Cambridge A Level Biology 9700 — 2025 Feb/March Paper 4 · Variant 2
9700/42/F/M/25 · 10 questions · 100 marks · 120 min
The question paper and its mark scheme, free to read here and free to download. This is Cambridge’s own paper, exactly as it was sat.
Question paper32 pages
Mark scheme19 pages
Answers below. Sit the paper first if you are practising.
Questions as text
Q1 · Different types of respiratory substrate can have different energy values and therefore…
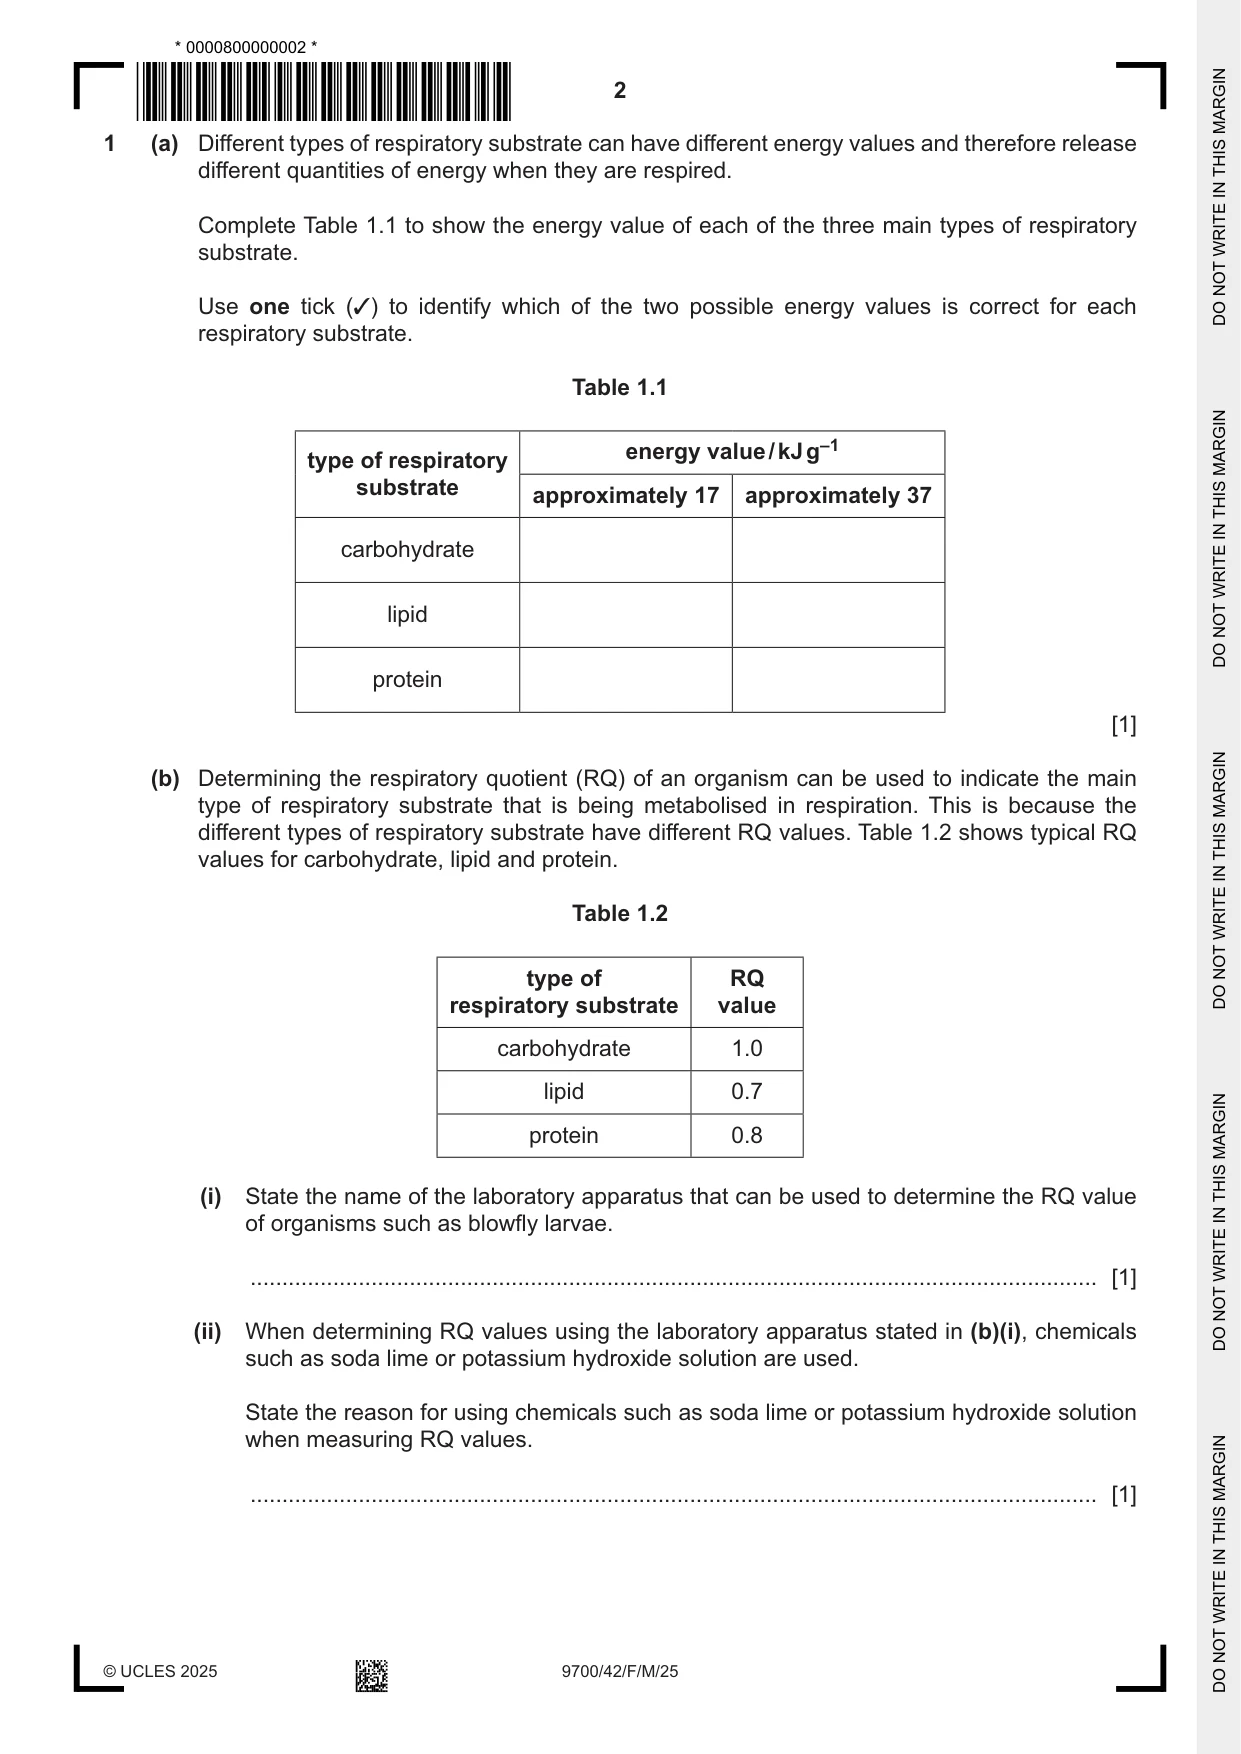
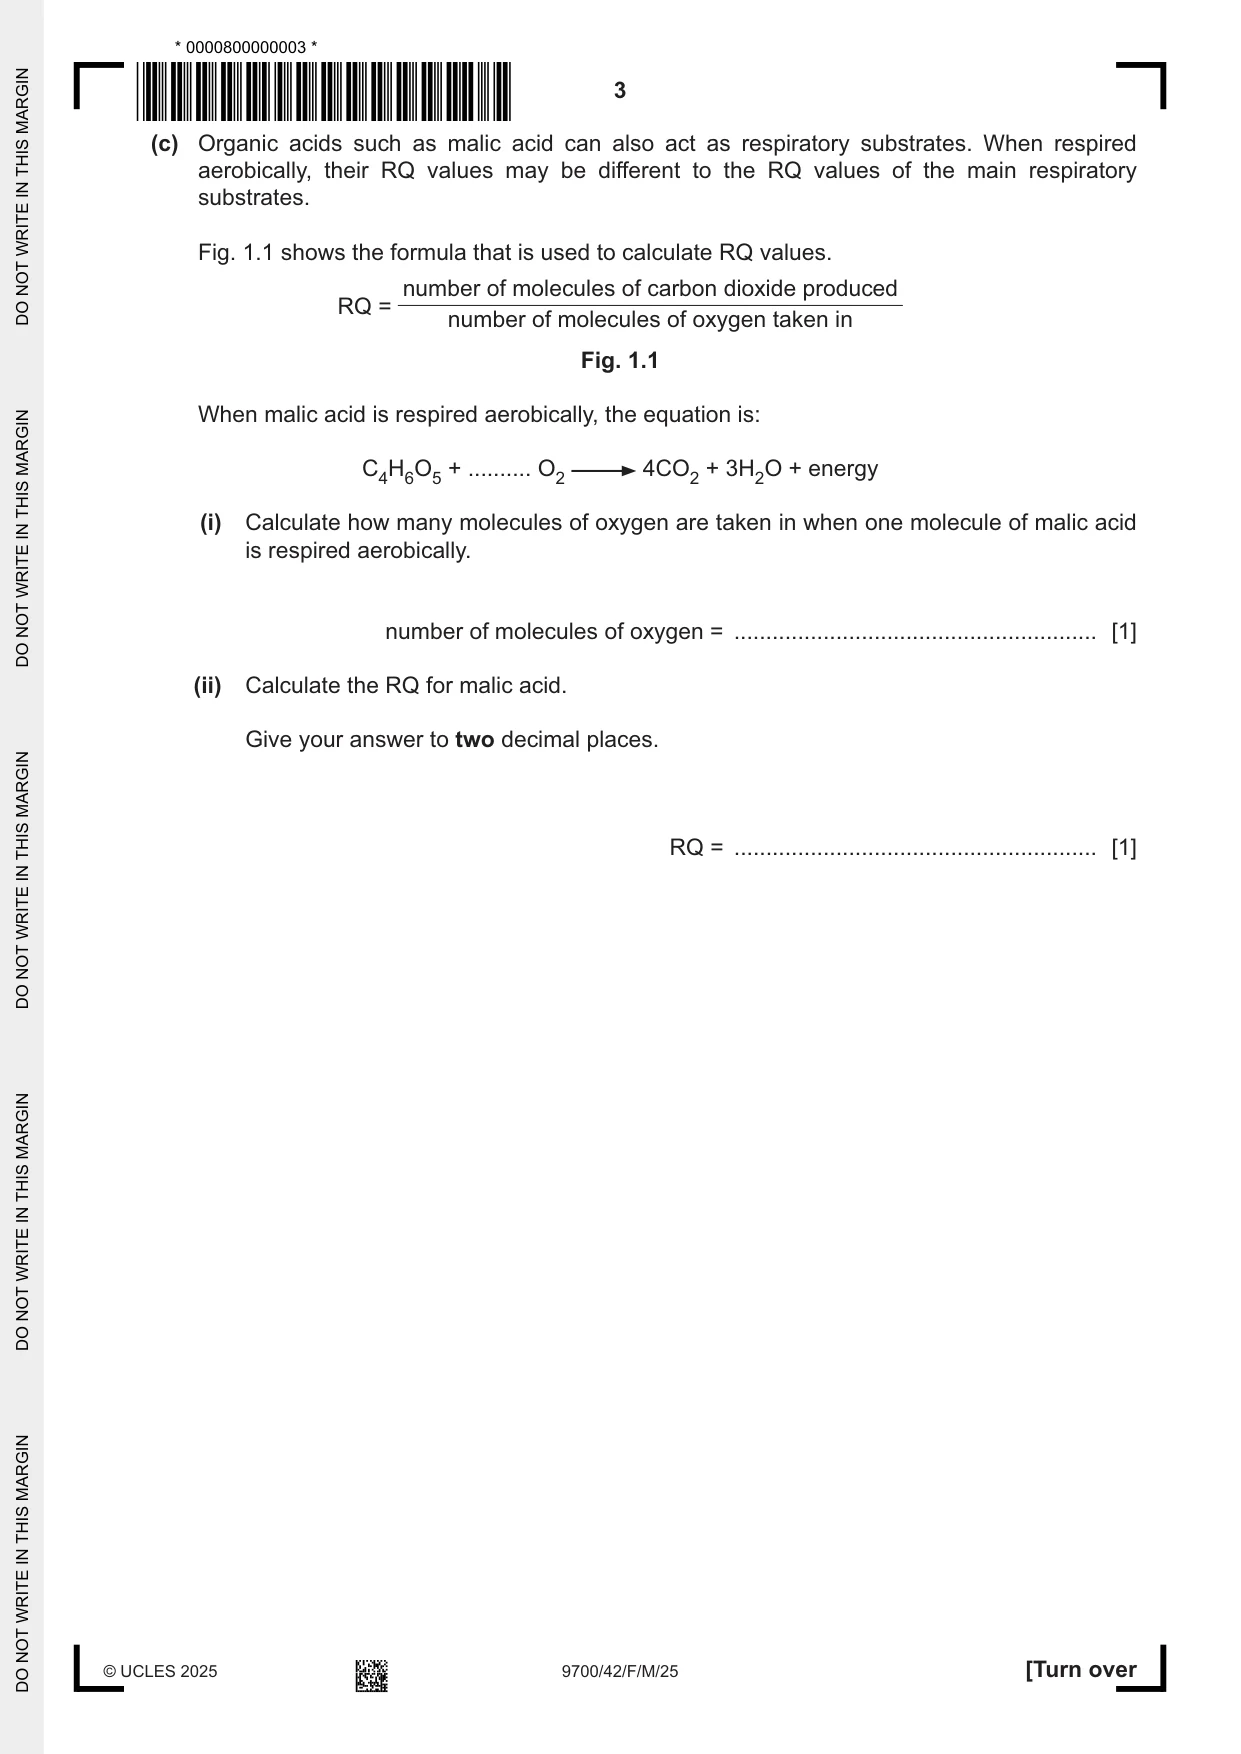
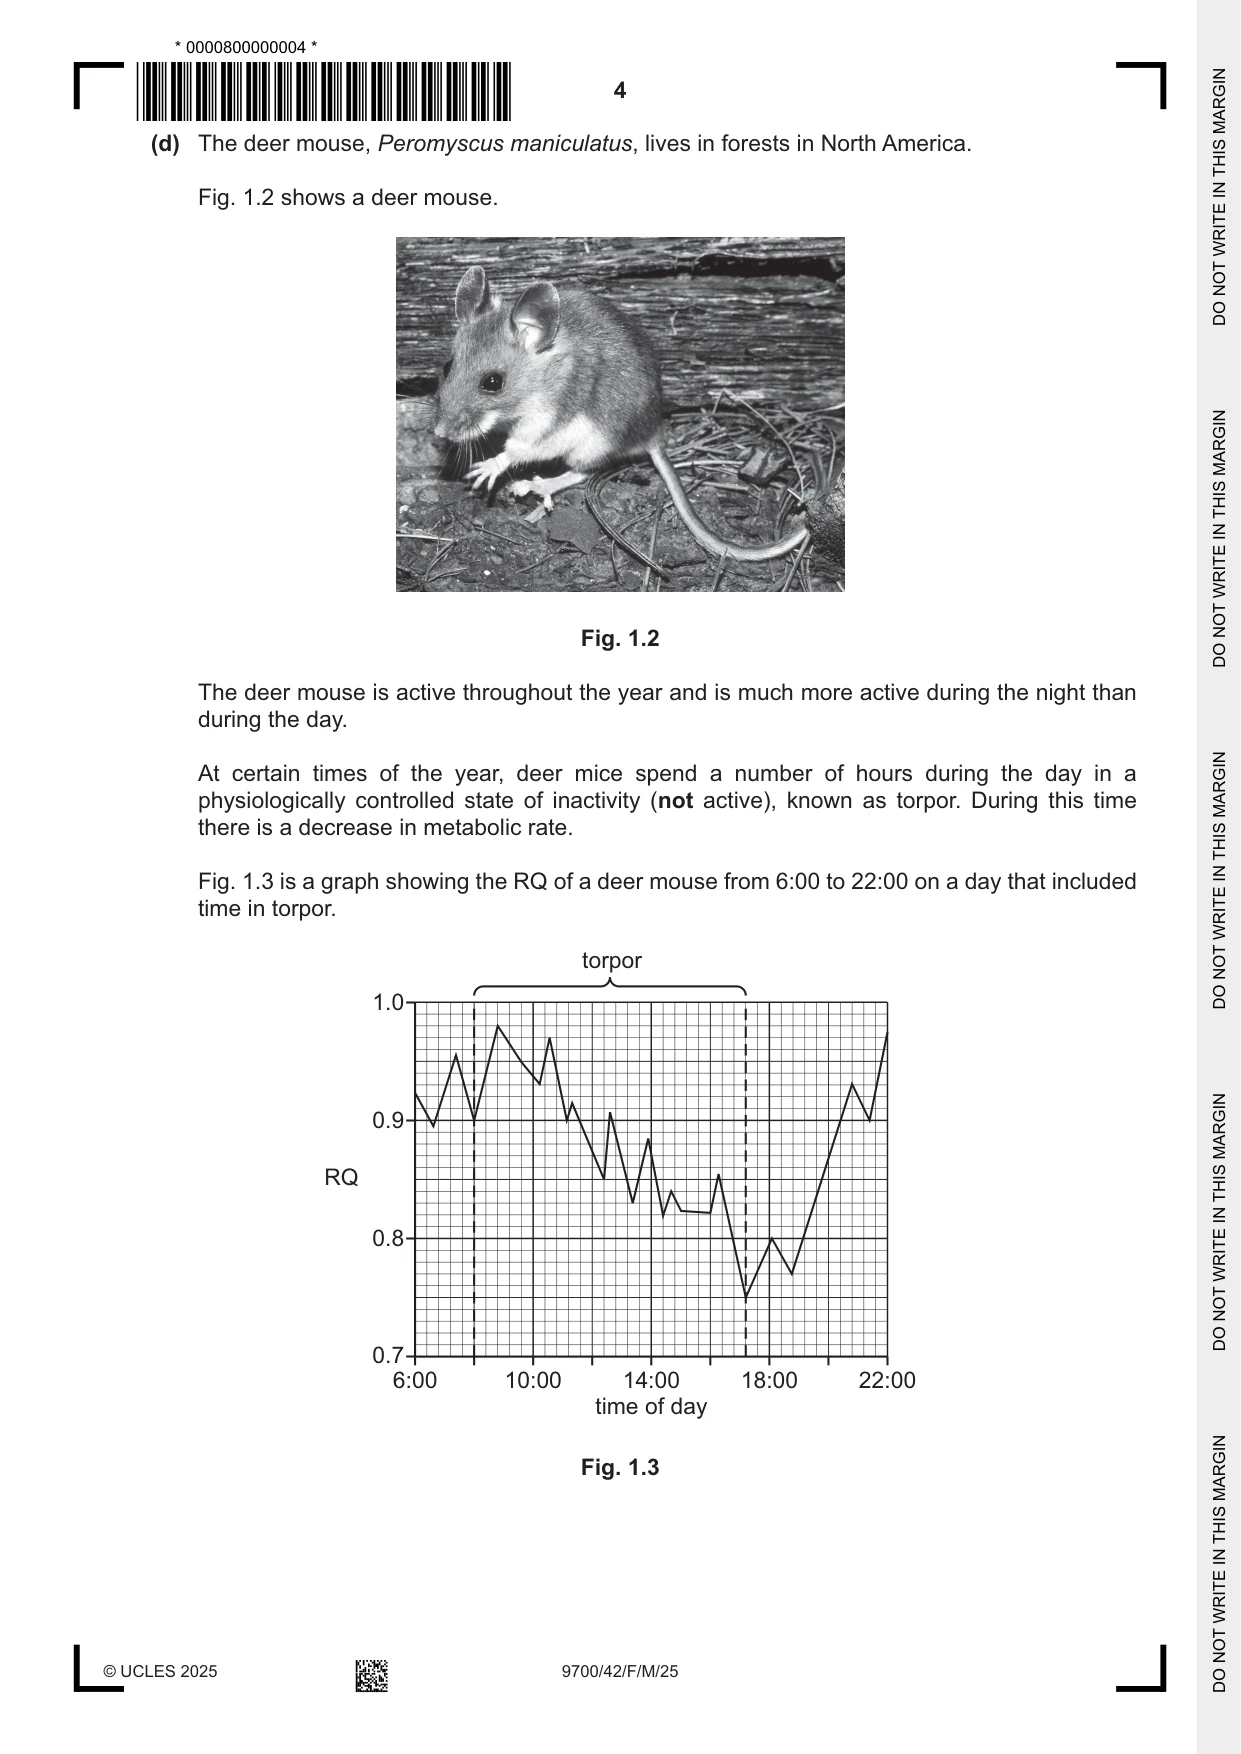
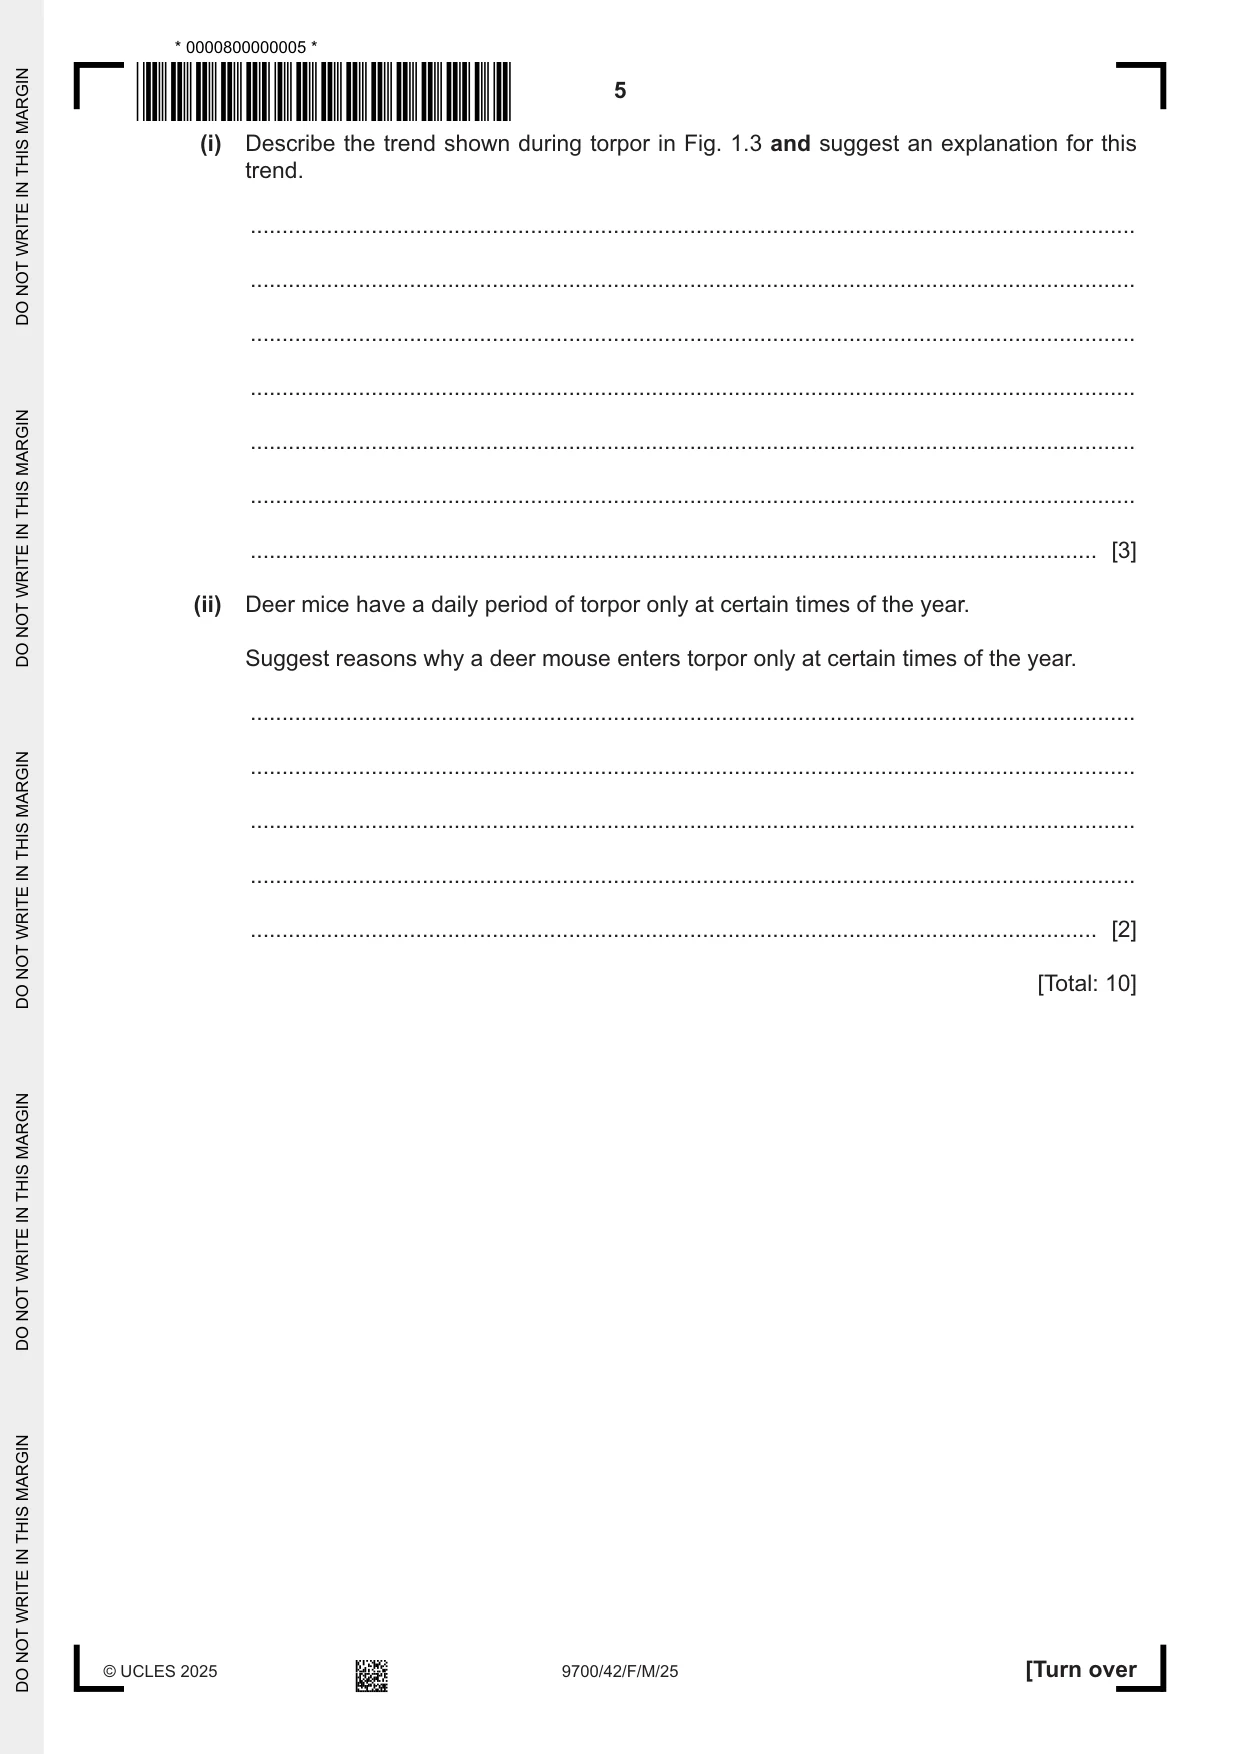
1 (a) Different types of respiratory substrate can have different energy values and therefore release different quantities of energy when they are respired. Complete Table 1.1 to show the energy value of each of the three main types of respiratory substrate. Use one tick (3) to identify which of the two possible energy values is correct for each respiratory substrate. Table 1.1 energy value / kJ g–1 type of respiratory substrate approximately 17 approximately 37 carbohydrate lipid protein [1] (b) Determining the respiratory quotient (RQ) of an organism can be used to indicate the main type of respiratory substrate that is being metabolised in respiration. This is because the different types of respiratory substrate have different RQ values. Table 1.2 shows typical RQ values for carbohydrate, lipid and protein. Table 1.2 type of RQ respiratory substrate value carbohydrate 1.0 lipid 0.7 protein 0.8 (i) State the name of the laboratory apparatus that can be used to determine the RQ value of organisms such as blowfly larvae. ..................................................................................................................................... [1] (ii) When determining RQ values using the laboratory apparatus stated in (b)(i), chemicals such as soda lime or potassium hydroxide solution are used. State the reason for using chemicals such as soda lime or potassium hydroxide solution when measuring RQ values. ..................................................................................................................................... [1] (c) Organic acids such as malic acid can also act as respiratory substrates. When respired aerobically, their RQ values may be different to the RQ values of the main respiratory substrates. Fig. 1.1 shows the formula that is used to calculate RQ values. number of molecules of carbon dioxide produced RQ = number of molecules of oxygen taken in Fig. 1.1 When malic acid is respired aerobically, the equation is: C4H6O5 + .......... O2 4CO2 + 3H2O + energy (i) Calculate how many molecules of oxygen are taken in when one molecule of malic acid is respired aerobically. number of molecules of oxygen = ......................................................... [1] (ii) Calculate the RQ for malic acid. Give your answer to two decimal places. RQ = ......................................................... [1] (d) The deer mouse, Peromyscus maniculatus, lives in forests in North America. Fig. 1.2 shows a deer mouse. Fig. 1.2 The deer mouse is active throughout the year and is much more active during the night than during the day. At certain times of the year, deer mice spend a number of hours during the day in a physiologically controlled state of inactivity (not active), known as torpor. During this time there is a decrease in metabolic rate. Fig. 1.3 is a graph showing the RQ of a deer mouse from 6:00 to 22:00 on a day that included time in torpor. torpor 1.0 0.9 RQ 0.8 0.7 6:00 10:00 14:00 18:00 22:00 time of day Fig. 1.3 (i) Describe the trend shown during torpor in Fig. 1.3 and suggest an explanation for this trend. ........................................................................................................................................... ........................................................................................................................................... ........................................................................................................................................... ........................................................................................................................................... ........................................................................................................................................... ........................................................................................................................................... ..................................................................................................................................... [3] (ii) Deer mice have a daily period of torpor only at certain times of the year. Suggest reasons why a deer mouse enters torpor only at certain times of the year. ........................................................................................................................................... ........................................................................................................................................... ........................................................................................................................................... ........................................................................................................................................... ..................................................................................................................................... [2] [Total: 10]
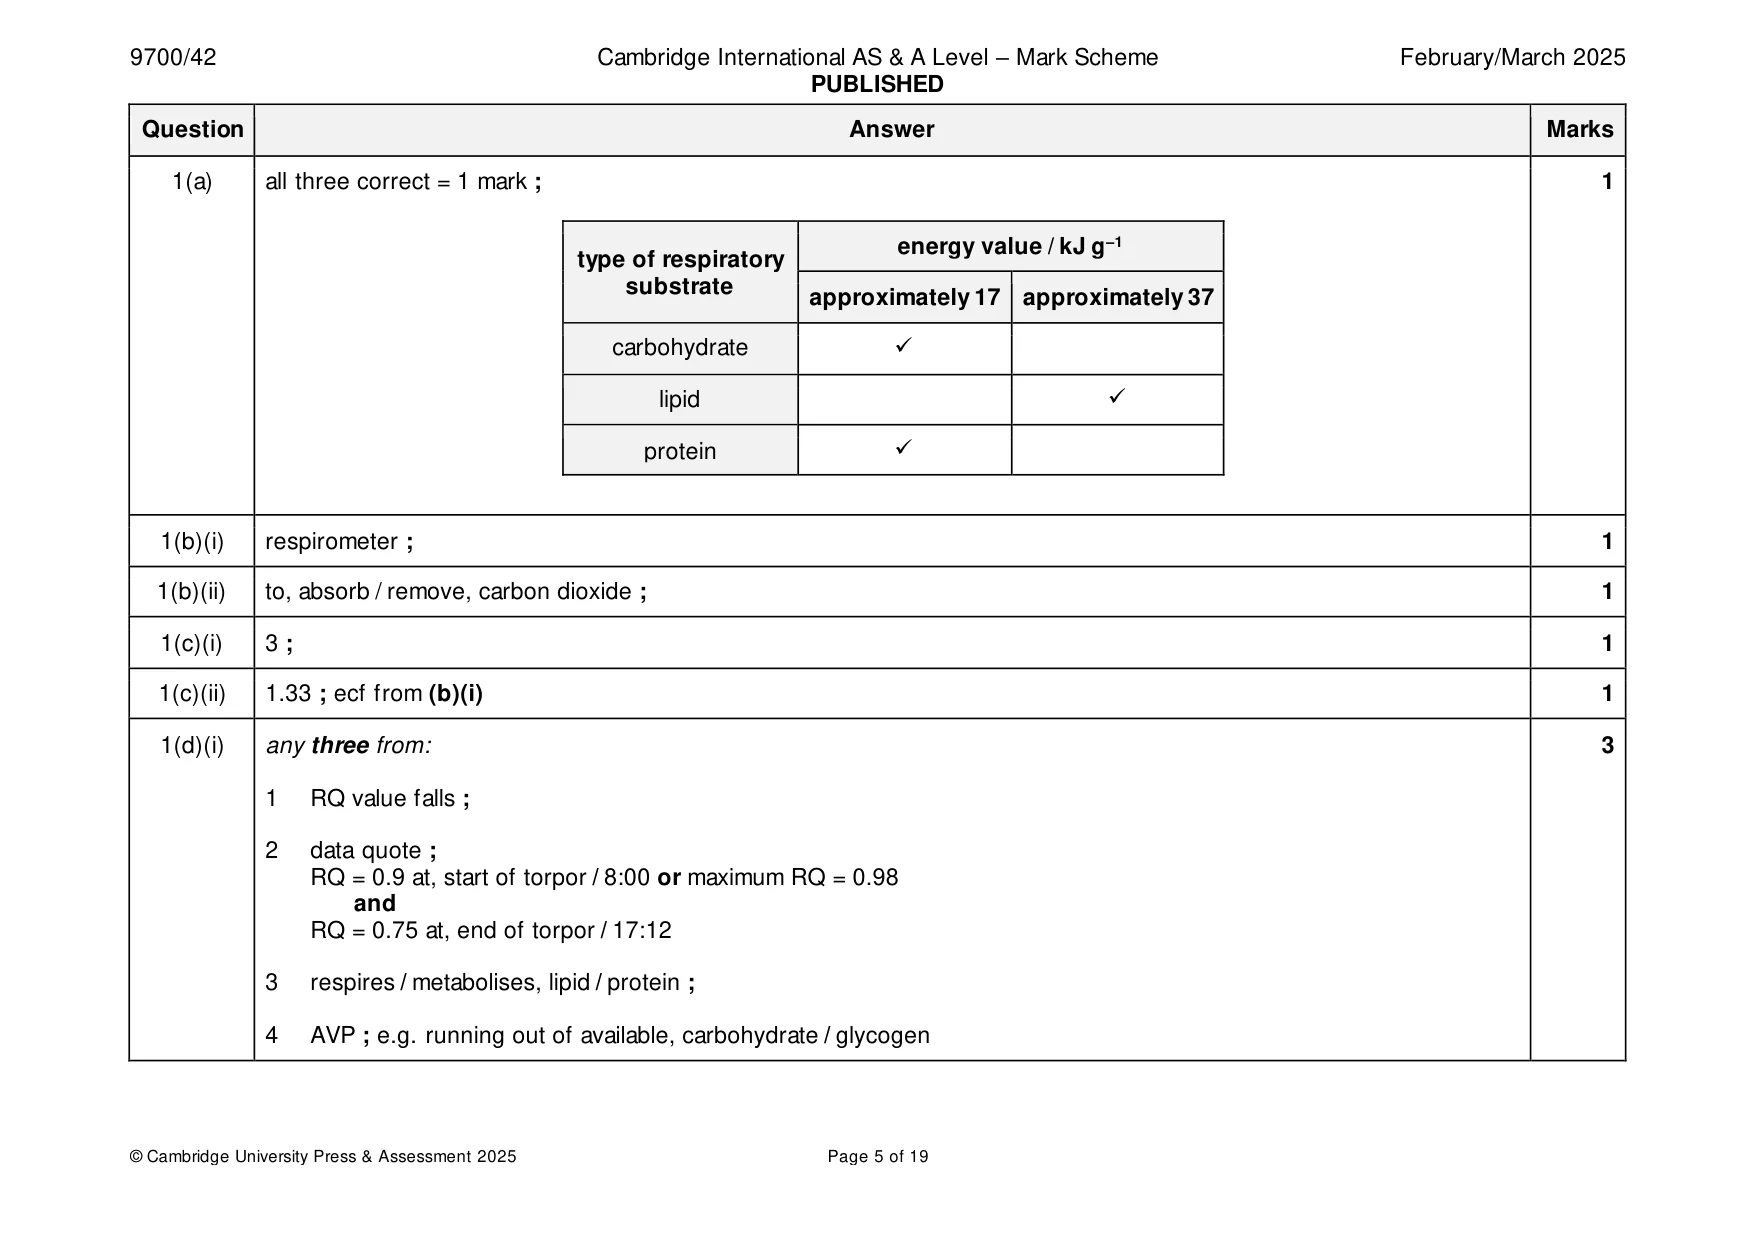
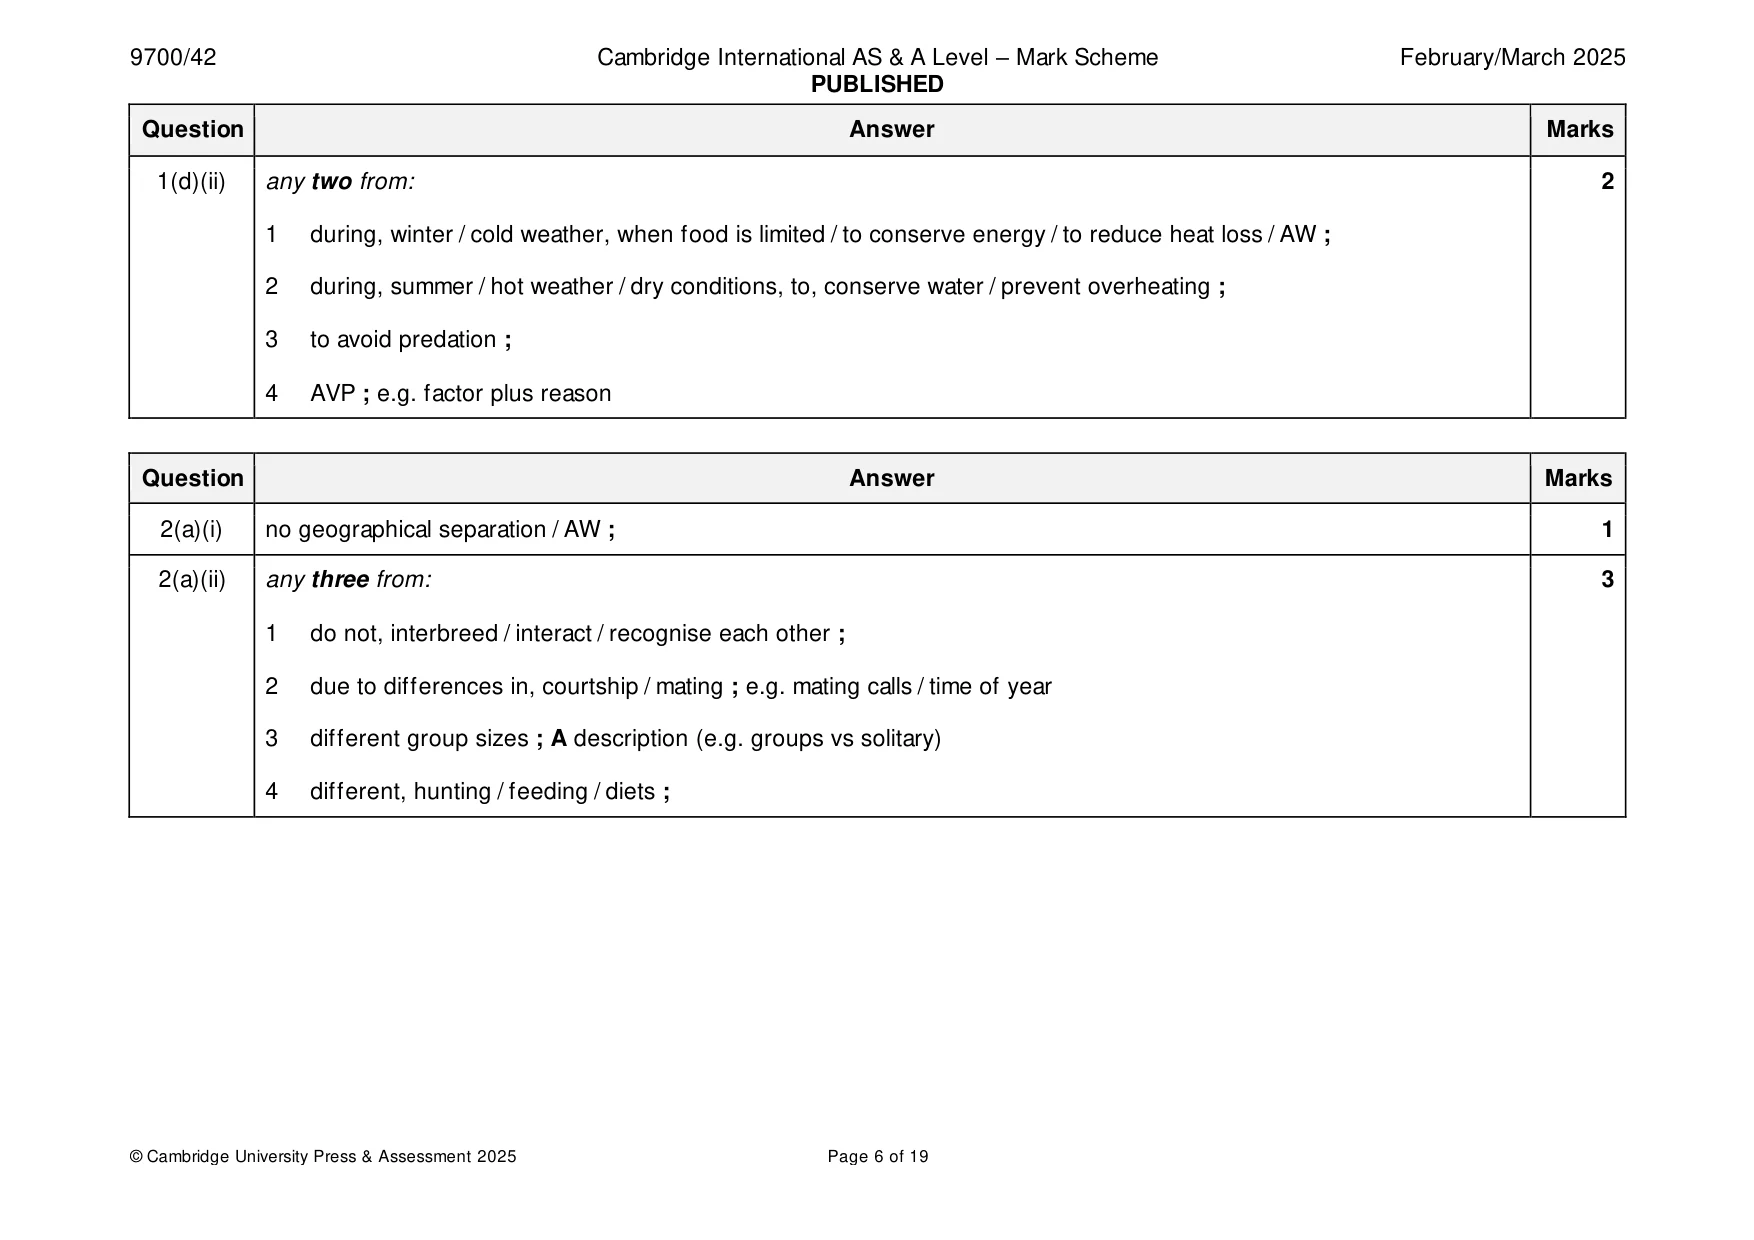
Mark scheme: Question Answer Marks 1(a) all three correct = 1 mark ; 1 energy value / kJ g–1 type of respiratory substrate approximately 17 approximately 37 carbohydrate ✓ lipid ✓ protein ✓ 1(b)(i) respirometer ; 1 1(b)(ii) to, absorb / remove, carbon dioxide ; 1 1(c)(i) 3 ; 1 1(c)(ii) 1.33 ; ecf from (b)(i) 1 1(d)(i) any three from: 3 1 RQ value falls ; 2 data quote ; RQ = 0.9 at, start of torpor / 8:00 or maximum RQ = 0.98 and RQ = 0.75 at, end of torpor / 17:12 3 respires / metabolises, lipid / protein ; 4 AVP ; e.g. running out of available, carbohydrate / glycogen 1(d)(ii) any two from: 2 1 during, winter / cold weather, when food is limited / to conserve energy / to reduce heat loss / AW ; 2 during, summer / hot weather / dry conditions, to, conserve water / prevent overheating ; 3 to avoid predation ; 4 AVP ; e.g. factor plus reason
Q2 · The orca, Orcinus orca, has the largest distribution of all aquatic mammals and is found…
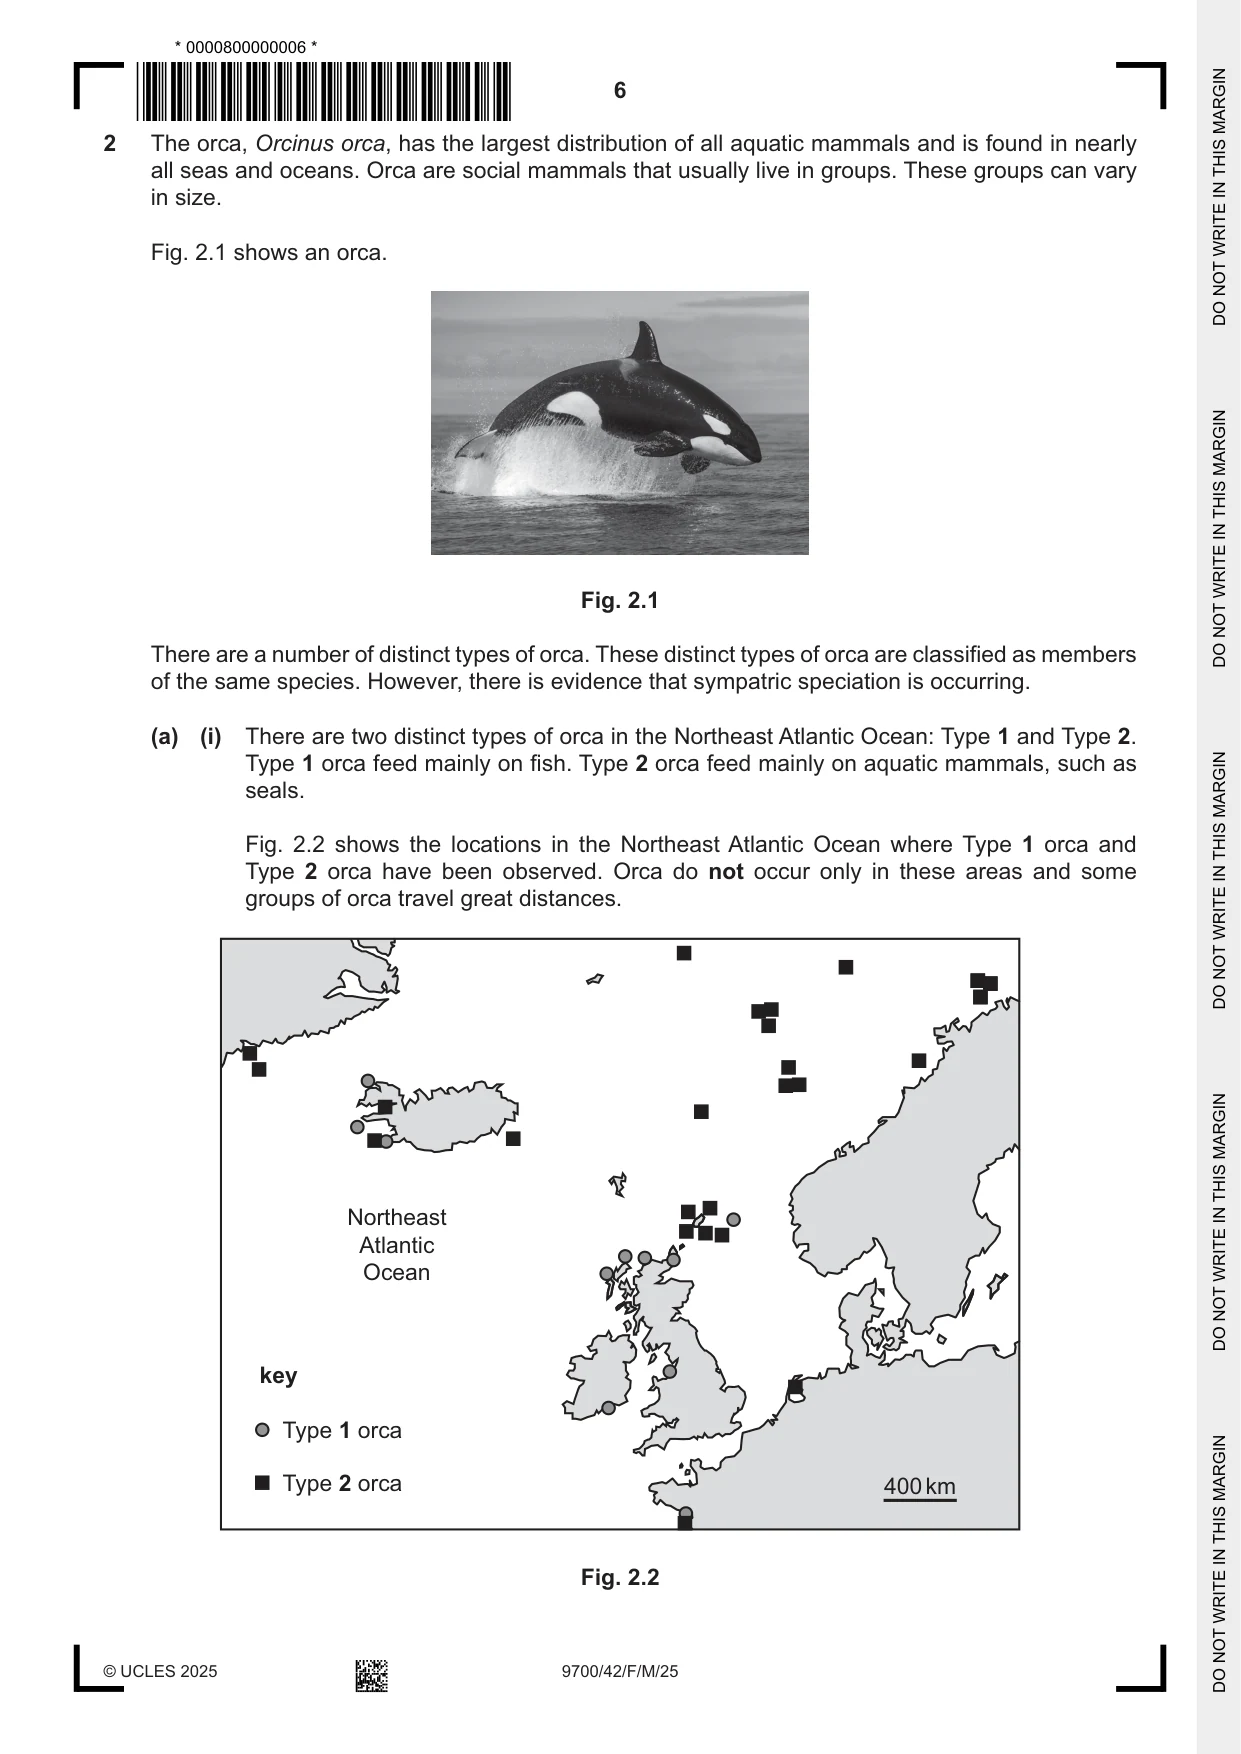
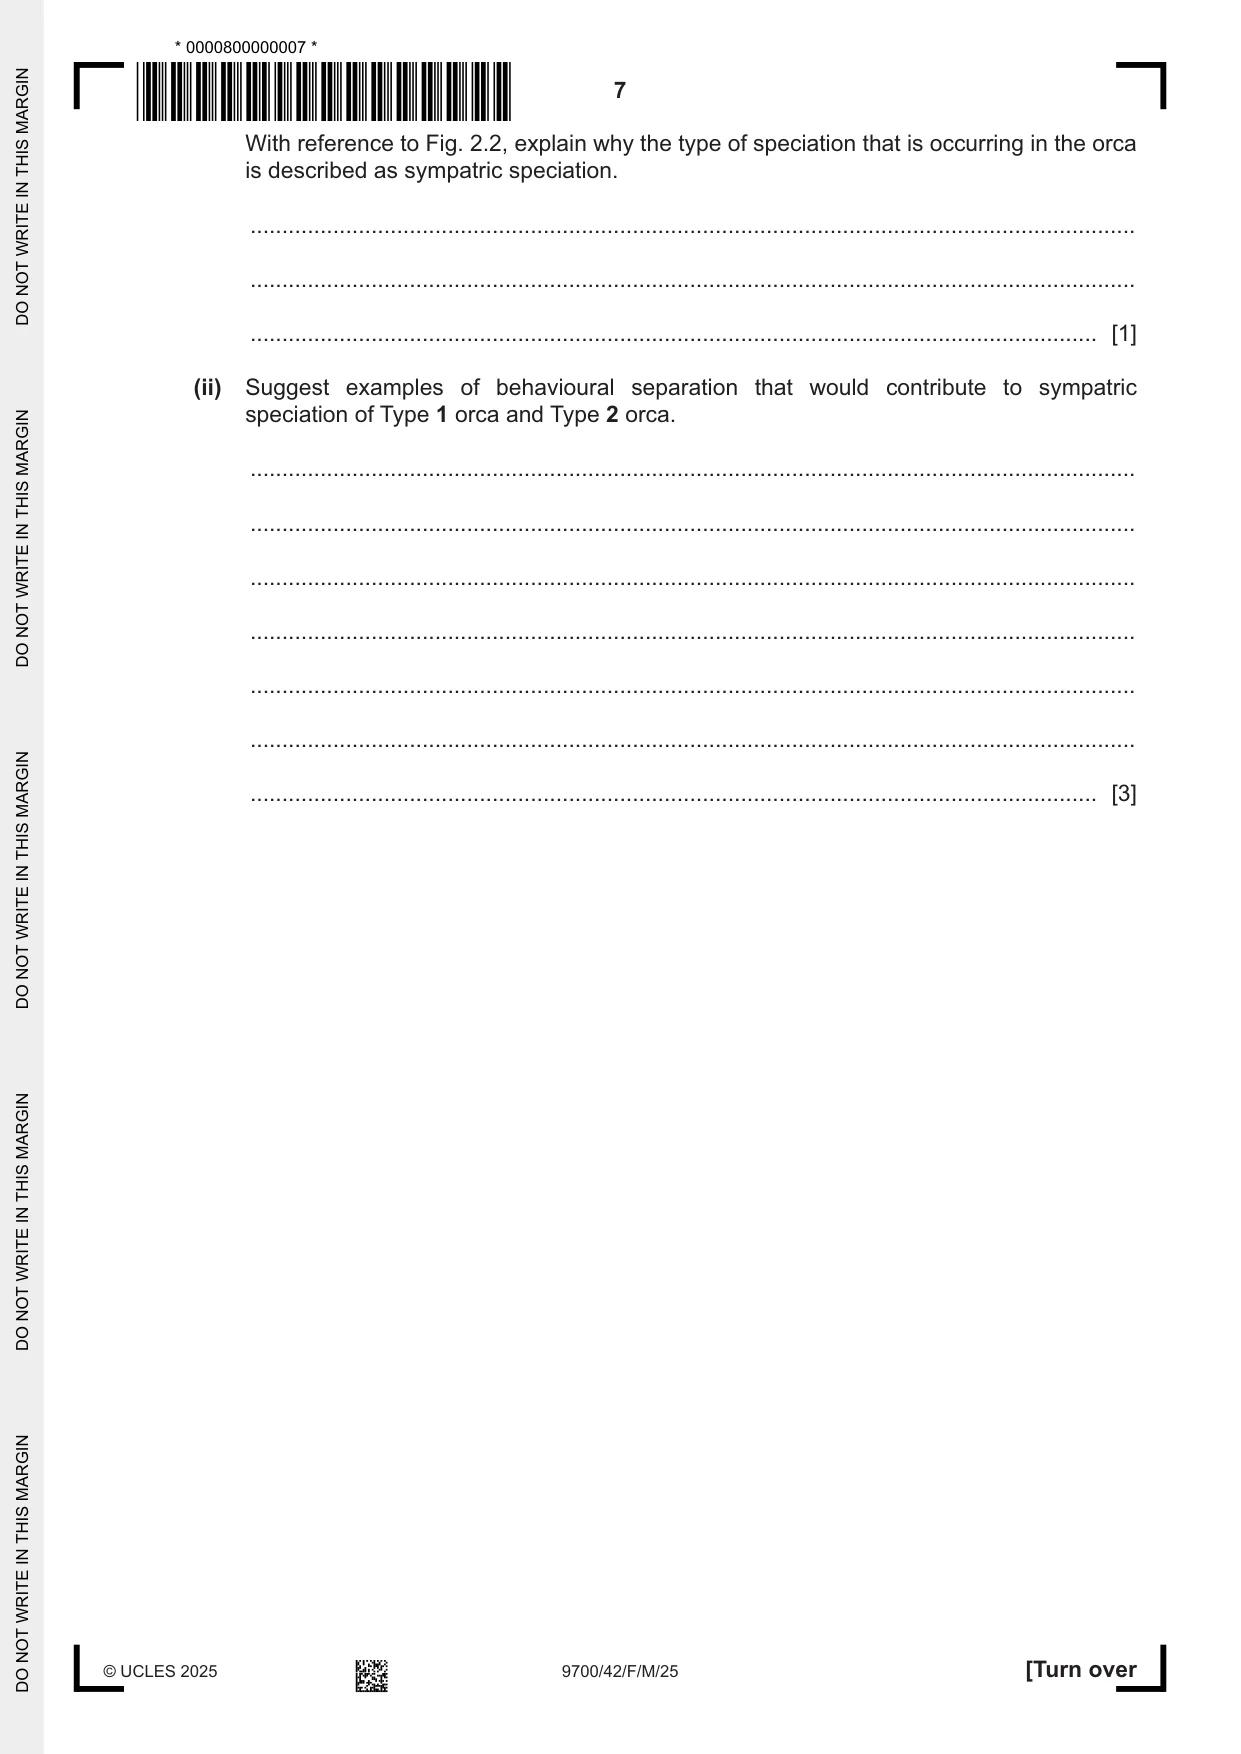
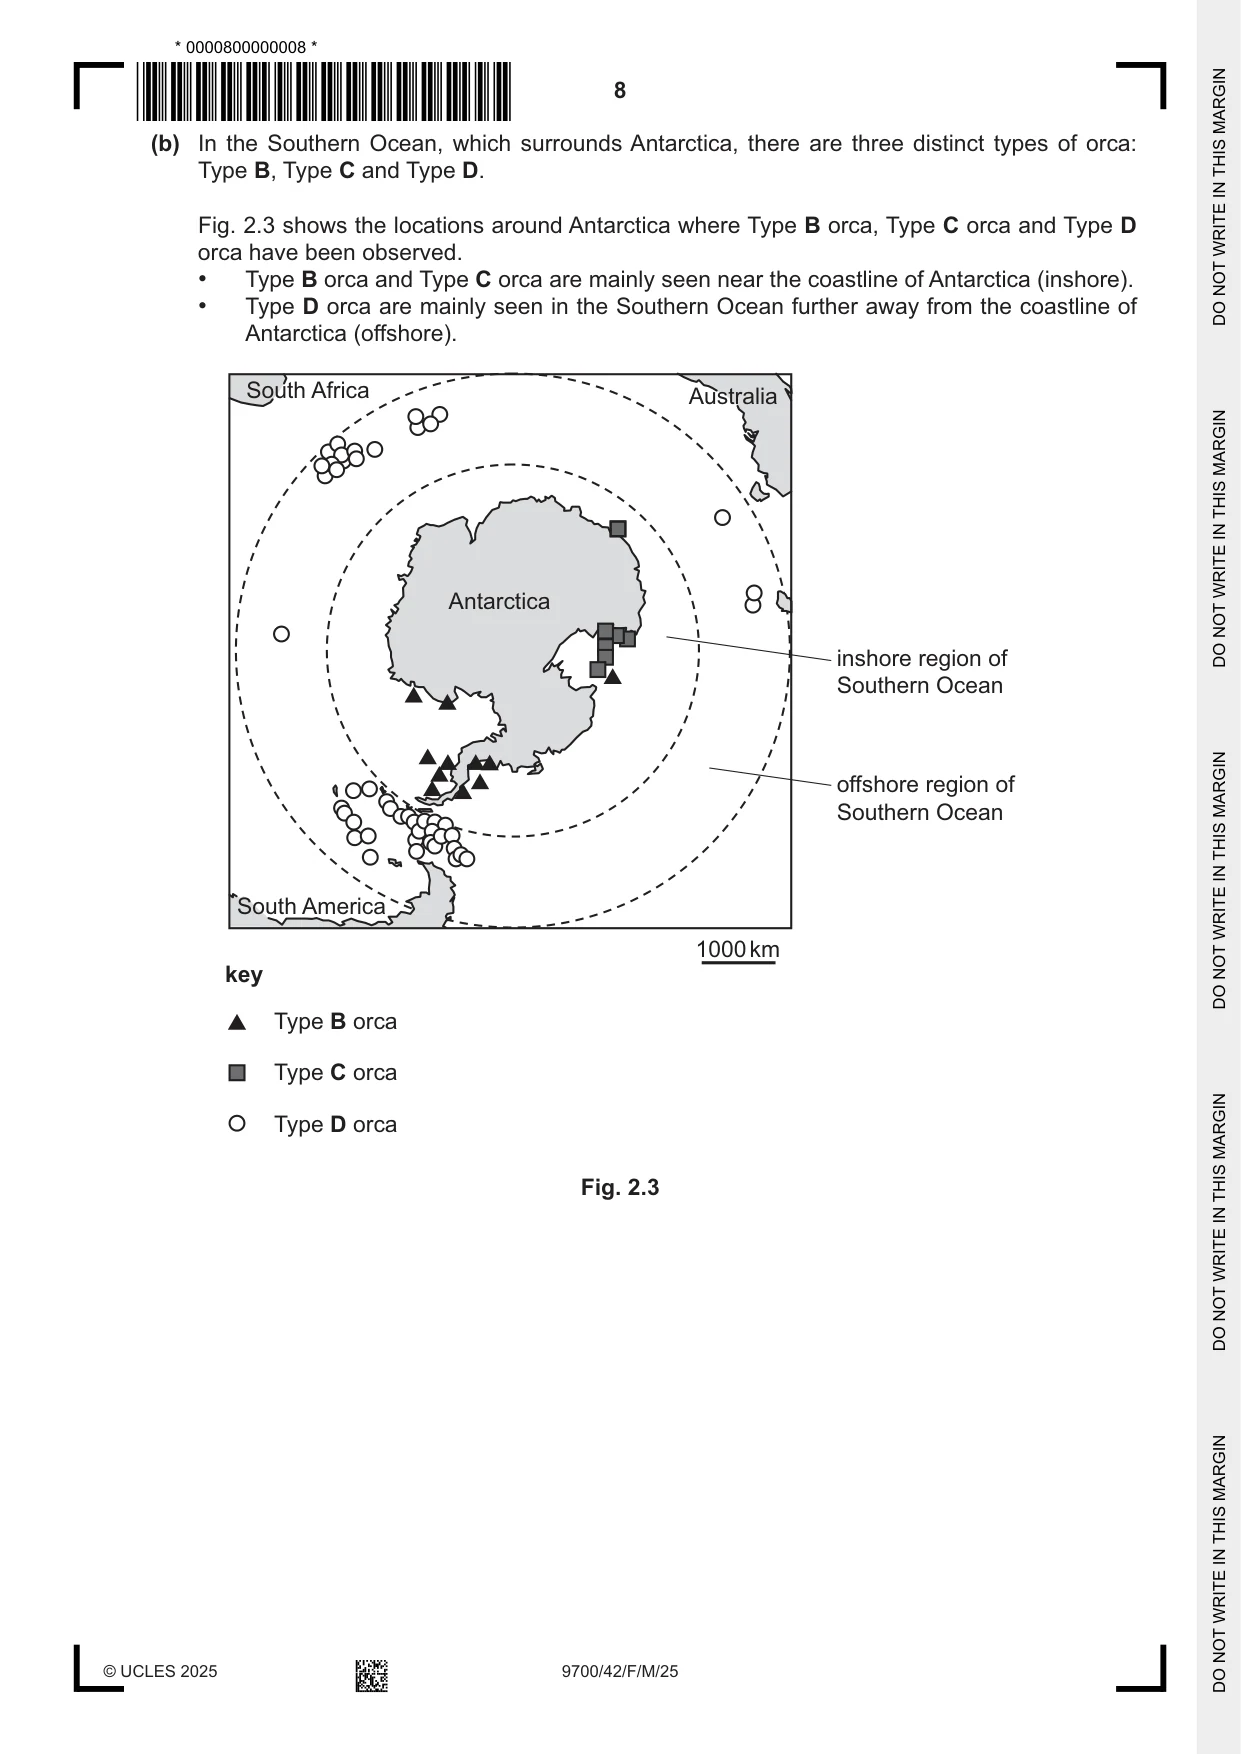
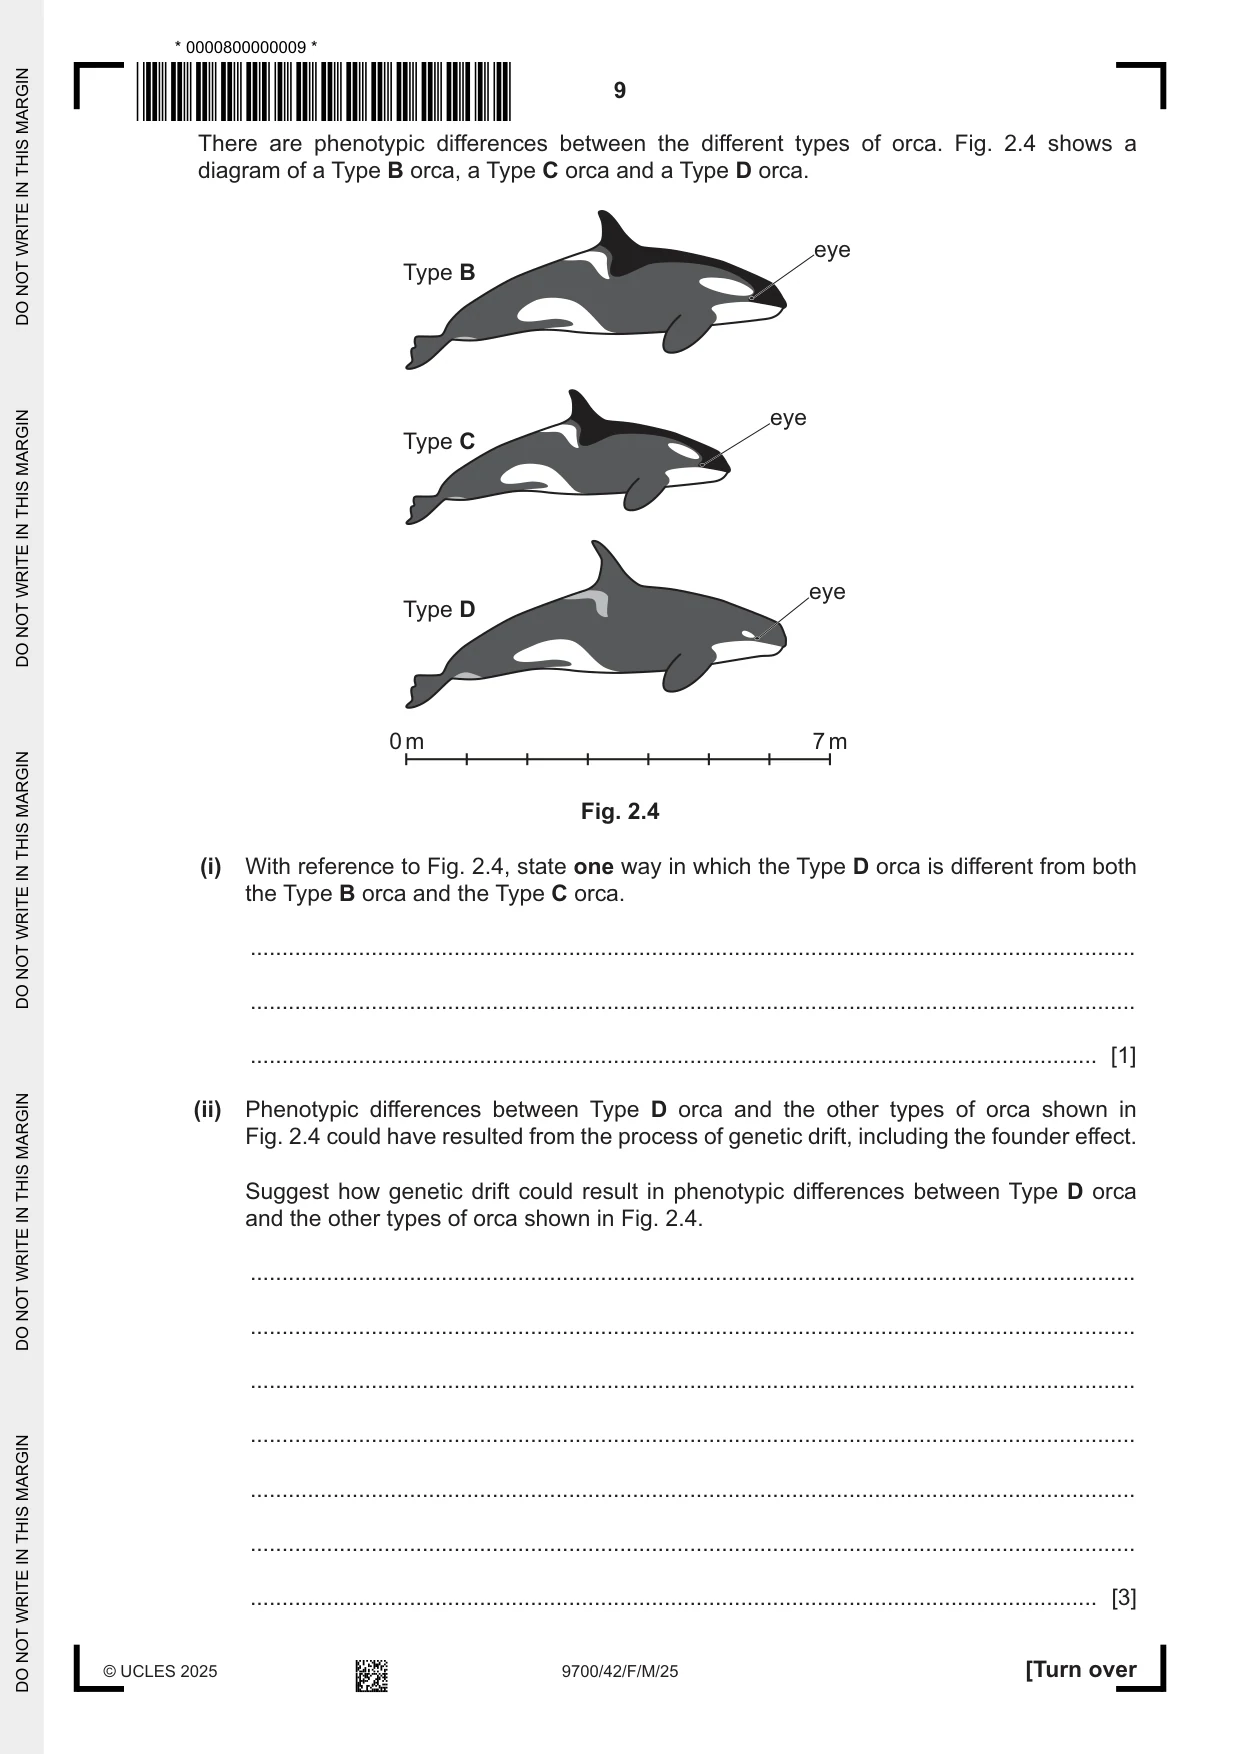
2 The orca, Orcinus orca, has the largest distribution of all aquatic mammals and is found in nearly all seas and oceans. Orca are social mammals that usually live in groups. These groups can vary in size. Fig. 2.1 shows an orca. Fig. 2.1 There are a number of distinct types of orca. These distinct types of orca are classified as members of the same species. However, there is evidence that sympatric speciation is occurring. (a) (i) There are two distinct types of orca in the Northeast Atlantic Ocean: Type 1 and Type 2. Type 1 orca feed mainly on fish. Type 2 orca feed mainly on aquatic mammals, such as seals. Fig. 2.2 shows the locations in the Northeast Atlantic Ocean where Type 1 orca and Type 2 orca have been observed. Orca do not occur only in these areas and some groups of orca travel great distances. Northeast Atlantic Ocean key Type 1 orca Type 2 orca 400 km Fig. 2.2 With reference to Fig. 2.2, explain why the type of speciation that is occurring in the orca is described as sympatric speciation. ........................................................................................................................................... ........................................................................................................................................... ..................................................................................................................................... [1] (ii) Suggest examples of behavioural separation that would contribute to sympatric speciation of Type 1 orca and Type 2 orca. ........................................................................................................................................... ........................................................................................................................................... ........................................................................................................................................... ........................................................................................................................................... ........................................................................................................................................... ........................................................................................................................................... ..................................................................................................................................... [3] (b) In the Southern Ocean, which surrounds Antarctica, there are three distinct types of orca: Type B, Type C and Type D. Fig. 2.3 shows the locations around Antarctica where Type B orca, Type C orca and Type D orca have been observed. • Type B orca and Type C orca are mainly seen near the coastline of Antarctica (inshore). • Type D orca are mainly seen in the Southern Ocean further away from the coastline of Antarctica (offshore). South Africa Australia Antarctica inshore region of Southern Ocean offshore region of Southern Ocean South America 1000 km key Type B orca Type C orca Type D orca Fig. 2.3 There are phenotypic differences between the different types of orca. Fig. 2.4 shows a diagram of a Type B orca, a Type C orca and a Type D orca. eye Type B eye Type C eye Type D 0 m 7 m Fig. 2.4 (i) With reference to Fig. 2.4, state one way in which the Type D orca is different from both the Type B orca and the Type C orca. ........................................................................................................................................... ........................................................................................................................................... ..................................................................................................................................... [1] (ii) Phenotypic differences between Type D orca and the other types of orca shown in Fig. 2.4 could have resulted from the process of genetic drift, including the founder effect. Suggest how genetic drift could result in phenotypic differences between Type D orca and the other types of orca shown in Fig. 2.4. ........................................................................................................................................... ........................................................................................................................................... ........................................................................................................................................... ........................................................................................................................................... ........................................................................................................................................... ........................................................................................................................................... ..................................................................................................................................... [3] (c) In the future, the different types of orca may be classified as separate species. If so, some of these newly classified species will have very small population sizes. Suggest two factors, other than population size, that should be monitored when assessing the conservation status of any newly classified species of orca. ................................................................................................................................................... ................................................................................................................................................... ................................................................................................................................................... ................................................................................................................................................... ............................................................................................................................................. [2] [Total: 10] Question 3 starts on page 12.
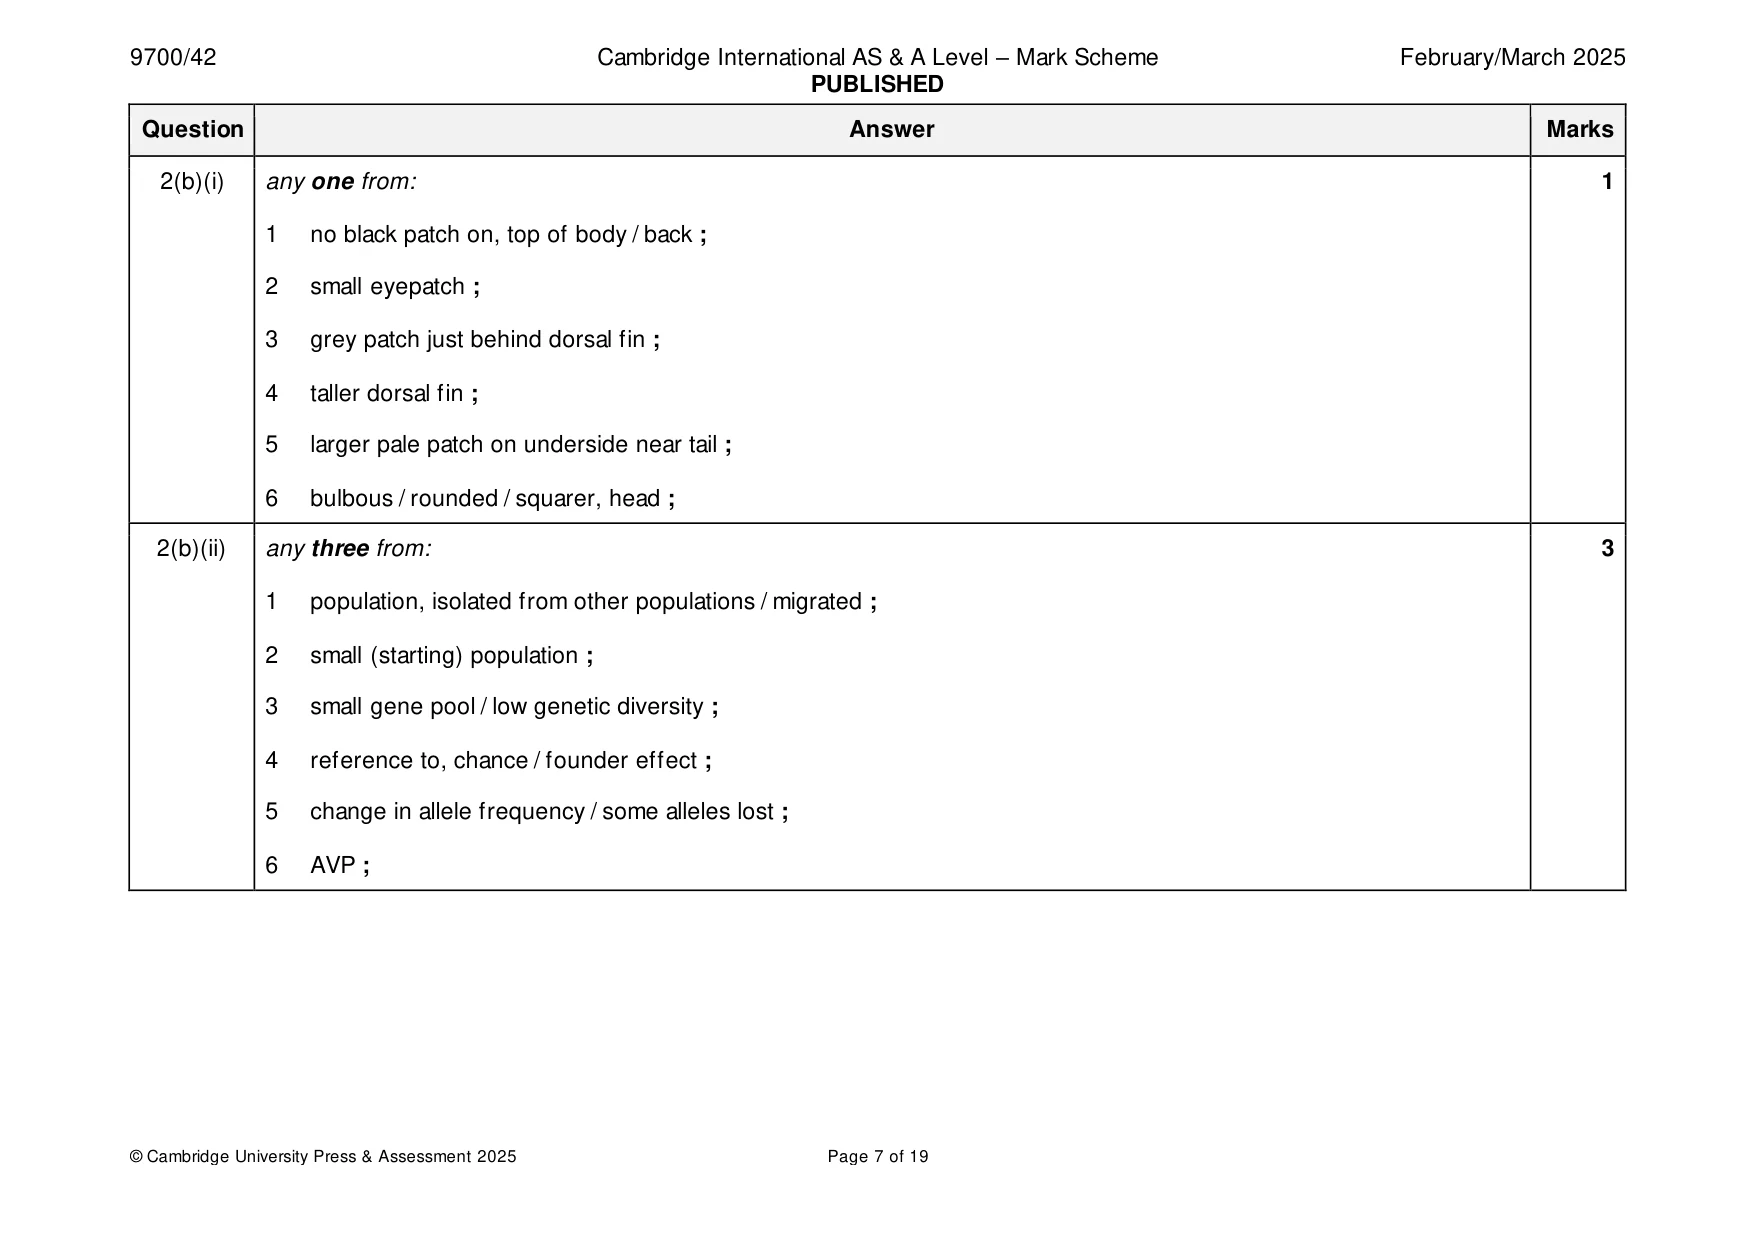
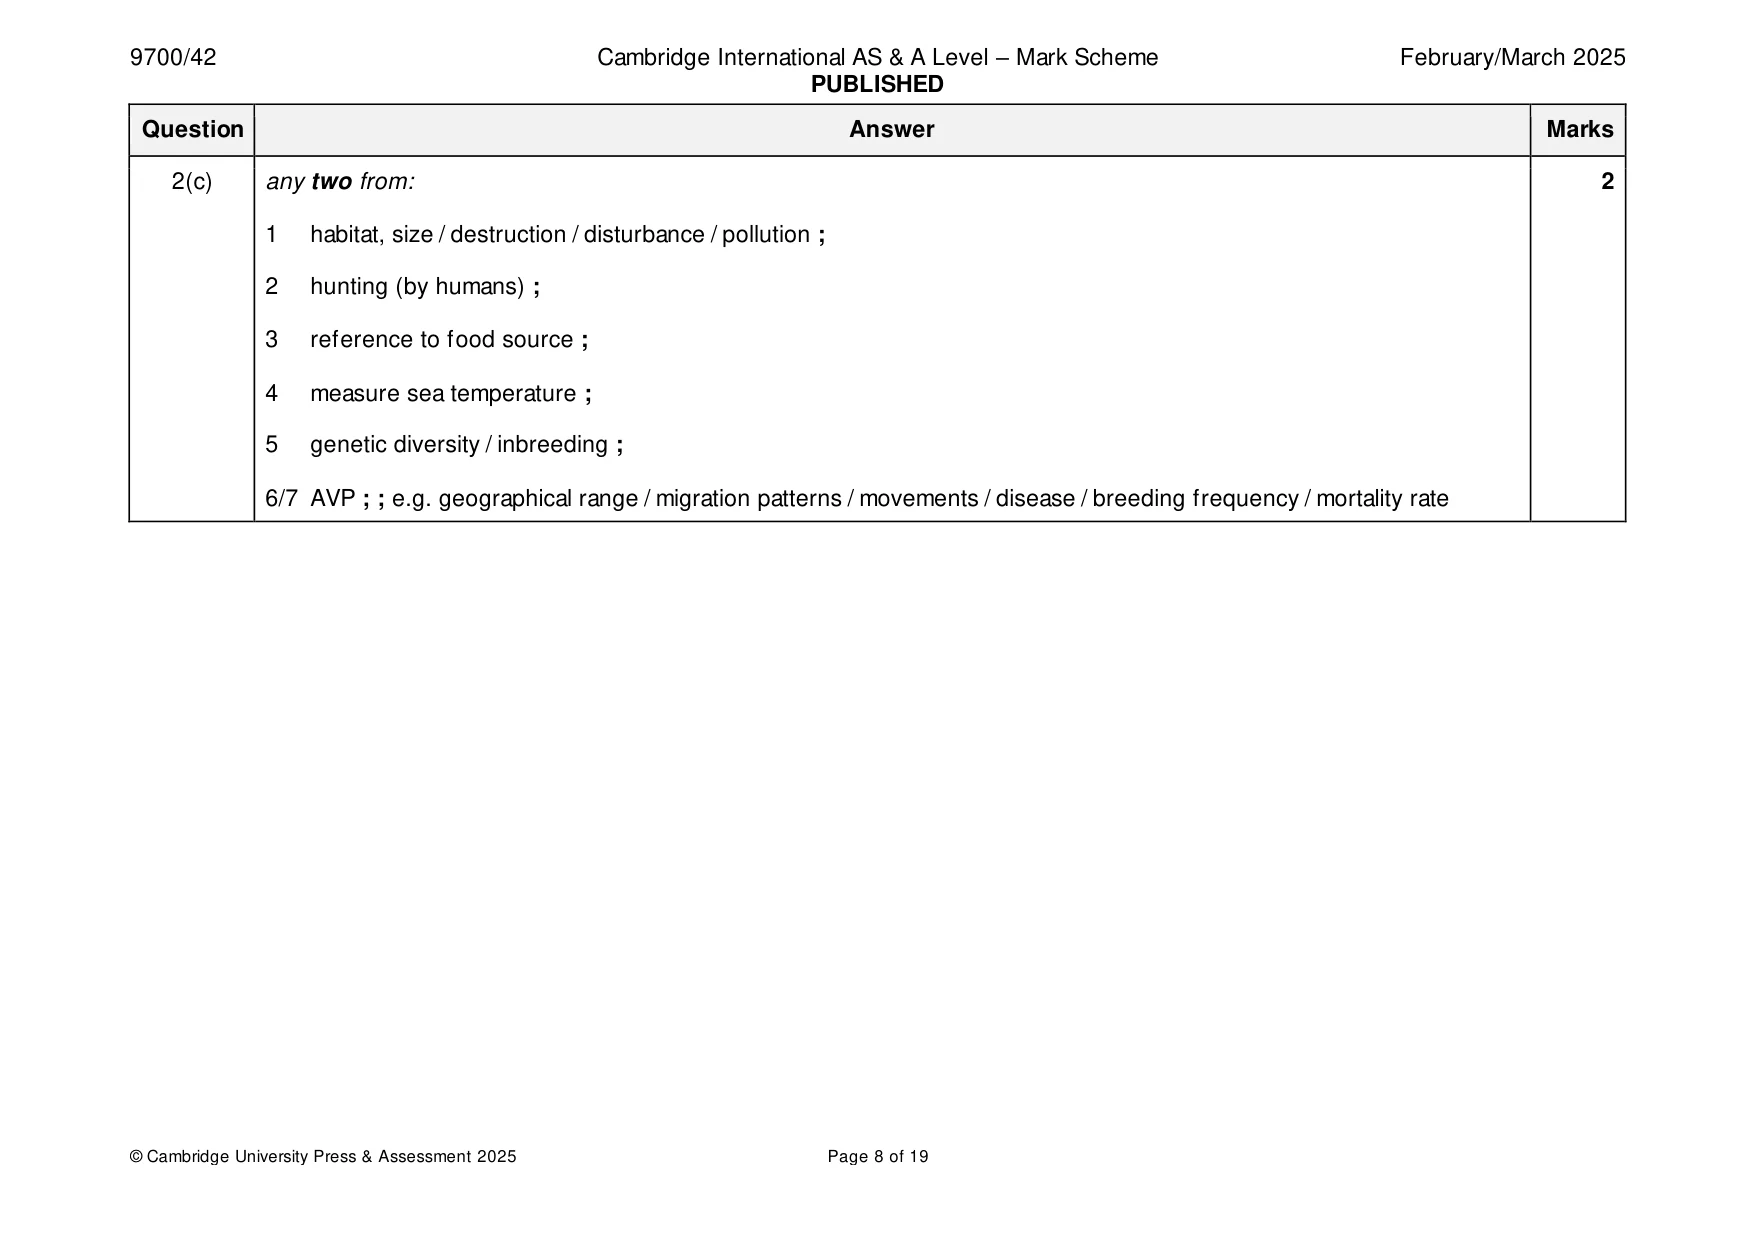
Mark scheme: 2(a)(i) no geographical separation / AW ; 1 2(a)(ii) any three from: 3 1 do not, interbreed / interact / recognise each other ; 2 due to differences in, courtship / mating ; e.g. mating calls / time of year 3 different group sizes ; A description (e.g. groups vs solitary) 4 different, hunting / feeding / diets ; 2(b)(i) any one from: 1 1 no black patch on, top of body / back ; 2 small eyepatch ; 3 grey patch just behind dorsal fin ; 4 taller dorsal fin ; 5 larger pale patch on underside near tail ; 6 bulbous / rounded / squarer, head ; 2(b)(ii) any three from: 3 1 population, isolated from other populations / migrated ; 2 small (starting) population ; 3 small gene pool / low genetic diversity ; 4 reference to, chance / founder effect ; 5 change in allele frequency / some alleles lost ; 6 AVP ; 2(c) any two from: 2 1 habitat, size / destruction / disturbance / pollution ; 2 hunting (by humans) ; 3 reference to food source ; 4 measure sea temperature ; 5 genetic diversity / inbreeding ; 6/7 AVP ; ; e.g. geographical range / migration patterns / movements / disease / breeding frequency / mortality rate
Q3 · Gentamicin is an antibiotic used to treat severe bacterial infections in children
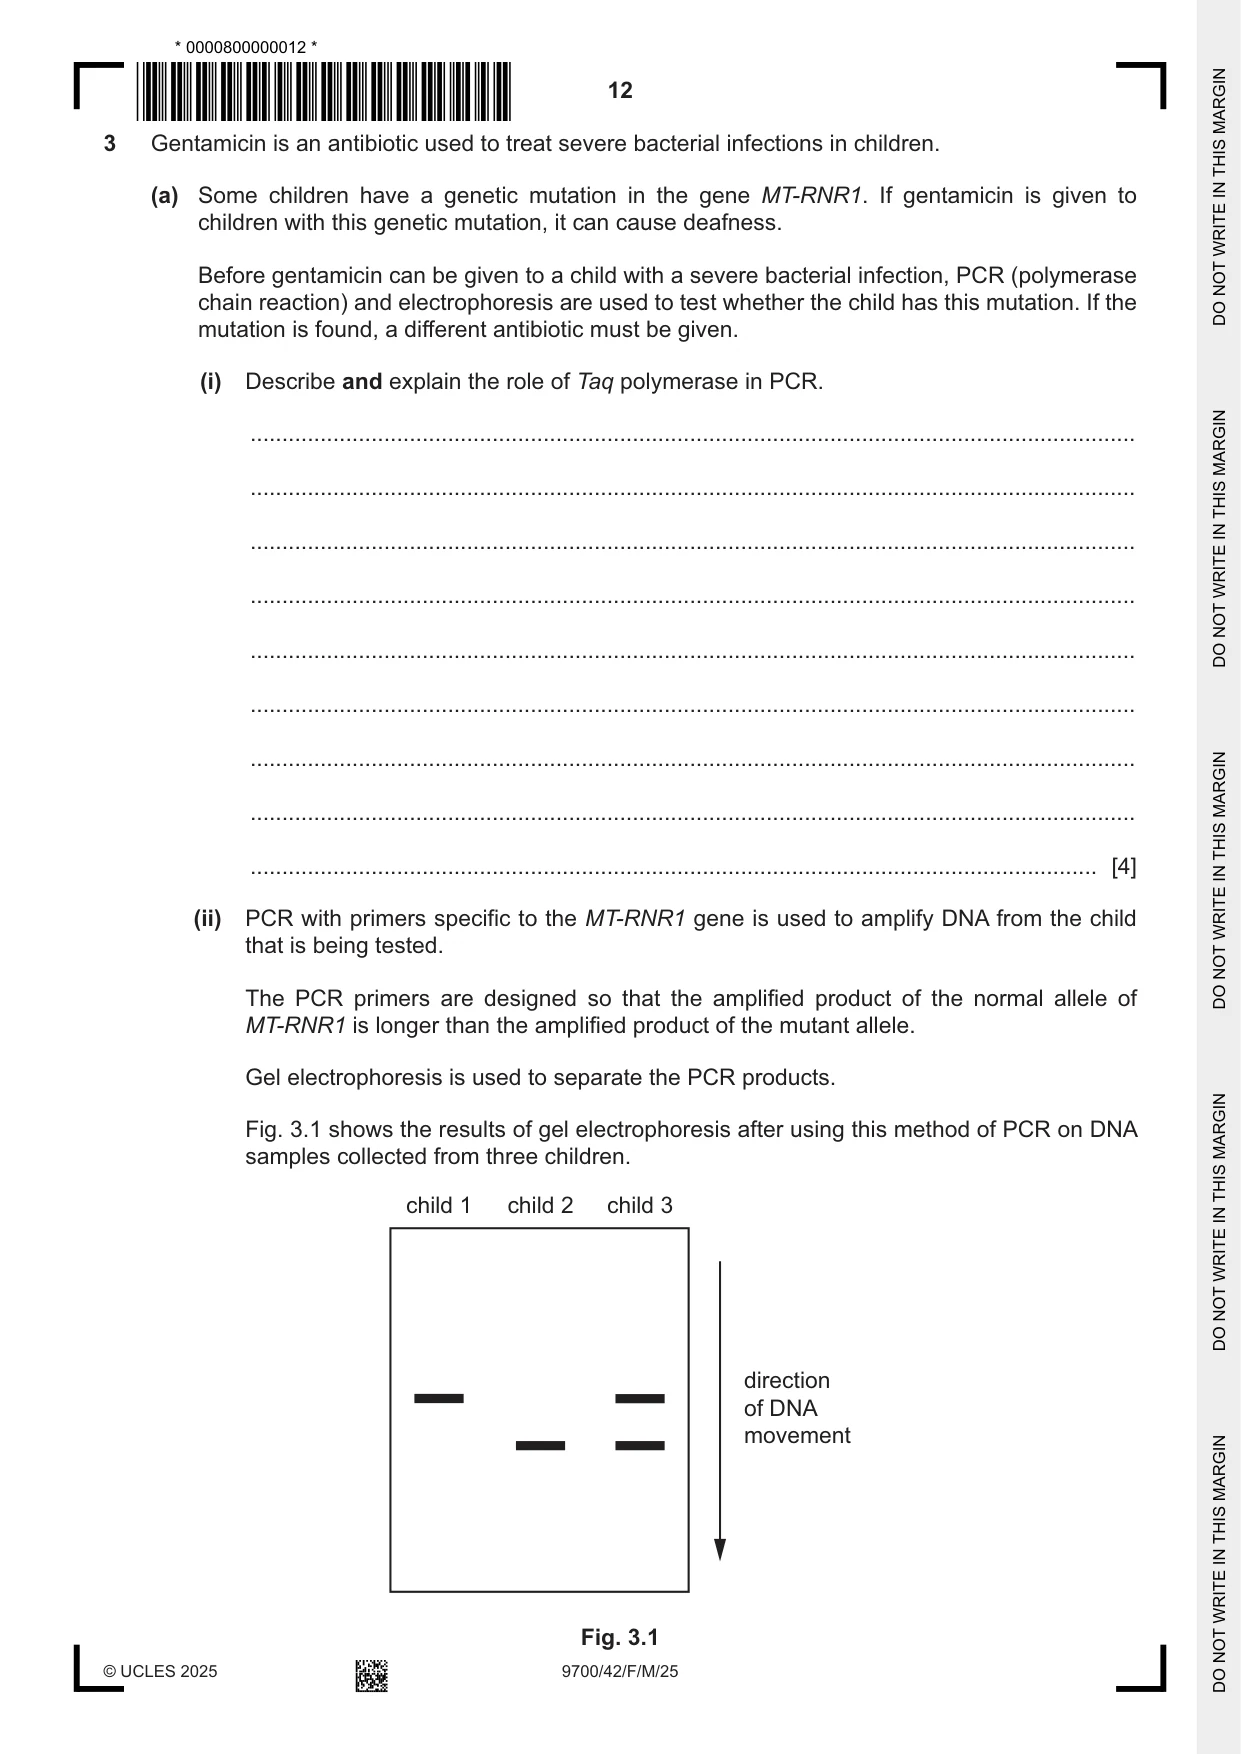
3 Gentamicin is an antibiotic used to treat severe bacterial infections in children. (a) Some children have a genetic mutation in the gene MT-RNR1. If gentamicin is given to children with this genetic mutation, it can cause deafness. Before gentamicin can be given to a child with a severe bacterial infection, PCR (polymerase chain reaction) and electrophoresis are used to test whether the child has this mutation. If the mutation is found, a different antibiotic must be given. (i) Describe and explain the role of Taq polymerase in PCR. ........................................................................................................................................... ........................................................................................................................................... ........................................................................................................................................... ........................................................................................................................................... ........................................................................................................................................... ........................................................................................................................................... ........................................................................................................................................... ........................................................................................................................................... ..................................................................................................................................... [4] (ii) PCR with primers specific to the MT-RNR1 gene is used to amplify DNA from the child that is being tested. The PCR primers are designed so that the amplified product of the normal allele of MT-RNR1 is longer than the amplified product of the mutant allele. Gel electrophoresis is used to separate the PCR products. Fig. 3.1 shows the results of gel electrophoresis after using this method of PCR on DNA samples collected from three children. child 1 child 2 child 3 direction of DNA movement Fig. 3.1 State which of the children in Fig. 3.1 cannot receive the antibiotic gentamicin to treat a severe bacterial infection. ..................................................................................................................................... [1] (iii) Explain how gel electrophoresis produces the pattern of results shown in Fig. 3.1 from the PCR products of the MT-RNR1 gene. ........................................................................................................................................... ........................................................................................................................................... ........................................................................................................................................... ........................................................................................................................................... ........................................................................................................................................... ........................................................................................................................................... ........................................................................................................................................... ........................................................................................................................................... ..................................................................................................................................... [4] (b) Some bacteria have plasmids that contain a gene conferring resistance to gentamicin. The gene can be transferred to other bacteria. Suggest how the gentamicin-resistance gene can be transferred to other bacteria. ................................................................................................................................................... ................................................................................................................................................... ............................................................................................................................................. [1] [Total: 10]
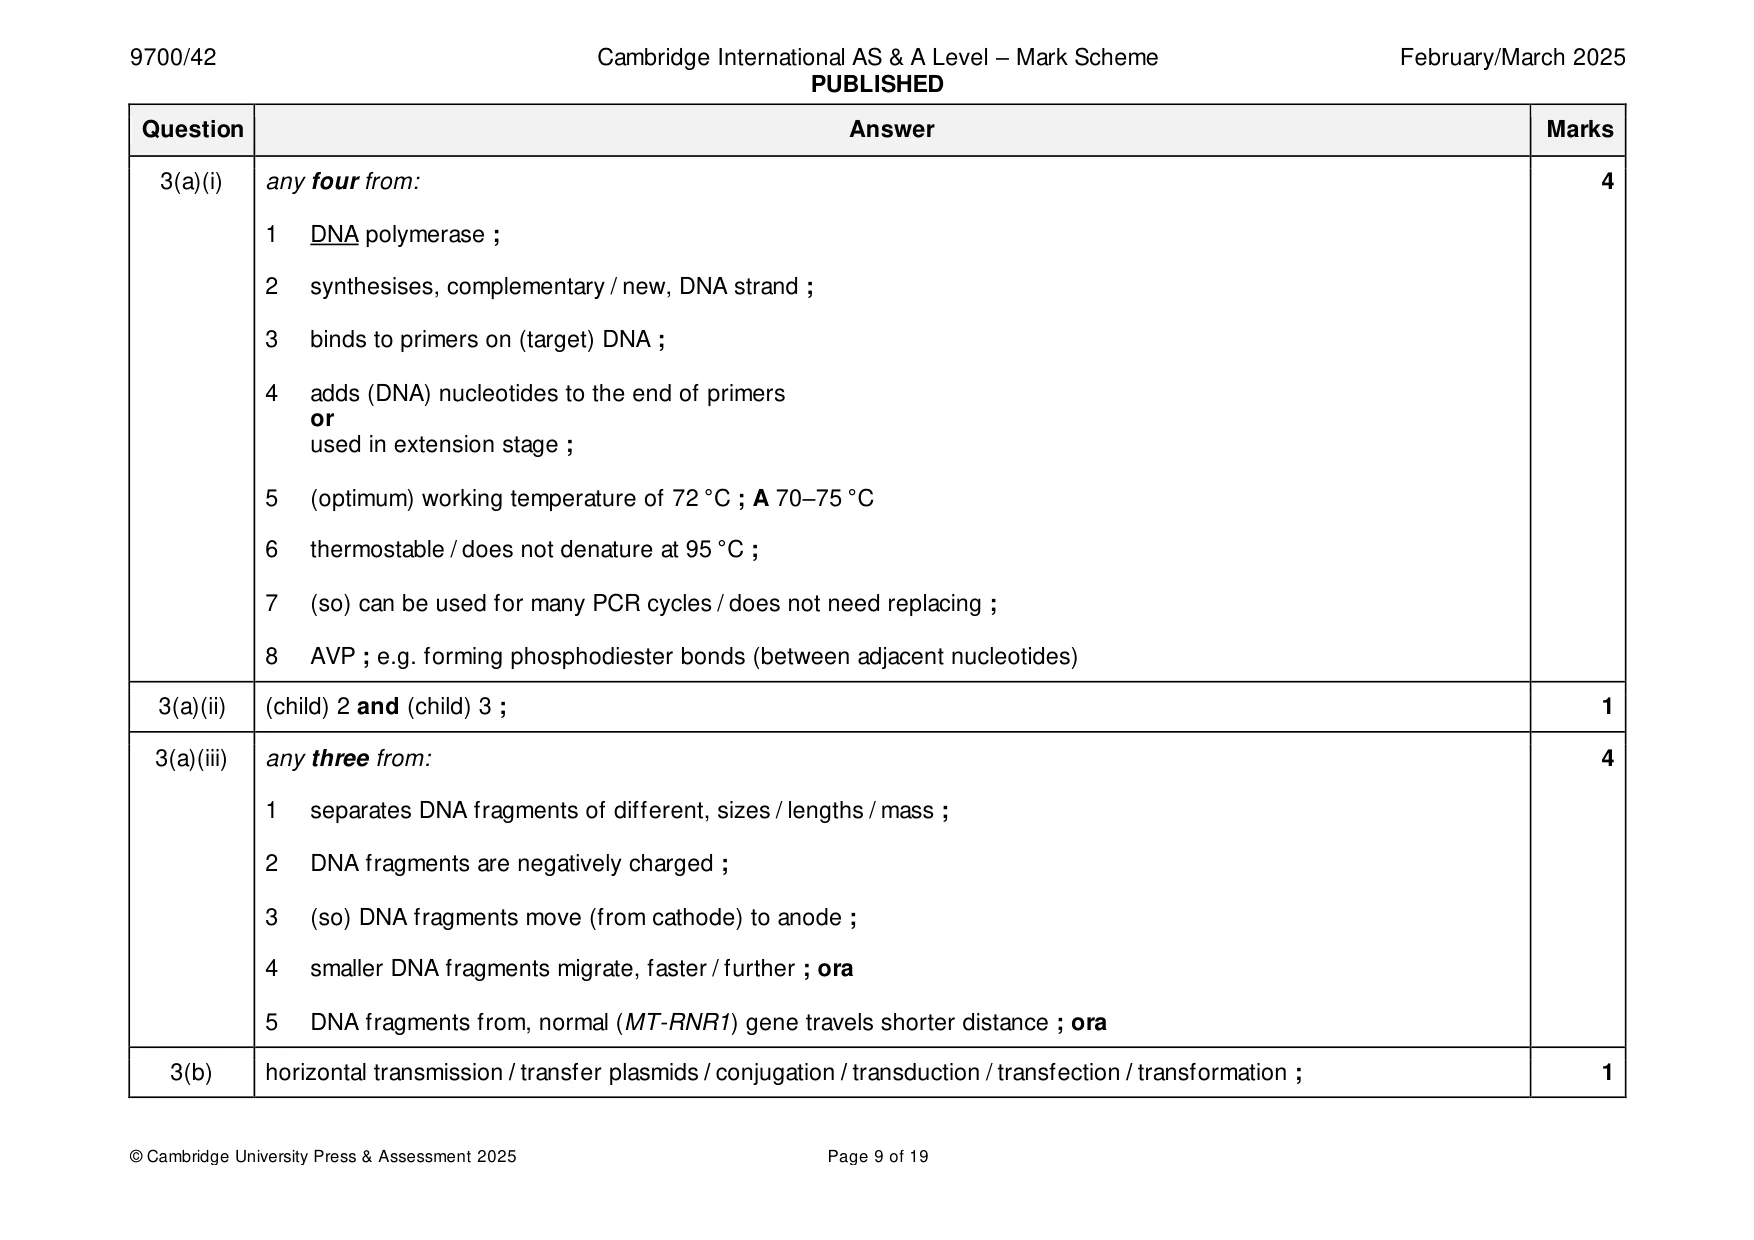
Mark scheme: 3(a)(i) any four from: 4 1 DNA polymerase ; 2 synthesises, complementary / new, DNA strand ; 3 binds to primers on (target) DNA ; 4 adds (DNA) nucleotides to the end of primers or used in extension stage ; 5 (optimum) working temperature of 72 °C ; A 70–75 °C 6 thermostable / does not denature at 95 °C ; 7 (so) can be used for many PCR cycles / does not need replacing ; 8 AVP ; e.g. forming phosphodiester bonds (between adjacent nucleotides) 3(a)(ii) (child) 2 and (child) 3 ; 1 3(a)(iii) any three from: 4 1 separates DNA fragments of different, sizes / lengths / mass ; 2 DNA fragments are negatively charged ; 3 (so) DNA fragments move (from cathode) to anode ; 4 smaller DNA fragments migrate, faster / further ; ora 5 DNA fragments from, normal (MT-RNR1) gene travels shorter distance ; ora 3(b) horizontal transmission / transfer plasmids / conjugation / transduction / transfection / transformation ; 1
Q4 · The HFE gene codes for the HFE protein, which has a role in the regulation of iron…
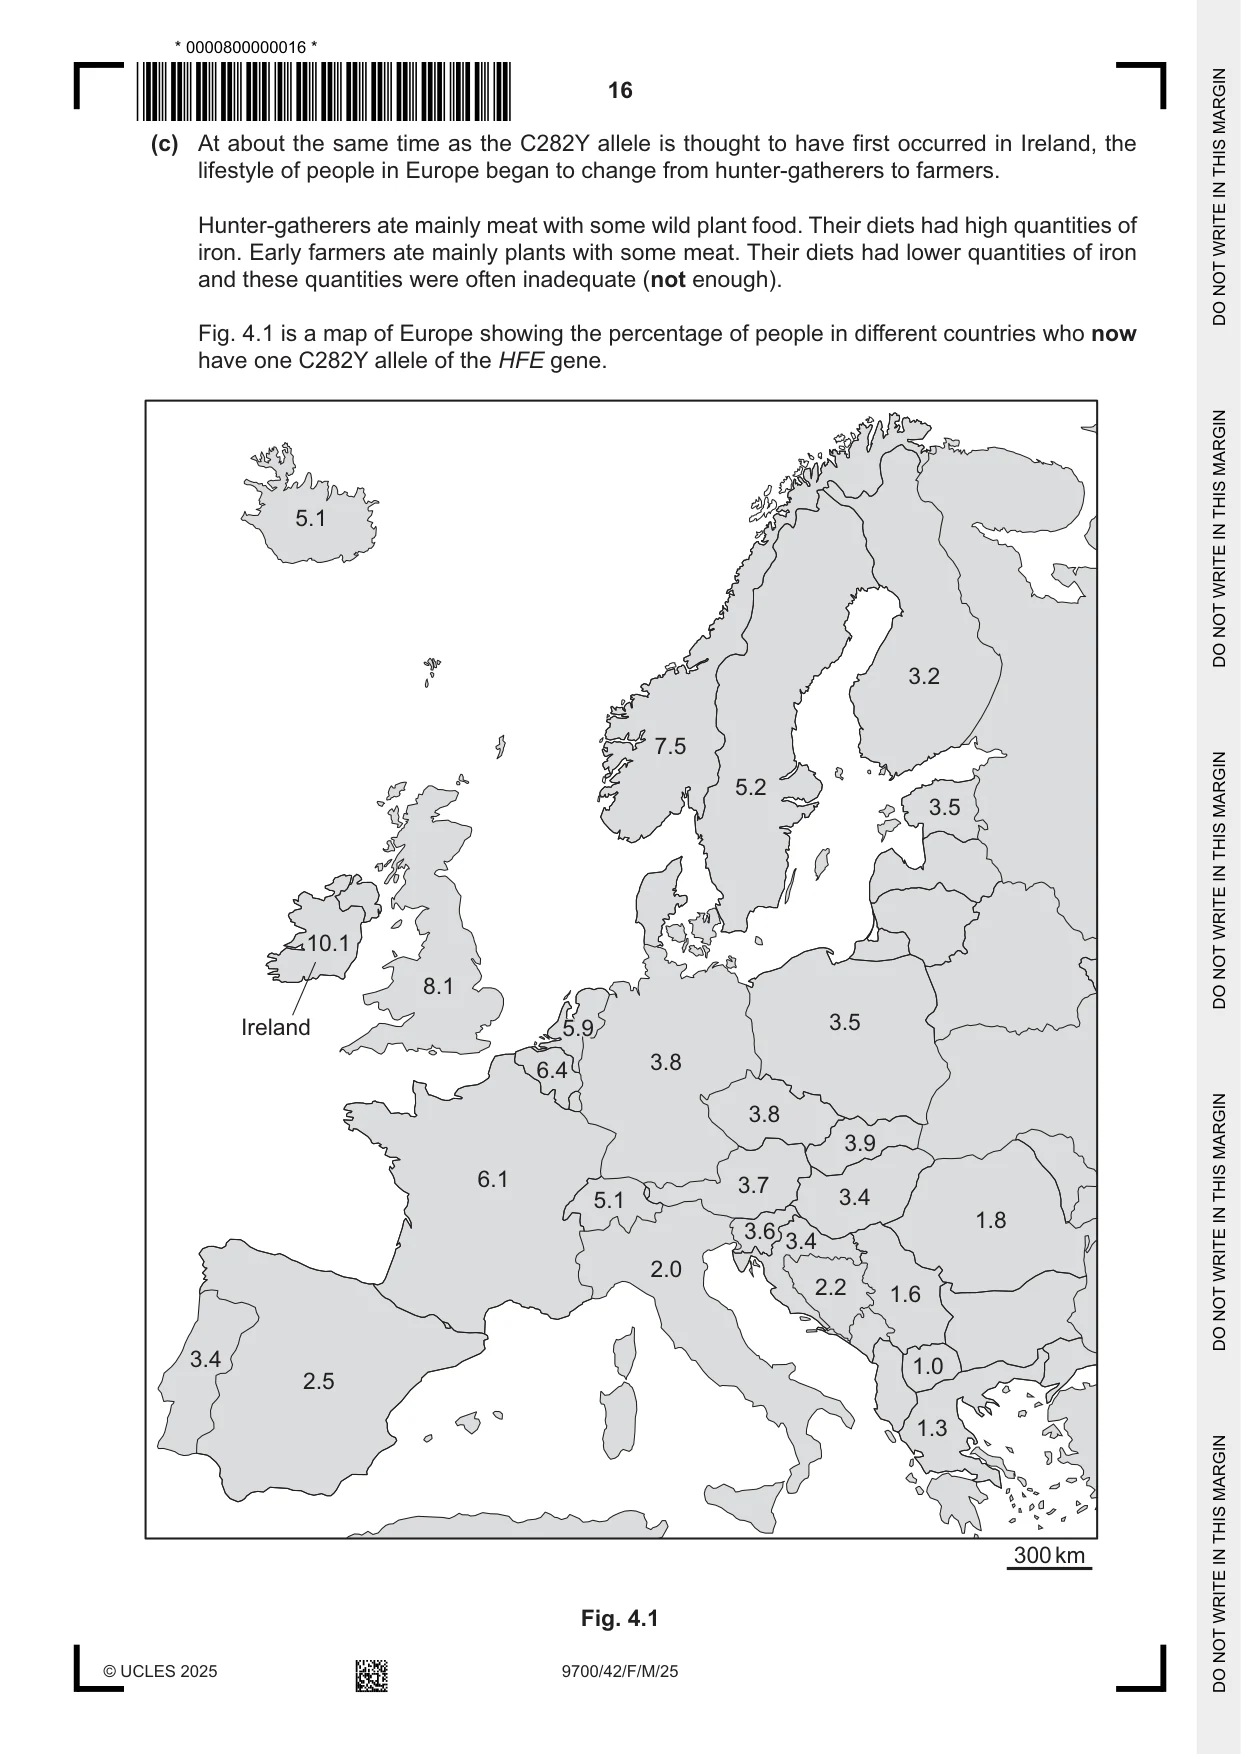
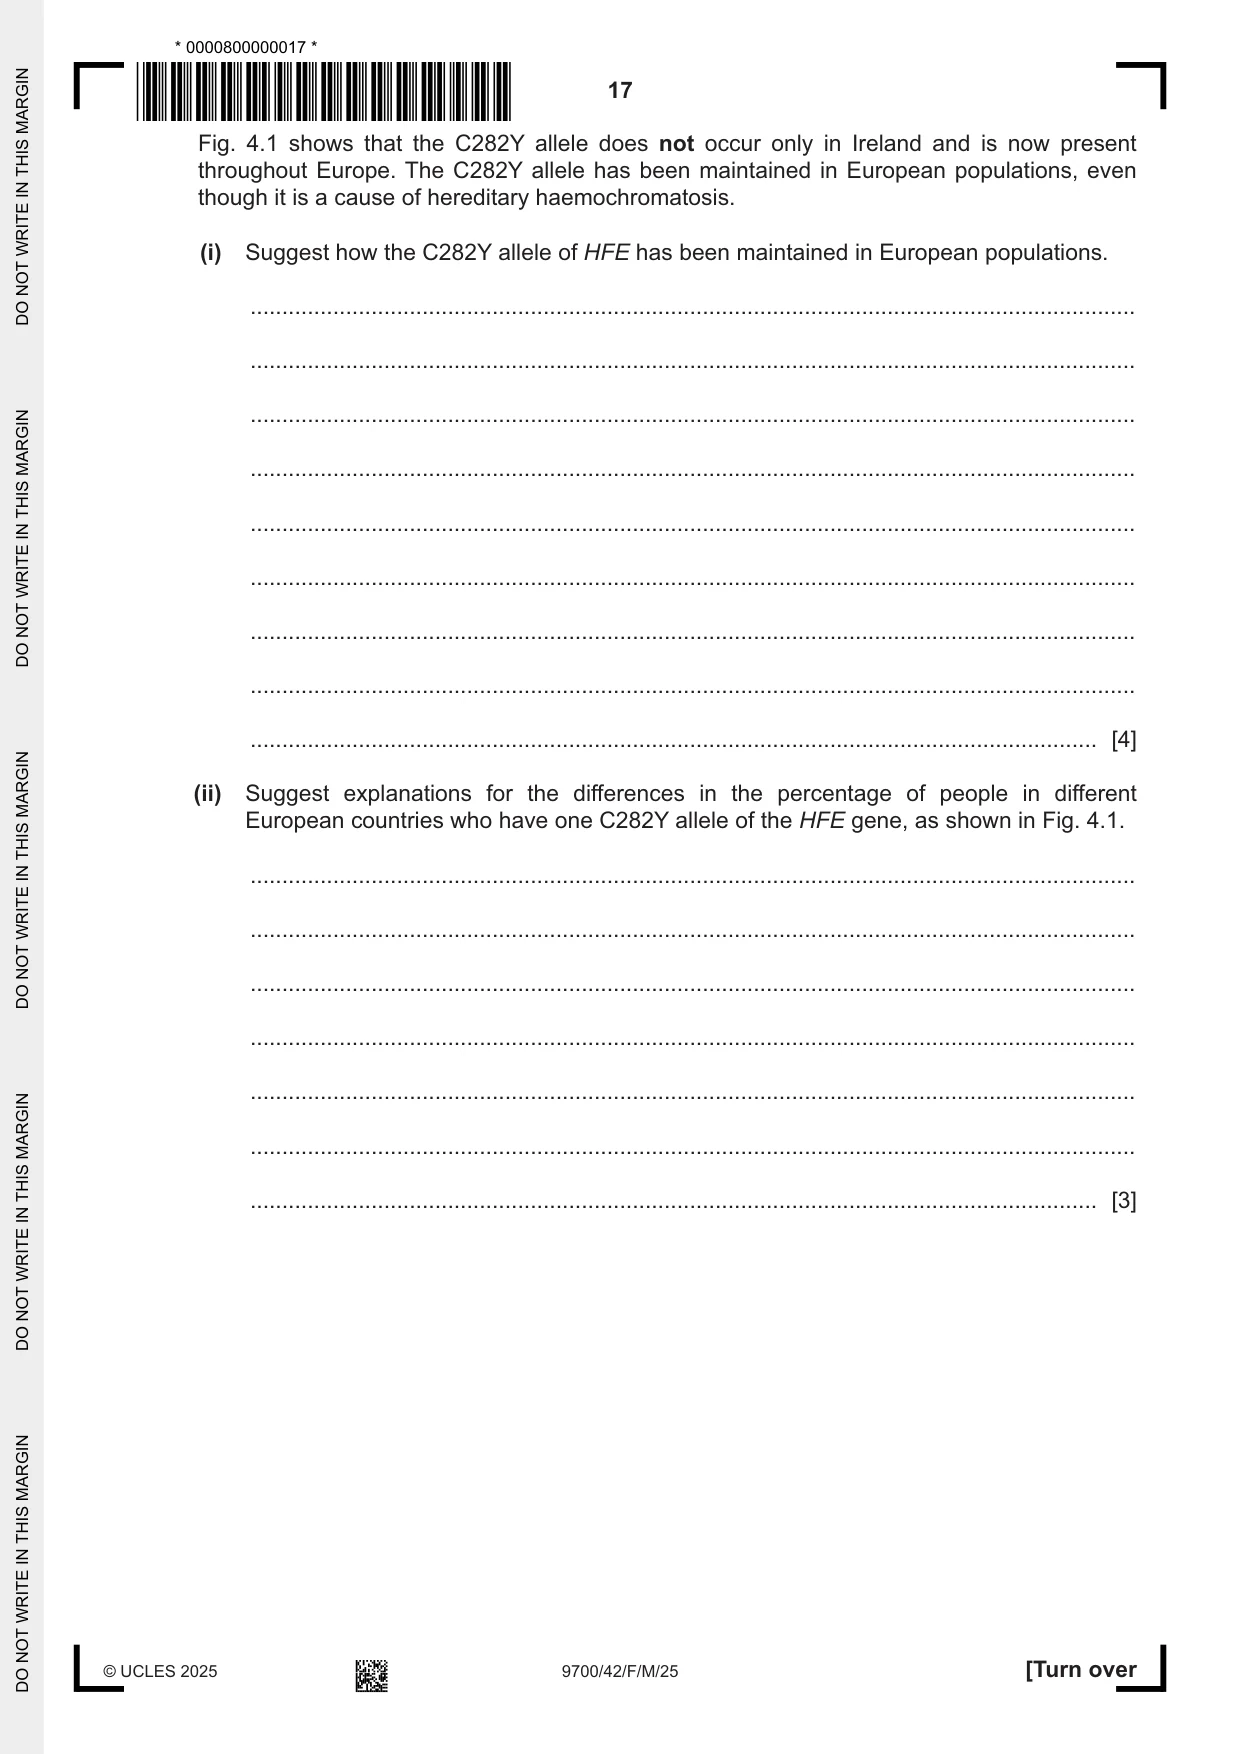
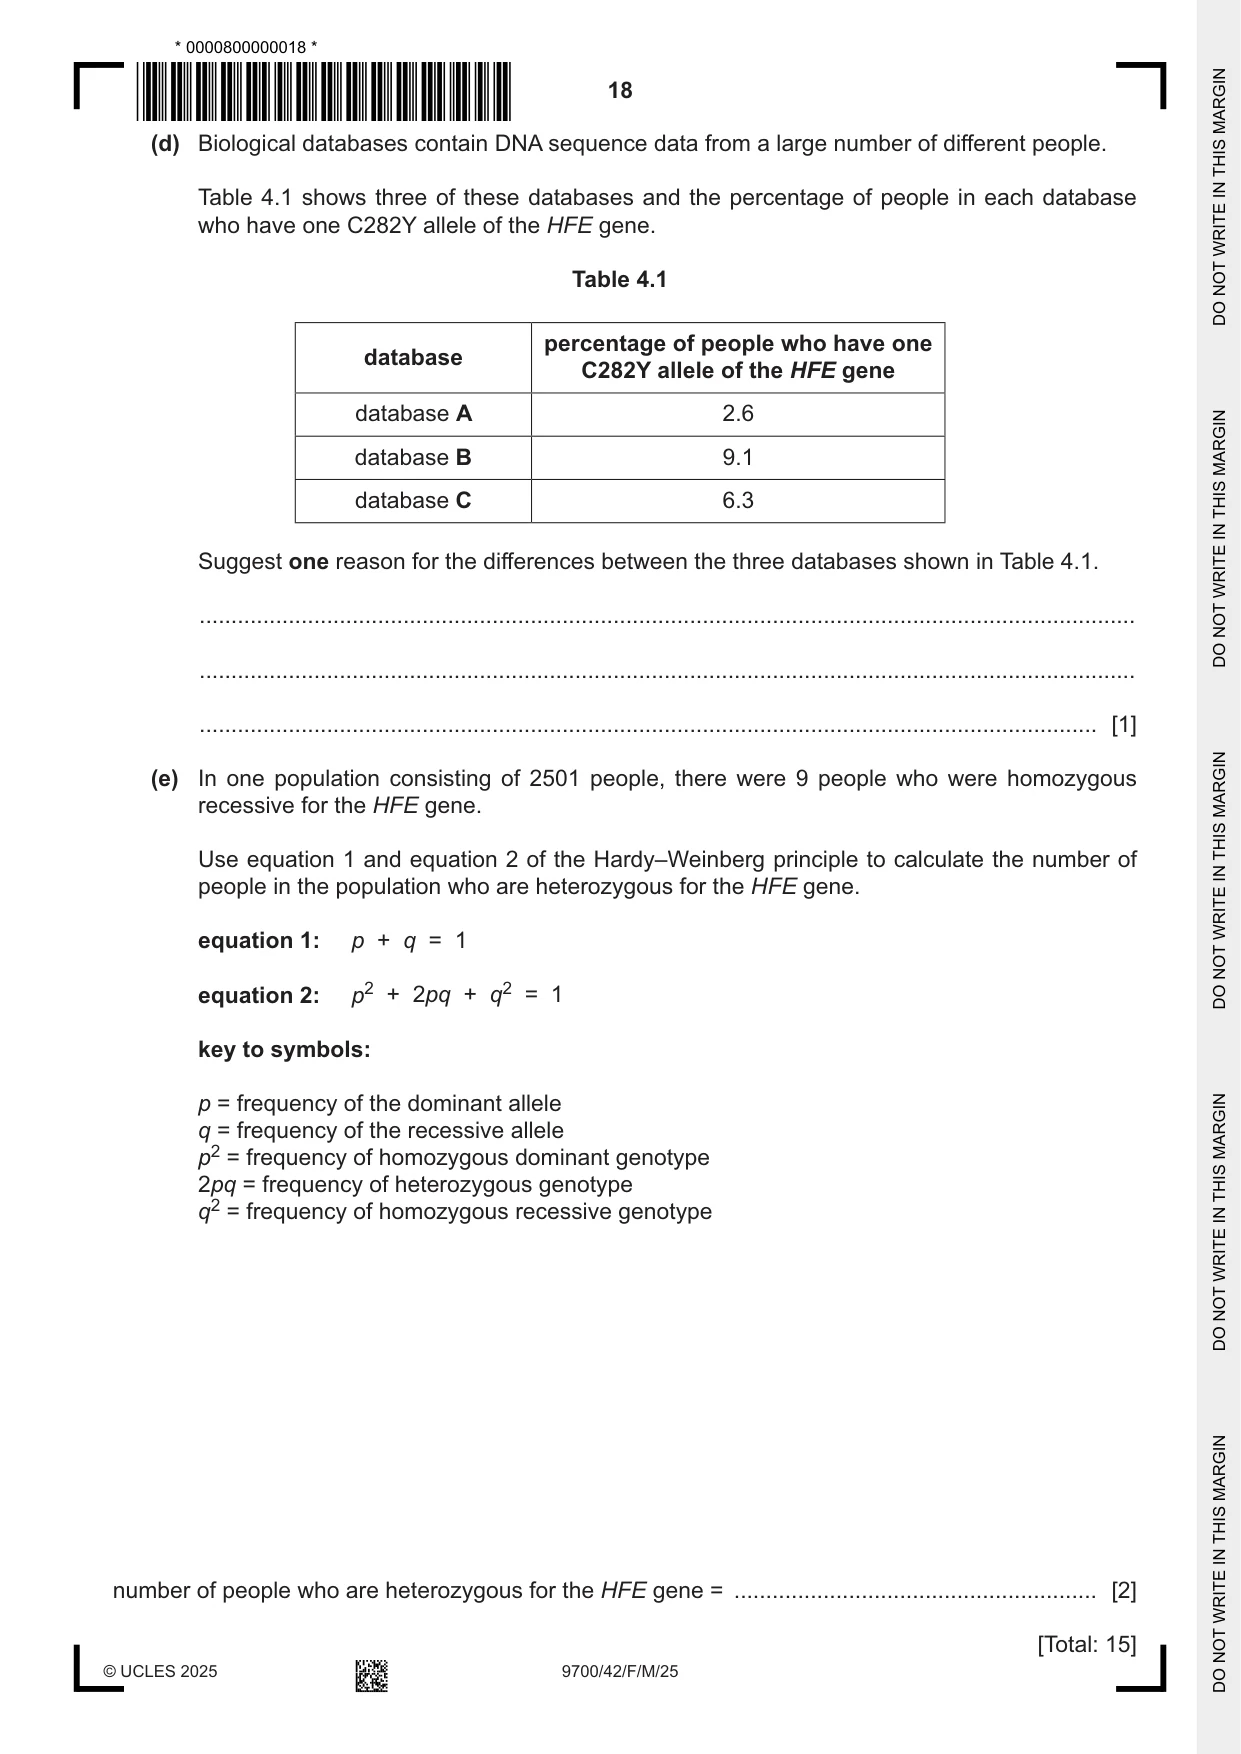
4 The HFE gene codes for the HFE protein, which has a role in the regulation of iron absorption by the body. Iron is an essential mineral that can be obtained only from the diet. A mutation of the HFE gene known as C282Y causes hereditary haemochromatosis, which is an autosomal recessive disease. The mutant allele codes for a non-functioning protein. People who are homozygous for the mutant allele produce no functioning HFE protein and this results in an excess of iron being absorbed by the body. The accumulation (build-up) of iron in body organs over many years can cause organ damage. People that are heterozygous for the HFE gene do not have hereditary haemochromatosis. They do absorb more iron from their diet than people who do not have the mutation, but this does not usually have any health effects. (a) Construct a genetic diagram of a monohybrid cross to show how two parents who do not have hereditary haemochromatosis can produce a child with the disease. Use the following symbols: H = normal HFE allele h = mutant HFE allele. [3] (b) Some scientists believe that the C282Y mutation may have first occurred in Ireland. Scientists sequenced DNA obtained from two human fossil skeletons in Ireland. One of the fossils was 5200 years old and the other was 4000 years old. The scientists concluded that: • the human living 4000 years ago did have the C282Y mutation • the human living 5200 years ago did not have the C282Y mutation. Explain how analysis of the results of these DNA sequencing studies could have been carried out to allow the scientists to make these conclusions. ................................................................................................................................................... ................................................................................................................................................... ................................................................................................................................................... ................................................................................................................................................... ............................................................................................................................................. [2] (c) At about the same time as the C282Y allele is thought to have first occurred in Ireland, the lifestyle of people in Europe began to change from hunter-gatherers to farmers. Hunter-gatherers ate mainly meat with some wild plant food. Their diets had high quantities of iron. Early farmers ate mainly plants with some meat. Their diets had lower quantities of iron and these quantities were often inadequate (not enough). Fig. 4.1 is a map of Europe showing the percentage of people in different countries who now have one C282Y allele of the HFE gene. 5.1 3.2 7.5 5.2 3.5 10.1 8.1 Ireland 5.95.9 3.5 3.8 6.4 3.8 3.9 6.1 3.7 5.1 3.4 1.8 3.6 3.4 2.0 2.2 1.6 3.4 1.0 2.5 1.3 300 km Fig. 4.1 Fig. 4.1 shows that the C282Y allele does not occur only in Ireland and is now present throughout Europe. The C282Y allele has been maintained in European populations, even though it is a cause of hereditary haemochromatosis. (i) Suggest how the C282Y allele of HFE has been maintained in European populations. ........................................................................................................................................... ........................................................................................................................................... ........................................................................................................................................... ........................................................................................................................................... ........................................................................................................................................... ........................................................................................................................................... ........................................................................................................................................... ........................................................................................................................................... ..................................................................................................................................... [4] (ii) Suggest explanations for the differences in the percentage of people in different European countries who have one C282Y allele of the HFE gene, as shown in Fig. 4.1. ........................................................................................................................................... ........................................................................................................................................... ........................................................................................................................................... ........................................................................................................................................... ........................................................................................................................................... ........................................................................................................................................... ..................................................................................................................................... [3] (d) Biological databases contain DNA sequence data from a large number of different people. Table 4.1 shows three of these databases and the percentage of people in each database who have one C282Y allele of the HFE gene. Table 4.1 percentage of people who have one database C282Y allele of the HFE gene database A 2.6 database B 9.1 database C 6.3 Suggest one reason for the differences between the three databases shown in Table 4.1. ................................................................................................................................................... ................................................................................................................................................... ............................................................................................................................................. [1] (e) In one population consisting of 2501 people, there were 9 people who were homozygous recessive for the HFE gene. Use equation 1 and equation 2 of the Hardy–Weinberg principle to calculate the number of people in the population who are heterozygous for the HFE gene. equation 1: p + q = 1 equation 2: p2 + 2pq + q2 = 1 key to symbols: p = frequency of the dominant allele q = frequency of the recessive allele p2 = frequency of homozygous dominant genotype 2pq = frequency of heterozygous genotype q2 = frequency of homozygous recessive genotype number of people who are heterozygous for the HFE gene = ......................................................... [2] [Total: 15]
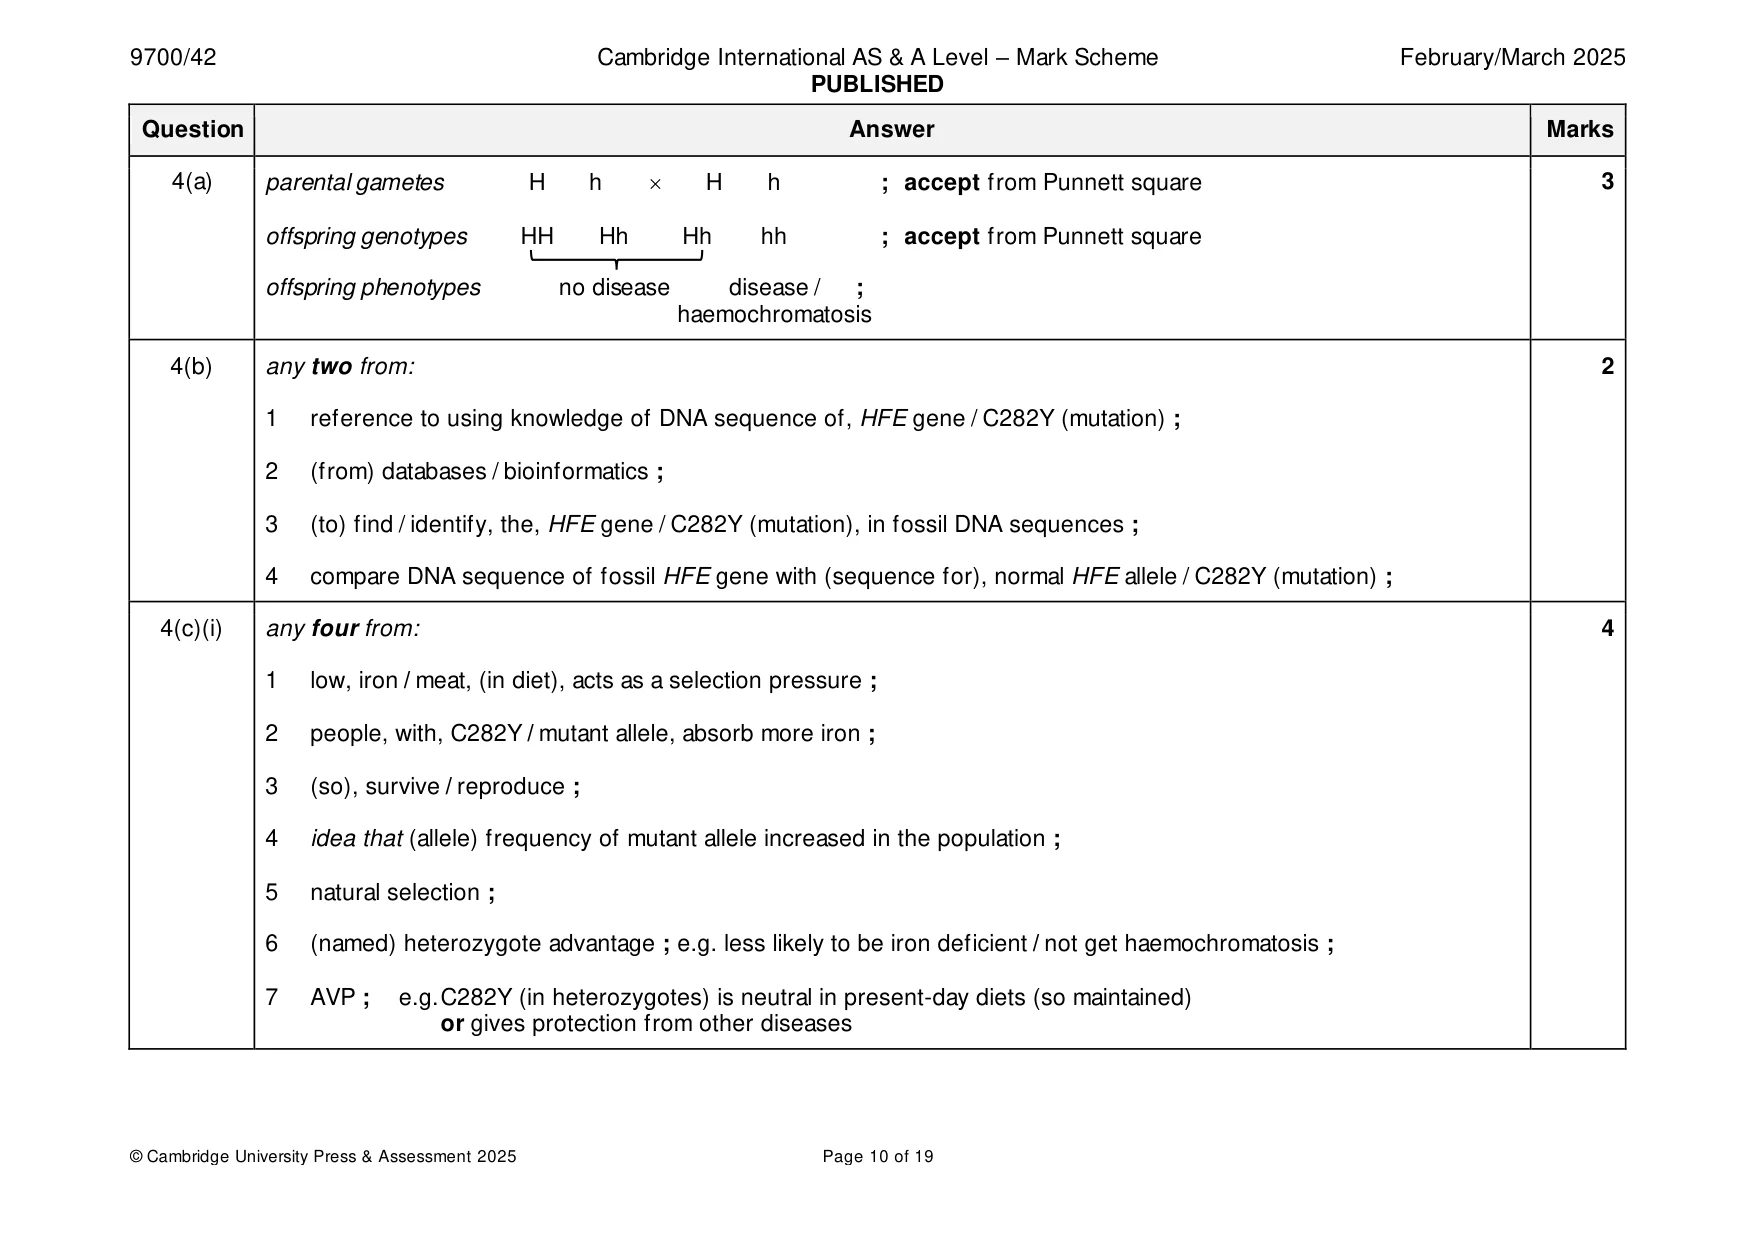
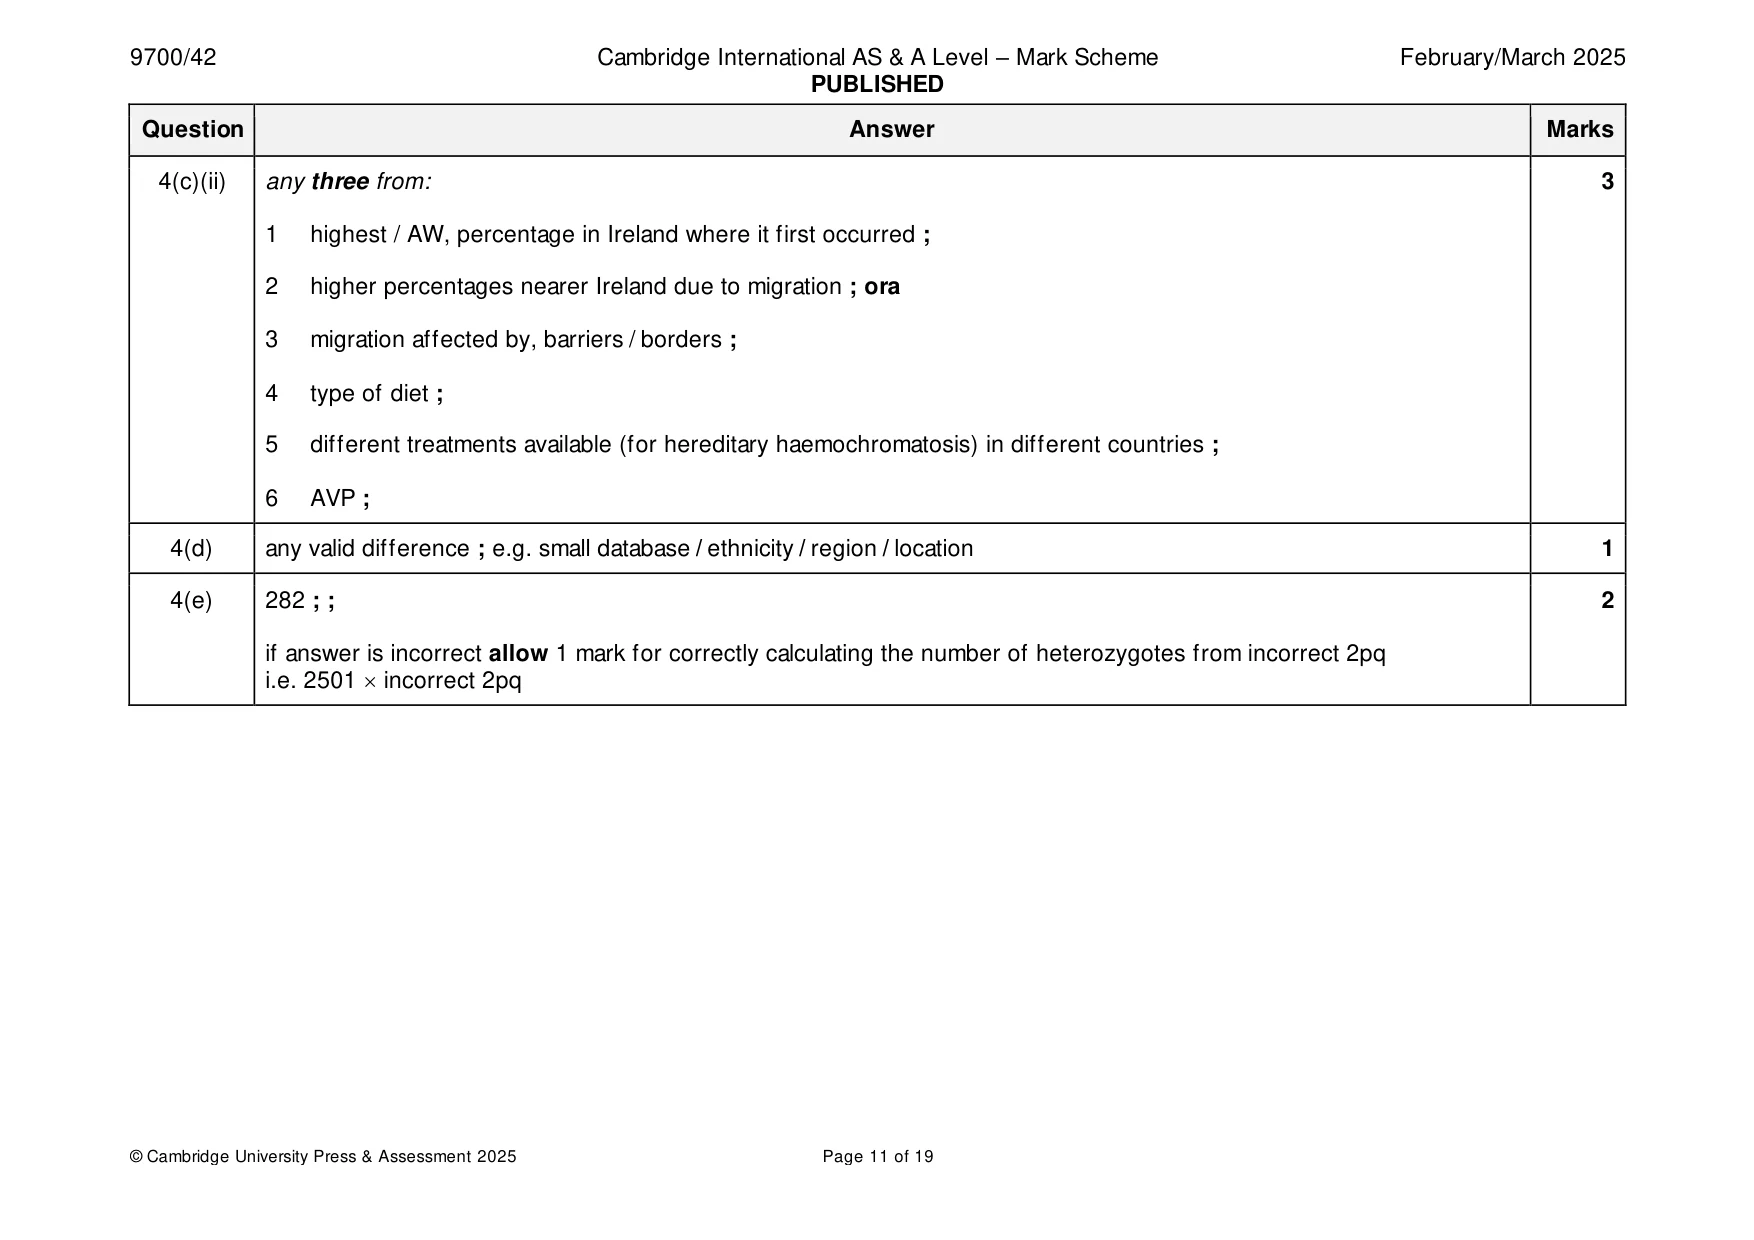
Mark scheme: 4(a) parental gametes H h H h ; accept from Punnett square 3 offspring genotypes HH Hh Hh hh ; accept from Punnett square offspring phenotypes no disease disease / ; haemochromatosis 4(b) any two from: 2 1 reference to using knowledge of DNA sequence of, HFE gene / C282Y (mutation) ; 2 (from) databases / bioinformatics ; 3 (to) find / identify, the, HFE gene / C282Y (mutation), in fossil DNA sequences ; 4 compare DNA sequence of fossil HFE gene with (sequence for), normal HFE allele / C282Y (mutation) ; 4(c)(i) any four from: 4 1 low, iron / meat, (in diet), acts as a selection pressure ; 2 people, with, C282Y / mutant allele, absorb more iron ; 3 (so), survive / reproduce ; 4 idea that (allele) frequency of mutant allele increased in the population ; 5 natural selection ; 6 (named) heterozygote advantage ; e.g. less likely to be iron deficient / not get haemochromatosis ; 7 AVP ; e.g. C282Y (in heterozygotes) is neutral in present-day diets (so maintained) or gives protection from other diseases 4(c)(ii) any three from: 3 1 highest / AW, percentage in Ireland where it first occurred ; 2 higher percentages nearer Ireland due to migration ; ora 3 migration affected by, barriers / borders ; 4 type of diet ; 5 different treatments available (for hereditary haemochromatosis) in different countries ; 6 AVP ; 4(d) any valid difference ; e.g. small database / ethnicity / region / location 1 4(e) 282 ; ; 2 if answer is incorrect allow 1 mark for correctly calculating the number of heterozygotes from incorrect 2pq i.e. 2501 incorrect 2pq
Q5 · A photomicrograph of a single plant cell in a stage of meiosis
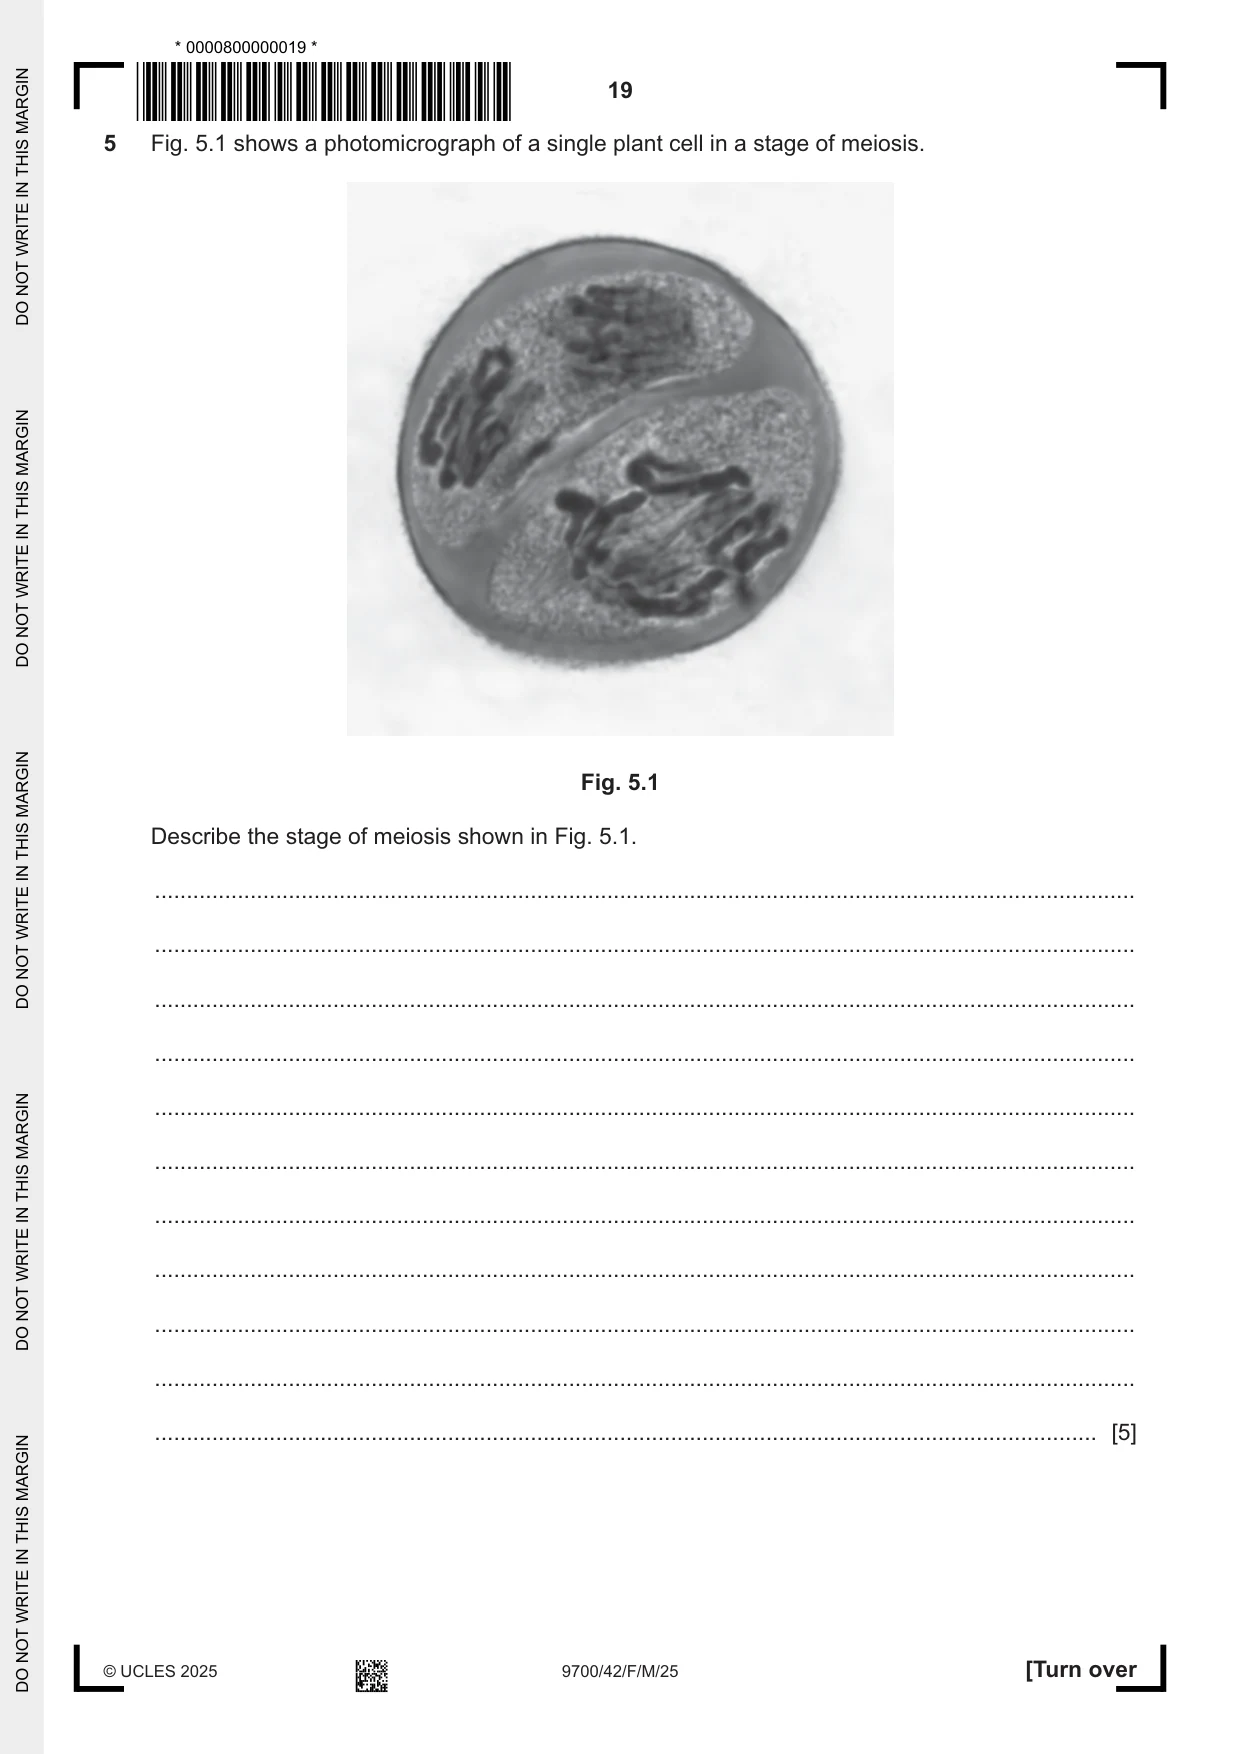
5 Fig. 5.1 shows a photomicrograph of a single plant cell in a stage of meiosis. Fig. 5.1 Describe the stage of meiosis shown in Fig. 5.1. .......................................................................................................................................................... .......................................................................................................................................................... .......................................................................................................................................................... .......................................................................................................................................................... .......................................................................................................................................................... .......................................................................................................................................................... .......................................................................................................................................................... .......................................................................................................................................................... .......................................................................................................................................................... .......................................................................................................................................................... .................................................................................................................................................... [5]
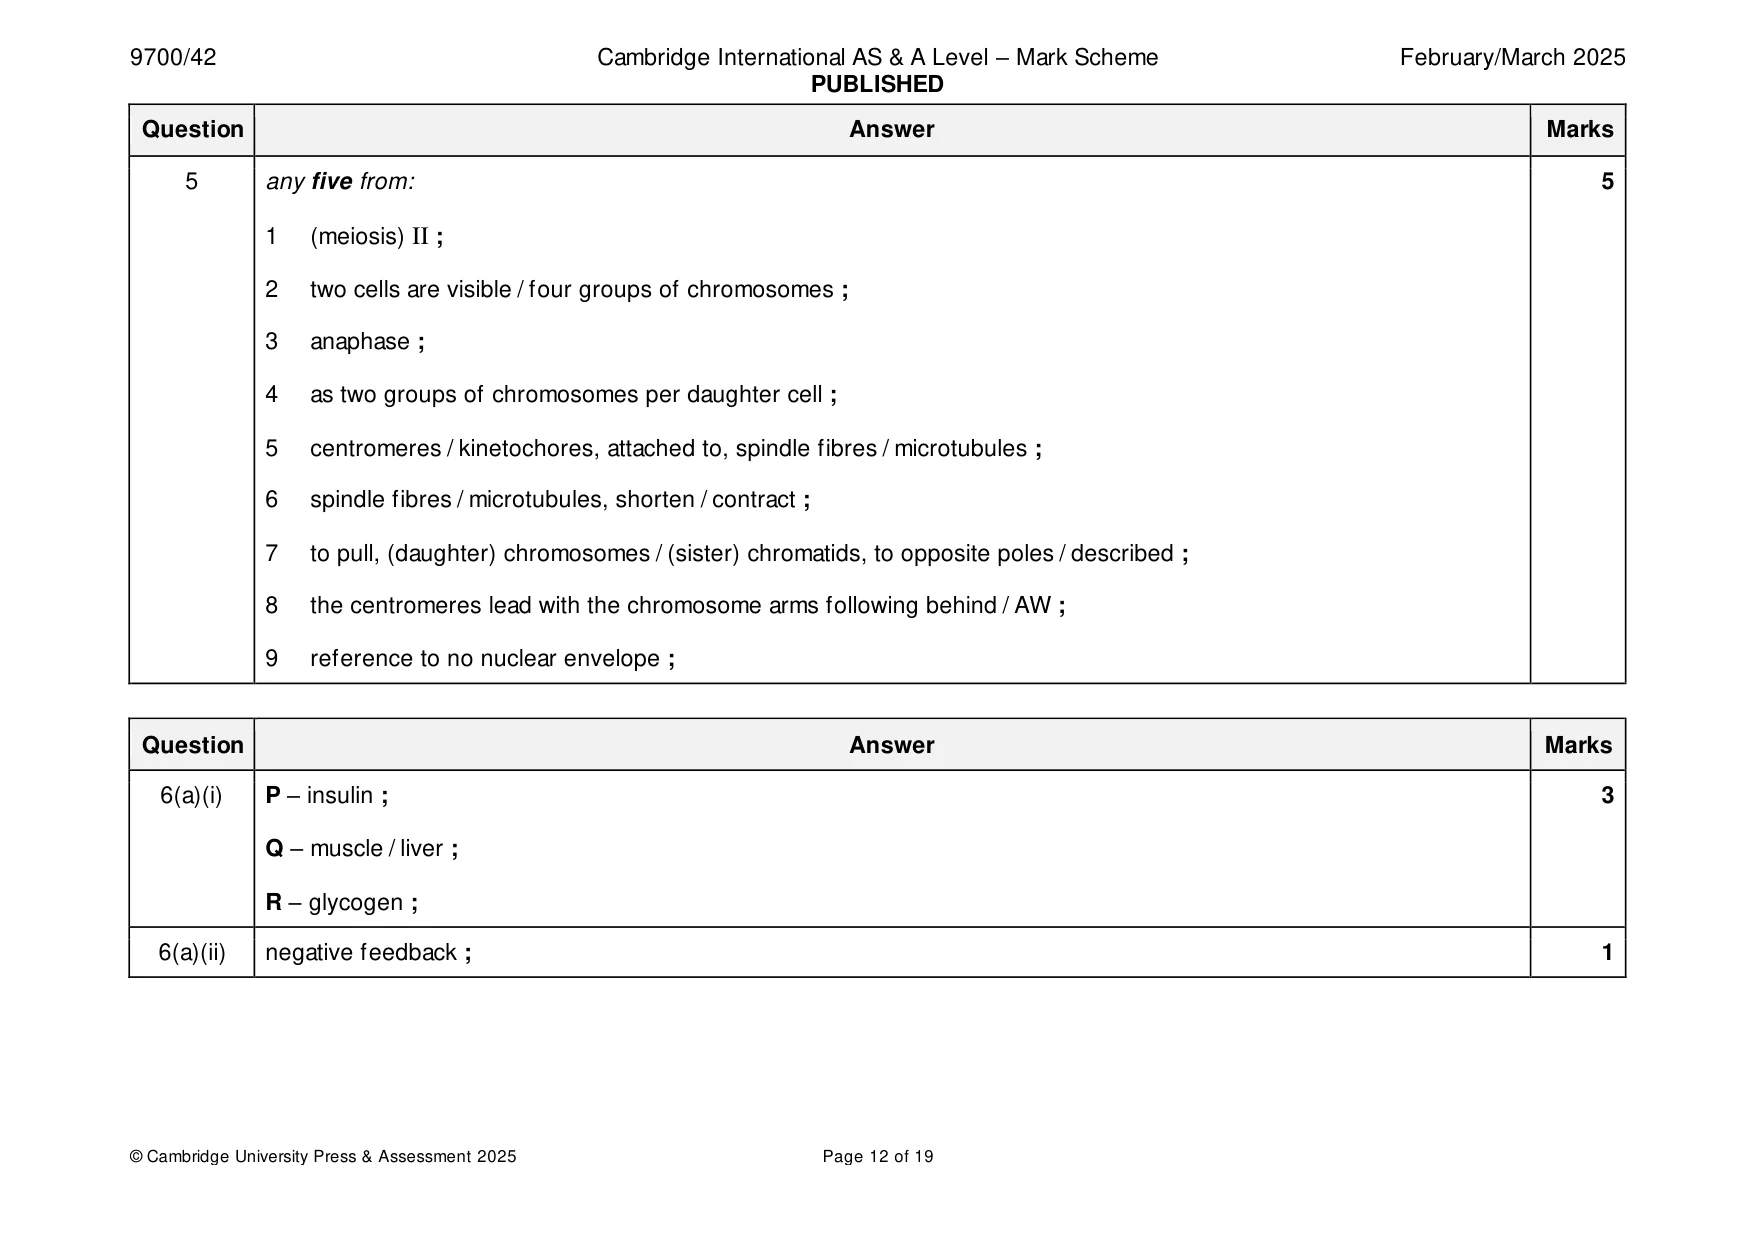
Mark scheme: 5 any five from: 5 1 (meiosis) II ; 2 two cells are visible / four groups of chromosomes ; 3 anaphase ; 4 as two groups of chromosomes per daughter cell ; 5 centromeres / kinetochores, attached to, spindle fibres / microtubules ; 6 spindle fibres / microtubules, shorten / contract ; 7 to pull, (daughter) chromosomes / (sister) chromatids, to opposite poles / described ; 8 the centromeres lead with the chromosome arms following behind / AW ; 9 reference to no nuclear envelope ;
More questions on Replication and division of nuclei and cells
Question 6
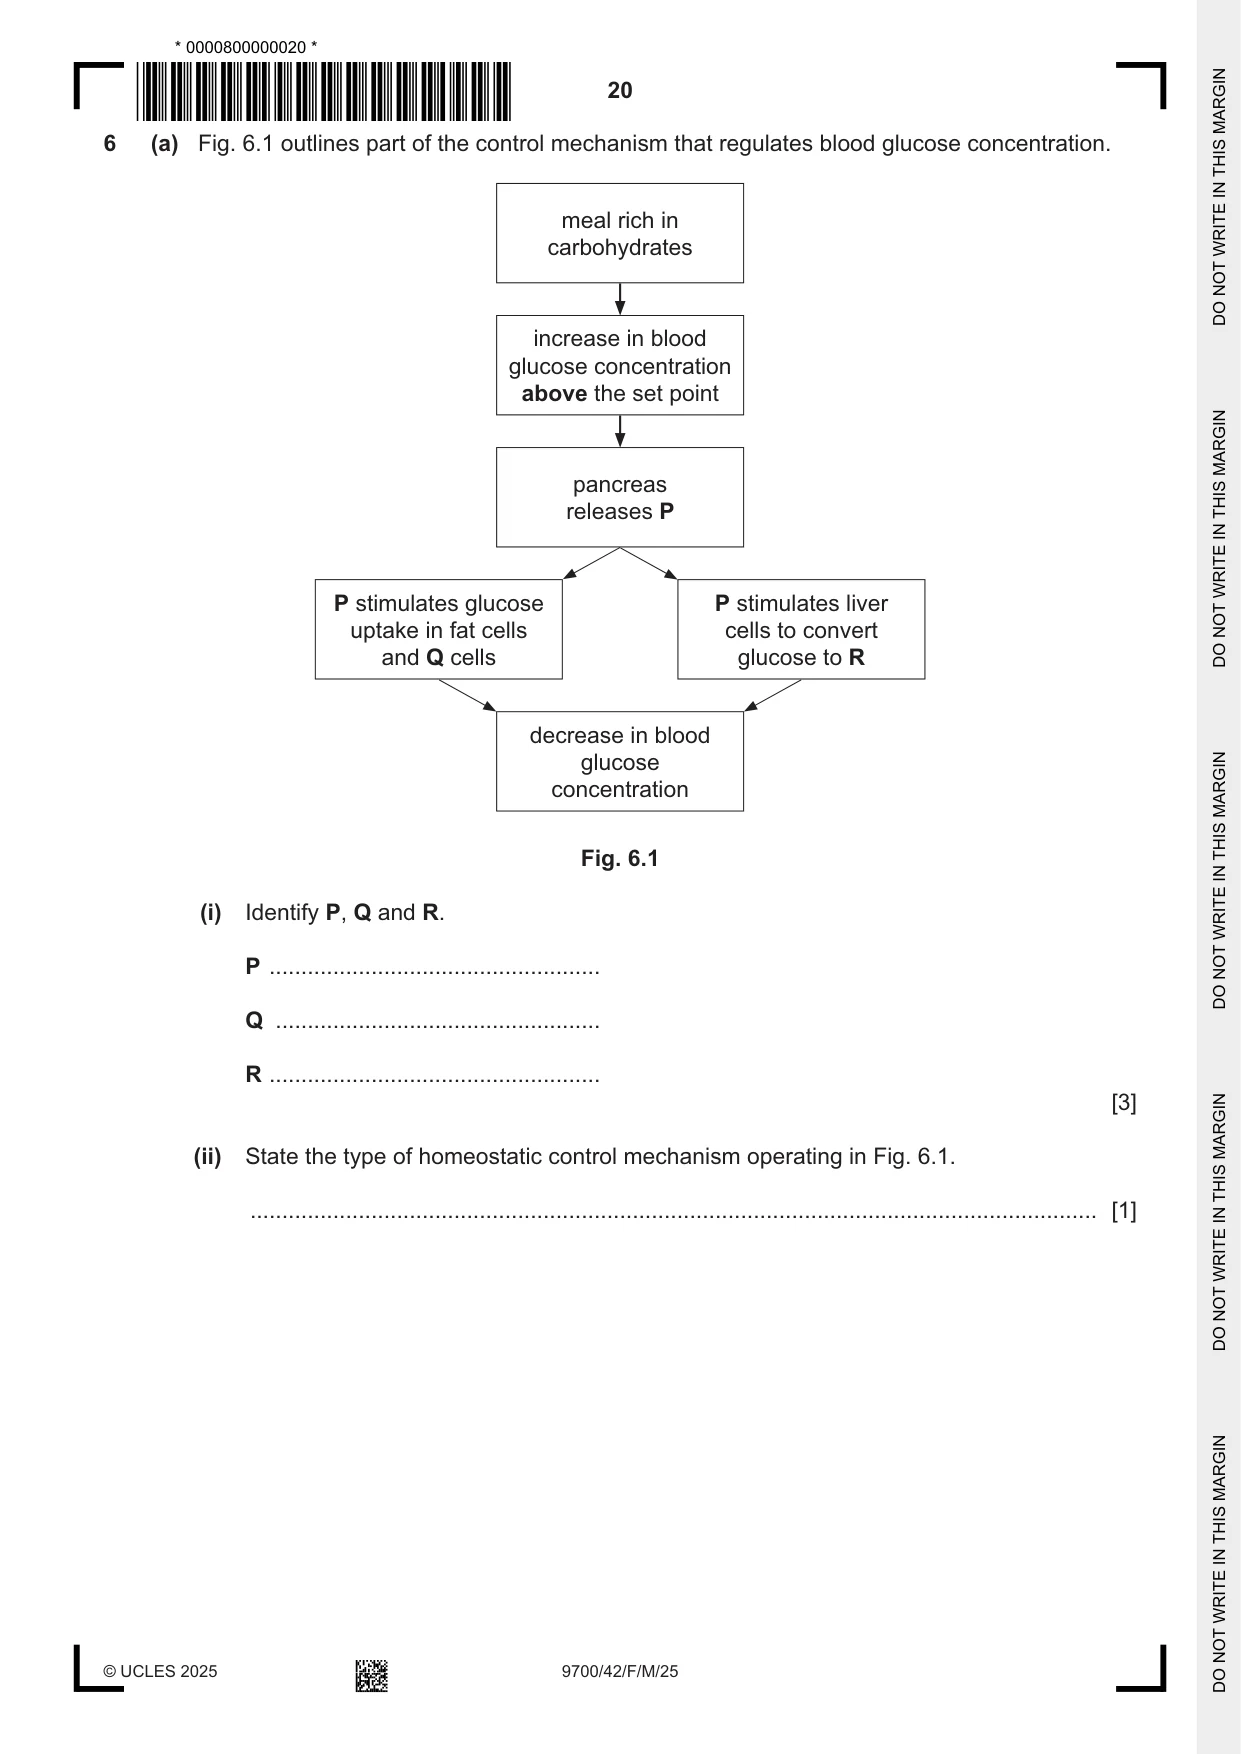
6 (a) Fig. 6.1 outlines part of the control mechanism that regulates blood glucose concentration. meal rich in carbohydrates increase in blood glucose concentration above the set point pancreas releases P P stimulates glucose P stimulates liver uptake in fat cells cells to convert and Q cells glucose to R decrease in blood glucose concentration Fig. 6.1 (i) Identify P, Q and R. P .................................................... Q ................................................... R .................................................... [3] (ii) State the type of homeostatic control mechanism operating in Fig. 6.1. ..................................................................................................................................... [1] (b) When the blood glucose concentration decreases below the set point, a hormone is released from the pancreas. Describe how the release of this hormone leads to the blood glucose concentration returning to the set point. ................................................................................................................................................... ................................................................................................................................................... ................................................................................................................................................... ................................................................................................................................................... ................................................................................................................................................... ................................................................................................................................................... ................................................................................................................................................... ................................................................................................................................................... ................................................................................................................................................... ................................................................................................................................................... ................................................................................................................................................... ................................................................................................................................................... ................................................................................................................................................... ................................................................................................................................................... ............................................................................................................................................. [7] [Total: 11]
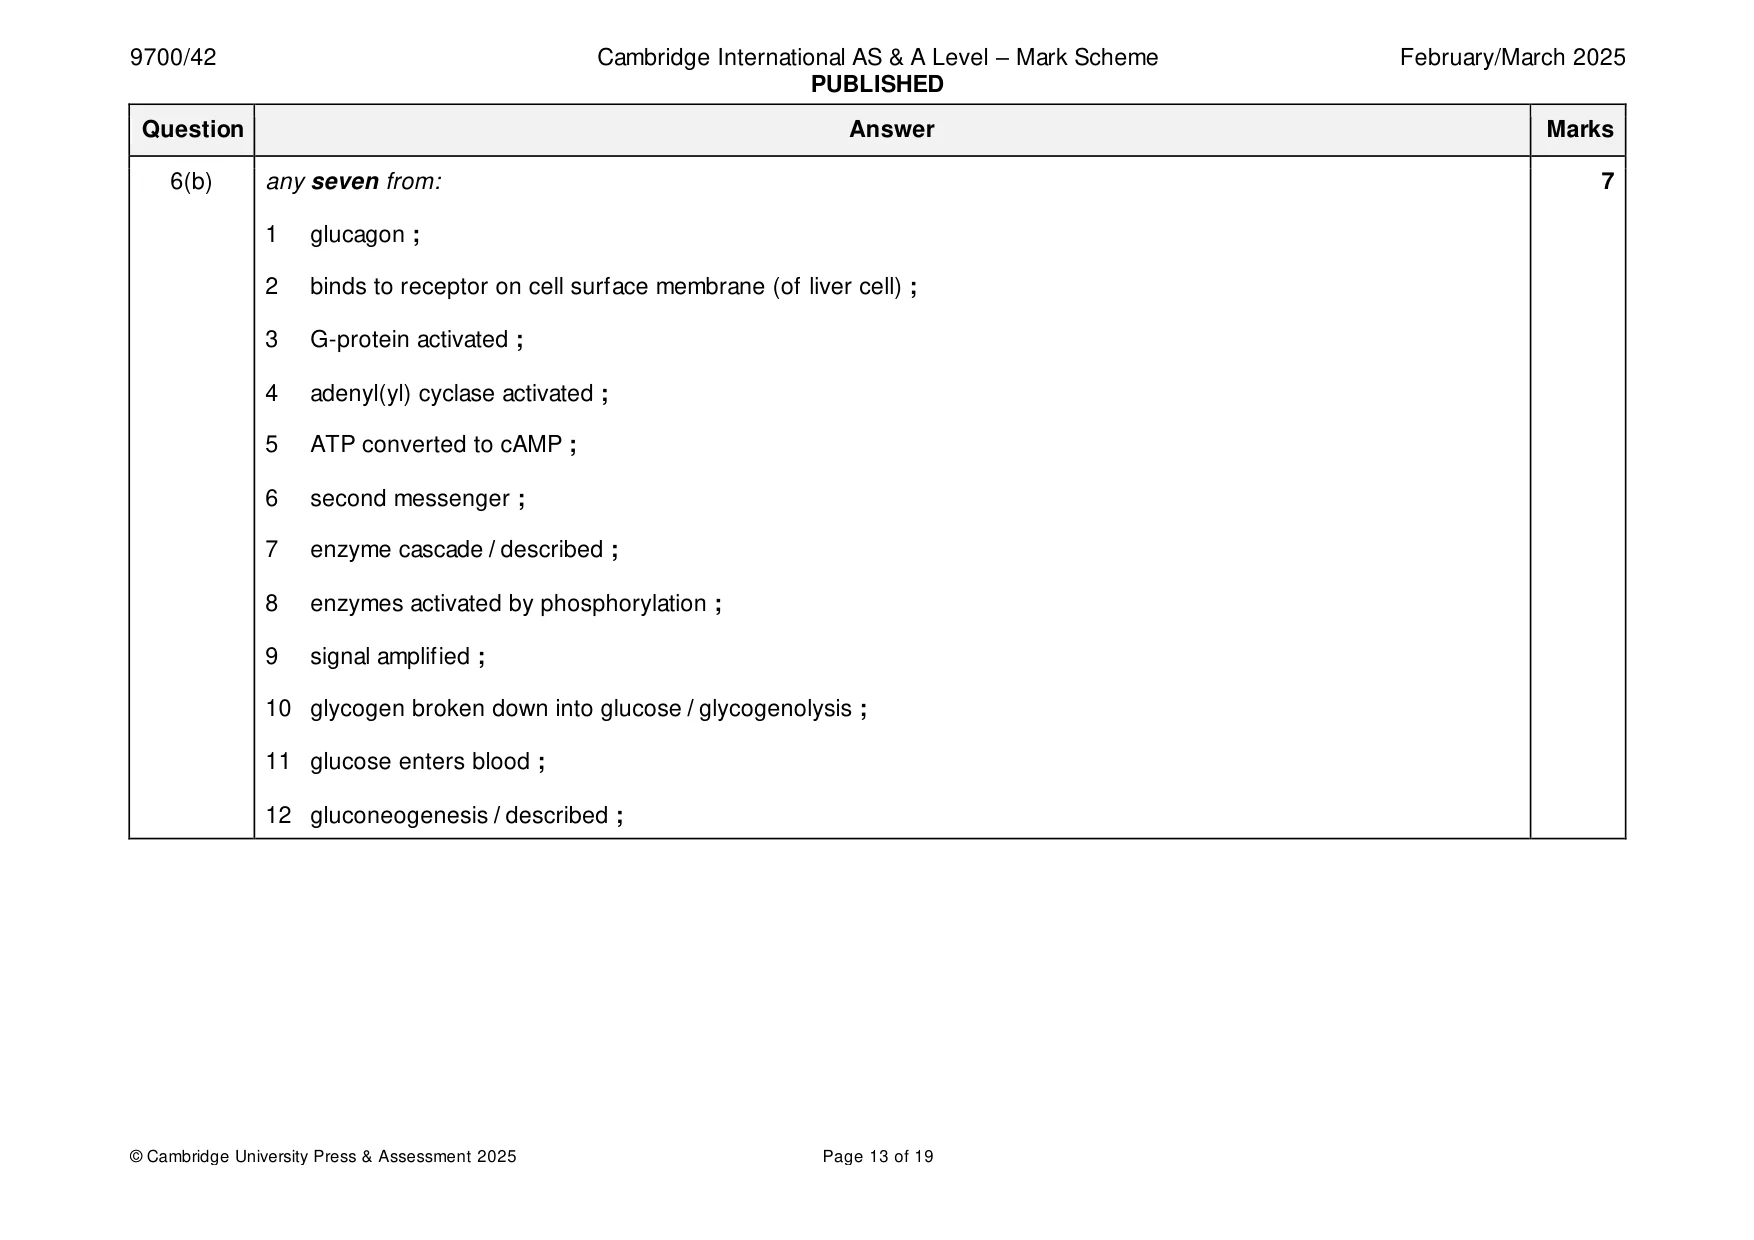
Mark scheme: 6(a)(i) P – insulin ; 3 Q – muscle / liver ; R – glycogen ; 6(a)(ii) negative feedback ; 1 6(b) any seven from: 7 1 glucagon ; 2 binds to receptor on cell surface membrane (of liver cell) ; 3 G-protein activated ; 4 adenyl(yl) cyclase activated ; 5 ATP converted to cAMP ; 6 second messenger ; 7 enzyme cascade / described ; 8 enzymes activated by phosphorylation ; 9 signal amplified ; 10 glycogen broken down into glucose / glycogenolysis ; 11 glucose enters blood ; 12 gluconeogenesis / described ;
Q7 · The Sumatran tiger, Panthera tigris sumatrae, is classified as critically endangered on…
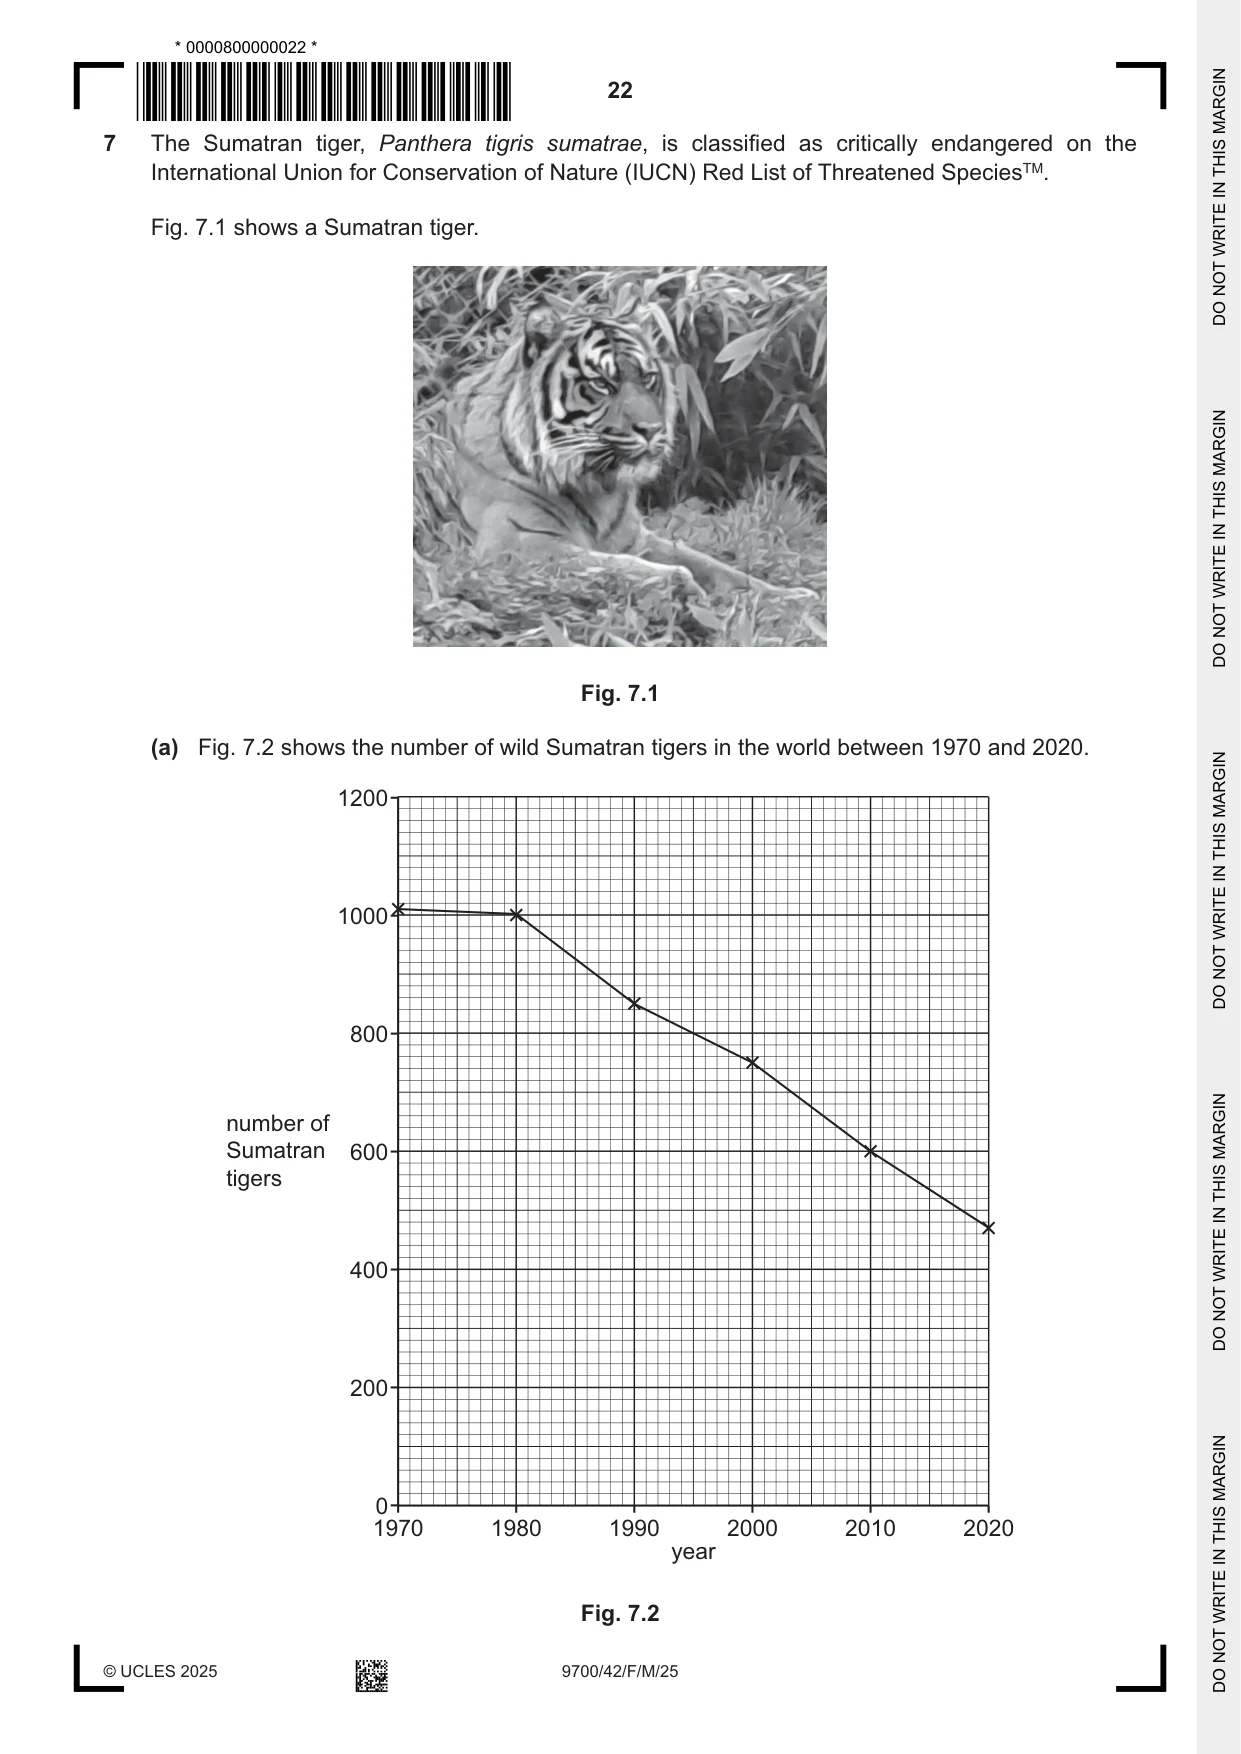
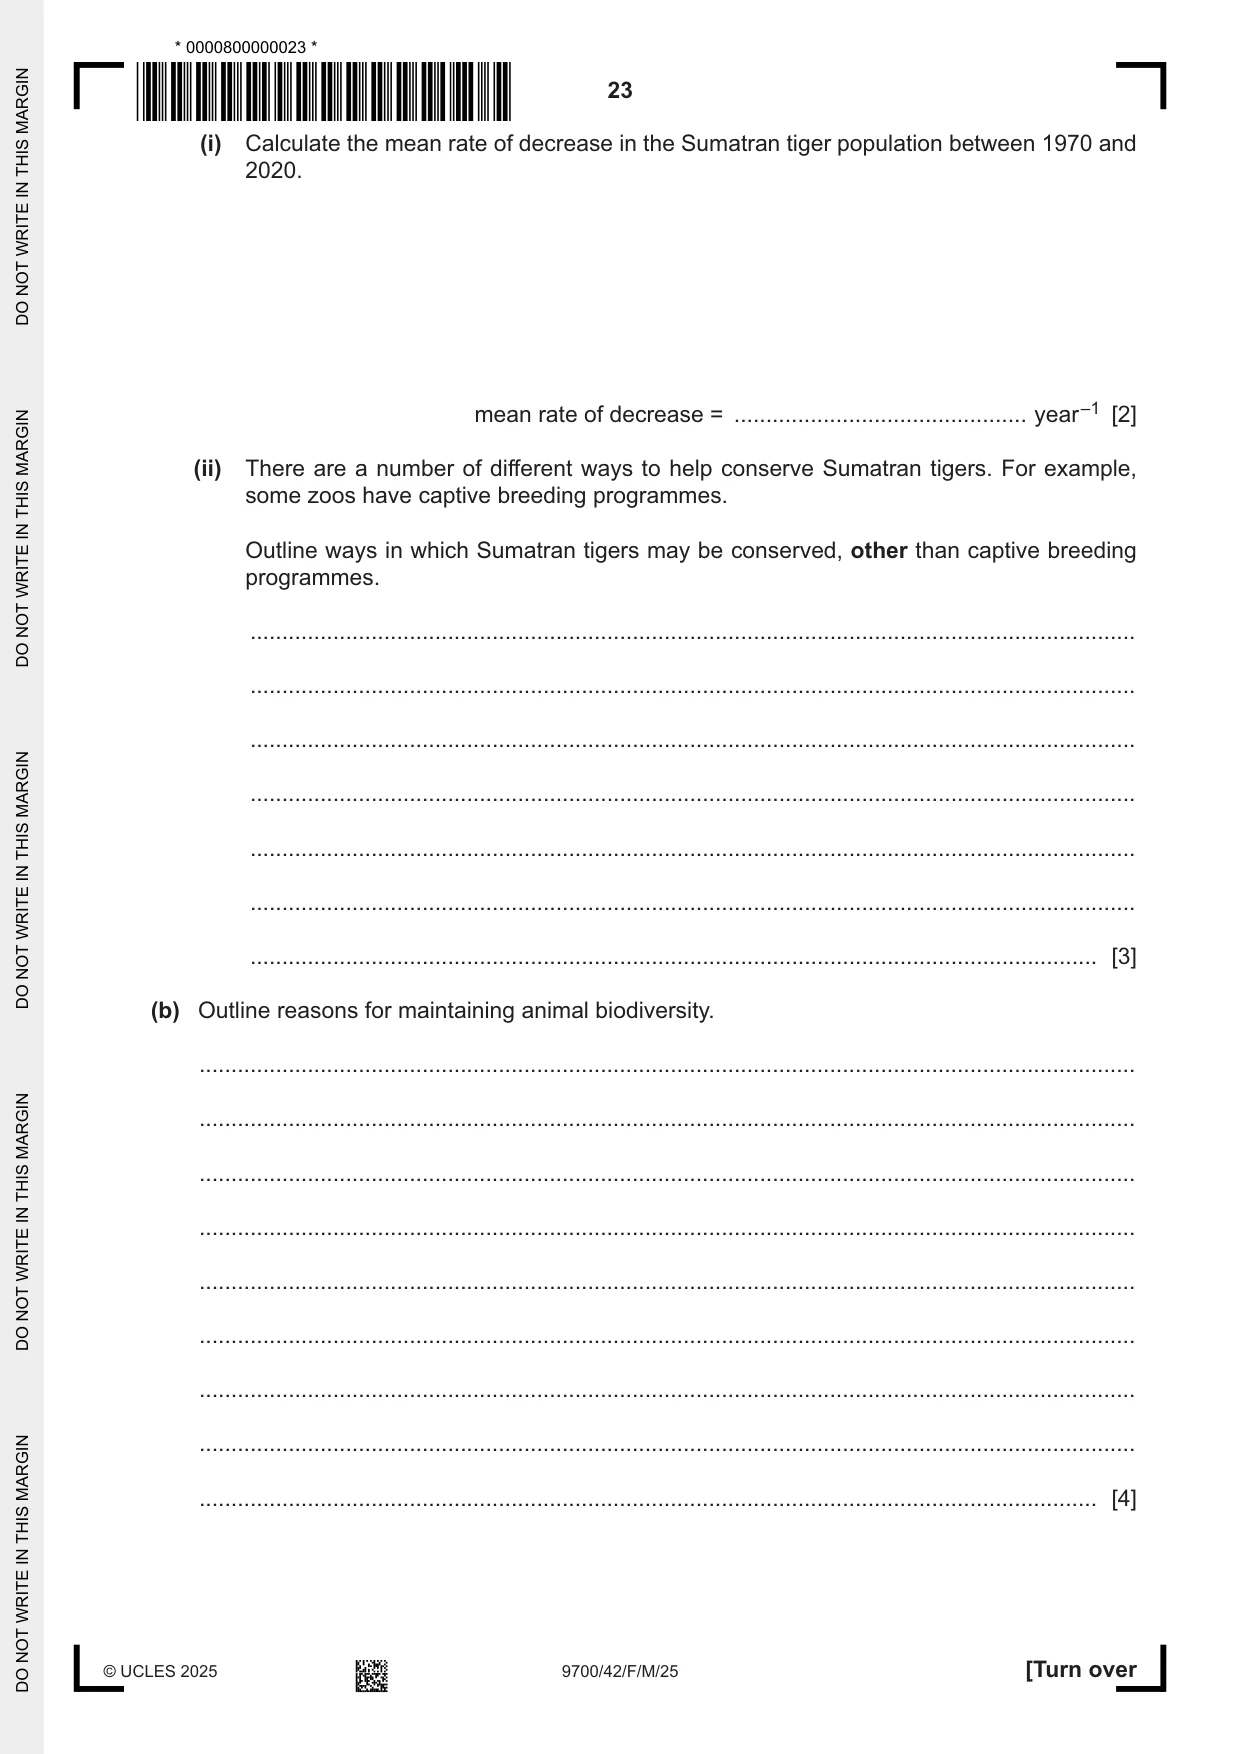
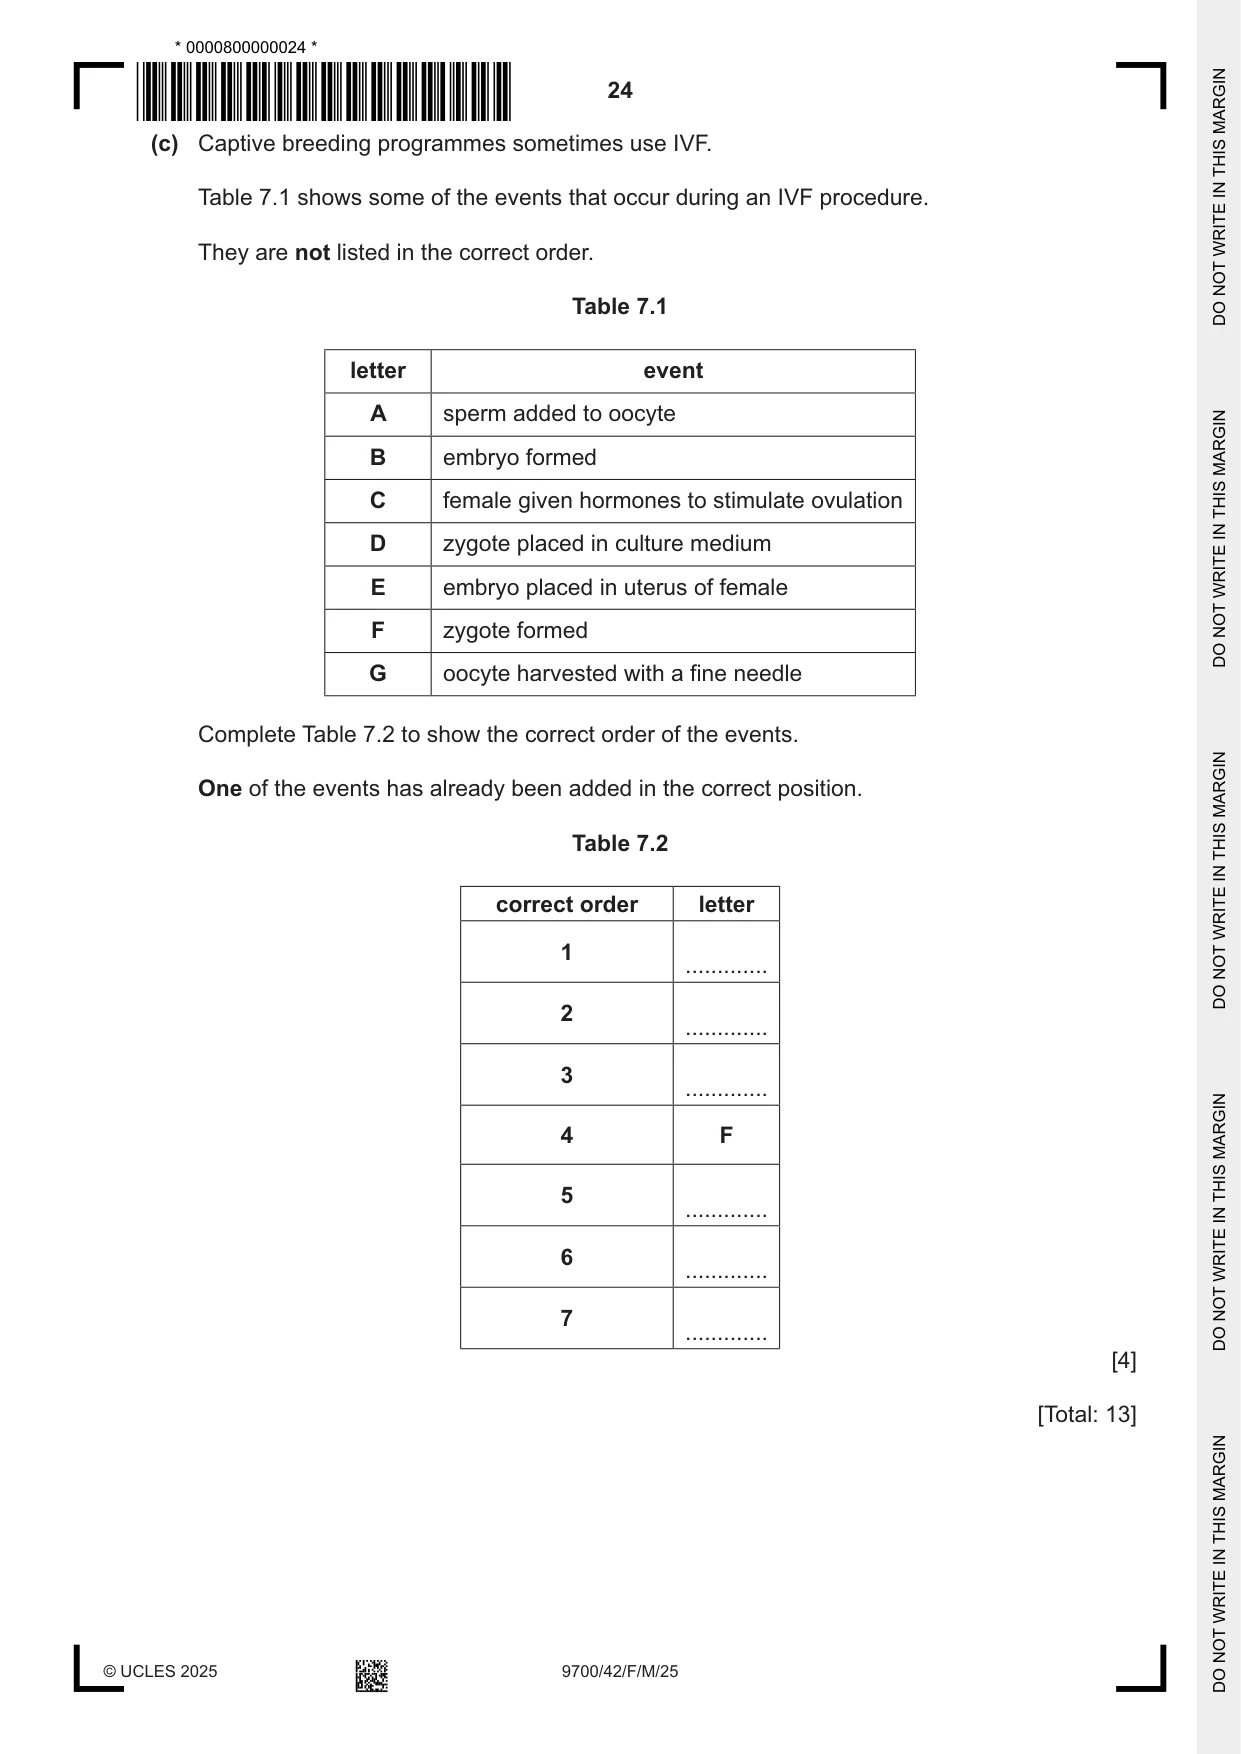
7 The Sumatran tiger, Panthera tigris sumatrae, is classified as critically endangered on the International Union for Conservation of Nature (IUCN) Red List of Threatened SpeciesTM. Fig. 7.1 shows a Sumatran tiger. Fig. 7.1 (a) Fig. 7.2 shows the number of wild Sumatran tigers in the world between 1970 and 2020. 1200 1000 800 number of Sumatran 600 tigers 400 200 0 1970 1980 1990 2000 2010 2020 year Fig. 7.2 (i) Calculate the mean rate of decrease in the Sumatran tiger population between 1970 and 2020. mean rate of decrease = .............................................. year –1 [2] (ii) There are a number of different ways to help conserve Sumatran tigers. For example, some zoos have captive breeding programmes. Outline ways in which Sumatran tigers may be conserved, other than captive breeding programmes. ........................................................................................................................................... ........................................................................................................................................... ........................................................................................................................................... ........................................................................................................................................... ........................................................................................................................................... ........................................................................................................................................... ..................................................................................................................................... [3] (b) Outline reasons for maintaining animal biodiversity. ................................................................................................................................................... ................................................................................................................................................... ................................................................................................................................................... ................................................................................................................................................... ................................................................................................................................................... ................................................................................................................................................... ................................................................................................................................................... ................................................................................................................................................... ............................................................................................................................................. [4] (c) Captive breeding programmes sometimes use IVF. Table 7.1 shows some of the events that occur during an IVF procedure. They are not listed in the correct order. Table 7.1 letter event A sperm added to oocyte B embryo formed C female given hormones to stimulate ovulation D zygote placed in culture medium E embryo placed in uterus of female F zygote formed G oocyte harvested with a fine needle Complete Table 7.2 to show the correct order of the events. One of the events has already been added in the correct position. Table 7.2 correct order letter 1 ............. 2 ............. 3 ............. 4 F 5 ............. 6 ............. 7 ............. [4] [Total: 13] Question 8 starts on page 26.
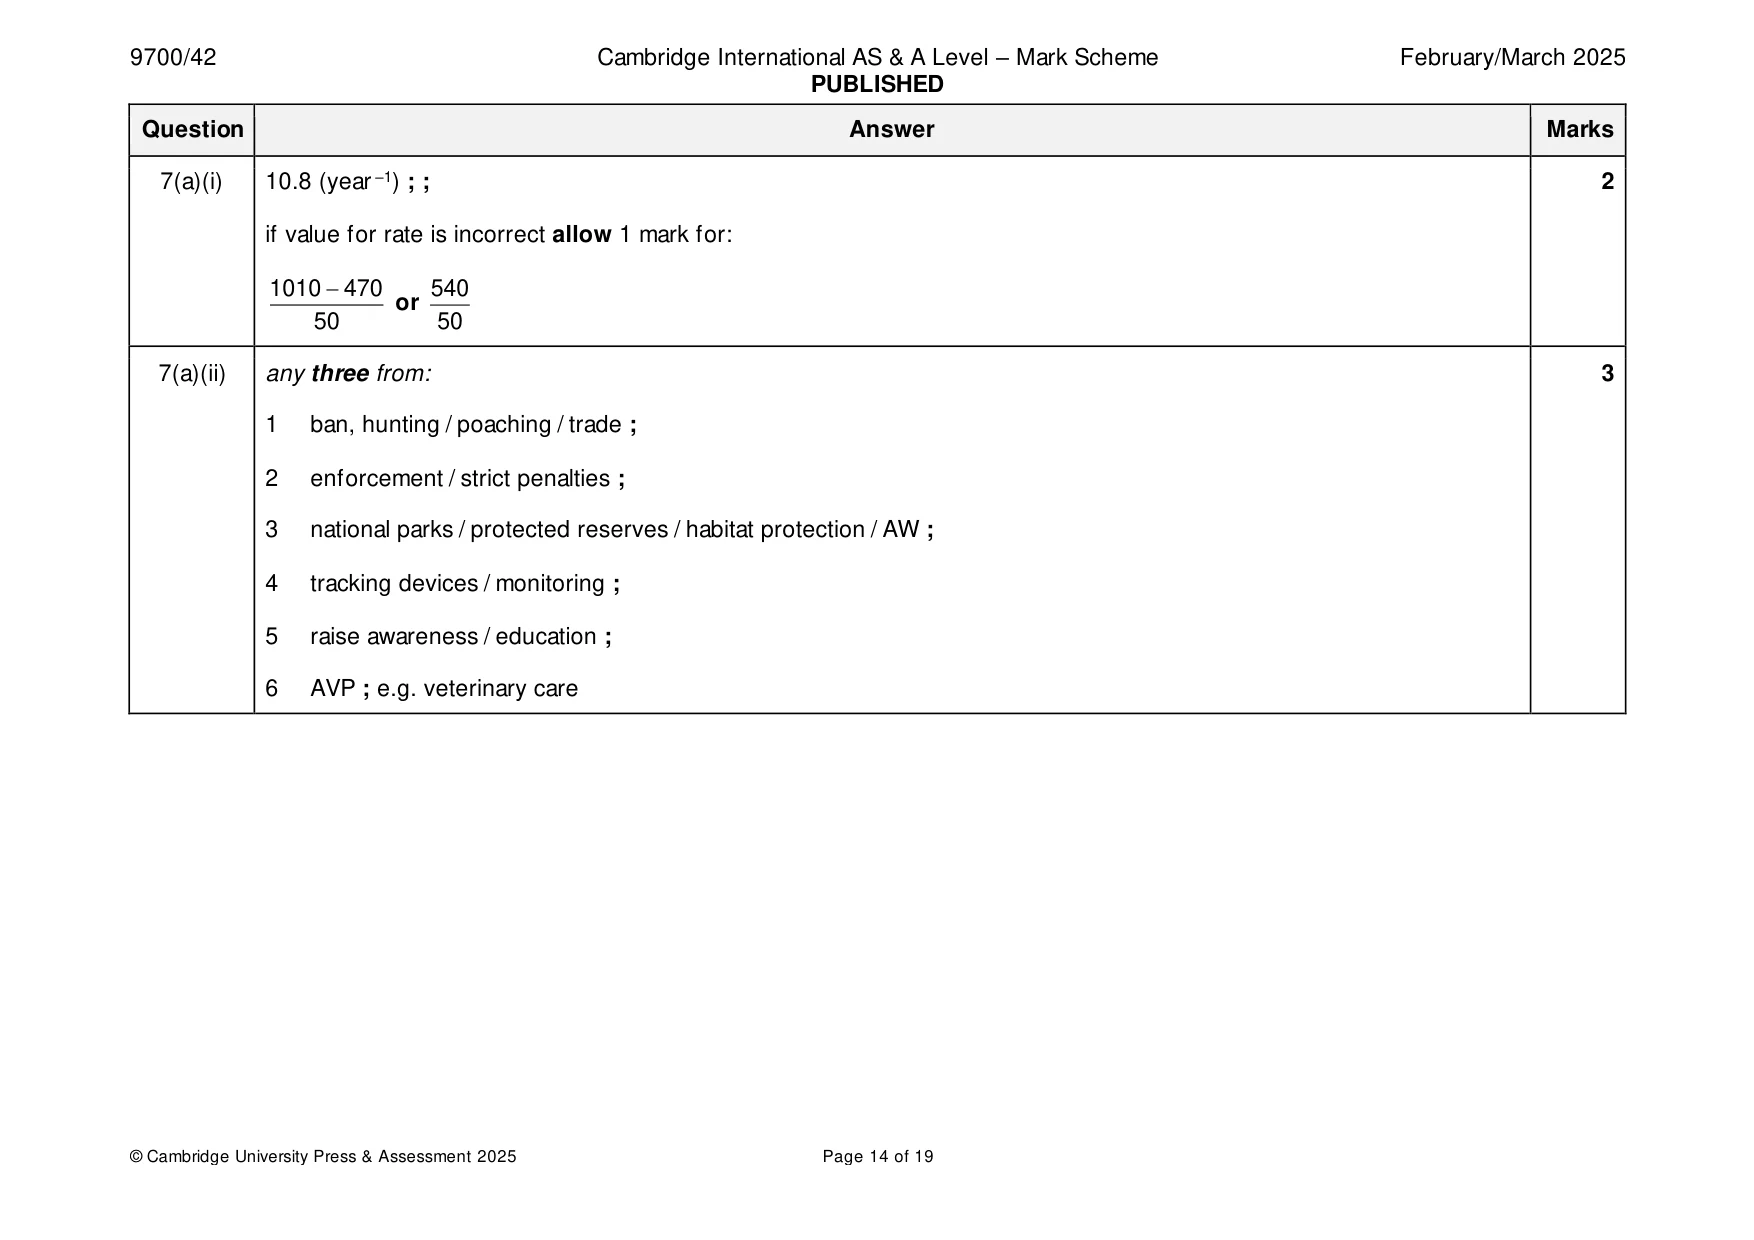
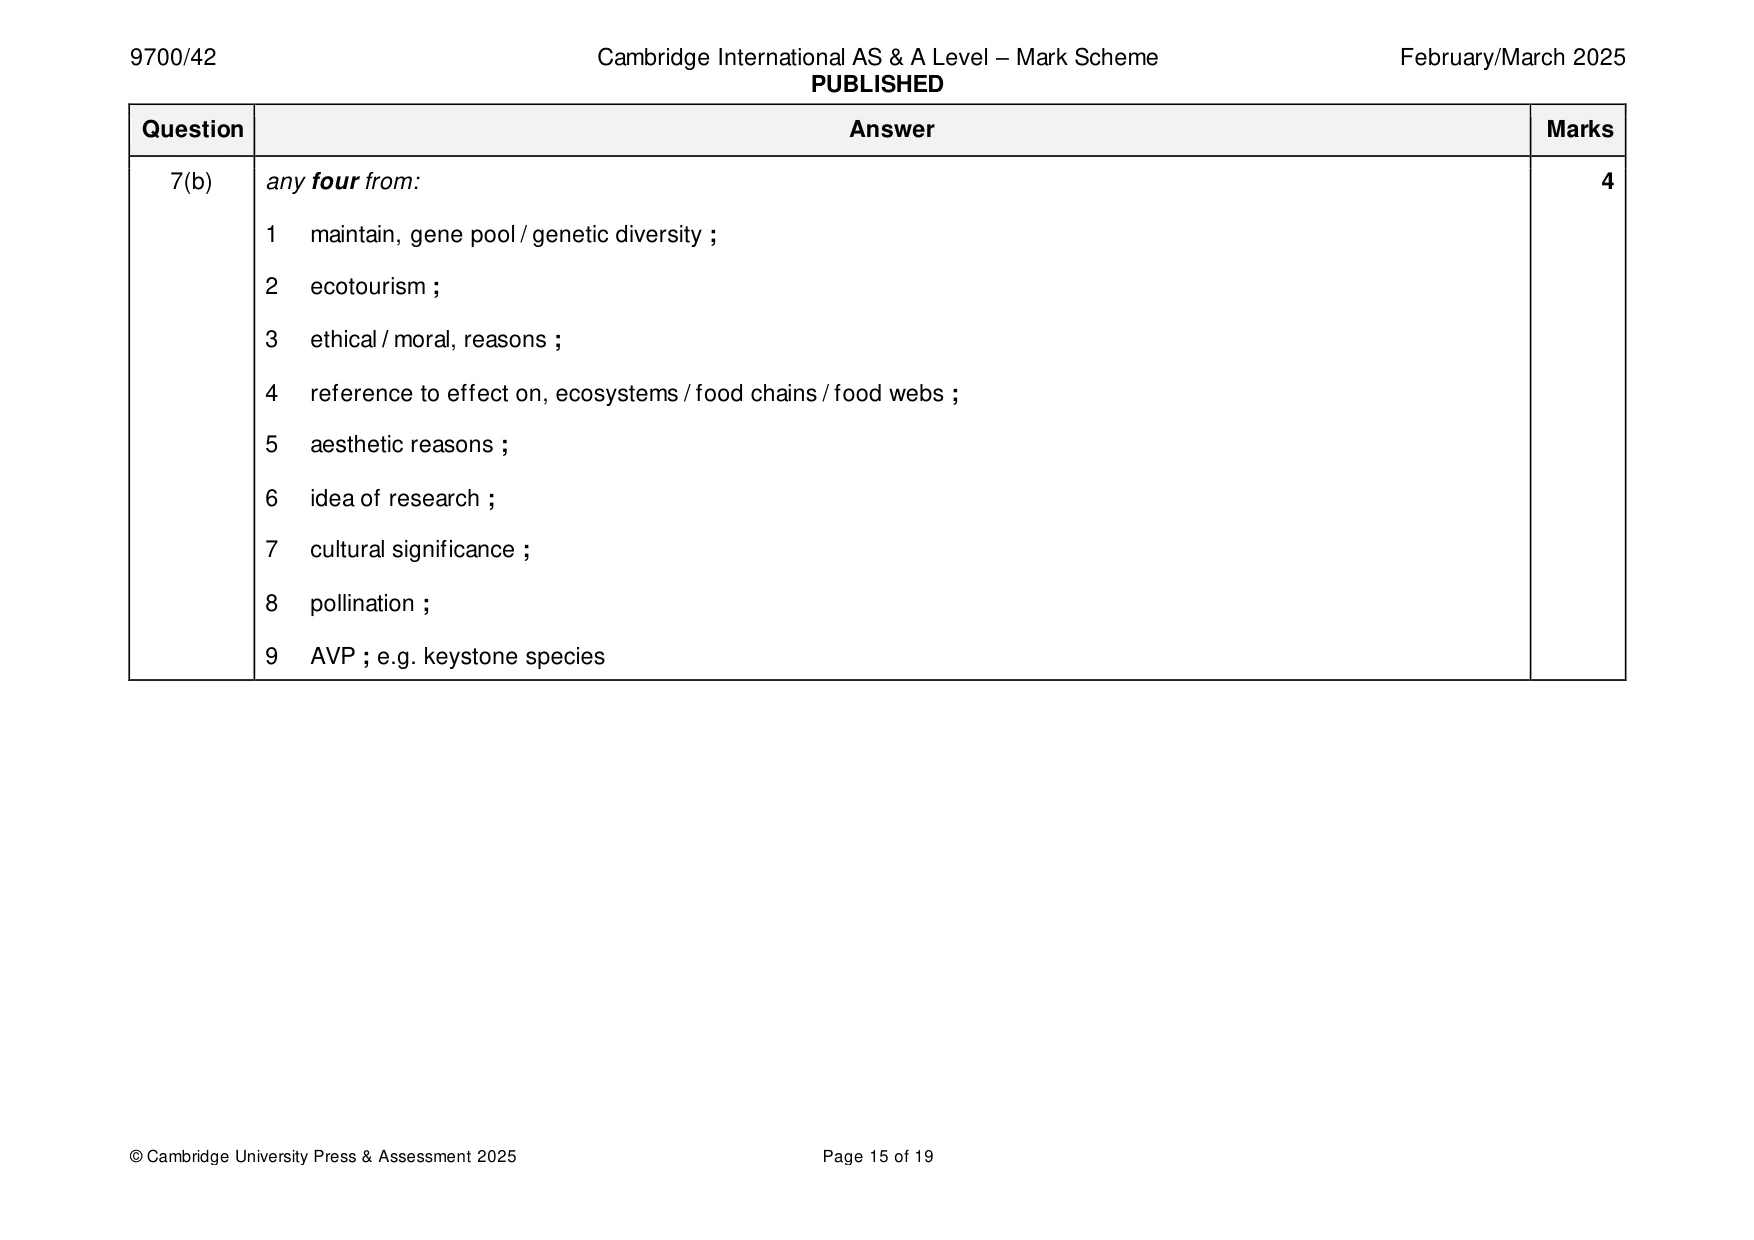
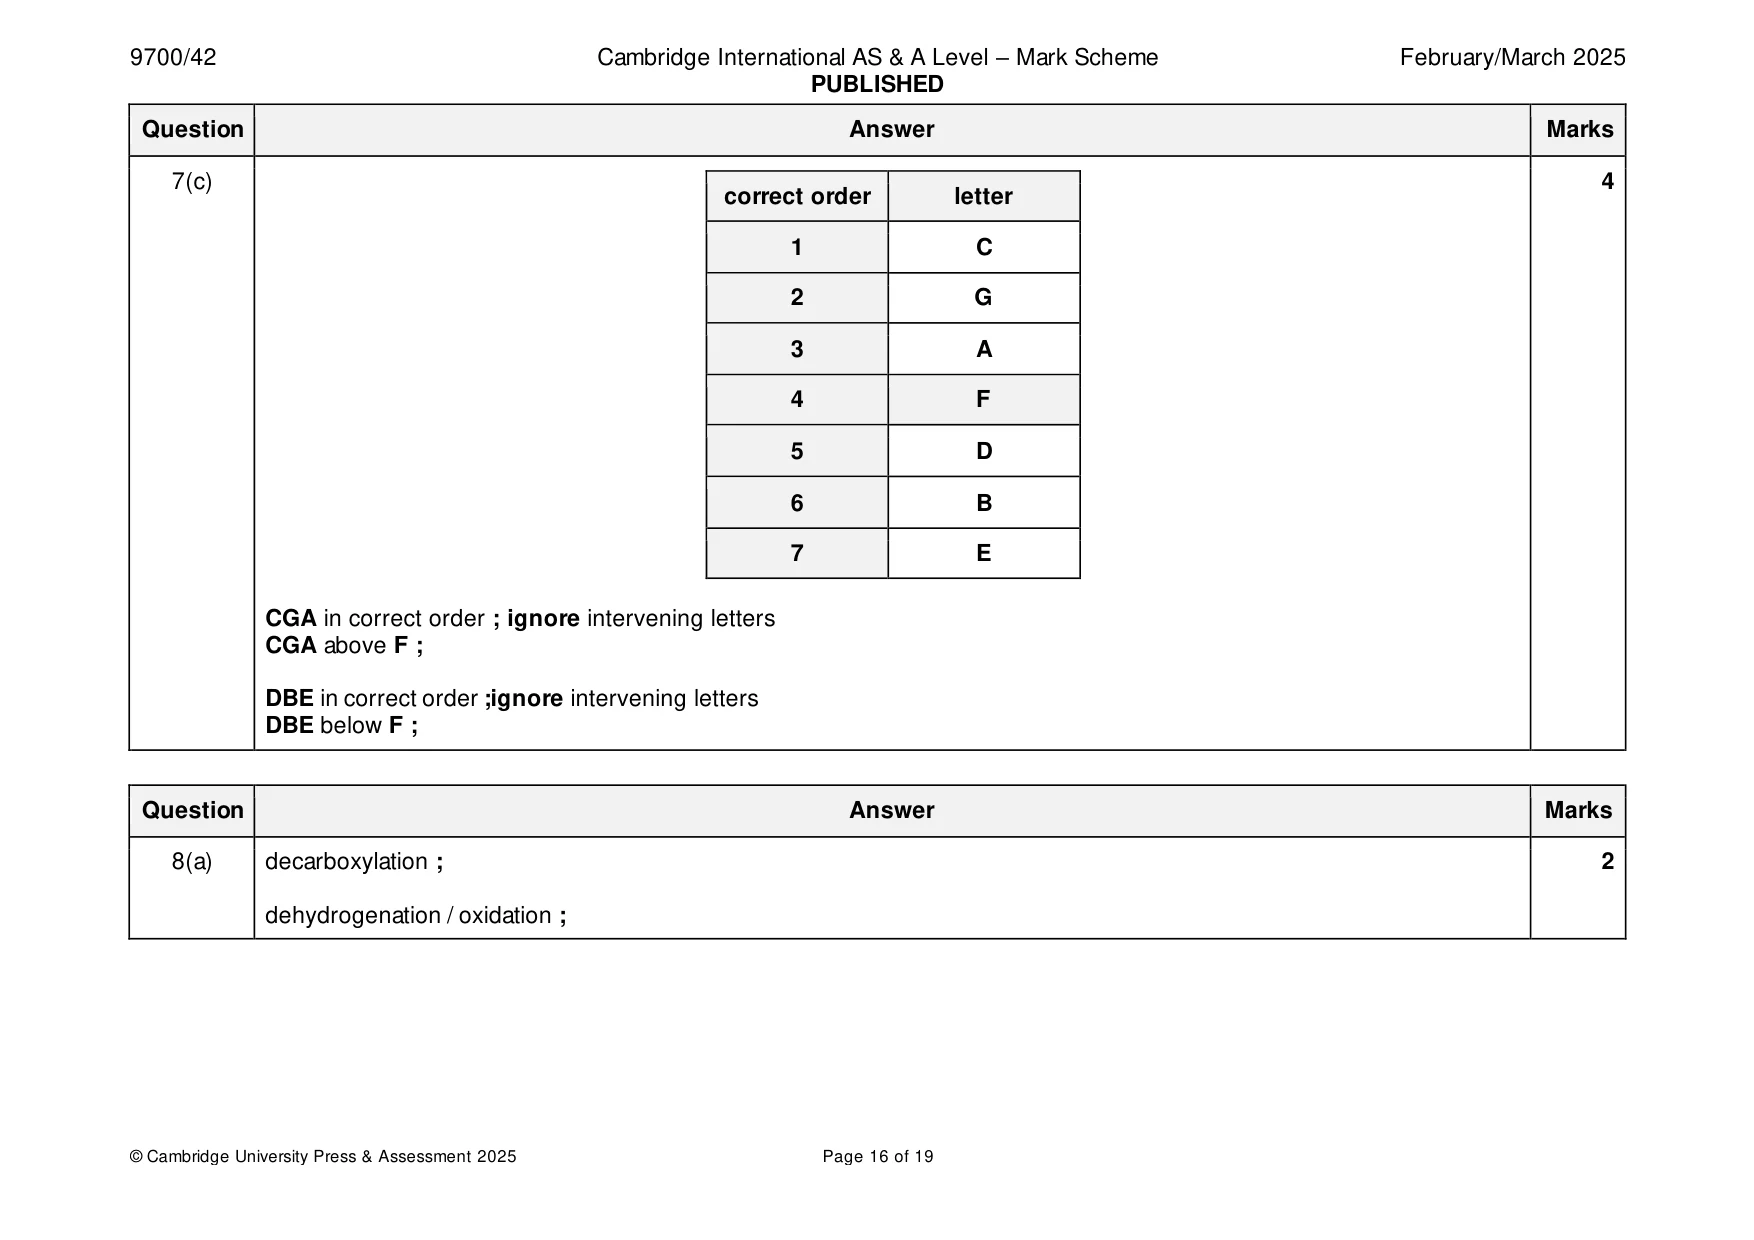
Mark scheme: 7(a)(i) 10.8 (year –1) ; ; 2 if value for rate is incorrect allow 1 mark for: 1010 − 470 540 or 50 50 7(a)(ii) any three from: 3 1 ban, hunting / poaching / trade ; 2 enforcement / strict penalties ; 3 national parks / protected reserves / habitat protection / AW ; 4 tracking devices / monitoring ; 5 raise awareness / education ; 6 AVP ; e.g. veterinary care 7(b) any four from: 4 1 maintain, gene pool / genetic diversity ; 2 ecotourism ; 3 ethical / moral, reasons ; 4 reference to effect on, ecosystems / food chains / food webs ; 5 aesthetic reasons ; 6 idea of research ; 7 cultural significance ; 8 pollination ; 9 AVP ; e.g. keystone species 7(c) 4 correct order letter 1 C 2 G 3 A 4 F 5 D 6 B 7 E CGA in correct order ; ignore intervening letters CGA above F ; DBE in correct order ;ignore intervening letters DBE below F ;
Q8 · In the link reaction, a two-carbon acetyl group is produced from pyruvate
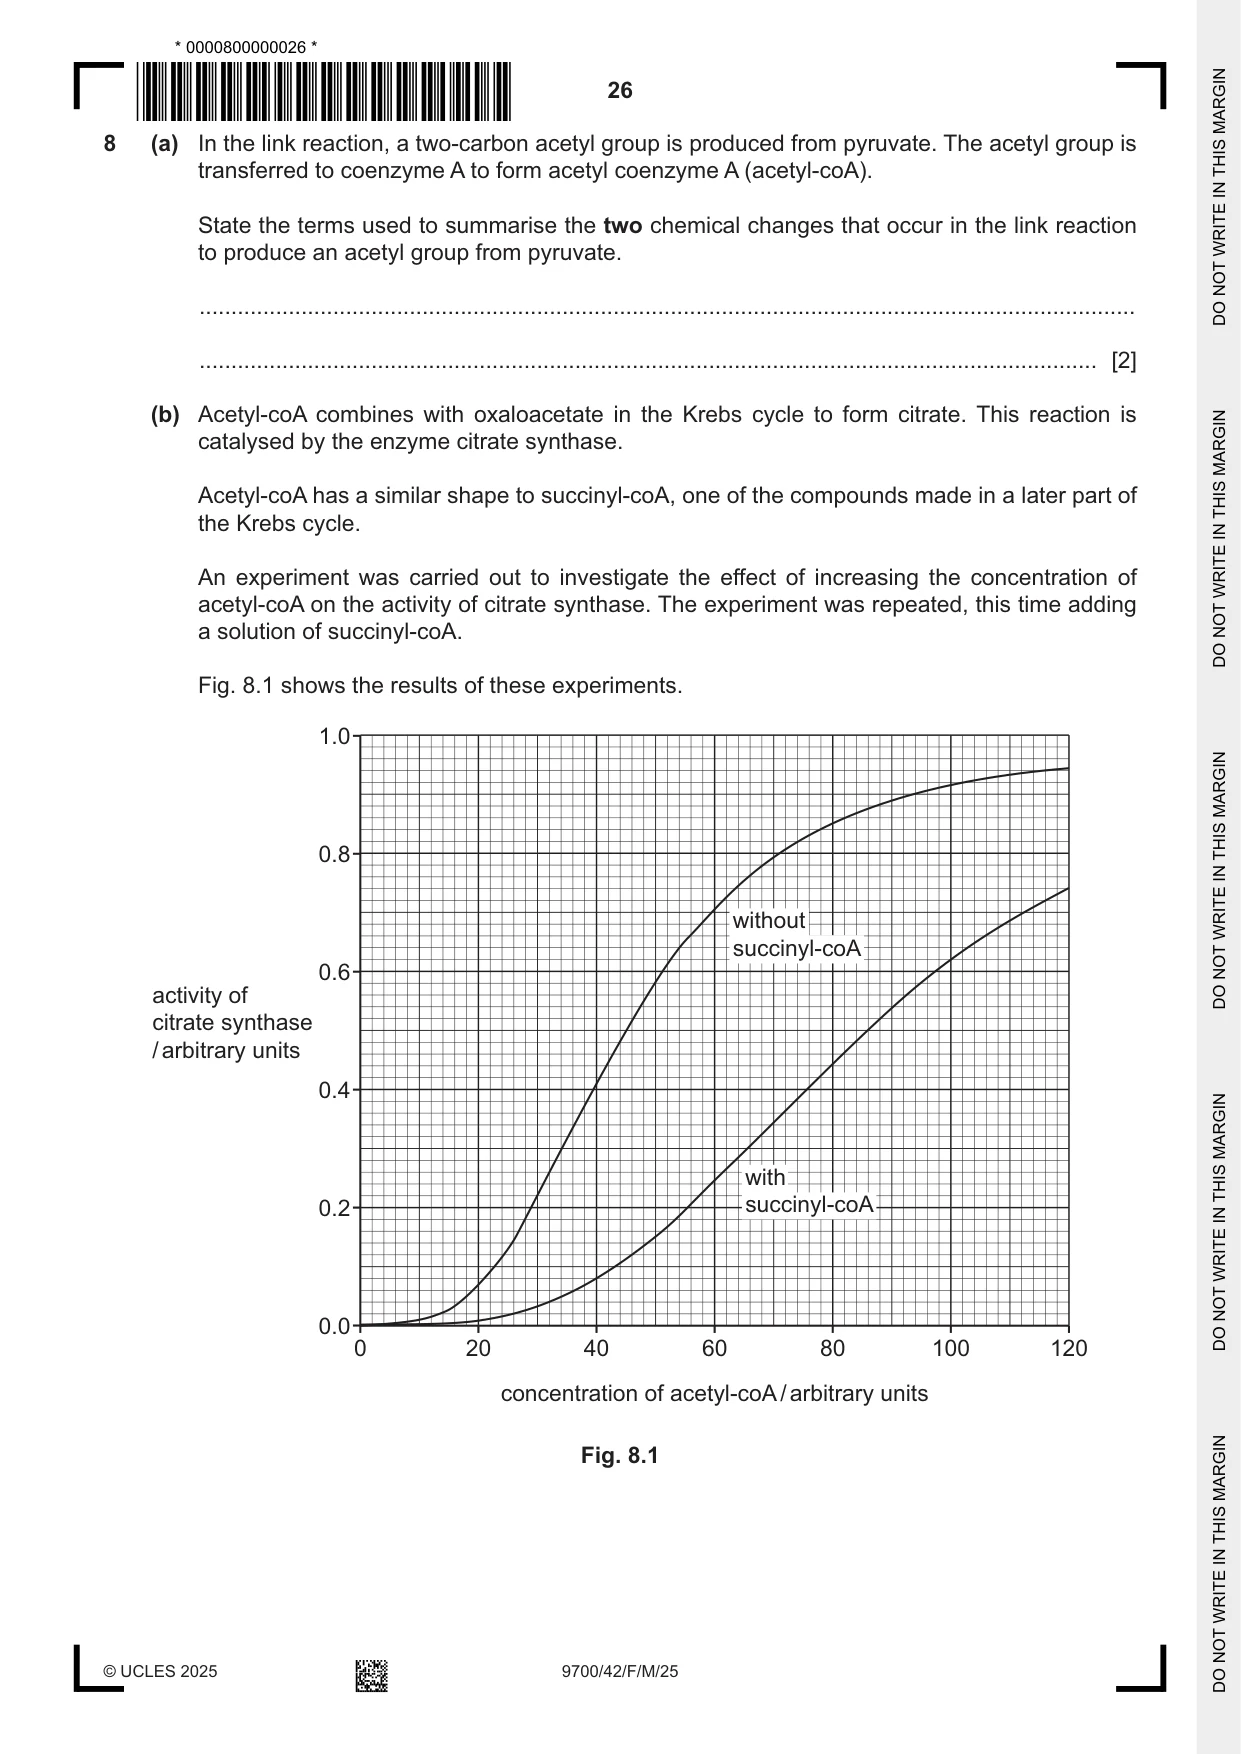
8 (a) In the link reaction, a two-carbon acetyl group is produced from pyruvate. The acetyl group is transferred to coenzyme A to form acetyl coenzyme A (acetyl-coA). State the terms used to summarise the two chemical changes that occur in the link reaction to produce an acetyl group from pyruvate. ................................................................................................................................................... ............................................................................................................................................. [2] (b) Acetyl-coA combines with oxaloacetate in the Krebs cycle to form citrate. This reaction is catalysed by the enzyme citrate synthase. Acetyl-coA has a similar shape to succinyl-coA, one of the compounds made in a later part of the Krebs cycle. An experiment was carried out to investigate the effect of increasing the concentration of acetyl-coA on the activity of citrate synthase. The experiment was repeated, this time adding a solution of succinyl-coA. Fig. 8.1 shows the results of these experiments. 1.0 0.8 without succinyl-coA 0.6 activity of citrate synthase / arbitrary units 0.4 with 0.2 succinyl-coA 0.0 0 20 40 60 80 100 120 concentration of acetyl-coA / arbitrary units Fig. 8.1 With reference to Fig. 8.1, explain how succinyl-coA could help to regulate the Krebs cycle. ................................................................................................................................................... ................................................................................................................................................... ................................................................................................................................................... ................................................................................................................................................... ................................................................................................................................................... ................................................................................................................................................... ................................................................................................................................................... ................................................................................................................................................... ............................................................................................................................................. [4] (c) The coenzyme NAD plays an important role in respiration. Describe the role of NAD in the stages of aerobic respiration that occur in a mitochondrion. ................................................................................................................................................... ................................................................................................................................................... ................................................................................................................................................... ................................................................................................................................................... ................................................................................................................................................... ................................................................................................................................................... ................................................................................................................................................... ................................................................................................................................................... ............................................................................................................................................. [4] [Total: 10]
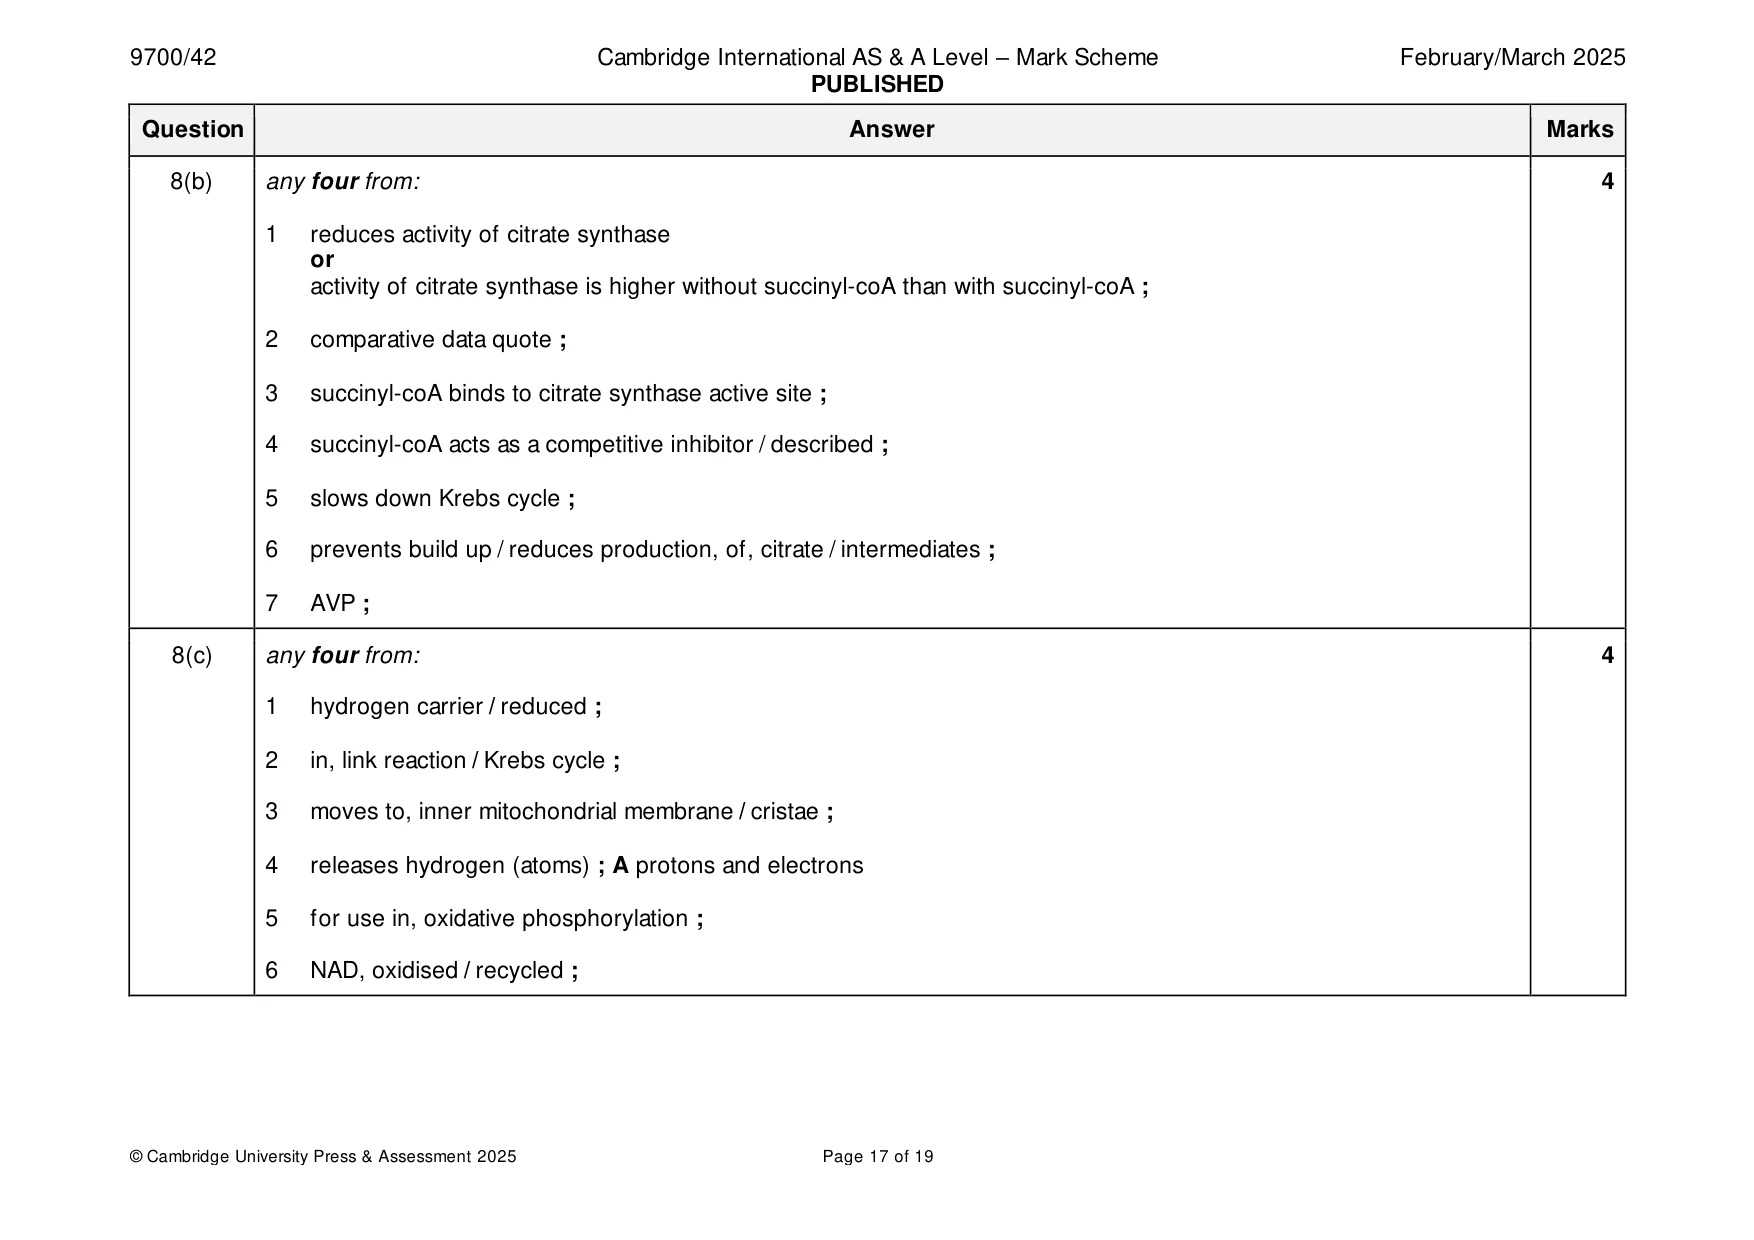
Mark scheme: 8(a) decarboxylation ; 2 dehydrogenation / oxidation ; 8(b) any four from: 4 1 reduces activity of citrate synthase or activity of citrate synthase is higher without succinyl-coA than with succinyl-coA ; 2 comparative data quote ; 3 succinyl-coA binds to citrate synthase active site ; 4 succinyl-coA acts as a competitive inhibitor / described ; 5 slows down Krebs cycle ; 6 prevents build up / reduces production, of, citrate / intermediates ; 7 AVP ; 8(c) any four from: 4 1 hydrogen carrier / reduced ; 2 in, link reaction / Krebs cycle ; 3 moves to, inner mitochondrial membrane / cristae ; 4 releases hydrogen (atoms) ; A protons and electrons 5 for use in, oxidative phosphorylation ; 6 NAD, oxidised / recycled ;
Q9 · The chloroplasts of leaves of tobacco plants, Nicotiana sp., contain chlorophyll a and…
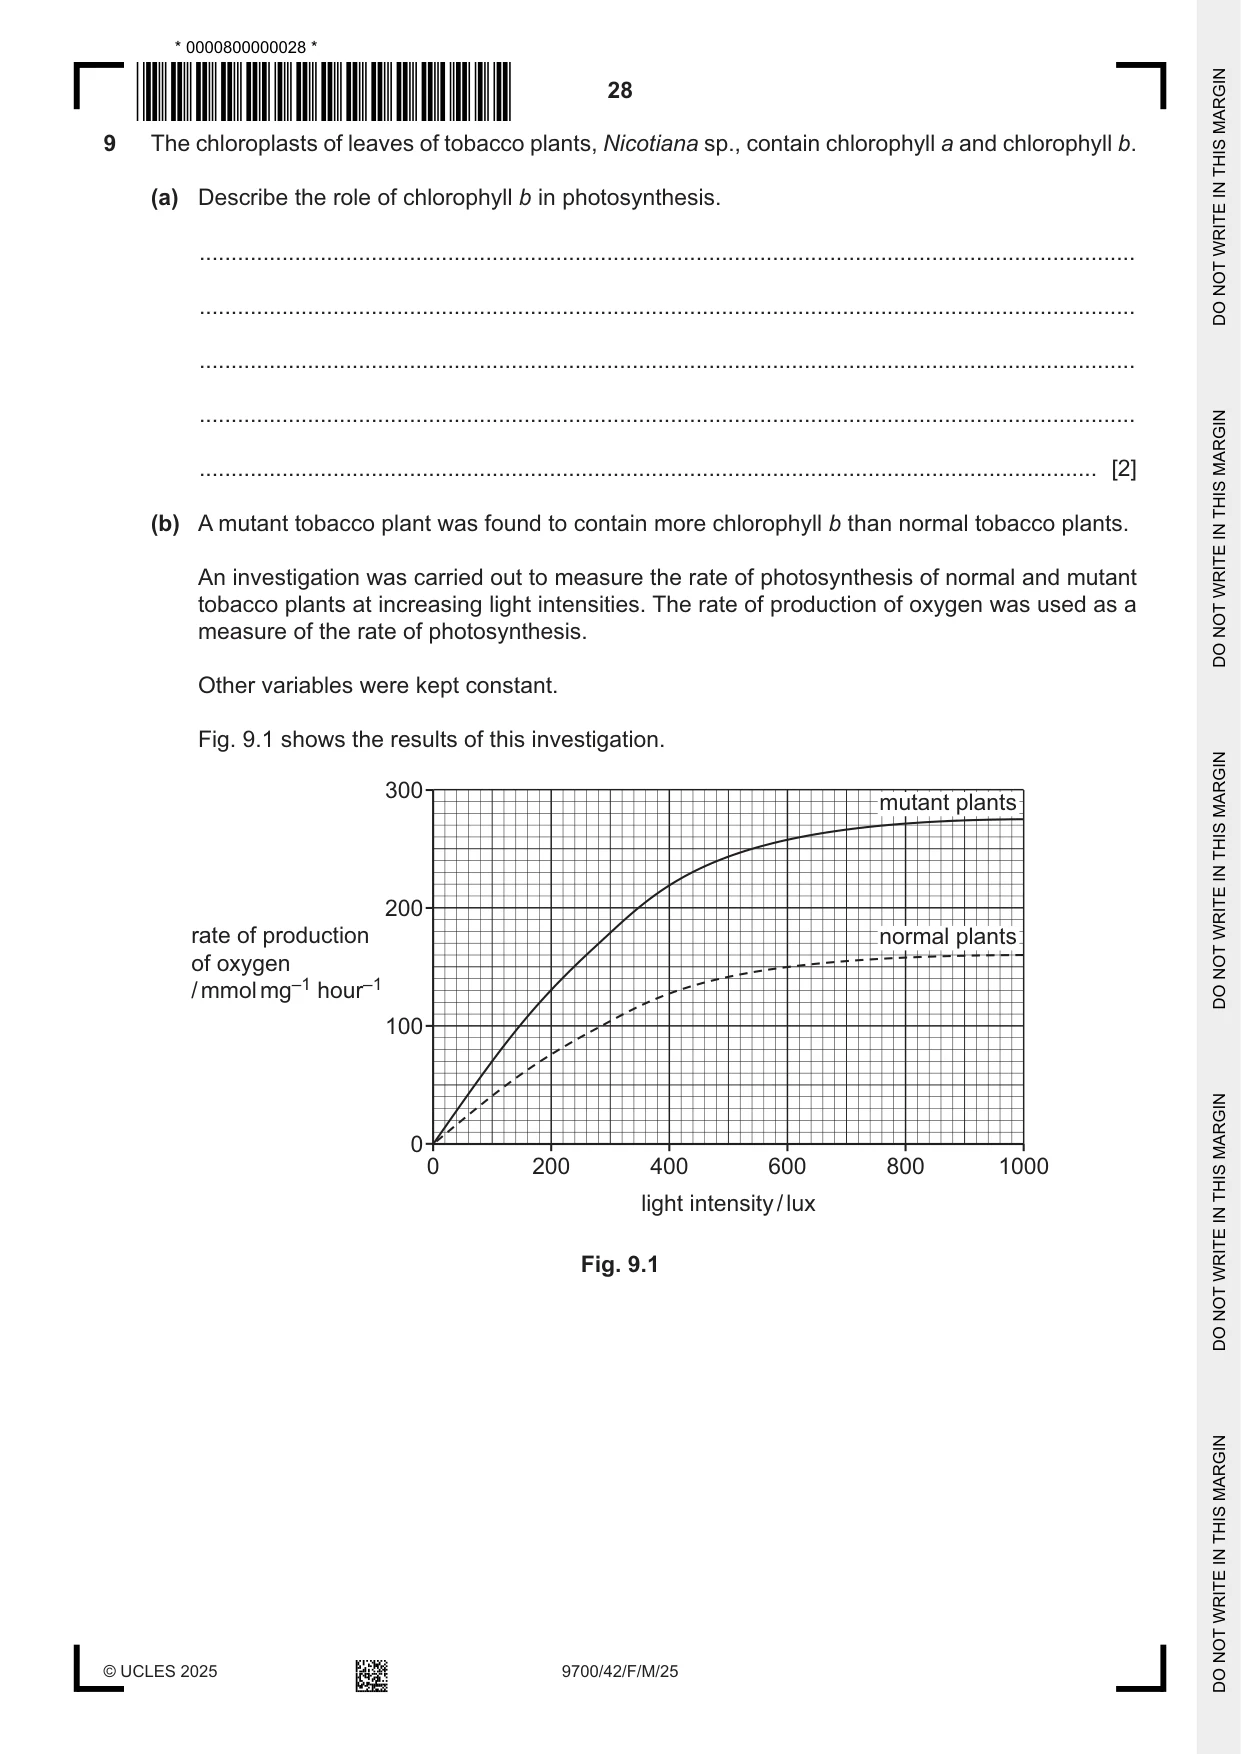
9 The chloroplasts of leaves of tobacco plants, Nicotiana sp., contain chlorophyll a and chlorophyll b. (a) Describe the role of chlorophyll b in photosynthesis. ................................................................................................................................................... ................................................................................................................................................... ................................................................................................................................................... ................................................................................................................................................... ............................................................................................................................................. [2] (b) A mutant tobacco plant was found to contain more chlorophyll b than normal tobacco plants. An investigation was carried out to measure the rate of photosynthesis of normal and mutant tobacco plants at increasing light intensities. The rate of production of oxygen was used as a measure of the rate of photosynthesis. Other variables were kept constant. Fig. 9.1 shows the results of this investigation. 300 mutant plants 200 rate of production normal plants of oxygen / mmol mg–1 hour–1 100 0 0 200 400 600 800 1000 light intensity / lux Fig. 9.1 (i) Describe the results shown in Fig. 9.1. ........................................................................................................................................... ........................................................................................................................................... ........................................................................................................................................... ........................................................................................................................................... ........................................................................................................................................... ........................................................................................................................................... ..................................................................................................................................... [3] (ii) It was observed that the mutant tobacco plants had a faster growth rate than the normal tobacco plants. Suggest explanations for this observation. ........................................................................................................................................... ........................................................................................................................................... ........................................................................................................................................... ........................................................................................................................................... ........................................................................................................................................... ........................................................................................................................................... ........................................................................................................................................... ........................................................................................................................................... ..................................................................................................................................... [4] [Total: 9]
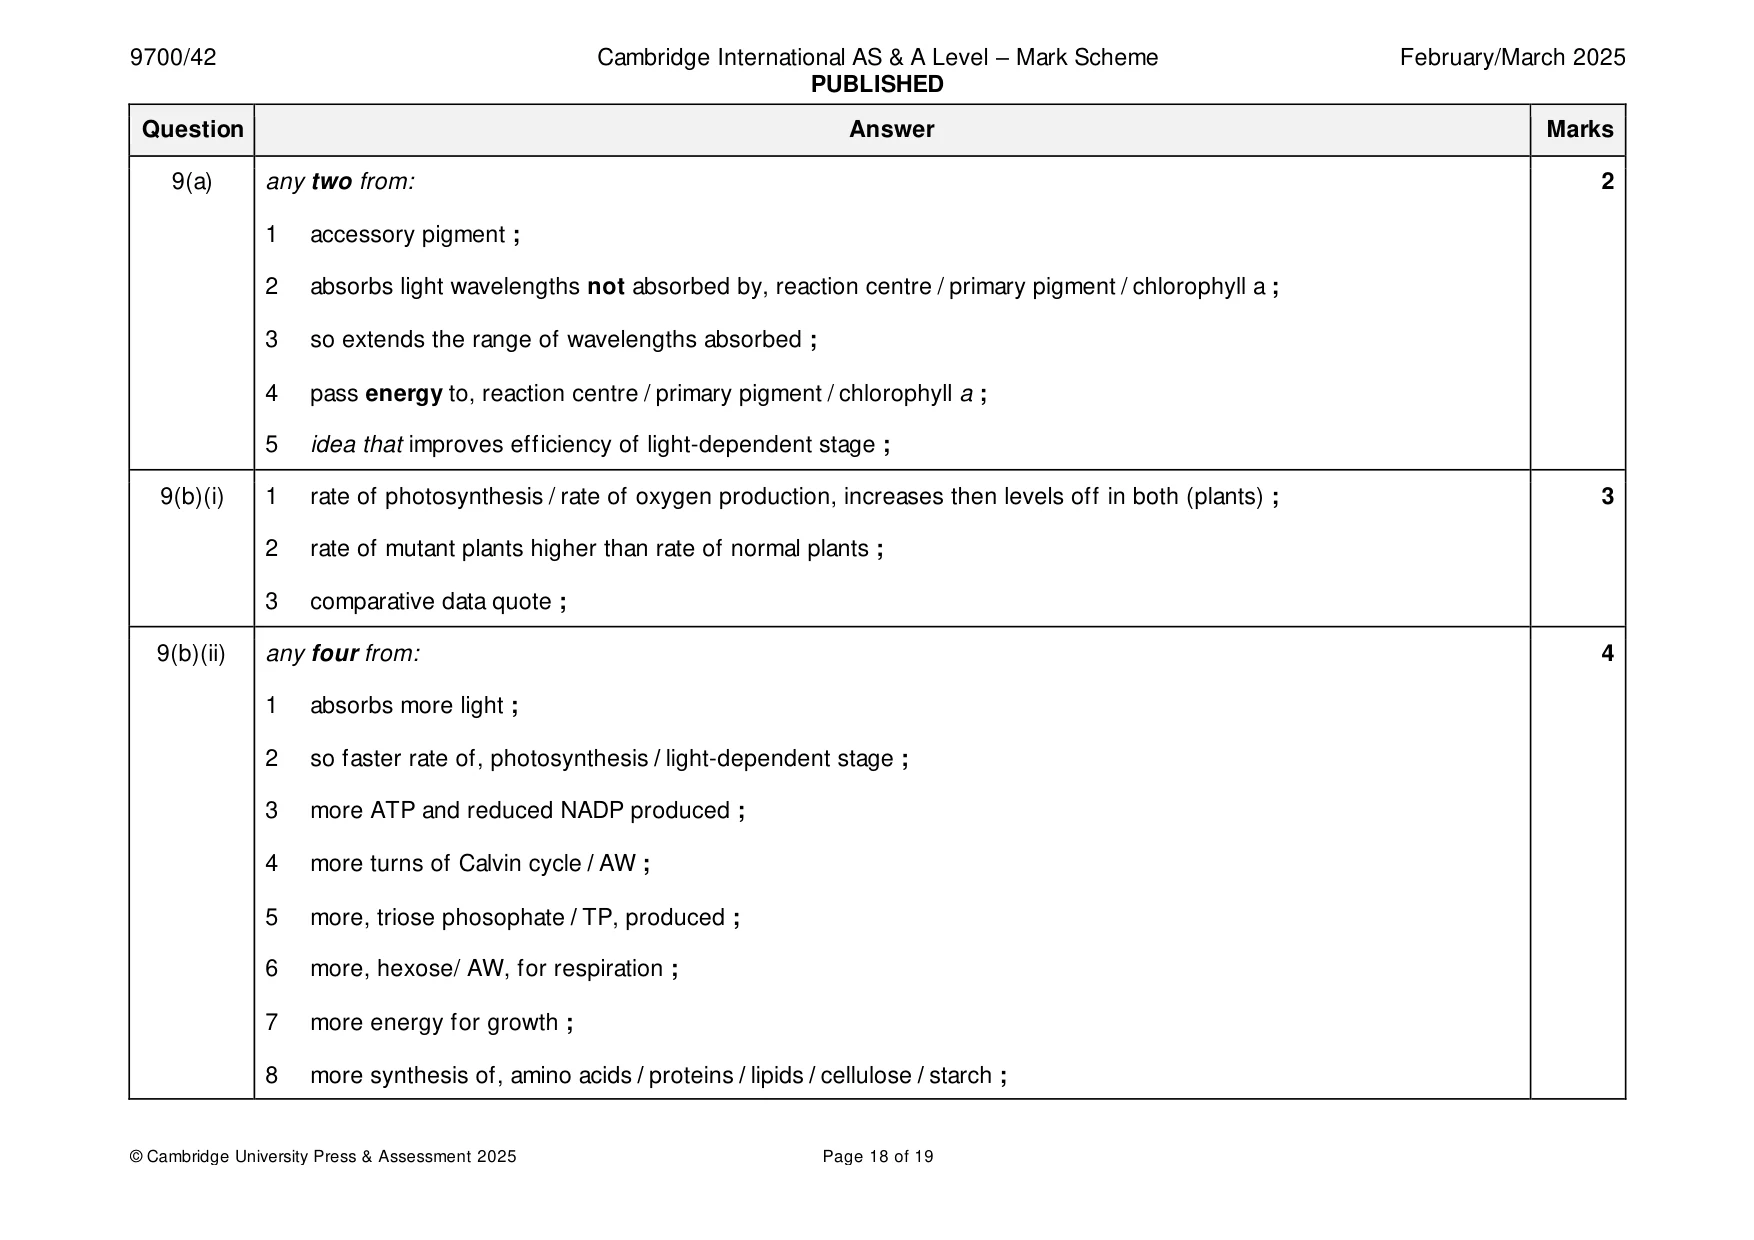
Mark scheme: 9(a) any two from: 2 1 accessory pigment ; 2 absorbs light wavelengths not absorbed by, reaction centre / primary pigment / chlorophyll a ; 3 so extends the range of wavelengths absorbed ; 4 pass energy to, reaction centre / primary pigment / chlorophyll a ; 5 idea that improves efficiency of light-dependent stage ; 9(b)(i) 1 rate of photosynthesis / rate of oxygen production, increases then levels off in both (plants) ; 3 2 rate of mutant plants higher than rate of normal plants ; 3 comparative data quote ; 9(b)(ii) any four from: 4 1 absorbs more light ; 2 so faster rate of, photosynthesis / light-dependent stage ; 3 more ATP and reduced NADP produced ; 4 more turns of Calvin cycle / AW ; 5 more, triose phosophate / TP, produced ; 6 more, hexose/ AW, for respiration ; 7 more energy for growth ; 8 more synthesis of, amino acids / proteins / lipids / cellulose / starch ;
Q10 · Chemoreceptor cells in a taste bud
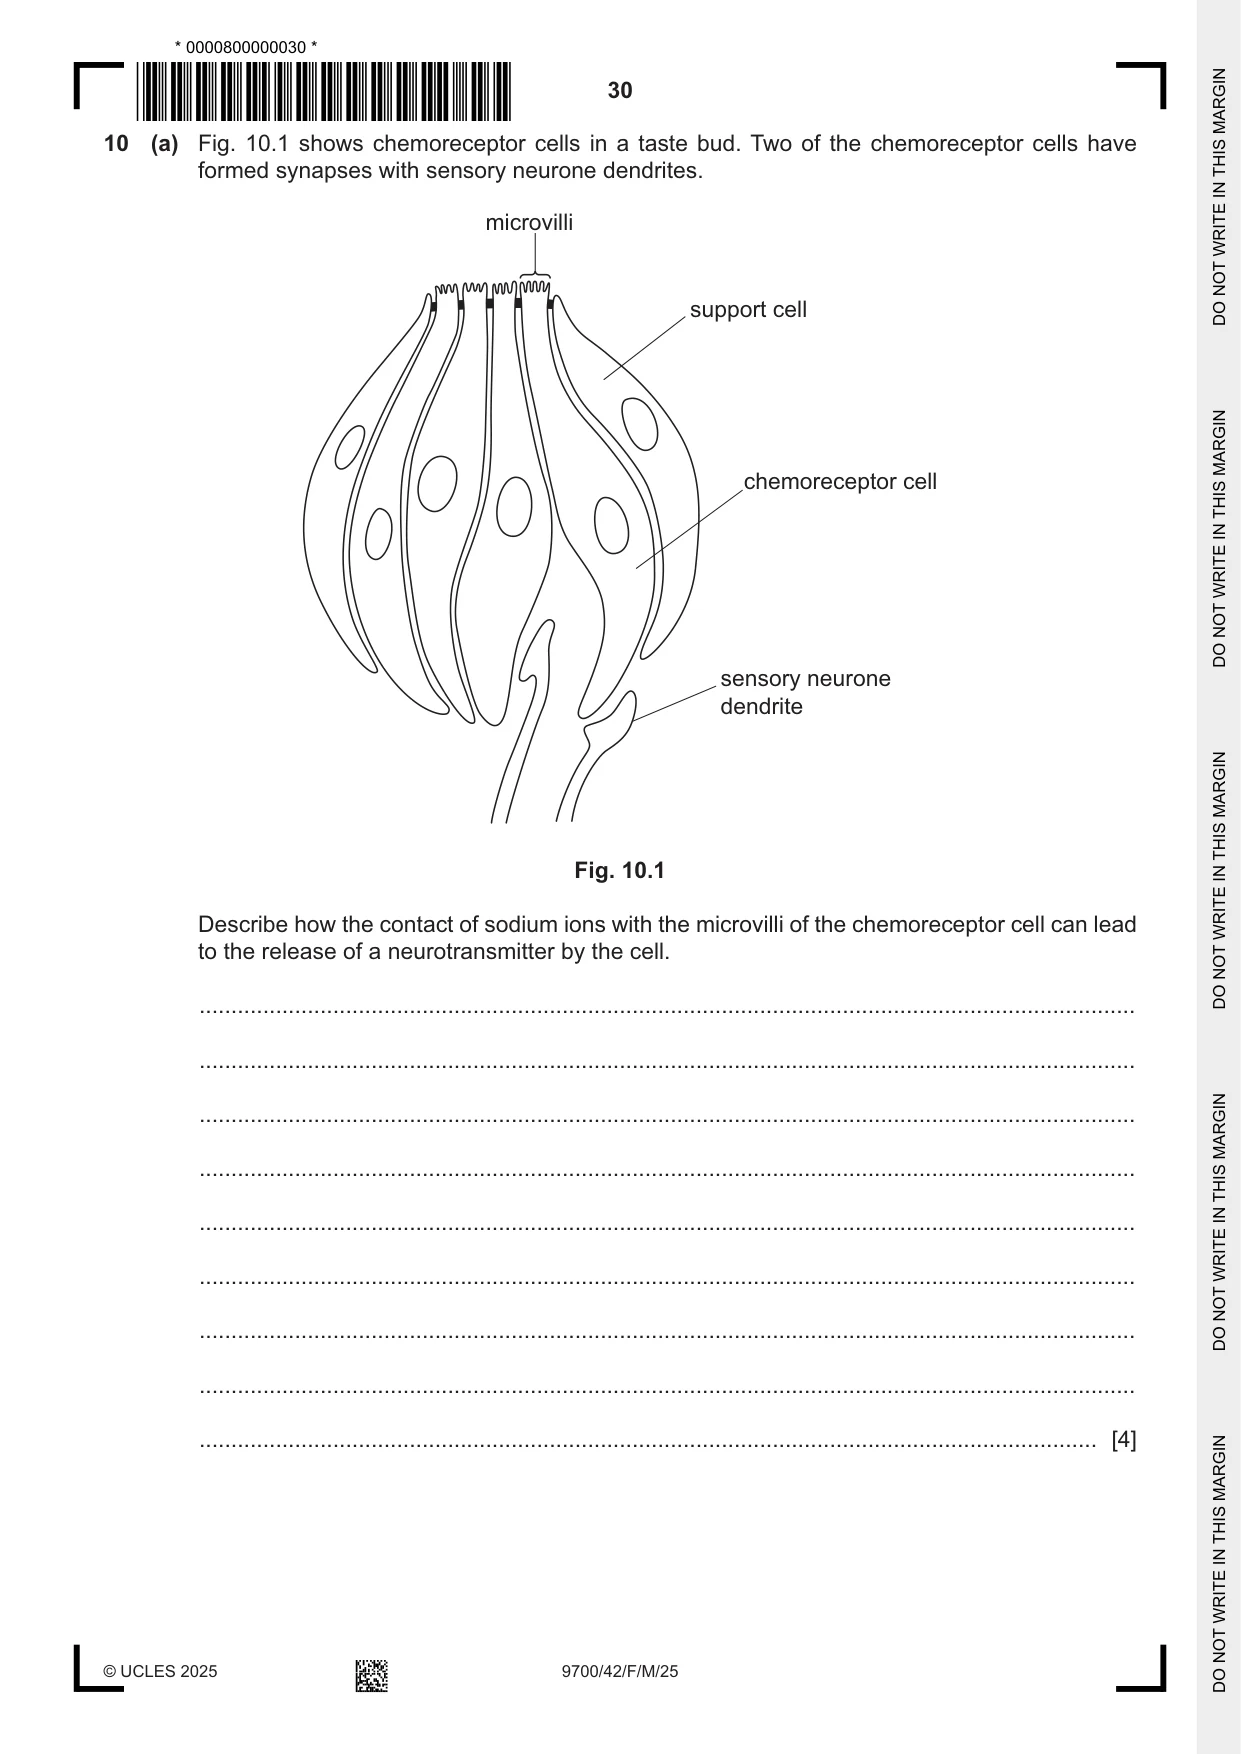
10 (a) Fig. 10.1 shows chemoreceptor cells in a taste bud. Two of the chemoreceptor cells have formed synapses with sensory neurone dendrites. microvilli support cell chemoreceptor cell sensory neurone dendrite Fig. 10.1 Describe how the contact of sodium ions with the microvilli of the chemoreceptor cell can lead to the release of a neurotransmitter by the cell. ................................................................................................................................................... ................................................................................................................................................... ................................................................................................................................................... ................................................................................................................................................... ................................................................................................................................................... ................................................................................................................................................... ................................................................................................................................................... ................................................................................................................................................... ............................................................................................................................................. [4] (b) Some of the neurotransmitters in the brain are produced through a series of reactions (reaction pathway) from a chemical called DOPA. DOPA is also involved in other reaction pathways. For example, in the skin and eyes, DOPA is part of a different reaction pathway that depends on the TYR gene. Describe and explain the phenotypic consequences for the skin and eyes of a person who is homozygous for a mutated, non-functional allele of the TYR gene. ................................................................................................................................................... ................................................................................................................................................... ................................................................................................................................................... ................................................................................................................................................... ................................................................................................................................................... ................................................................................................................................................... ............................................................................................................................................. [3] [Total: 7]
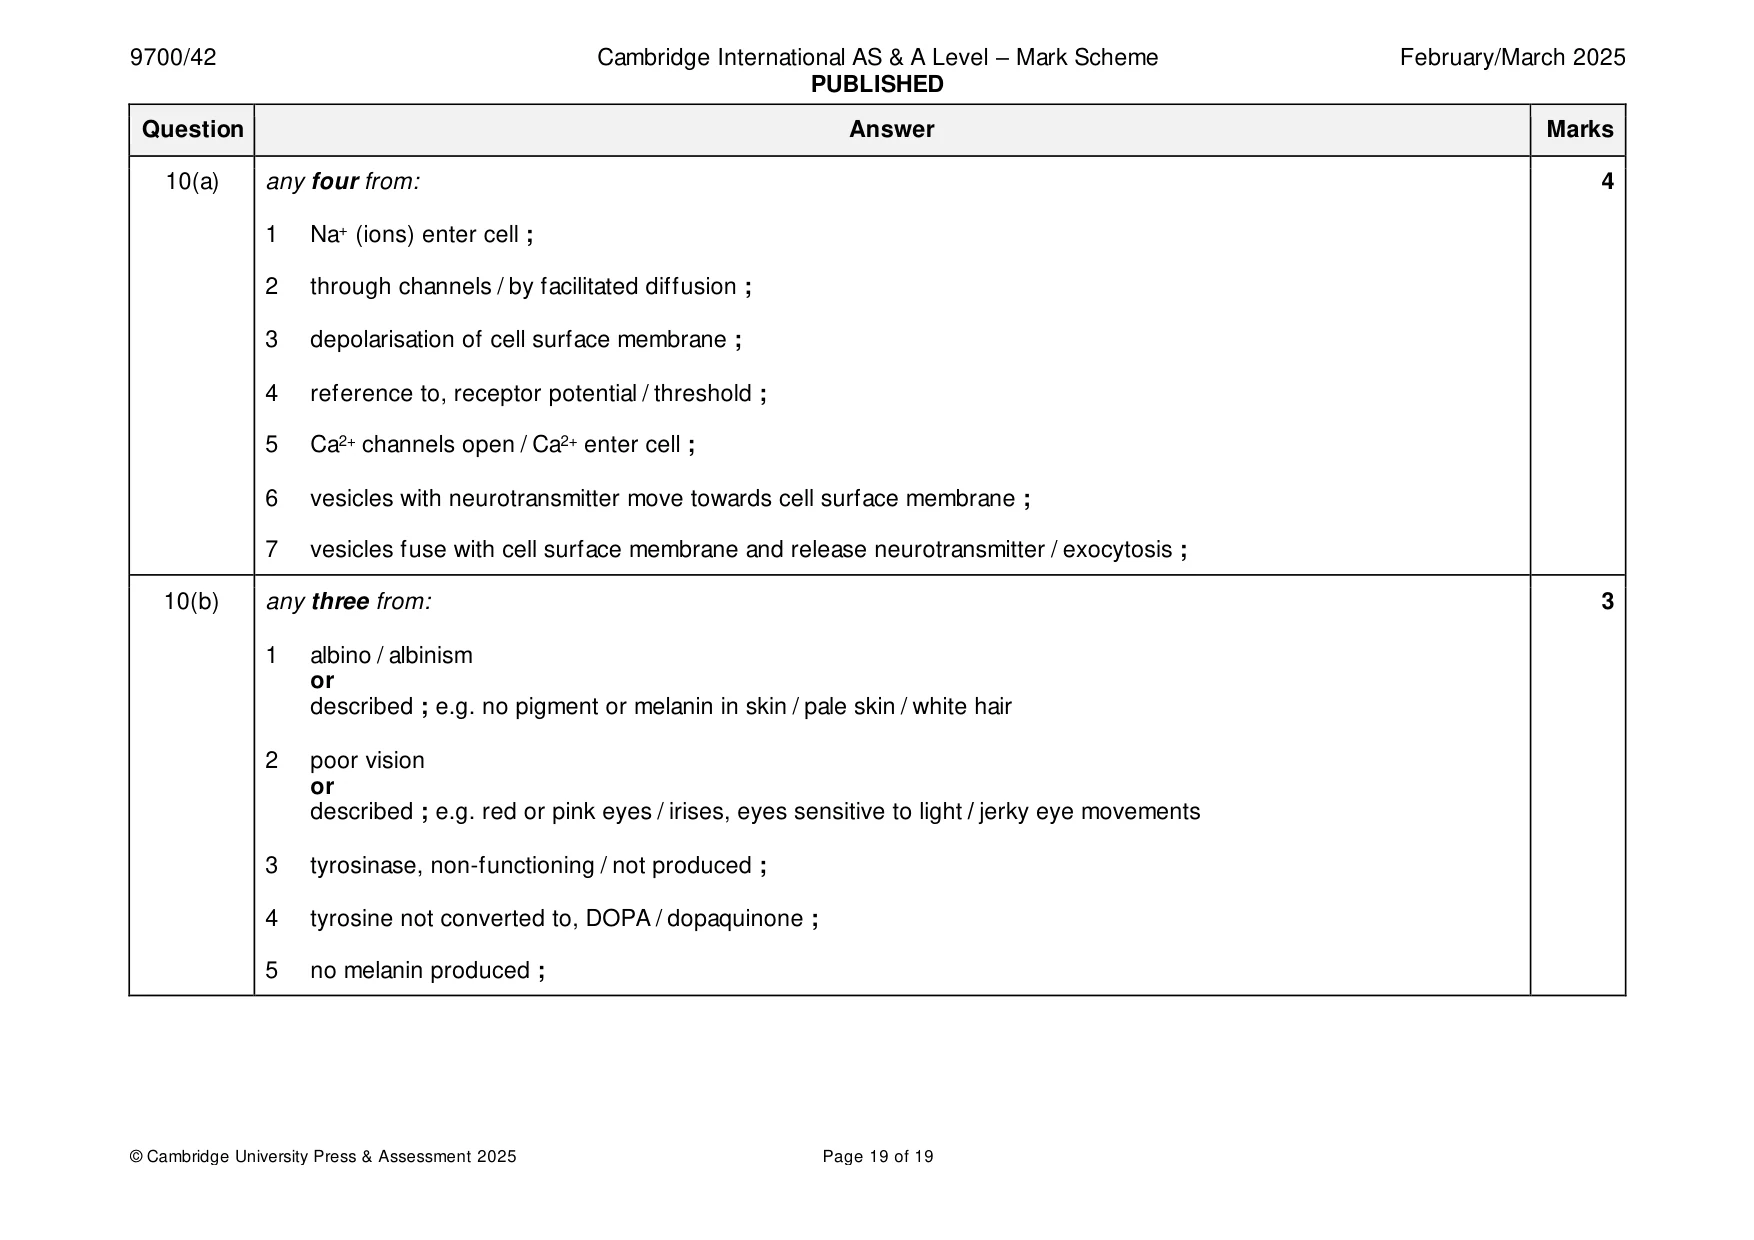
Mark scheme: 10(a) any four from: 4 1 Na+ (ions) enter cell ; 2 through channels / by facilitated diffusion ; 3 depolarisation of cell surface membrane ; 4 reference to, receptor potential / threshold ; 5 Ca2+ channels open / Ca2+ enter cell ; 6 vesicles with neurotransmitter move towards cell surface membrane ; 7 vesicles fuse with cell surface membrane and release neurotransmitter / exocytosis ; 10(b) any three from: 3 1 albino / albinism or described ; e.g. no pigment or melanin in skin / pale skin / white hair 2 poor vision or described ; e.g. red or pink eyes / irises, eyes sensitive to light / jerky eye movements 3 tyrosinase, non-functioning / not produced ; 4 tyrosine not converted to, DOPA / dopaquinone ; 5 no melanin produced ;
What was in this paper
The subtopics covered by these 10 questions, and how many questions each got. Open one in a new tab to see every Cambridge question on it.
What you needed in this session
Cambridge’s own grade thresholds for 2025 Feb/March, Paper 4 · Variant 2. A higher threshold means an easier paper — the bar moves with how the cohort did.