Cambridge A Level Biology 9700 — 2023 Feb/March Paper 4 · Variant 2
9700/42/F/M/23 · 10 questions · 100 marks · ≈113 min
The question paper and its mark scheme, free to read here and free to download. This is Cambridge’s own paper, exactly as it was sat.
Question paper28 pages


Mark scheme20 pages
Answers below. Sit the paper first if you are practising.
Questions as text
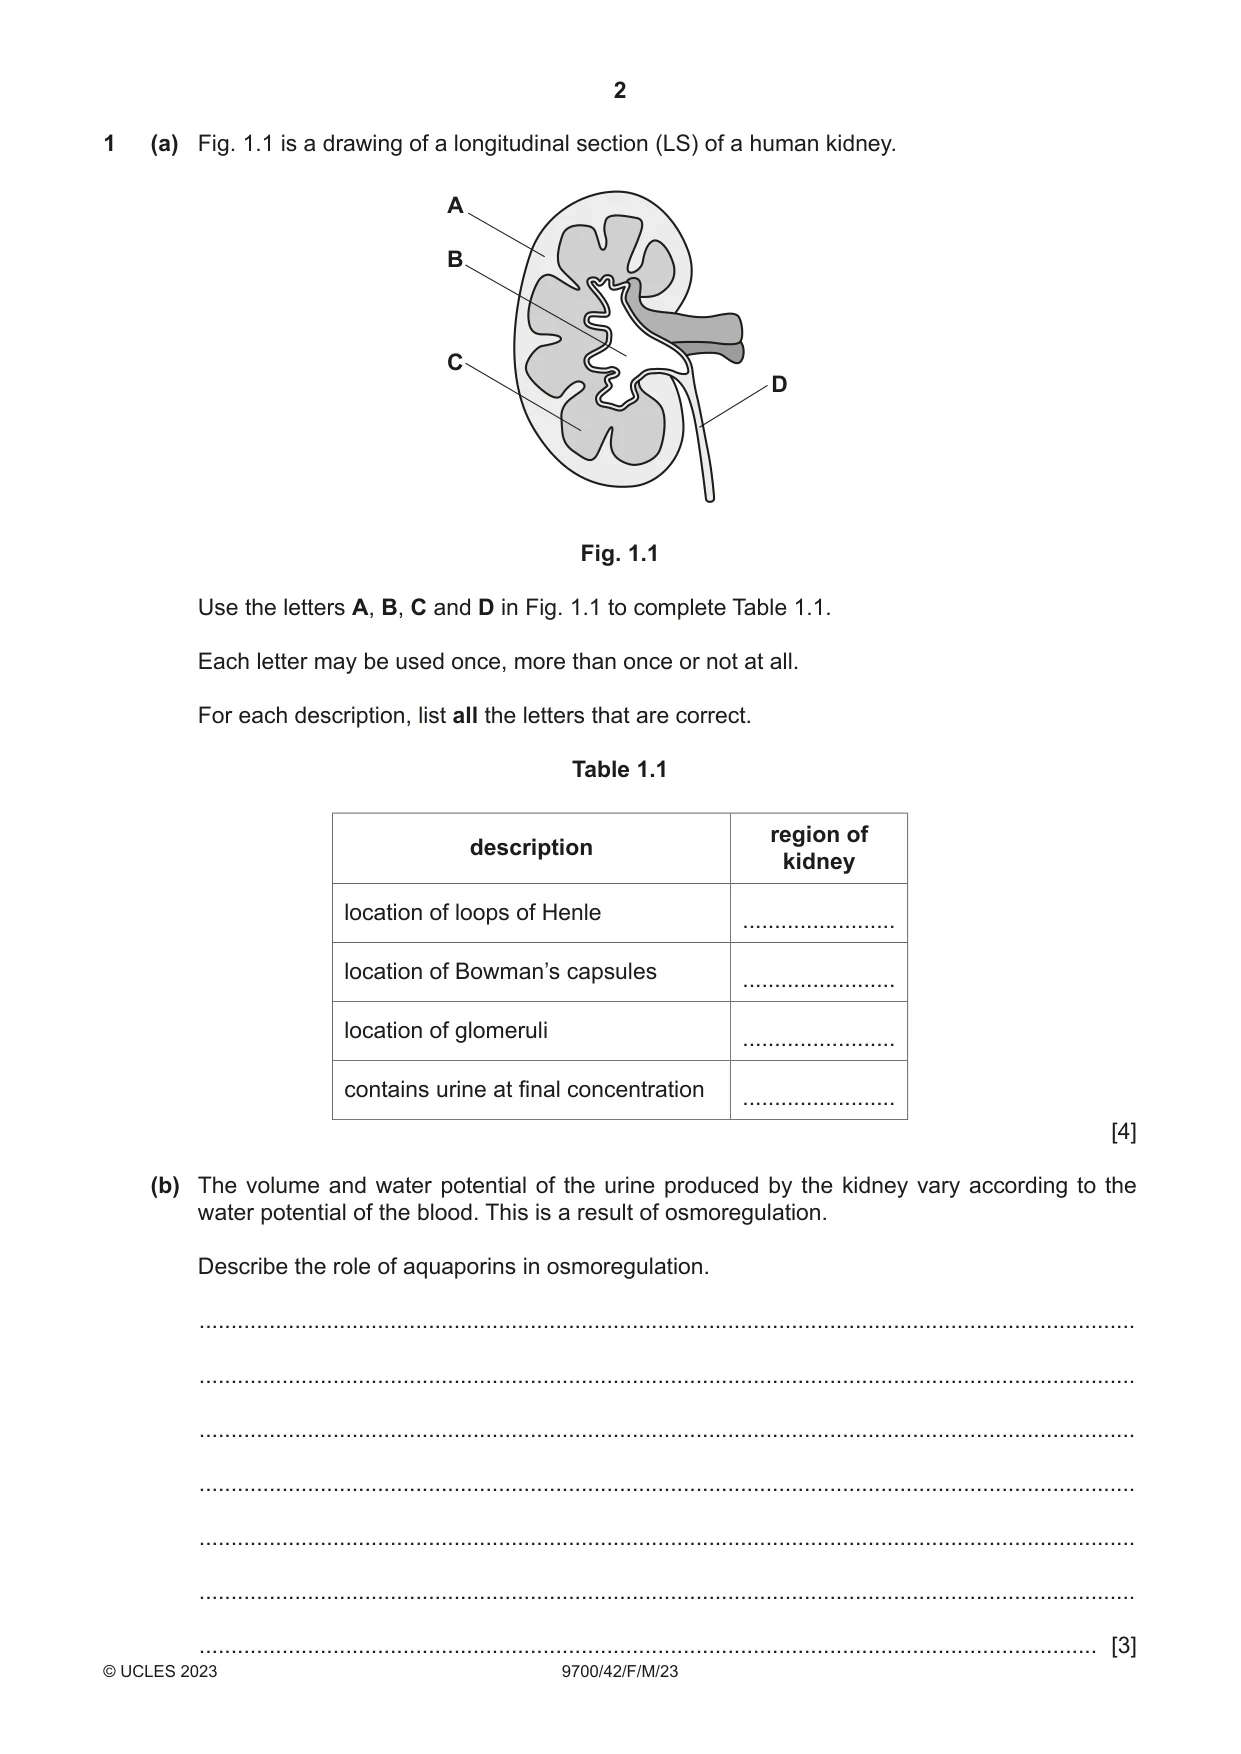
Q1 · A drawing of a longitudinal section (LS) of a human kidney
1 (a) Fig. 1.1 is a drawing of a longitudinal section (LS) of a human kidney. A B C D Fig. 1.1 Use the letters A, B, C and D in Fig. 1.1 to complete Table 1.1. Each letter may be used once, more than once or not at all. For each description, list all the letters that are correct. Table 1.1 region of description kidney location of loops of Henle ........................ location of Bowman’s capsules ........................ location of glomeruli ........................ contains urine at final concentration ........................ [4] (b) The volume and water potential of the urine produced by the kidney vary according to the water potential of the blood. This is a result of osmoregulation. Describe the role of aquaporins in osmoregulation. ................................................................................................................................................... ................................................................................................................................................... ................................................................................................................................................... ................................................................................................................................................... ................................................................................................................................................... ................................................................................................................................................... ............................................................................................................................................. [3] (c) Describe the role of the brain in osmoregulation when the water potential of the blood increases above the set point. ................................................................................................................................................... ................................................................................................................................................... ................................................................................................................................................... ................................................................................................................................................... ................................................................................................................................................... ................................................................................................................................................... ............................................................................................................................................. [3] [Total: 10] Question 2 starts on page 5.
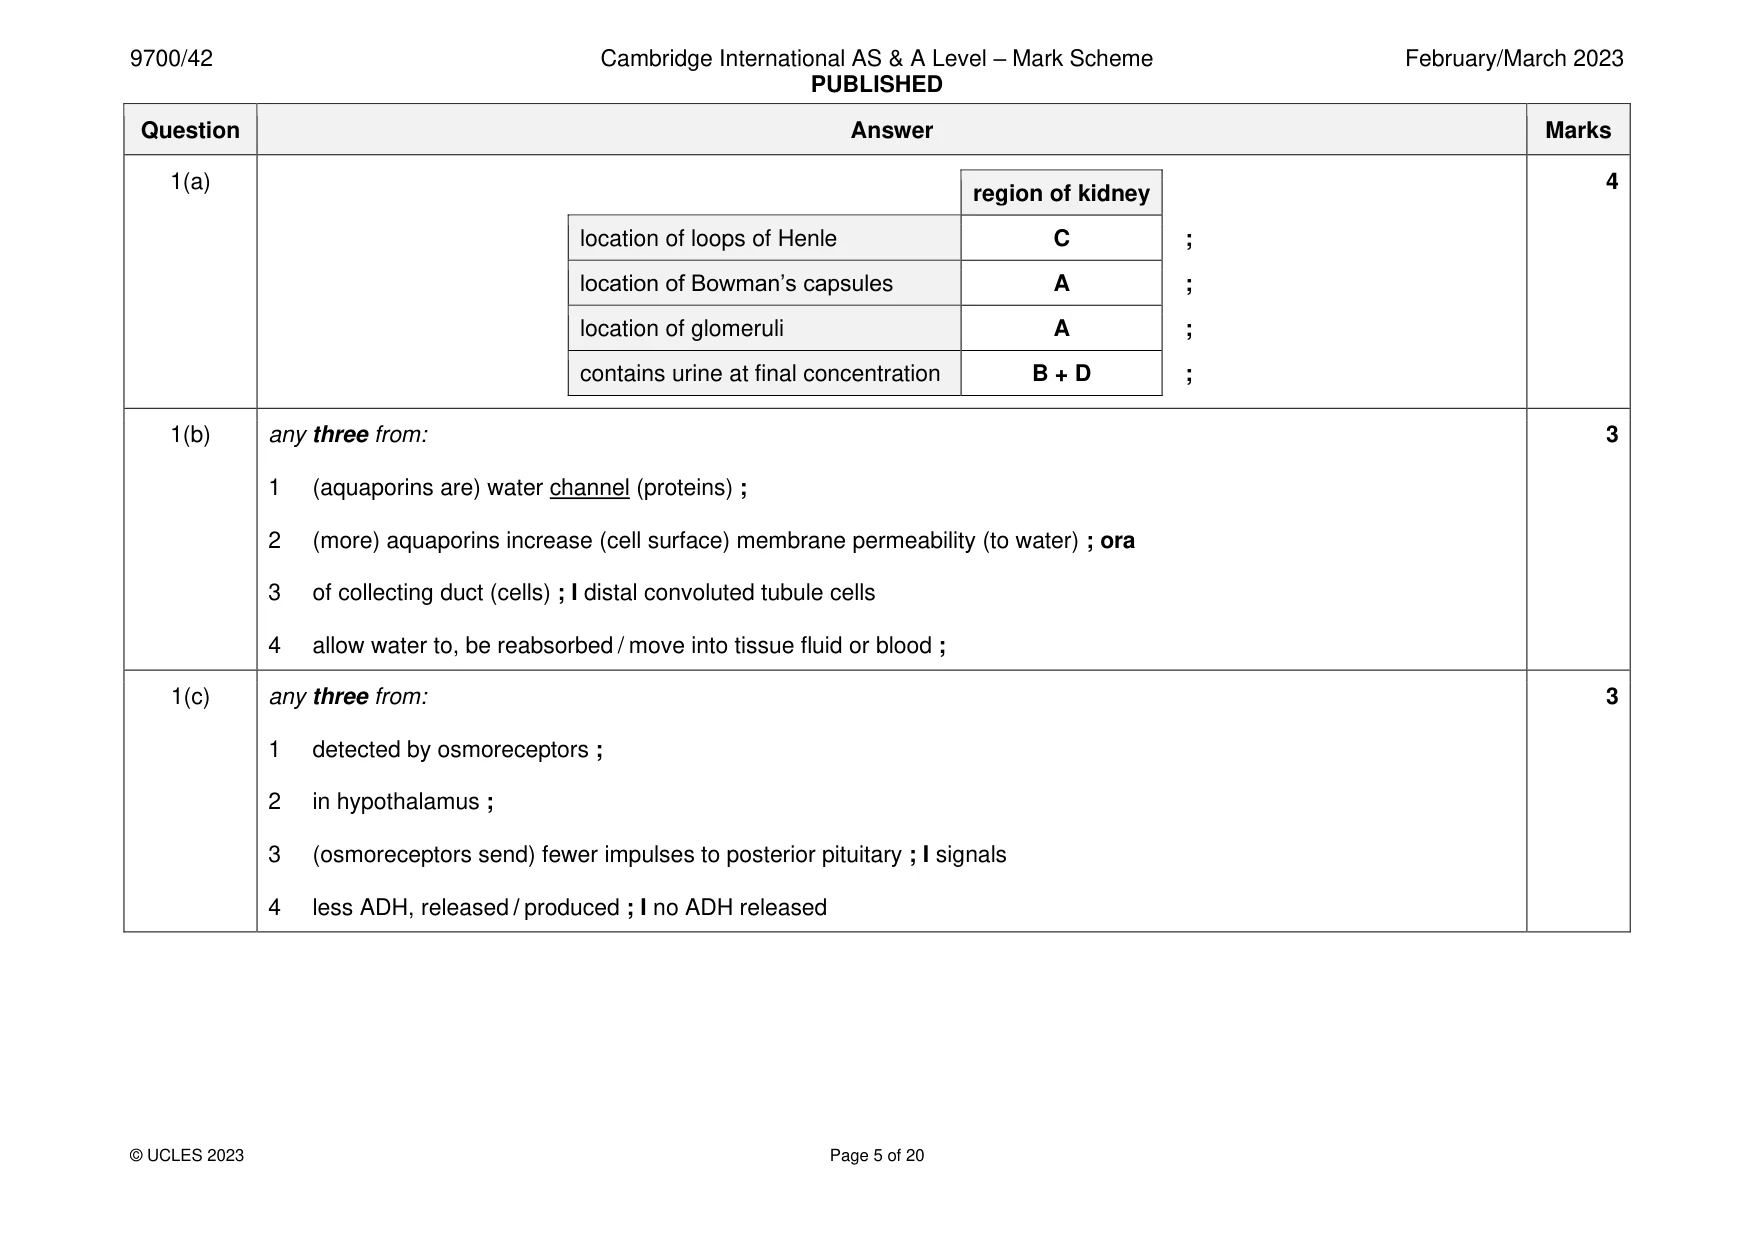
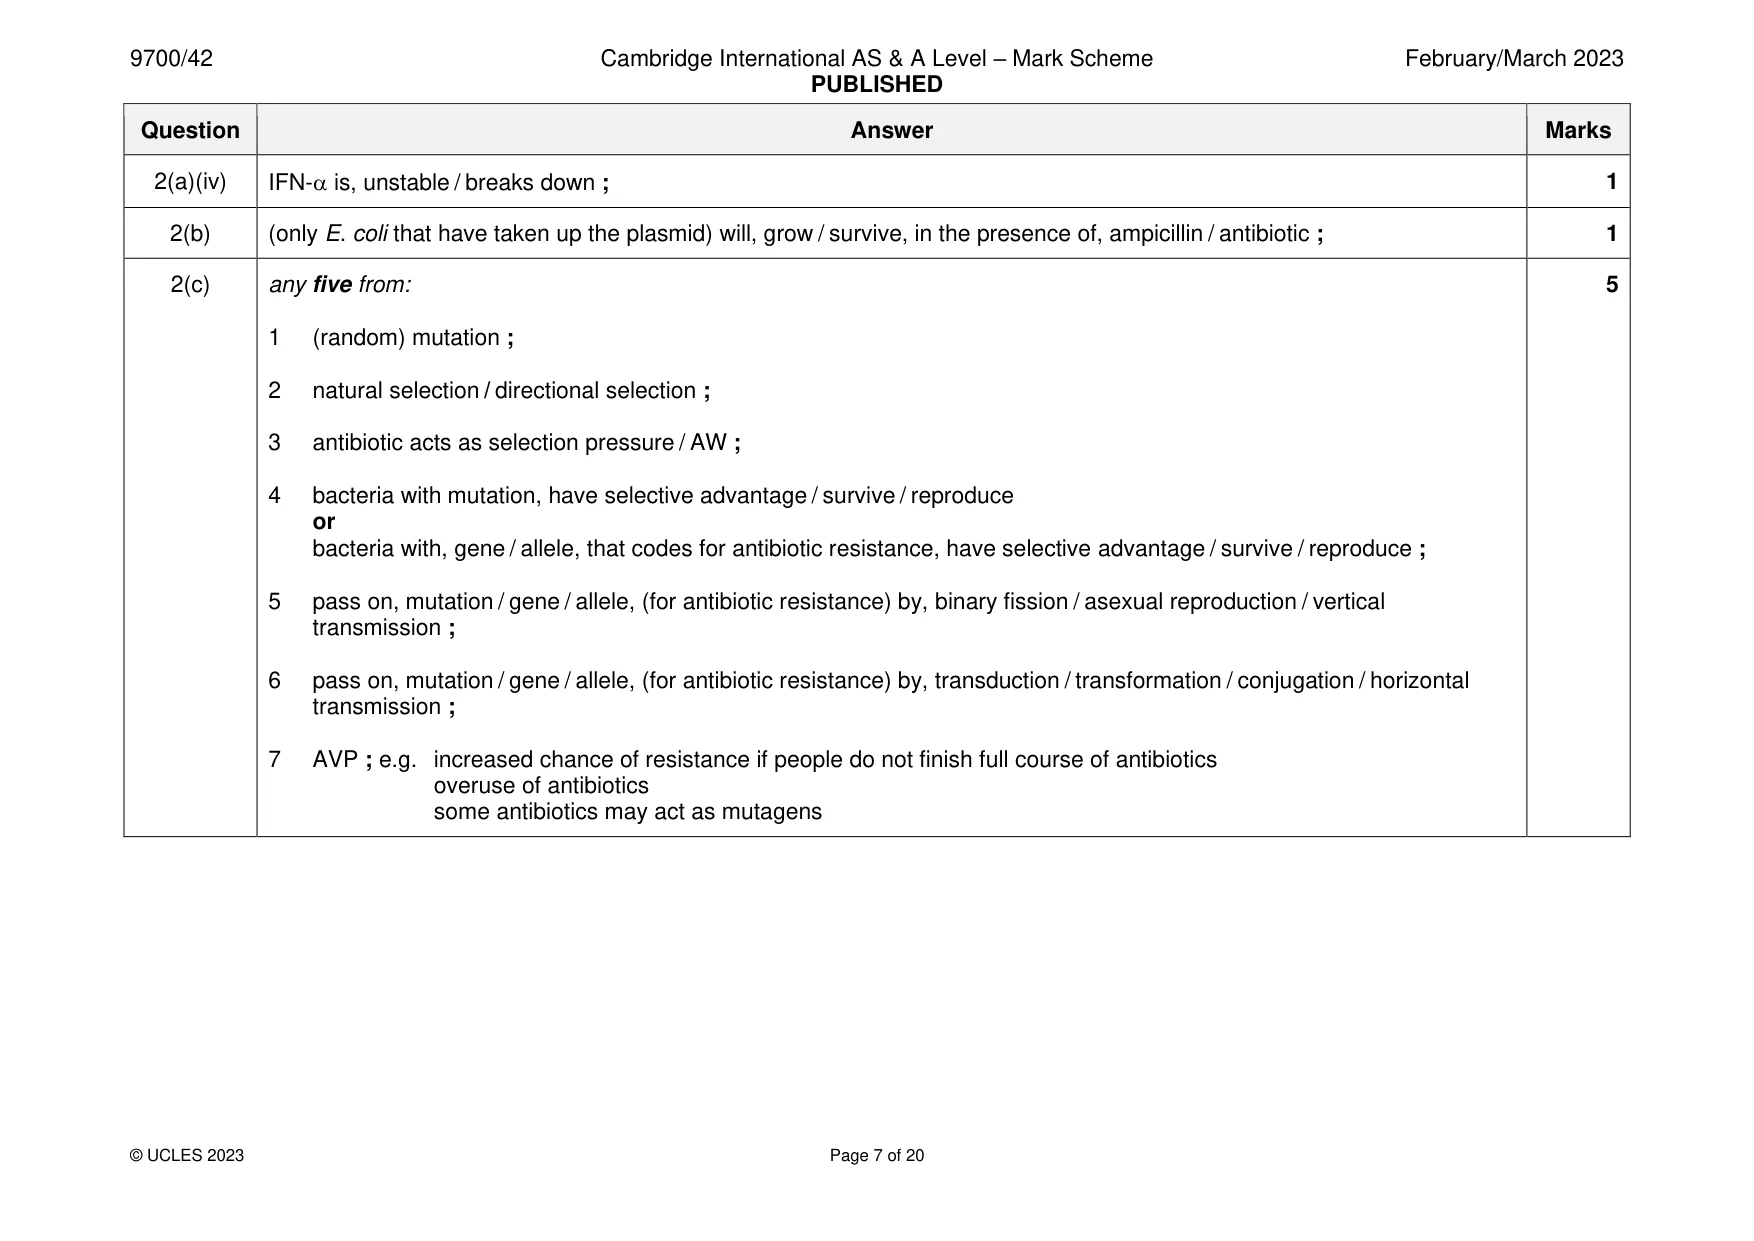
Mark scheme: Question Answer Marks 1(a) 4 region of kidney location of loops of Henle C ; location of Bowman’s capsules A ; location of glomeruli A ; contains urine at final concentration B + D ; 1(b) any three from: 3 1 (aquaporins are) water channel (proteins) ; 2 (more) aquaporins increase (cell surface) membrane permeability (to water) ; ora 3 of collecting duct (cells) ; I distal convoluted tubule cells 4 allow water to, be reabsorbed / move into tissue fluid or blood ; 1(c) any three from: 3 1 detected by osmoreceptors ; 2 in hypothalamus ; 3 (osmoreceptors send) fewer impulses to posterior pituitary ; I signals 4 less ADH, released / produced ; I no ADH released
Q2 · Interferon-alpha (IFN-α) can be produced as a recombinant human protein to treat some…
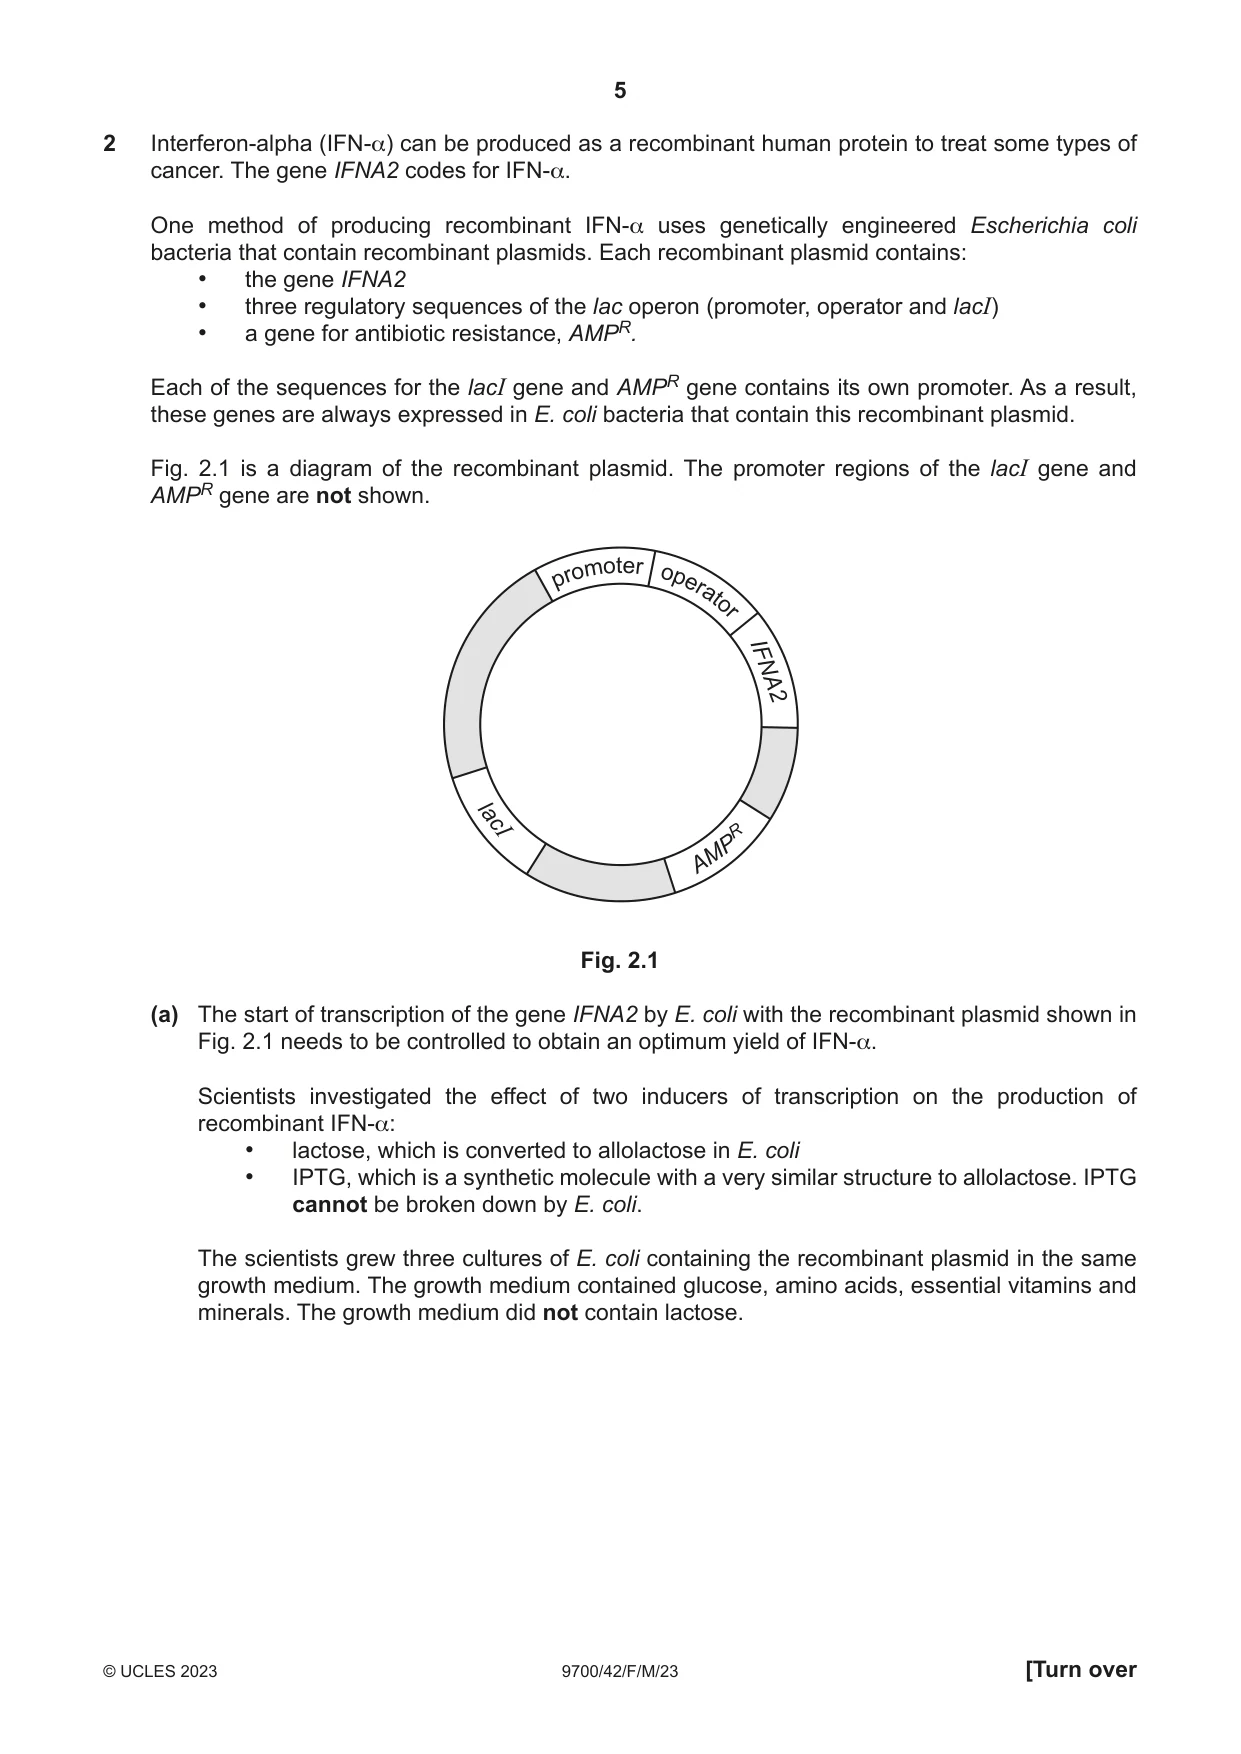
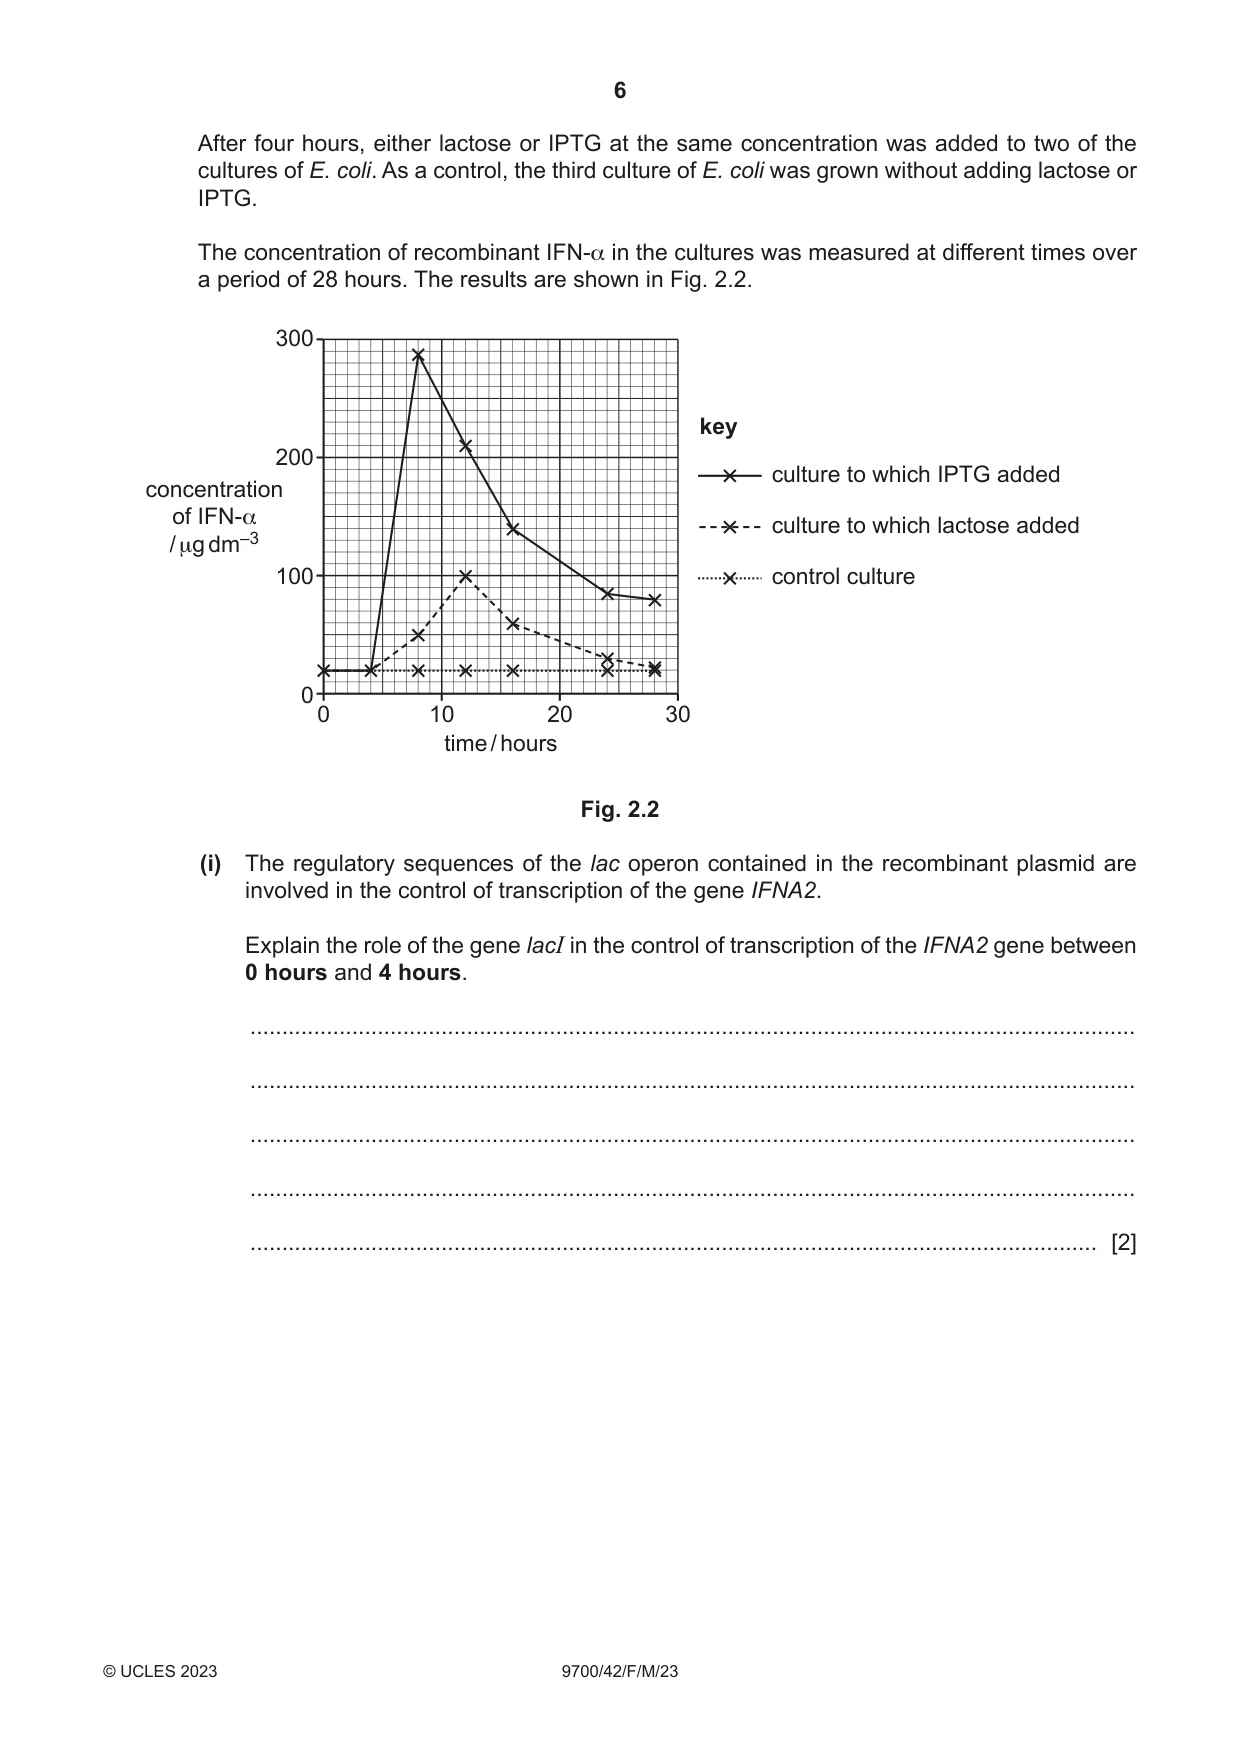
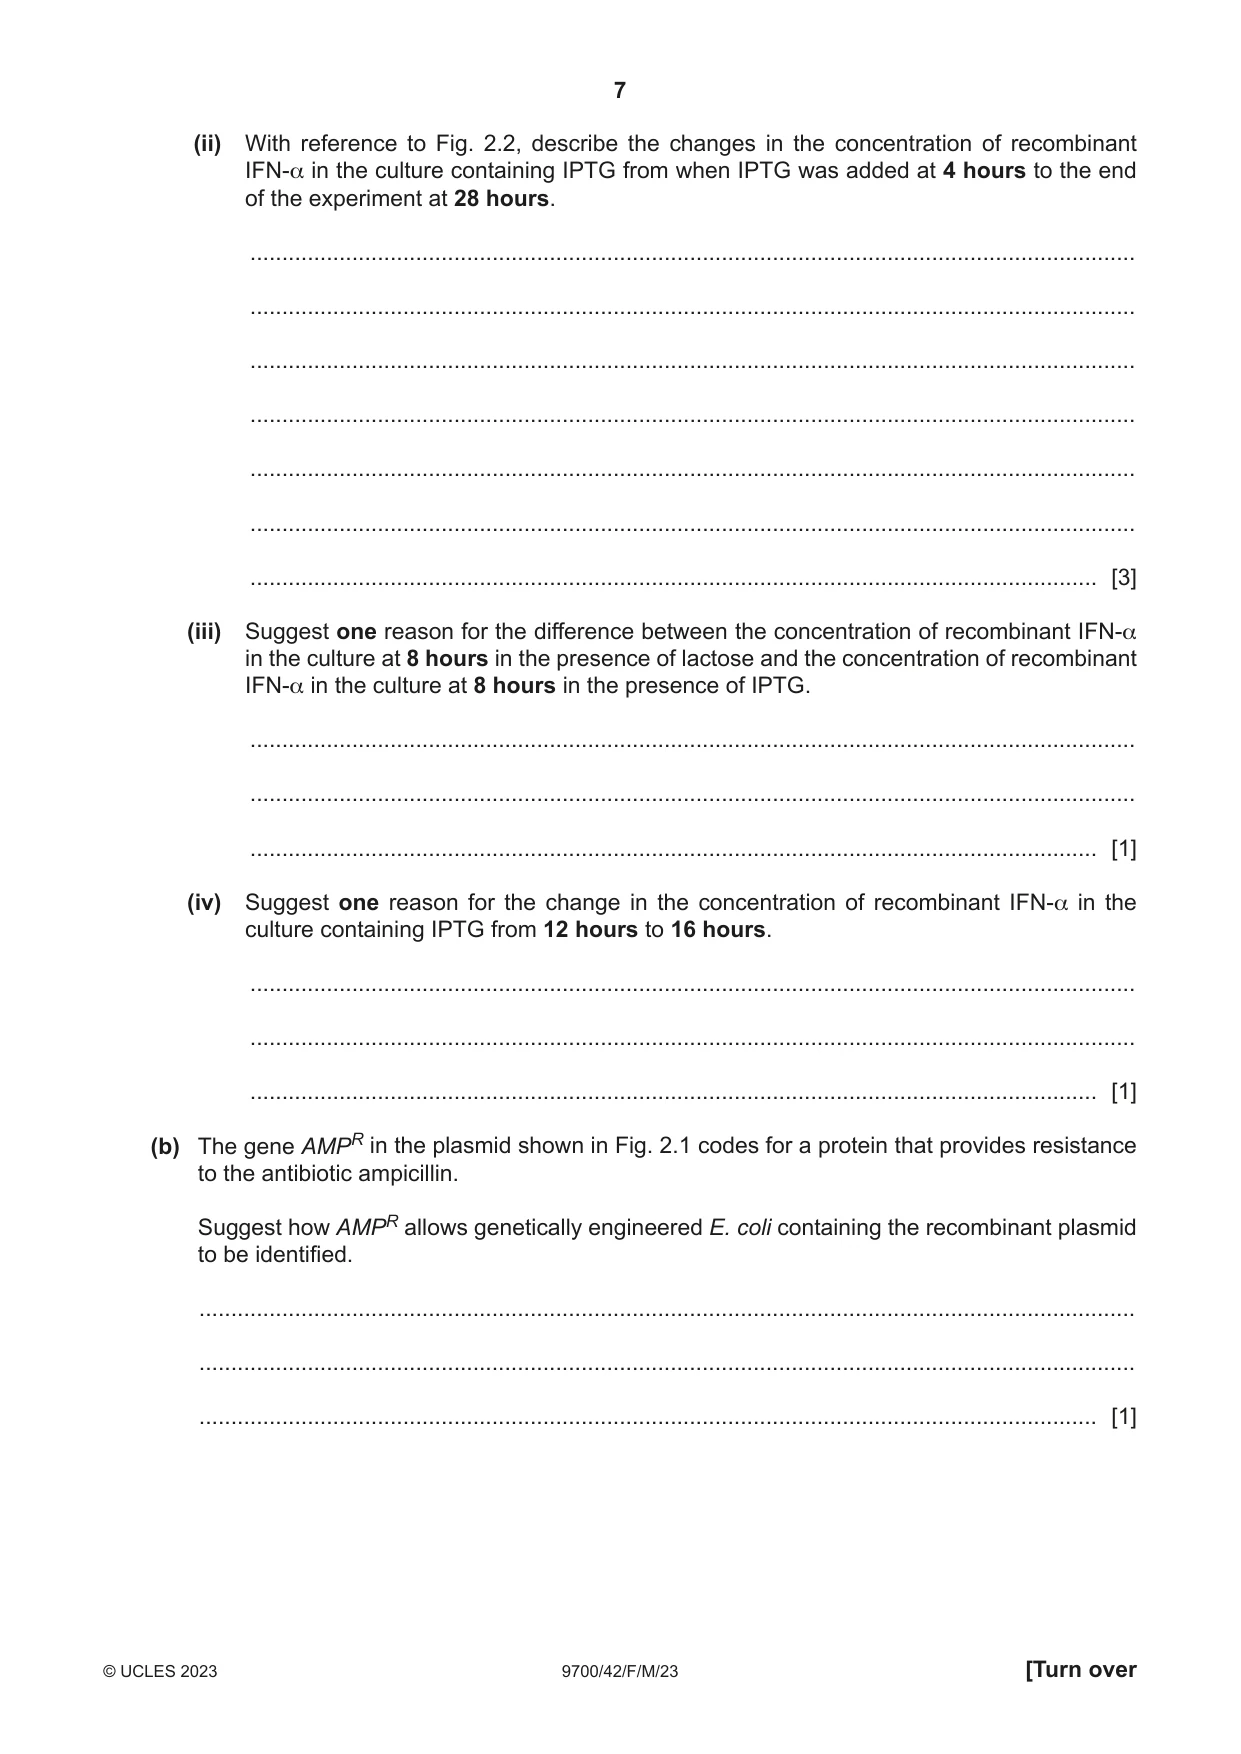
2 Interferon-alpha (IFN-α) can be produced as a recombinant human protein to treat some types of cancer. The gene IFNA2 codes for IFN-α. One method of producing recombinant IFN-α uses genetically engineered Escherichia coli bacteria that contain recombinant plasmids. Each recombinant plasmid contains: • the gene IFNA2 • three regulatory sequences of the lac operon (promoter, operator and lacI) • a gene for antibiotic resistance, AMPR. Each of the sequences for the lacI gene and AMPR gene contains its own promoter. As a result, these genes are always expressed in E. coli bacteria that contain this recombinant plasmid. Fig. 2.1 is a diagram of the recombinant plasmid. The promoter regions of the lacI gene and AMPR gene are not shown. promoter oper at or IFNA2 lacI AMPR Fig. 2.1 (a) The start of transcription of the gene IFNA2 by E. coli with the recombinant plasmid shown in Fig. 2.1 needs to be controlled to obtain an optimum yield of IFN-α. Scientists investigated the effect of two inducers of transcription on the production of recombinant IFN-α: • lactose, which is converted to allolactose in E. coli • IPTG, which is a synthetic molecule with a very similar structure to allolactose. IPTG cannot be broken down by E. coli. The scientists grew three cultures of E. coli containing the recombinant plasmid in the same growth medium. The growth medium contained glucose, amino acids, essential vitamins and minerals. The growth medium did not contain lactose. After four hours, either lactose or IPTG at the same concentration was added to two of the cultures of E. coli. As a control, the third culture of E. coli was grown without adding lactose or IPTG. The concentration of recombinant IFN-α in the cultures was measured at different times over a period of 28 hours. The results are shown in Fig. 2.2. 300 key 200 culture to which IPTG addedconcentration of IFN-α culture to which lactose added / μg dm–3 100 control culture 0 0 10 20 30 time / hours Fig. 2.2 (i) The regulatory sequences of the lac operon contained in the recombinant plasmid are involved in the control of transcription of the gene IFNA2. Explain the role of the gene lacI in the control of transcription of the IFNA2 gene between 0 hours and 4 hours. ........................................................................................................................................... ........................................................................................................................................... ........................................................................................................................................... ........................................................................................................................................... ..................................................................................................................................... [2] (ii) With reference to Fig. 2.2, describe the changes in the concentration of recombinant IFN-α in the culture containing IPTG from when IPTG was added at 4 hours to the end of the experiment at 28 hours. ........................................................................................................................................... ........................................................................................................................................... ........................................................................................................................................... ........................................................................................................................................... ........................................................................................................................................... ........................................................................................................................................... ..................................................................................................................................... [3] (iii) Suggest one reason for the difference between the concentration of recombinant IFN-α in the culture at 8 hours in the presence of lactose and the concentration of recombinant IFN-α in the culture at 8 hours in the presence of IPTG. ........................................................................................................................................... ........................................................................................................................................... ..................................................................................................................................... [1] (iv) Suggest one reason for the change in the concentration of recombinant IFN-α in the culture containing IPTG from 12 hours to 16 hours. ........................................................................................................................................... ........................................................................................................................................... ..................................................................................................................................... [1] (b) The gene AMPR in the plasmid shown in Fig. 2.1 codes for a protein that provides resistance to the antibiotic ampicillin. Suggest how AMPR allows genetically engineered E. coli containing the recombinant plasmid to be identified. ................................................................................................................................................... ................................................................................................................................................... ............................................................................................................................................. [1] (c) Bacteria can evolve antibiotic resistance through natural processes. Outline how bacteria can evolve to become resistant to antibiotics. ................................................................................................................................................... ................................................................................................................................................... ................................................................................................................................................... ................................................................................................................................................... ................................................................................................................................................... ................................................................................................................................................... ................................................................................................................................................... ................................................................................................................................................... ................................................................................................................................................... ................................................................................................................................................... ............................................................................................................................................. [5] [Total: 13] Question 3 starts on page 10.
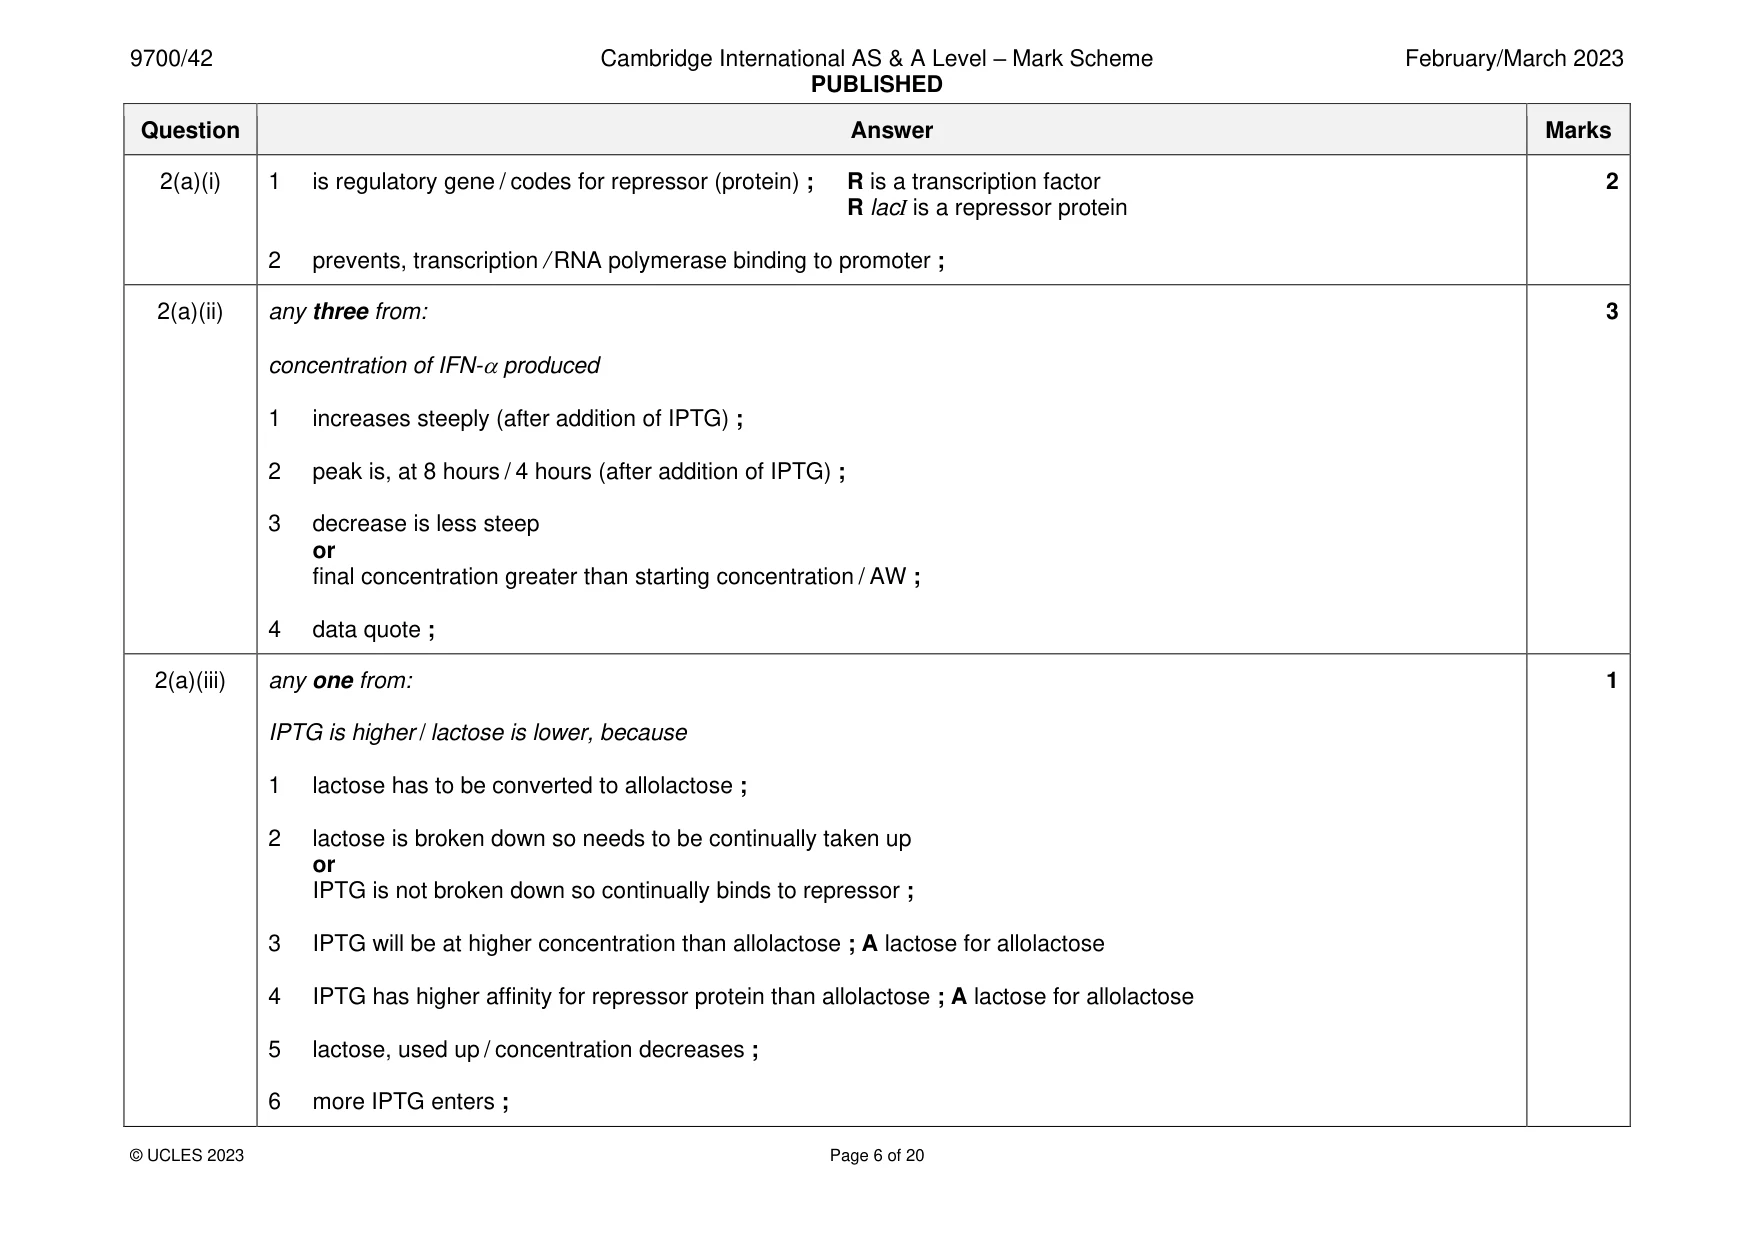
Mark scheme: 2(a)(i) 1 is regulatory gene / codes for repressor (protein) ; R is a transcription factor 2 R lacI is a repressor protein 2 prevents, transcription / RNA polymerase binding to promoter ; 2(a)(ii) any three from: 3 concentration of IFN-produced 1 increases steeply (after addition of IPTG) ; 2 peak is, at 8 hours / 4 hours (after addition of IPTG) ; 3 decrease is less steep or final concentration greater than starting concentration / AW ; 4 data quote ; 2(a)(iii) any one from: 1 IPTG is higher / lactose is lower, because 1 lactose has to be converted to allolactose ; 2 lactose is broken down so needs to be continually taken up or IPTG is not broken down so continually binds to repressor ; 3 IPTG will be at higher concentration than allolactose ; A lactose for allolactose 4 IPTG has higher affinity for repressor protein than allolactose ; A lactose for allolactose 5 lactose, used up / concentration decreases ; 6 more IPTG enters ; 2(a)(iv) IFN- is, unstable / breaks down ; 1 2(b) (only E. coli that have taken up the plasmid) will, grow / survive, in the presence of, ampicillin / antibiotic ; 1 2(c) any five from: 5 1 (random) mutation ; 2 natural selection / directional selection ; 3 antibiotic acts as selection pressure / AW ; 4 bacteria with mutation, have selective advantage / survive / reproduce or bacteria with, gene / allele, that codes for antibiotic resistance, have selective advantage / survive / reproduce ; 5 pass on, mutation / gene / allele, (for antibiotic resistance) by, binary fission / asexual reproduction / vertical transmission ; 6 pass on, mutation / gene / allele, (for antibiotic resistance) by, transduction / transformation / conjugation / horizontal transmission ; 7 AVP ; e.g. increased chance of resistance if people do not finish full course of antibiotics overuse of antibiotics some antibiotics may act as mutagens
Q3 · Salmon can be genetically modified (GM) to produce increased quantities of growth…
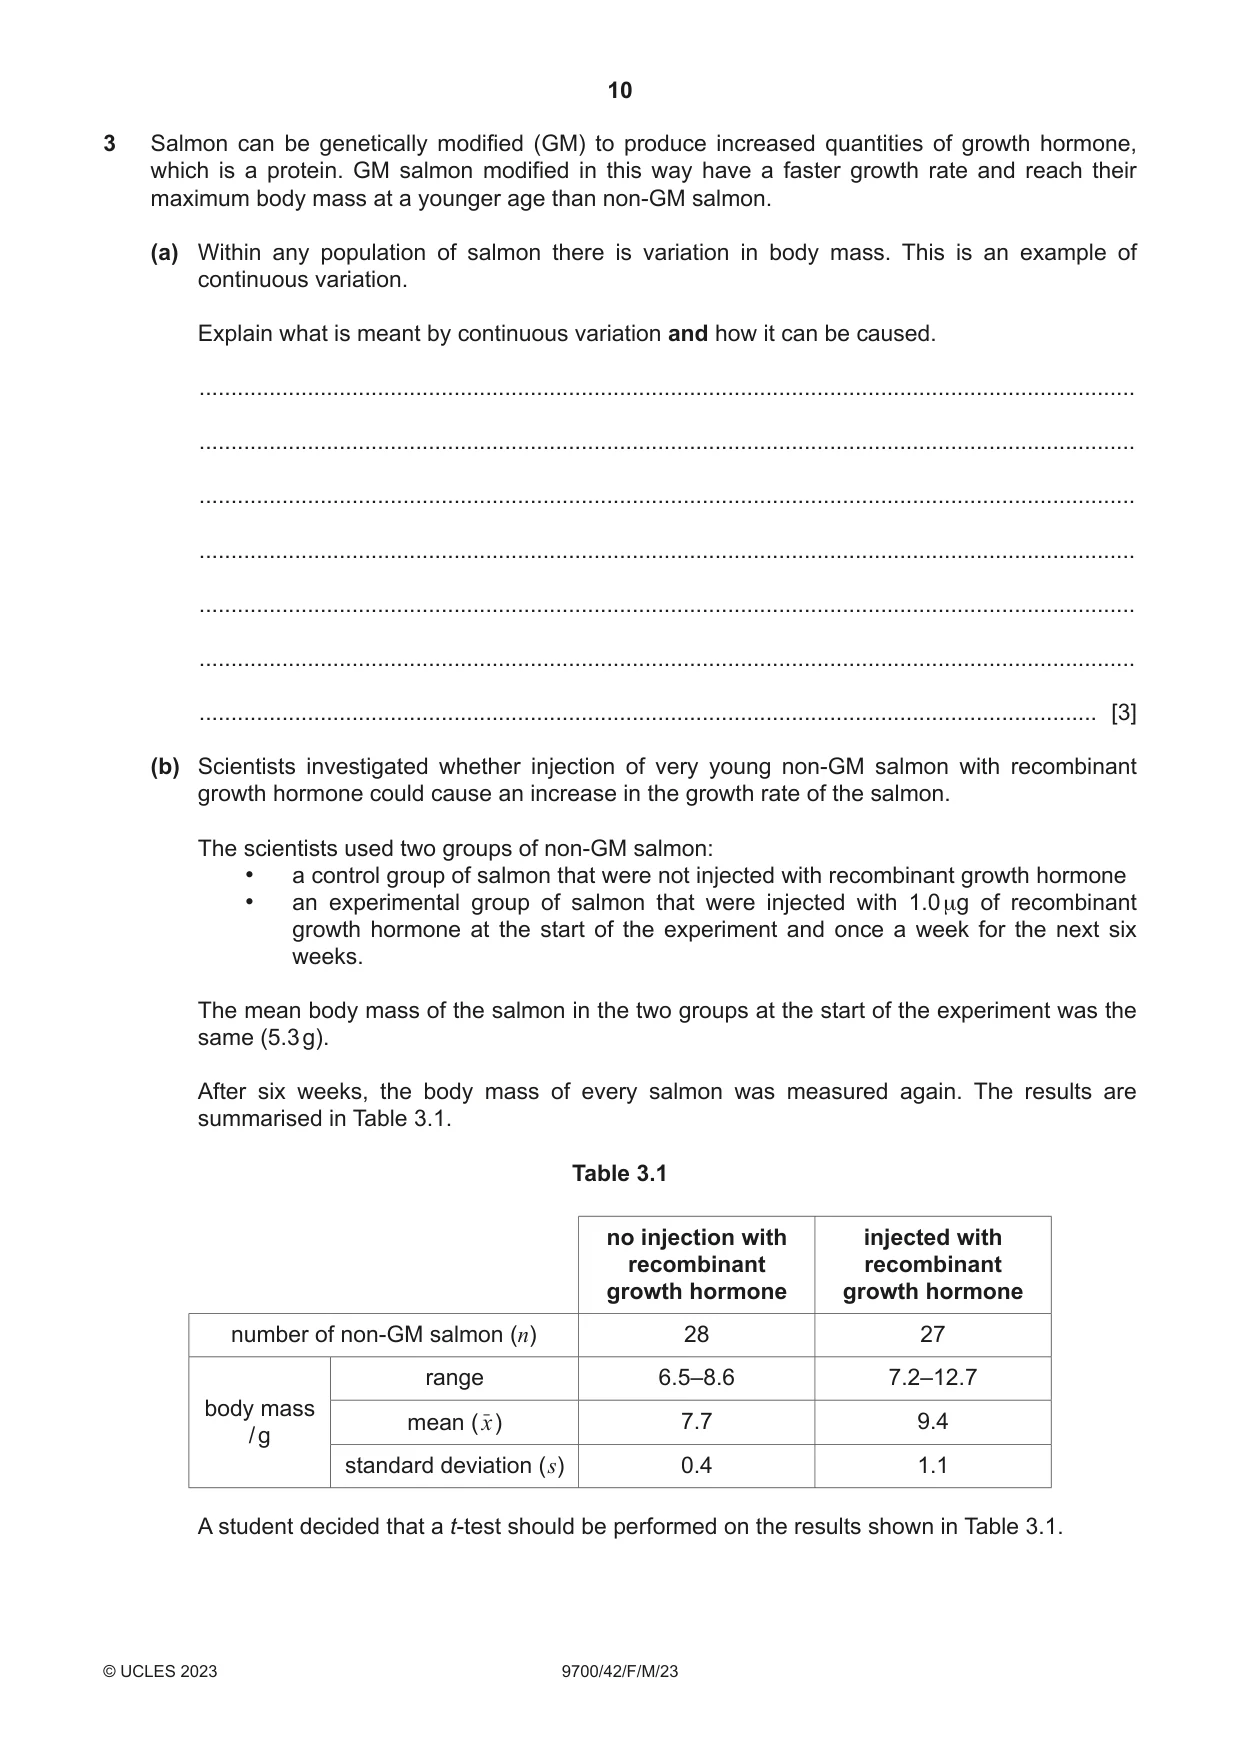
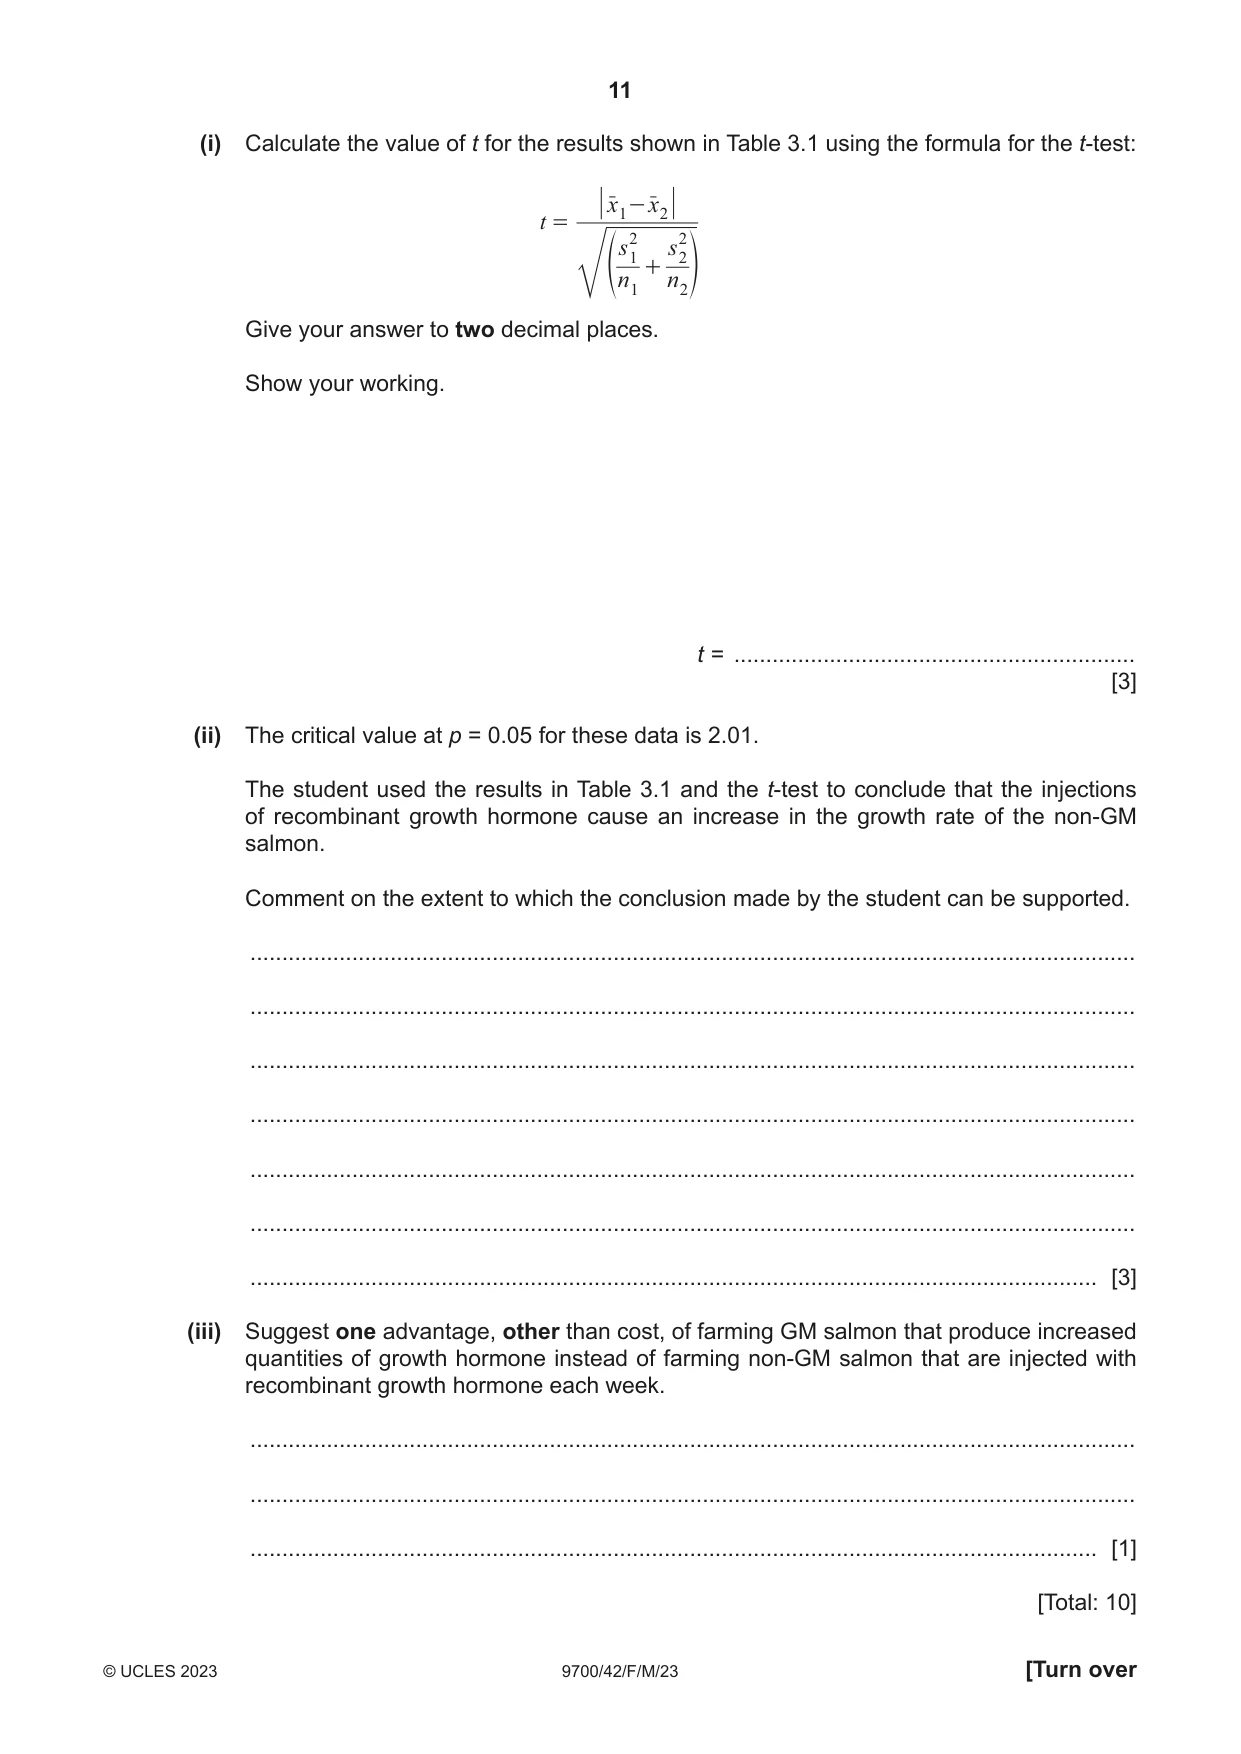
3 Salmon can be genetically modified (GM) to produce increased quantities of growth hormone, which is a protein. GM salmon modified in this way have a faster growth rate and reach their maximum body mass at a younger age than non-GM salmon. (a) Within any population of salmon there is variation in body mass. This is an example of continuous variation. Explain what is meant by continuous variation and how it can be caused. ................................................................................................................................................... ................................................................................................................................................... ................................................................................................................................................... ................................................................................................................................................... ................................................................................................................................................... ................................................................................................................................................... ............................................................................................................................................. [3] (b) Scientists investigated whether injection of very young non-GM salmon with recombinant growth hormone could cause an increase in the growth rate of the salmon. The scientists used two groups of non-GM salmon: • a control group of salmon that were not injected with recombinant growth hormone • an experimental group of salmon that were injected with 1.0 µg of recombinant growth hormone at the start of the experiment and once a week for the next six weeks. The mean body mass of the salmon in the two groups at the start of the experiment was the same (5.3 g). After six weeks, the body mass of every salmon was measured again. The results are summarised in Table 3.1. Table 3.1 no injection with injected with recombinant recombinant growth hormone growth hormone number of non-GM salmon (n) 28 27 range 6.5–8.6 7.2–12.7 body mass mean (xr ) 7.7 9.4 / g standard deviation (s) 0.4 1.1 A student decided that a t-test should be performed on the results shown in Table 3.1. (i) Calculate the value of t for the results shown in Table 3.1 using the formula for the t-test: xr 1 - xr 2 t = s 21 s 22 + f n 1 n 2 p Give your answer to two decimal places. Show your working. t = ............................................................... [3] (ii) The critical value at p = 0.05 for these data is 2.01. The student used the results in Table 3.1 and the t-test to conclude that the injections of recombinant growth hormone cause an increase in the growth rate of the non-GM salmon. Comment on the extent to which the conclusion made by the student can be supported. ........................................................................................................................................... ........................................................................................................................................... ........................................................................................................................................... ........................................................................................................................................... ........................................................................................................................................... ........................................................................................................................................... ..................................................................................................................................... [3] (iii) Suggest one advantage, other than cost, of farming GM salmon that produce increased quantities of growth hormone instead of farming non-GM salmon that are injected with recombinant growth hormone each week. ........................................................................................................................................... ........................................................................................................................................... ..................................................................................................................................... [1] [Total: 10]
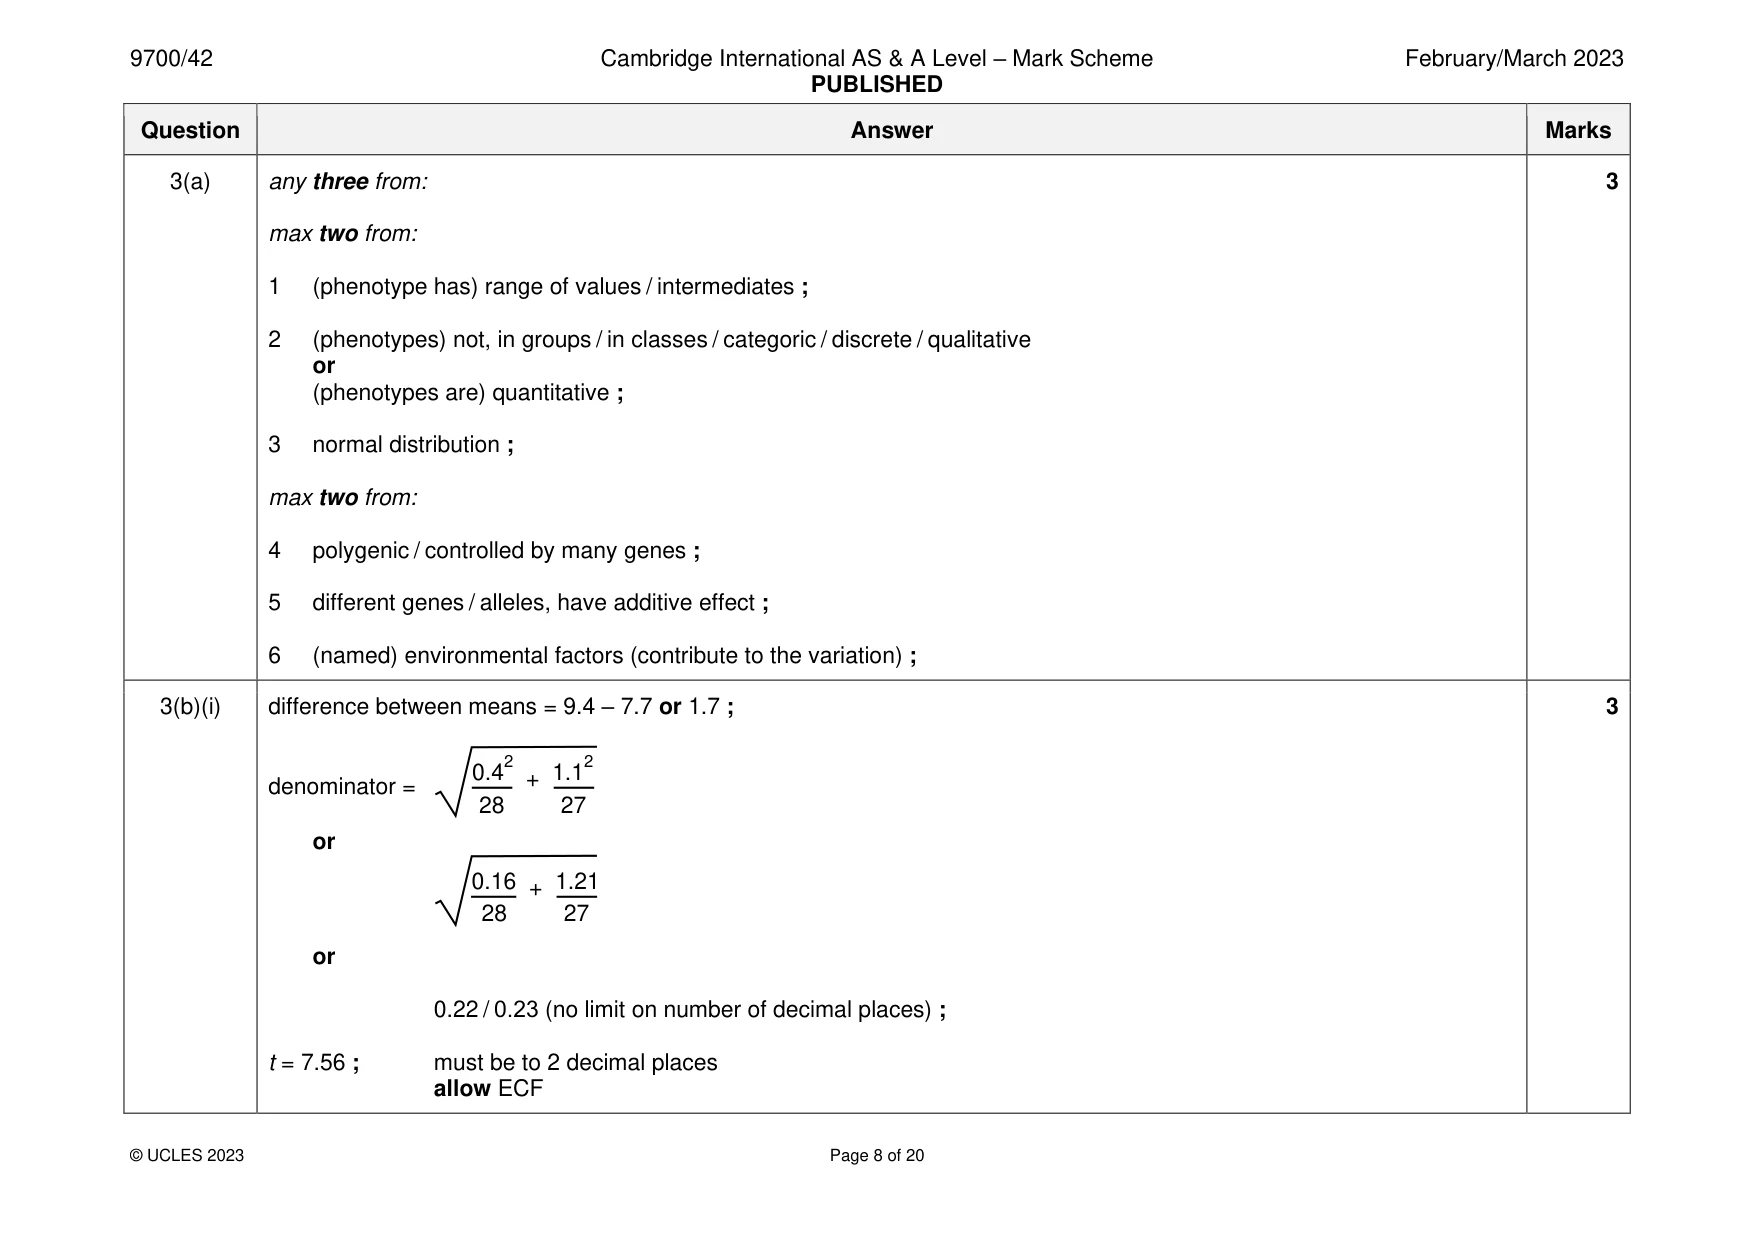
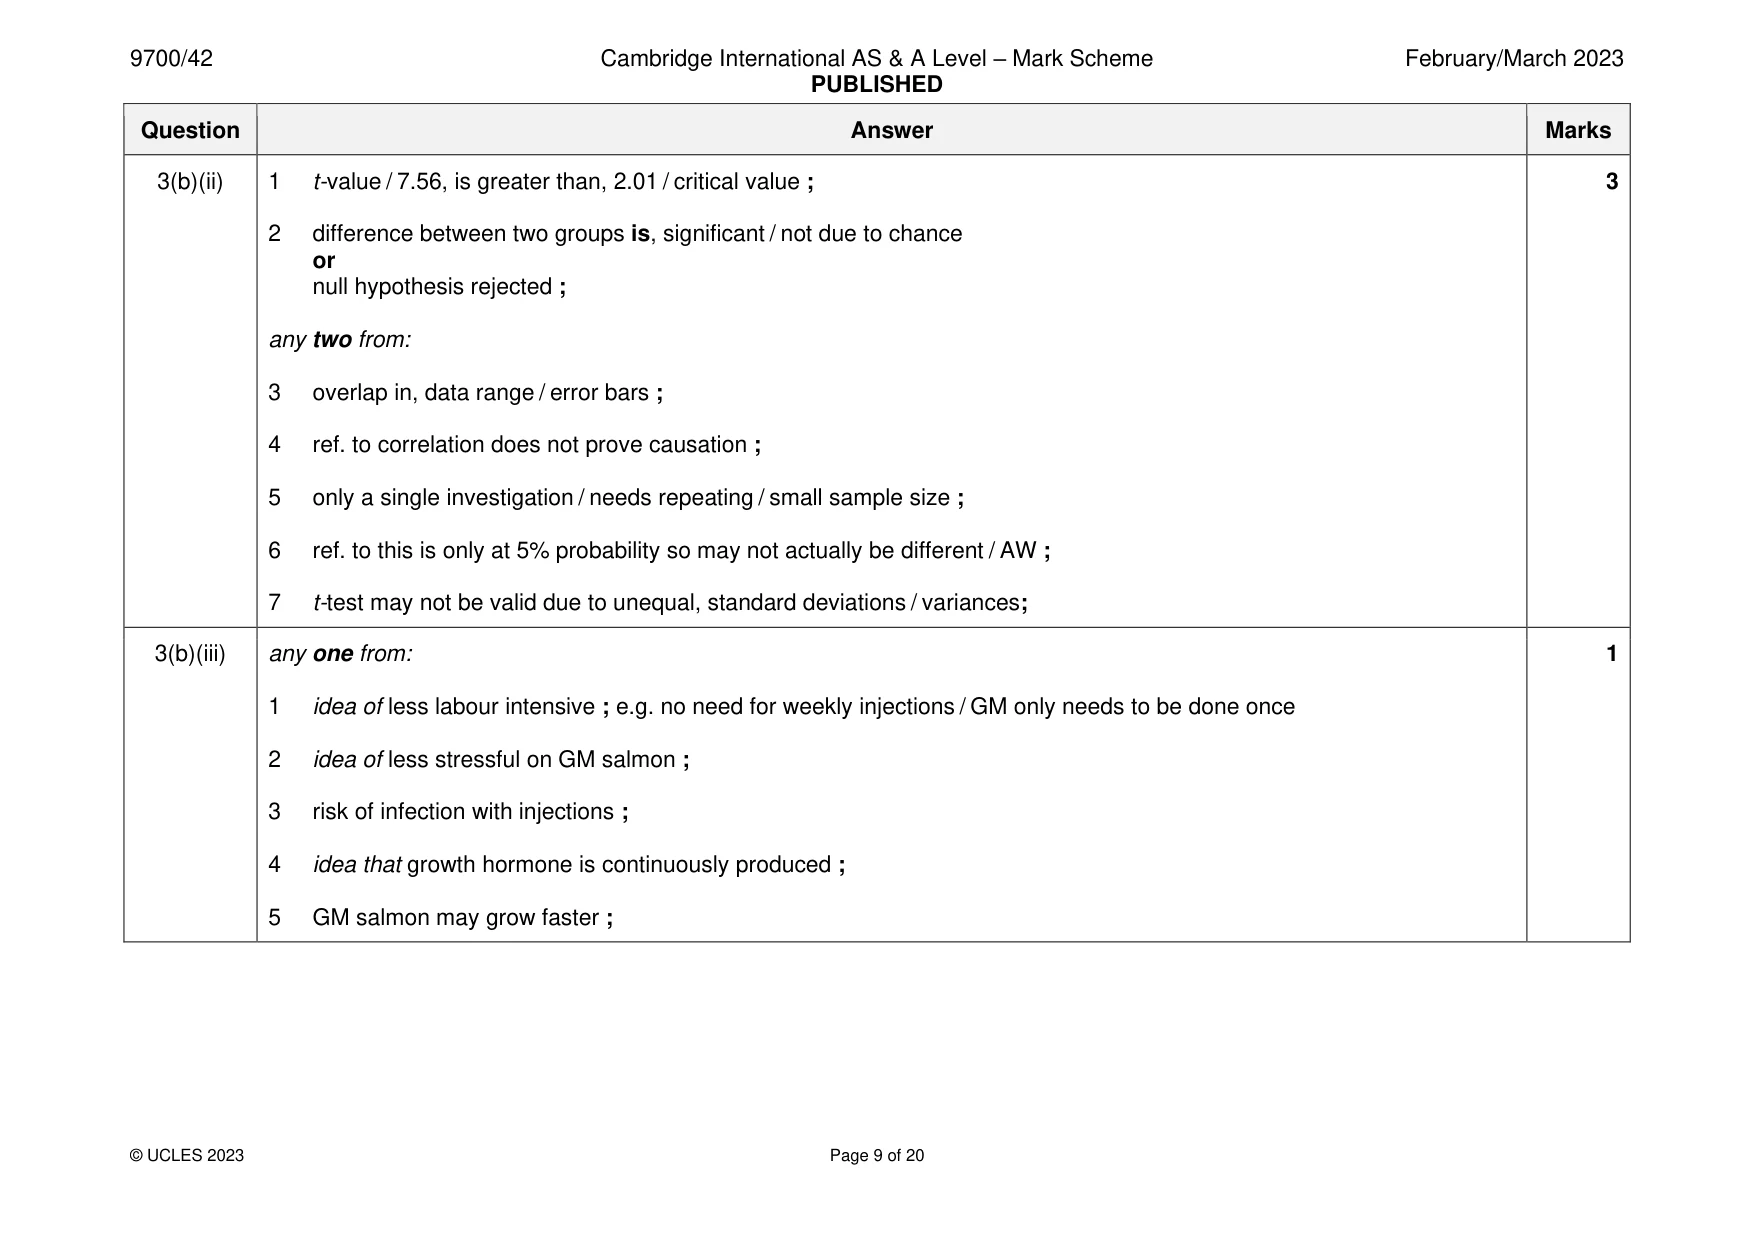
Mark scheme: 3(a) any three from: 3 max two from: 1 (phenotype has) range of values / intermediates ; 2 (phenotypes) not, in groups / in classes / categoric / discrete / qualitative or (phenotypes are) quantitative ; 3 normal distribution ; max two from: 4 polygenic / controlled by many genes ; 5 different genes / alleles, have additive effect ; 6 (named) environmental factors (contribute to the variation) ; 3(b)(i) difference between means = 9.4 – 7.7 or 1.7 ; 3 0.42 + 1.12 denominator = 28 27 or 0.16 + 1.21 28 27 or 0.22 / 0.23 (no limit on number of decimal places) ; t = 7.56 ; must be to 2 decimal places allow ECF 3(b)(ii) 1 t-value / 7.56, is greater than, 2.01 / critical value ; 3 2 difference between two groups is, significant / not due to chance or null hypothesis rejected ; any two from: 3 overlap in, data range / error bars ; 4 ref. to correlation does not prove causation ; 5 only a single investigation / needs repeating / small sample size ; 6 ref. to this is only at 5% probability so may not actually be different / AW ; 7 t-test may not be valid due to unequal, standard deviations / variances; 3(b)(iii) any one from: 1 1 idea of less labour intensive ; e.g. no need for weekly injections / GM only needs to be done once 2 idea of less stressful on GM salmon ; 3 risk of infection with injections ; 4 idea that growth hormone is continuously produced ; 5 GM salmon may grow faster ;
Q4 · Array comparative genome hybridisation (aCGH) is a technique involving the use of a…
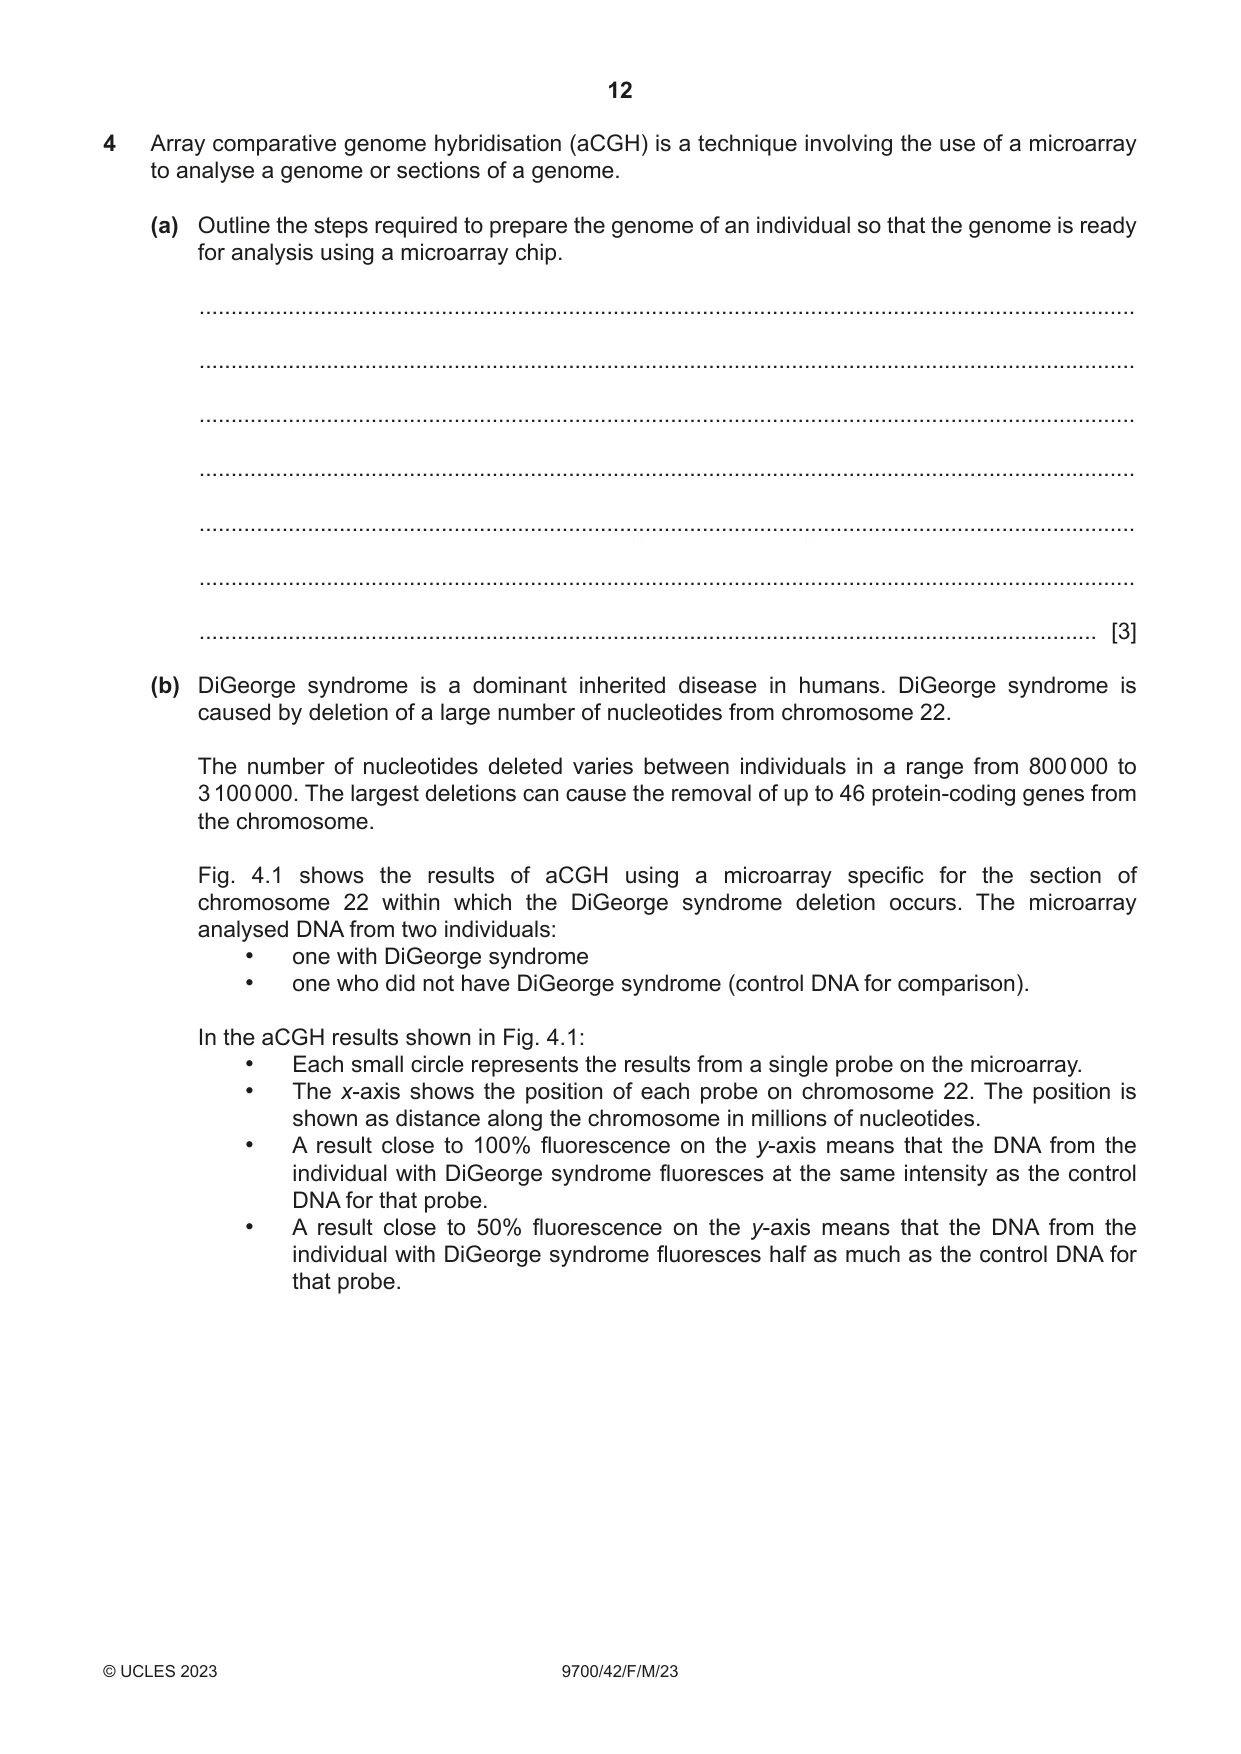
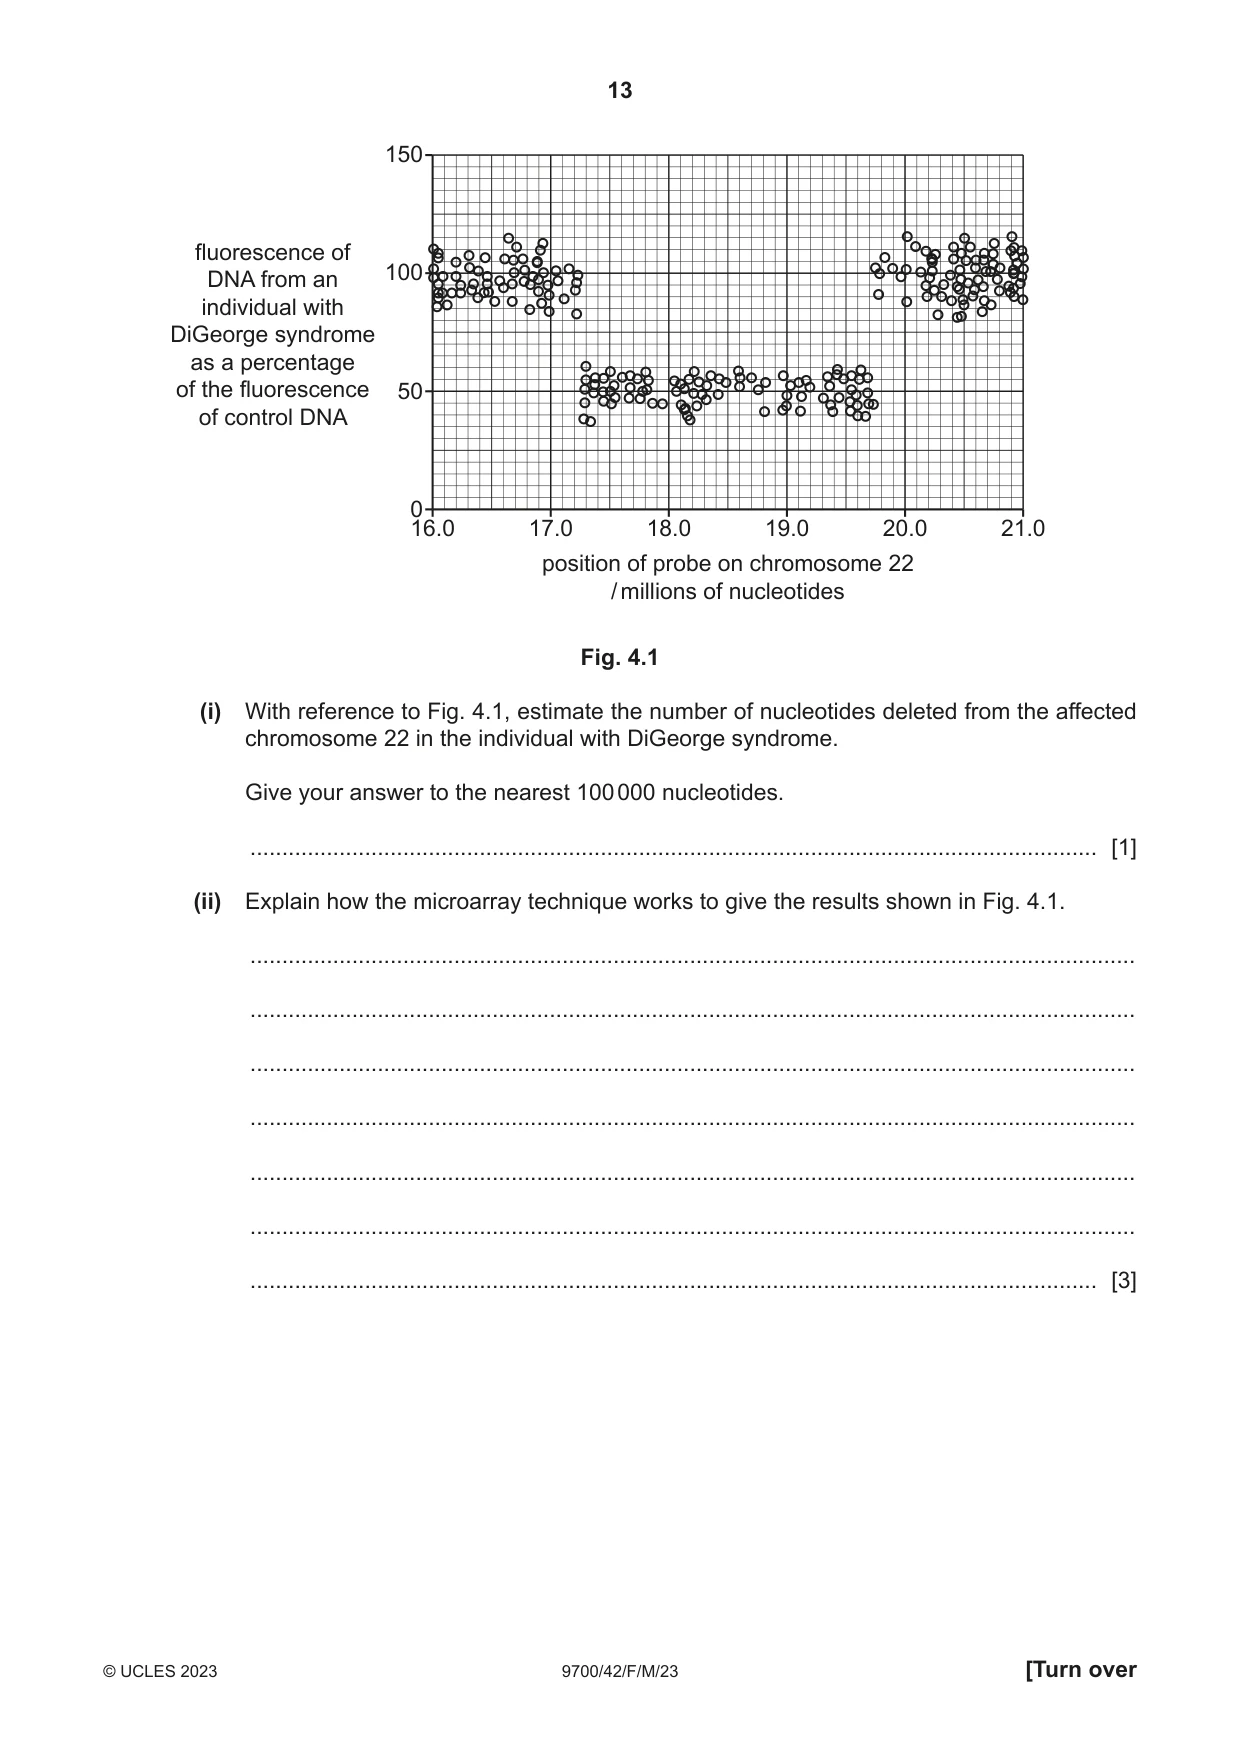
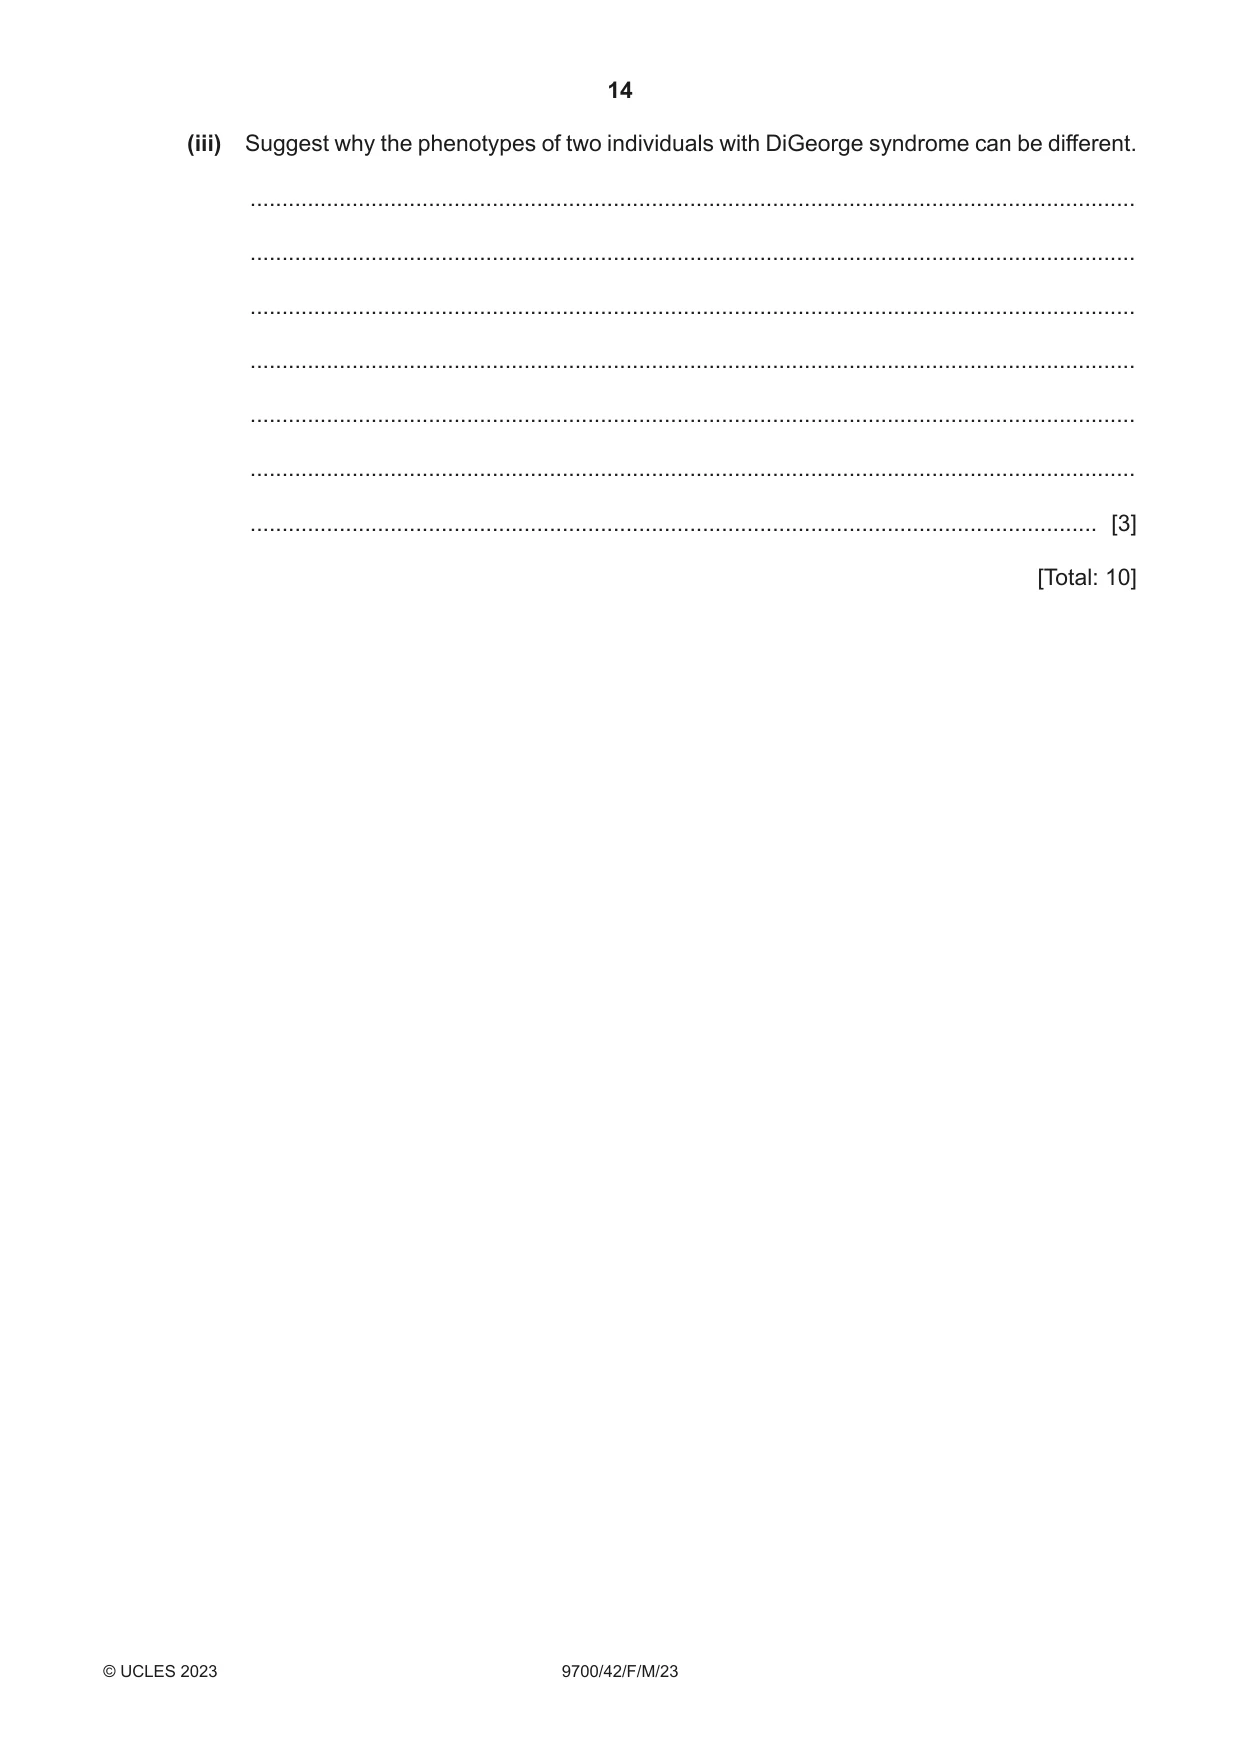
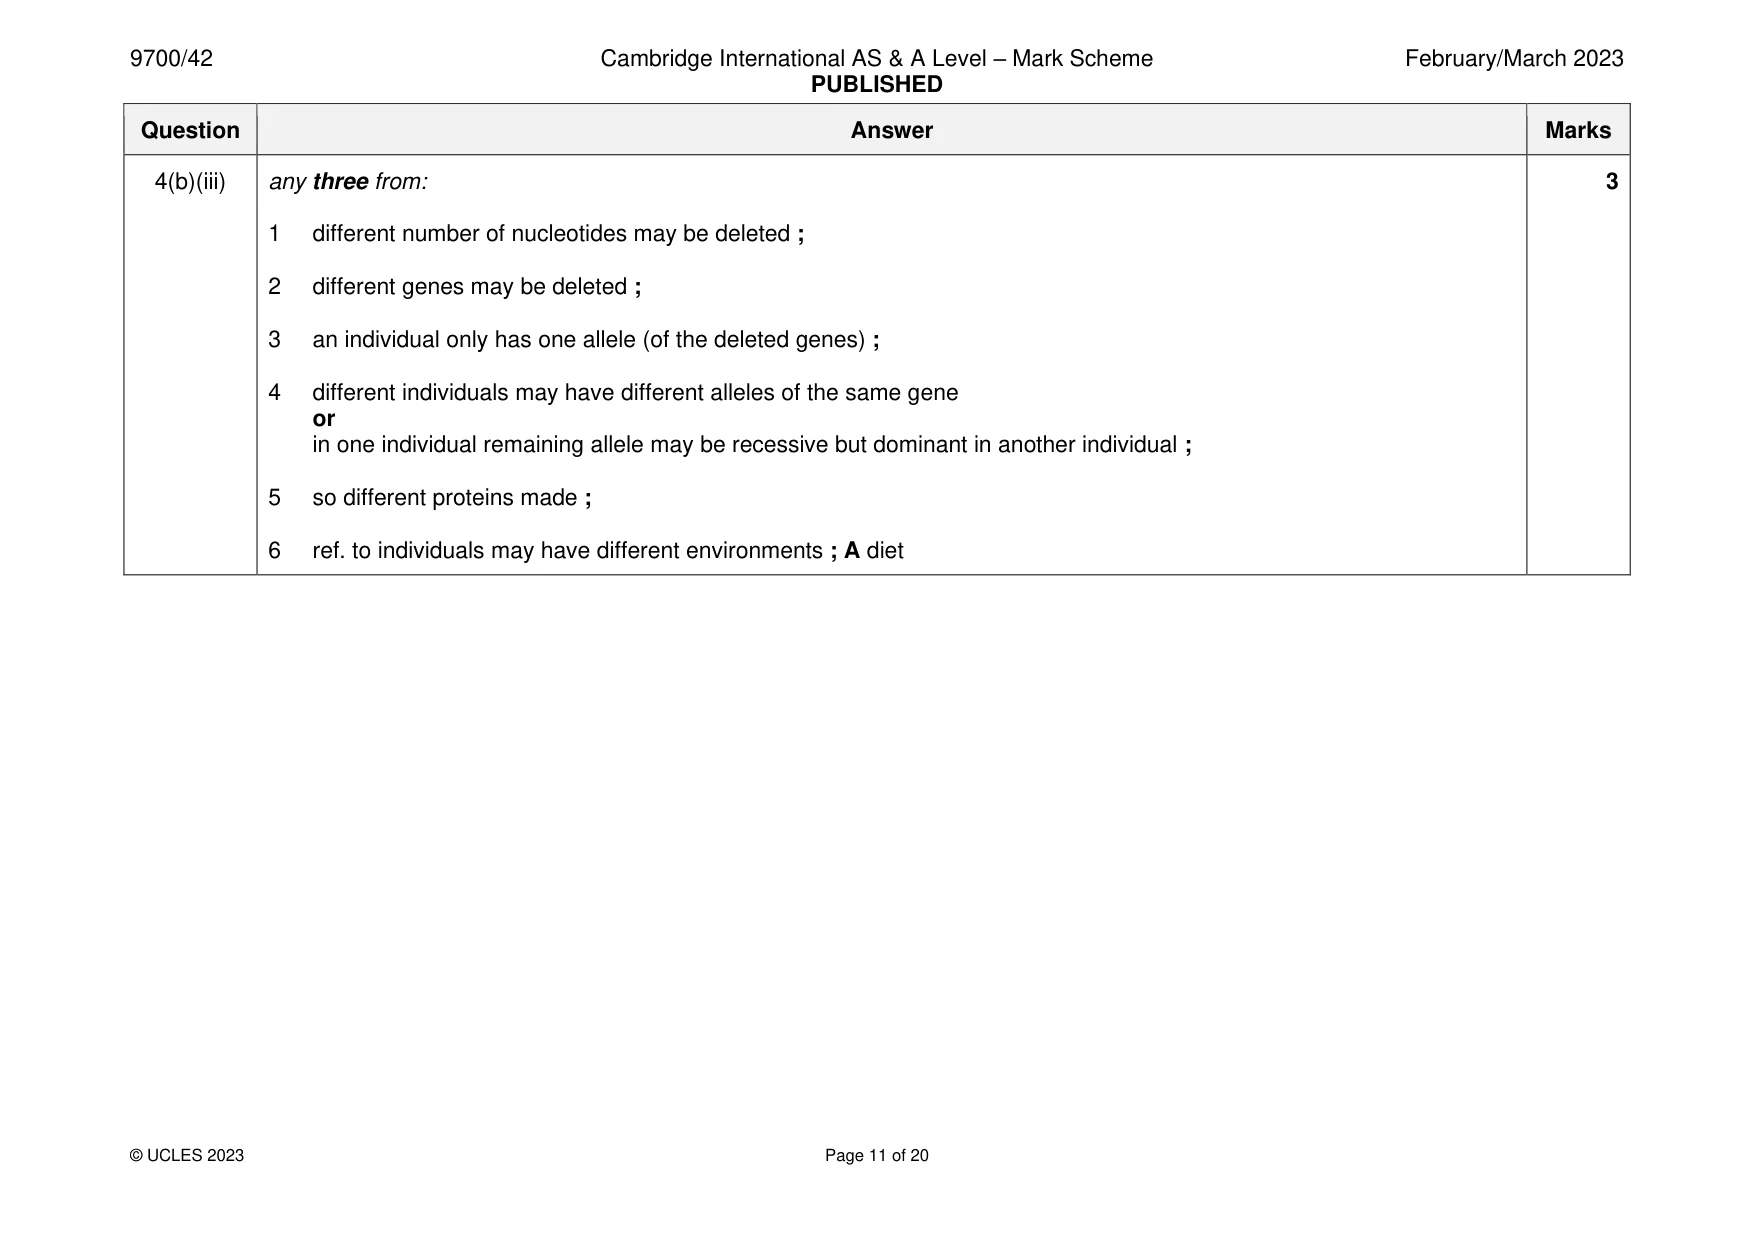
4 Array comparative genome hybridisation (aCGH) is a technique involving the use of a microarray to analyse a genome or sections of a genome. (a) Outline the steps required to prepare the genome of an individual so that the genome is ready for analysis using a microarray chip. ................................................................................................................................................... ................................................................................................................................................... ................................................................................................................................................... ................................................................................................................................................... ................................................................................................................................................... ................................................................................................................................................... ............................................................................................................................................. [3] (b) DiGeorge syndrome is a dominant inherited disease in humans. DiGeorge syndrome is caused by deletion of a large number of nucleotides from chromosome 22. The number of nucleotides deleted varies between individuals in a range from 800 000 to 3 100 000. The largest deletions can cause the removal of up to 46 protein-coding genes from the chromosome. Fig. 4.1 shows the results of aCGH using a microarray specific for the section of chromosome 22 within which the DiGeorge syndrome deletion occurs. The microarray analysed DNA from two individuals: • one with DiGeorge syndrome • one who did not have DiGeorge syndrome (control DNA for comparison). In the aCGH results shown in Fig. 4.1: • Each small circle represents the results from a single probe on the microarray. • The x-axis shows the position of each probe on chromosome 22. The position is shown as distance along the chromosome in millions of nucleotides. • A result close to 100% fluorescence on the y-axis means that the DNA from the individual with DiGeorge syndrome fluoresces at the same intensity as the control DNA for that probe. • A result close to 50% fluorescence on the y-axis means that the DNA from the individual with DiGeorge syndrome fluoresces half as much as the control DNA for that probe. 150 fluorescence of 100 DNA from an individual with DiGeorge syndrome as a percentage of the fluorescence 50 of control DNA 0 16.0 17.0 18.0 19.0 20.0 21.0 position of probe on chromosome 22 / millions of nucleotides Fig. 4.1 (i) With reference to Fig. 4.1, estimate the number of nucleotides deleted from the affected chromosome 22 in the individual with DiGeorge syndrome. Give your answer to the nearest 100 000 nucleotides. ..................................................................................................................................... [1] (ii) Explain how the microarray technique works to give the results shown in Fig. 4.1. ........................................................................................................................................... ........................................................................................................................................... ........................................................................................................................................... ........................................................................................................................................... ........................................................................................................................................... ........................................................................................................................................... ..................................................................................................................................... [3] (iii) Suggest why the phenotypes of two individuals with DiGeorge syndrome can be different. ........................................................................................................................................... ........................................................................................................................................... ........................................................................................................................................... ........................................................................................................................................... ........................................................................................................................................... ........................................................................................................................................... ..................................................................................................................................... [3] [Total: 10] Question 5 starts on page 16.
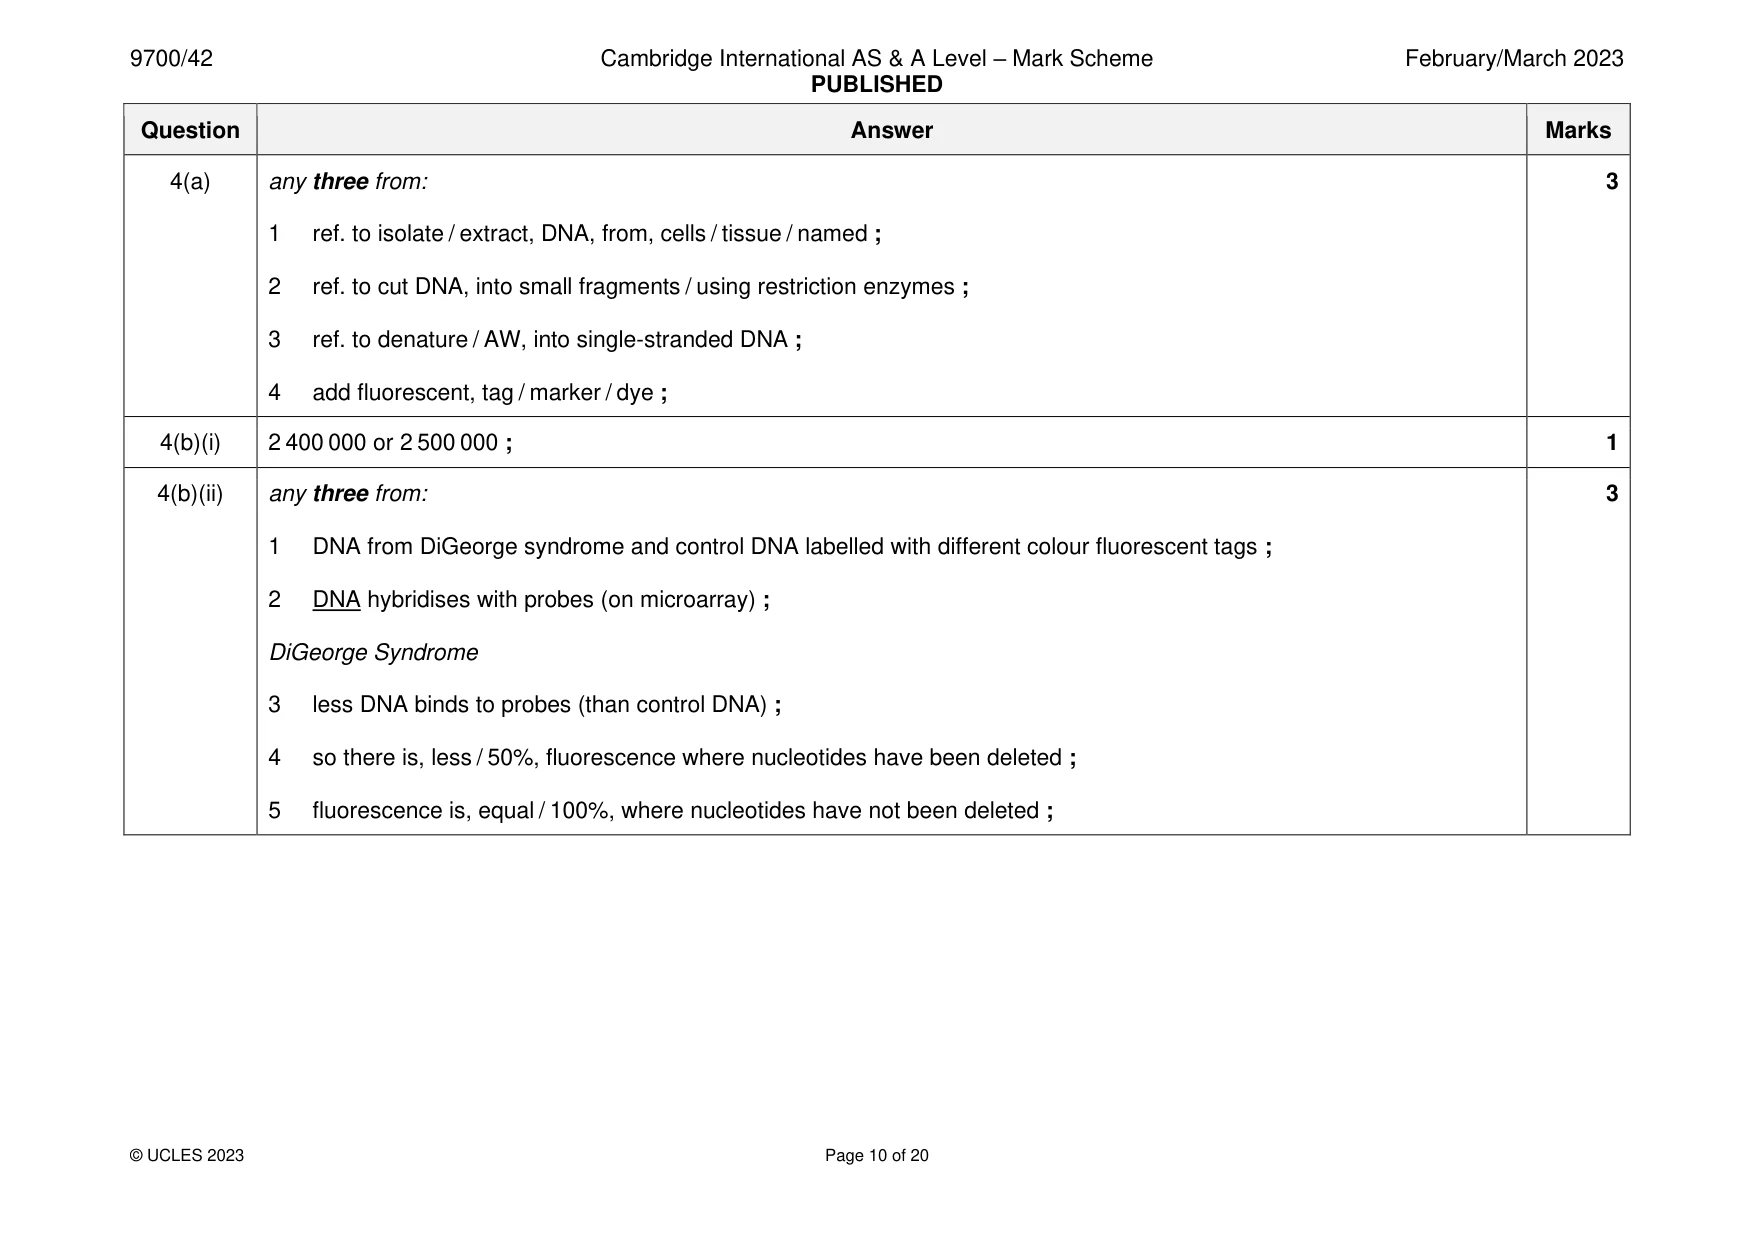
Mark scheme: 4(a) any three from: 3 1 ref. to isolate / extract, DNA, from, cells / tissue / named ; 2 ref. to cut DNA, into small fragments / using restriction enzymes ; 3 ref. to denature / AW, into single-stranded DNA ; 4 add fluorescent, tag / marker / dye ; 4(b)(i) 2 400 000 or 2 500 000 ; 1 4(b)(ii) any three from: 3 1 DNA from DiGeorge syndrome and control DNA labelled with different colour fluorescent tags ; 2 DNA hybridises with probes (on microarray) ; DiGeorge Syndrome 3 less DNA binds to probes (than control DNA) ; 4 so there is, less / 50%, fluorescence where nucleotides have been deleted ; 5 fluorescence is, equal / 100%, where nucleotides have not been deleted ; 4(b)(iii) any three from: 3 1 different number of nucleotides may be deleted ; 2 different genes may be deleted ; 3 an individual only has one allele (of the deleted genes) ; 4 different individuals may have different alleles of the same gene or in one individual remaining allele may be recessive but dominant in another individual ; 5 so different proteins made ; 6 ref. to individuals may have different environments ; A diet
Q5 · Meiosis is described as a reduction division because the number of chromosomes in the…
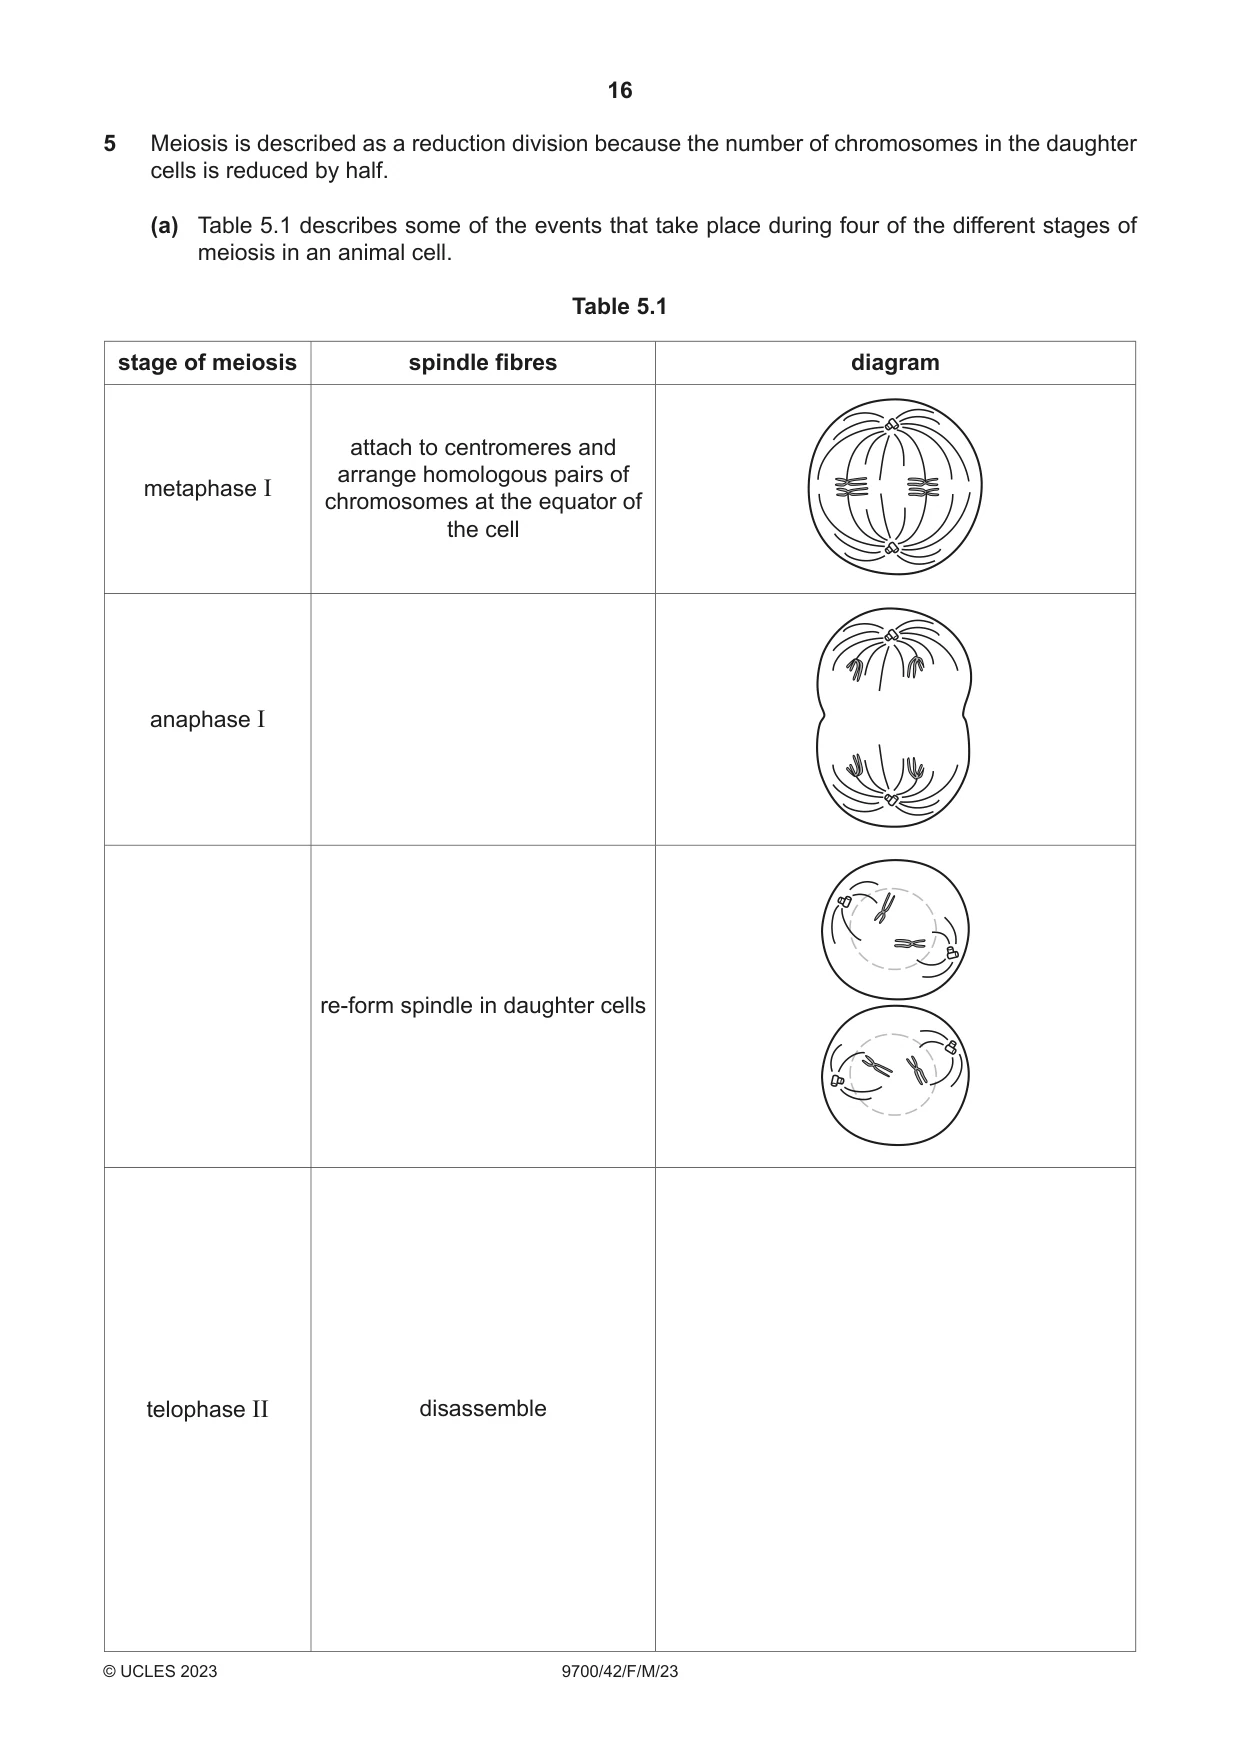
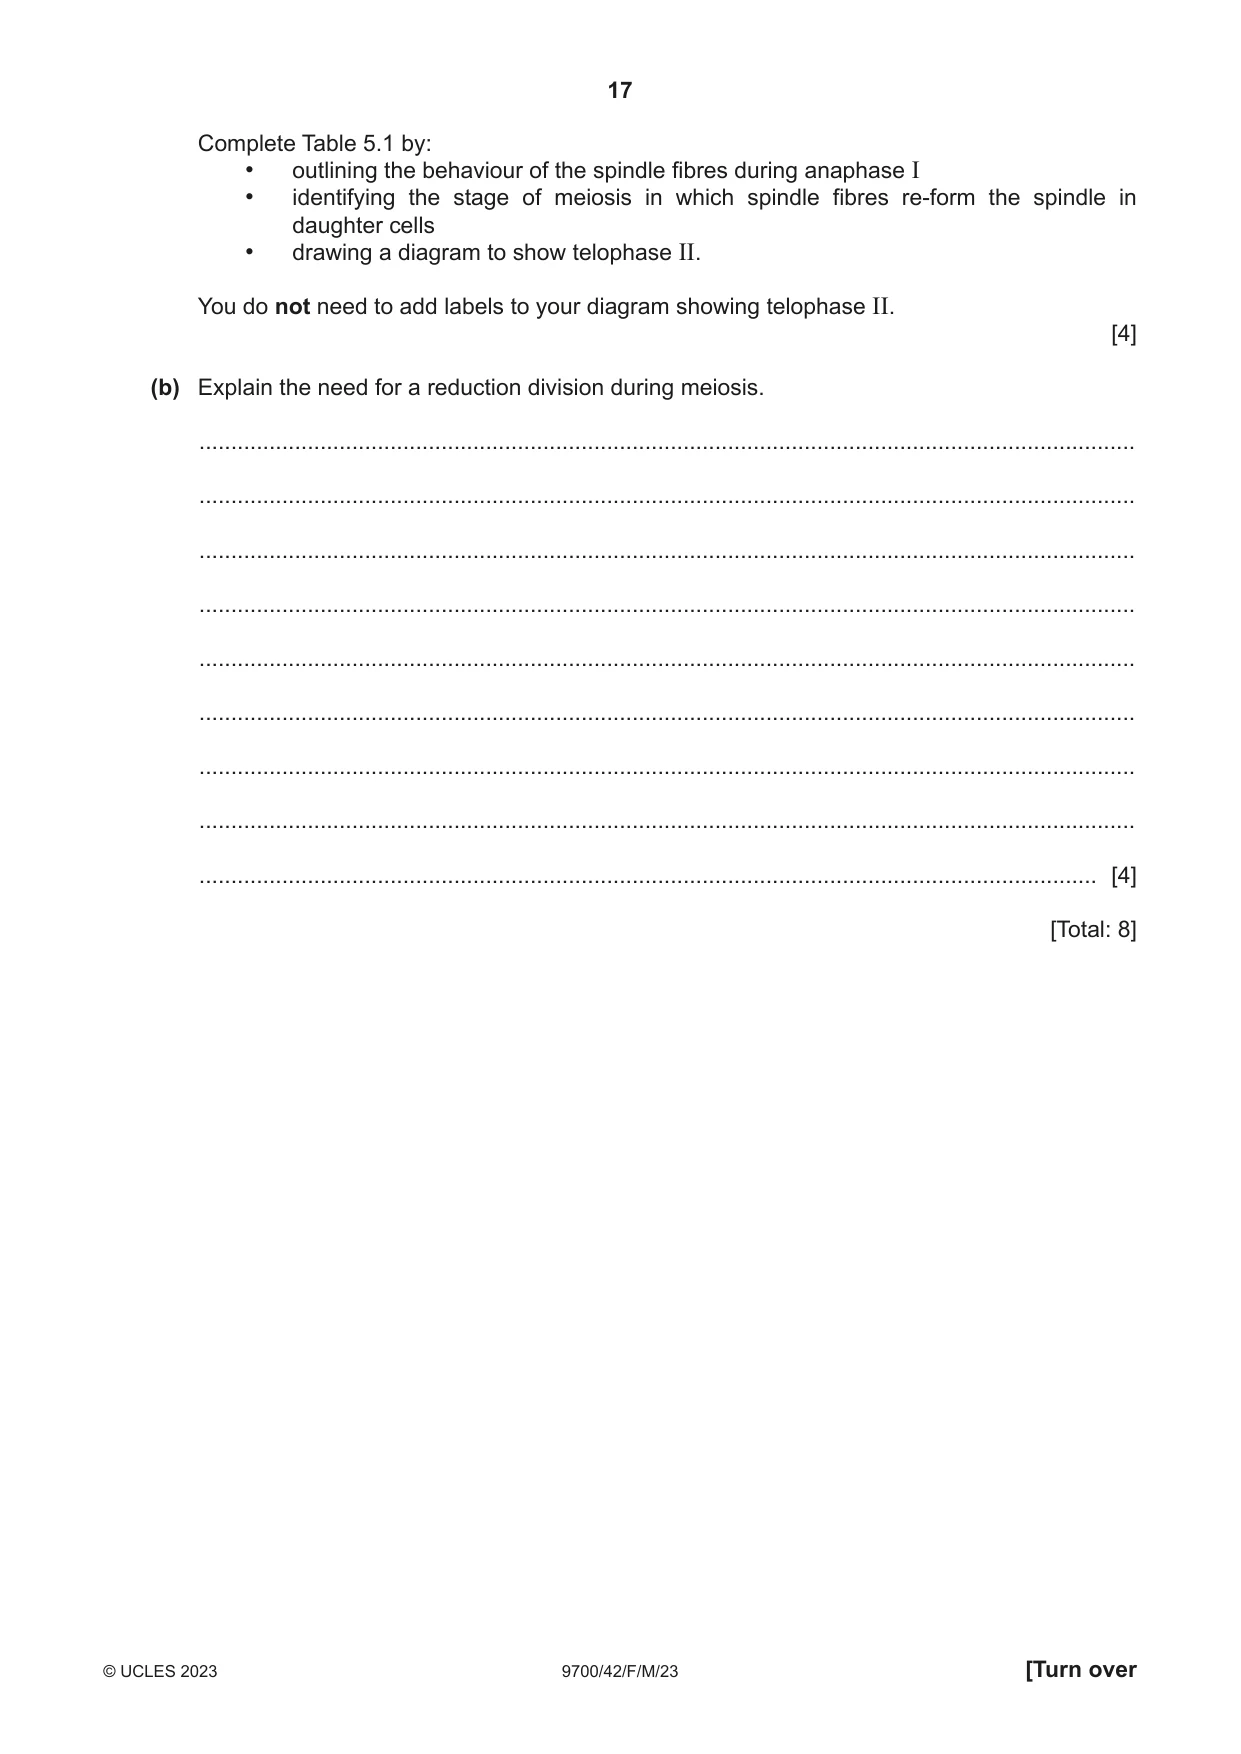
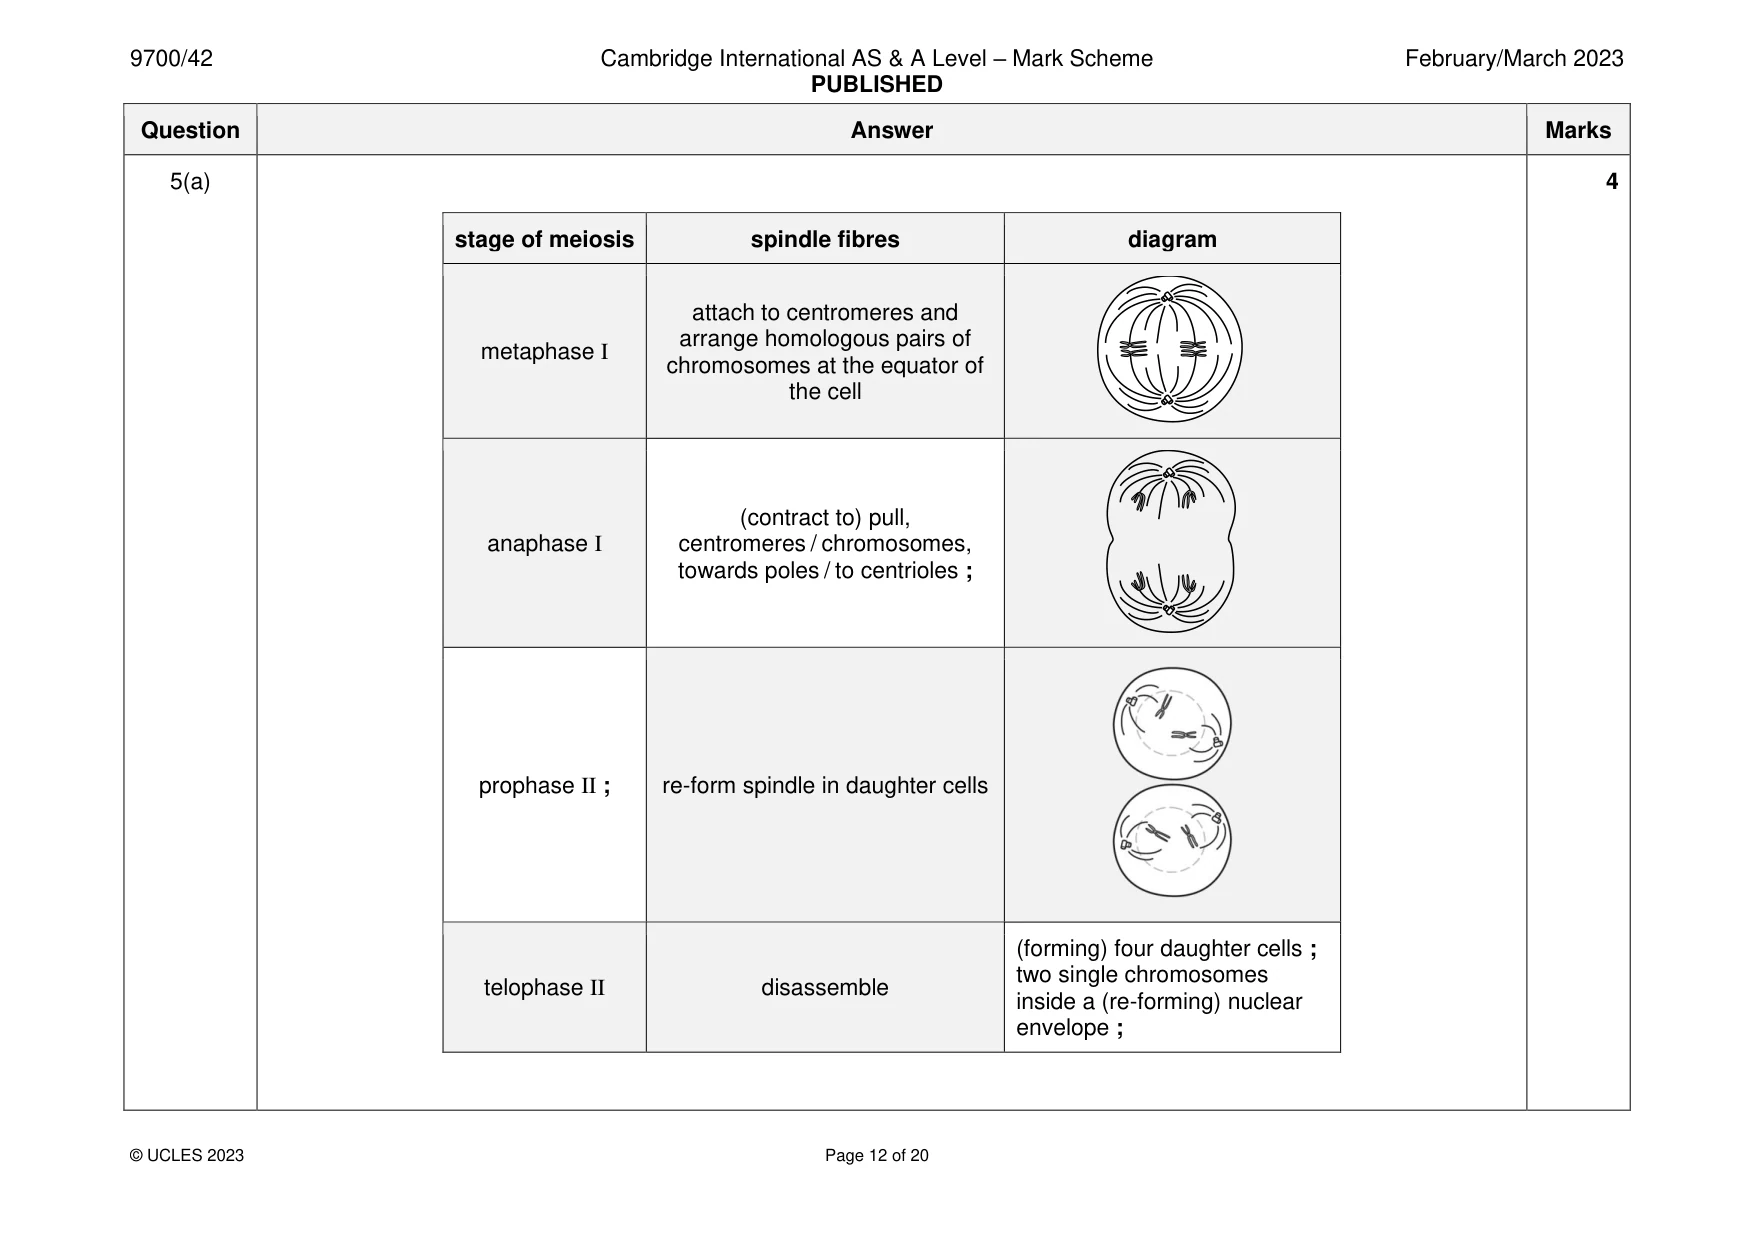
5 Meiosis is described as a reduction division because the number of chromosomes in the daughter cells is reduced by half. (a) Table 5.1 describes some of the events that take place during four of the different stages of meiosis in an animal cell. Table 5.1 stage of meiosis spindle fibres diagram attach to centromeres and arrange homologous pairs of metaphase I chromosomes at the equator of the cell anaphase I re-form spindle in daughter cells telophase II disassemble Complete Table 5.1 by: • outlining the behaviour of the spindle fibres during anaphase I • identifying the stage of meiosis in which spindle fibres re-form the spindle in daughter cells • drawing a diagram to show telophase II. You do not need to add labels to your diagram showing telophase II. [4] (b) Explain the need for a reduction division during meiosis. ................................................................................................................................................... ................................................................................................................................................... ................................................................................................................................................... ................................................................................................................................................... ................................................................................................................................................... ................................................................................................................................................... ................................................................................................................................................... ................................................................................................................................................... ............................................................................................................................................. [4] [Total: 8]
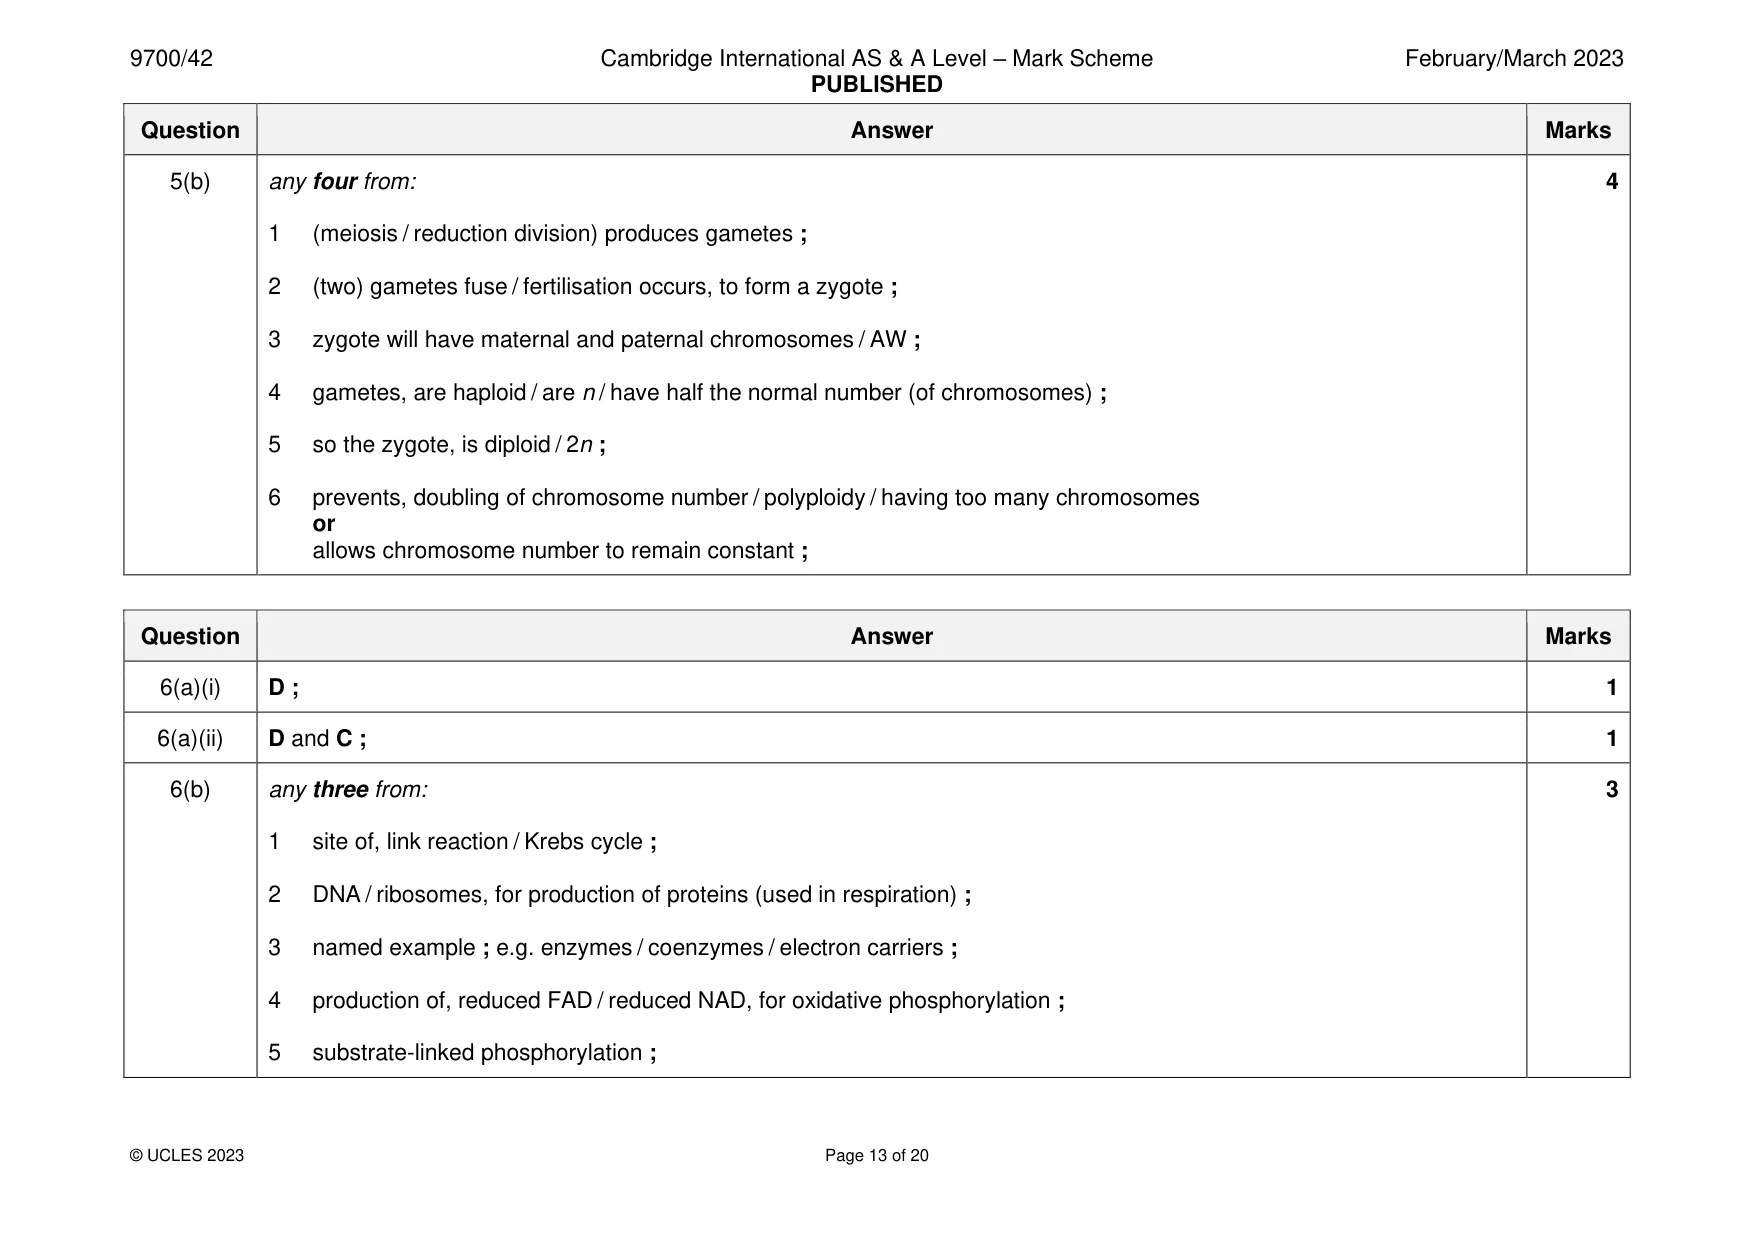
Mark scheme: 5(a) 4 stage of meiosis spindle fibres diagram attach to centromeres and arrange homologous pairs of metaphase I chromosomes at the equator of the cell (contract to) pull, anaphase I centromeres / chromosomes, towards poles / to centrioles ; prophase II ; re-form spindle in daughter cells (forming) four daughter cells ; two single chromosomes telophase II disassemble inside a (re-forming) nuclear envelope ; 5(b) any four from: 4 1 (meiosis / reduction division) produces gametes ; 2 (two) gametes fuse / fertilisation occurs, to form a zygote ; 3 zygote will have maternal and paternal chromosomes / AW ; 4 gametes, are haploid / are n / have half the normal number (of chromosomes) ; 5 so the zygote, is diploid / 2n ; 6 prevents, doubling of chromosome number / polyploidy / having too many chromosomes or allows chromosome number to remain constant ;
Q6 · A diagram of a section through a mitochondrion
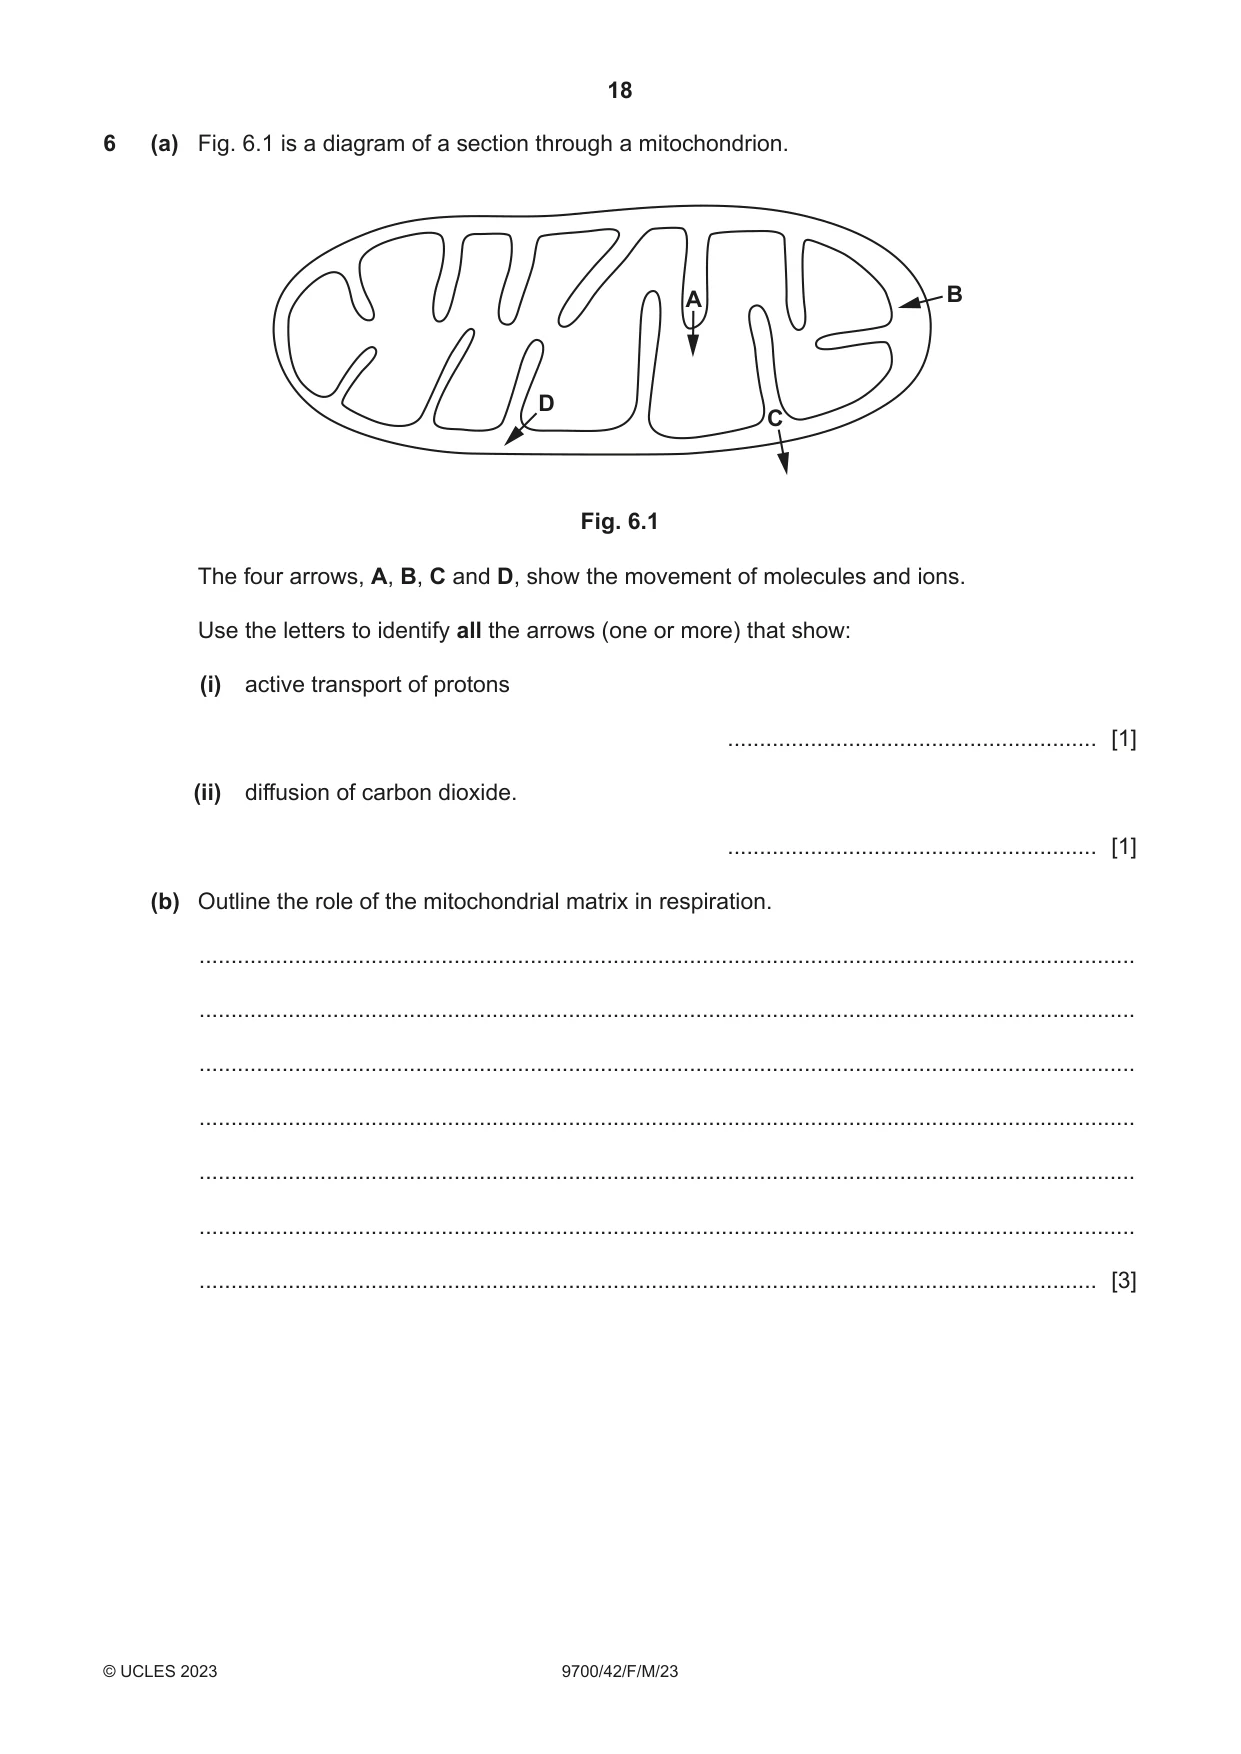
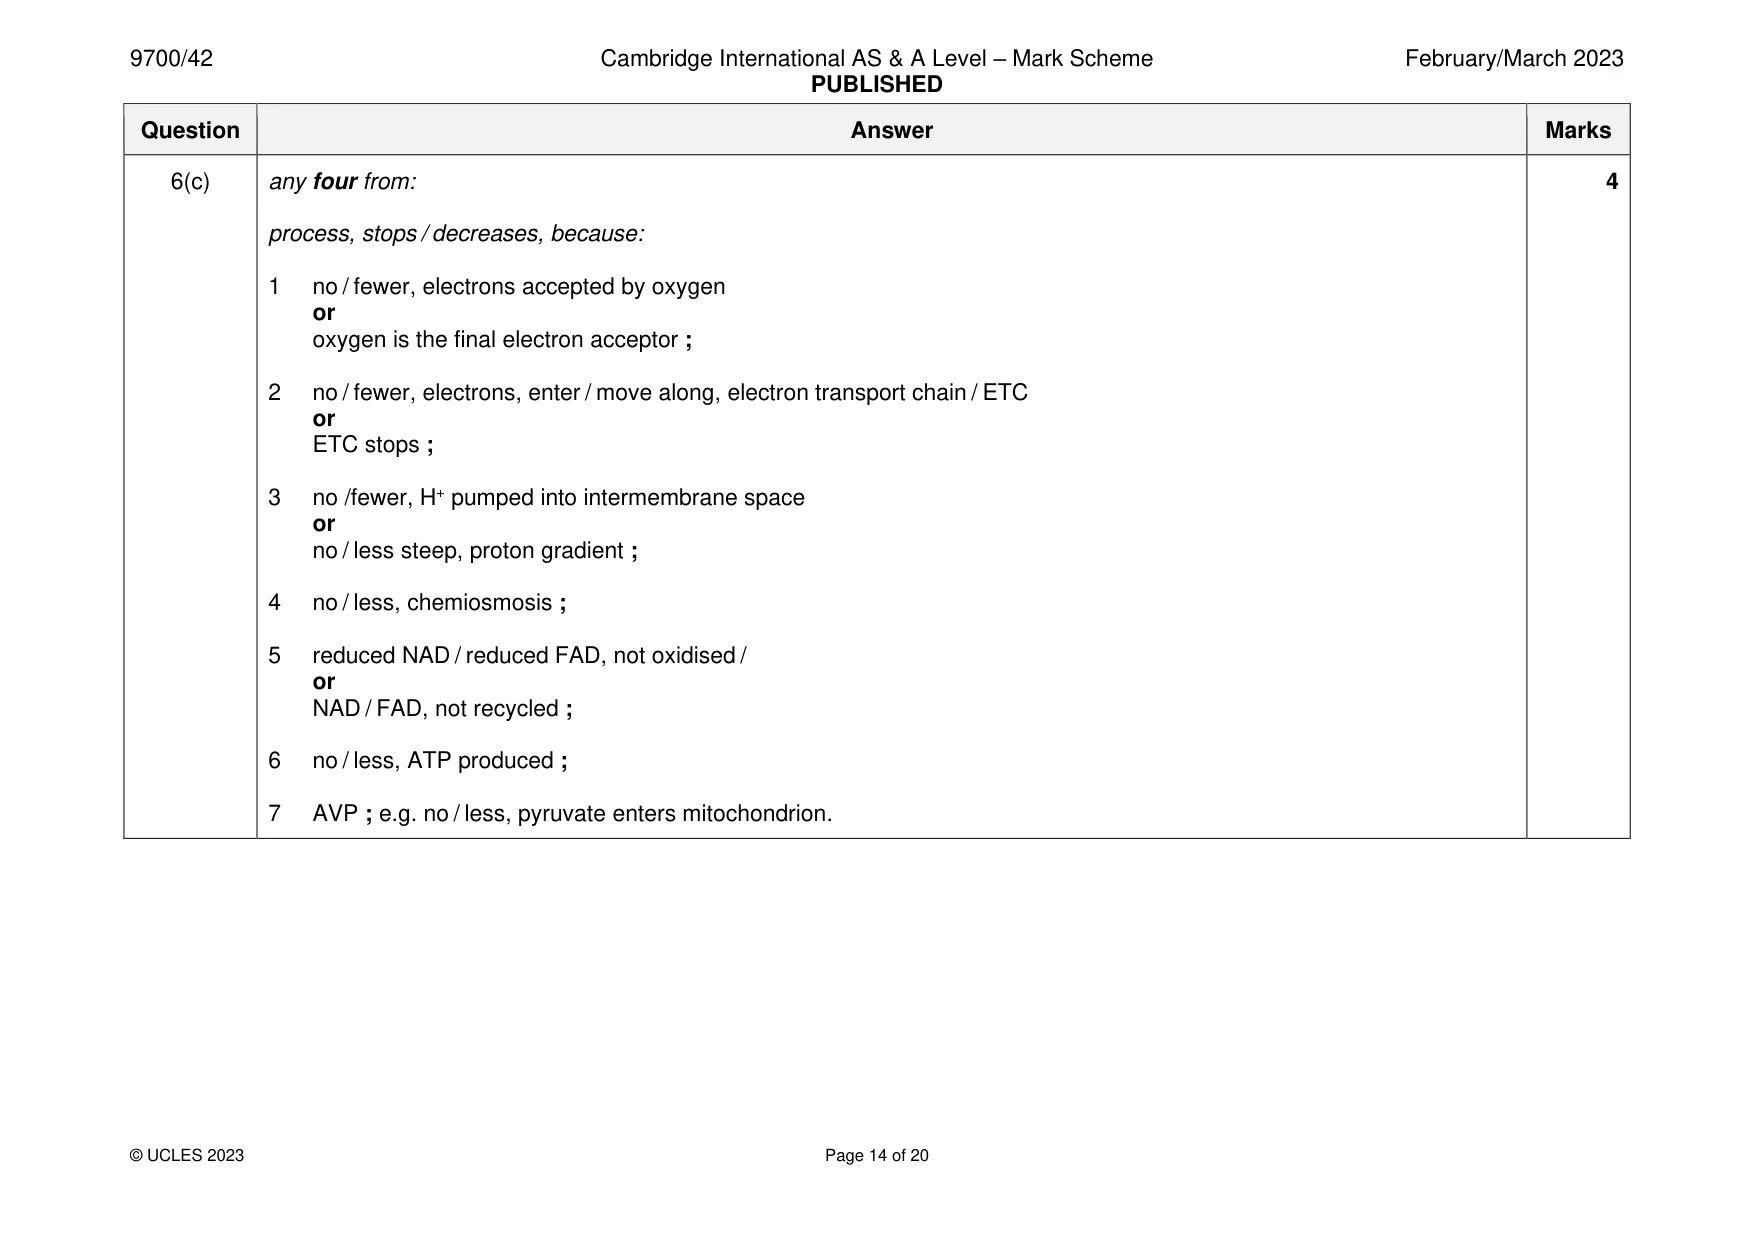
6 (a) Fig. 6.1 is a diagram of a section through a mitochondrion. A B D C Fig. 6.1 The four arrows, A, B, C and D, show the movement of molecules and ions. Use the letters to identify all the arrows (one or more) that show: (i) active transport of protons .......................................................... [1] (ii) diffusion of carbon dioxide. .......................................................... [1] (b) Outline the role of the mitochondrial matrix in respiration. ................................................................................................................................................... ................................................................................................................................................... ................................................................................................................................................... ................................................................................................................................................... ................................................................................................................................................... ................................................................................................................................................... ............................................................................................................................................. [3] (c) Explain how a lack of oxygen affects oxidative phosphorylation. ................................................................................................................................................... ................................................................................................................................................... ................................................................................................................................................... ................................................................................................................................................... ................................................................................................................................................... ................................................................................................................................................... ................................................................................................................................................... ................................................................................................................................................... ............................................................................................................................................. [4] [Total: 9]
Mark scheme: 6(a)(i) D ; 1 6(a)(ii) D and C ; 1 6(b) any three from: 3 1 site of, link reaction / Krebs cycle ; 2 DNA / ribosomes, for production of proteins (used in respiration) ; 3 named example ; e.g. enzymes / coenzymes / electron carriers ; 4 production of, reduced FAD / reduced NAD, for oxidative phosphorylation ; 5 substrate-linked phosphorylation ; 6(c) any four from: 4 process, stops / decreases, because: 1 no / fewer, electrons accepted by oxygen or oxygen is the final electron acceptor ; 2 no / fewer, electrons, enter / move along, electron transport chain / ETC or ETC stops ; 3 no /fewer, H+ pumped into intermembrane space or no / less steep, proton gradient ; 4 no / less, chemiosmosis ; 5 reduced NAD / reduced FAD, not oxidised / or NAD / FAD, not recycled ; 6 no / less, ATP produced ; 7 AVP ; e.g. no / less, pyruvate enters mitochondrion.
Q7 · A diagram representing a synapse between a chemoreceptor cell from a human taste bud and…
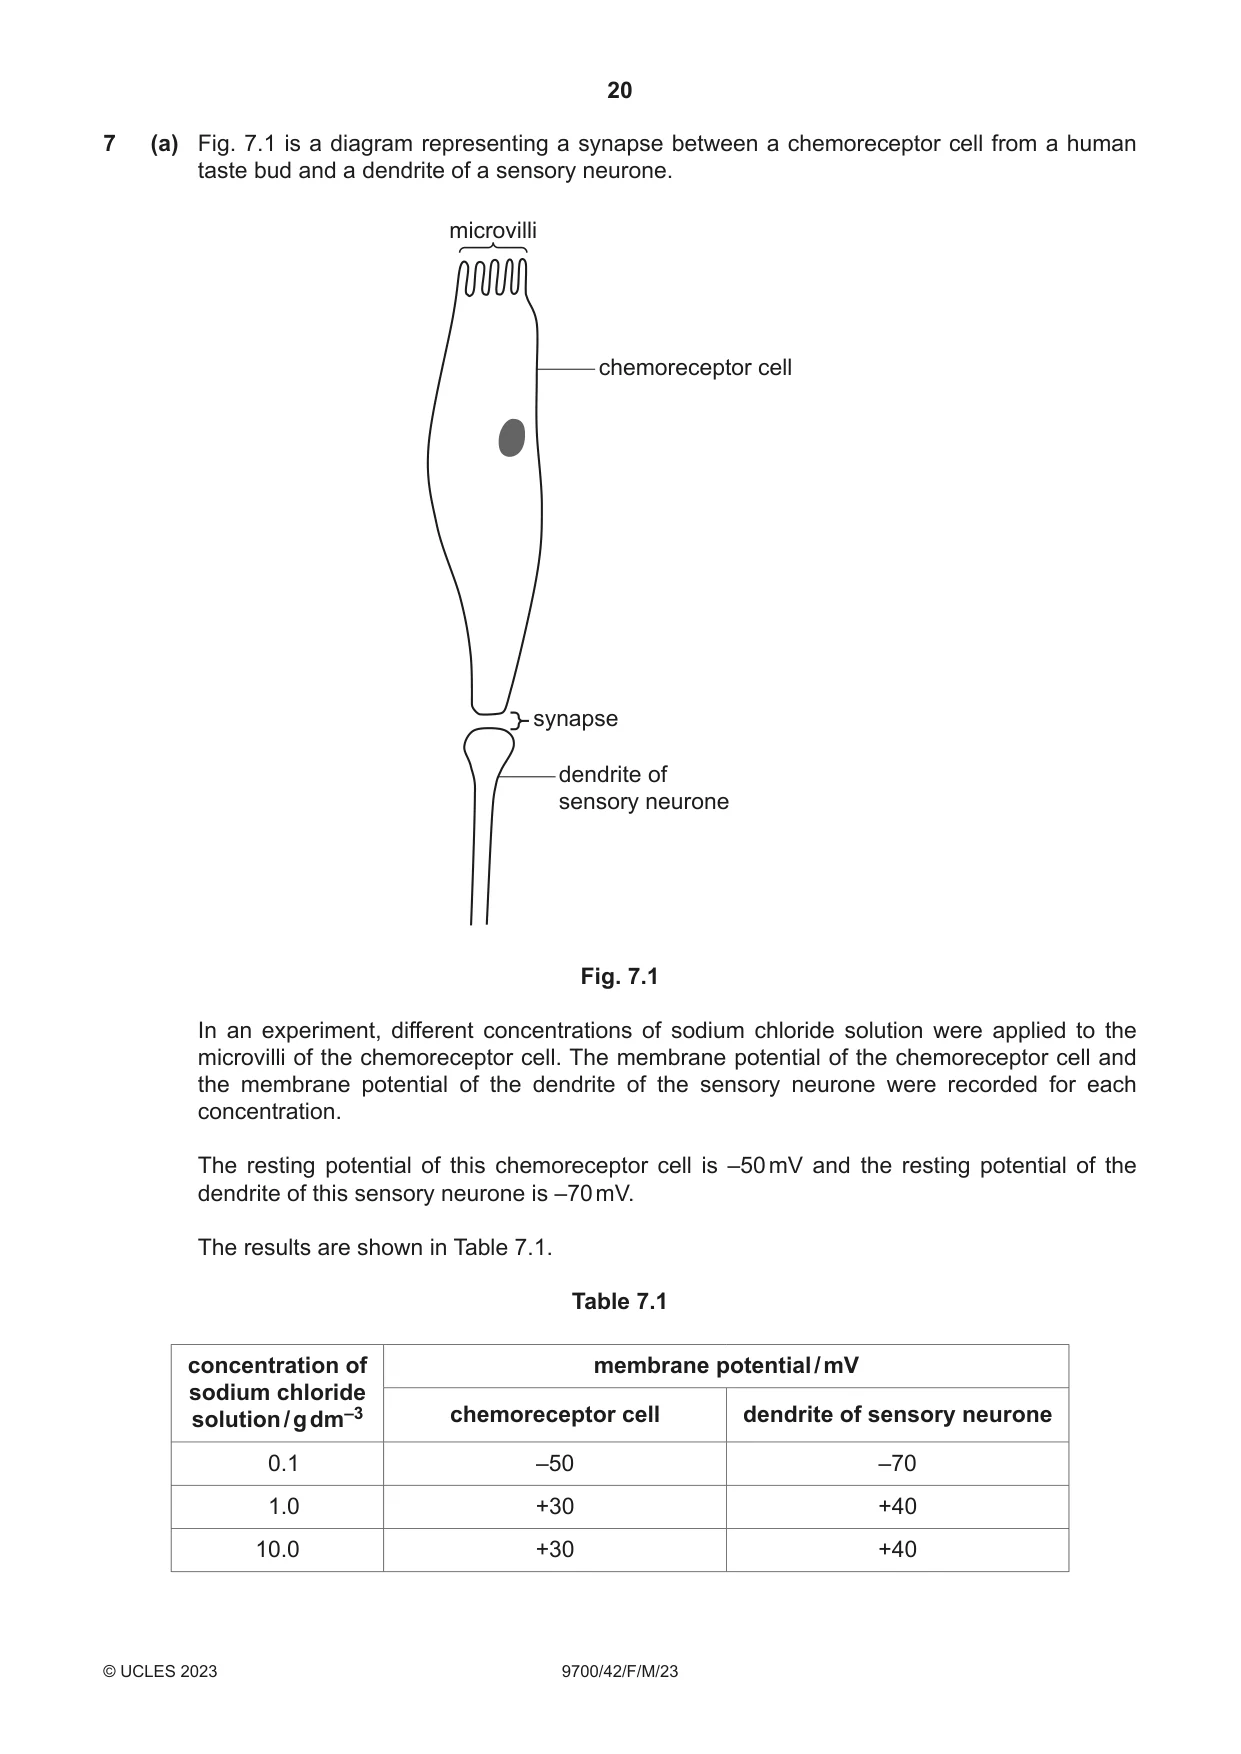
7 (a) Fig. 7.1 is a diagram representing a synapse between a chemoreceptor cell from a human taste bud and a dendrite of a sensory neurone. microvilli chemoreceptor cell synapse dendrite of sensory neurone Fig. 7.1 In an experiment, different concentrations of sodium chloride solution were applied to the microvilli of the chemoreceptor cell. The membrane potential of the chemoreceptor cell and the membrane potential of the dendrite of the sensory neurone were recorded for each concentration. The resting potential of this chemoreceptor cell is –50 mV and the resting potential of the dendrite of this sensory neurone is –70 mV. The results are shown in Table 7.1. Table 7.1 concentration of membrane potential / mV sodium chloride solution / g dm–3 chemoreceptor cell dendrite of sensory neurone 0.1 –50 –70 1.0 +30 +40 10.0 +30 +40 Explain the results shown in Table 7.1. ................................................................................................................................................... ................................................................................................................................................... ................................................................................................................................................... ................................................................................................................................................... ................................................................................................................................................... ................................................................................................................................................... ................................................................................................................................................... ................................................................................................................................................... ...............................................................................................................................................[4] (b) Describe the differences in structure and function between sensory neurones and motor neurones. ................................................................................................................................................... ................................................................................................................................................... ................................................................................................................................................... ................................................................................................................................................... ................................................................................................................................................... ................................................................................................................................................... ............................................................................................................................................. [3] [Total: 7]
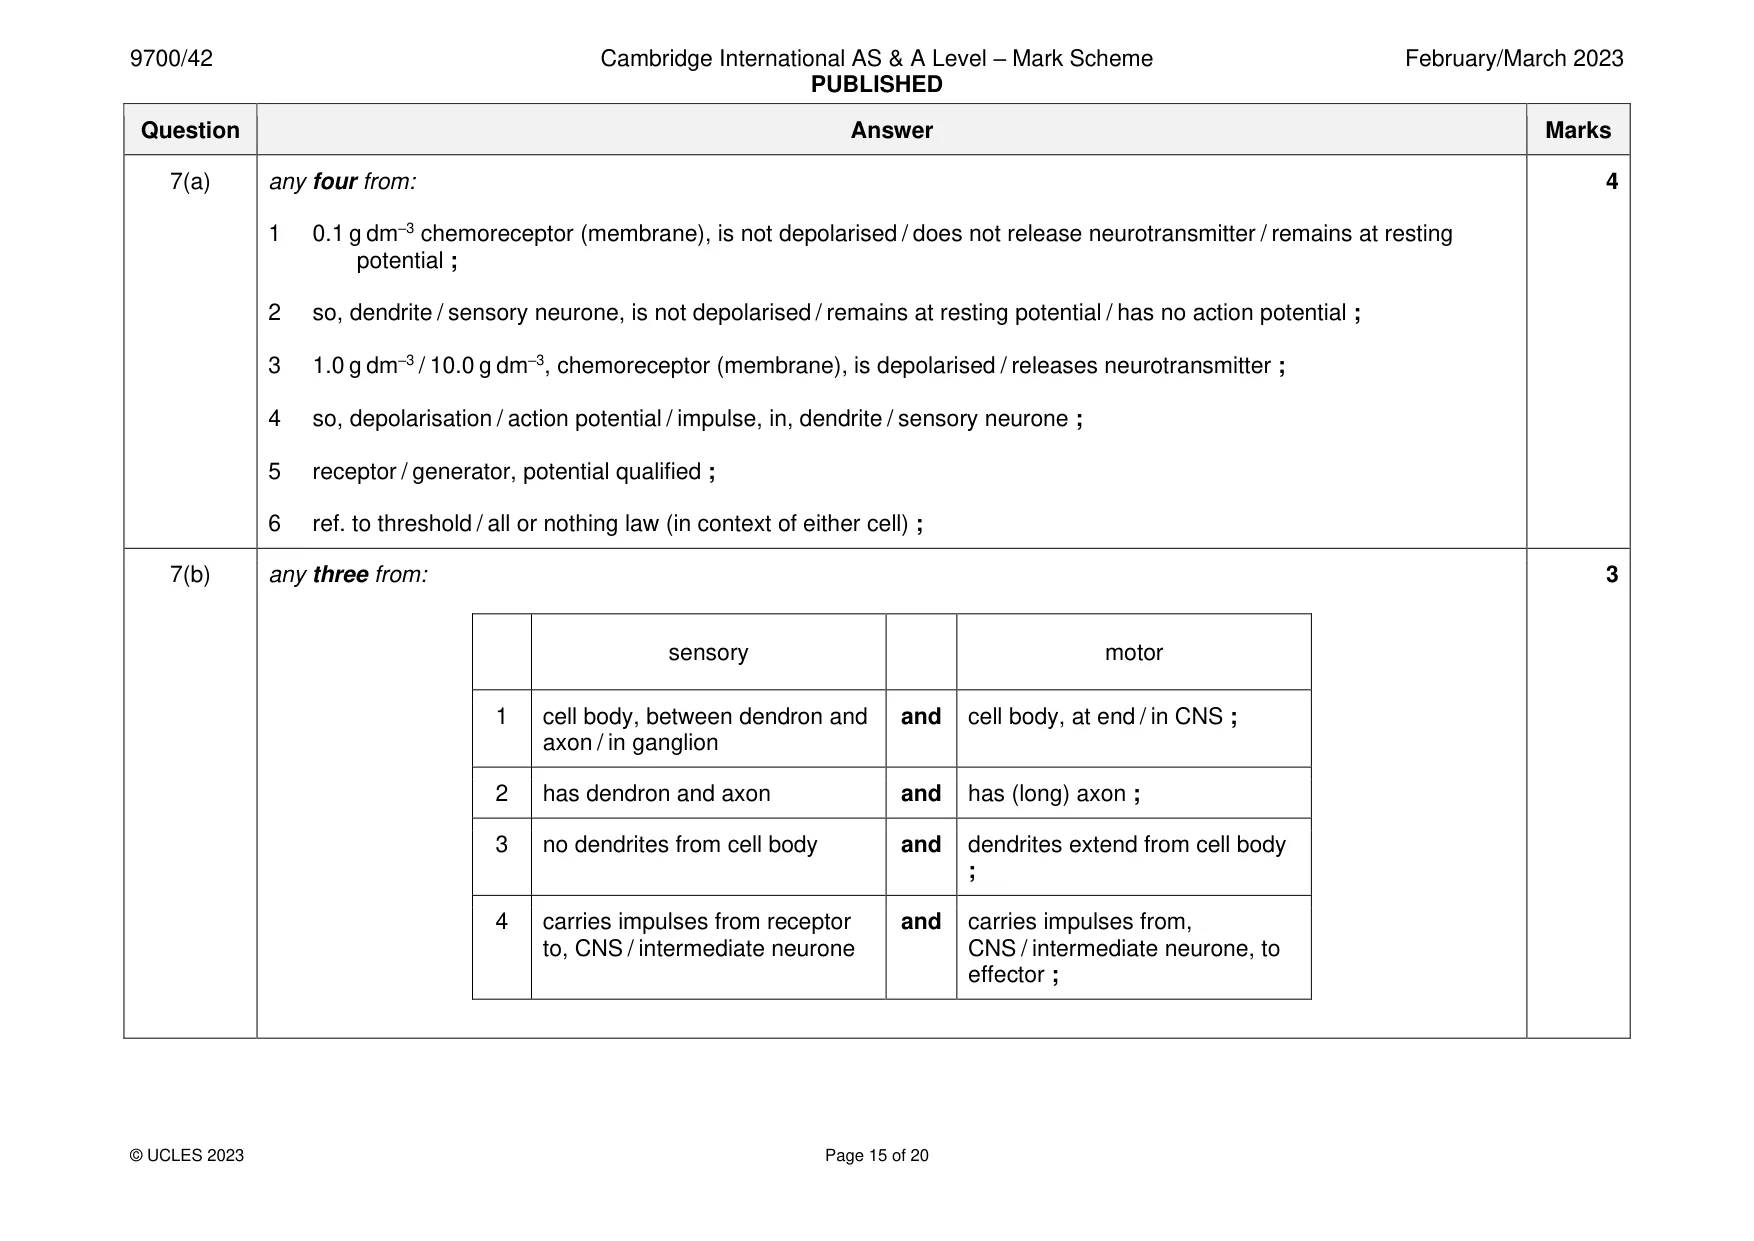
Mark scheme: 7(a) any four from: 4 1 0.1 g dm–3 chemoreceptor (membrane), is not depolarised / does not release neurotransmitter / remains at resting potential ; 2 so, dendrite / sensory neurone, is not depolarised / remains at resting potential / has no action potential ; 3 1.0 g dm–3 / 10.0 g dm–3, chemoreceptor (membrane), is depolarised / releases neurotransmitter ; 4 so, depolarisation / action potential / impulse, in, dendrite / sensory neurone ; 5 receptor / generator, potential qualified ; 6 ref. to threshold / all or nothing law (in context of either cell) ; 7(b) any three from: 3 sensory motor 1 cell body, between dendron and and cell body, at end / in CNS ; axon / in ganglion 2 has dendron and axon and has (long) axon ; 3 no dendrites from cell body and dendrites extend from cell body ; 4 carries impulses from receptor and carries impulses from, to, CNS / intermediate neurone CNS / intermediate neurone, to effector ;
Q8 · Describe the functions of the internal membranes of the chloroplast in photosynthesis
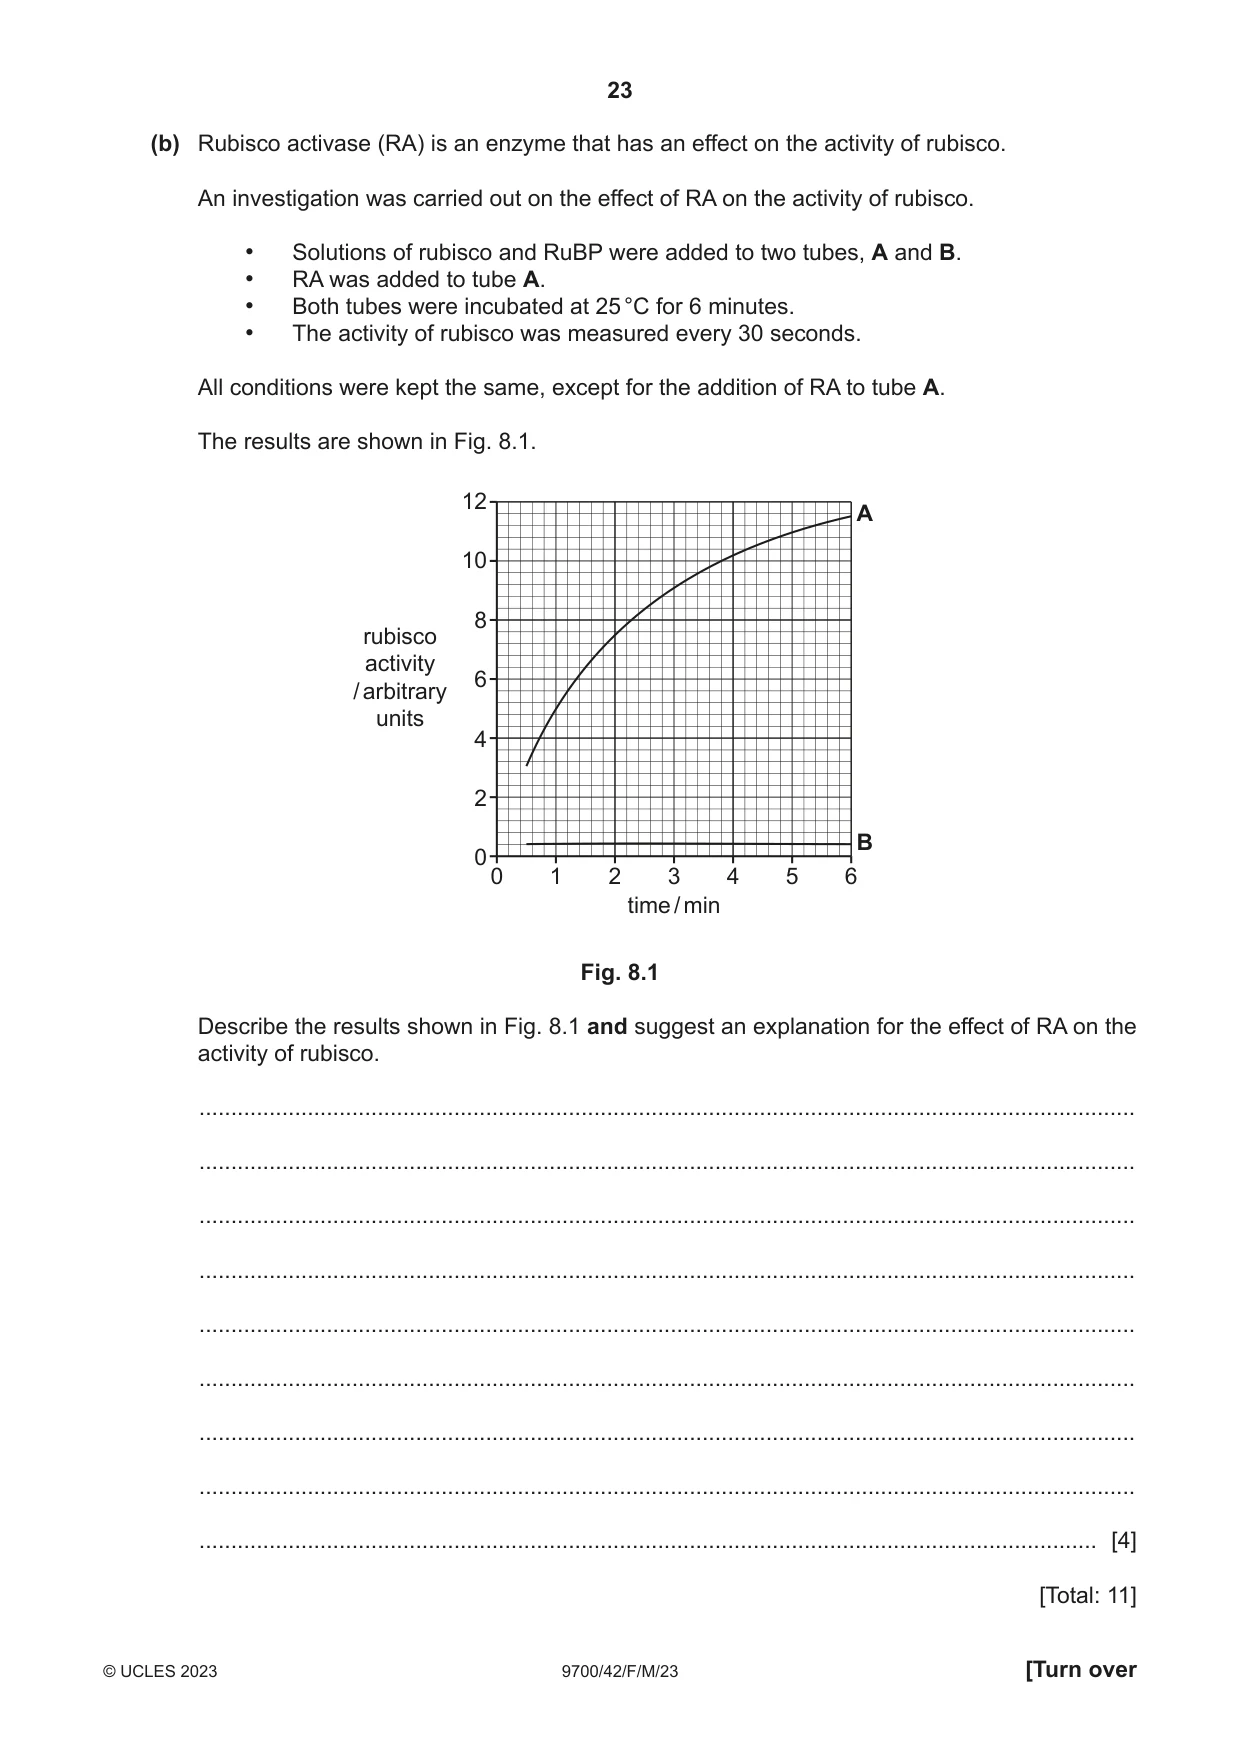
8 (a) Describe the functions of the internal membranes of the chloroplast in photosynthesis. ................................................................................................................................................... ................................................................................................................................................... ................................................................................................................................................... ................................................................................................................................................... ................................................................................................................................................... ................................................................................................................................................... ................................................................................................................................................... ................................................................................................................................................... ................................................................................................................................................... ................................................................................................................................................... ................................................................................................................................................... ................................................................................................................................................... ................................................................................................................................................... ................................................................................................................................................... ............................................................................................................................................. [7] (b) Rubisco activase (RA) is an enzyme that has an effect on the activity of rubisco. An investigation was carried out on the effect of RA on the activity of rubisco. • Solutions of rubisco and RuBP were added to two tubes, A and B. • RA was added to tube A. • Both tubes were incubated at 25 °C for 6 minutes. • The activity of rubisco was measured every 30 seconds. All conditions were kept the same, except for the addition of RA to tube A. The results are shown in Fig. 8.1. 12 A 10 8 rubisco activity 6 / arbitrary units 4 2 B 0 0 1 2 3 4 5 6 time / min Fig. 8.1 Describe the results shown in Fig. 8.1 and suggest an explanation for the effect of RA on the activity of rubisco. ................................................................................................................................................... ................................................................................................................................................... ................................................................................................................................................... ................................................................................................................................................... ................................................................................................................................................... ................................................................................................................................................... ................................................................................................................................................... ................................................................................................................................................... ............................................................................................................................................. [4] [Total: 11]
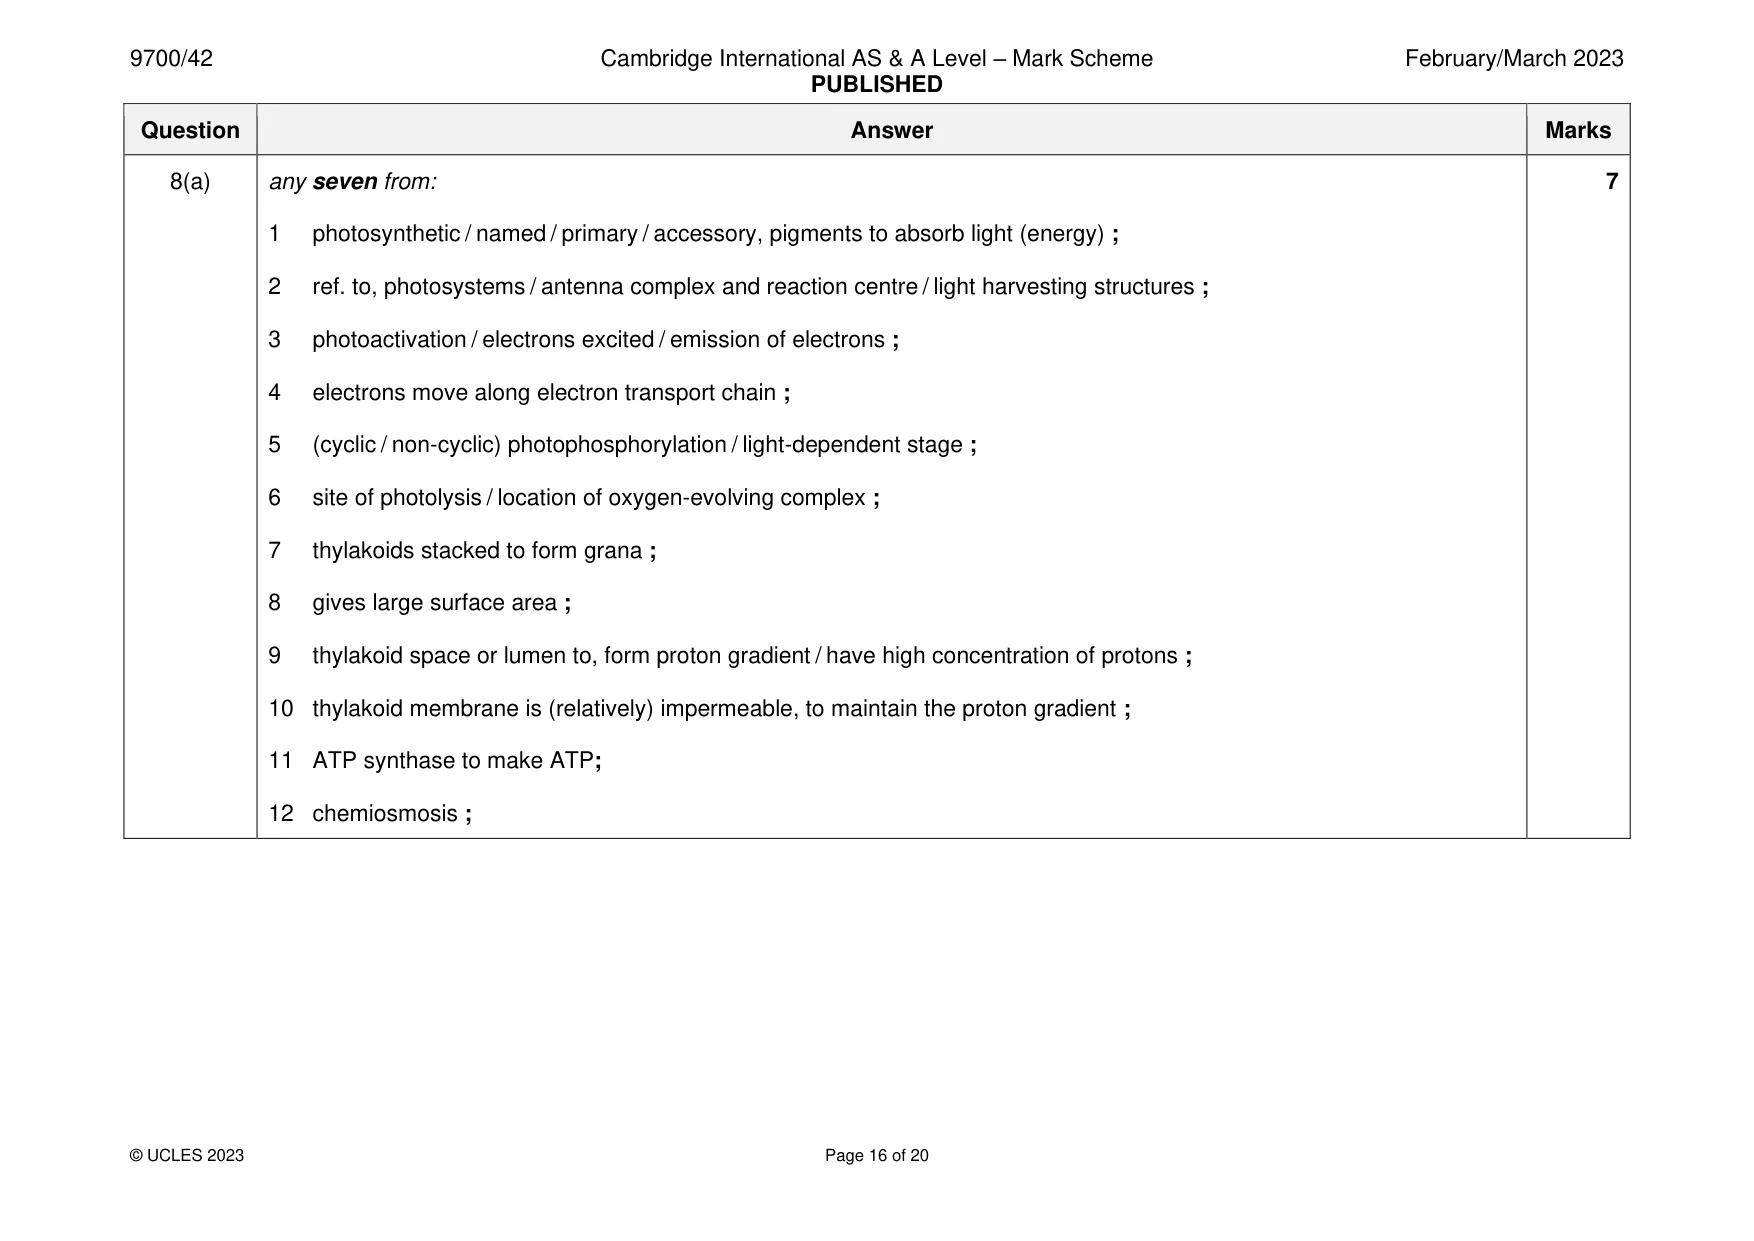
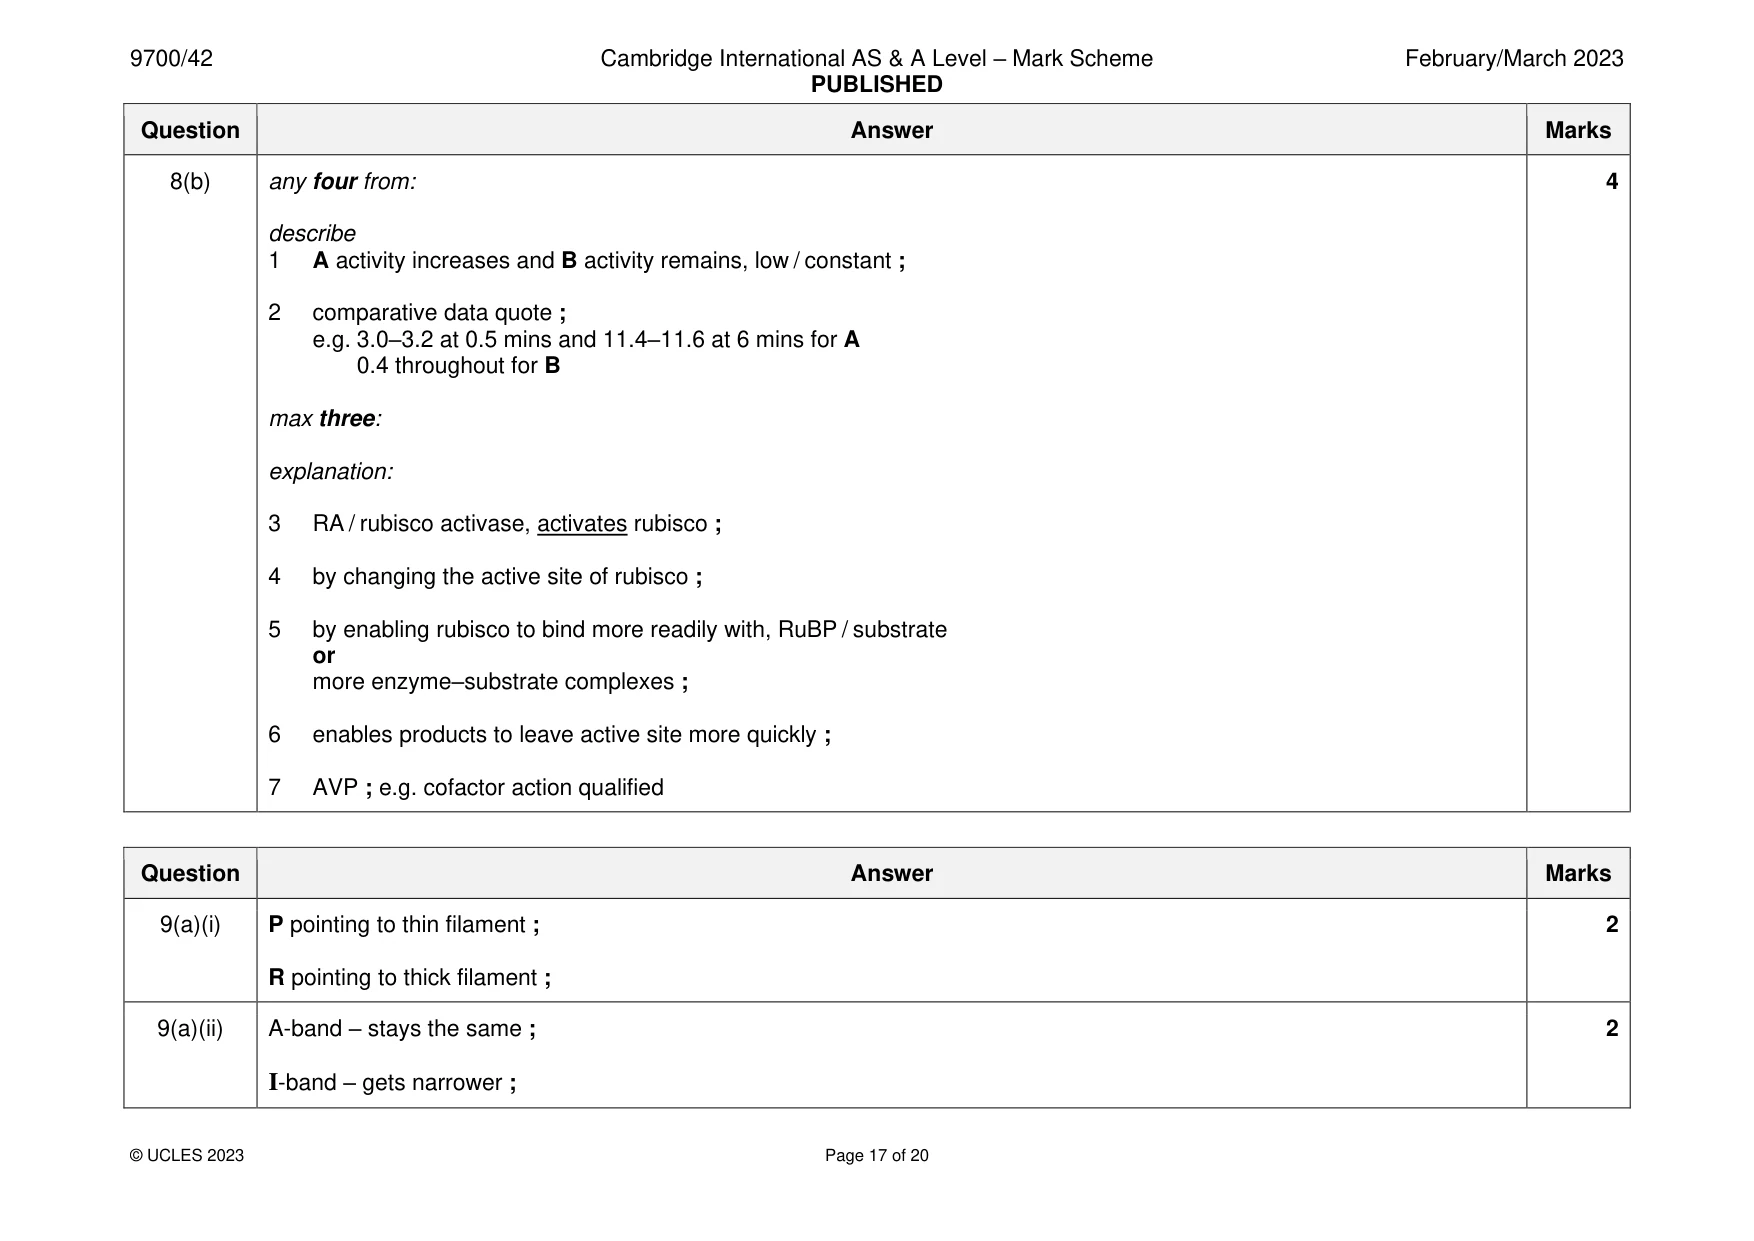
Mark scheme: 8(a) any seven from: 7 1 photosynthetic / named / primary / accessory, pigments to absorb light (energy) ; 2 ref. to, photosystems / antenna complex and reaction centre / light harvesting structures ; 3 photoactivation / electrons excited / emission of electrons ; 4 electrons move along electron transport chain ; 5 (cyclic / non-cyclic) photophosphorylation / light-dependent stage ; 6 site of photolysis / location of oxygen-evolving complex ; 7 thylakoids stacked to form grana ; 8 gives large surface area ; 9 thylakoid space or lumen to, form proton gradient / have high concentration of protons ; 10 thylakoid membrane is (relatively) impermeable, to maintain the proton gradient ; 11 ATP synthase to make ATP; 12 chemiosmosis ; 8(b) any four from: 4 describe 1 A activity increases and B activity remains, low / constant ; 2 comparative data quote ; e.g. 3.0–3.2 at 0.5 mins and 11.4–11.6 at 6 mins for A 0.4 throughout for B max three: explanation: 3 RA / rubisco activase, activates rubisco ; 4 by changing the active site of rubisco ; 5 by enabling rubisco to bind more readily with, RuBP / substrate or more enzyme–substrate complexes ; 6 enables products to leave active site more quickly ; 7 AVP ; e.g. cofactor action qualified
More questions on Photosynthesis as an energy transfer process
Q9 · A diagram of a relaxed sarcomere in striated muscle
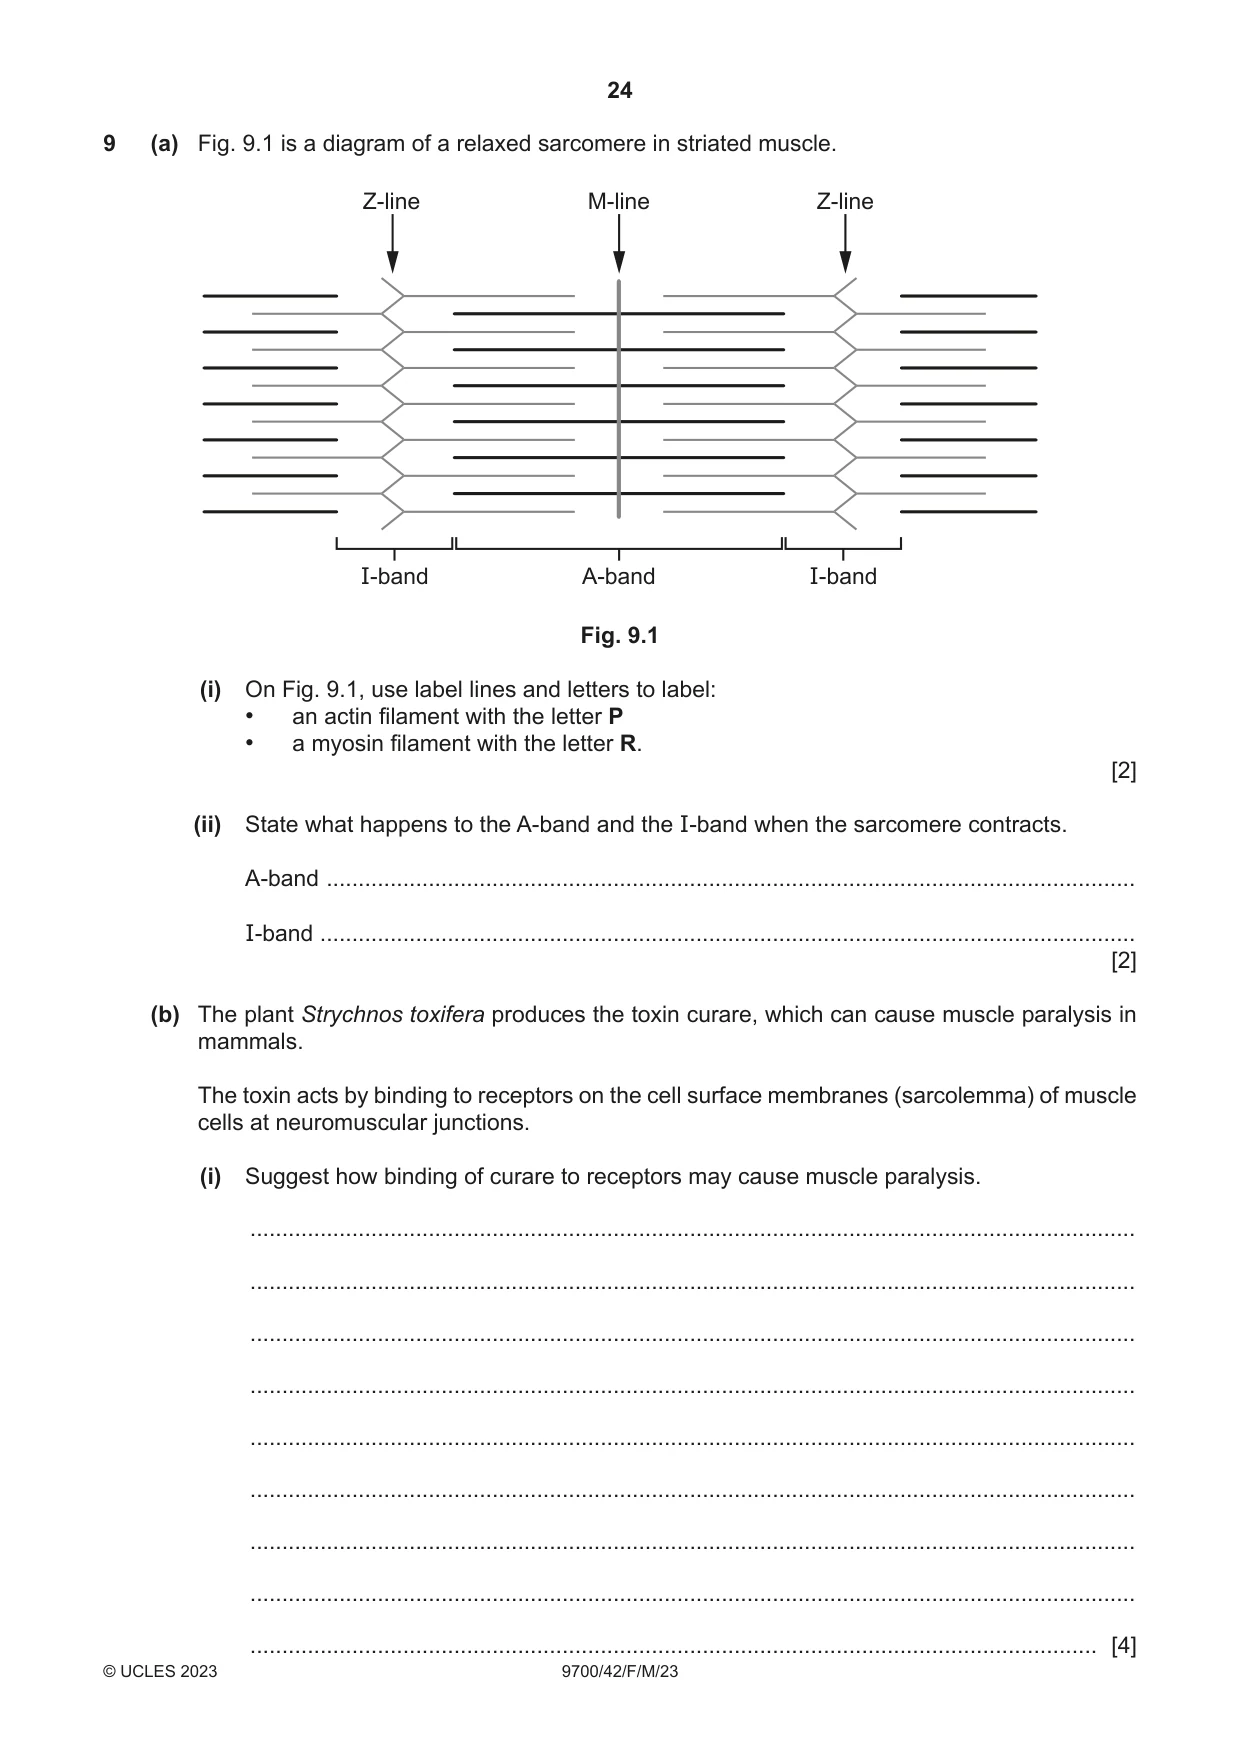
9 (a) Fig. 9.1 is a diagram of a relaxed sarcomere in striated muscle. Z-line M-line Z-line I-band A-band I-band Fig. 9.1 (i) On Fig. 9.1, use label lines and letters to label: • an actin filament with the letter P • a myosin filament with the letter R. [2] (ii) State what happens to the A-band and the I-band when the sarcomere contracts. A-band ............................................................................................................................... I-band ................................................................................................................................ [2] (b) The plant Strychnos toxifera produces the toxin curare, which can cause muscle paralysis in mammals. The toxin acts by binding to receptors on the cell surface membranes (sarcolemma) of muscle cells at neuromuscular junctions. (i) Suggest how binding of curare to receptors may cause muscle paralysis. ........................................................................................................................................... ........................................................................................................................................... ........................................................................................................................................... ........................................................................................................................................... ........................................................................................................................................... ........................................................................................................................................... ........................................................................................................................................... ........................................................................................................................................... ..................................................................................................................................... [4] (ii) Suggest why the action of curare may lead to the death of a mammal. ........................................................................................................................................... ........................................................................................................................................... ........................................................................................................................................... ........................................................................................................................................... ..................................................................................................................................... [2] [Total: 10]
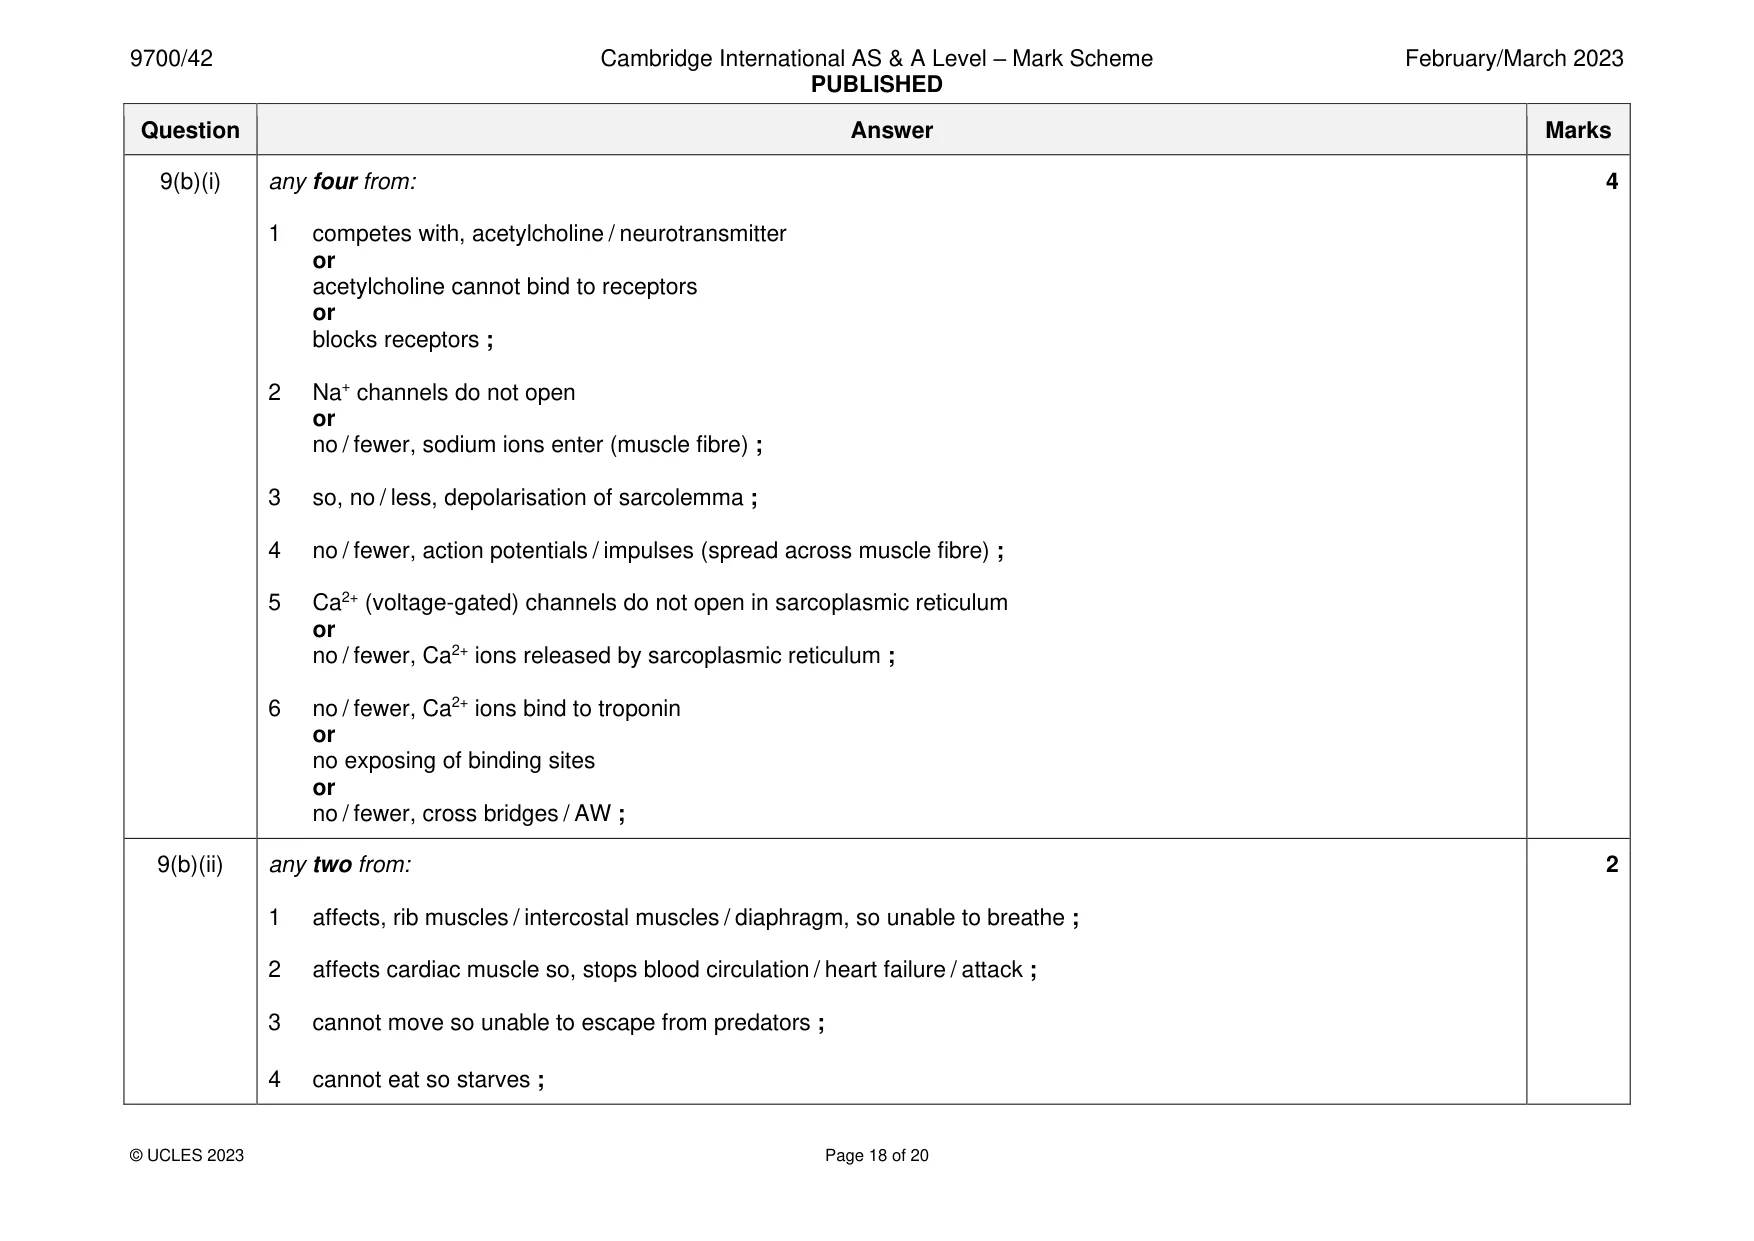
Mark scheme: 9(a)(i) P pointing to thin filament ; 2 R pointing to thick filament ; 9(a)(ii) A-band – stays the same ; 2 I-band – gets narrower ; 9(b)(i) any four from: 4 1 competes with, acetylcholine / neurotransmitter or acetylcholine cannot bind to receptors or blocks receptors ; 2 Na+ channels do not open or no / fewer, sodium ions enter (muscle fibre) ; 3 so, no / less, depolarisation of sarcolemma ; 4 no / fewer, action potentials / impulses (spread across muscle fibre) ; 5 Ca2+ (voltage-gated) channels do not open in sarcoplasmic reticulum or no / fewer, Ca2+ ions released by sarcoplasmic reticulum ; 6 no / fewer, Ca2+ ions bind to troponin or no exposing of binding sites or no / fewer, cross bridges / AW ; 9(b)(ii) any two from: 2 1 affects, rib muscles / intercostal muscles / diaphragm, so unable to breathe ; 2 affects cardiac muscle so, stops blood circulation / heart failure / attack ; 3 cannot move so unable to escape from predators ; 4 cannot eat so starves ;
Q10 · The passage in Fig
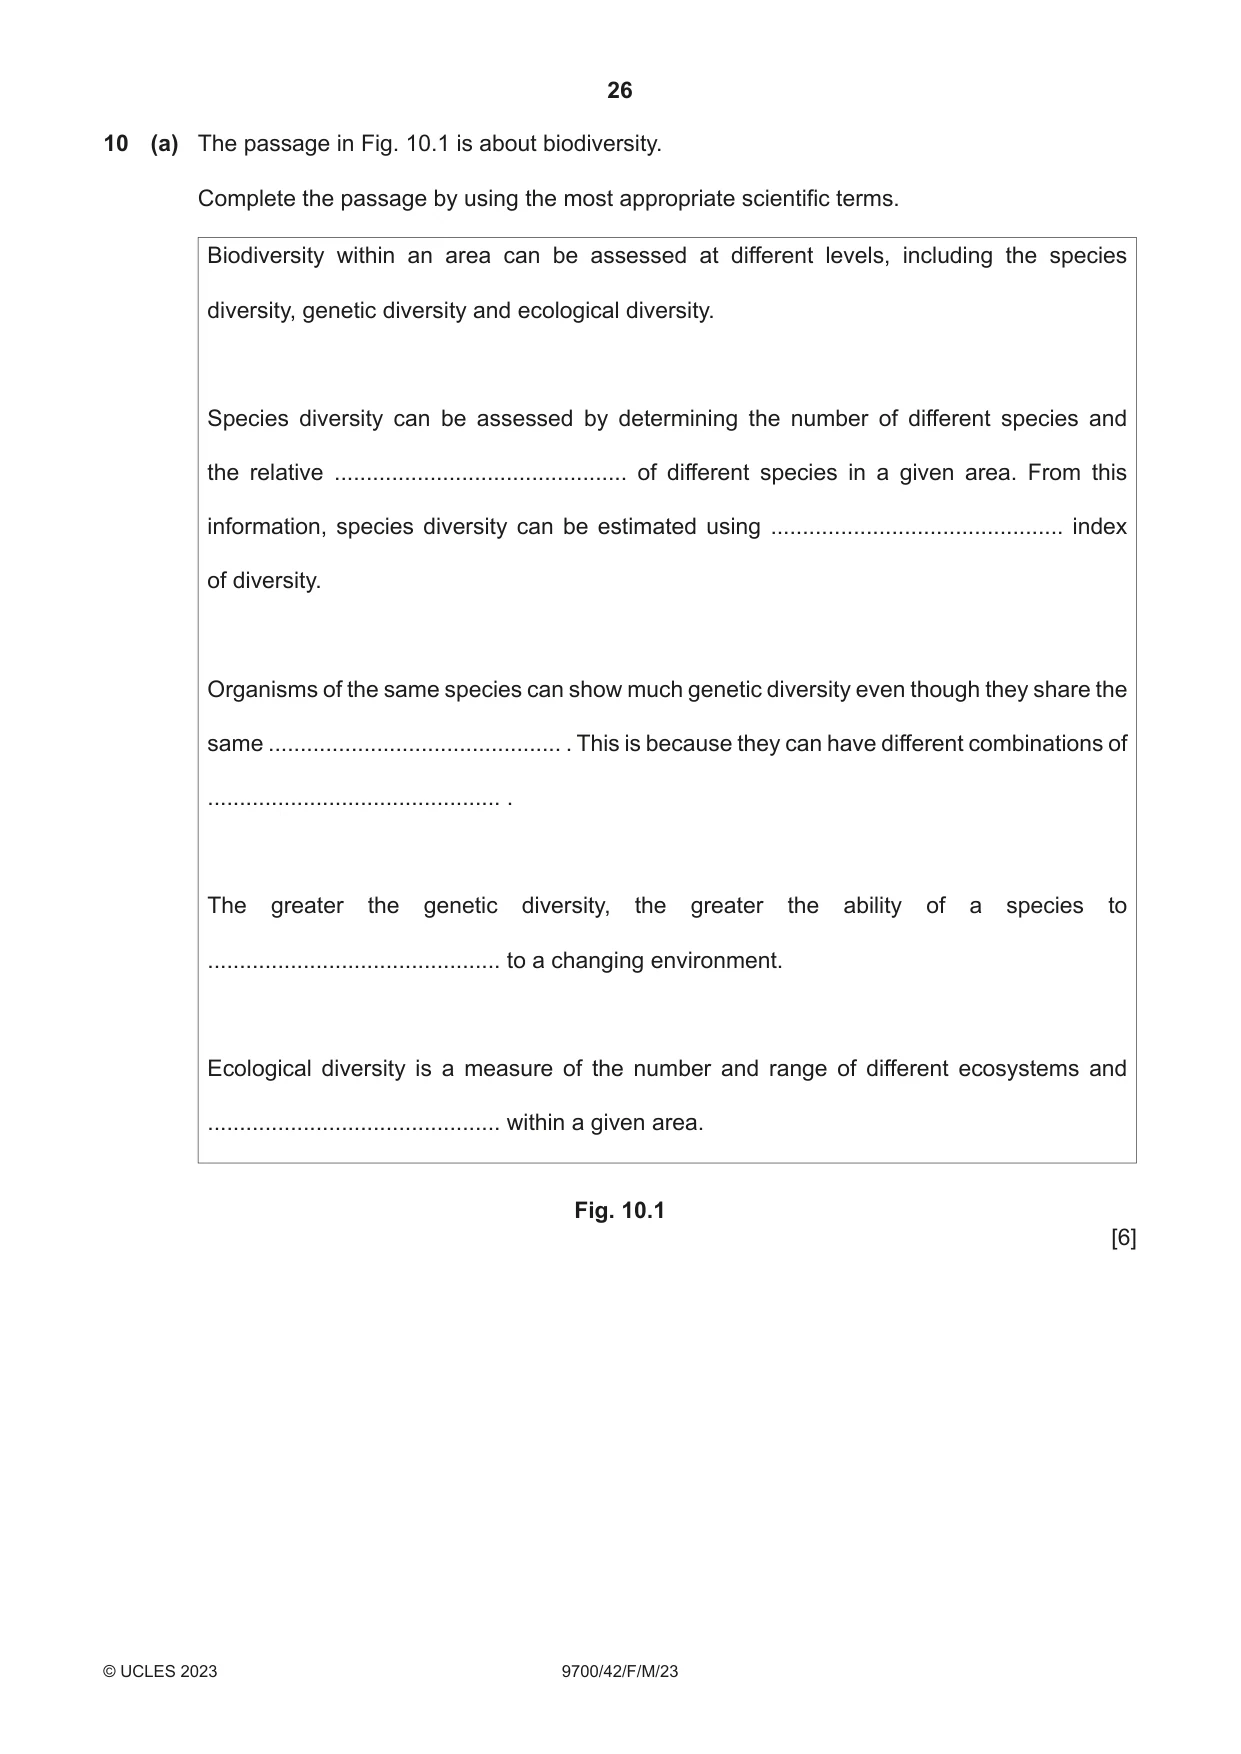
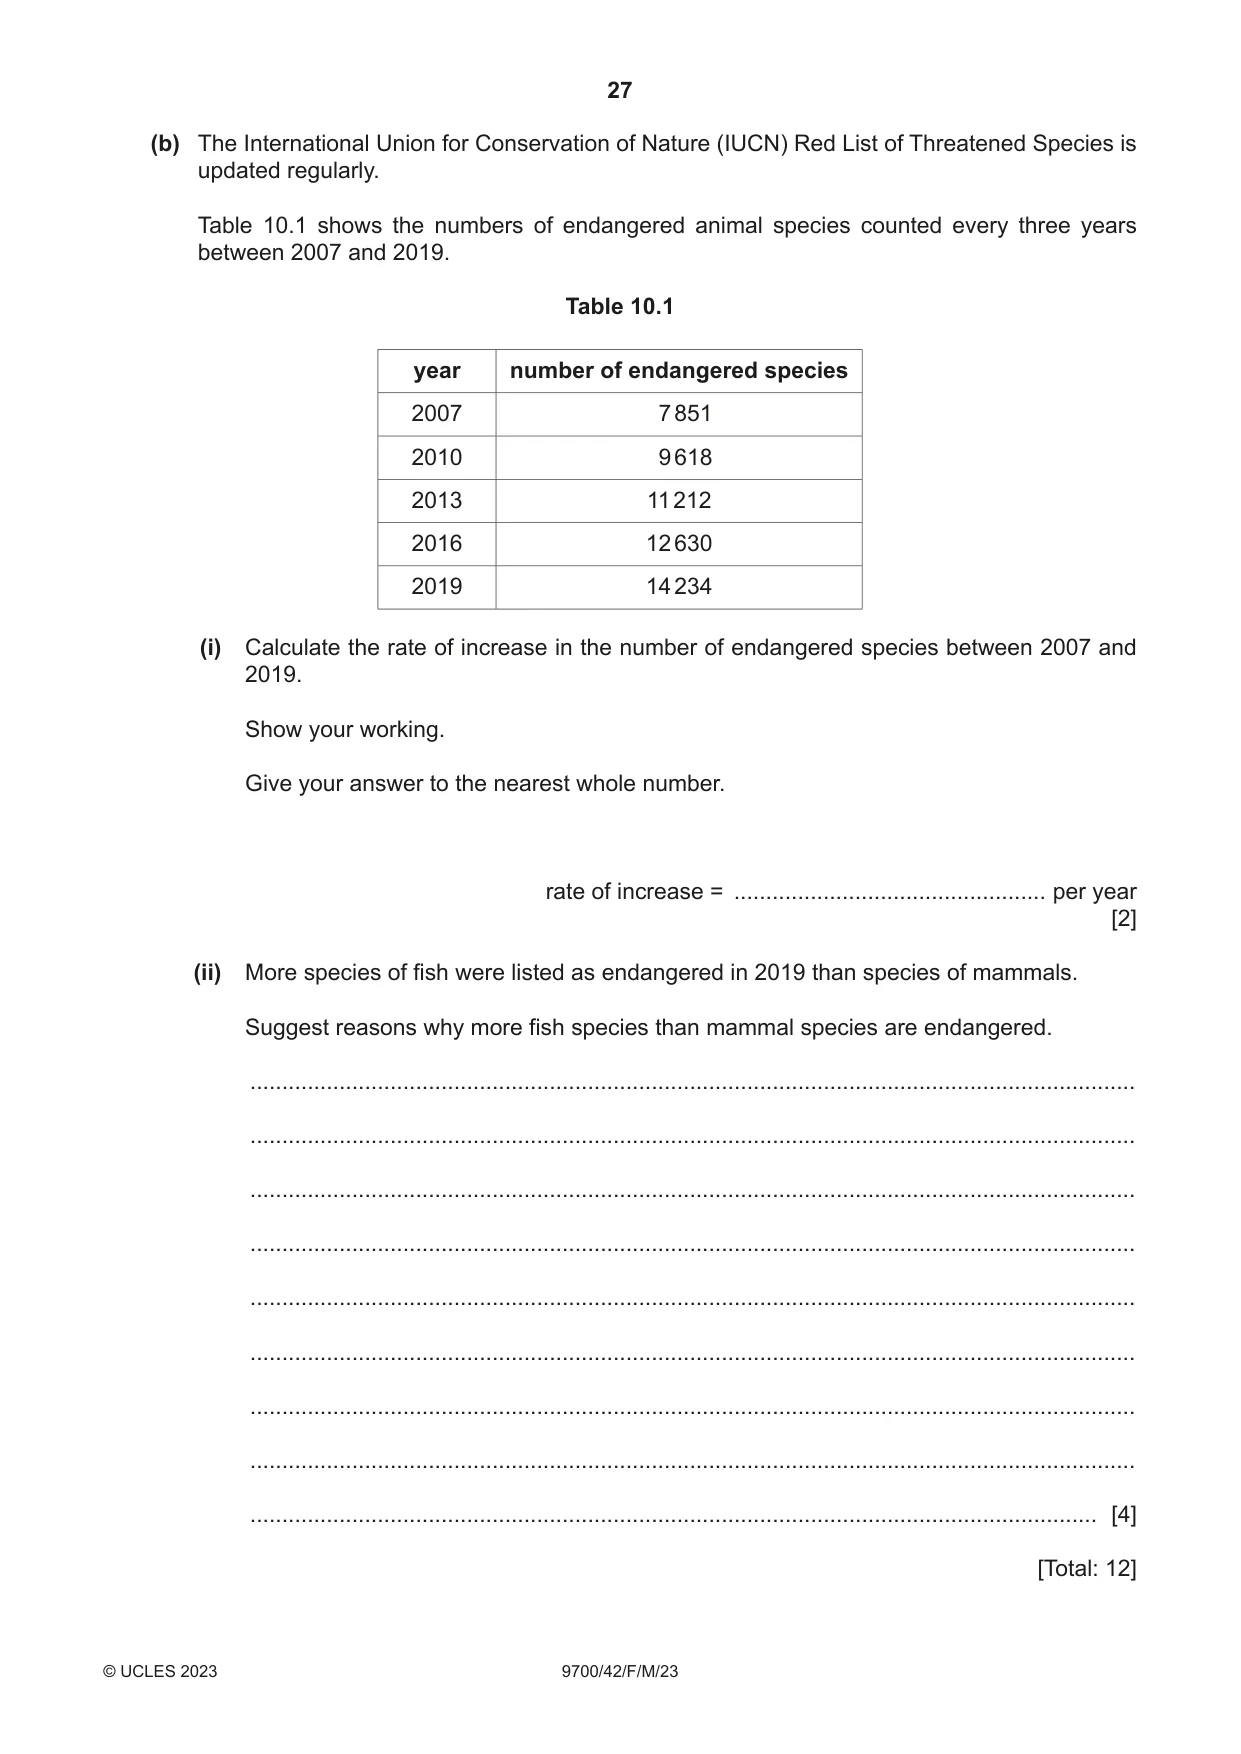
10 (a) The passage in Fig. 10.1 is about biodiversity. Complete the passage by using the most appropriate scientific terms. Biodiversity within an area can be assessed at different levels, including the species diversity, genetic diversity and ecological diversity. Species diversity can be assessed by determining the number of different species and the relative .............................................. of different species in a given area. From this information, species diversity can be estimated using .............................................. index of diversity. Organisms of the same species can show much genetic diversity even though they share the same .............................................. . This is because they can have different combinations of .............................................. . The greater the genetic diversity, the greater the ability of a species to .............................................. to a changing environment. Ecological diversity is a measure of the number and range of different ecosystems and .............................................. within a given area. Fig. 10.1 [6] (b) The International Union for Conservation of Nature (IUCN) Red List of Threatened Species is updated regularly. Table 10.1 shows the numbers of endangered animal species counted every three years between 2007 and 2019. Table 10.1 year number of endangered species 2007 7 851 2010 9 618 2013 11 212 2016 12 630 2019 14 234 (i) Calculate the rate of increase in the number of endangered species between 2007 and 2019. Show your working. Give your answer to the nearest whole number. rate of increase = ................................................. per year [2] (ii) More species of fish were listed as endangered in 2019 than species of mammals. Suggest reasons why more fish species than mammal species are endangered. ........................................................................................................................................... ........................................................................................................................................... ........................................................................................................................................... ........................................................................................................................................... ........................................................................................................................................... ........................................................................................................................................... ........................................................................................................................................... ........................................................................................................................................... ..................................................................................................................................... [4] [Total: 12]
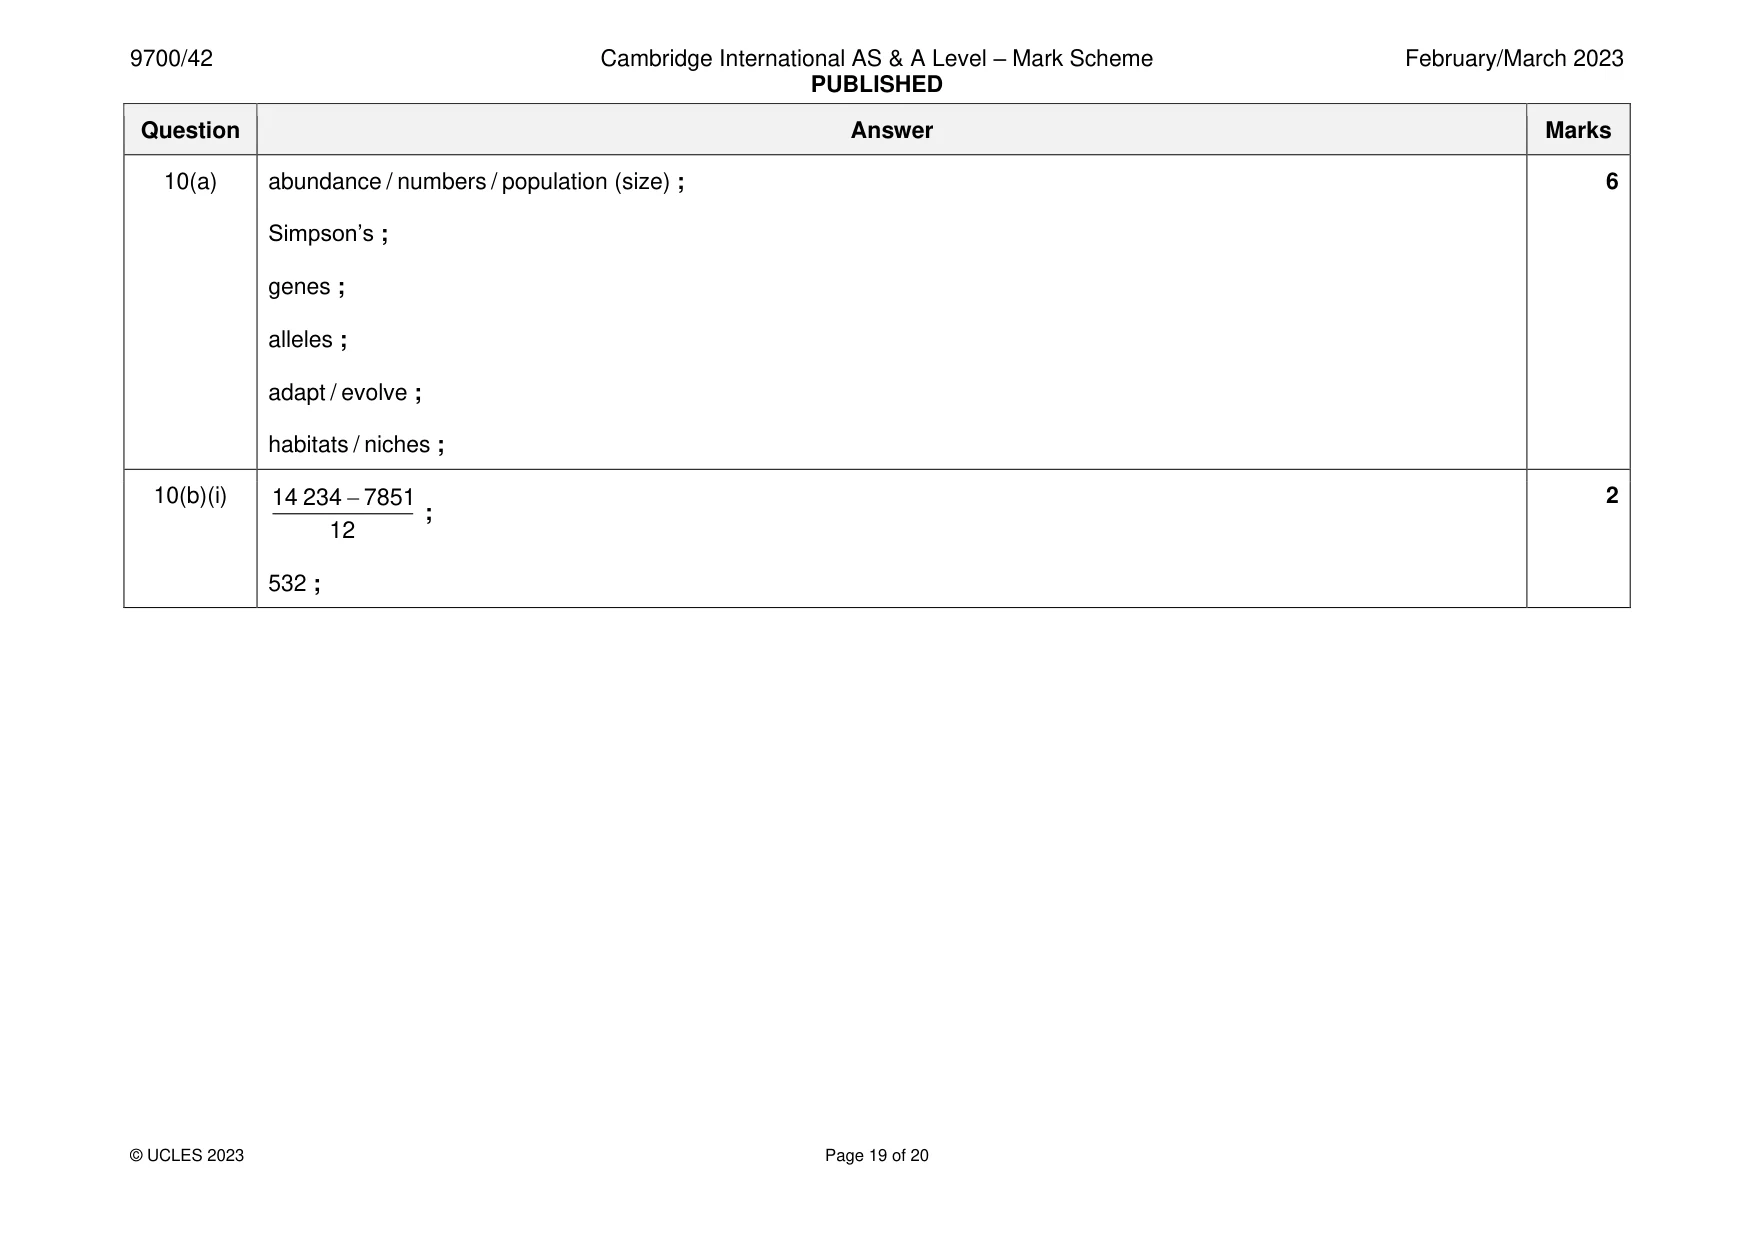
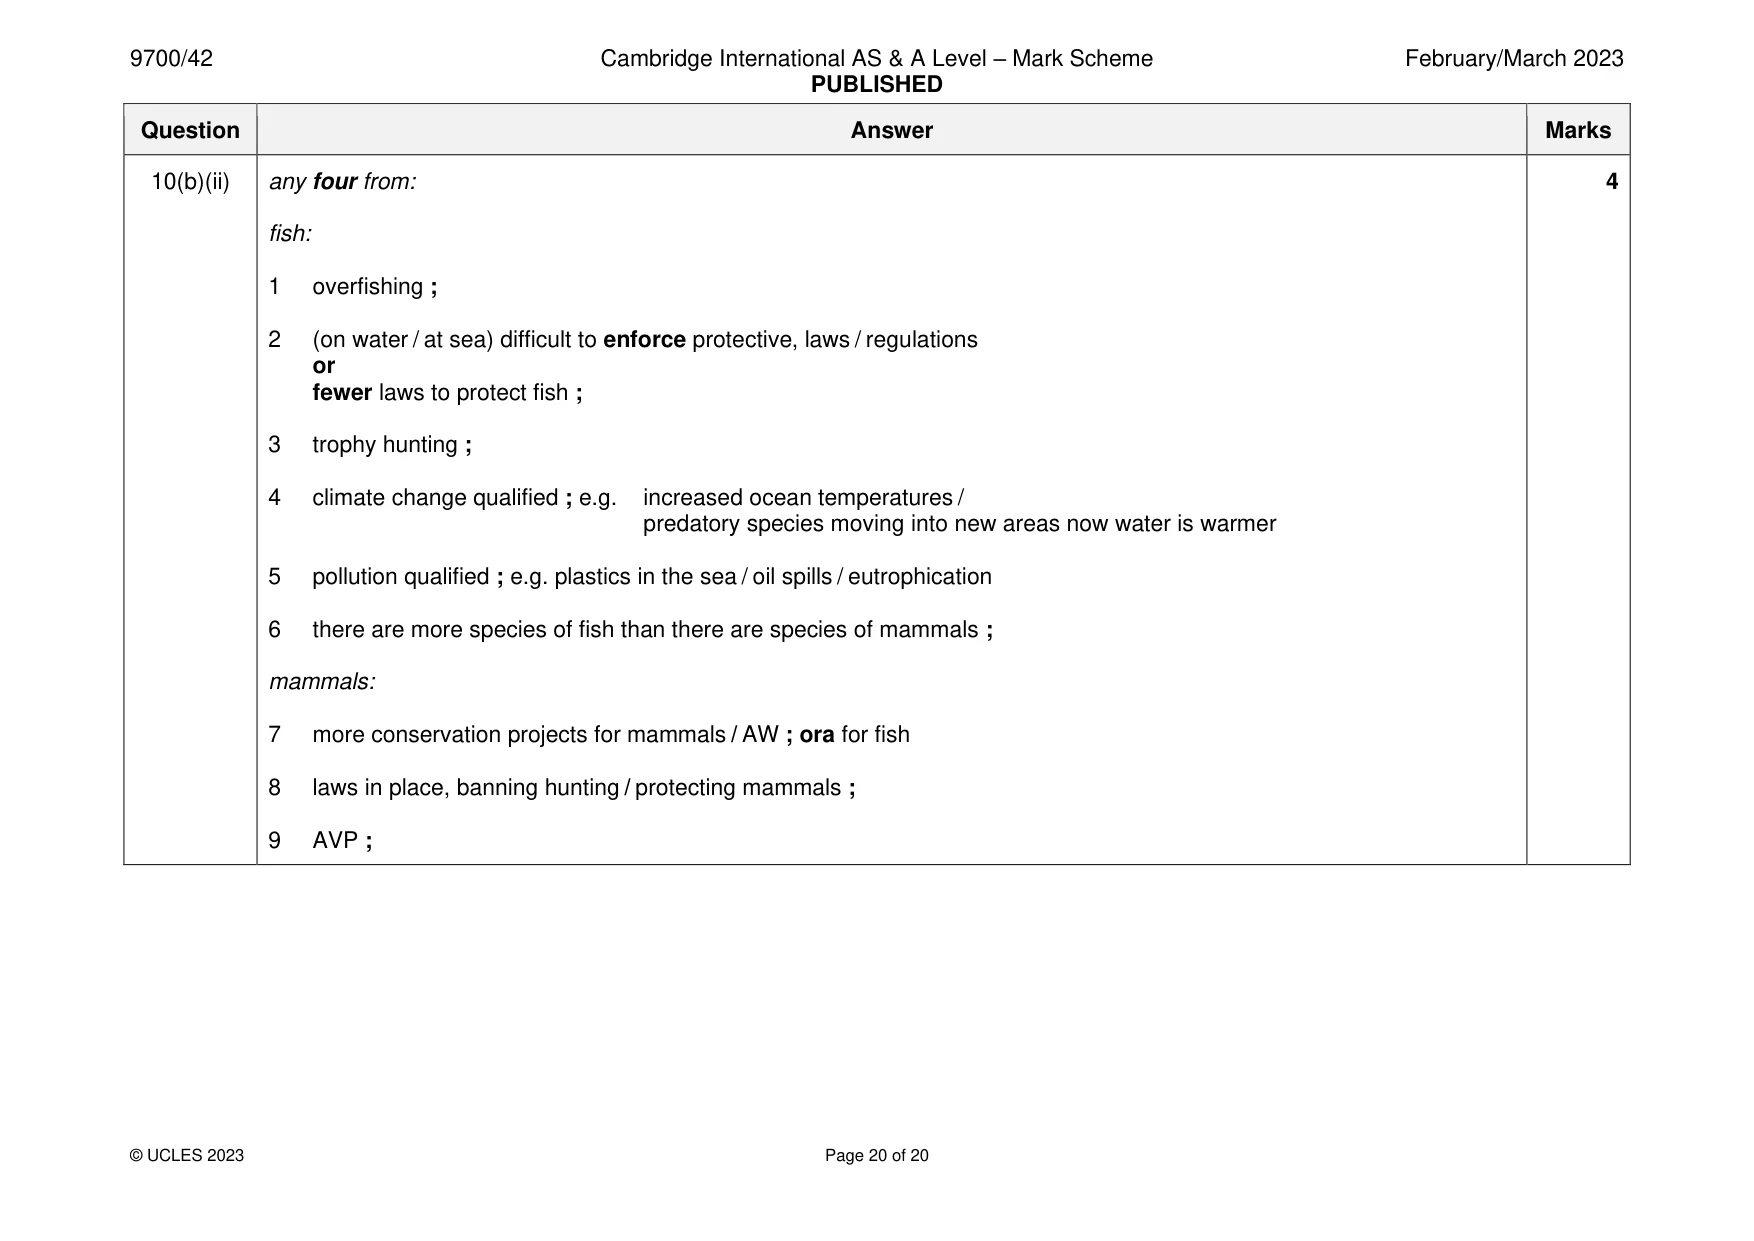
Mark scheme: 10(a) abundance / numbers / population (size) ; 6 Simpson’s ; genes ; alleles ; adapt / evolve ; habitats / niches ; 10(b)(i) 14 234 − 7851 2 ; 12 532 ; 10(b)(ii) any four from: 4 fish: 1 overfishing ; 2 (on water / at sea) difficult to enforce protective, laws / regulations or fewer laws to protect fish ; 3 trophy hunting ; 4 climate change qualified ; e.g. increased ocean temperatures / predatory species moving into new areas now water is warmer 5 pollution qualified ; e.g. plastics in the sea / oil spills / eutrophication 6 there are more species of fish than there are species of mammals ; mammals: 7 more conservation projects for mammals / AW ; ora for fish 8 laws in place, banning hunting / protecting mammals ; 9 AVP ;
What was in this paper
The subtopics covered by these 10 questions, and how many questions each got. Open one in a new tab to see every Cambridge question on it.
What you needed in this session
Cambridge’s own grade thresholds for 2023 Feb/March, Paper 4 · Variant 2. A higher threshold means an easier paper — the bar moves with how the cohort did.