Cambridge A Level Biology 9700 — 2025 Oct/Nov Paper 4 · Variant 4
9700/44/O/N/25 · 10 questions · 100 marks · 120 min
The question paper and its mark scheme, free to read here and free to download. This is Cambridge’s own paper, exactly as it was sat.
Question paper28 pages

Mark scheme17 pages
Answers below. Sit the paper first if you are practising.
Questions as text
Q1 · A diagram of a sensory neurone
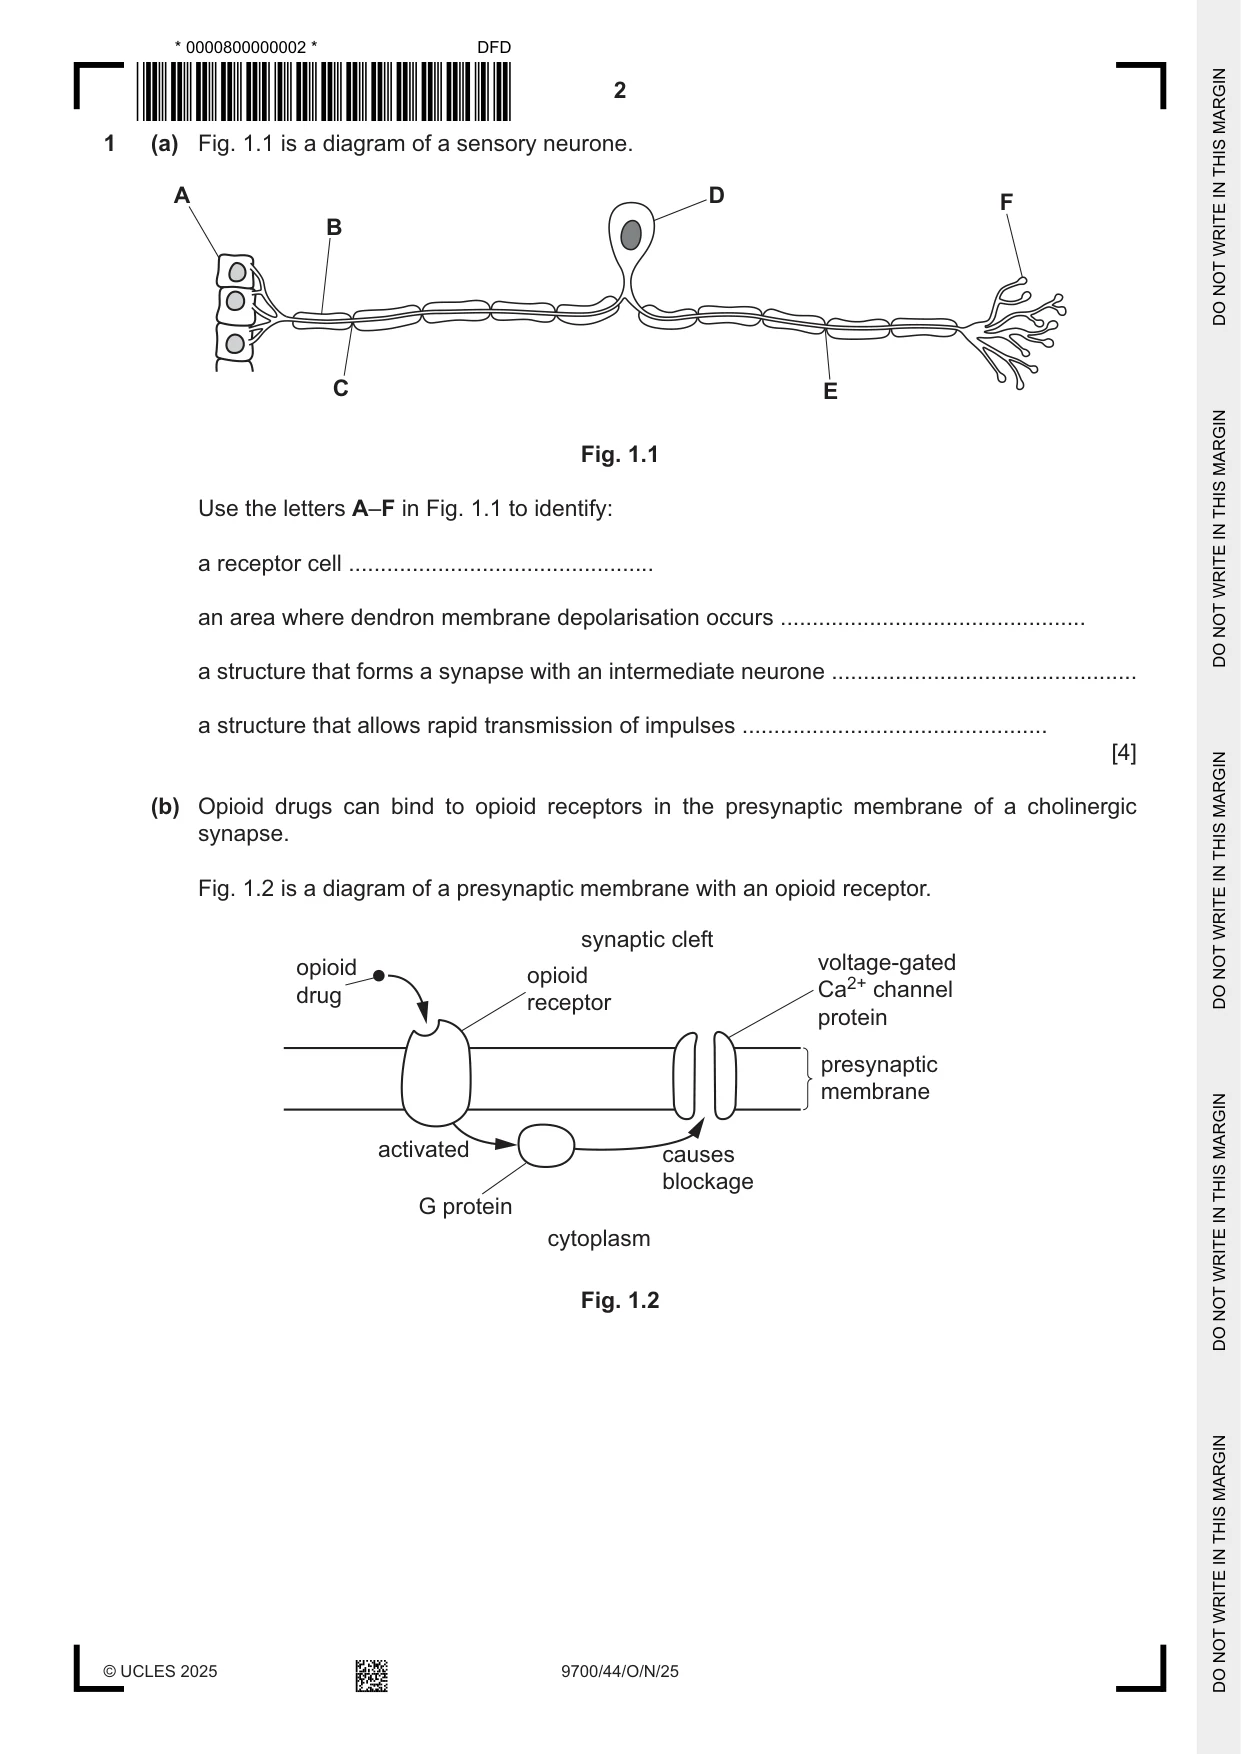
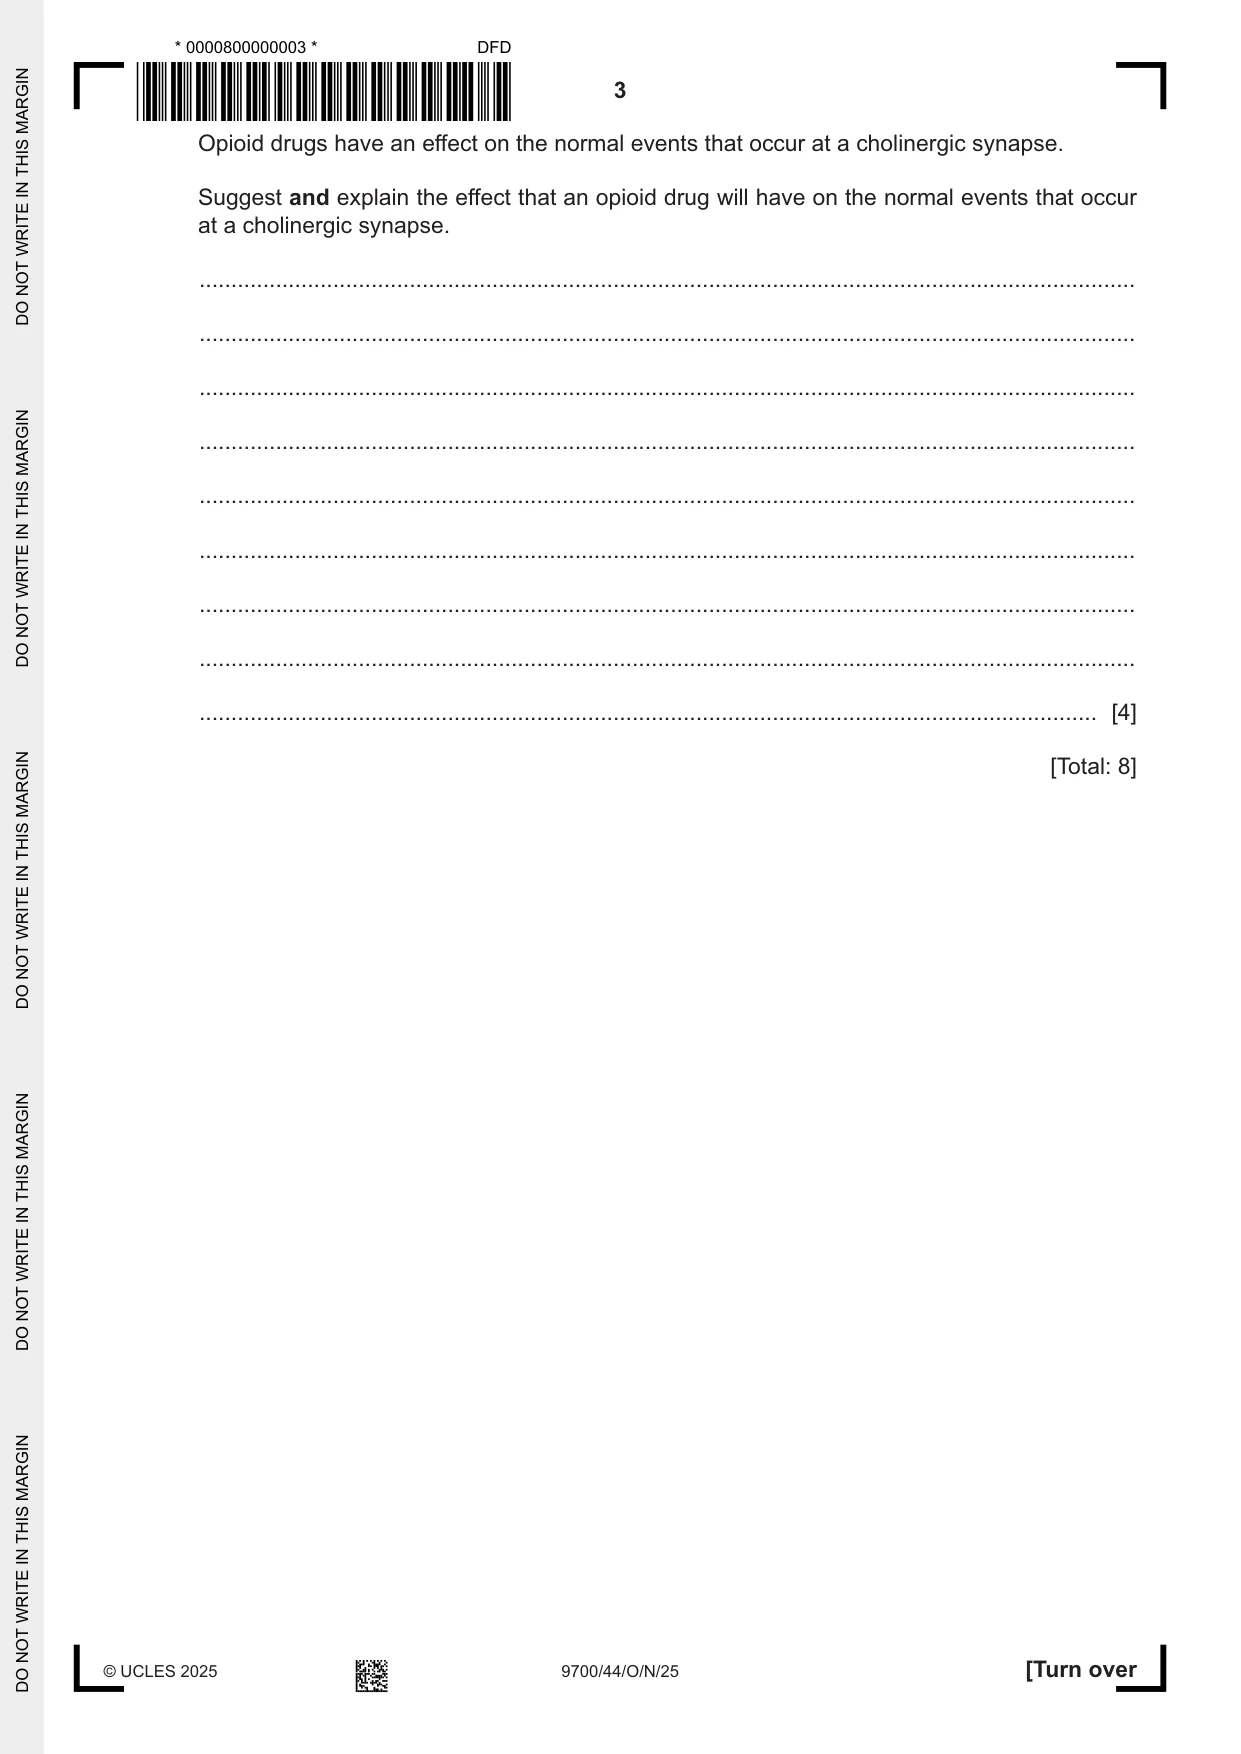
1 (a) Fig. 1.1 is a diagram of a sensory neurone. A D F B C E Fig. 1.1 Use the letters A–F in Fig. 1.1 to identify: a receptor cell ................................................ an area where dendron membrane depolarisation occurs ................................................ a structure that forms a synapse with an intermediate neurone ................................................ a structure that allows rapid transmission of impulses ................................................ [4] (b) Opioid drugs can bind to opioid receptors in the presynaptic membrane of a cholinergic synapse. Fig. 1.2 is a diagram of a presynaptic membrane with an opioid receptor. synaptic cleft opioid voltage-gated opioid drug Ca2+ channel receptor protein presynaptic membrane activated causes blockage G protein cytoplasm Fig. 1.2 Opioid drugs have an effect on the normal events that occur at a cholinergic synapse. Suggest and explain the effect that an opioid drug will have on the normal events that occur at a cholinergic synapse. ................................................................................................................................................... ................................................................................................................................................... ................................................................................................................................................... ................................................................................................................................................... ................................................................................................................................................... ................................................................................................................................................... ................................................................................................................................................... ................................................................................................................................................... ............................................................................................................................................. [4] [Total: 8]
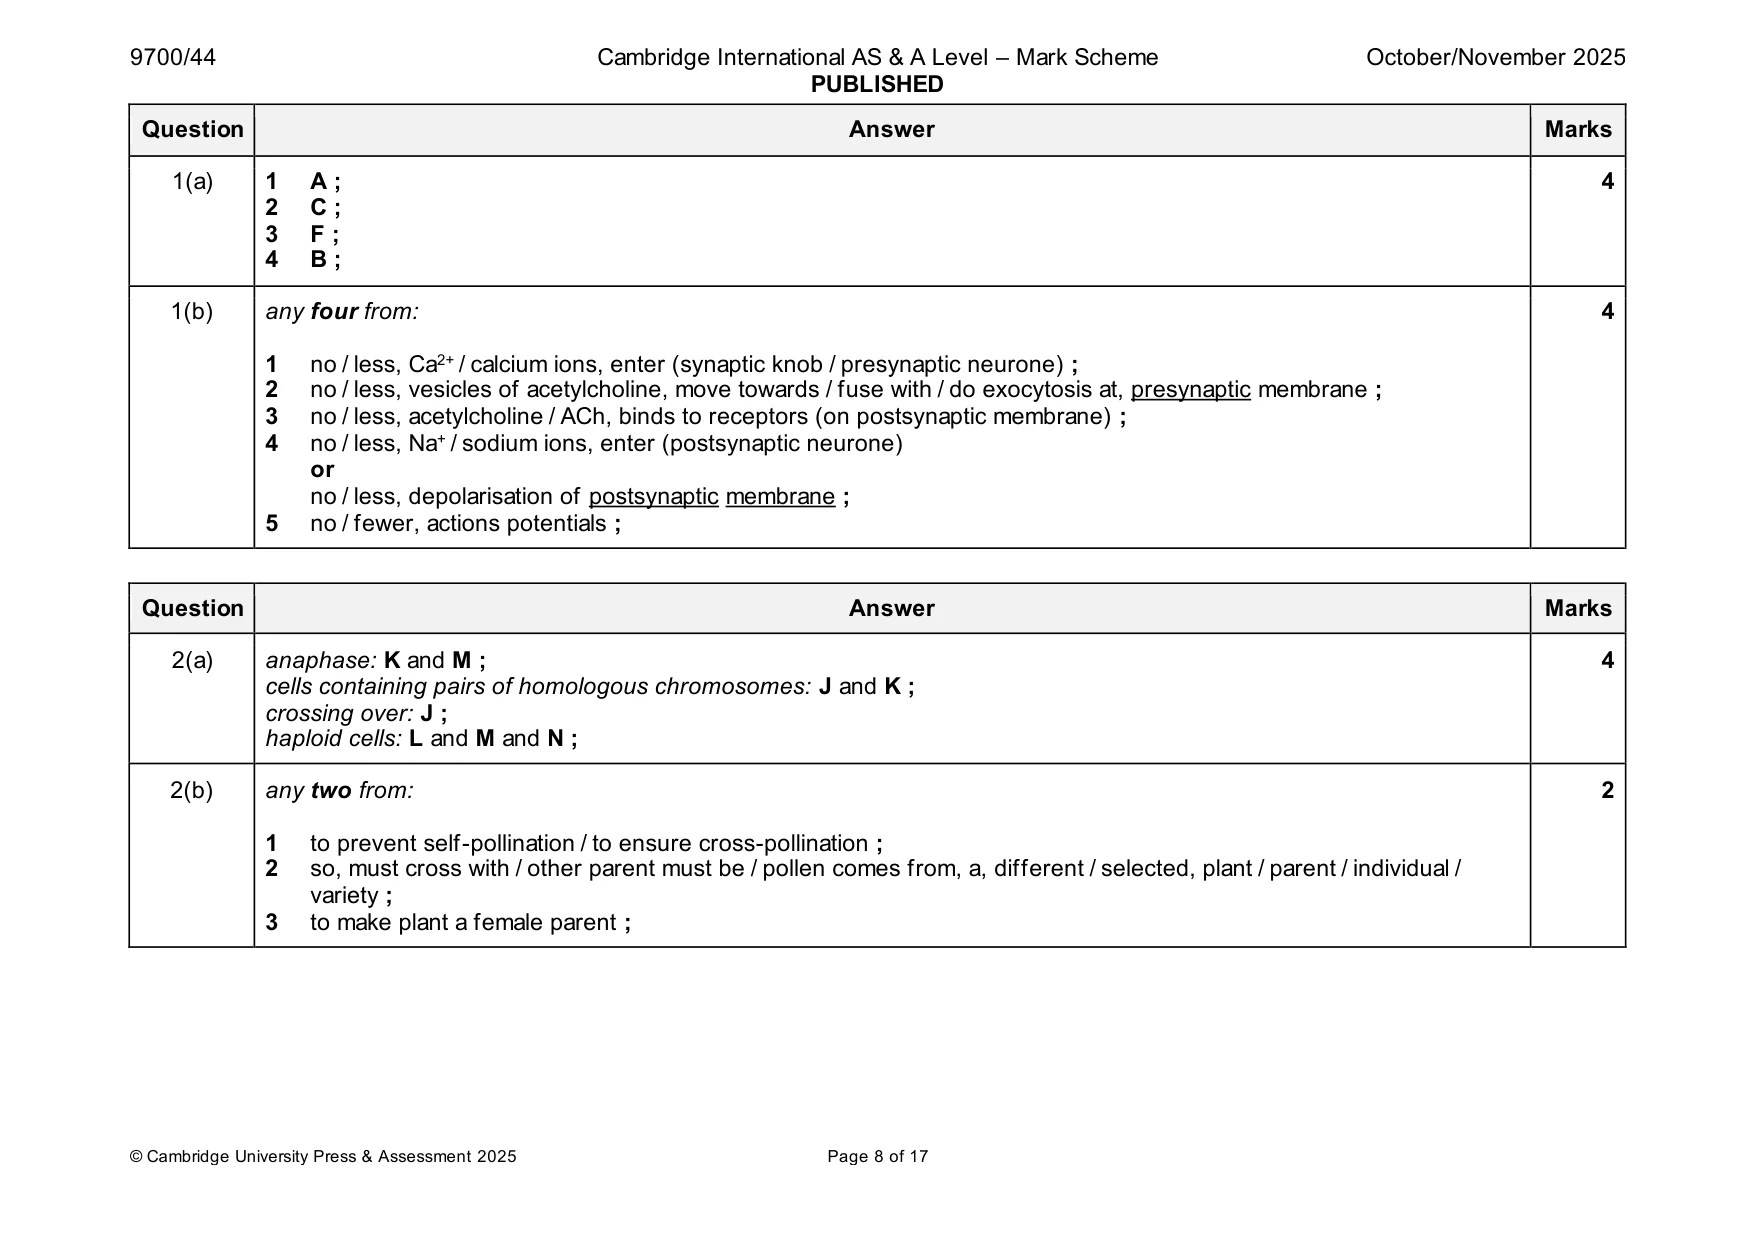
Mark scheme: Question Answer Marks 1(a) 1 A ; 4 2 C ; 3 F ; 4 B ; 1(b) any four from: 4 1 no / less, Ca2+ / calcium ions, enter (synaptic knob / presynaptic neurone) ; 2 no / less, vesicles of acetylcholine, move towards / fuse with / do exocytosis at, presynaptic membrane ; 3 no / less, acetylcholine / ACh, binds to receptors (on postsynaptic membrane) ; 4 no / less, Na+ / sodium ions, enter (postsynaptic neurone) or no / less, depolarisation of postsynaptic membrane ; 5 no / fewer, actions potentials ;
Q2 · Meiosis and cytokinesis occur in the male reproductive organs (anthers) of plants to make…
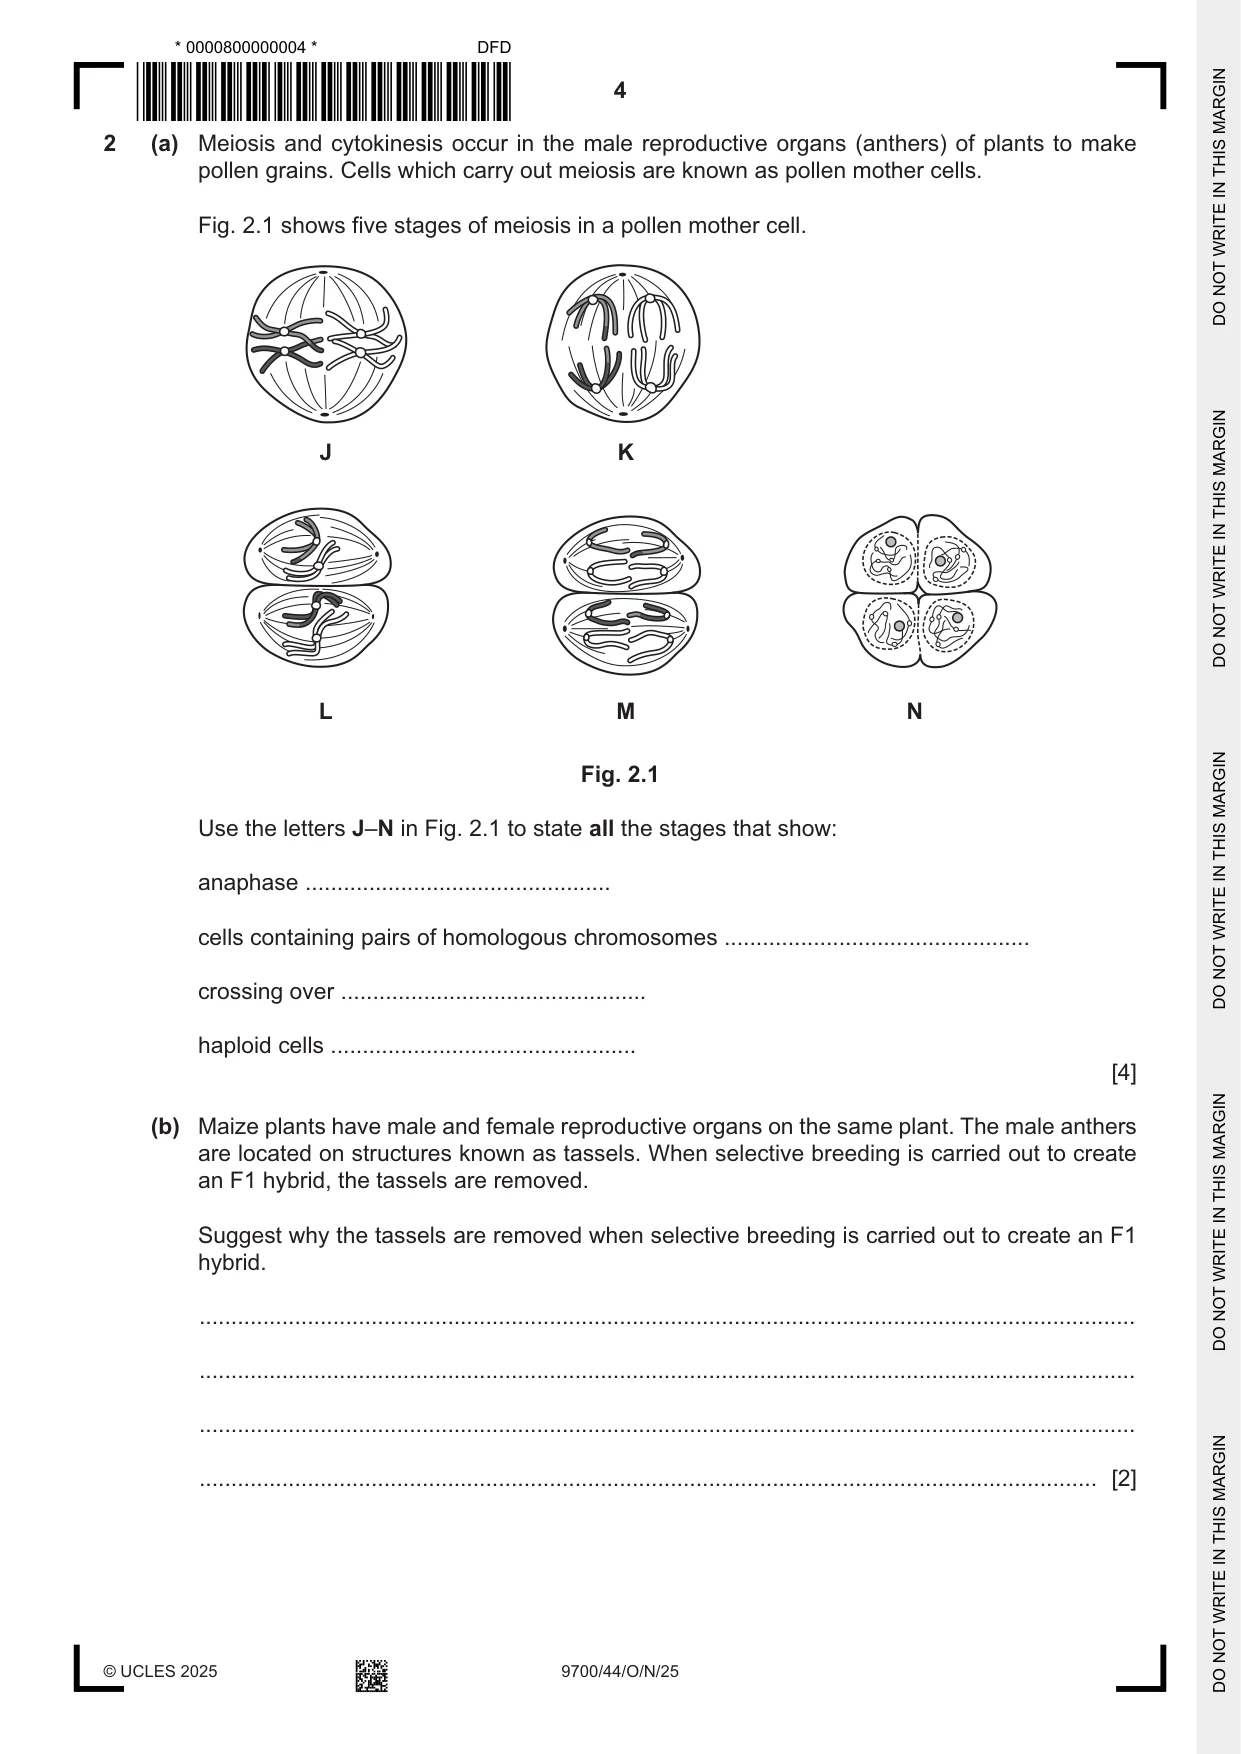
2 (a) Meiosis and cytokinesis occur in the male reproductive organs (anthers) of plants to make pollen grains. Cells which carry out meiosis are known as pollen mother cells. Fig. 2.1 shows five stages of meiosis in a pollen mother cell. J K L M N Fig. 2.1 Use the letters J–N in Fig. 2.1 to state all the stages that show: anaphase ................................................ cells containing pairs of homologous chromosomes ................................................ crossing over ................................................ haploid cells ................................................ [4] (b) Maize plants have male and female reproductive organs on the same plant. The male anthers are located on structures known as tassels. When selective breeding is carried out to create an F1 hybrid, the tassels are removed. Suggest why the tassels are removed when selective breeding is carried out to create an F1 hybrid. ................................................................................................................................................... ................................................................................................................................................... ................................................................................................................................................... ............................................................................................................................................. [2] (c) Outline how selective breeding is used to produce vigorous, uniform varieties of maize. ................................................................................................................................................... ................................................................................................................................................... ................................................................................................................................................... ................................................................................................................................................... ................................................................................................................................................... ................................................................................................................................................... ................................................................................................................................................... ................................................................................................................................................... ................................................................................................................................................... ............................................................................................................................................. [4] [Total: 10]
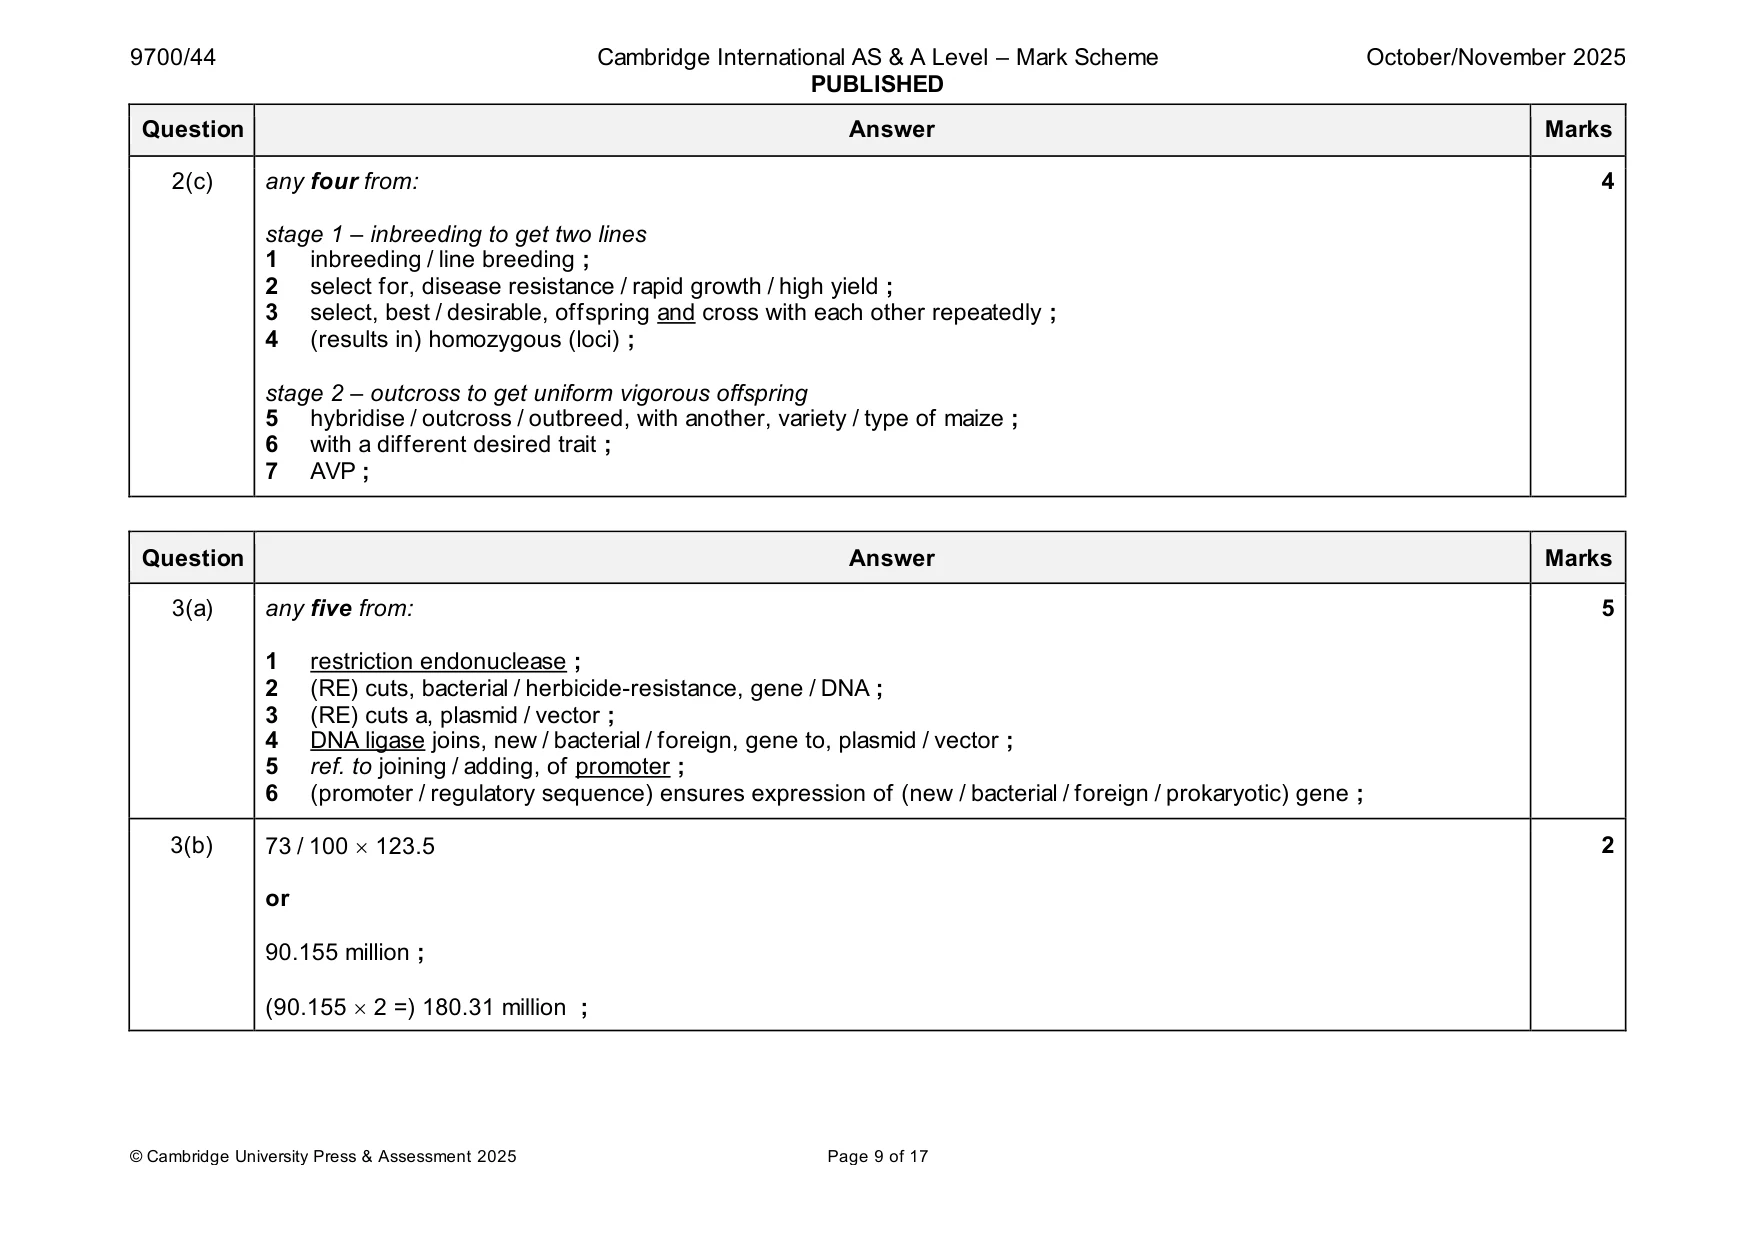
Mark scheme: 2(a) anaphase: K and M ; 4 cells containing pairs of homologous chromosomes: J and K ; crossing over: J ; haploid cells: L and M and N ; 2(b) any two from: 2 1 to prevent self-pollination / to ensure cross-pollination ; 2 so, must cross with / other parent must be / pollen comes from, a, different / selected, plant / parent / individual / variety ; 3 to make plant a female parent ; 2(c) any four from: 4 stage 1 – inbreeding to get two lines 1 inbreeding / line breeding ; 2 select for, disease resistance / rapid growth / high yield ; 3 select, best / desirable, offspring and cross with each other repeatedly ; 4 (results in) homozygous (loci) ; stage 2 – outcross to get uniform vigorous offspring 5 hybridise / outcross / outbreed, with another, variety / type of maize ; 6 with a different desired trait ; 7 AVP ;
Q3 · Genetic engineering is a modern method for producing crop plants with improved…
3 (a) Genetic engineering is a modern method for producing crop plants with improved characteristics. One example of a crop plant with improved characteristics is soybean, Glycine max, which has been genetically modified to make it resistant to a herbicide. This genetically modified soybean is called GM soybean. To create GM soybean, a bacterial gene and a section of regulatory DNA were introduced into soybean cells. Outline the roles of enzymes and a section of regulatory DNA in the creation of genetically modified organisms such as GM soybean. ................................................................................................................................................... ................................................................................................................................................... ................................................................................................................................................... ................................................................................................................................................... ................................................................................................................................................... ................................................................................................................................................... ................................................................................................................................................... ................................................................................................................................................... ................................................................................................................................................... ................................................................................................................................................... ................................................................................................................................................... ............................................................................................................................................. [5] (b) In 2018, an area of 123.5 million hectares was used to grow soybean crops worldwide. GM soybean was grown in 73% of this area. In 2018, soybeans accounted for 50% of the total GM crop area worldwide. Calculate the total area used to grow GM crops worldwide in 2018. Show your working. ........................................... hectares [2] (c) Discuss the social implications of growing GM crops. ................................................................................................................................................... ................................................................................................................................................... ................................................................................................................................................... ................................................................................................................................................... ................................................................................................................................................... ................................................................................................................................................... ................................................................................................................................................... ................................................................................................................................................... ................................................................................................................................................... ............................................................................................................................................. [4] [Total: 11]
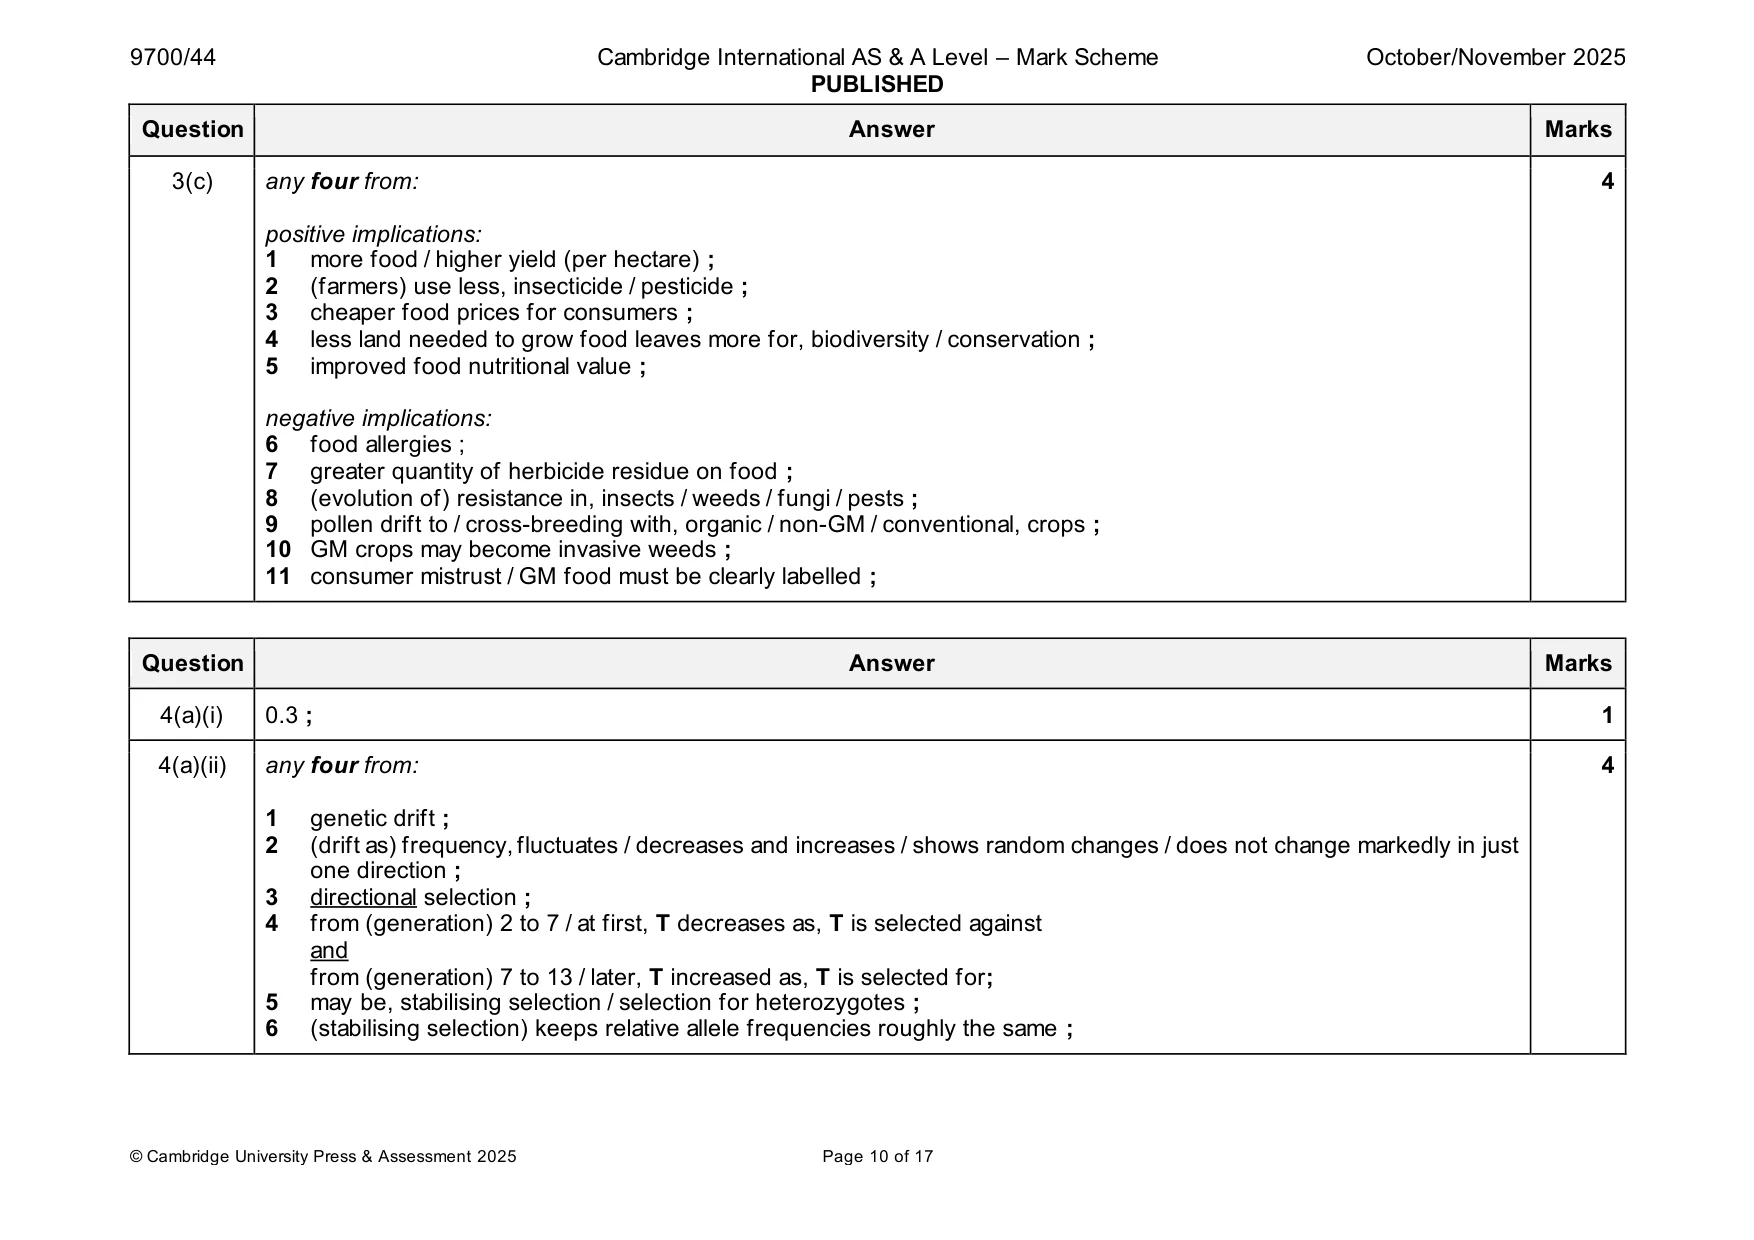
Mark scheme: 3(a) any five from: 5 1 restriction endonuclease ; 2 (RE) cuts, bacterial / herbicide-resistance, gene / DNA ; 3 (RE) cuts a, plasmid / vector ; 4 DNA ligase joins, new / bacterial / foreign, gene to, plasmid / vector ; 5 ref. to joining / adding, of promoter ; 6 (promoter / regulatory sequence) ensures expression of (new / bacterial / foreign / prokaryotic) gene ; 3(b) 73 / 100 123.5 2 or 90.155 million ; (90.155 2 =) 180.31 million ; 3(c) any four from: 4 positive implications: 1 more food / higher yield (per hectare) ; 2 (farmers) use less, insecticide / pesticide ; 3 cheaper food prices for consumers ; 4 less land needed to grow food leaves more for, biodiversity / conservation ; 5 improved food nutritional value ; negative implications: 6 food allergies ; 7 greater quantity of herbicide residue on food ; 8 (evolution of) resistance in, insects / weeds / fungi / pests ; 9 pollen drift to / cross-breeding with, organic / non-GM / conventional, crops ; 10 GM crops may become invasive weeds ; 11 consumer mistrust / GM food must be clearly labelled ;
More questions on Genetically modified organisms in agriculture
Q4 · Alleles are alternative forms of a gene
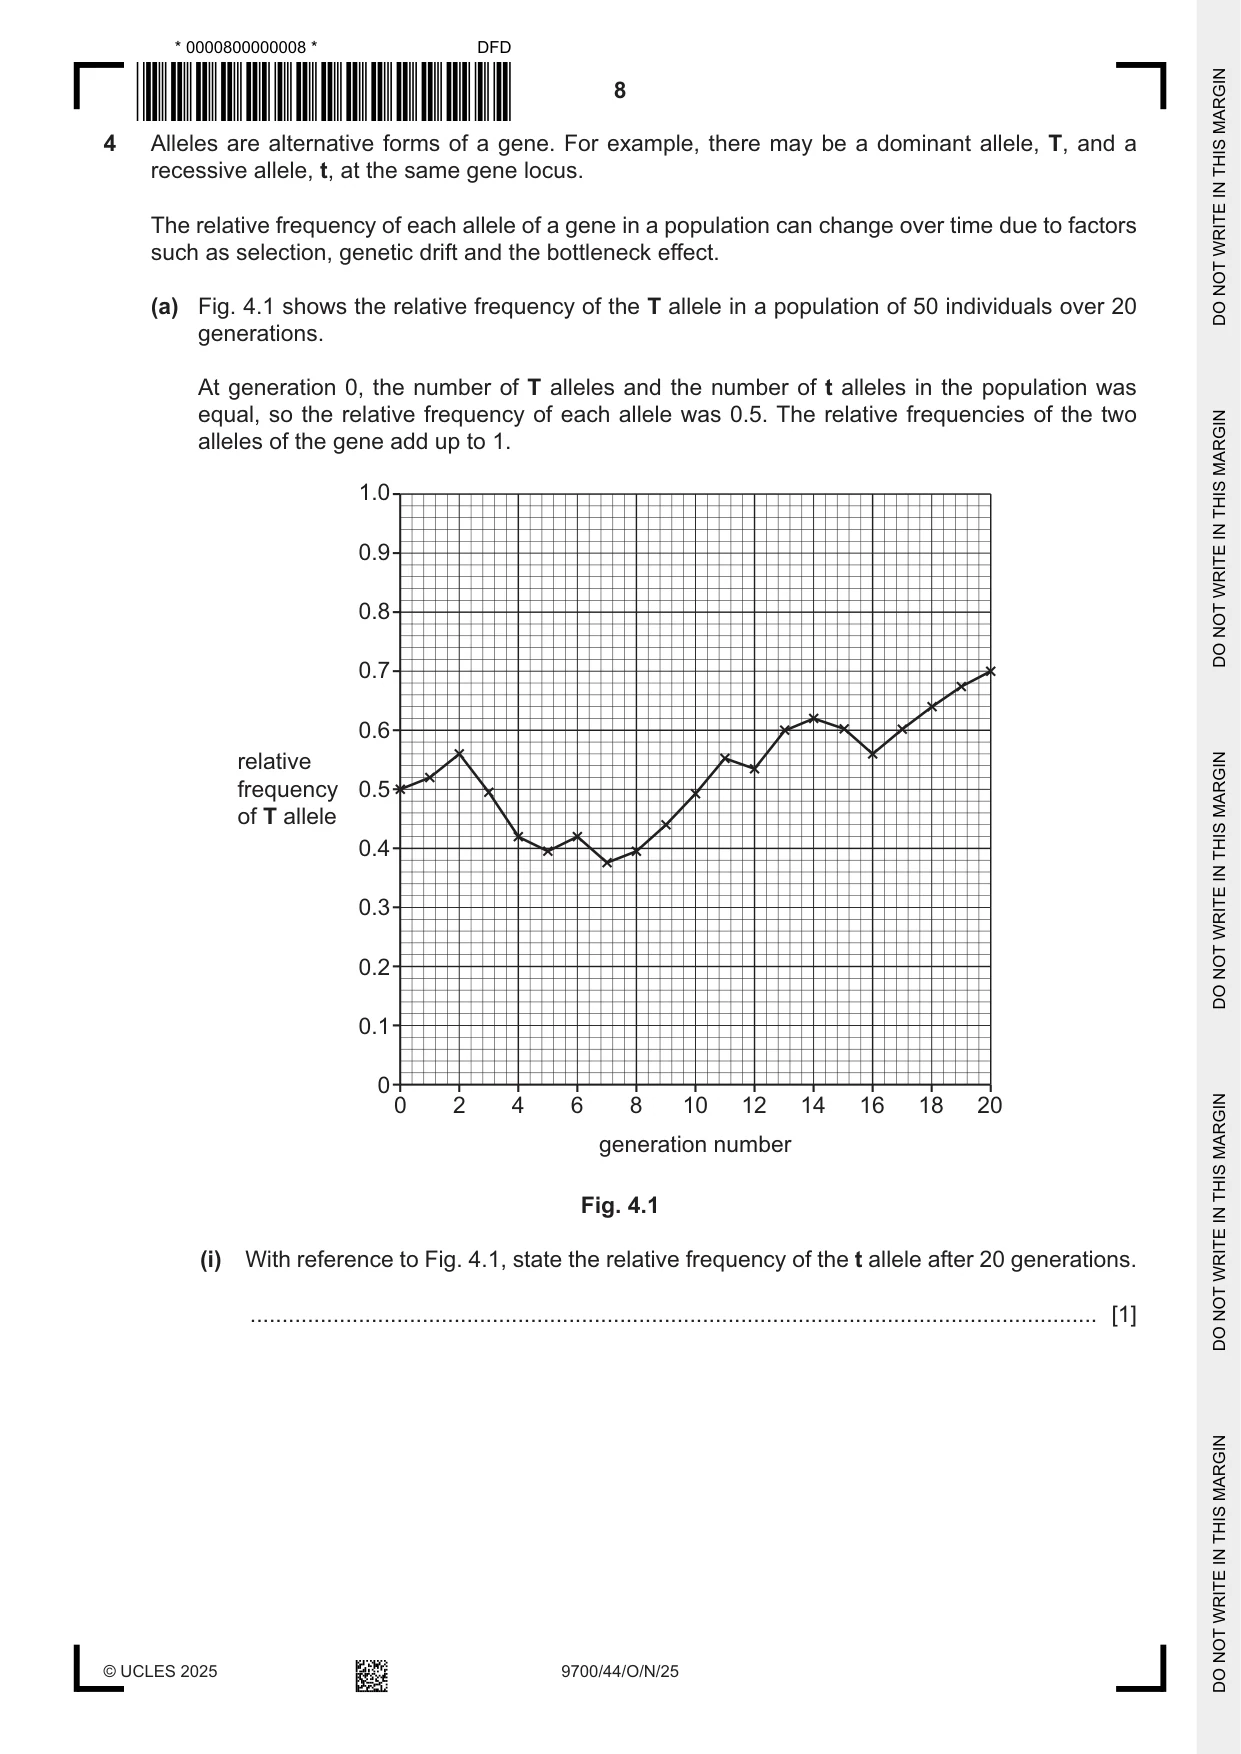
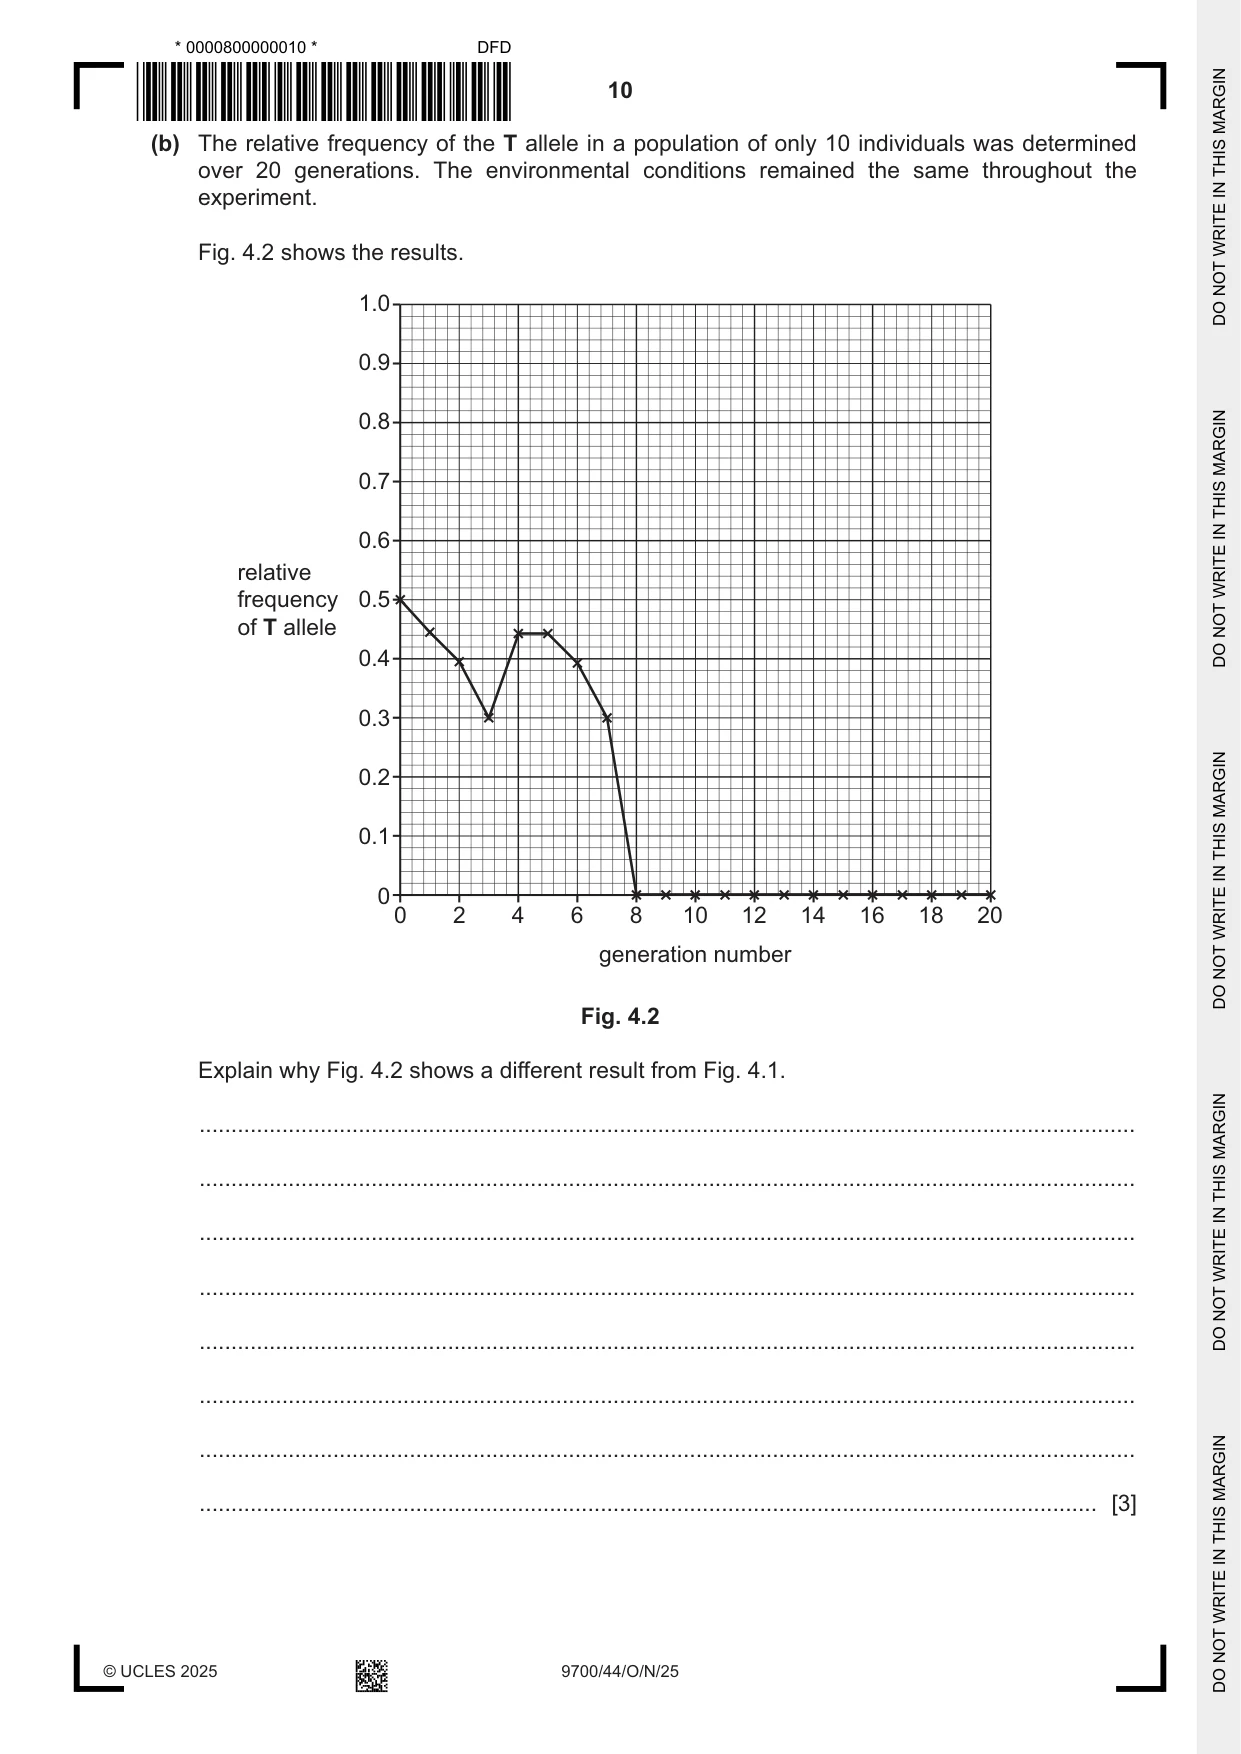
4 Alleles are alternative forms of a gene. For example, there may be a dominant allele, T, and a recessive allele, t, at the same gene locus. The relative frequency of each allele of a gene in a population can change over time due to factors such as selection, genetic drift and the bottleneck effect. (a) Fig. 4.1 shows the relative frequency of the T allele in a population of 50 individuals over 20 generations. At generation 0, the number of T alleles and the number of t alleles in the population was equal, so the relative frequency of each allele was 0.5. The relative frequencies of the two alleles of the gene add up to 1. 1.0 0.9 0.8 0.7 0.6 relative frequency 0.5 of T allele 0.4 0.3 0.2 0.1 0 0 2 4 6 8 10 12 14 16 18 20 generation number Fig. 4.1 (i) With reference to Fig. 4.1, state the relative frequency of the t allele after 20 generations. ..................................................................................................................................... [1] (ii) Suggest possible explanations for the change in the relative frequency of the T allele between generation 0 and generation 13. ........................................................................................................................................... ........................................................................................................................................... ........................................................................................................................................... ........................................................................................................................................... ........................................................................................................................................... ........................................................................................................................................... ........................................................................................................................................... ........................................................................................................................................... ........................................................................................................................................... ..................................................................................................................................... [4] (b) The relative frequency of the T allele in a population of only 10 individuals was determined over 20 generations. The environmental conditions remained the same throughout the experiment. Fig. 4.2 shows the results. 1.0 0.9 0.8 0.7 0.6 relative frequency 0.5 of T allele 0.4 0.3 0.2 0.1 0 0 2 4 6 8 10 12 14 16 18 20 generation number Fig. 4.2 Explain why Fig. 4.2 shows a different result from Fig. 4.1. ................................................................................................................................................... ................................................................................................................................................... ................................................................................................................................................... ................................................................................................................................................... ................................................................................................................................................... ................................................................................................................................................... ................................................................................................................................................... ............................................................................................................................................. [3] (c) State the name of the principle that can be used to calculate relative frequencies of two alleles by counting the numbers of organisms in the population showing dominant and recessive phenotypes. ............................................................................................................................................. [1] [Total: 9]
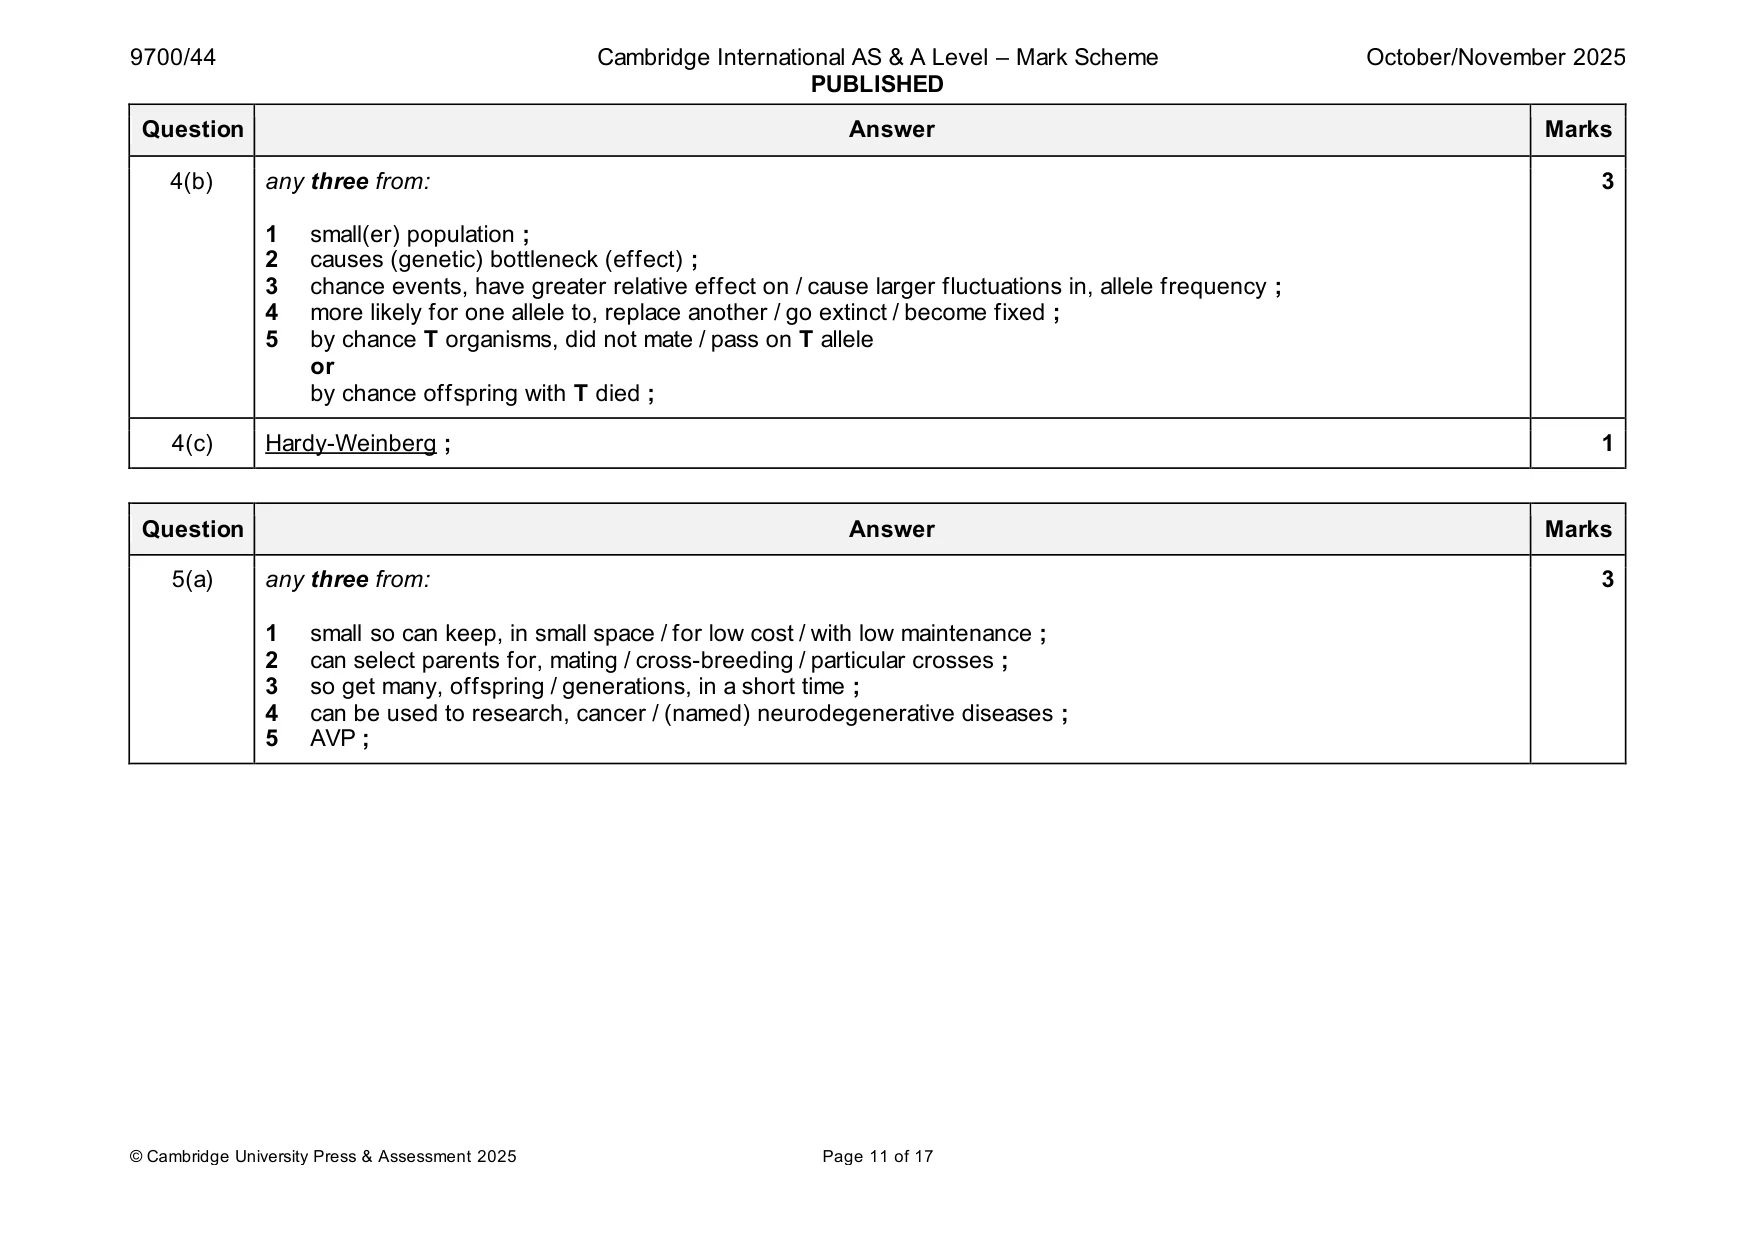
Mark scheme: 4(a)(i) 0.3 ; 1 4(a)(ii) any four from: 4 1 genetic drift ; 2 (drift as) frequency, fluctuates / decreases and increases / shows random changes / does not change markedly in just one direction ; 3 directional selection ; 4 from (generation) 2 to 7 / at first, T decreases as, T is selected against and from (generation) 7 to 13 / later, T increased as, T is selected for; 5 may be, stabilising selection / selection for heterozygotes ; 6 (stabilising selection) keeps relative allele frequencies roughly the same ; 4(b) any three from: 3 1 small(er) population ; 2 causes (genetic) bottleneck (effect) ; 3 chance events, have greater relative effect on / cause larger fluctuations in, allele frequency ; 4 more likely for one allele to, replace another / go extinct / become fixed ; 5 by chance T organisms, did not mate / pass on T allele or by chance offspring with T died ; 4(c) Hardy-Weinberg ; 1
Q5 · The fruit fly, Drosophila melanogaster, feeds on sugars found in damaged fruits
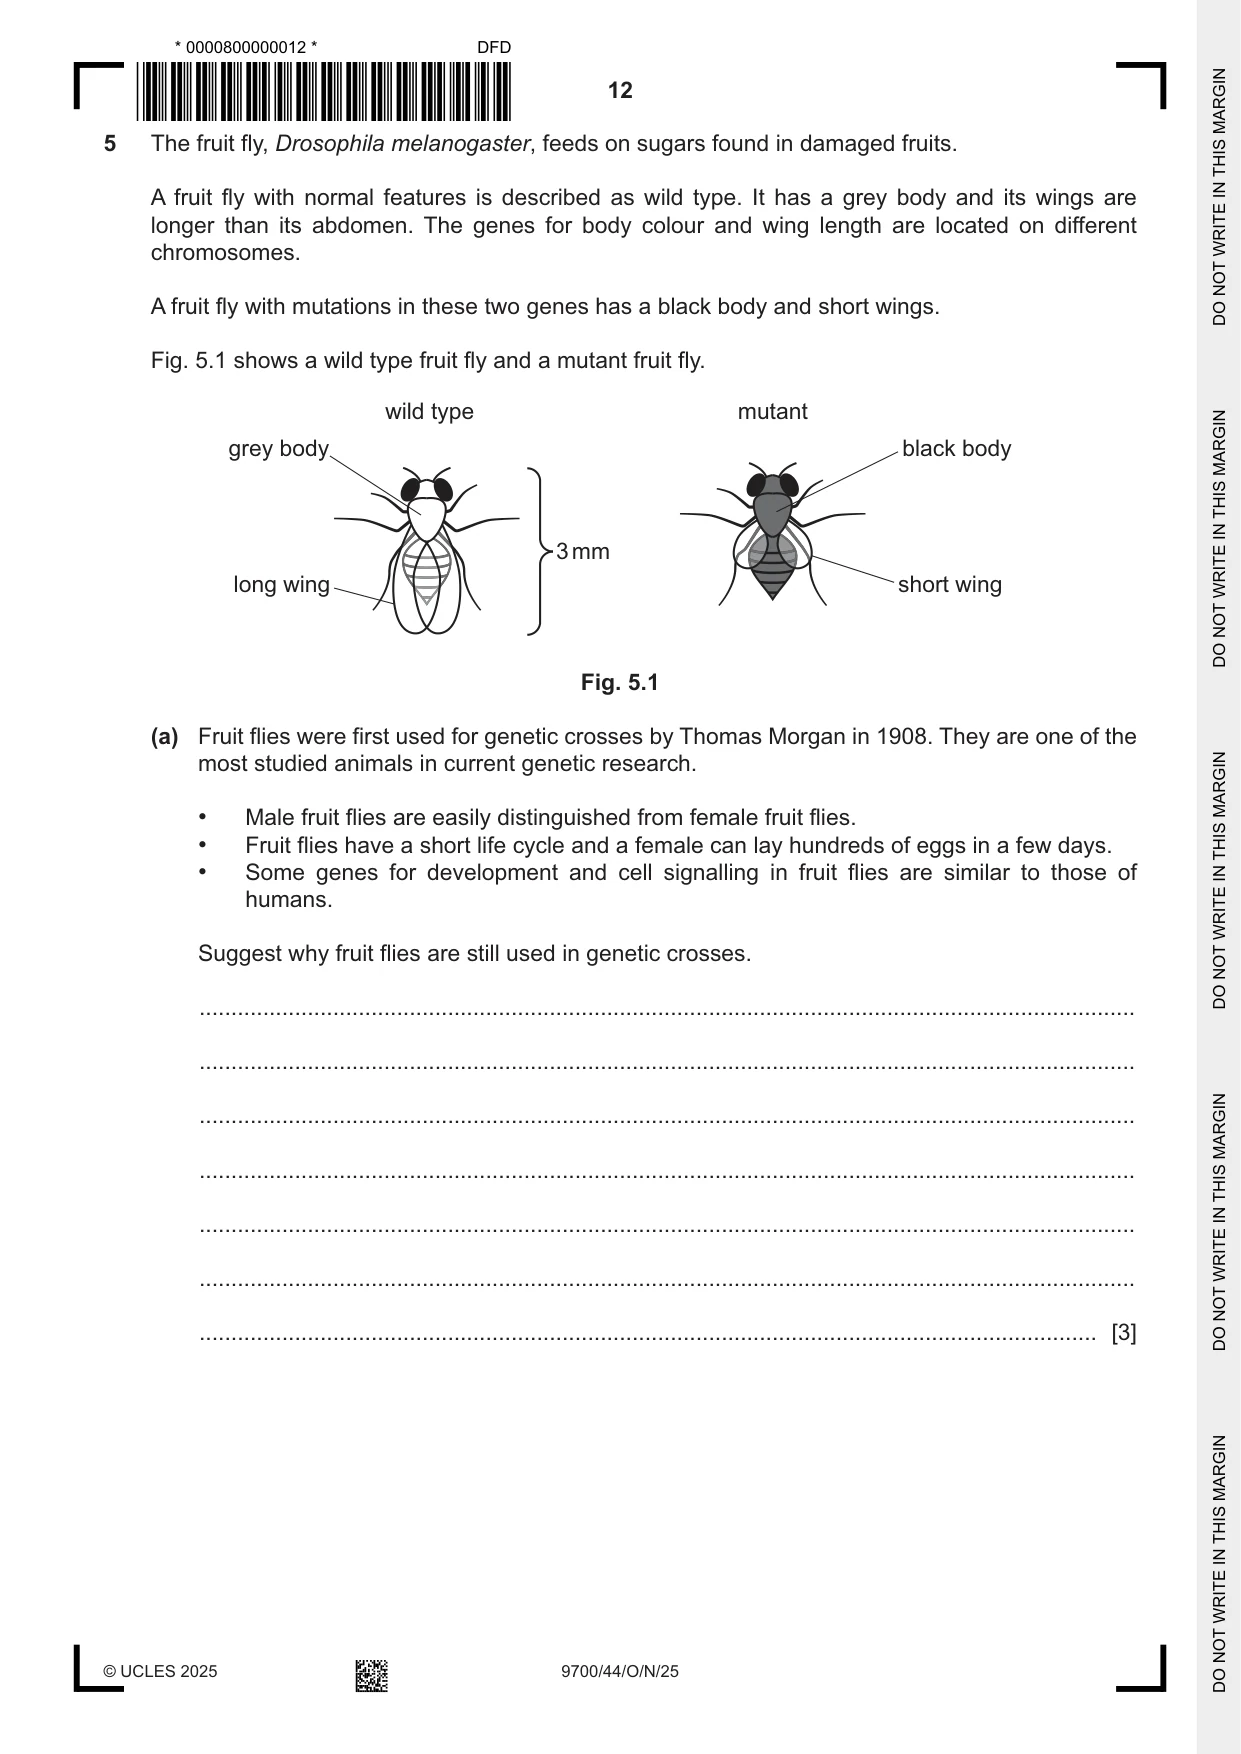
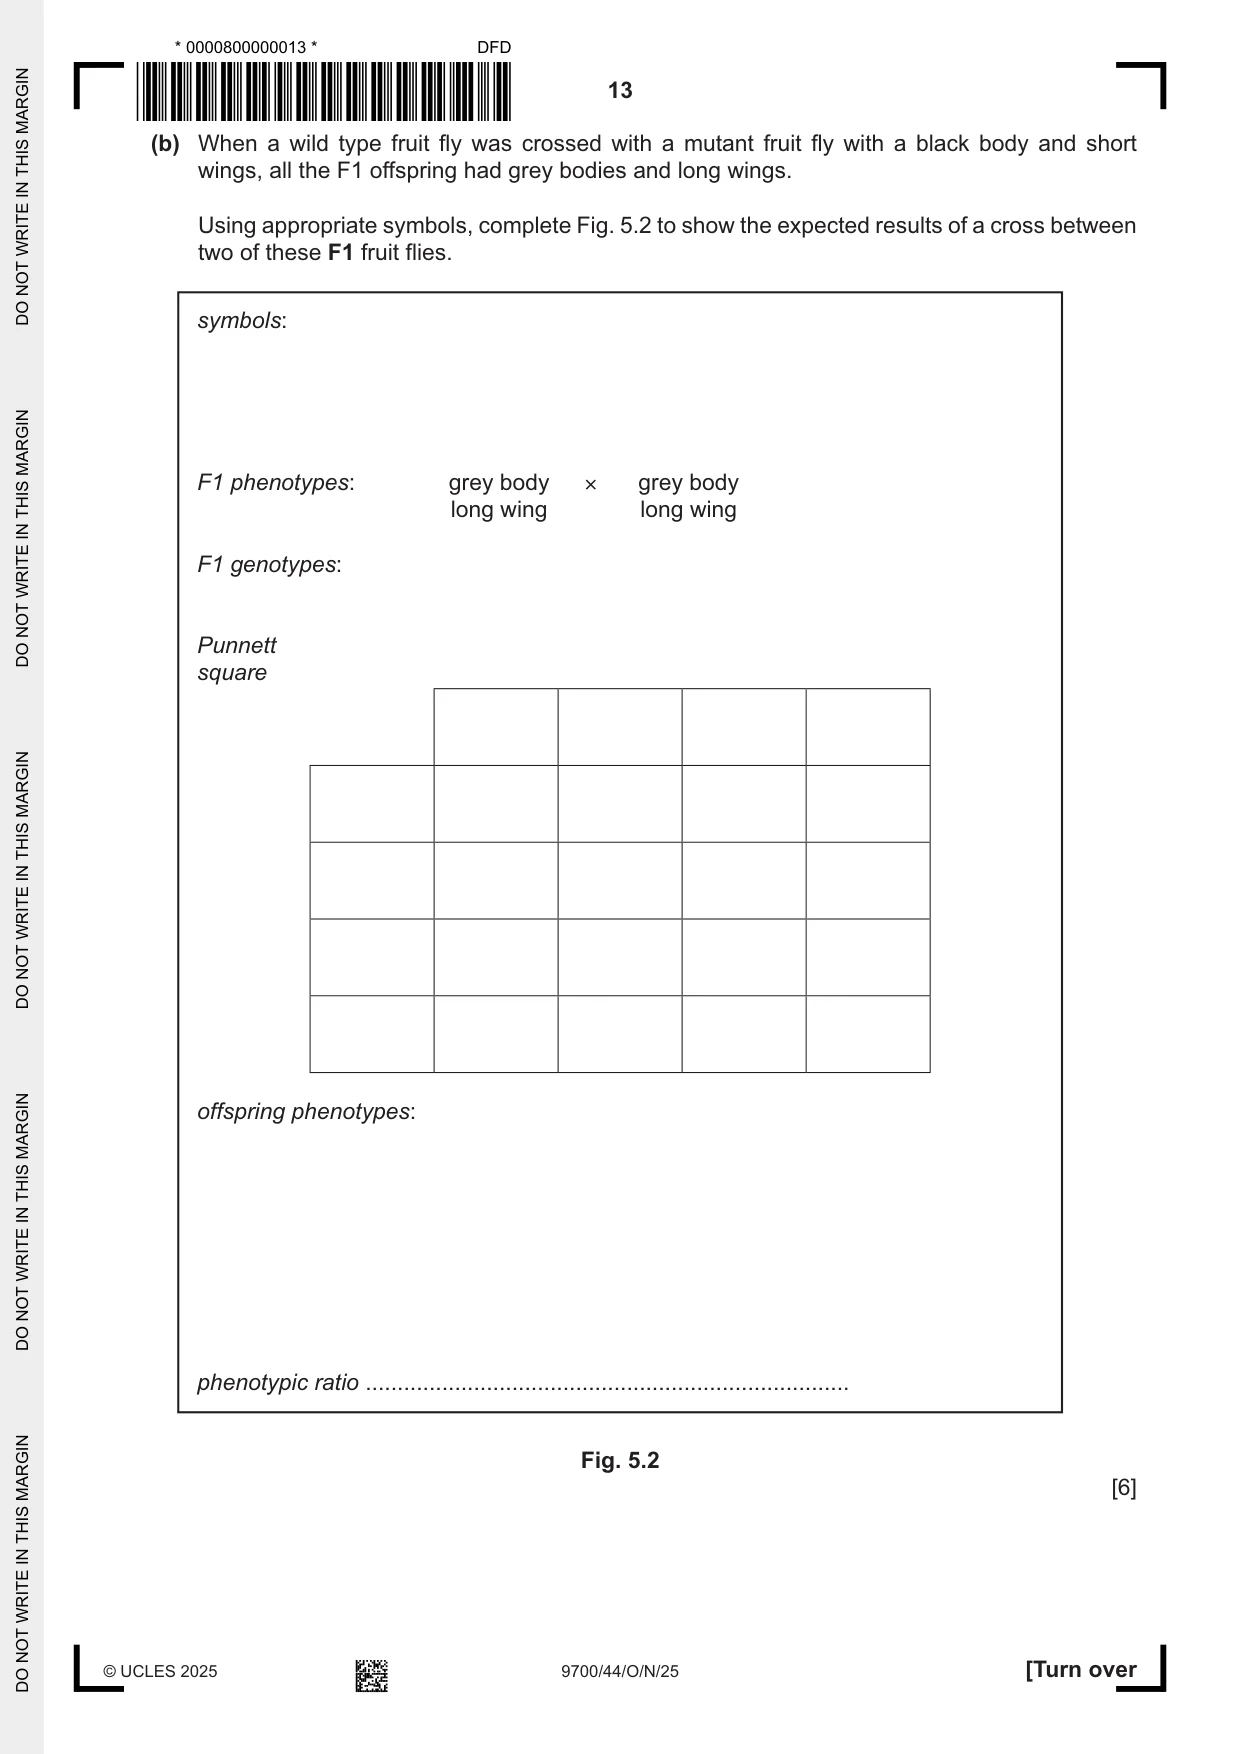
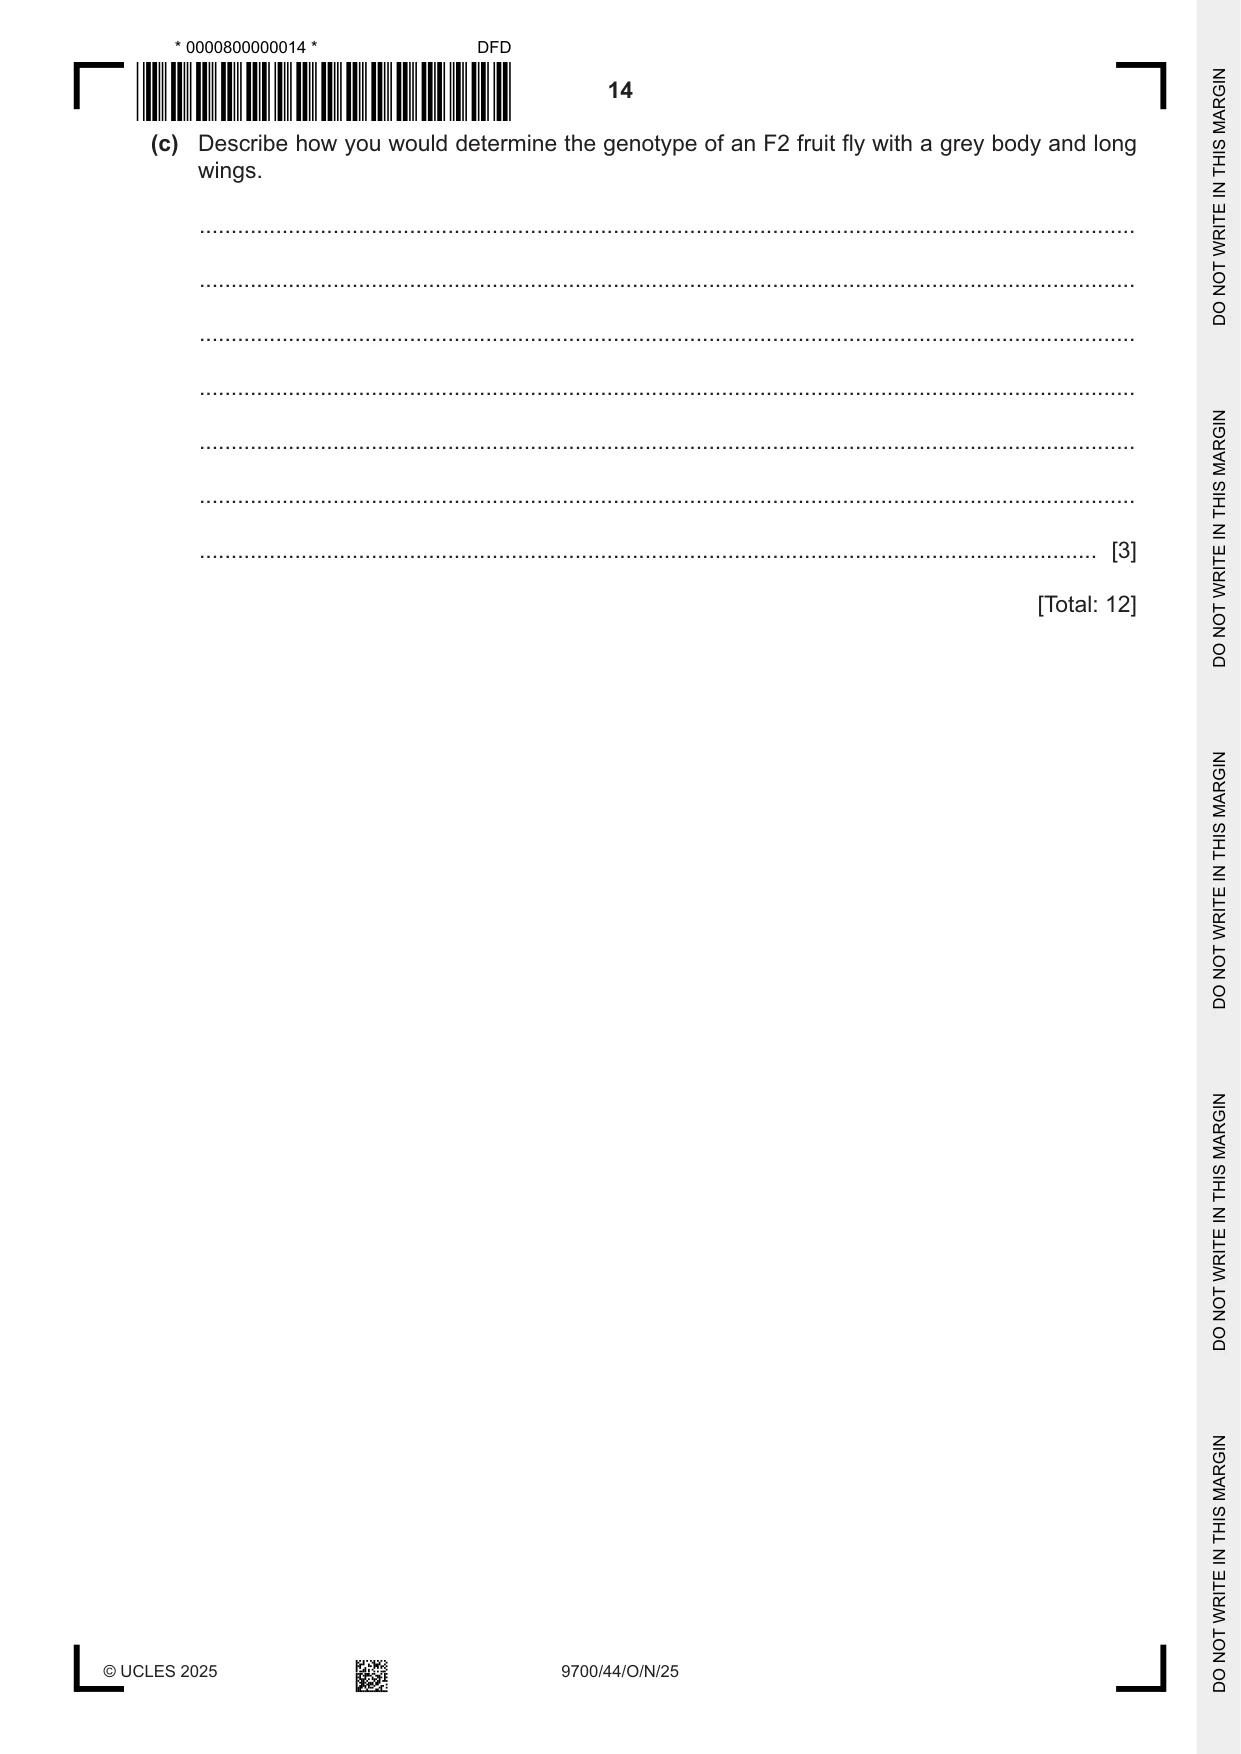
5 The fruit fly, Drosophila melanogaster, feeds on sugars found in damaged fruits. A fruit fly with normal features is described as wild type. It has a grey body and its wings are longer than its abdomen. The genes for body colour and wing length are located on different chromosomes. A fruit fly with mutations in these two genes has a black body and short wings. Fig. 5.1 shows a wild type fruit fly and a mutant fruit fly. wild type mutant grey body black body 3mm long wing short wing Fig. 5.1 (a) Fruit flies were first used for genetic crosses by Thomas Morgan in 1908. They are one of the most studied animals in current genetic research. • Male fruit flies are easily distinguished from female fruit flies. • Fruit flies have a short life cycle and a female can lay hundreds of eggs in a few days. • Some genes for development and cell signalling in fruit flies are similar to those of humans. Suggest why fruit flies are still used in genetic crosses. ................................................................................................................................................... ................................................................................................................................................... ................................................................................................................................................... ................................................................................................................................................... ................................................................................................................................................... ................................................................................................................................................... ............................................................................................................................................. [3] (b) When a wild type fruit fly was crossed with a mutant fruit fly with a black body and short wings, all the F1 offspring had grey bodies and long wings. Using appropriate symbols, complete Fig. 5.2 to show the expected results of a cross between two of these F1 fruit flies. symbols: F1 phenotypes: grey body × grey body long wing long wing F1 genotypes: Punnett square offspring phenotypes: phenotypic ratio ............................................................................ Fig. 5.2 [6] (c) Describe how you would determine the genotype of an F2 fruit fly with a grey body and long wings. ................................................................................................................................................... ................................................................................................................................................... ................................................................................................................................................... ................................................................................................................................................... ................................................................................................................................................... ................................................................................................................................................... ............................................................................................................................................. [3] [Total: 12]
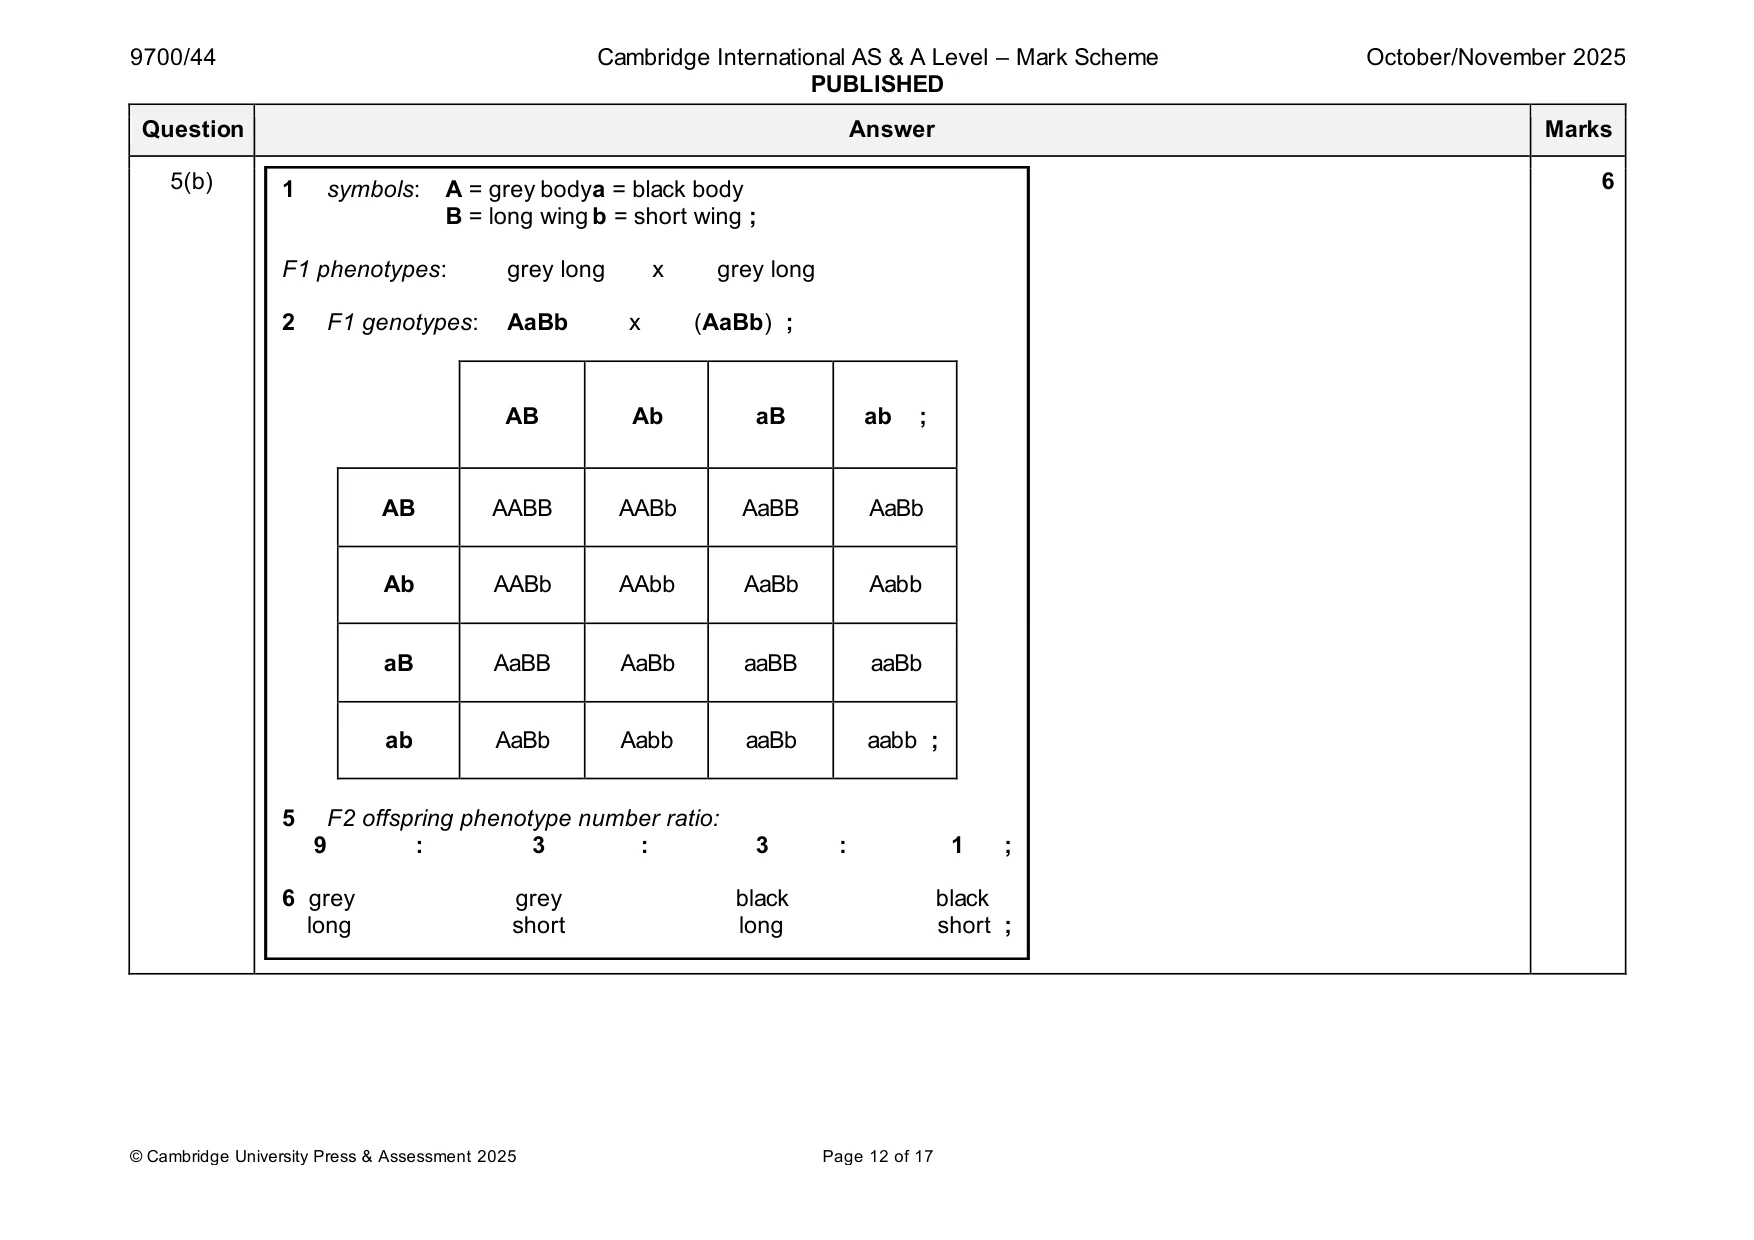
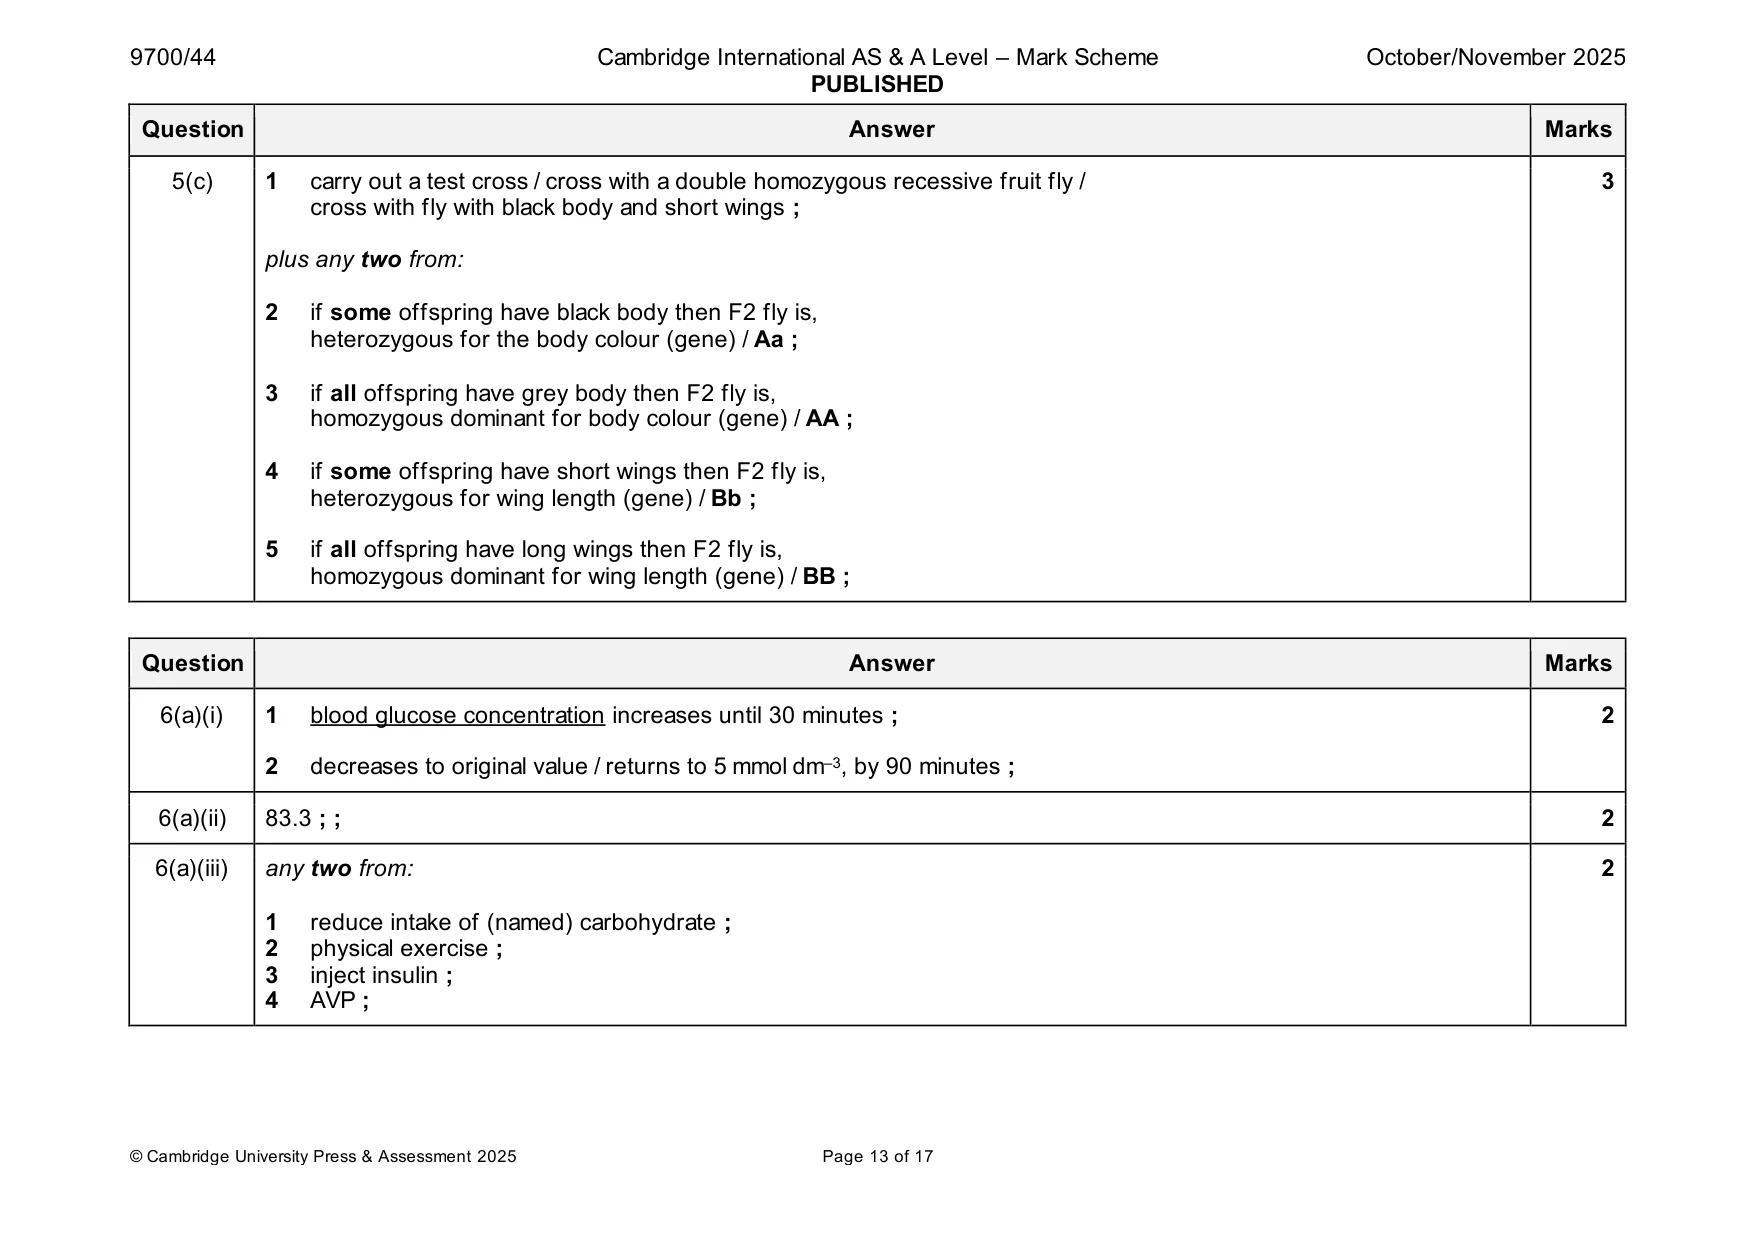
Mark scheme: 5(a) any three from: 3 1 small so can keep, in small space / for low cost / with low maintenance ; 2 can select parents for, mating / cross-breeding / particular crosses ; 3 so get many, offspring / generations, in a short time ; 4 can be used to research, cancer / (named) neurodegenerative diseases ; 5 AVP ; 5(b) 6 1 symbols: A = grey bodya = black body B = long wing b = short wing ; F1 phenotypes: grey long x grey long 2 F1 genotypes: AaBb x (AaBb) ; AB Ab aB ab ; AB AABB AABb AaBB AaBb Ab AABb AAbb AaBb Aabb aB AaBB AaBb aaBB aaBb ab AaBb Aabb aaBb aabb ; 5 F2 offspring phenotype number ratio: 9 : 3 : 3 : 1 ; 6 grey grey black black long short long short ; 5(c) 1 carry out a test cross / cross with a double homozygous recessive fruit fly / 3 cross with fly with black body and short wings ; plus any two from: 2 if some offspring have black body then F2 fly is, heterozygous for the body colour (gene) / Aa ; 3 if all offspring have grey body then F2 fly is, homozygous dominant for body colour (gene) / AA ; 4 if some offspring have short wings then F2 fly is, heterozygous for wing length (gene) / Bb ; 5 if all offspring have long wings then F2 fly is, homozygous dominant for wing length (gene) / BB ;
More questions on Passage of information from parents to offspring
Q6 · Some people can develop a condition called type 2 diabetes
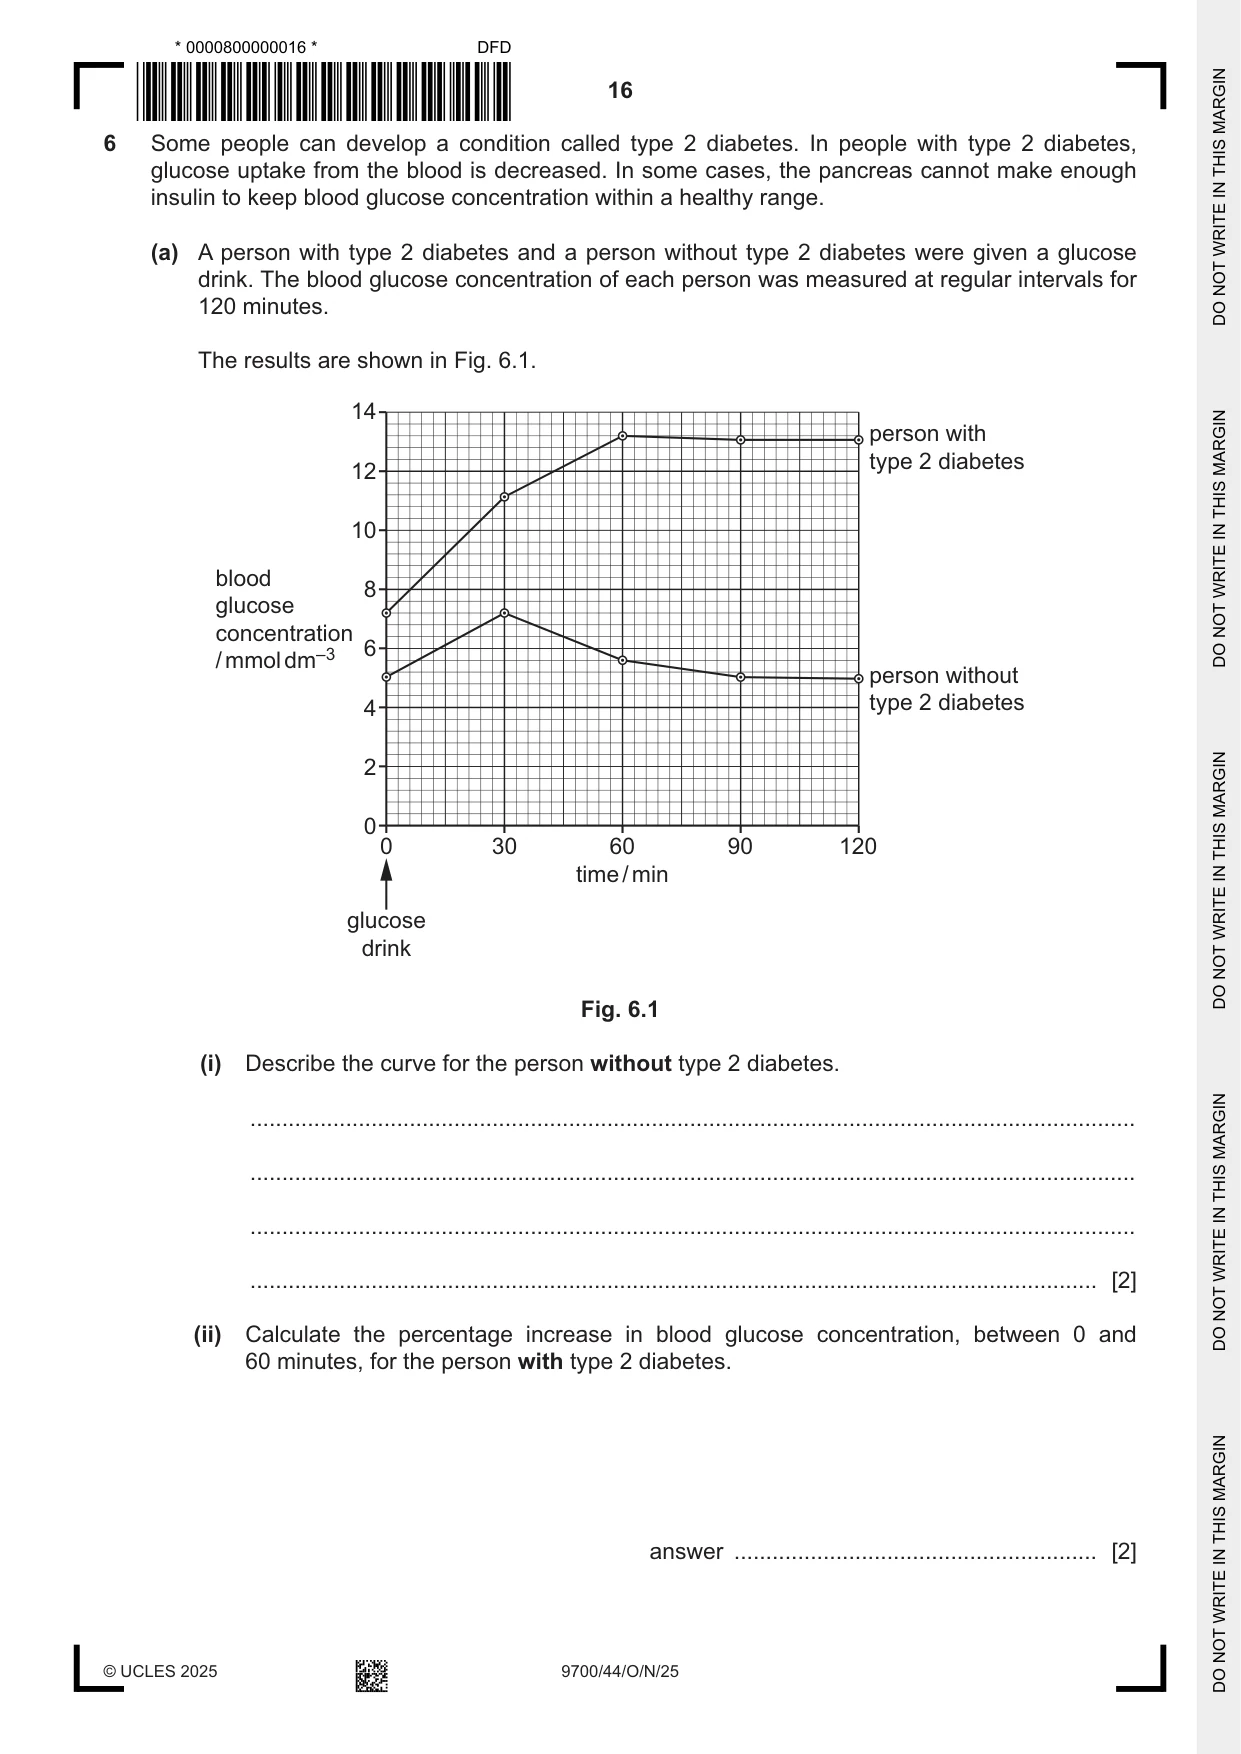
6 Some people can develop a condition called type 2 diabetes. In people with type 2 diabetes, glucose uptake from the blood is decreased. In some cases, the pancreas cannot make enough insulin to keep blood glucose concentration within a healthy range. (a) A person with type 2 diabetes and a person without type 2 diabetes were given a glucose drink. The blood glucose concentration of each person was measured at regular intervals for 120 minutes. The results are shown in Fig. 6.1. 14 person with type 2 diabetes 12 10 blood 8 glucose concentration 6 / mmol dm–3 person without 4 type 2 diabetes 2 0 0 30 60 90 120 time / min glucose drink Fig. 6.1 (i) Describe the curve for the person without type 2 diabetes. ........................................................................................................................................... ........................................................................................................................................... ........................................................................................................................................... ..................................................................................................................................... [2] (ii) Calculate the percentage increase in blood glucose concentration, between 0 and 60 minutes, for the person with type 2 diabetes. answer ......................................................... [2] (iii) Suggest ways in which people with type 2 diabetes can help to control their condition. ........................................................................................................................................... ........................................................................................................................................... ........................................................................................................................................... ..................................................................................................................................... [2] (b) Glucagon has a role in the control of blood glucose concentration. Describe the cell signalling pathway involving glucagon, and describe how this pathway leads to a change in the blood glucose concentration. ................................................................................................................................................... ................................................................................................................................................... ................................................................................................................................................... ................................................................................................................................................... ................................................................................................................................................... ................................................................................................................................................... ................................................................................................................................................... ................................................................................................................................................... ................................................................................................................................................... ................................................................................................................................................... ................................................................................................................................................... ................................................................................................................................................... ................................................................................................................................................... ................................................................................................................................................... ................................................................................................................................................... ................................................................................................................................................... ................................................................................................................................................... ............................................................................................................................................. [7] [Total: 13]
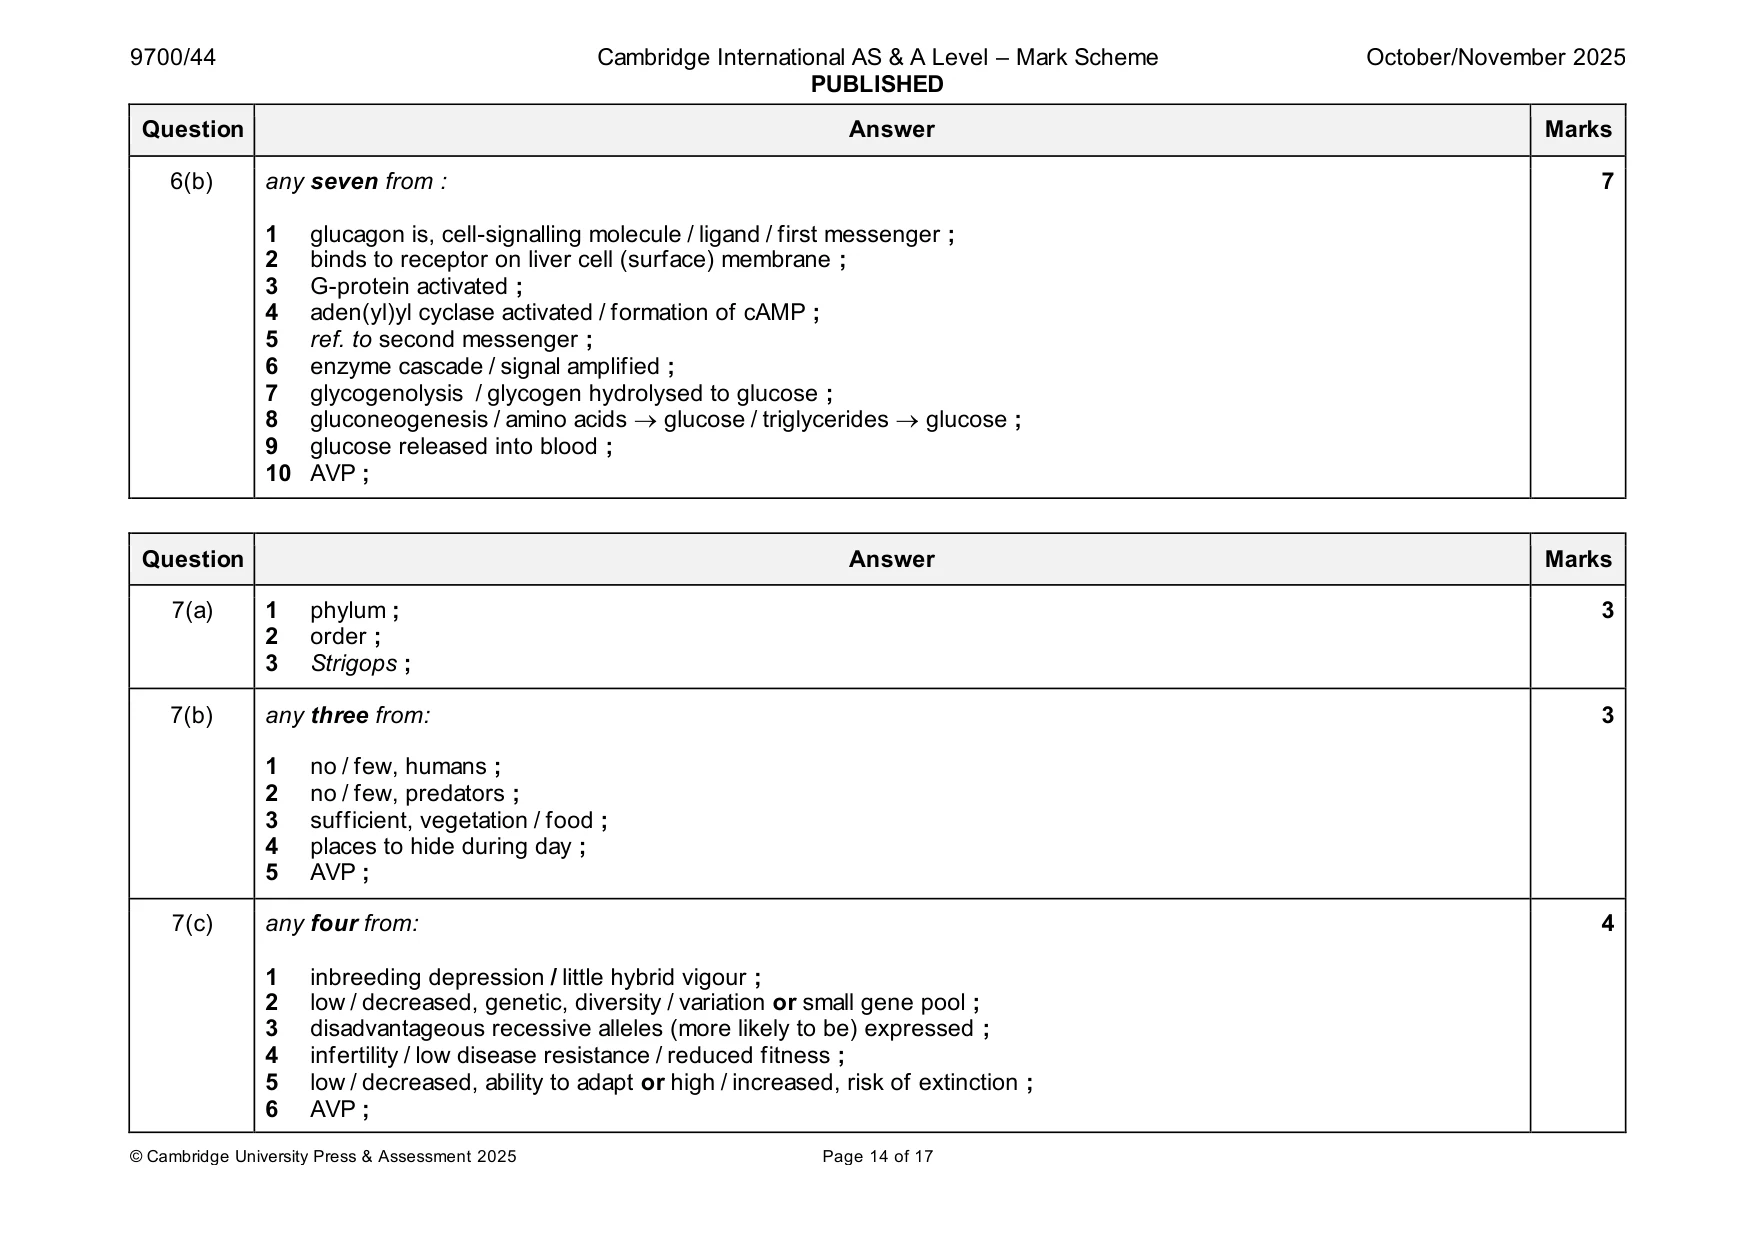
Mark scheme: 6(a)(i) 1 blood glucose concentration increases until 30 minutes ; 2 2 decreases to original value / returns to 5 mmol dm–3, by 90 minutes ; 6(a)(ii) 83.3 ; ; 2 6(a)(iii) any two from: 2 1 reduce intake of (named) carbohydrate ; 2 physical exercise ; 3 inject insulin ; 4 AVP ; 6(b) any seven from : 7 1 glucagon is, cell-signalling molecule / ligand / first messenger ; 2 binds to receptor on liver cell (surface) membrane ; 3 G-protein activated ; 4 aden(yl)yl cyclase activated / formation of cAMP ; 5 ref. to second messenger ; 6 enzyme cascade / signal amplified ; 7 glycogenolysis / glycogen hydrolysed to glucose ; 8 gluconeogenesis / amino acids → glucose / triglycerides → glucose ; 9 glucose released into blood ; 10 AVP ;
Q7 · The kakapo, Strigops habroptila, is a species of large, nocturnal (active at night)…
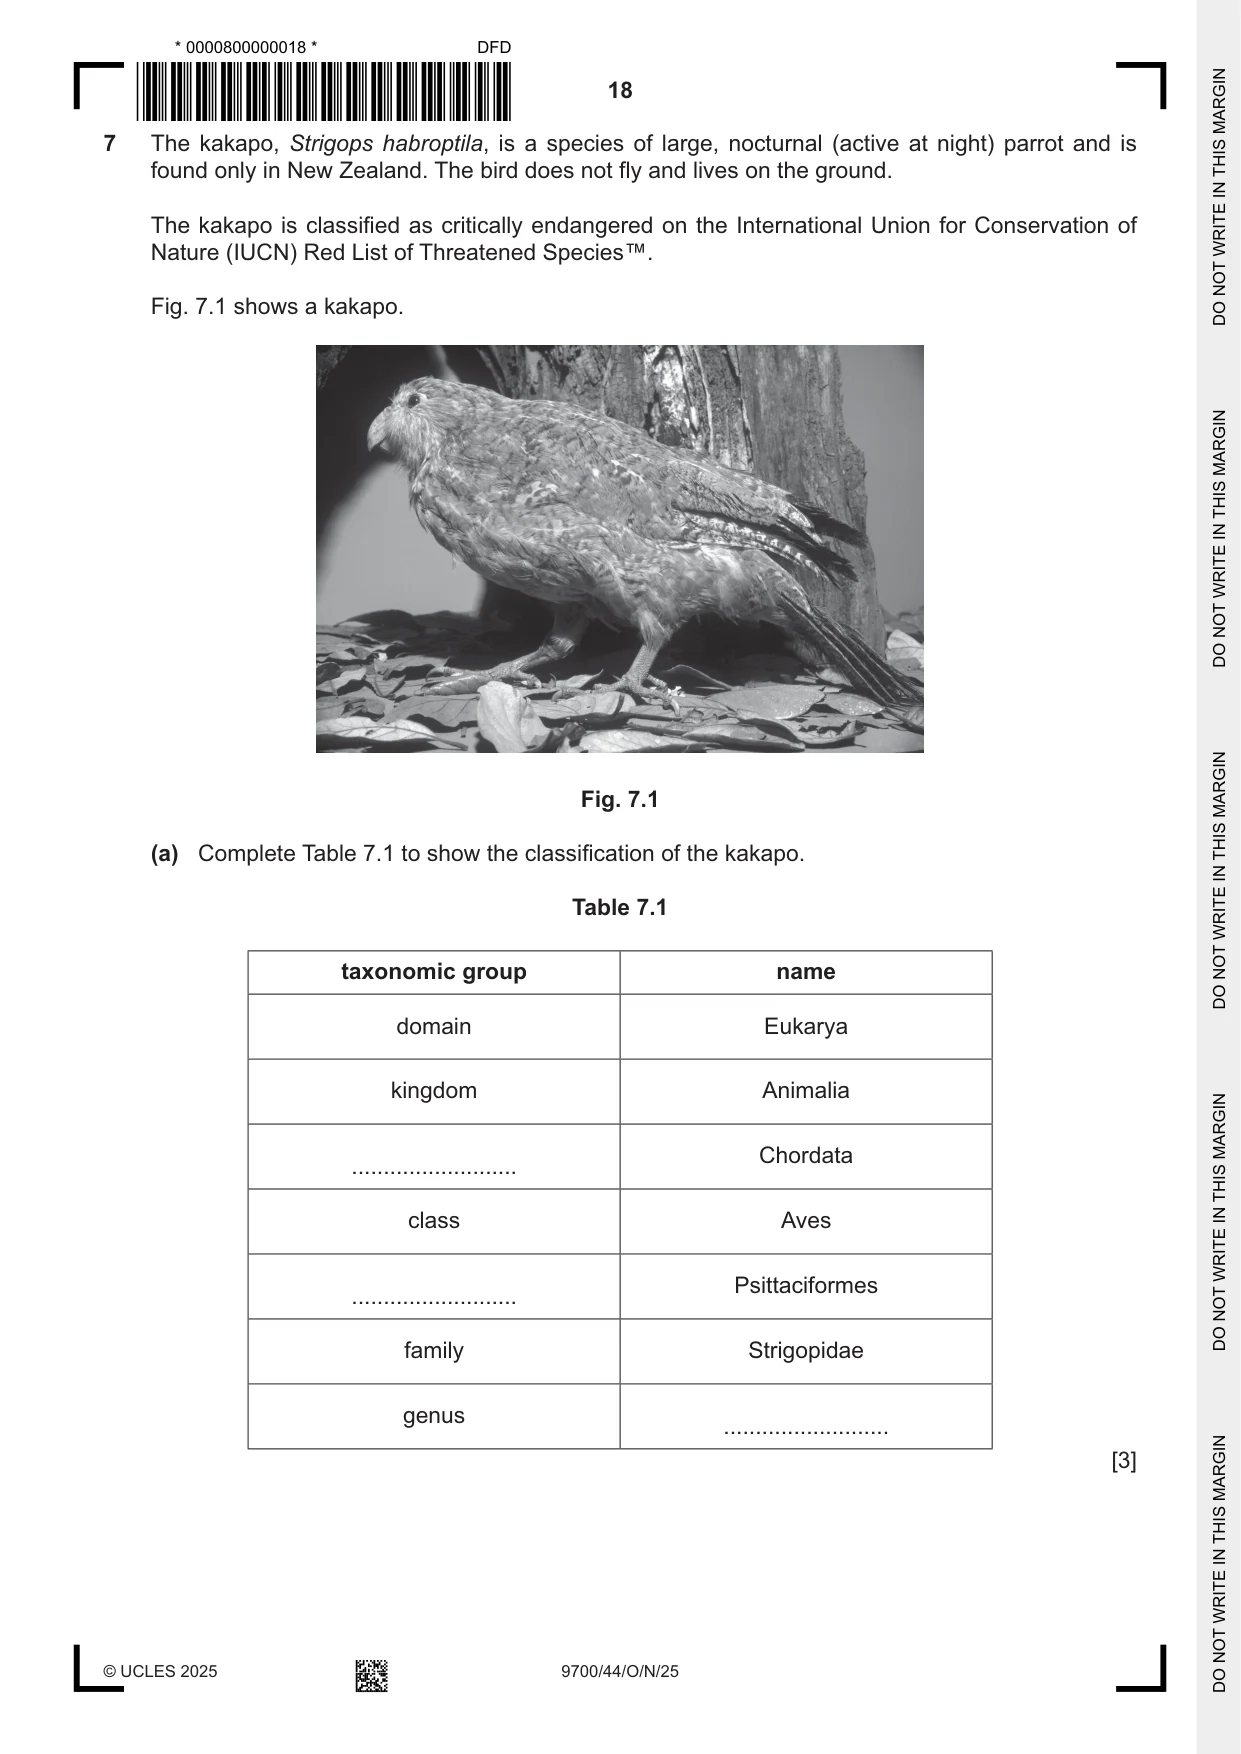
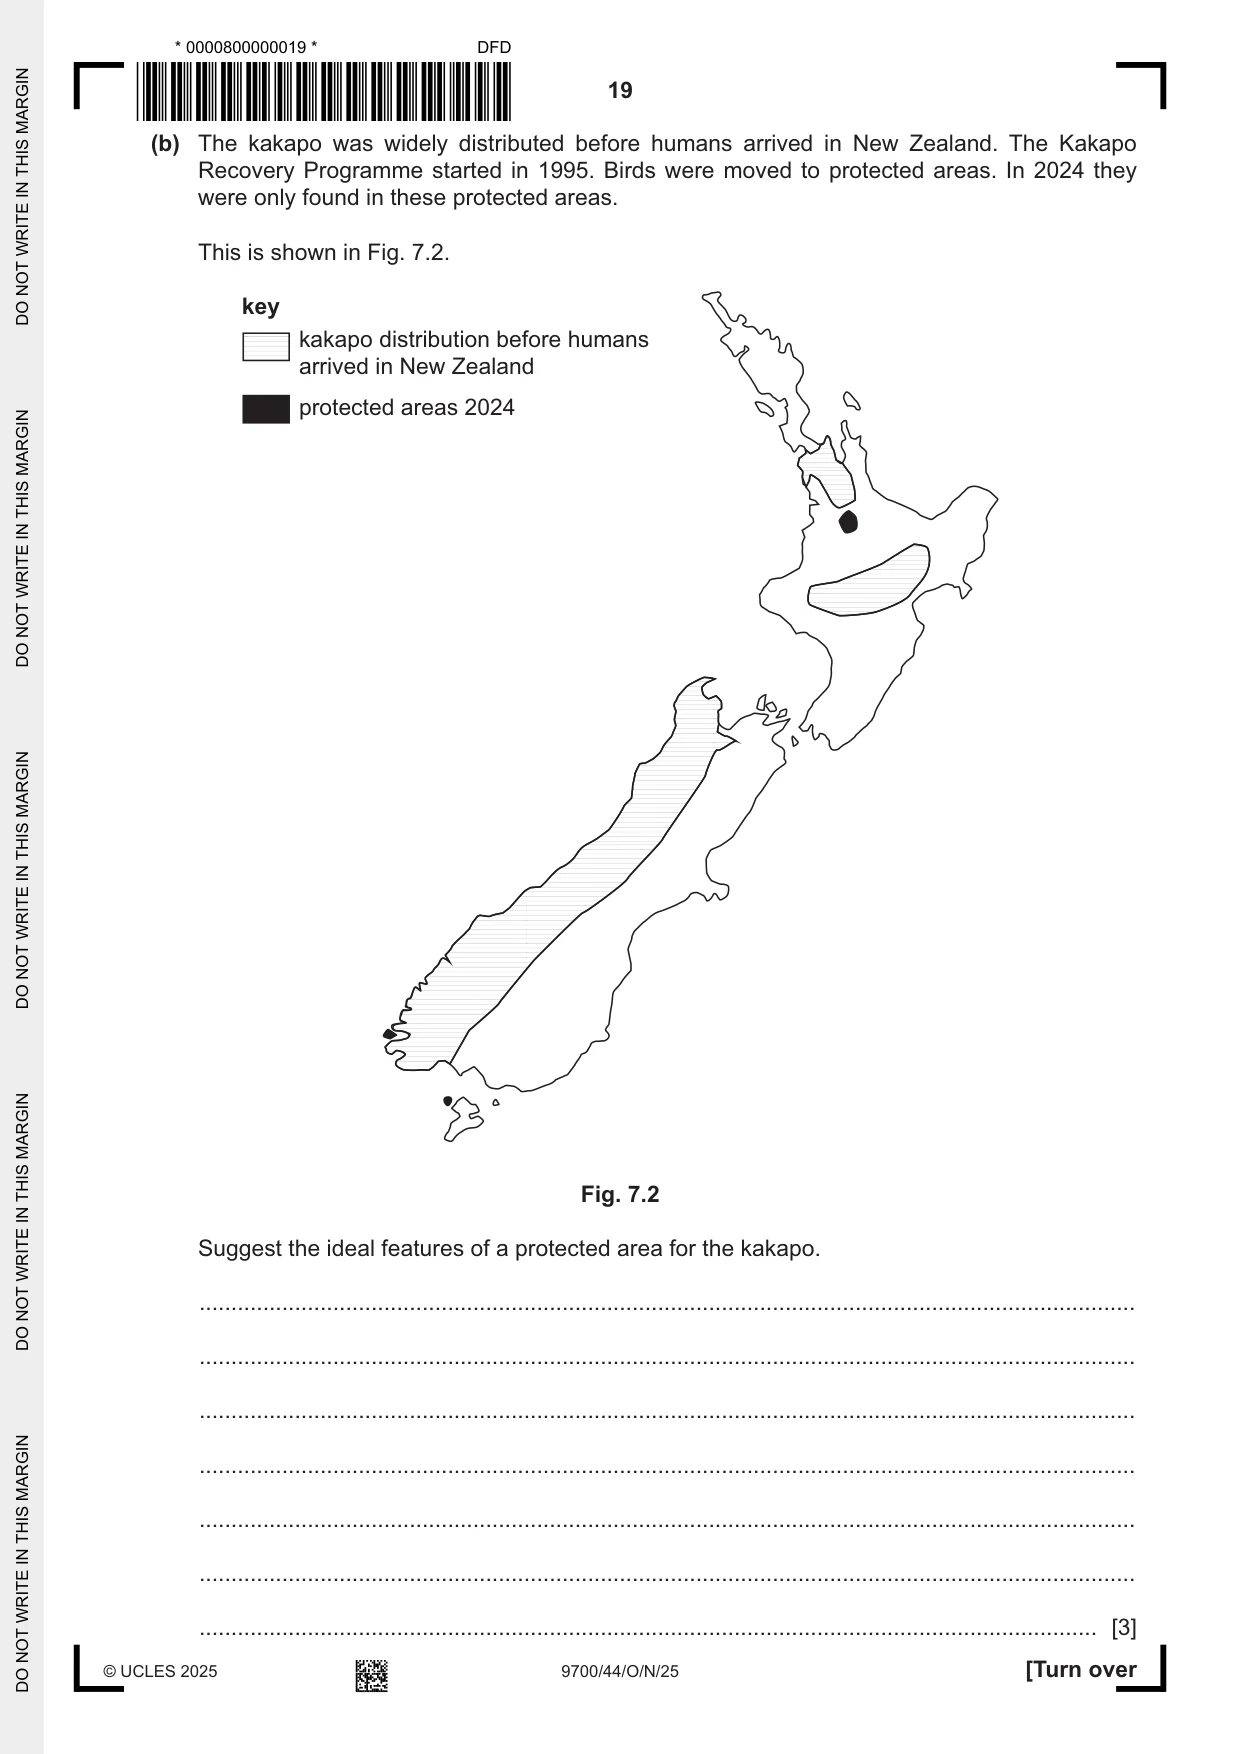
7 The kakapo, Strigops habroptila, is a species of large, nocturnal (active at night) parrot and is found only in New Zealand. The bird does not fly and lives on the ground. The kakapo is classified as critically endangered on the International Union for Conservation of Nature (IUCN) Red List of Threatened Species™. Fig. 7.1 shows a kakapo. Fig. 7.1 (a) Complete Table 7.1 to show the classification of the kakapo. Table 7.1 taxonomic group name domain Eukarya kingdom Animalia Chordata .......................... class Aves Psittaciformes .......................... family Strigopidae genus .......................... [3] (b) The kakapo was widely distributed before humans arrived in New Zealand. The Kakapo Recovery Programme started in 1995. Birds were moved to protected areas. In 2024 they were only found in these protected areas. This is shown in Fig. 7.2. key kakapo distribution before humans arrived in New Zealand protected areas 2024 Fig. 7.2 Suggest the ideal features of a protected area for the kakapo. ................................................................................................................................................... ................................................................................................................................................... ................................................................................................................................................... ................................................................................................................................................... ................................................................................................................................................... ................................................................................................................................................... ............................................................................................................................................. [3] (c) DNA has shown that the kakapo population may have gone through one or more genetic bottlenecks after the arrival of humans in New Zealand. Suggest the consequences of a genetic bottleneck to the kakapo population in New Zealand. ................................................................................................................................................... ................................................................................................................................................... ................................................................................................................................................... ................................................................................................................................................... ................................................................................................................................................... ................................................................................................................................................... ................................................................................................................................................... ................................................................................................................................................... ............................................................................................................................................. [4] [Total: 10]
Mark scheme: 7(a) 1 phylum ; 3 2 order ; 3 Strigops ; 7(b) any three from: 3 1 no / few, humans ; 2 no / few, predators ; 3 sufficient, vegetation / food ; 4 places to hide during day ; 5 AVP ; 7(c) any four from: 4 1 inbreeding depression / little hybrid vigour ; 2 low / decreased, genetic, diversity / variation or small gene pool ; 3 disadvantageous recessive alleles (more likely to be) expressed ; 4 infertility / low disease resistance / reduced fitness ; 5 low / decreased, ability to adapt or high / increased, risk of extinction ; 6 AVP ;
Q8 · When the water supply to a plant is reduced, the concentration of abscisic acid (ABA) in…
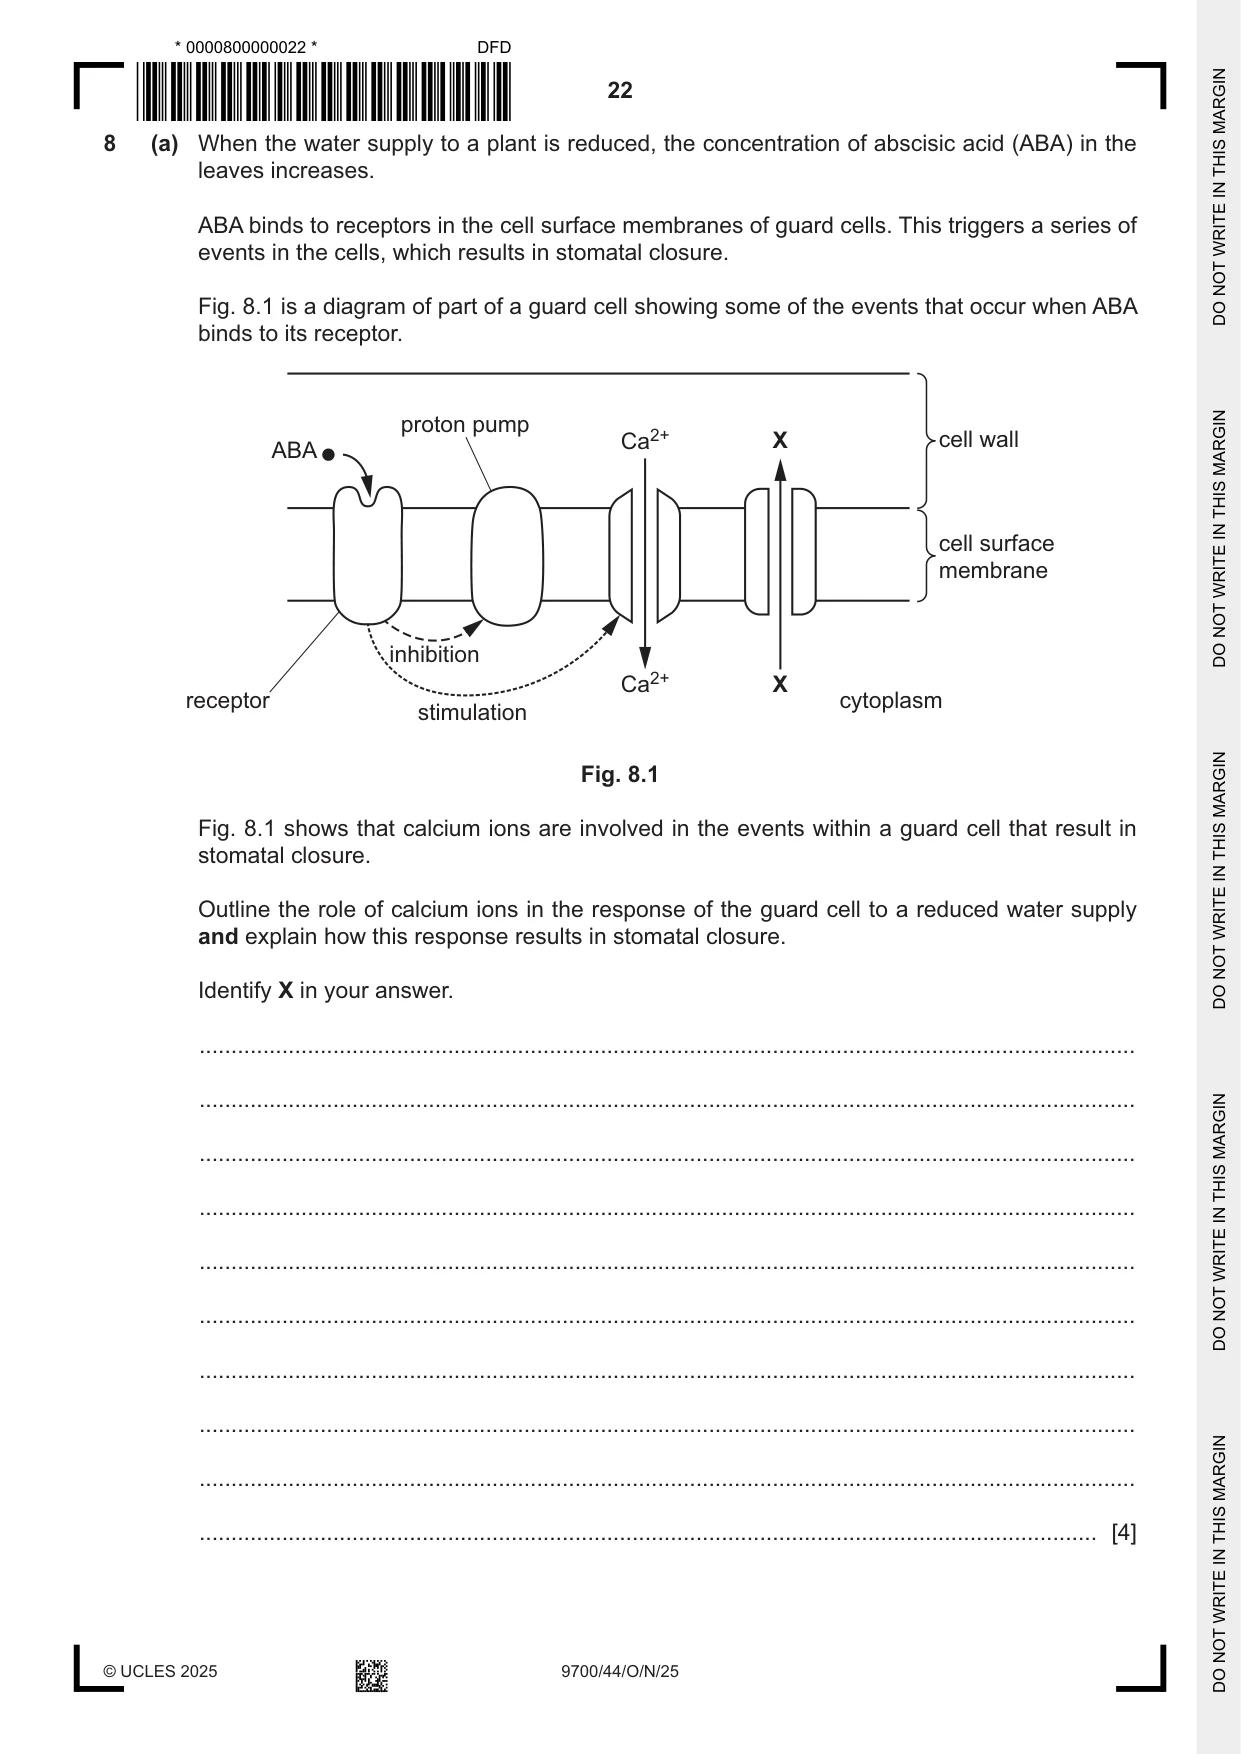
8 (a) When the water supply to a plant is reduced, the concentration of abscisic acid (ABA) in the leaves increases. ABA binds to receptors in the cell surface membranes of guard cells. This triggers a series of events in the cells, which results in stomatal closure. Fig. 8.1 is a diagram of part of a guard cell showing some of the events that occur when ABA binds to its receptor. proton pump Ca2+ X cell wall ABA cell surface membrane inhibition Ca2+ X receptor cytoplasm stimulation Fig. 8.1 Fig. 8.1 shows that calcium ions are involved in the events within a guard cell that result in stomatal closure. Outline the role of calcium ions in the response of the guard cell to a reduced water supply and explain how this response results in stomatal closure. Identify X in your answer. ................................................................................................................................................... ................................................................................................................................................... ................................................................................................................................................... ................................................................................................................................................... ................................................................................................................................................... ................................................................................................................................................... ................................................................................................................................................... ................................................................................................................................................... ................................................................................................................................................... ............................................................................................................................................. [4] (b) Explain, using examples, why the homeostatic control involving the opening and closing of stomata is important for the efficient functioning of plants. ................................................................................................................................................... ................................................................................................................................................... ................................................................................................................................................... ................................................................................................................................................... ................................................................................................................................................... ................................................................................................................................................... ................................................................................................................................................... ................................................................................................................................................... ................................................................................................................................................... ............................................................................................................................................. [4] [Total: 8]
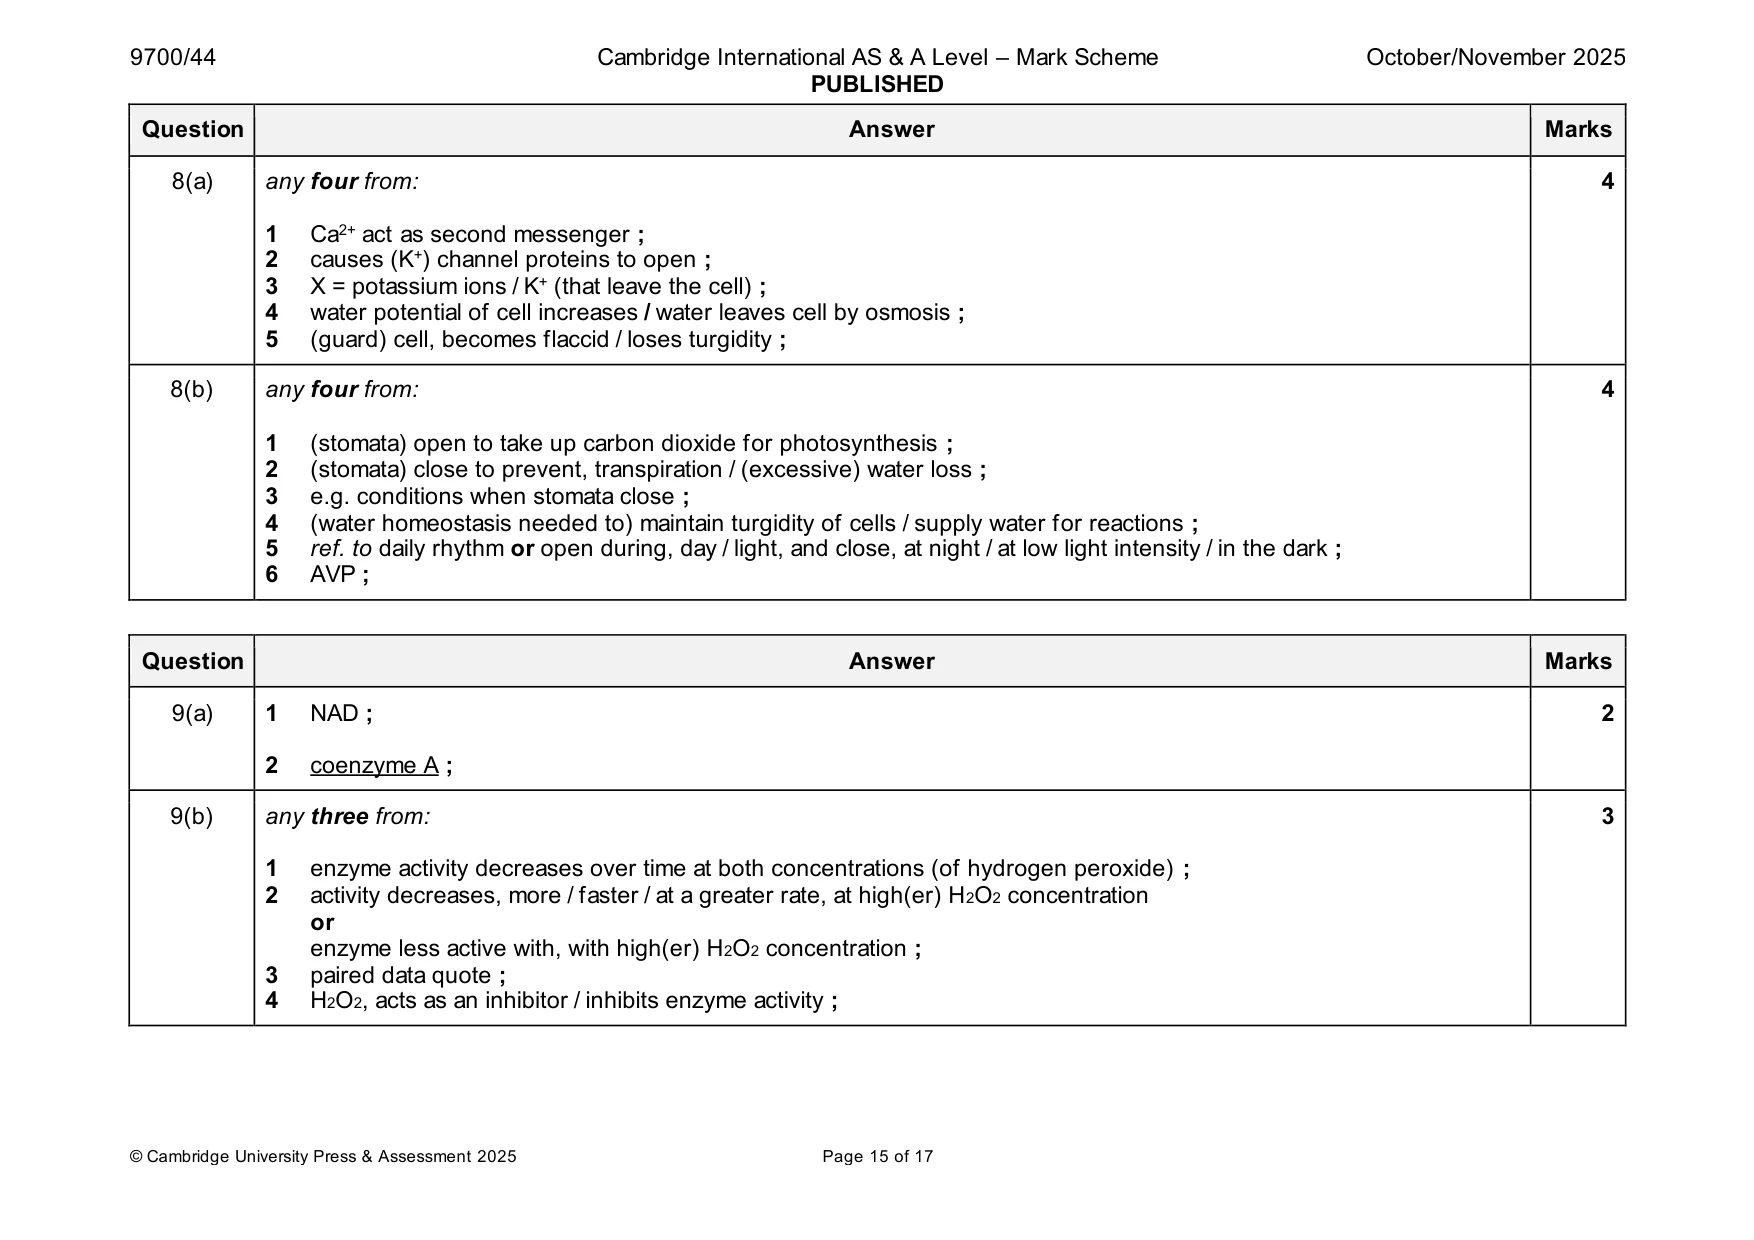
Mark scheme: 8(a) any four from: 4 1 Ca2+ act as second messenger ; 2 causes (K+) channel proteins to open ; 3 X = potassium ions / K+ (that leave the cell) ; 4 water potential of cell increases / water leaves cell by osmosis ; 5 (guard) cell, becomes flaccid / loses turgidity ; 8(b) any four from: 4 1 (stomata) open to take up carbon dioxide for photosynthesis ; 2 (stomata) close to prevent, transpiration / (excessive) water loss ; 3 e.g. conditions when stomata close ; 4 (water homeostasis needed to) maintain turgidity of cells / supply water for reactions ; 5 ref. to daily rhythm or open during, day / light, and close, at night / at low light intensity / in the dark ; 6 AVP ;
Q9 · In aerobic conditions, pyruvate that has formed during glycolysis enters the…
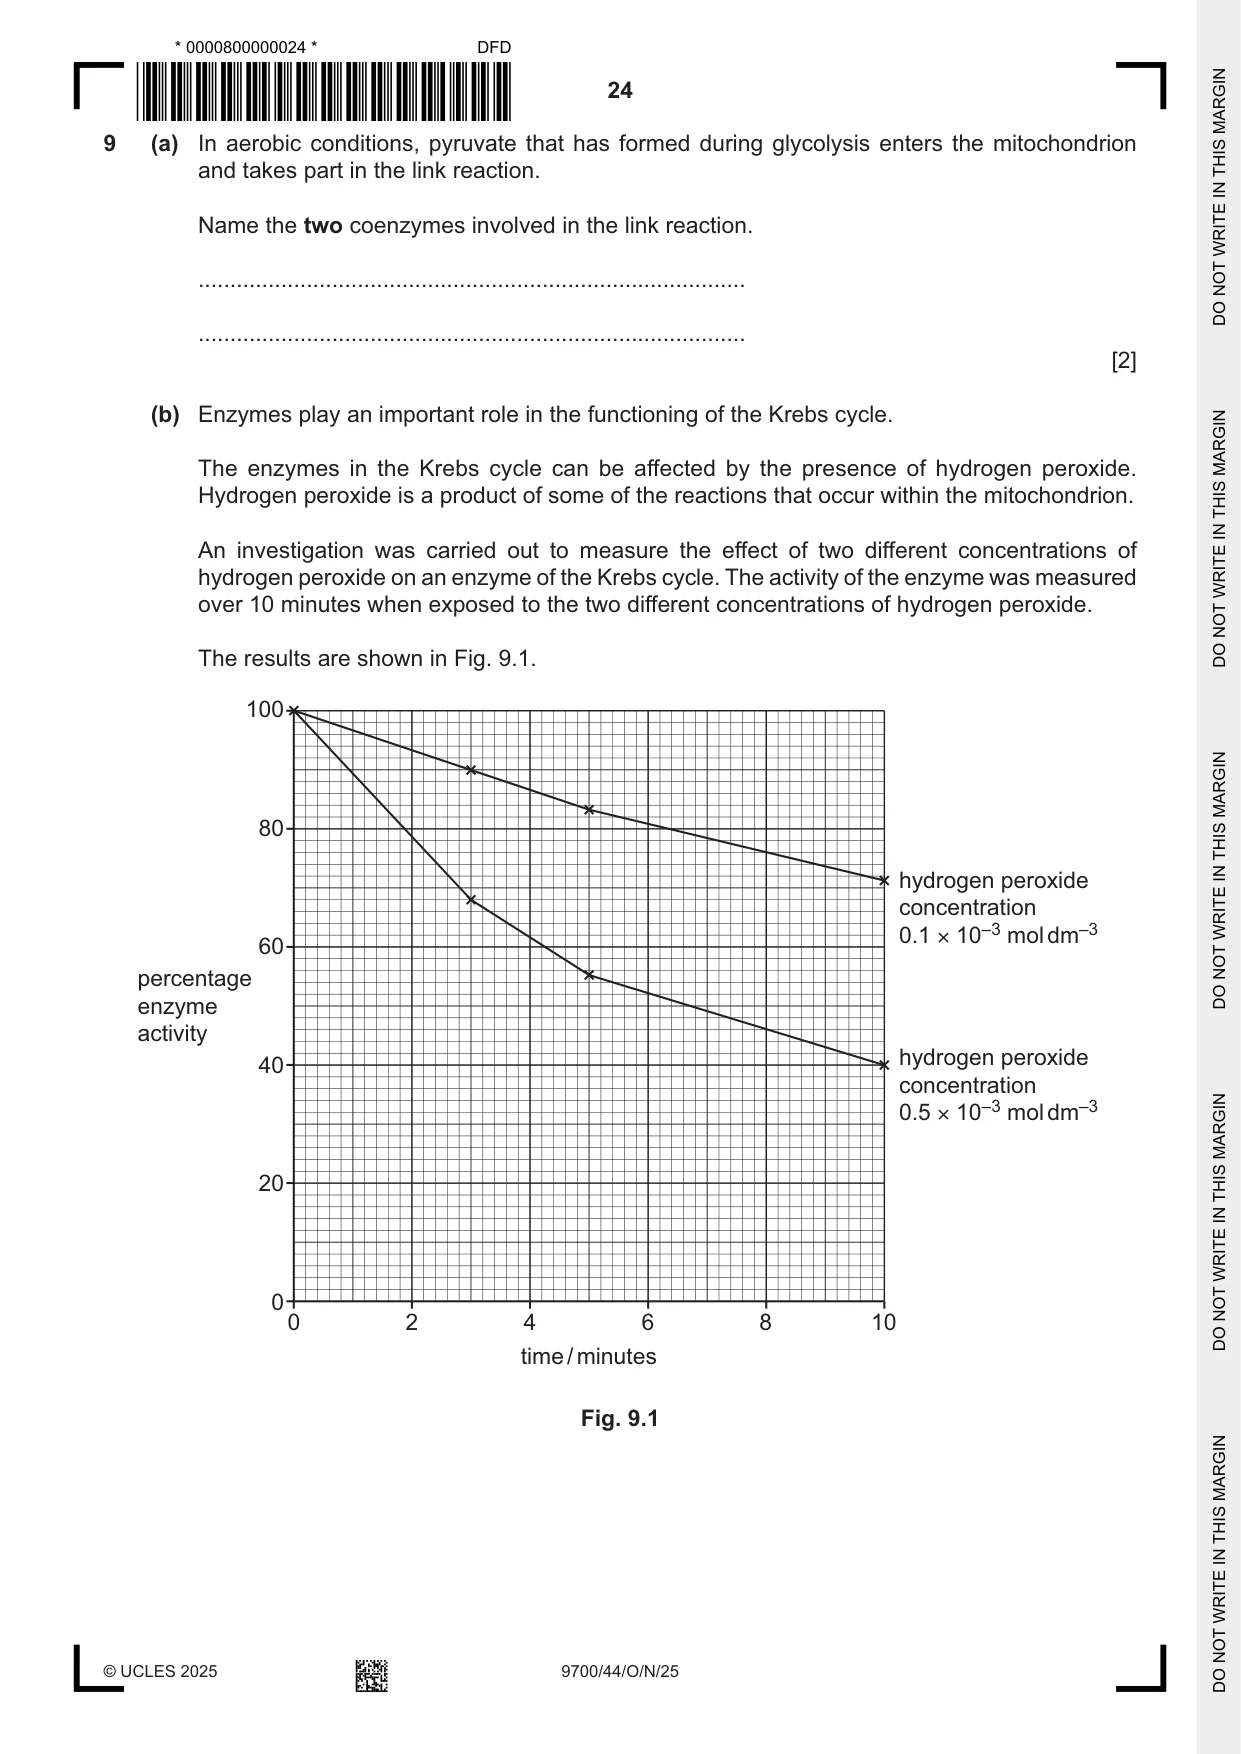
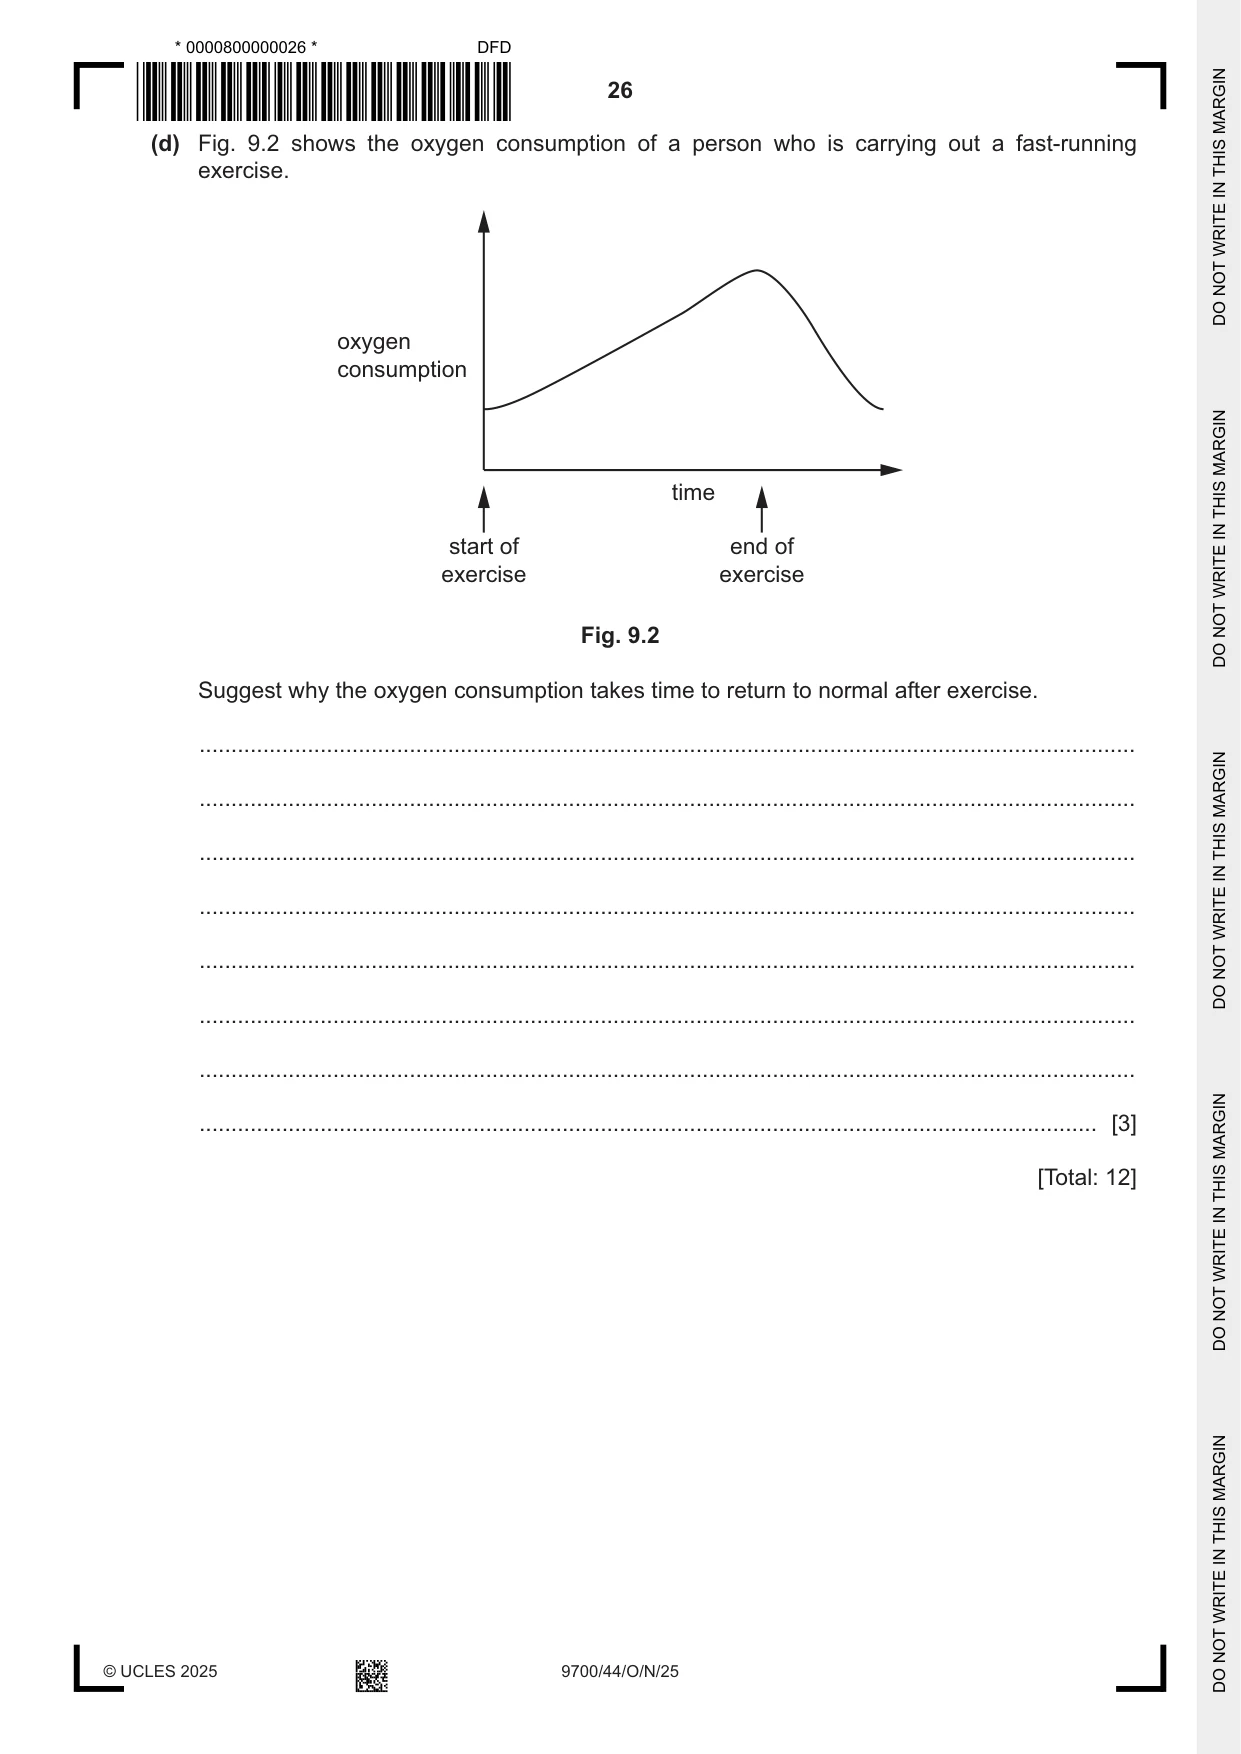
9 (a) In aerobic conditions, pyruvate that has formed during glycolysis enters the mitochondrion and takes part in the link reaction. Name the two coenzymes involved in the link reaction. ...................................................................................... ...................................................................................... [2] (b) Enzymes play an important role in the functioning of the Krebs cycle. The enzymes in the Krebs cycle can be affected by the presence of hydrogen peroxide. Hydrogen peroxide is a product of some of the reactions that occur within the mitochondrion. An investigation was carried out to measure the effect of two different concentrations of hydrogen peroxide on an enzyme of the Krebs cycle. The activity of the enzyme was measured over 10 minutes when exposed to the two different concentrations of hydrogen peroxide. The results are shown in Fig. 9.1. 100 80 hydrogen peroxide concentration 0.1 × 10⁻³ mol dm–3 60 percentage enzyme activity hydrogen peroxide 40 concentration 0.5 × 10⁻³ mol dm–3 20 0 0 2 4 6 8 10 time / minutes Fig. 9.1 Describe the effect shown in Fig. 9.1 of hydrogen peroxide concentration on the activity of the Krebs cycle enzyme. ................................................................................................................................................... ................................................................................................................................................... ................................................................................................................................................... ................................................................................................................................................... ................................................................................................................................................... ............................................................................................................................................. [3] (c) Reduced NAD and reduced FAD are produced during the Krebs cycle. They carry hydrogen to the inner mitochondrial membrane where oxidative phosphorylation occurs. The first two steps in oxidative phosphorylation are: 1. Hydrogen atoms split into protons and electrons. 2. Electrons move along the electron transport chain, releasing energy. Outline the steps that occur to complete oxidative phosphorylation. ................................................................................................................................................... ................................................................................................................................................... ................................................................................................................................................... ................................................................................................................................................... ................................................................................................................................................... ................................................................................................................................................... ................................................................................................................................................... ................................................................................................................................................... ................................................................................................................................................... ................................................................................................................................................... ................................................................................................................................................... ............................................................................................................................................. [4] (d) Fig. 9.2 shows the oxygen consumption of a person who is carrying out a fast‑running exercise. oxygen consumption time start of end of exercise exercise Fig. 9.2 Suggest why the oxygen consumption takes time to return to normal after exercise. ................................................................................................................................................... ................................................................................................................................................... ................................................................................................................................................... ................................................................................................................................................... ................................................................................................................................................... ................................................................................................................................................... ................................................................................................................................................... ............................................................................................................................................. [3] [Total: 12]
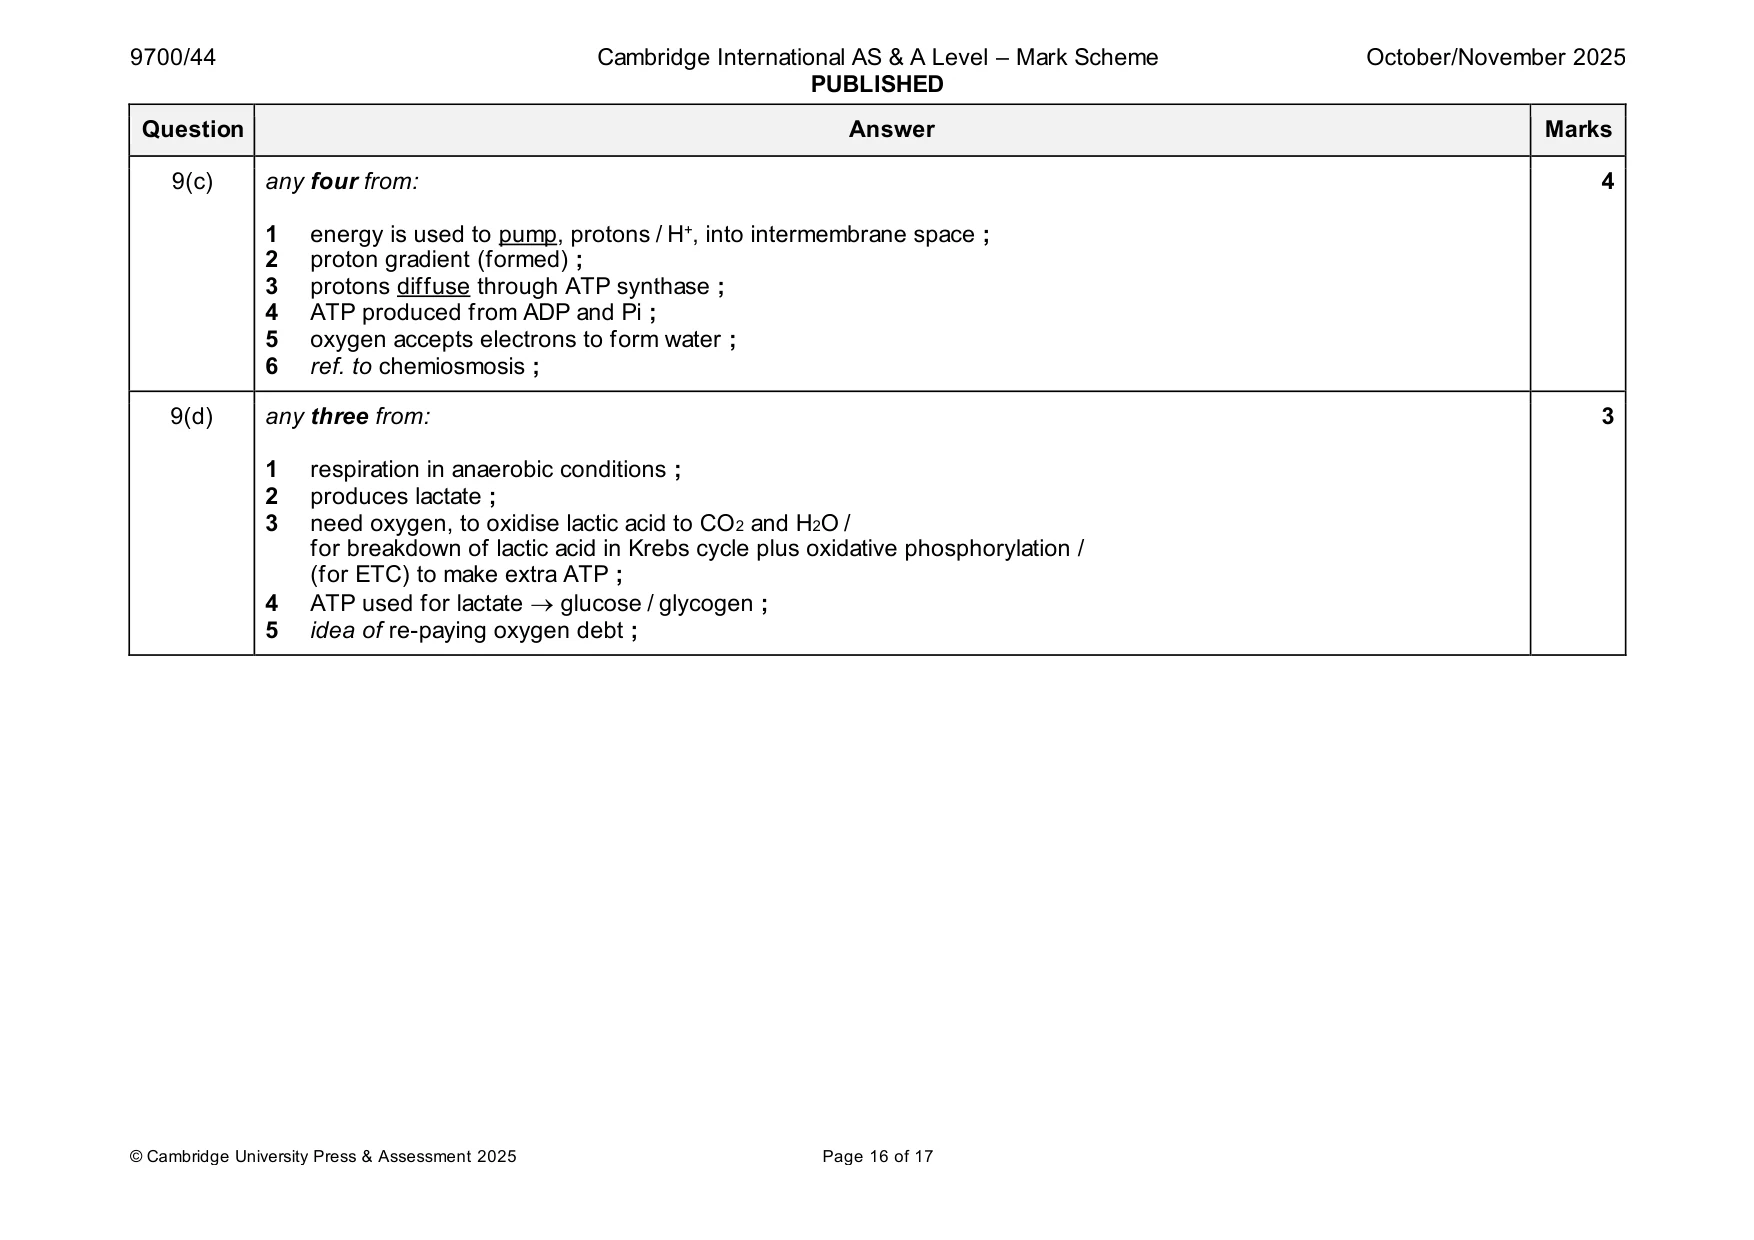
Mark scheme: 9(a) 1 NAD ; 2 2 coenzyme A ; 9(b) any three from: 3 1 enzyme activity decreases over time at both concentrations (of hydrogen peroxide) ; 2 activity decreases, more / faster / at a greater rate, at high(er) H2O2 concentration or enzyme less active with, with high(er) H2O2 concentration ; 3 paired data quote ; 4 H2O2, acts as an inhibitor / inhibits enzyme activity ; 9(c) any four from: 4 1 energy is used to pump, protons / H+, into intermembrane space ; 2 proton gradient (formed) ; 3 protons diffuse through ATP synthase ; 4 ATP produced from ADP and Pi ; 5 oxygen accepts electrons to form water ; 6 ref. to chemiosmosis ; 9(d) any three from: 3 1 respiration in anaerobic conditions ; 2 produces lactate ; 3 need oxygen, to oxidise lactic acid to CO2 and H2O / for breakdown of lactic acid in Krebs cycle plus oxidative phosphorylation / (for ETC) to make extra ATP ; 4 ATP used for lactate → glucose / glycogen ; 5 idea of re-paying oxygen debt ;
Q10 · Cyclic photophosphorylation and non‑cyclic photophosphorylation occur during the…
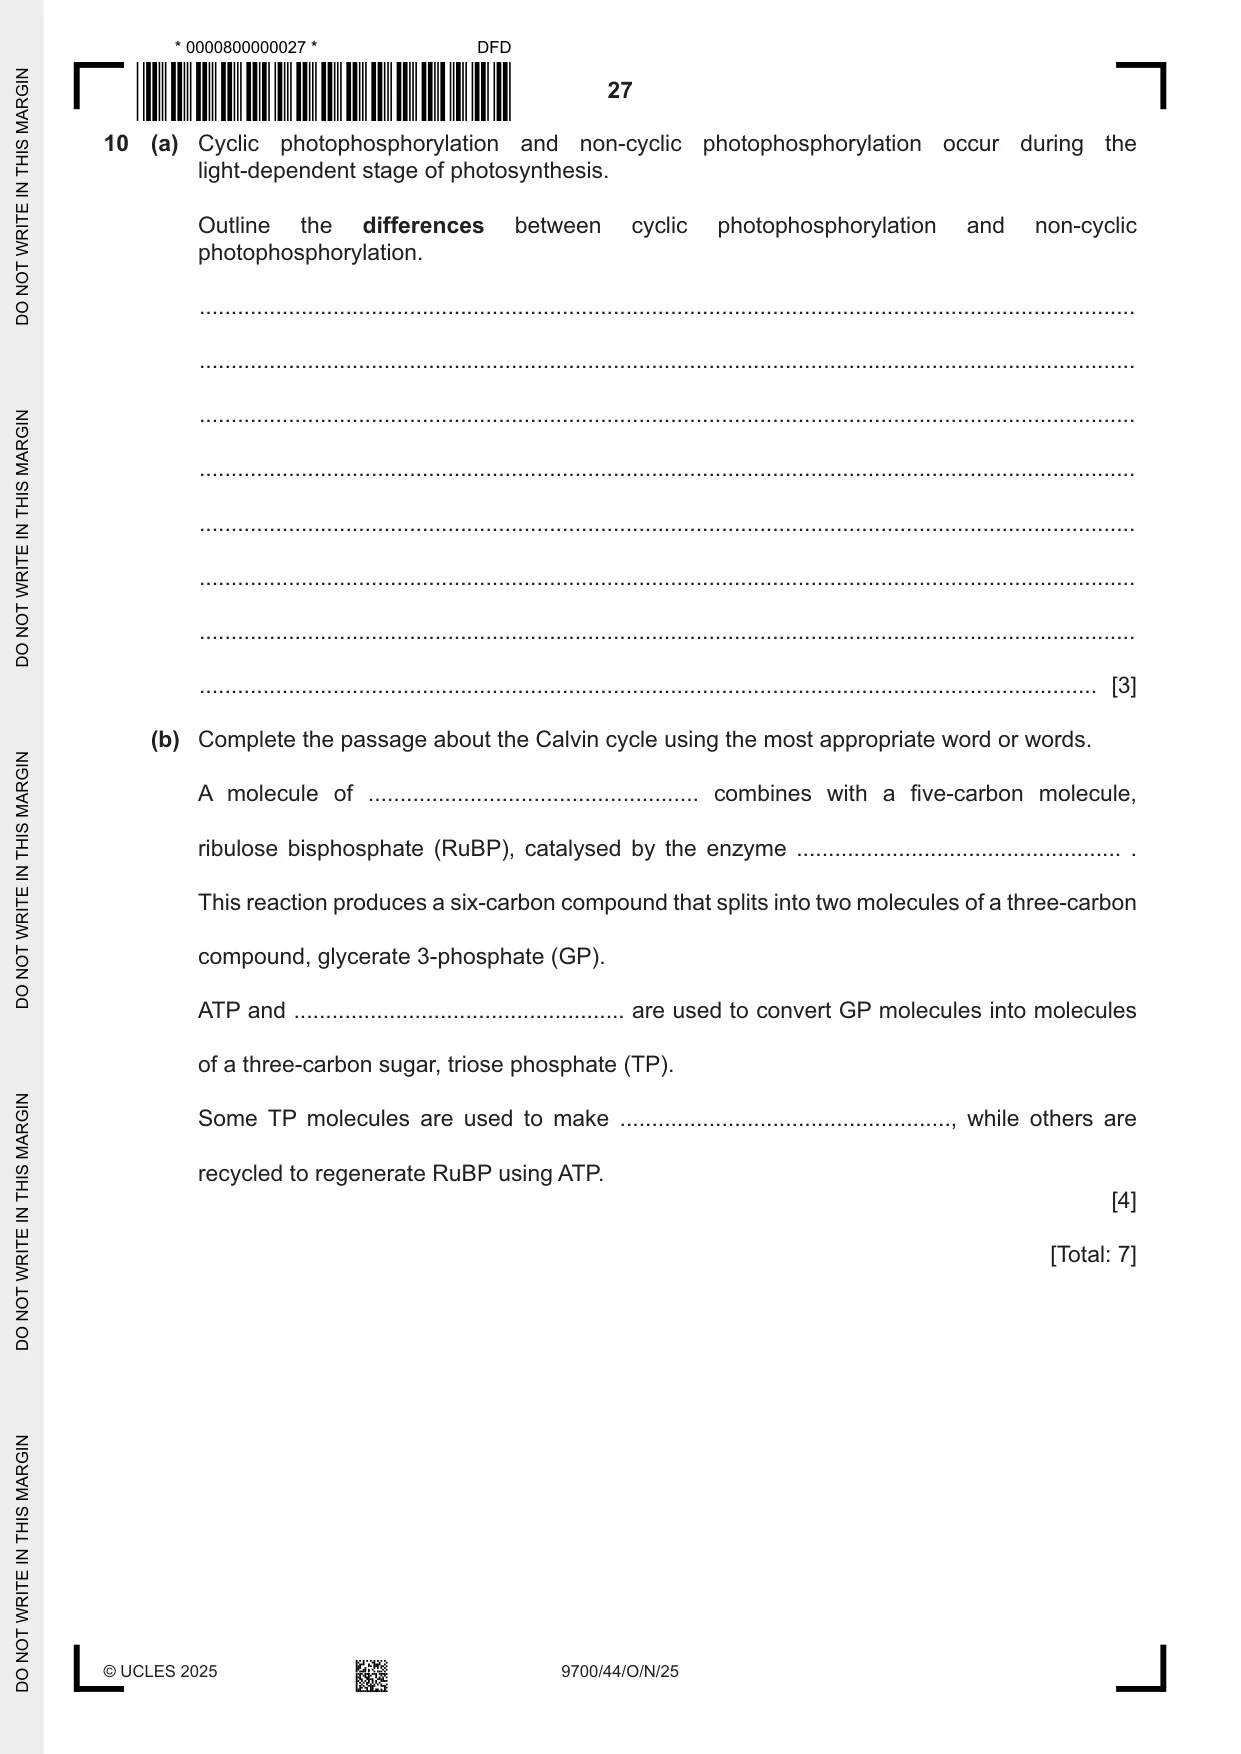
10 (a) Cyclic photophosphorylation and non‑cyclic photophosphorylation occur during the light‑dependent stage of photosynthesis. Outline the differences between cyclic photophosphorylation and non‑cyclic photophosphorylation. ................................................................................................................................................... ................................................................................................................................................... ................................................................................................................................................... ................................................................................................................................................... ................................................................................................................................................... ................................................................................................................................................... ................................................................................................................................................... ............................................................................................................................................. [3] (b) Complete the passage about the Calvin cycle using the most appropriate word or words. A molecule of .................................................... combines with a five‑carbon molecule, ribulose bisphosphate (RuBP), catalysed by the enzyme ................................................... . This reaction produces a six‑carbon compound that splits into two molecules of a three‑carbon compound, glycerate 3‑phosphate (GP). ATP and .................................................... are used to convert GP molecules into molecules of a three‑carbon sugar, triose phosphate (TP). Some TP molecules are used to make ...................................................., while others are recycled to regenerate RuBP using ATP. [4] [Total: 7]
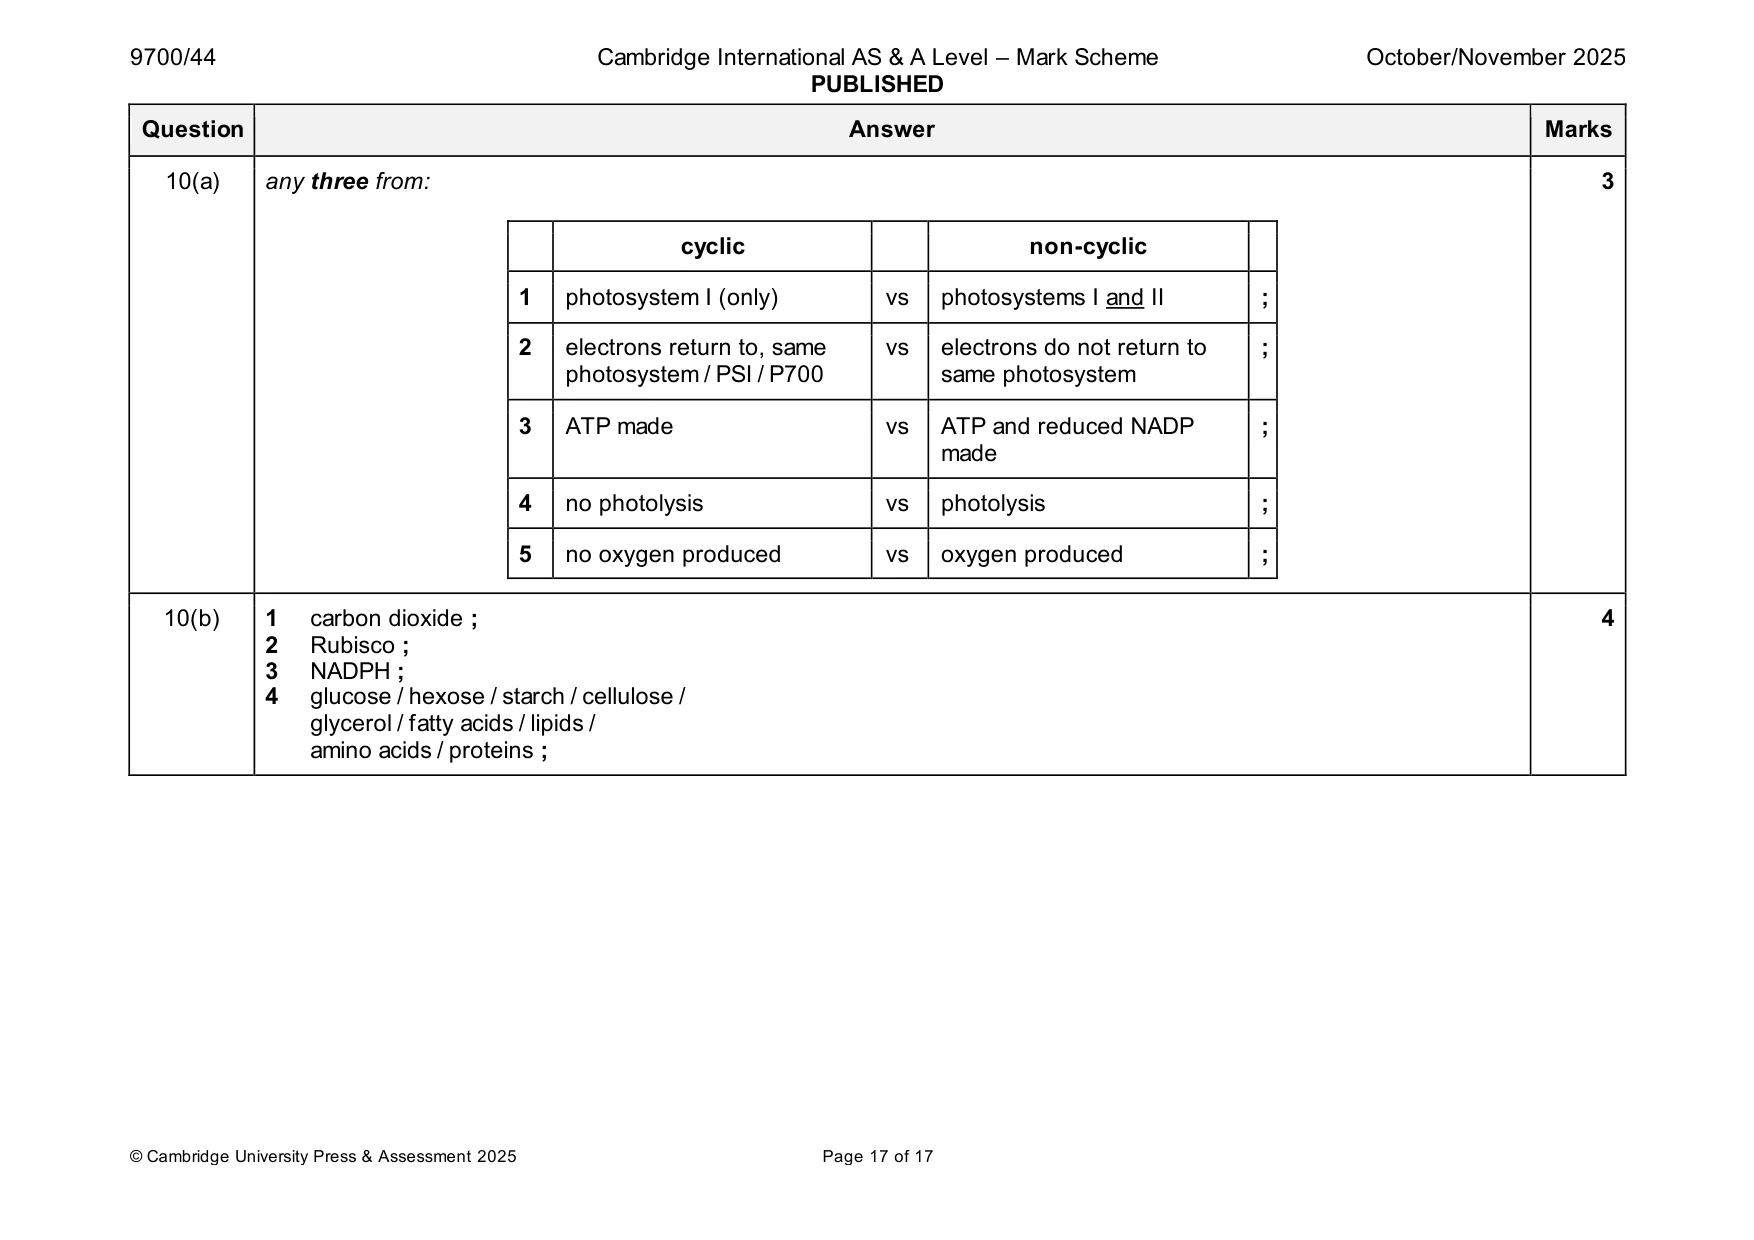
Mark scheme: 10(a) any three from: 3 cyclic non-cyclic 1 photosystem I (only) vs photosystems I and II ; 2 electrons return to, same vs electrons do not return to ; photosystem / PSI / P700 same photosystem 3 ATP made vs ATP and reduced NADP ; made 4 no photolysis vs photolysis ; 5 no oxygen produced vs oxygen produced ; 10(b) 1 carbon dioxide ; 4 2 Rubisco ; 3 NADPH ; 4 glucose / hexose / starch / cellulose / glycerol / fatty acids / lipids / amino acids / proteins ;
More questions on Photosynthesis as an energy transfer process
What was in this paper
The subtopics covered by these 10 questions, and how many questions each got. Open one in a new tab to see every Cambridge question on it.
What you needed in this session
Cambridge’s own grade thresholds for 2025 Oct/Nov, Paper 4 · Variant 4. A higher threshold means an easier paper — the bar moves with how the cohort did.