Cambridge A Level Biology 9700 — 2025 Oct/Nov Paper 4 · Variant 1
9700/41/O/N/25 · 10 questions · 100 marks · 120 min
The question paper and its mark scheme, free to read here and free to download. This is Cambridge’s own paper, exactly as it was sat.
Question paper20 pages
Mark scheme18 pages
Answers below. Sit the paper first if you are practising.
Questions as text
Q1 · Guinea pigs, Cavia porcellus, vary in the length and colour of their fur
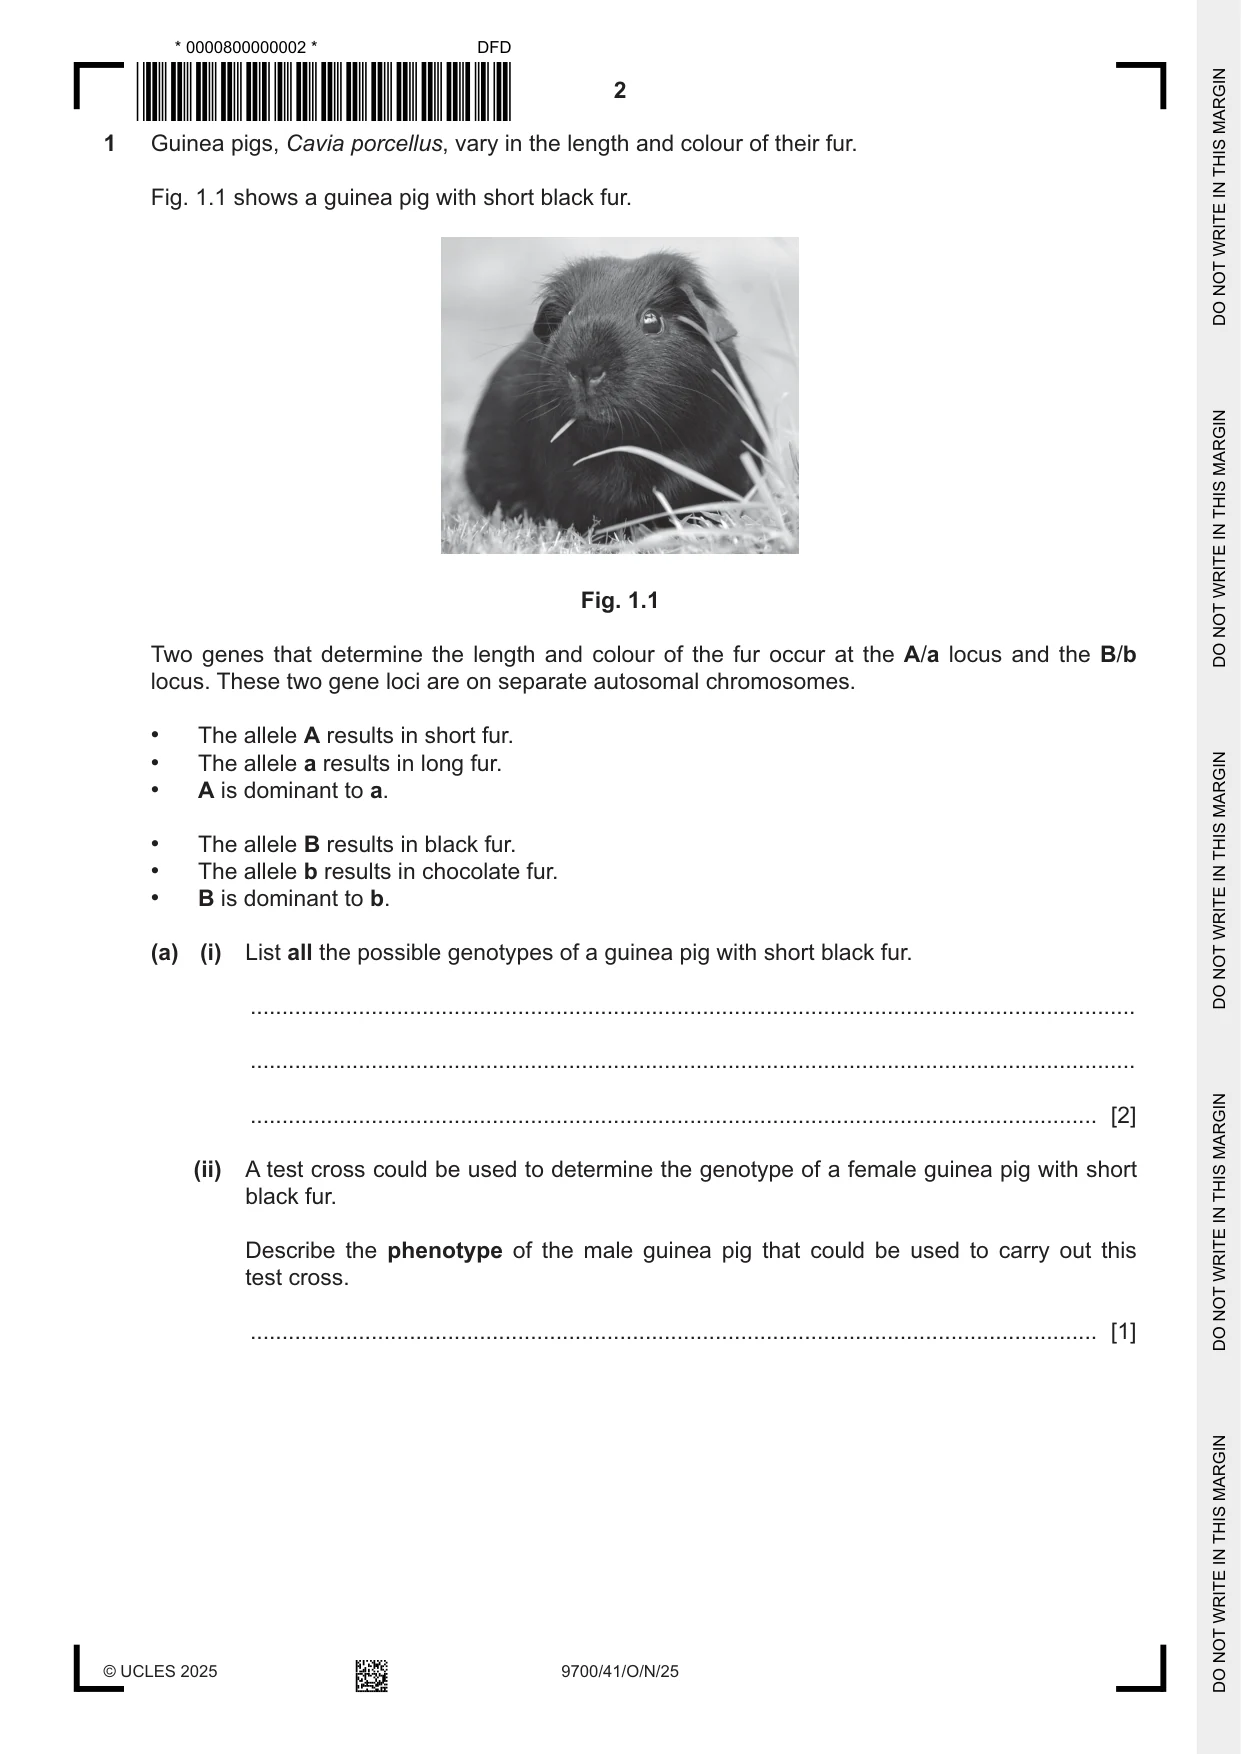
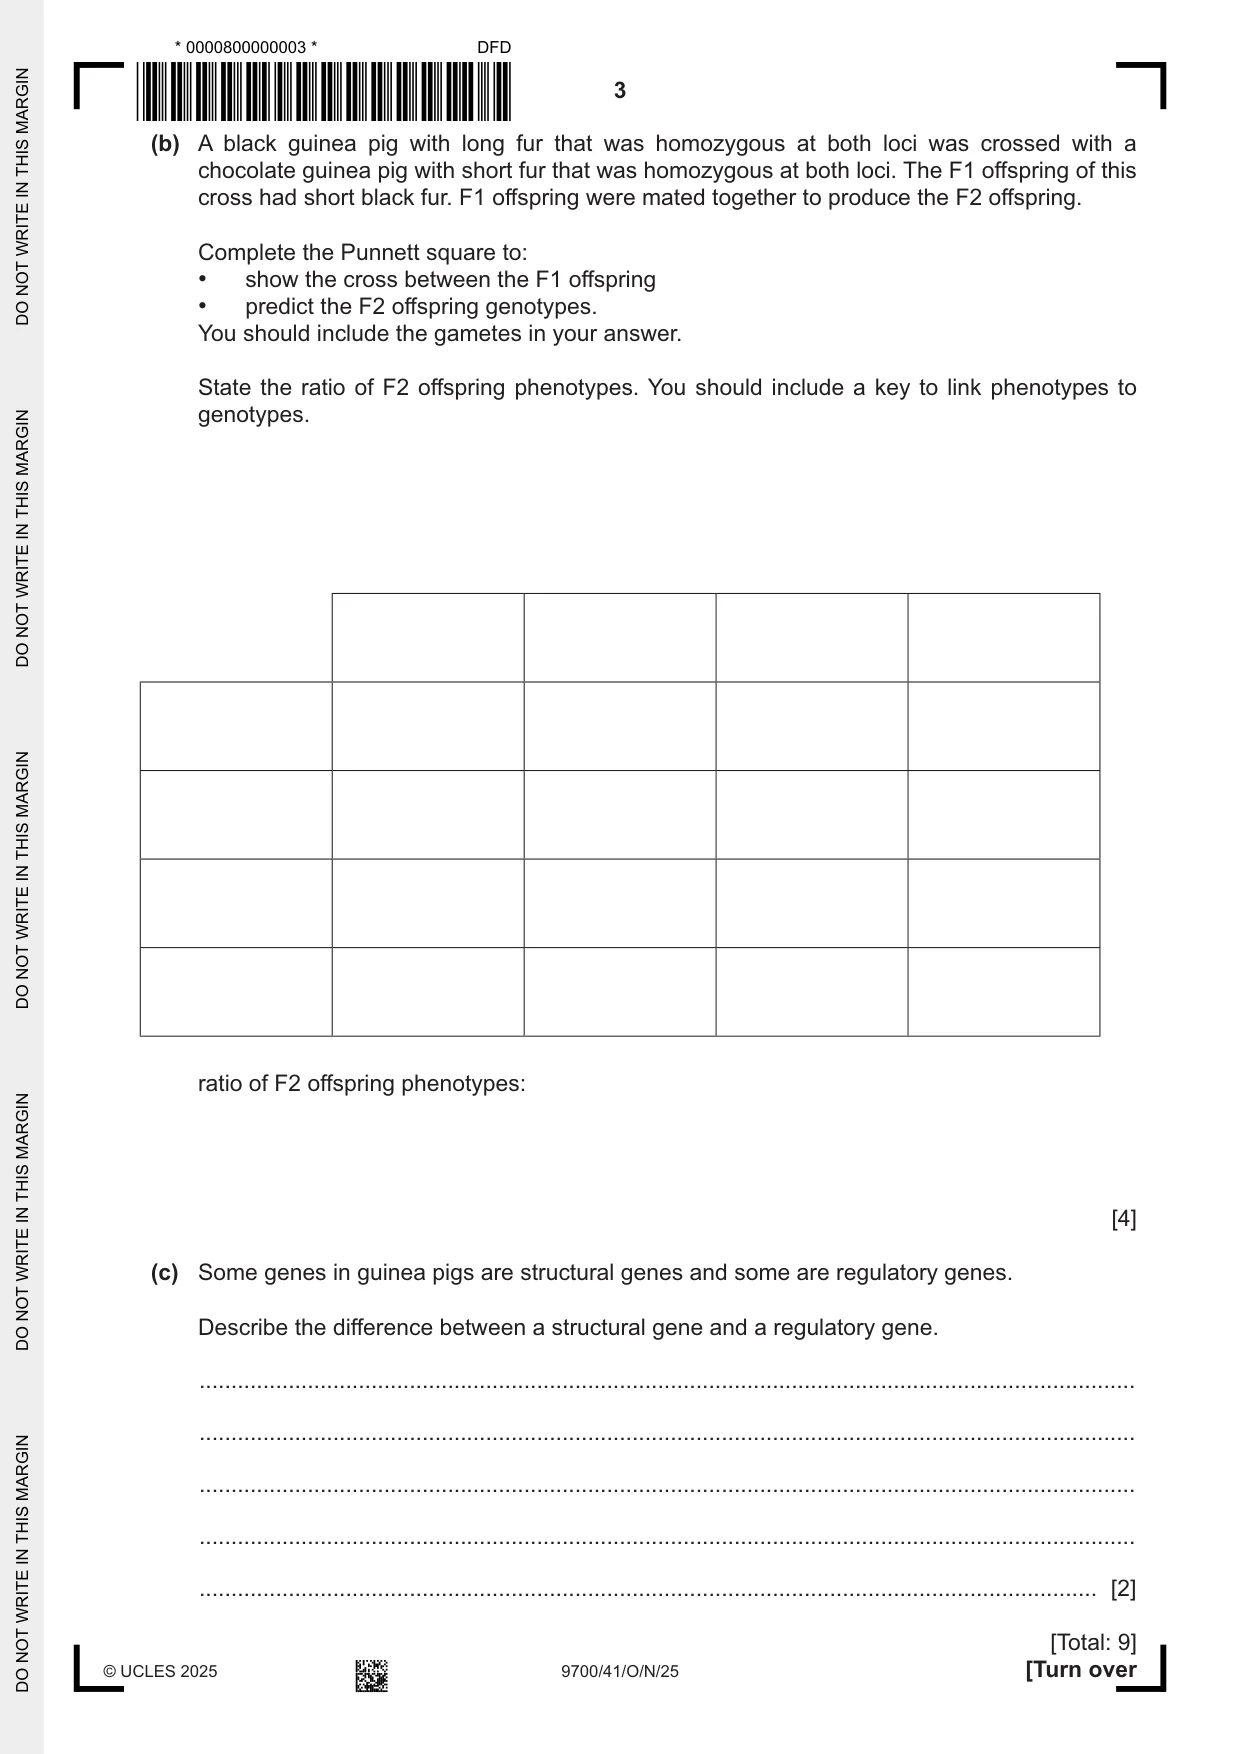
1 Guinea pigs, Cavia porcellus, vary in the length and colour of their fur. Fig. 1.1 shows a guinea pig with short black fur. Fig. 1.1 Two genes that determine the length and colour of the fur occur at the A/a locus and the B/b locus. These two gene loci are on separate autosomal chromosomes. • The allele A results in short fur. • The allele a results in long fur. • A is dominant to a. • The allele B results in black fur. • The allele b results in chocolate fur. • B is dominant to b. (a) (i) List all the possible genotypes of a guinea pig with short black fur. ........................................................................................................................................... ........................................................................................................................................... ..................................................................................................................................... [2] (ii) A test cross could be used to determine the genotype of a female guinea pig with short black fur. Describe the phenotype of the male guinea pig that could be used to carry out this test cross. ..................................................................................................................................... [1] (b) A black guinea pig with long fur that was homozygous at both loci was crossed with a chocolate guinea pig with short fur that was homozygous at both loci. The F1 offspring of this cross had short black fur. F1 offspring were mated together to produce the F2 offspring. Complete the Punnett square to: • show the cross between the F1 offspring • predict the F2 offspring genotypes. You should include the gametes in your answer. State the ratio of F2 offspring phenotypes. You should include a key to link phenotypes to genotypes. ratio of F2 offspring phenotypes: [4] (c) Some genes in guinea pigs are structural genes and some are regulatory genes. Describe the difference between a structural gene and a regulatory gene. ................................................................................................................................................... ................................................................................................................................................... ................................................................................................................................................... ................................................................................................................................................... ............................................................................................................................................. [2] [Total: 9]
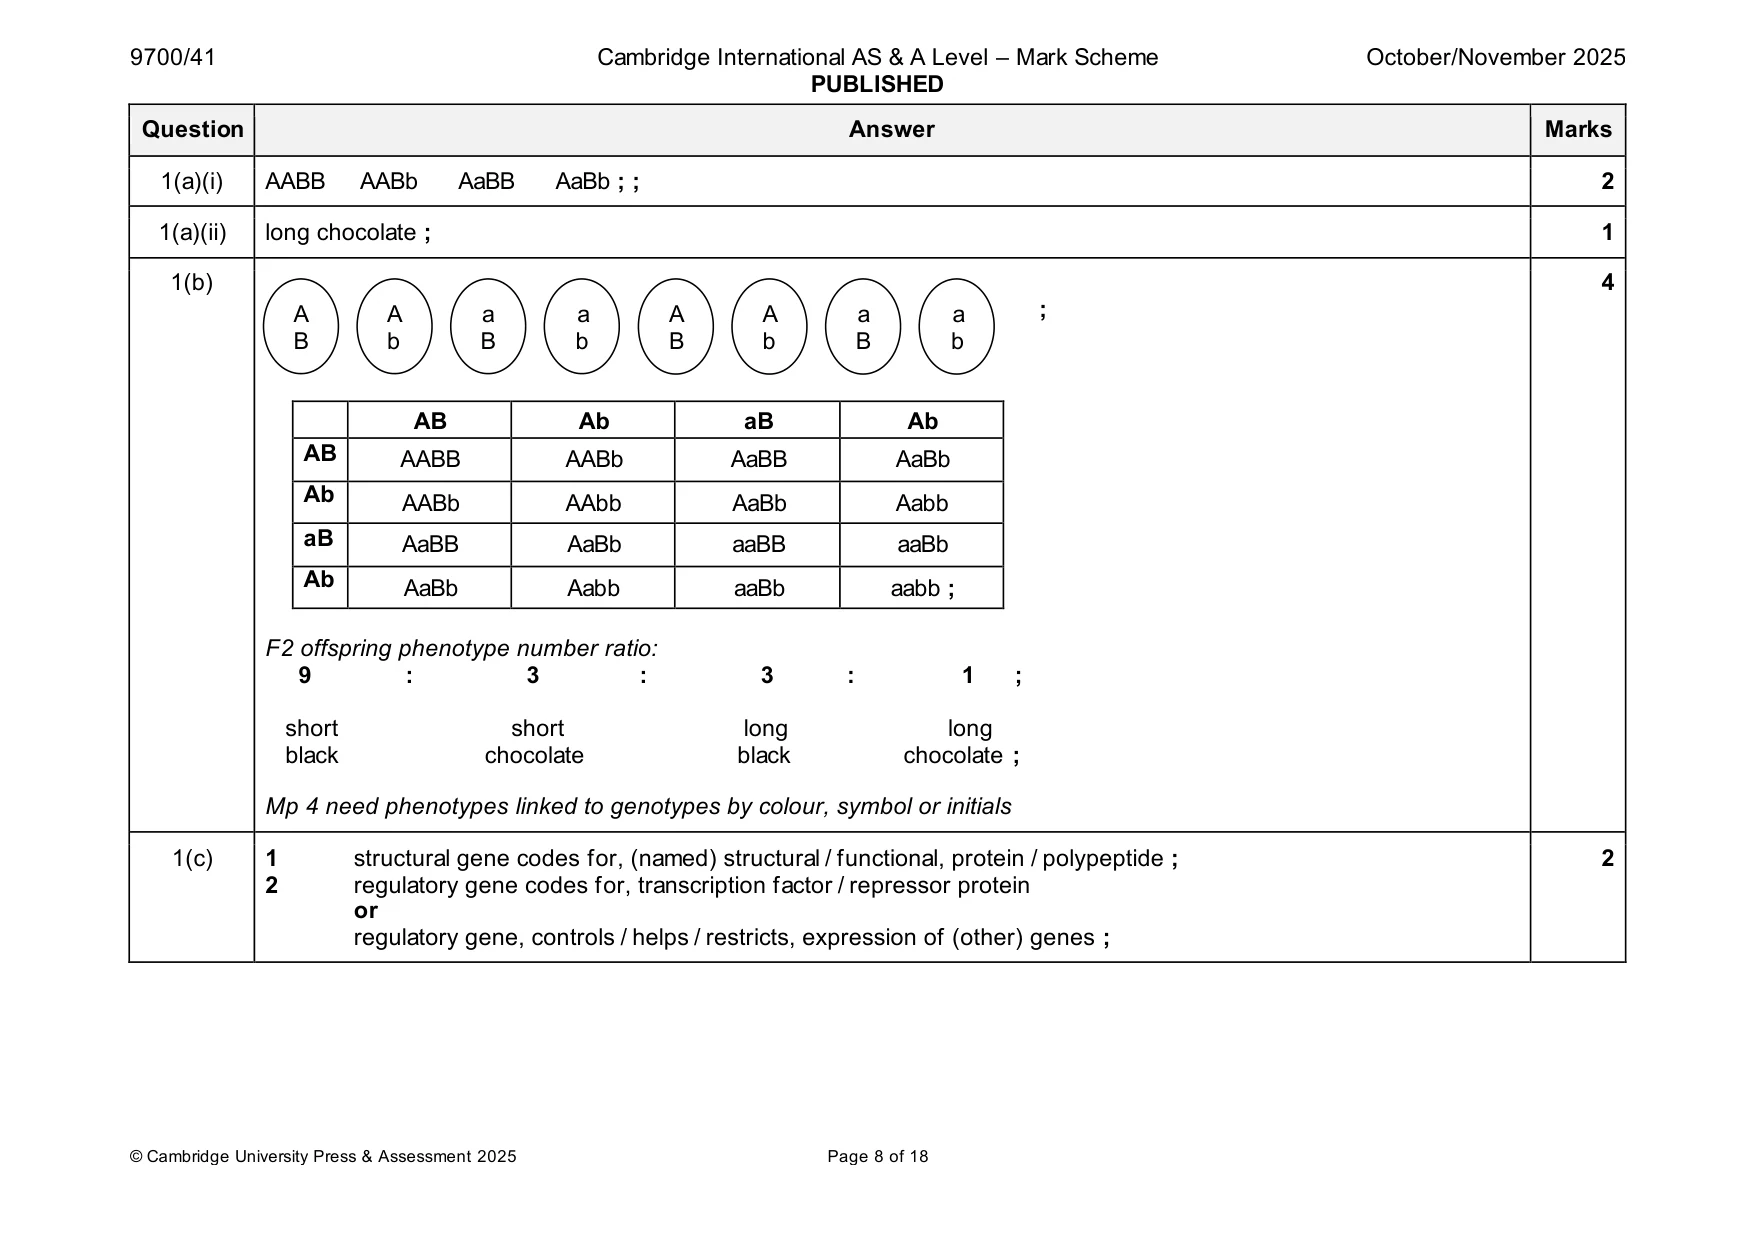
Mark scheme: Question Answer Marks 1(a)(i) AABB AABb AaBB AaBb ; ; 2 1(a)(ii) long chocolate ; 1 1(b) 4 A A a a A A a a ; B b B b B b B b AB Ab aB Ab AB AABB AABb AaBB AaBb Ab AABb AAbb AaBb Aabb aB AaBB AaBb aaBB aaBb Ab AaBb Aabb aaBb aabb ; F2 offspring phenotype number ratio: 9 : 3 : 3 : 1 ; short short long long black chocolate black chocolate ; Mp 4 need phenotypes linked to genotypes by colour, symbol or initials 1(c) 1 structural gene codes for, (named) structural / functional, protein / polypeptide ; 2 2 regulatory gene codes for, transcription factor / repressor protein or regulatory gene, controls / helps / restricts, expression of (other) genes ;
More questions on Passage of information from parents to offspring
Q2 · Exserohilum turcicum is a fungal pathogen
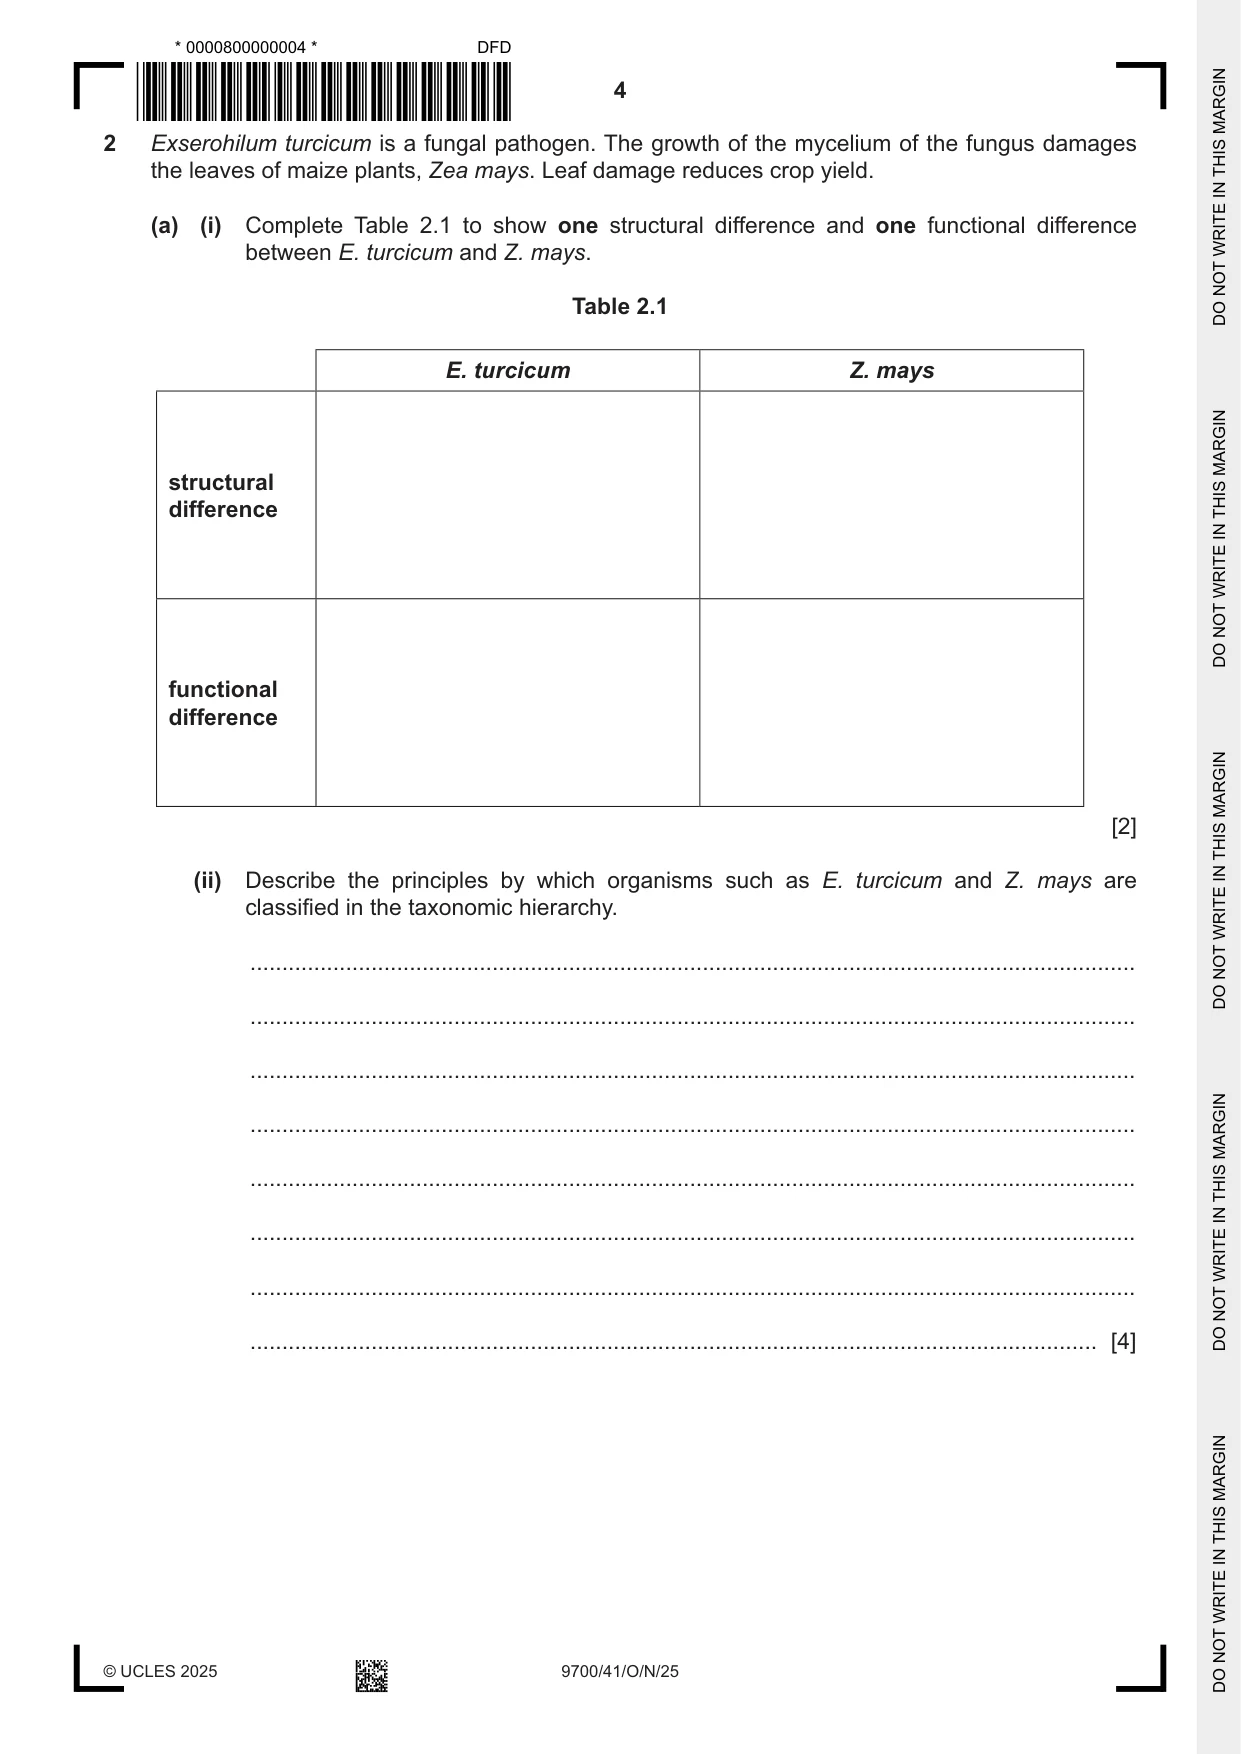
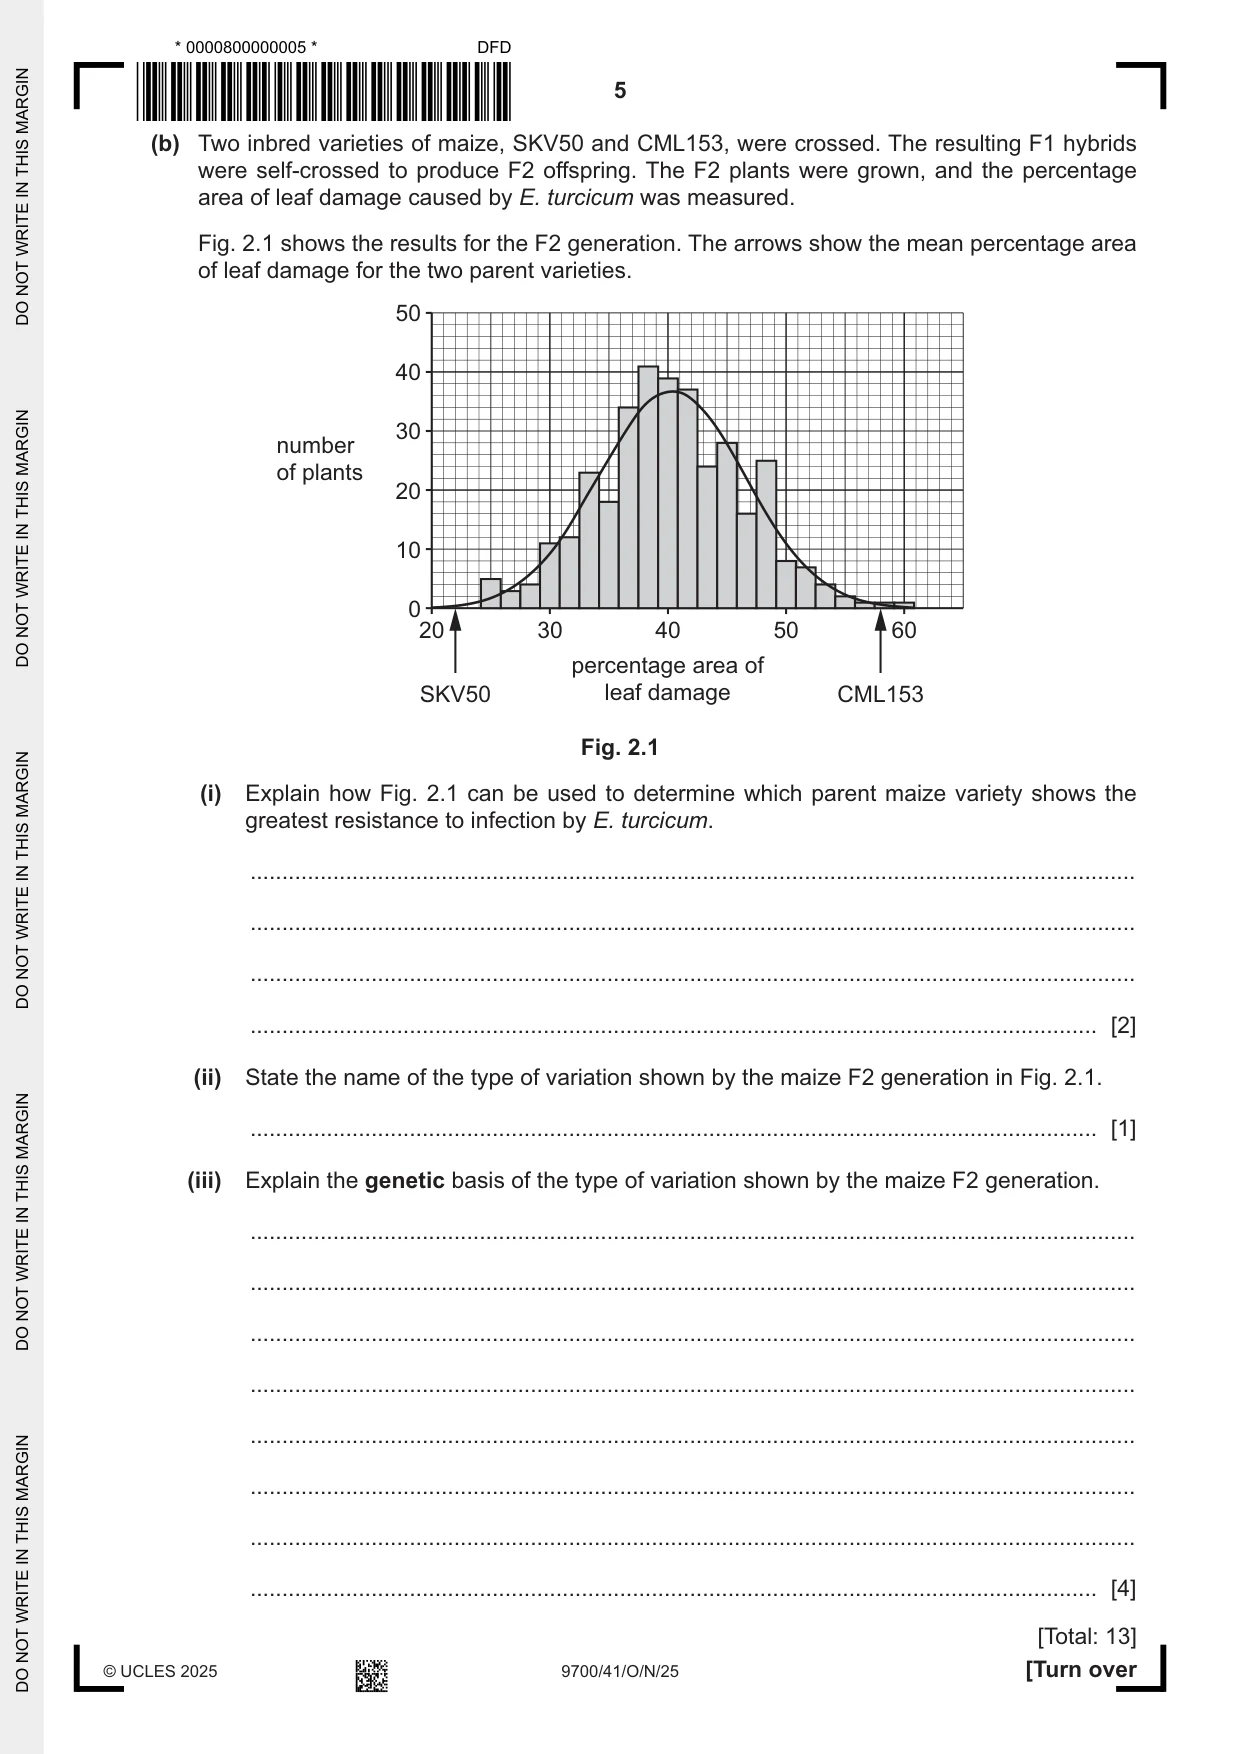
2 Exserohilum turcicum is a fungal pathogen. The growth of the mycelium of the fungus damages the leaves of maize plants, Zea mays. Leaf damage reduces crop yield. (a) (i) Complete Table 2.1 to show one structural difference and one functional difference between E. turcicum and Z. mays. Table 2.1 E. turcicum Z. mays structural difference functional difference [2] (ii) Describe the principles by which organisms such as E. turcicum and Z. mays are classified in the taxonomic hierarchy. ........................................................................................................................................... ........................................................................................................................................... ........................................................................................................................................... ........................................................................................................................................... ........................................................................................................................................... ........................................................................................................................................... ........................................................................................................................................... ..................................................................................................................................... [4] (b) Two inbred varieties of maize, SKV50 and CML153, were crossed. The resulting F1 hybrids were self‑crossed to produce F2 offspring. The F2 plants were grown, and the percentage area of leaf damage caused by E. turcicum was measured. Fig. 2.1 shows the results for the F2 generation. The arrows show the mean percentage area of leaf damage for the two parent varieties. 50 40 30 number of plants 20 10 0 20 30 40 50 60 percentage area of SKV50 leaf damage CML153 Fig. 2.1 (i) Explain how Fig. 2.1 can be used to determine which parent maize variety shows the greatest resistance to infection by E. turcicum. ........................................................................................................................................... ........................................................................................................................................... ........................................................................................................................................... ..................................................................................................................................... [2] (ii) State the name of the type of variation shown by the maize F2 generation in Fig. 2.1. ..................................................................................................................................... [1] (iii) Explain the genetic basis of the type of variation shown by the maize F2 generation. ........................................................................................................................................... ........................................................................................................................................... ........................................................................................................................................... ........................................................................................................................................... ........................................................................................................................................... ........................................................................................................................................... ........................................................................................................................................... ..................................................................................................................................... [4] [Total: 13]
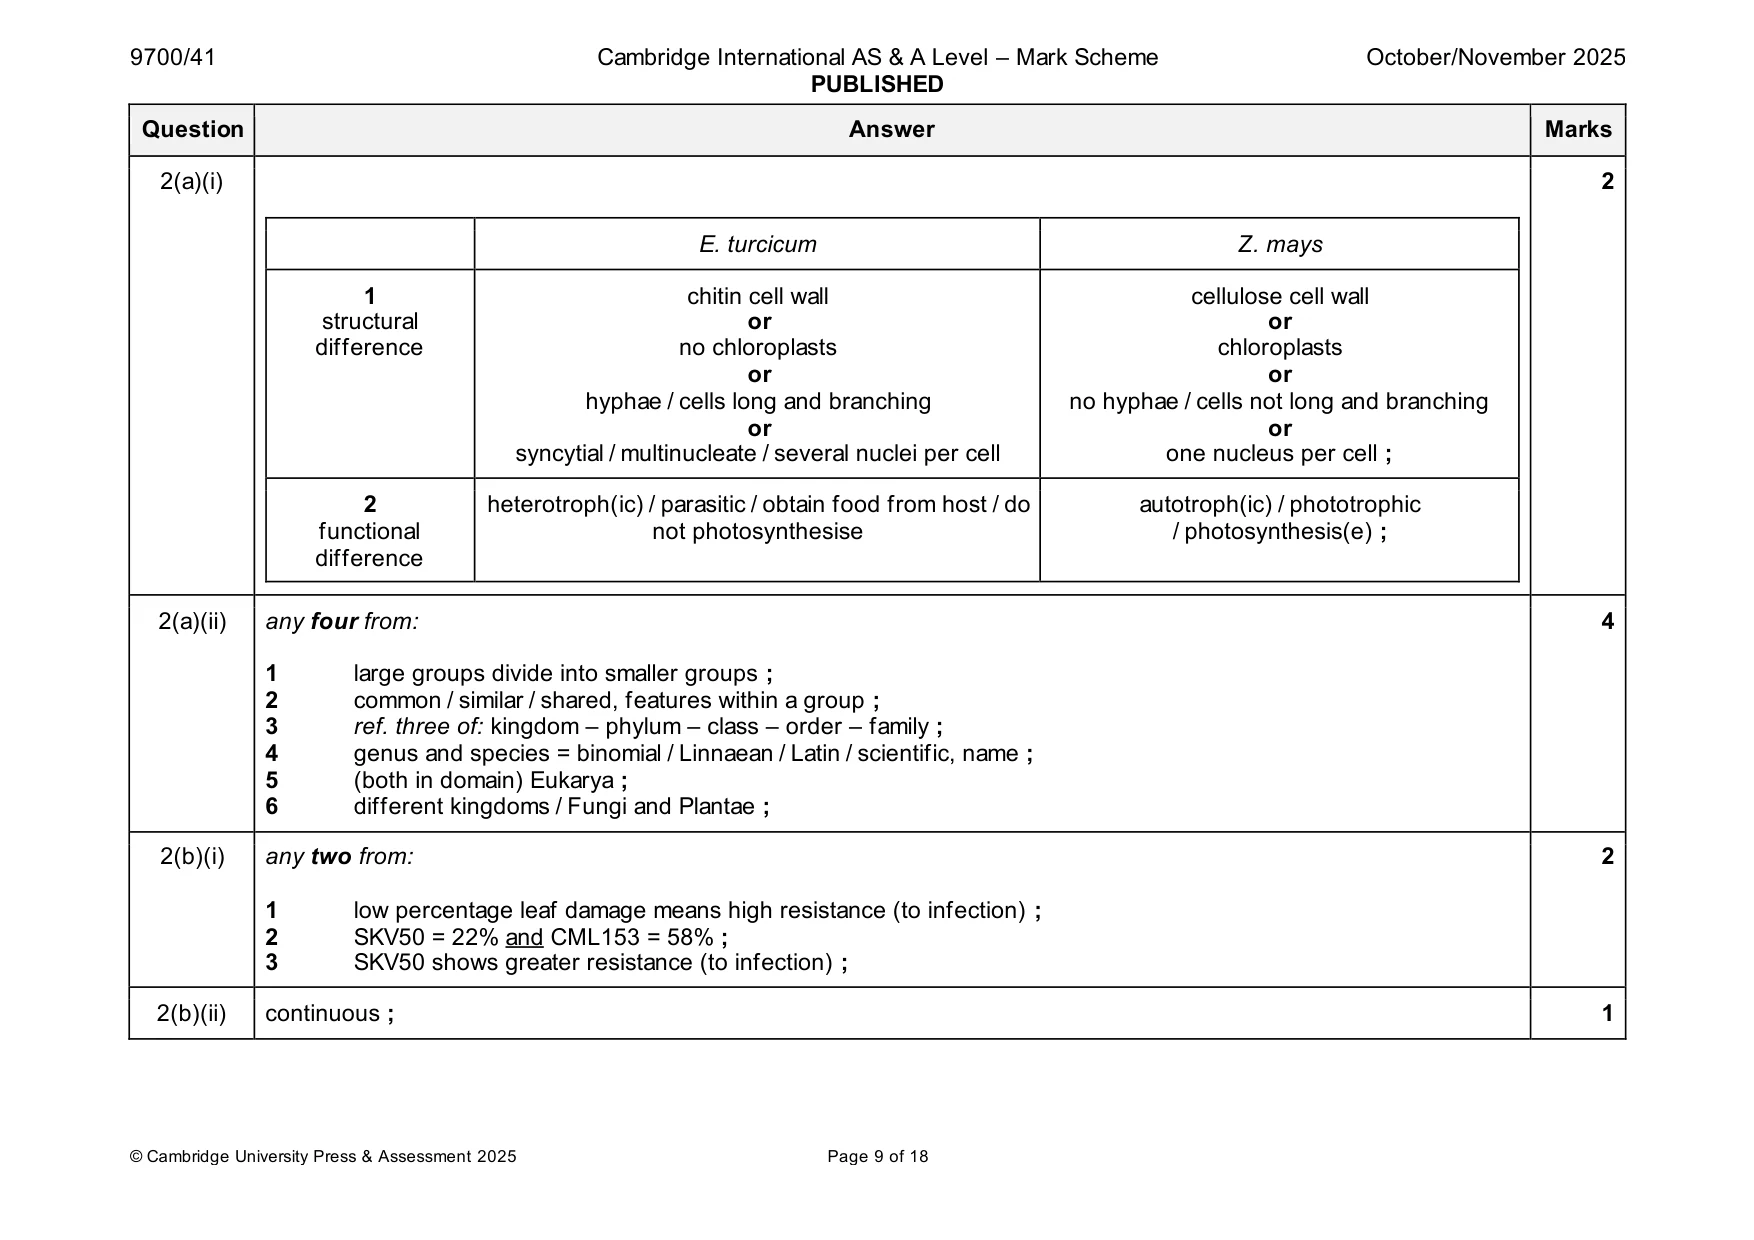
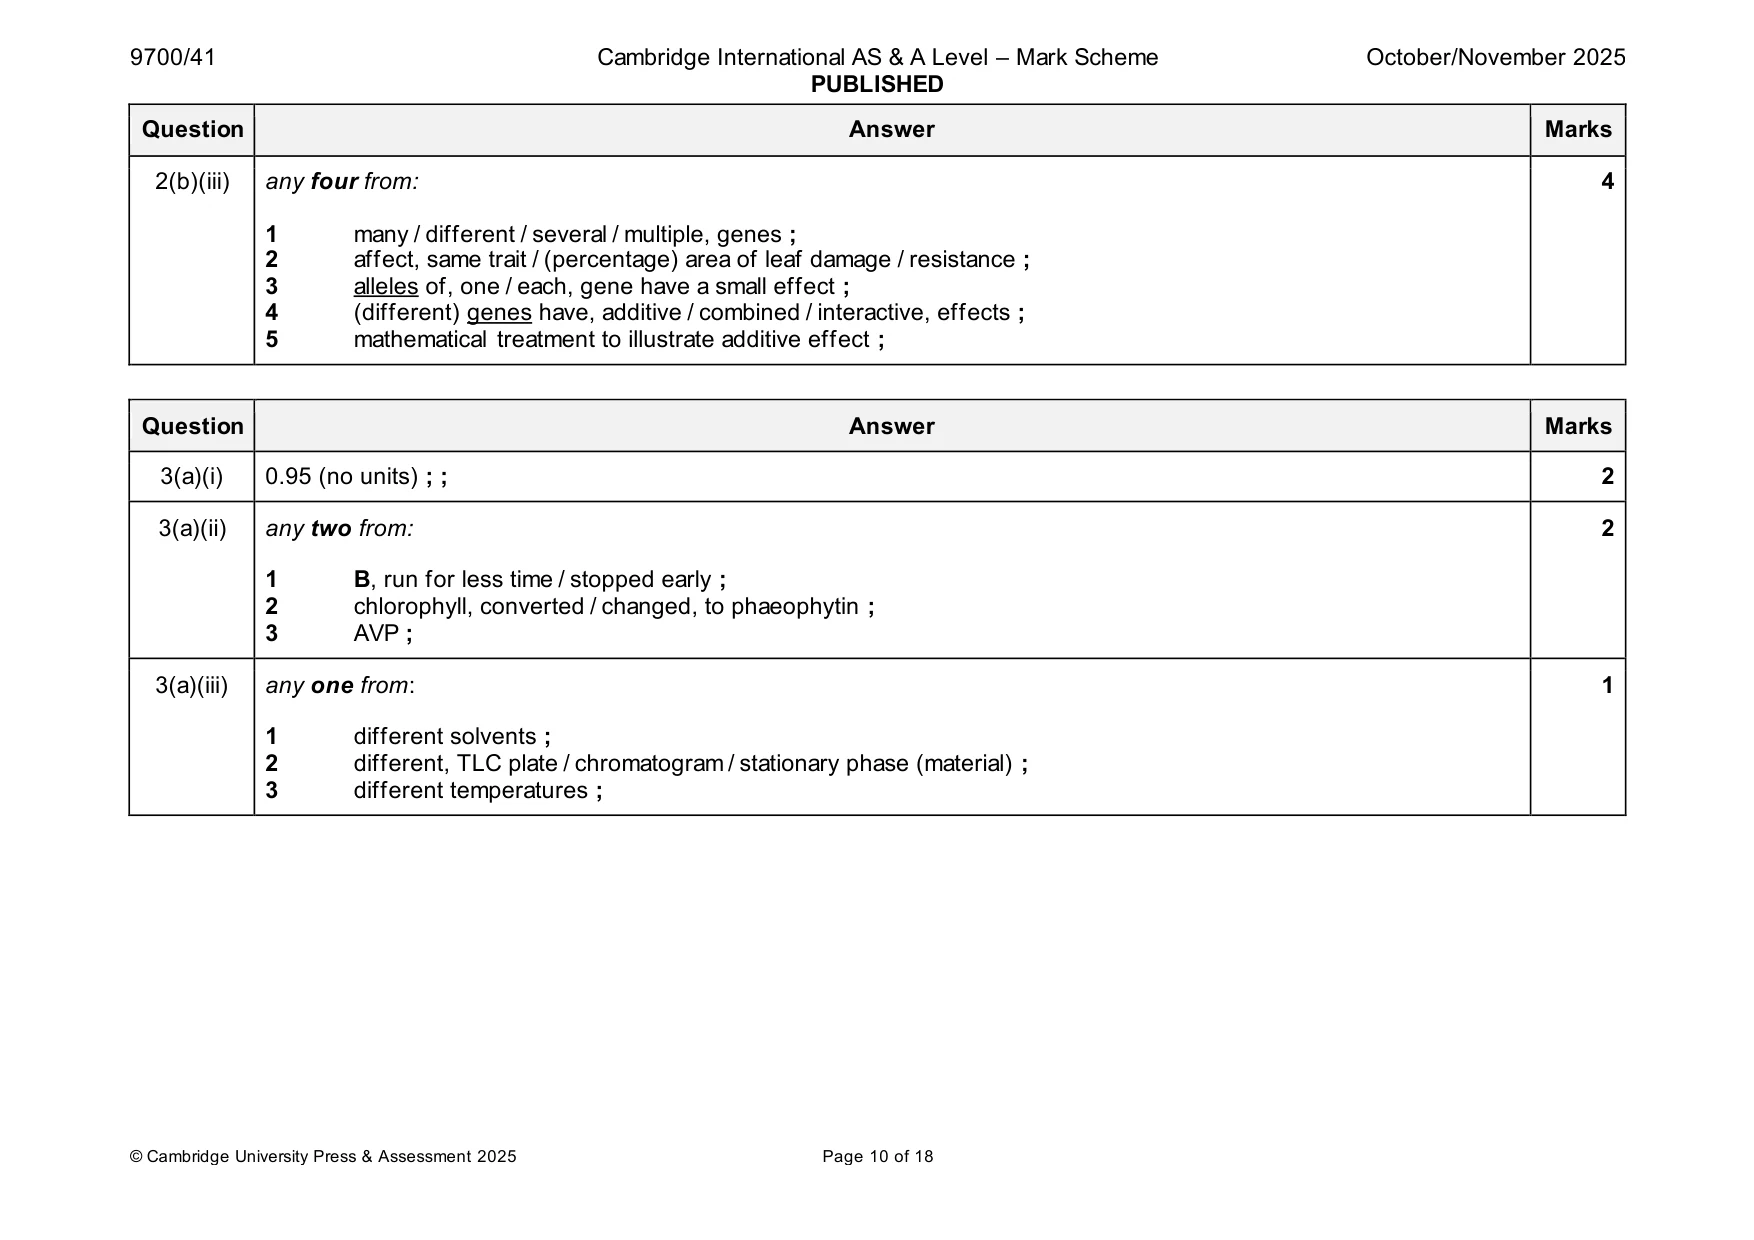
Mark scheme: 2(a)(i) 2 E. turcicum Z. mays 1 chitin cell wall cellulose cell wall structural or or difference no chloroplasts chloroplasts or or hyphae / cells long and branching no hyphae / cells not long and branching or or syncytial / multinucleate / several nuclei per cell one nucleus per cell ; 2 heterotroph(ic) / parasitic / obtain food from host / do autotroph(ic) / phototrophic functional not photosynthesise / photosynthesis(e) ; difference 2(a)(ii) any four from: 4 1 large groups divide into smaller groups ; 2 common / similar / shared, features within a group ; 3 ref. three of: kingdom – phylum – class – order – family ; 4 genus and species = binomial / Linnaean / Latin / scientific, name ; 5 (both in domain) Eukarya ; 6 different kingdoms / Fungi and Plantae ; 2(b)(i) any two from: 2 1 low percentage leaf damage means high resistance (to infection) ; 2 SKV50 = 22% and CML153 = 58% ; 3 SKV50 shows greater resistance (to infection) ; 2(b)(ii) continuous ; 1 2(b)(iii) any four from: 4 1 many / different / several / multiple, genes ; 2 affect, same trait / (percentage) area of leaf damage / resistance ; 3 alleles of, one / each, gene have a small effect ; 4 (different) genes have, additive / combined / interactive, effects ; 5 mathematical treatment to illustrate additive effect ;
Q3 · Plants have several different photosynthetic pigments in their chloroplasts
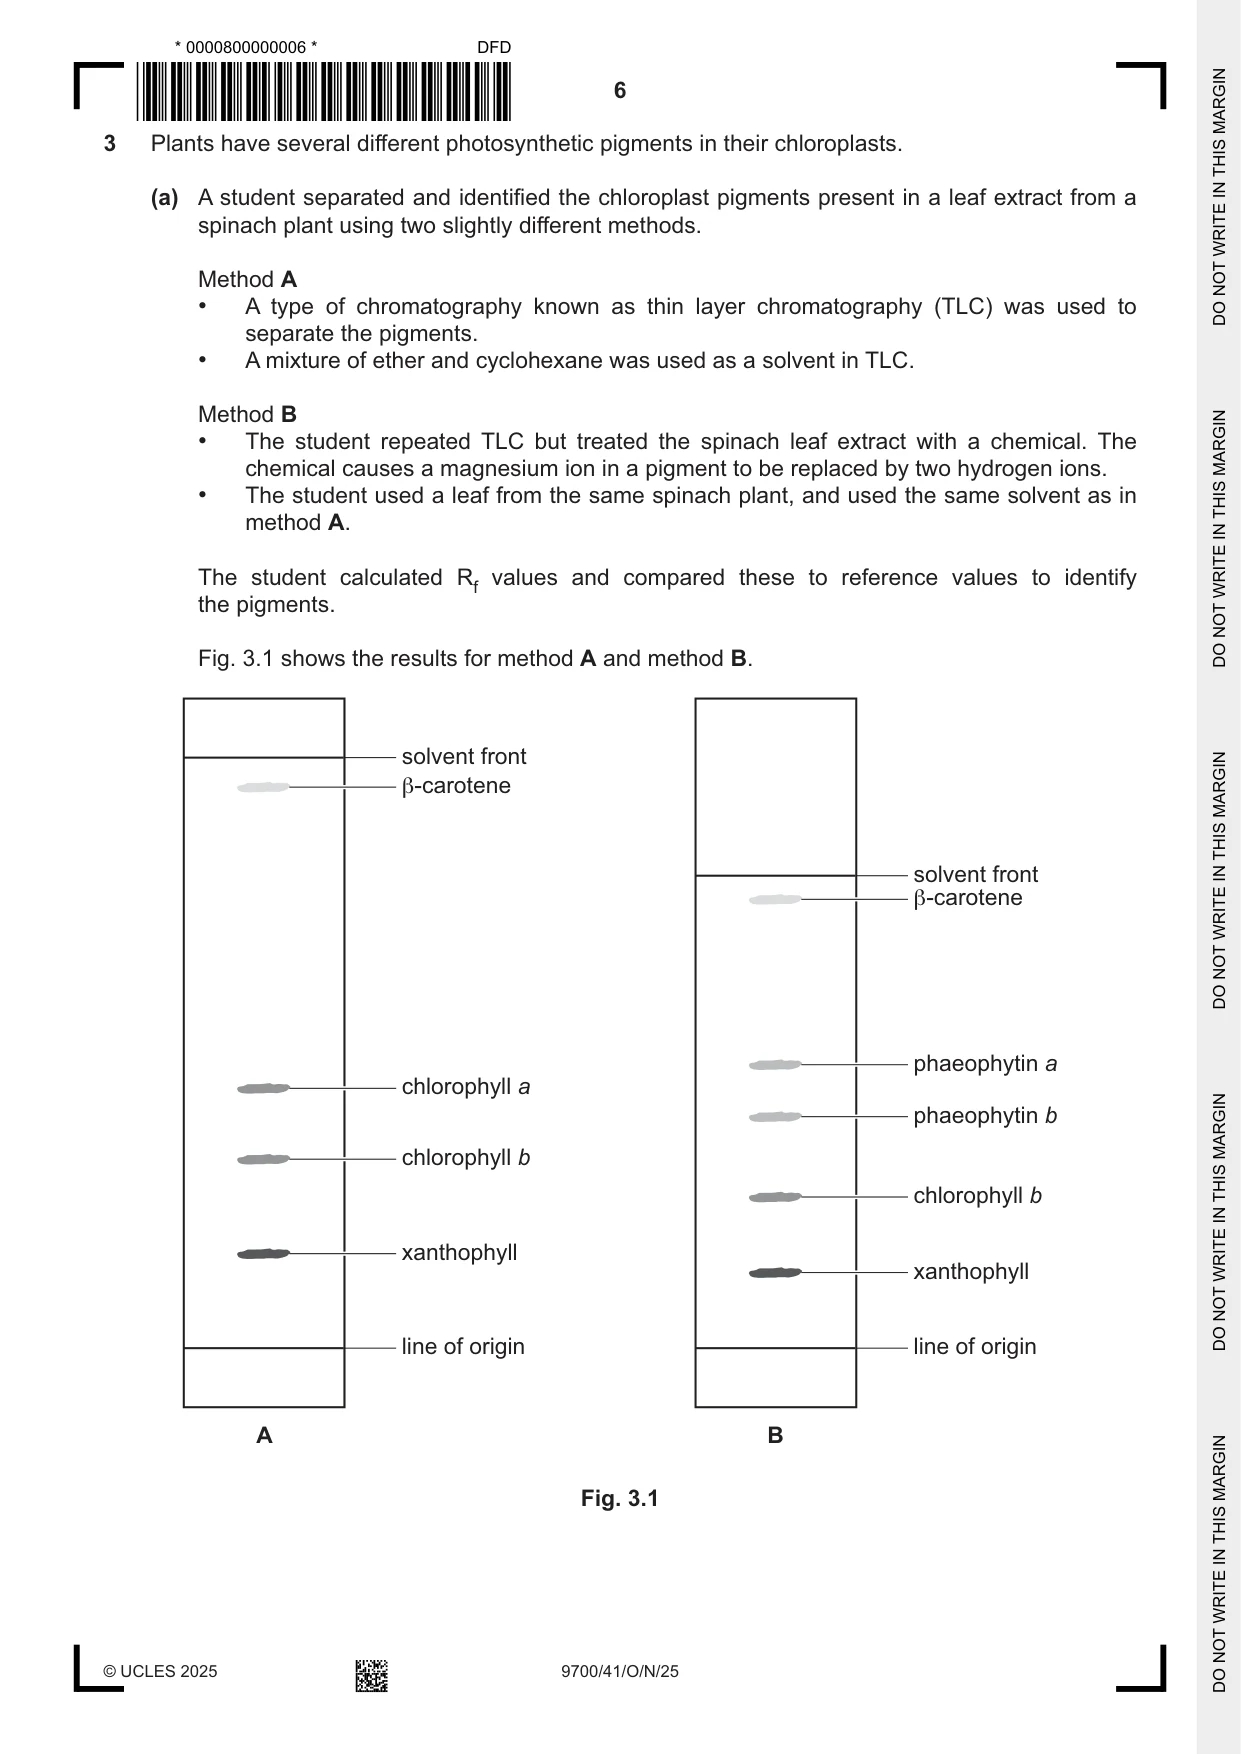
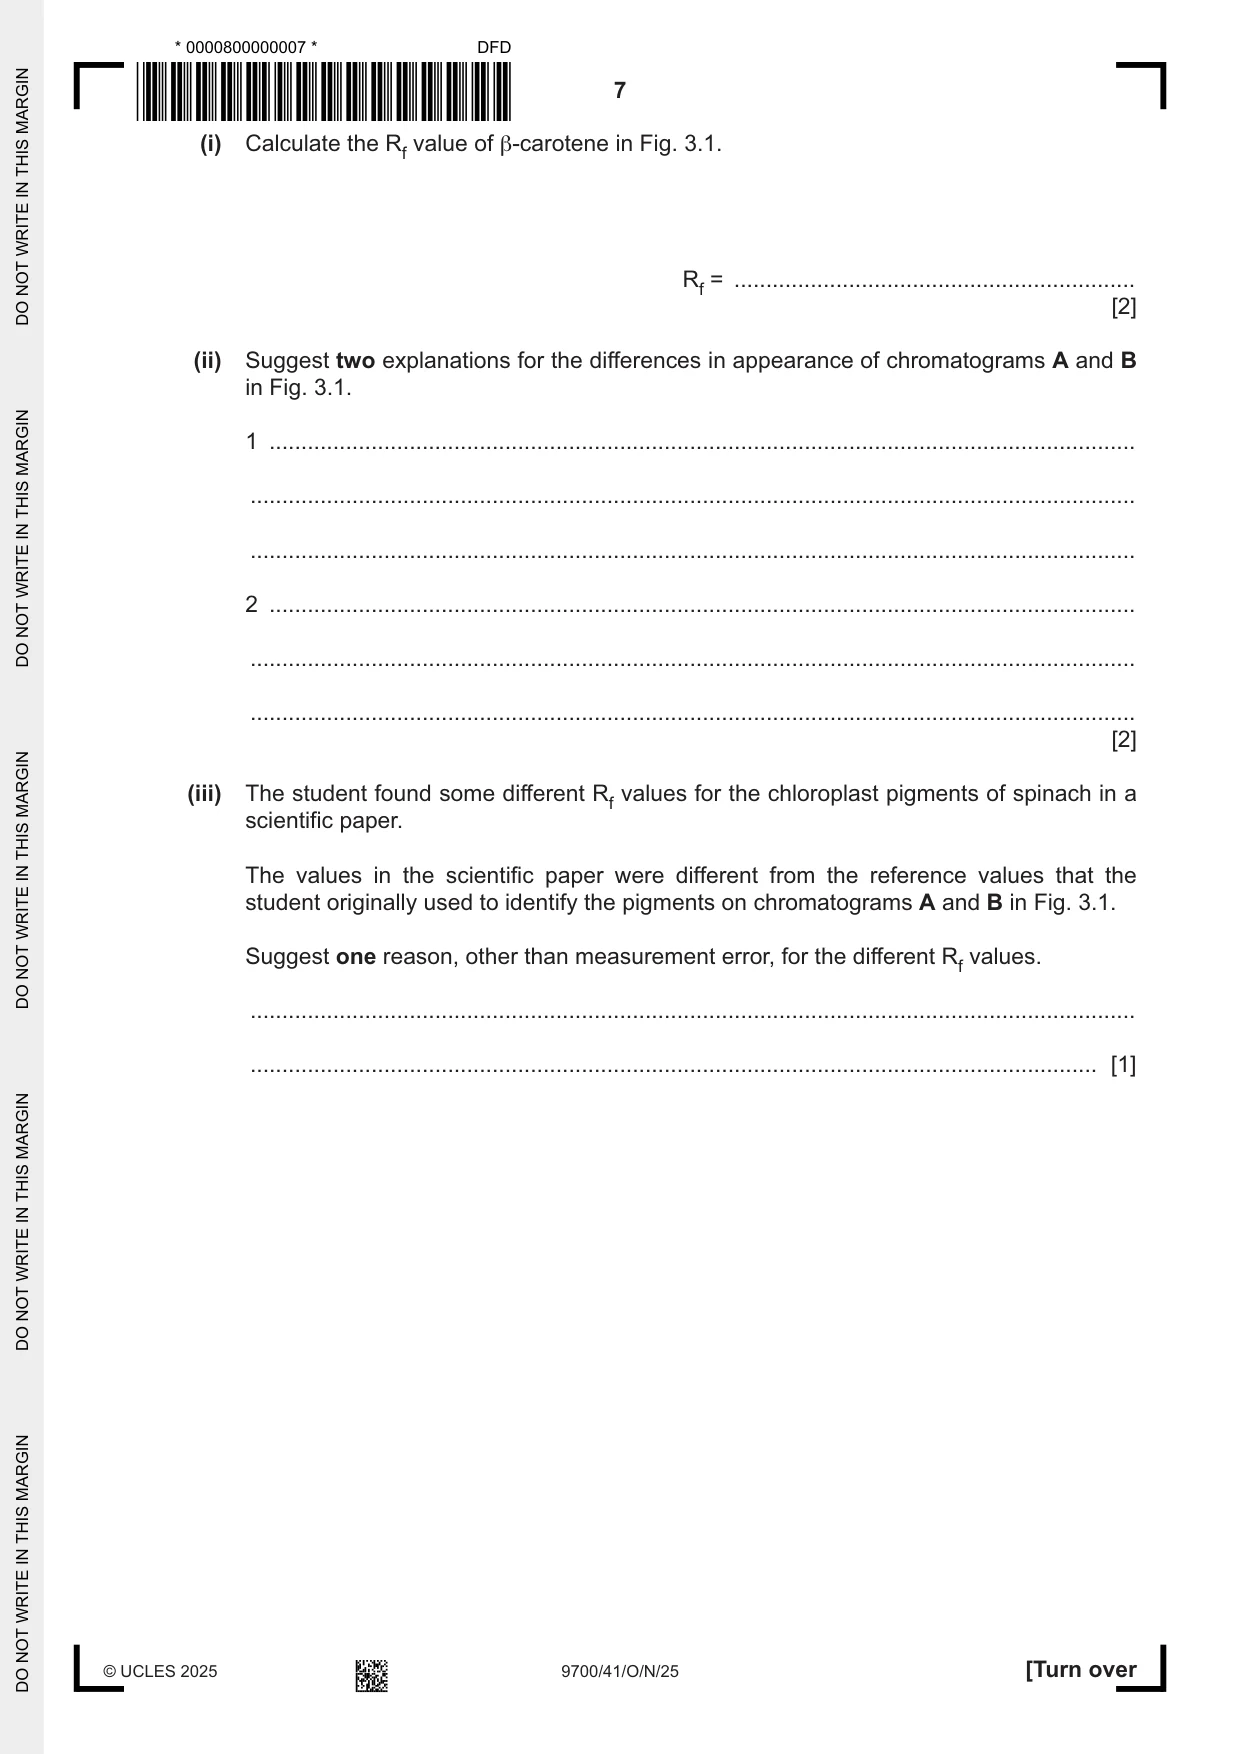
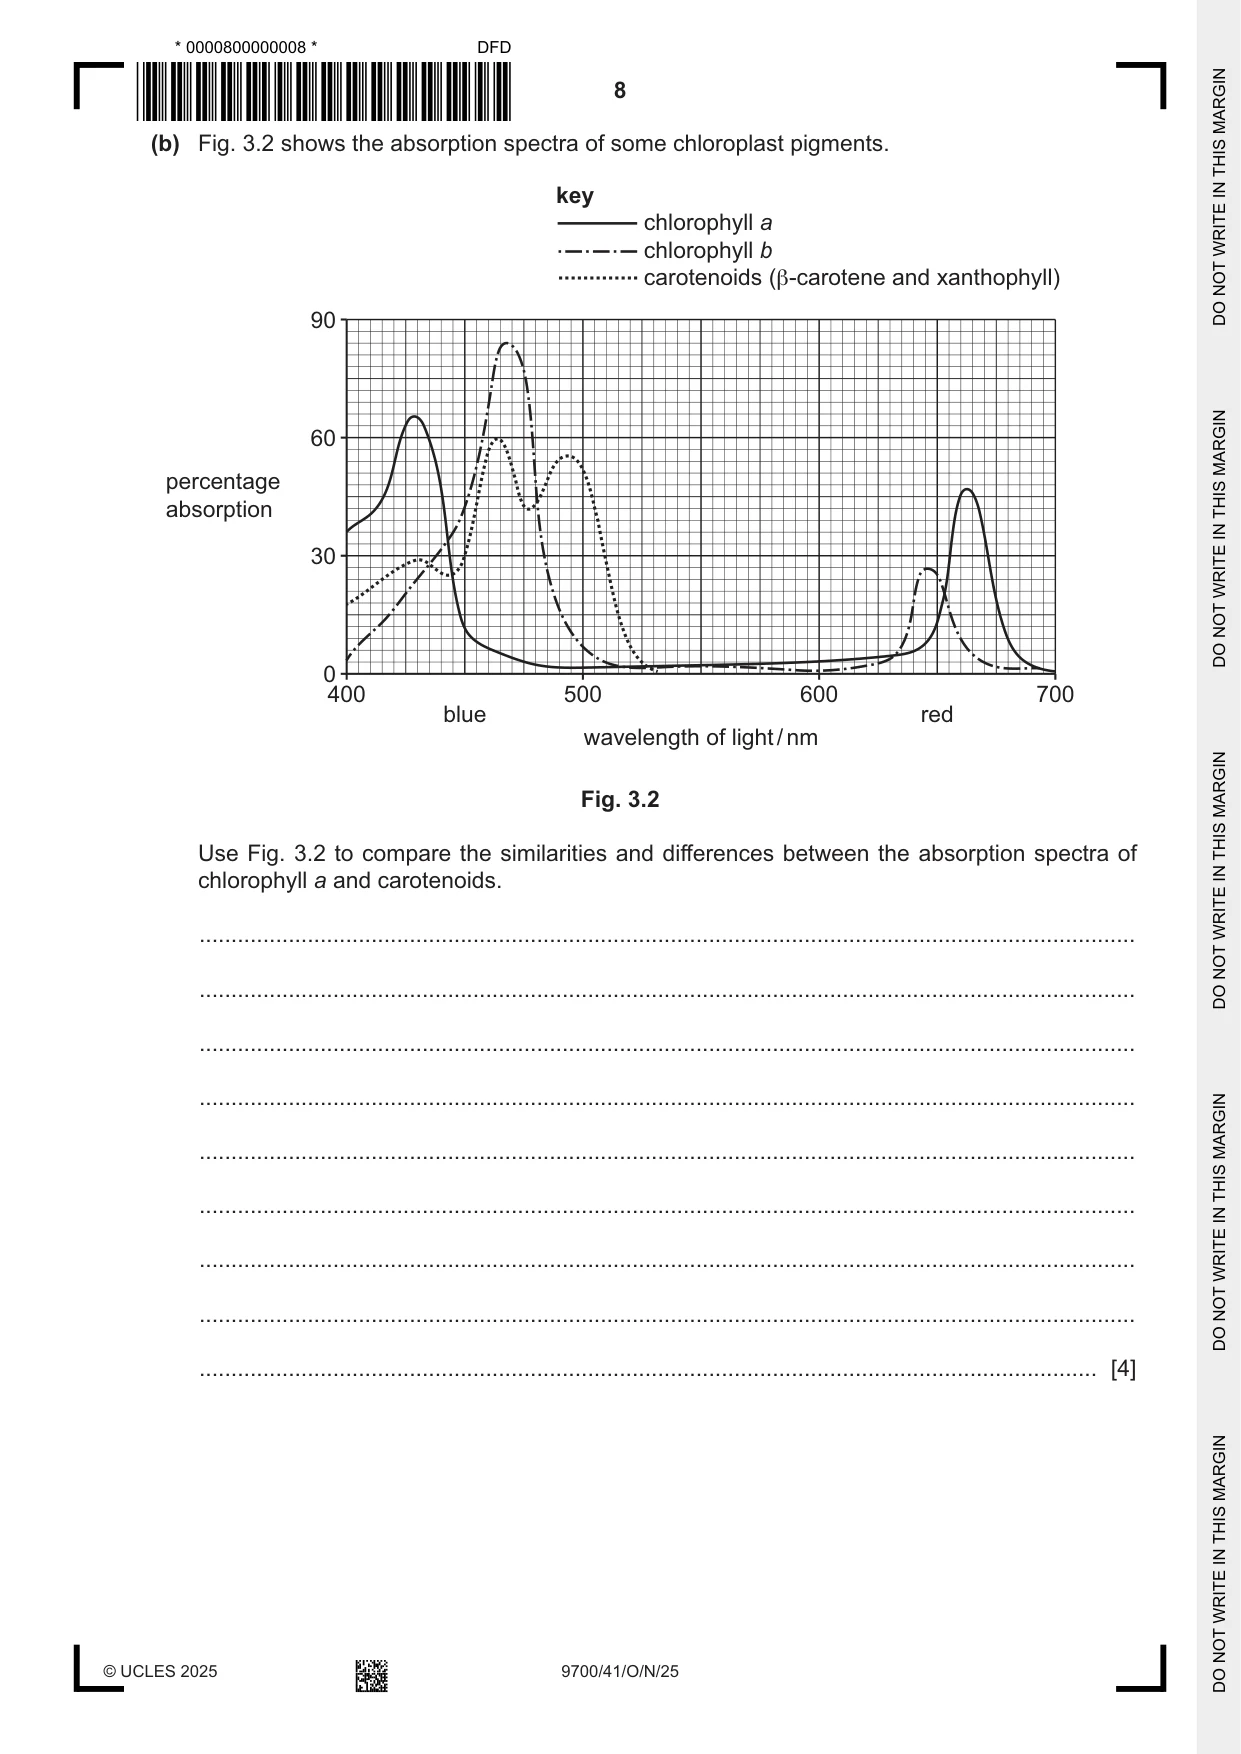
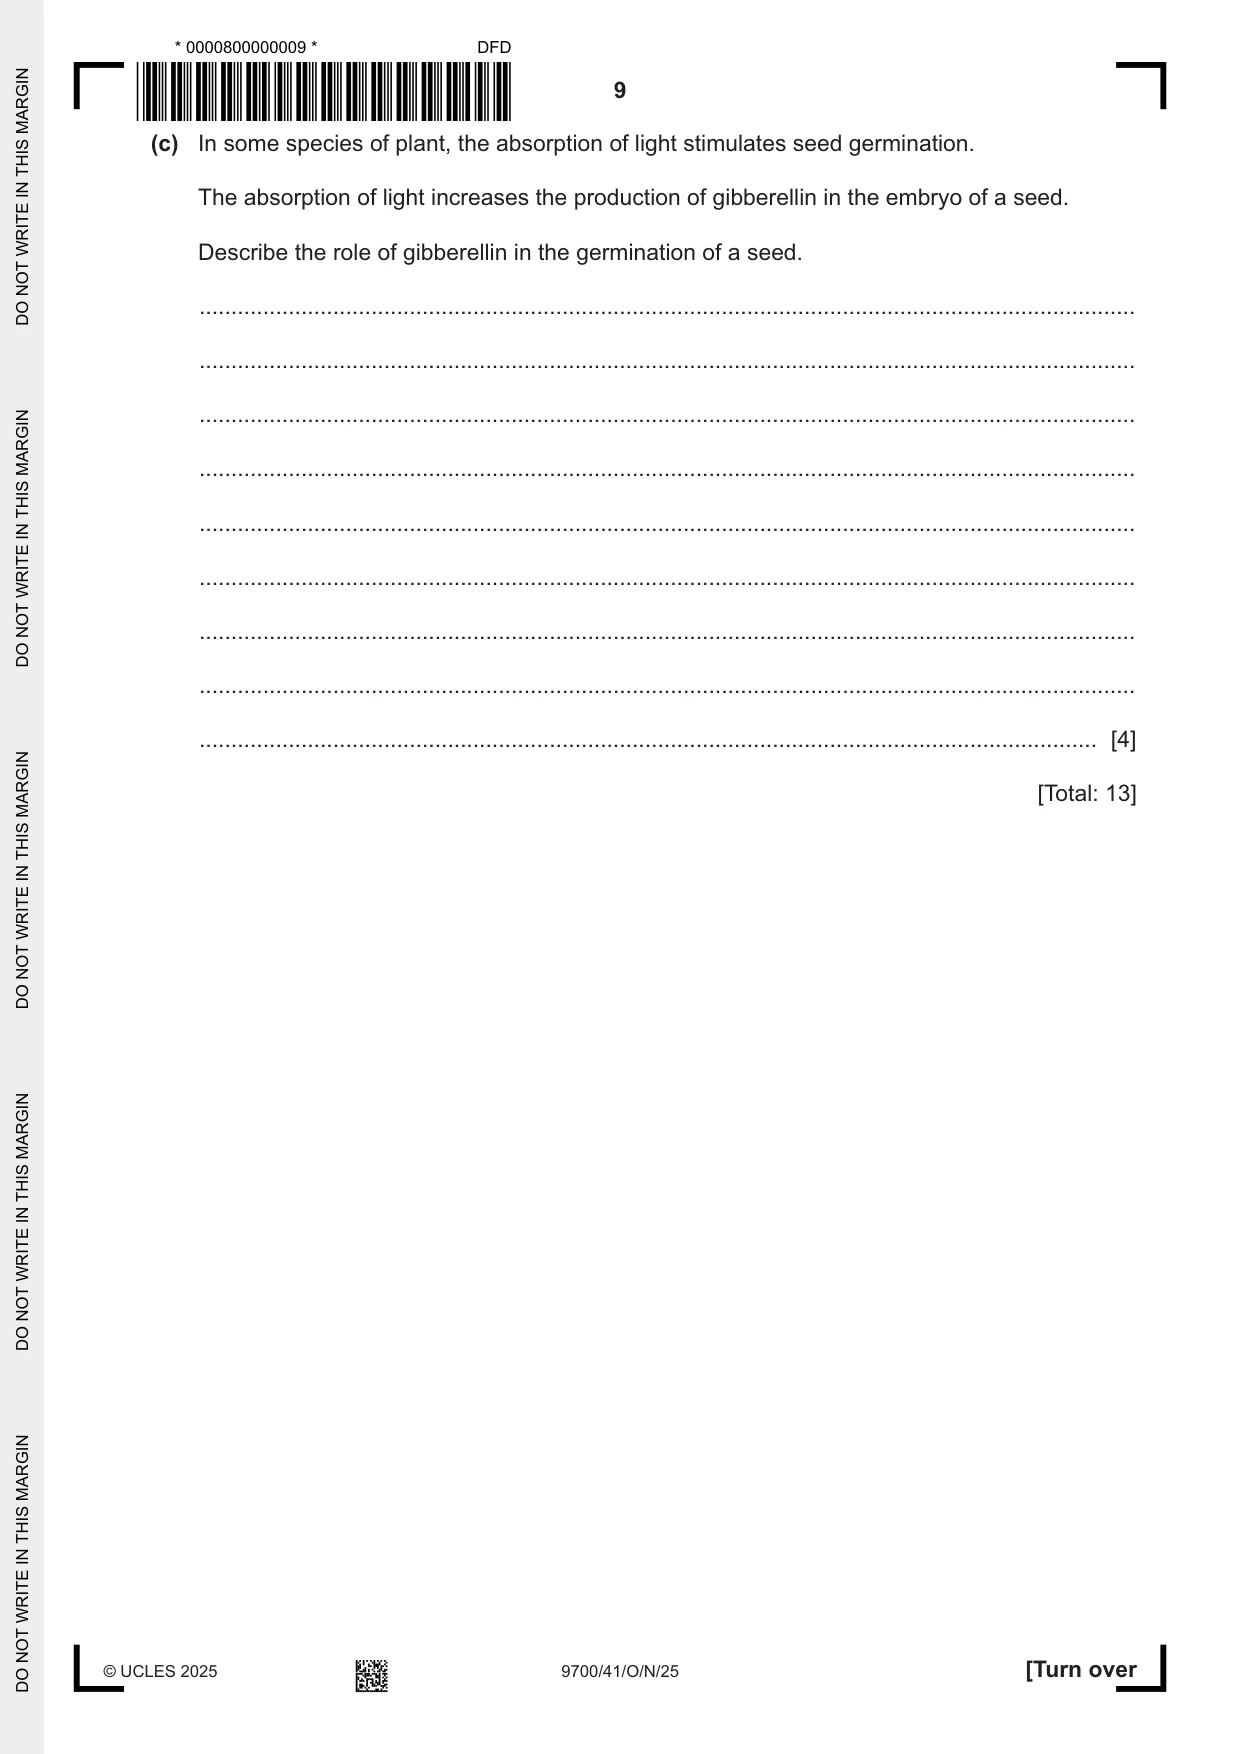
3 Plants have several different photosynthetic pigments in their chloroplasts. (a) A student separated and identified the chloroplast pigments present in a leaf extract from a spinach plant using two slightly different methods. Method A • A type of chromatography known as thin layer chromatography (TLC) was used to separate the pigments. • A mixture of ether and cyclohexane was used as a solvent in TLC. Method B • The student repeated TLC but treated the spinach leaf extract with a chemical. The chemical causes a magnesium ion in a pigment to be replaced by two hydrogen ions. • The student used a leaf from the same spinach plant, and used the same solvent as in method A. The student calculated Rf values and compared these to reference values to identify the pigments. Fig. 3.1 shows the results for method A and method B. solvent front β-carotene solvent front β-carotene phaeophytin a chlorophyll a phaeophytin b chlorophyll b chlorophyll b xanthophyll xanthophyll line of origin line of origin A B Fig. 3.1 (i) Calculate the Rf value of β‑carotene in Fig. 3.1. Rf = ............................................................... [2] (ii) Suggest two explanations for the differences in appearance of chromatograms A and B in Fig. 3.1. 1 ........................................................................................................................................ ........................................................................................................................................... ........................................................................................................................................... 2 ........................................................................................................................................ ........................................................................................................................................... ........................................................................................................................................... [2] (iii) The student found some different Rf values for the chloroplast pigments of spinach in a scientific paper. The values in the scientific paper were different from the reference values that the student originally used to identify the pigments on chromatograms A and B in Fig. 3.1. Suggest one reason, other than measurement error, for the different Rf values. ........................................................................................................................................... ..................................................................................................................................... [1] (b) Fig. 3.2 shows the absorption spectra of some chloroplast pigments. key chlorophyll a chlorophyll b carotenoids (β-carotene and xanthophyll) 90 60 percentage absorption 30 0 400 500 600 700 blue red wavelength of light / nm Fig. 3.2 Use Fig. 3.2 to compare the similarities and differences between the absorption spectra of chlorophyll a and carotenoids. ................................................................................................................................................... ................................................................................................................................................... ................................................................................................................................................... ................................................................................................................................................... ................................................................................................................................................... ................................................................................................................................................... ................................................................................................................................................... ................................................................................................................................................... ............................................................................................................................................. [4] (c) In some species of plant, the absorption of light stimulates seed germination. The absorption of light increases the production of gibberellin in the embryo of a seed. Describe the role of gibberellin in the germination of a seed. ................................................................................................................................................... ................................................................................................................................................... ................................................................................................................................................... ................................................................................................................................................... ................................................................................................................................................... ................................................................................................................................................... ................................................................................................................................................... ................................................................................................................................................... ............................................................................................................................................. [4] [Total: 13]
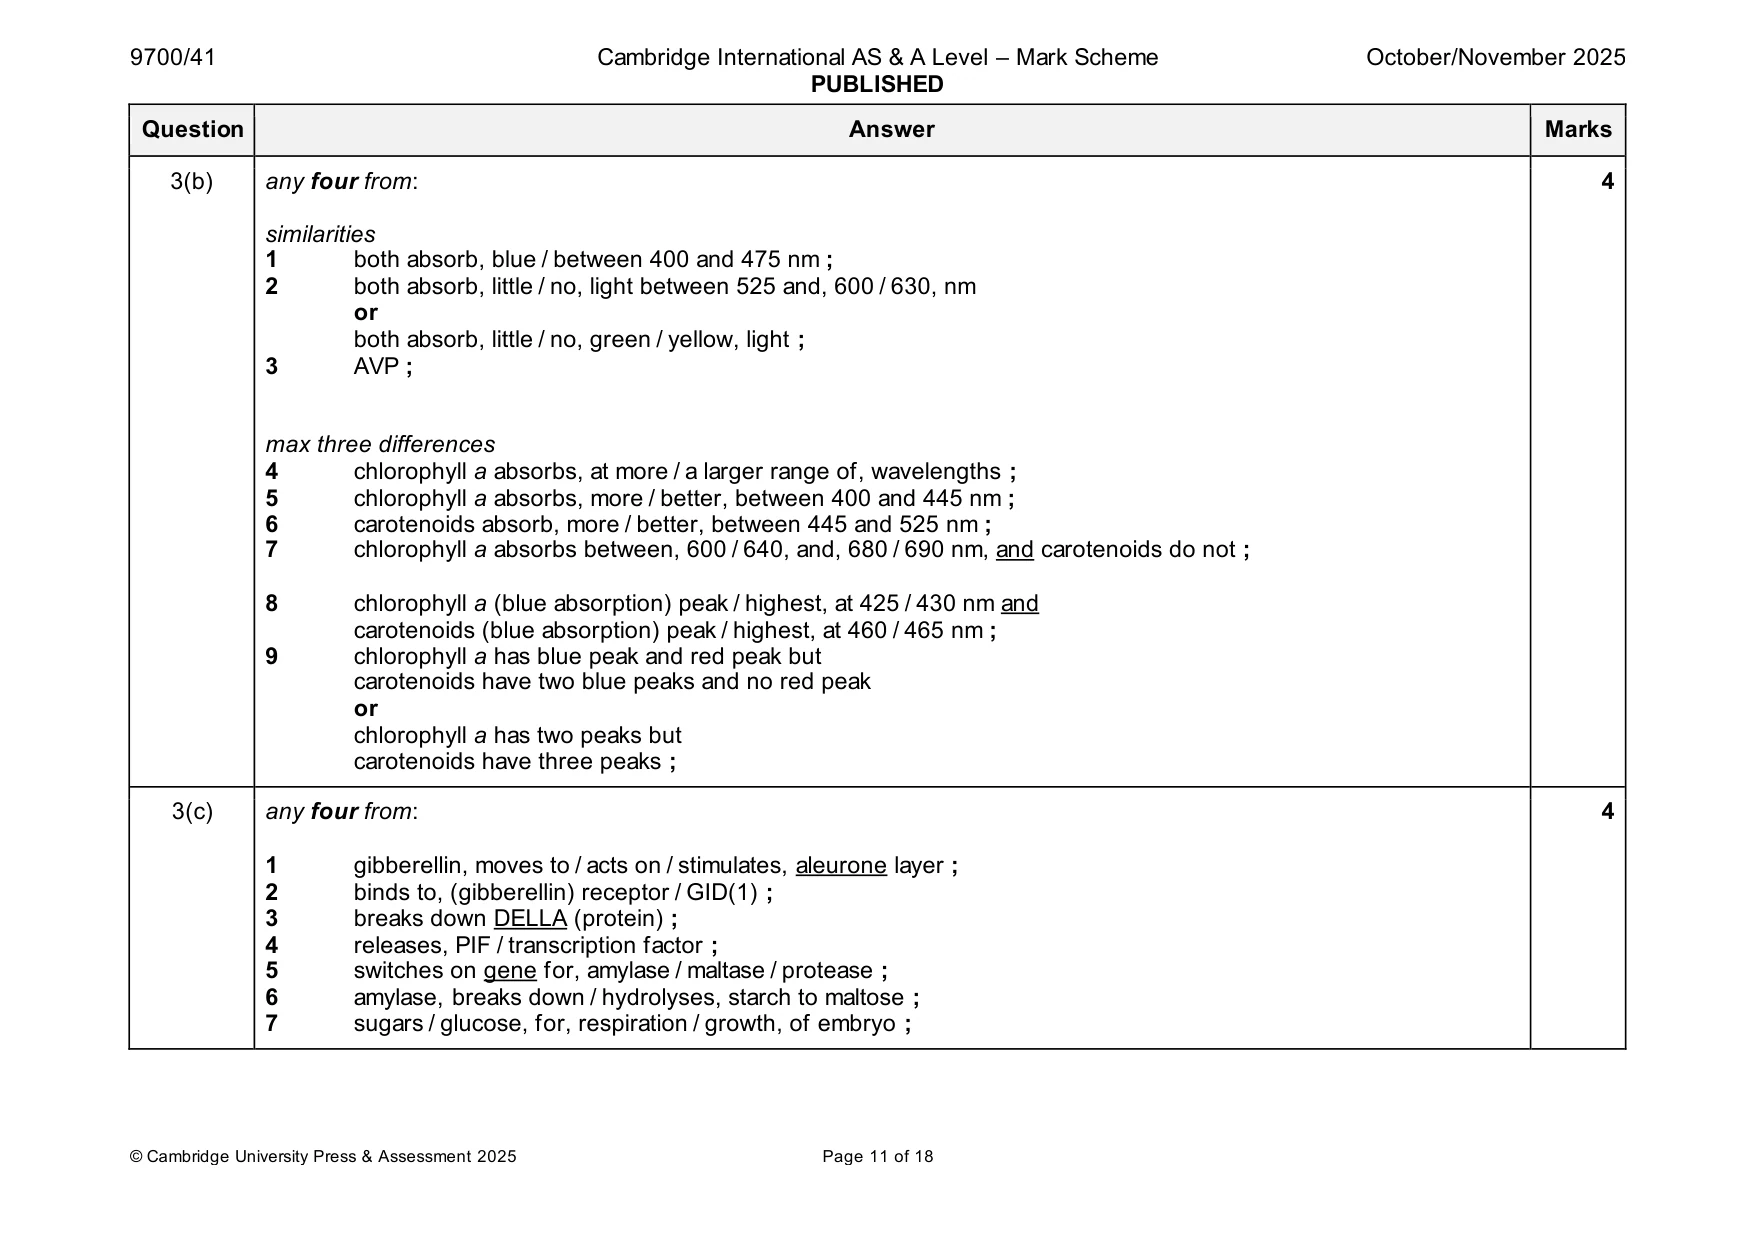
Mark scheme: 3(a)(i) 0.95 (no units) ; ; 2 3(a)(ii) any two from: 2 1 B, run for less time / stopped early ; 2 chlorophyll, converted / changed, to phaeophytin ; 3 AVP ; 3(a)(iii) any one from: 1 1 different solvents ; 2 different, TLC plate / chromatogram / stationary phase (material) ; 3 different temperatures ; 3(b) any four from: 4 similarities 1 both absorb, blue / between 400 and 475 nm ; 2 both absorb, little / no, light between 525 and, 600 / 630, nm or both absorb, little / no, green / yellow, light ; 3 AVP ; max three differences 4 chlorophyll a absorbs, at more / a larger range of, wavelengths ; 5 chlorophyll a absorbs, more / better, between 400 and 445 nm ; 6 carotenoids absorb, more / better, between 445 and 525 nm ; 7 chlorophyll a absorbs between, 600 / 640, and, 680 / 690 nm, and carotenoids do not ; 8 chlorophyll a (blue absorption) peak / highest, at 425 / 430 nm and carotenoids (blue absorption) peak / highest, at 460 / 465 nm ; 9 chlorophyll a has blue peak and red peak but carotenoids have two blue peaks and no red peak or chlorophyll a has two peaks but carotenoids have three peaks ; 3(c) any four from: 4 1 gibberellin, moves to / acts on / stimulates, aleurone layer ; 2 binds to, (gibberellin) receptor / GID(1) ; 3 breaks down DELLA (protein) ; 4 releases, PIF / transcription factor ; 5 switches on gene for, amylase / maltase / protease ; 6 amylase, breaks down / hydrolyses, starch to maltose ; 7 sugars / glucose, for, respiration / growth, of embryo ;
More questions on Photosynthesis as an energy transfer process
Q4 · The wolf, Canis lupus, lives in North America
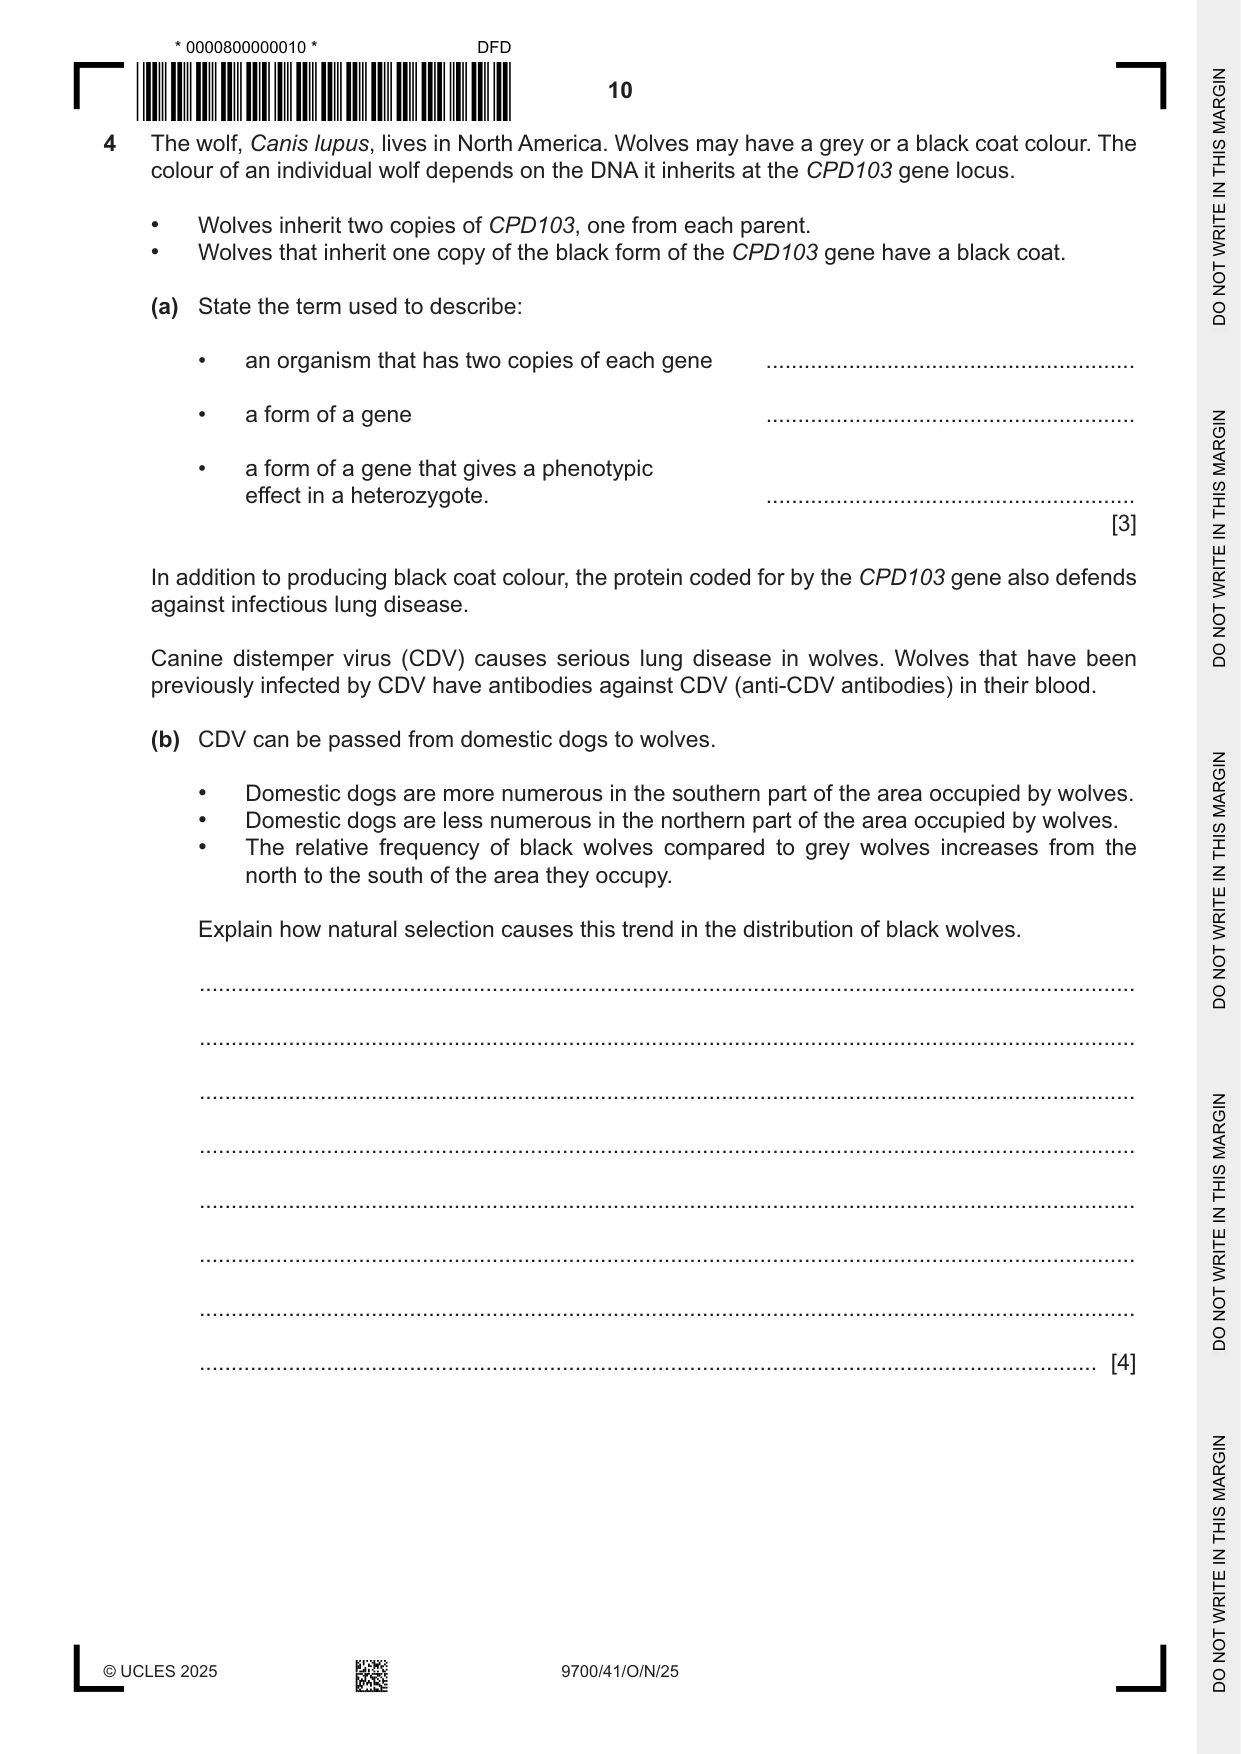
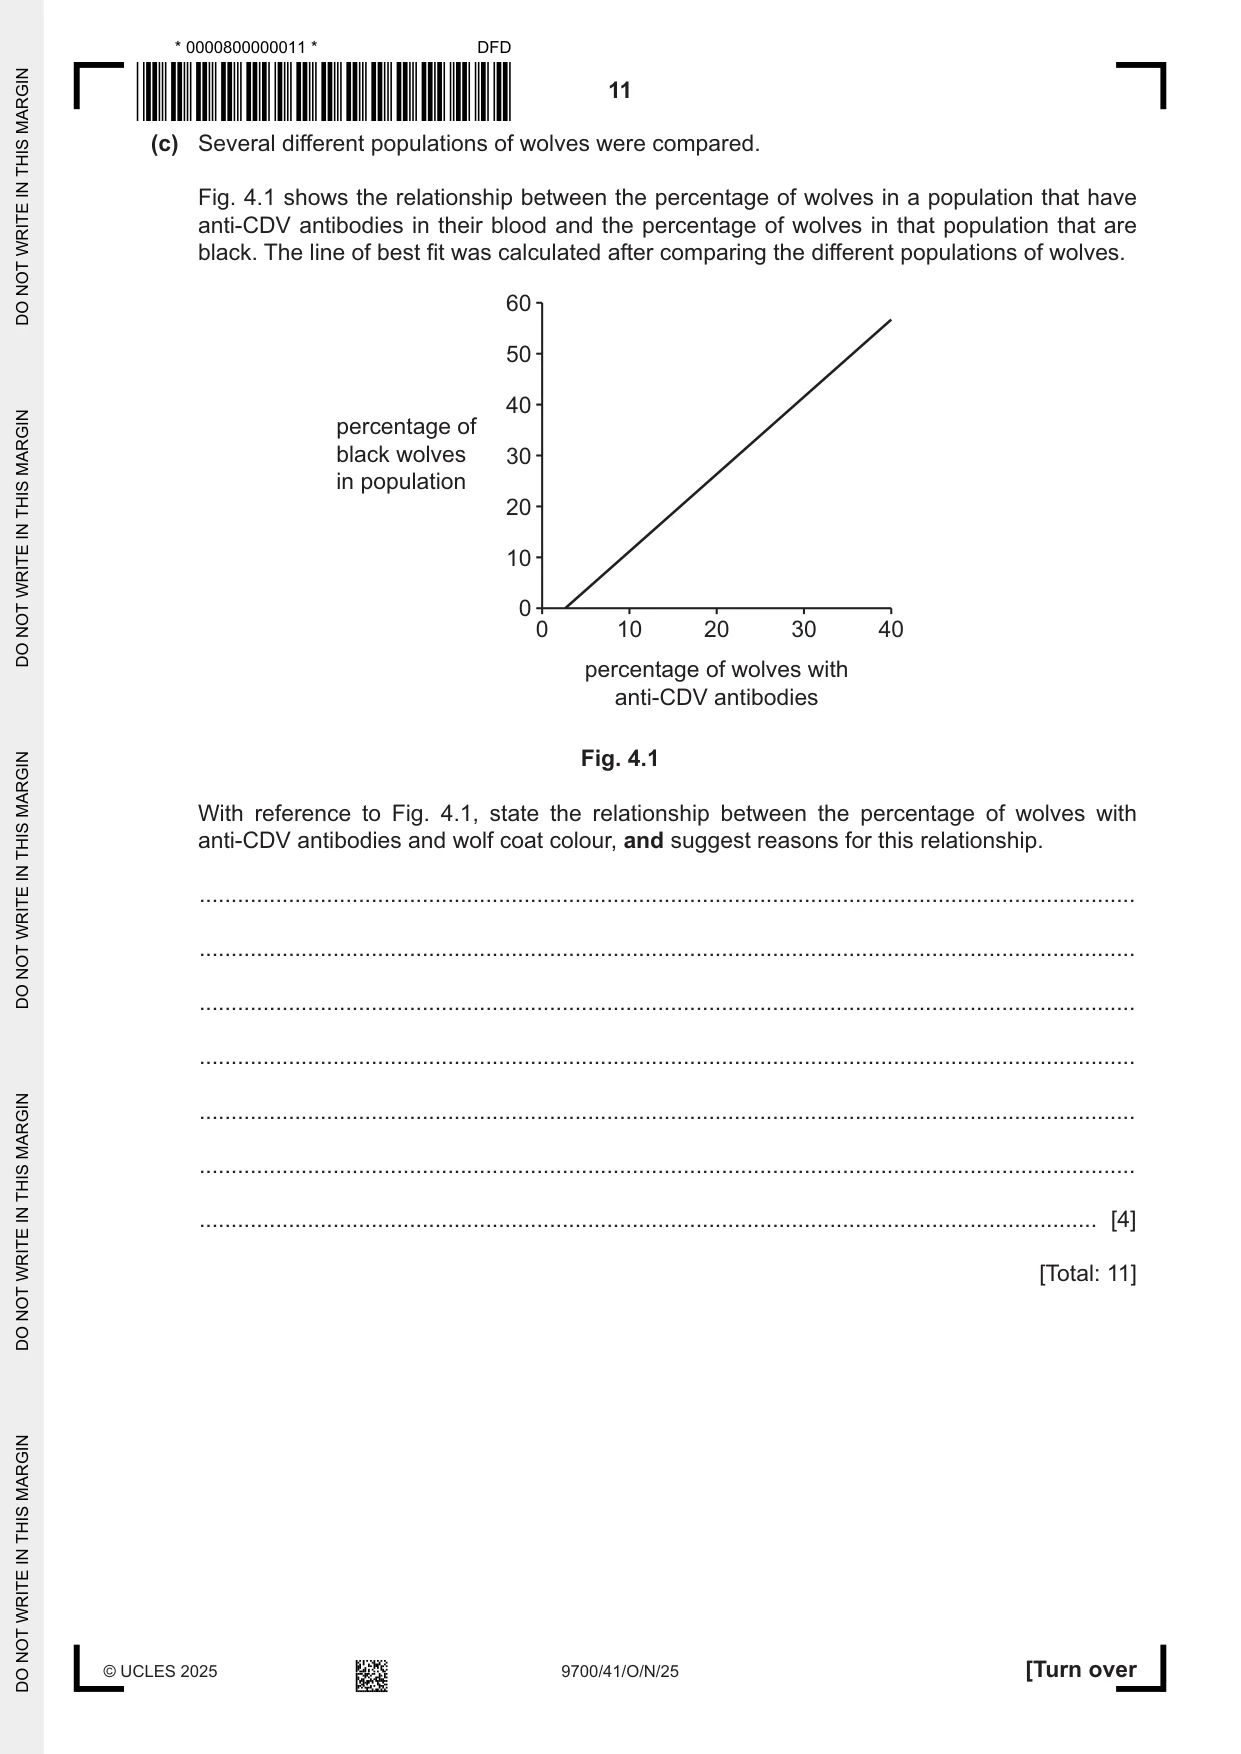
4 The wolf, Canis lupus, lives in North America. Wolves may have a grey or a black coat colour. The colour of an individual wolf depends on the DNA it inherits at the CPD103 gene locus. • Wolves inherit two copies of CPD103, one from each parent. • Wolves that inherit one copy of the black form of the CPD103 gene have a black coat. (a) State the term used to describe: • an organism that has two copies of each gene .......................................................... • a form of a gene .......................................................... • a form of a gene that gives a phenotypic effect in a heterozygote. .......................................................... [3] In addition to producing black coat colour, the protein coded for by the CPD103 gene also defends against infectious lung disease. Canine distemper virus (CDV) causes serious lung disease in wolves. Wolves that have been previously infected by CDV have antibodies against CDV (anti‑CDV antibodies) in their blood. (b) CDV can be passed from domestic dogs to wolves. • Domestic dogs are more numerous in the southern part of the area occupied by wolves. • Domestic dogs are less numerous in the northern part of the area occupied by wolves. • The relative frequency of black wolves compared to grey wolves increases from the north to the south of the area they occupy. Explain how natural selection causes this trend in the distribution of black wolves. ................................................................................................................................................... ................................................................................................................................................... ................................................................................................................................................... ................................................................................................................................................... ................................................................................................................................................... ................................................................................................................................................... ................................................................................................................................................... ............................................................................................................................................. [4] (c) Several different populations of wolves were compared. Fig. 4.1 shows the relationship between the percentage of wolves in a population that have anti‑CDV antibodies in their blood and the percentage of wolves in that population that are black. The line of best fit was calculated after comparing the different populations of wolves. 60 50 40 percentage of black wolves 30 in population 20 10 0 0 10 20 30 40 percentage of wolves with anti-CDV antibodies Fig. 4.1 With reference to Fig. 4.1, state the relationship between the percentage of wolves with anti‑CDV antibodies and wolf coat colour, and suggest reasons for this relationship. ................................................................................................................................................... ................................................................................................................................................... ................................................................................................................................................... ................................................................................................................................................... ................................................................................................................................................... ................................................................................................................................................... ............................................................................................................................................. [4] [Total: 11]
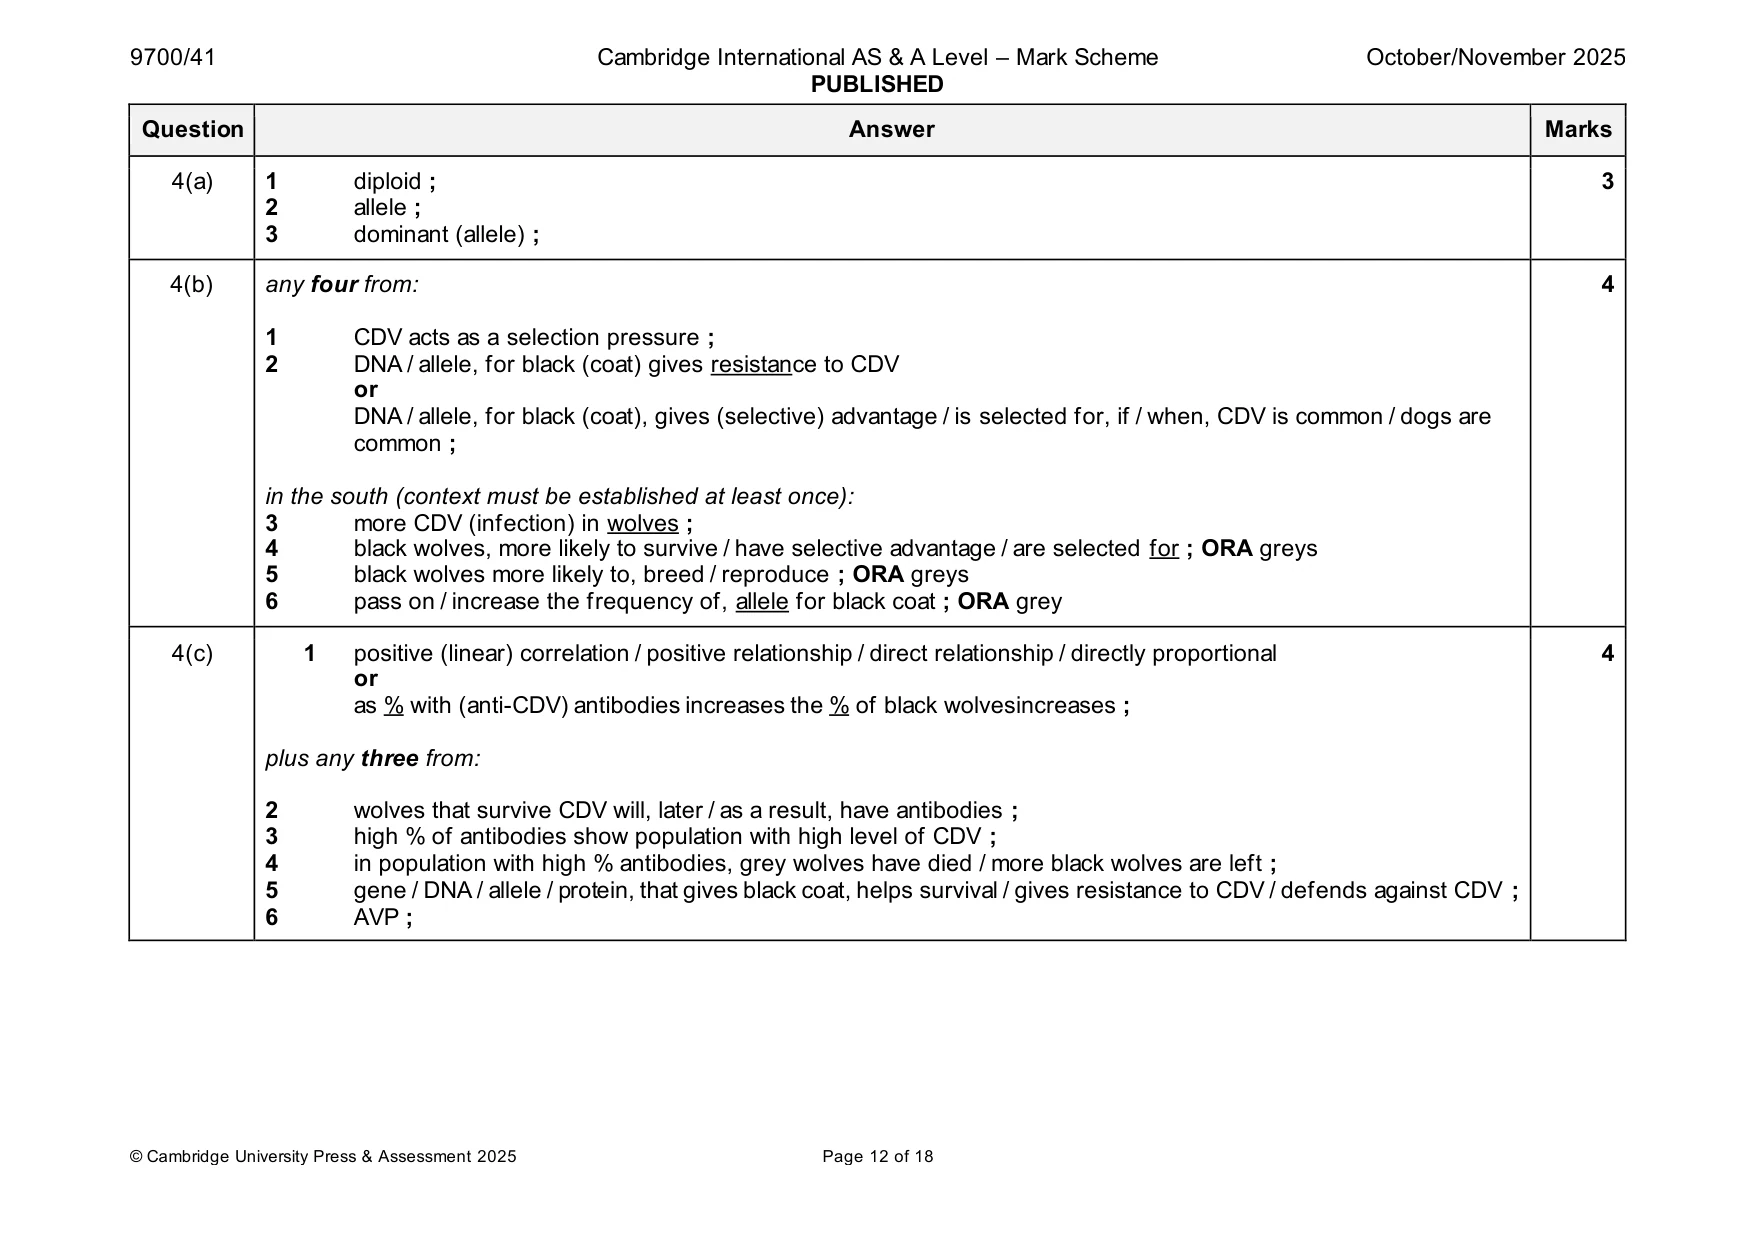
Mark scheme: 4(a) 1 diploid ; 3 2 allele ; 3 dominant (allele) ; 4(b) any four from: 4 1 CDV acts as a selection pressure ; 2 DNA / allele, for black (coat) gives resistance to CDV or DNA / allele, for black (coat), gives (selective) advantage / is selected for, if / when, CDV is common / dogs are common ; in the south (context must be established at least once): 3 more CDV (infection) in wolves ; 4 black wolves, more likely to survive / have selective advantage / are selected for ; ORA greys 5 black wolves more likely to, breed / reproduce ; ORA greys 6 pass on / increase the frequency of, allele for black coat ; ORA grey 4(c) 1 positive (linear) correlation / positive relationship / direct relationship / directly proportional 4 or as % with (anti-CDV) antibodies increases the % of black wolvesincreases ; plus any three from: 2 wolves that survive CDV will, later / as a result, have antibodies ; 3 high % of antibodies show population with high level of CDV ; 4 in population with high % antibodies, grey wolves have died / more black wolves are left ; 5 gene / DNA / allele / protein, that gives black coat, helps survival / gives resistance to CDV / defends against CDV ; 6 AVP ;
Q5 · The endocrine system and the nervous system both coordinate responses in mammals
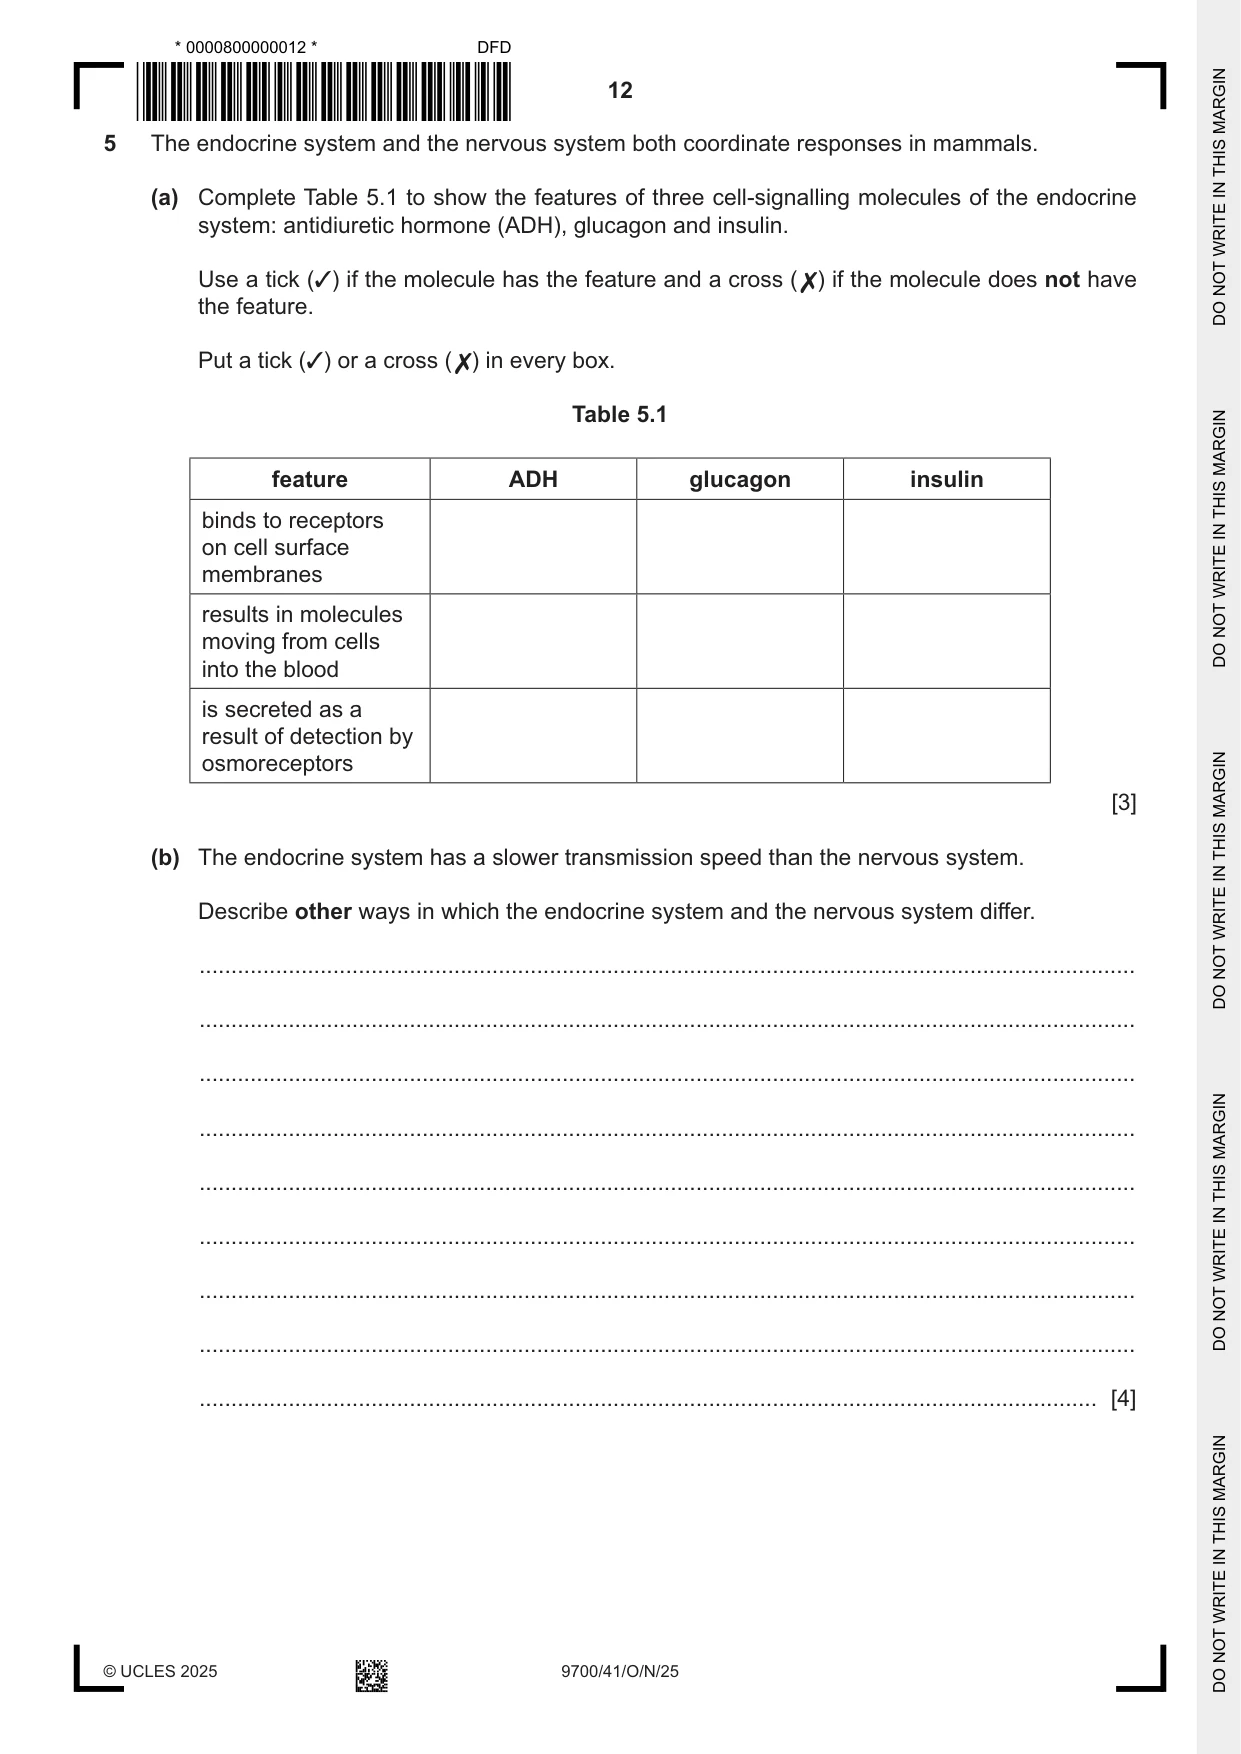
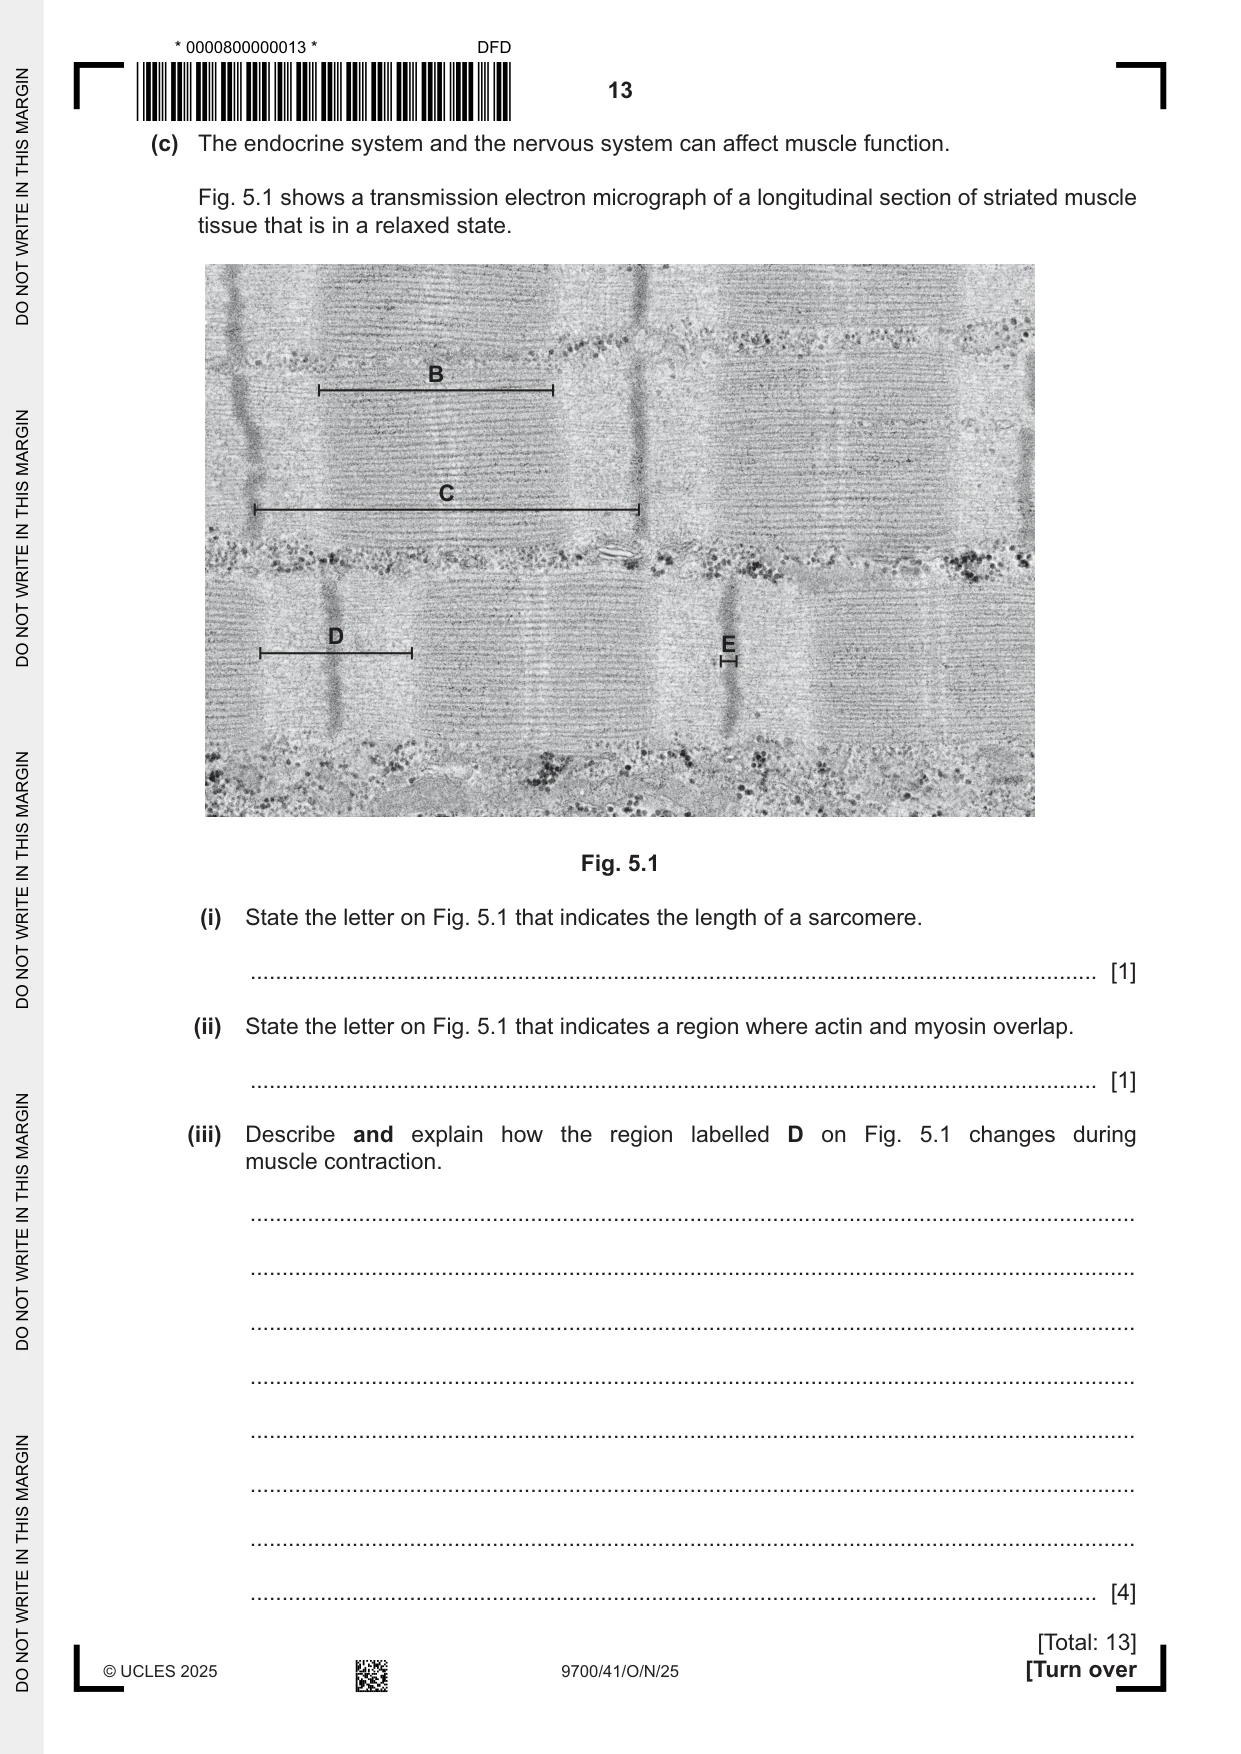
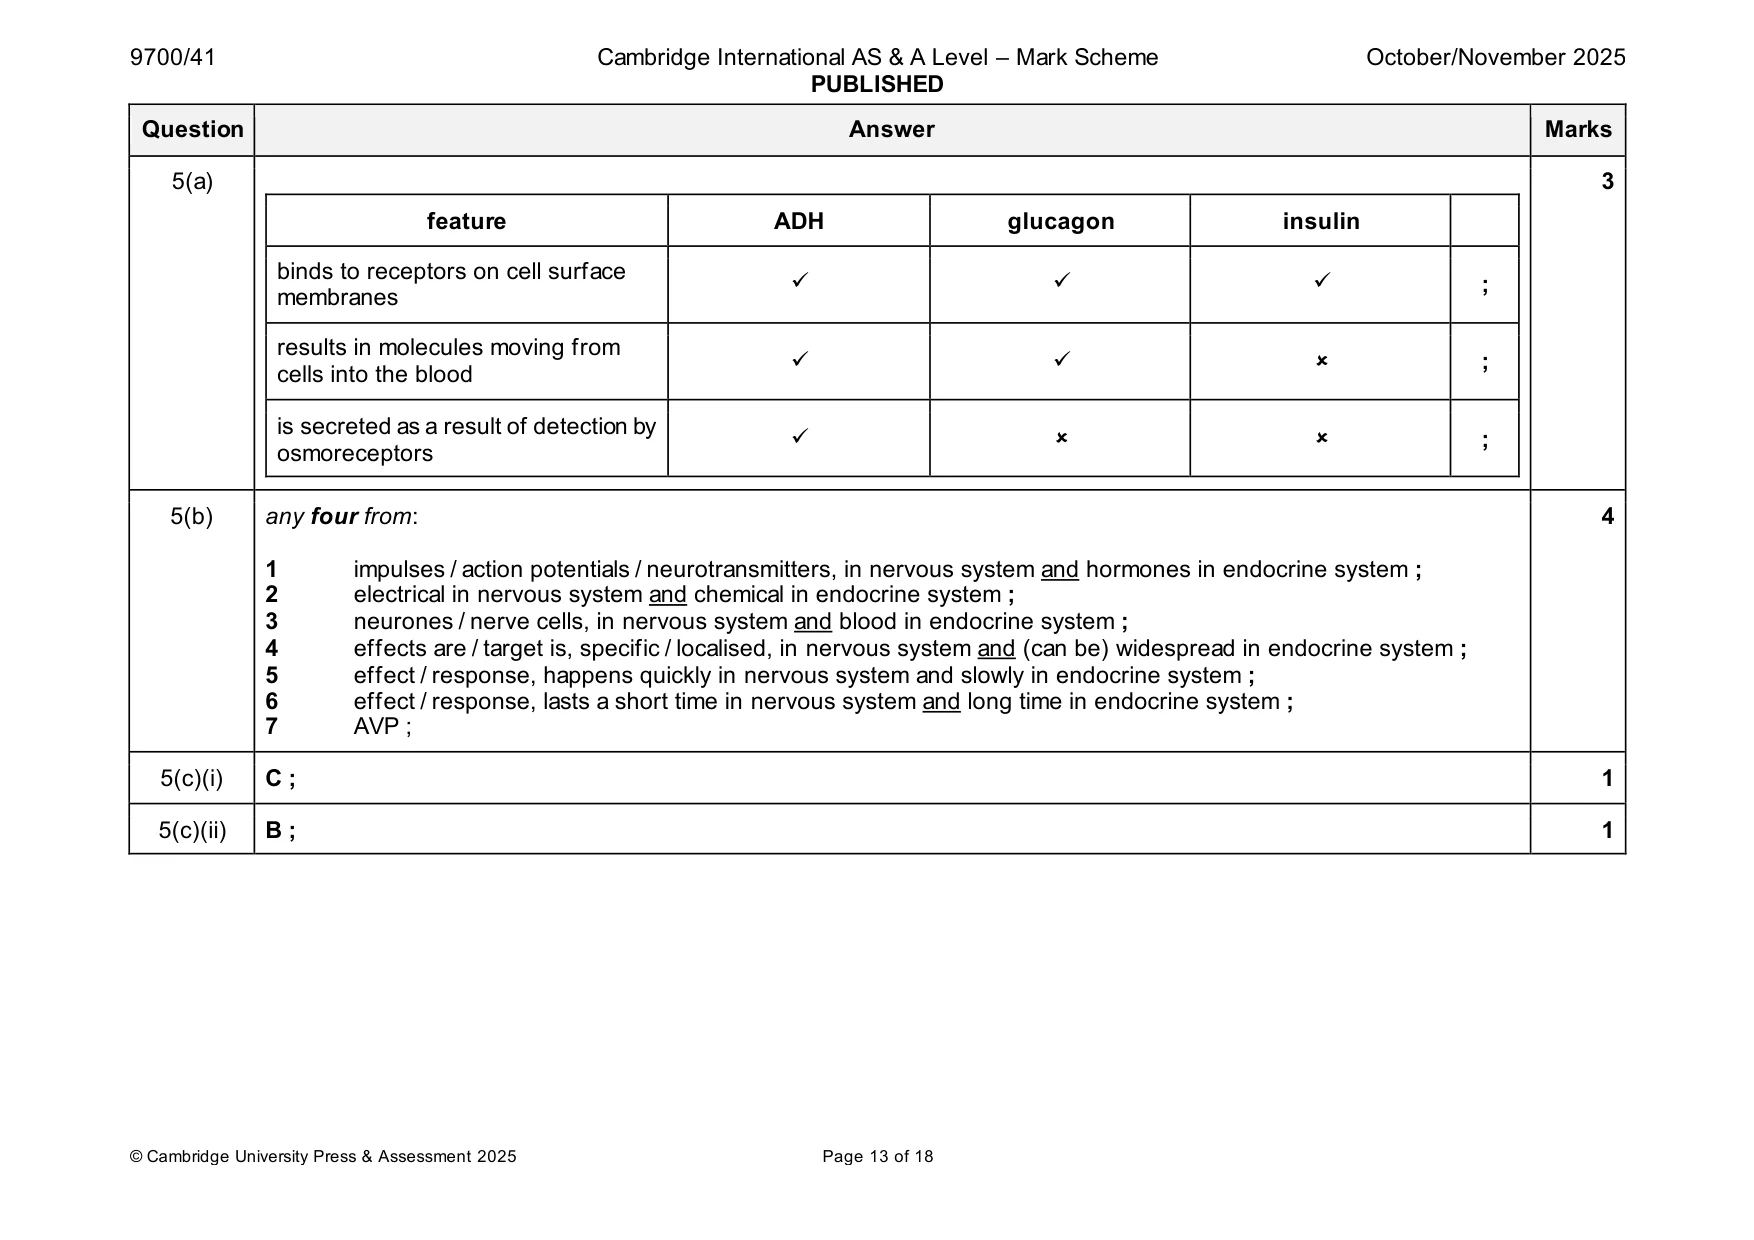
5 The endocrine system and the nervous system both coordinate responses in mammals. (a) Complete Table 5.1 to show the features of three cell‑signalling molecules of the endocrine system: antidiuretic hormone (ADH), glucagon and insulin. Use a tick (3) if the molecule has the feature and a cross ( 7) if the molecule does not have the feature. Put a tick (3) or a cross ( 7) in every box. Table 5.1 feature ADH glucagon insulin binds to receptors on cell surface membranes results in molecules moving from cells into the blood is secreted as a result of detection by osmoreceptors [3] (b) The endocrine system has a slower transmission speed than the nervous system. Describe other ways in which the endocrine system and the nervous system differ. ................................................................................................................................................... ................................................................................................................................................... ................................................................................................................................................... ................................................................................................................................................... ................................................................................................................................................... ................................................................................................................................................... ................................................................................................................................................... ................................................................................................................................................... ............................................................................................................................................. [4] (c) The endocrine system and the nervous system can affect muscle function. Fig. 5.1 shows a transmission electron micrograph of a longitudinal section of striated muscle tissue that is in a relaxed state. B C D E Fig. 5.1 (i) State the letter on Fig. 5.1 that indicates the length of a sarcomere. ..................................................................................................................................... [1] (ii) State the letter on Fig. 5.1 that indicates a region where actin and myosin overlap. ..................................................................................................................................... [1] (iii) Describe and explain how the region labelled D on Fig. 5.1 changes during muscle contraction. ........................................................................................................................................... ........................................................................................................................................... ........................................................................................................................................... ........................................................................................................................................... ........................................................................................................................................... ........................................................................................................................................... ........................................................................................................................................... ..................................................................................................................................... [4] [Total: 13]
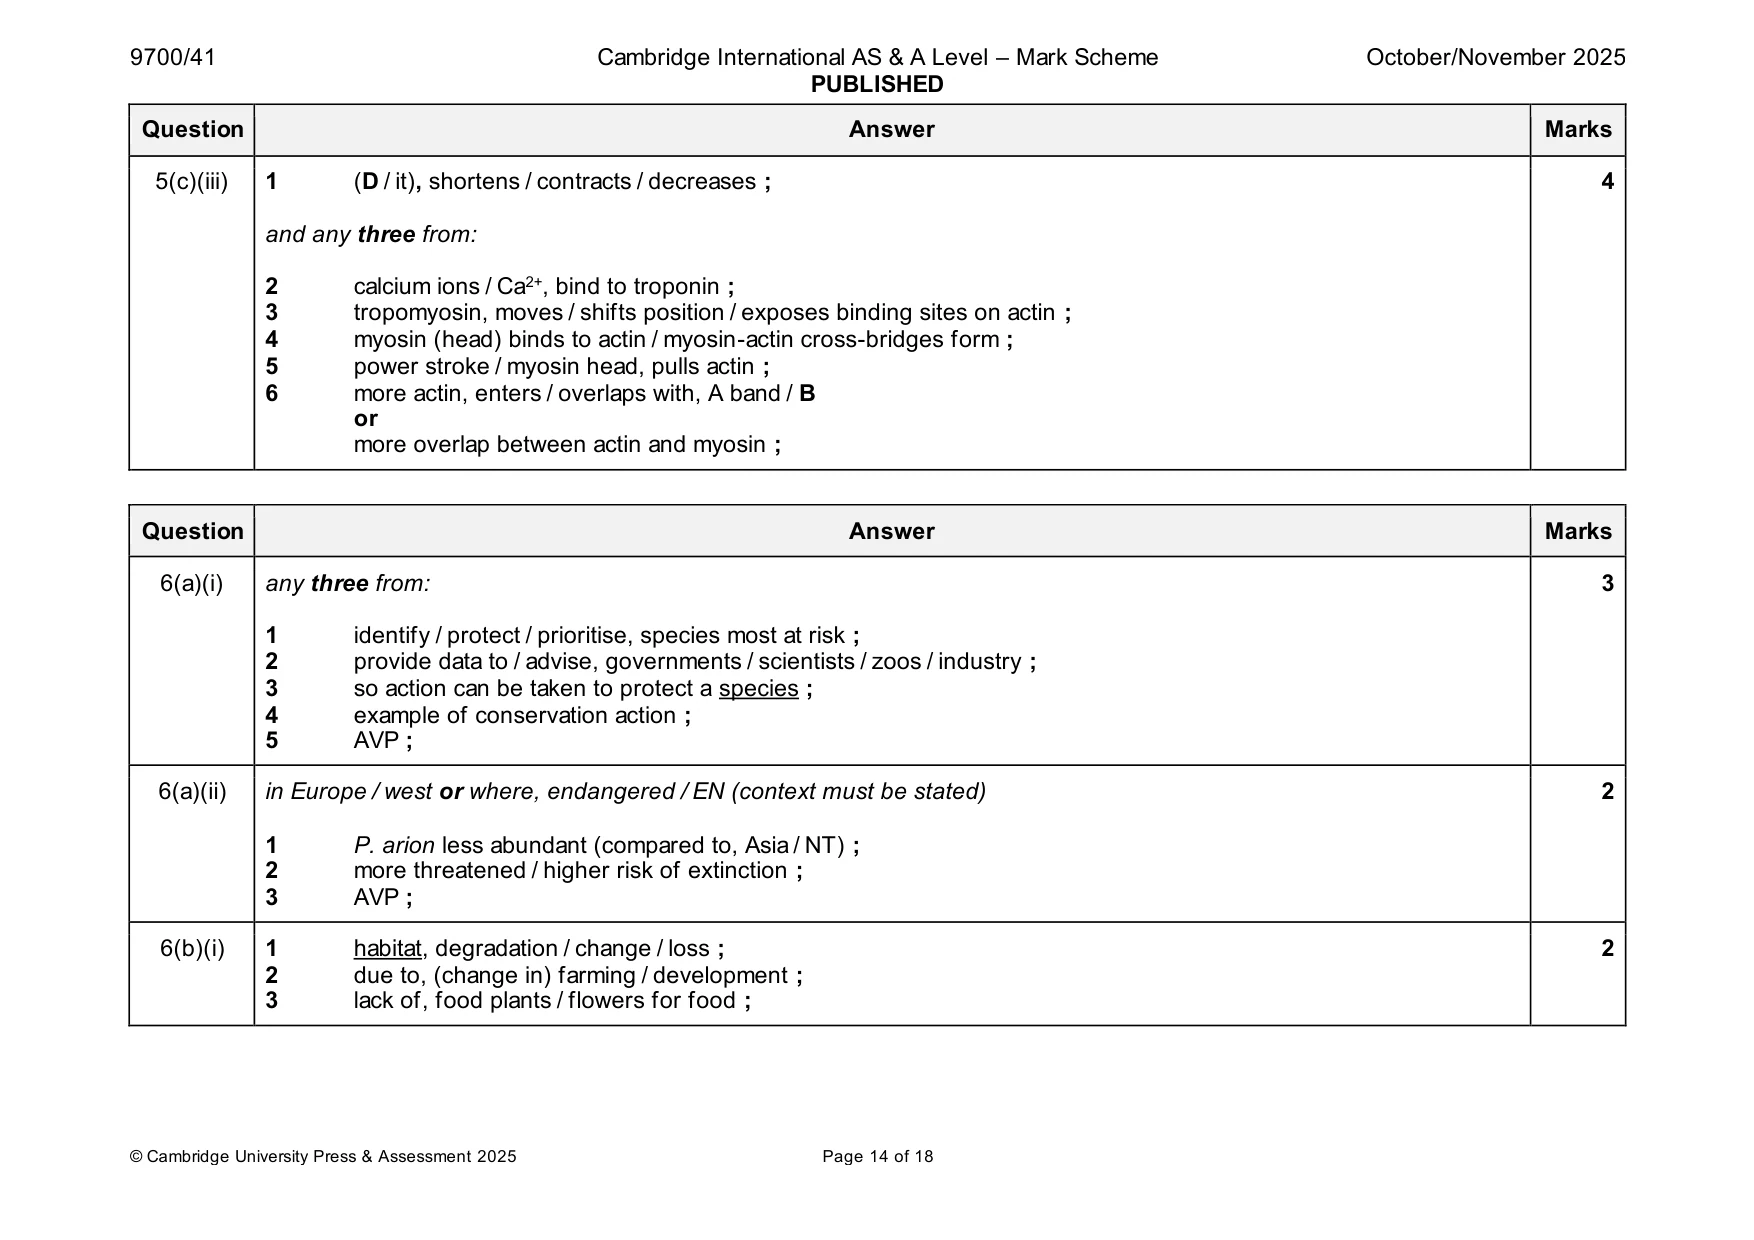
Mark scheme: 5(a) 3 feature ADH glucagon insulin binds to receptors on cell surface ✓ ✓ ✓ ; membranes results in molecules moving from ✓ ✓ ; cells into the blood is secreted as a result of detection by ✓ ; osmoreceptors 5(b) any four from: 4 1 impulses / action potentials / neurotransmitters, in nervous system and hormones in endocrine system ; 2 electrical in nervous system and chemical in endocrine system ; 3 neurones / nerve cells, in nervous system and blood in endocrine system ; 4 effects are / target is, specific / localised, in nervous system and (can be) widespread in endocrine system ; 5 effect / response, happens quickly in nervous system and slowly in endocrine system ; 6 effect / response, lasts a short time in nervous system and long time in endocrine system ; 7 AVP ; 5(c)(i) C ; 1 5(c)(ii) B ; 1 5(c)(iii) 1 (D / it), shortens / contracts / decreases ; 4 and any three from: 2 calcium ions / Ca2+, bind to troponin ; 3 tropomyosin, moves / shifts position / exposes binding sites on actin ; 4 myosin (head) binds to actin / myosin-actin cross-bridges form ; 5 power stroke / myosin head, pulls actin ; 6 more actin, enters / overlaps with, A band / B or more overlap between actin and myosin ;
Q6 · The distribution of the large blue butterfly, Phengaris arion, extends across Europe and…
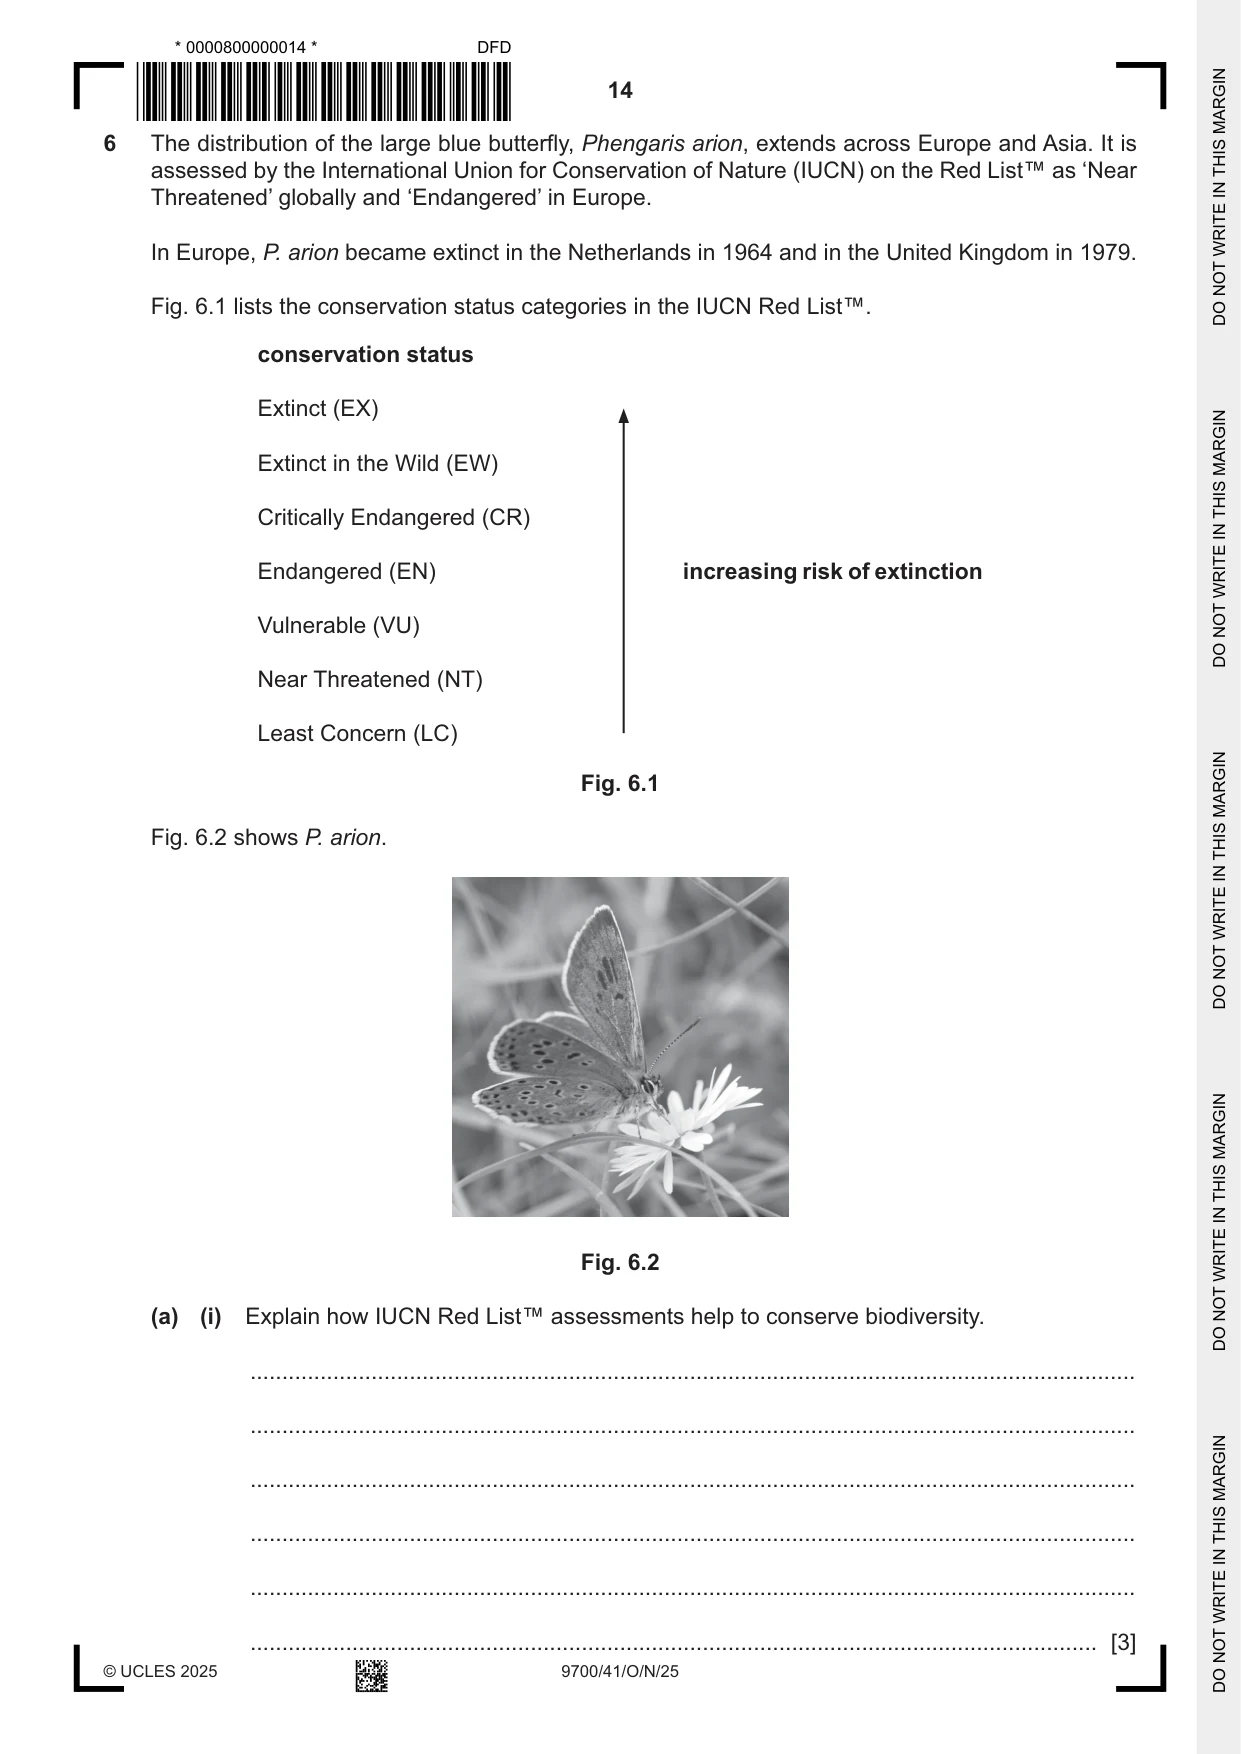
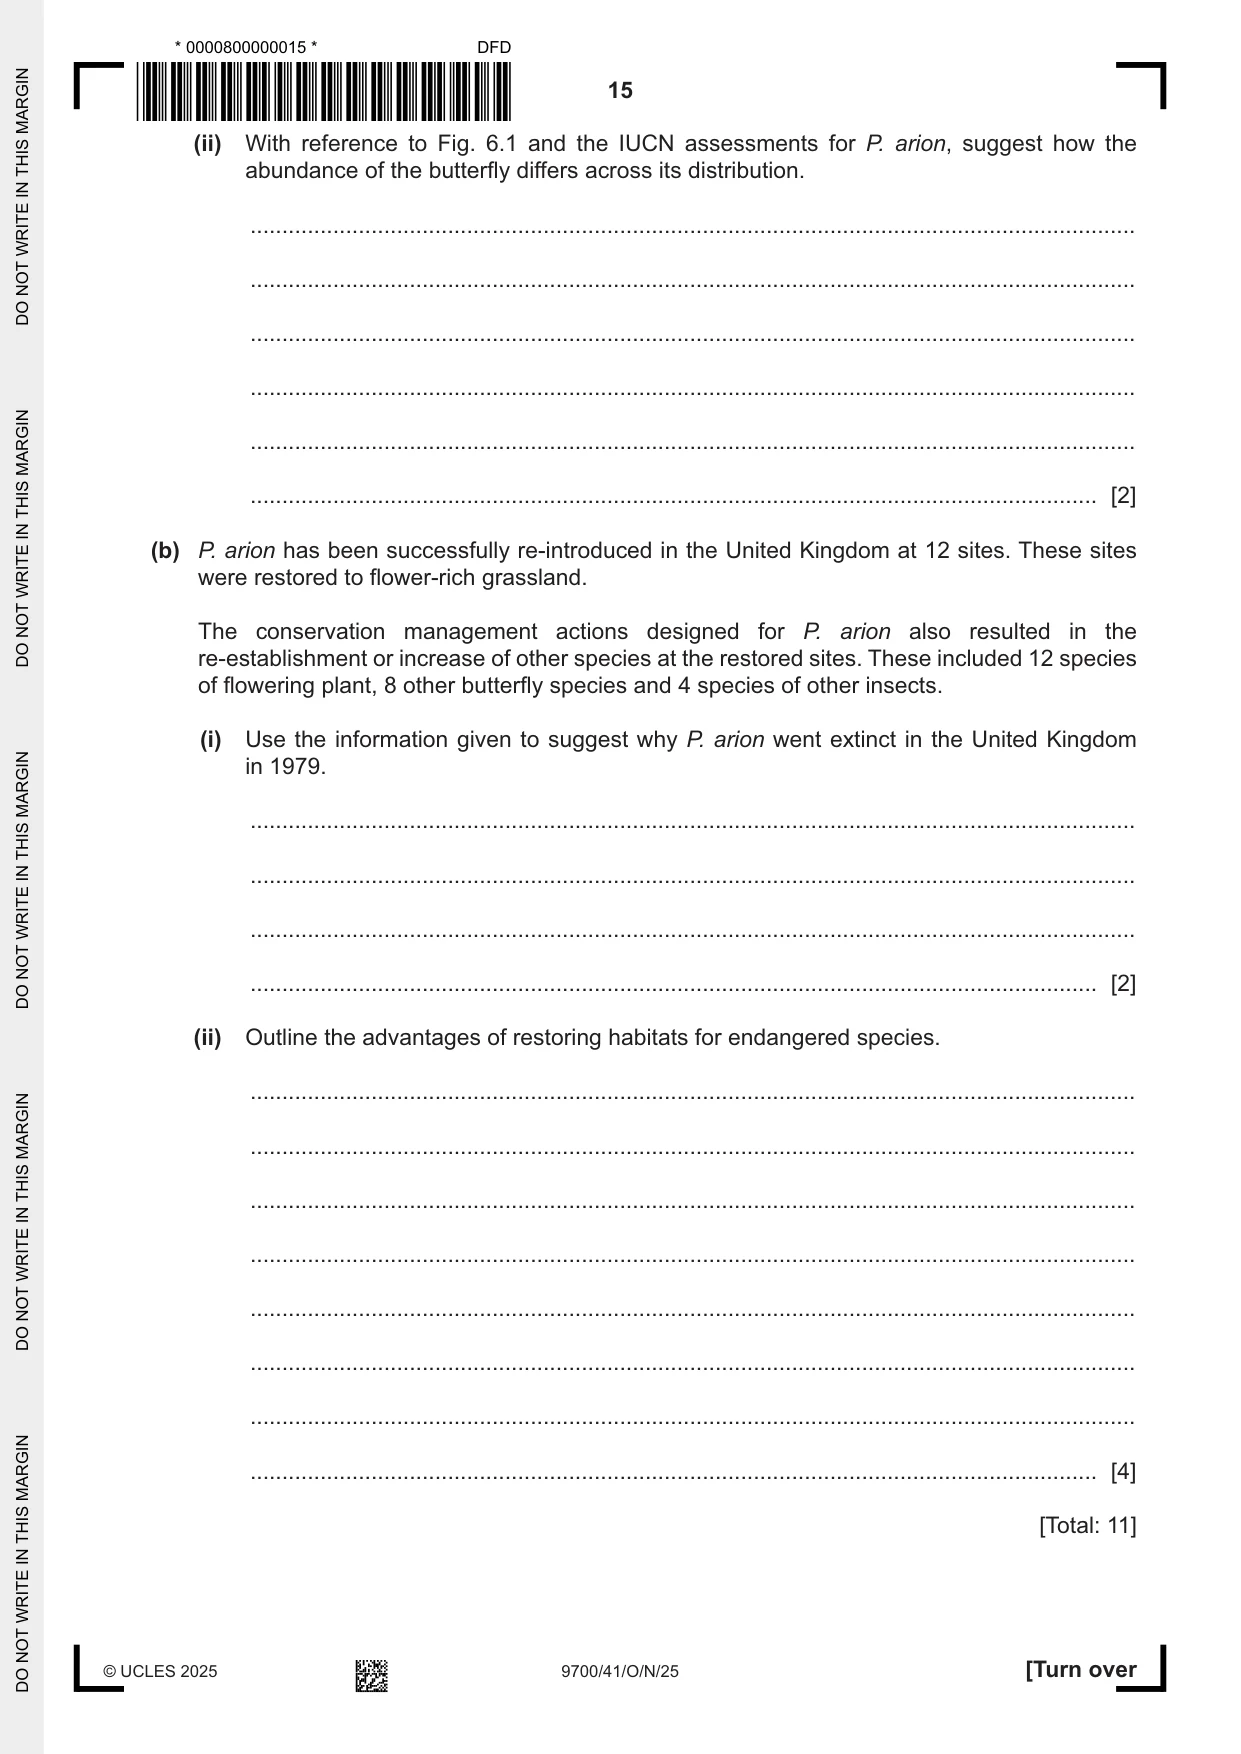
6 The distribution of the large blue butterfly, Phengaris arion, extends across Europe and Asia. It is assessed by the International Union for Conservation of Nature (IUCN) on the Red List™ as ‘Near Threatened’ globally and ‘Endangered’ in Europe. In Europe, P. arion became extinct in the Netherlands in 1964 and in the United Kingdom in 1979. Fig. 6.1 lists the conservation status categories in the IUCN Red List™. conservation status Extinct (EX) Extinct in the Wild (EW) Critically Endangered (CR) Endangered (EN) increasing risk of extinction Vulnerable (VU) Near Threatened (NT) Least Concern (LC) Fig. 6.1 Fig. 6.2 shows P. arion. Fig. 6.2 (a) (i) Explain how IUCN Red List™ assessments help to conserve biodiversity. ........................................................................................................................................... ........................................................................................................................................... ........................................................................................................................................... ........................................................................................................................................... ........................................................................................................................................... ................ ............................................................................................................... [3] (ii) With reference to Fig. 6.1 and the IUCN assessments for P. arion, suggest how the abundance of the butterfly differs across its distribution. ........................................................................................................................................... ........................................................................................................................................... ........................................................................................................................................... ........................................................................................................................................... ........................................................................................................................................... ..................................................................................................................................... [2] (b) P. arion has been successfully re‑introduced in the United Kingdom at 12 sites. These sites were restored to flower‑rich grassland. The conservation management actions designed for P. arion also resulted in the re‑establishment or increase of other species at the restored sites. These included 12 species of flowering plant, 8 other butterfly species and 4 species of other insects. (i) Use the information given to suggest why P. arion went extinct in the United Kingdom in 1979. ........................................................................................................................................... ........................................................................................................................................... ........................................................................................................................................... ..................................................................................................................................... [2] (ii) Outline the advantages of restoring habitats for endangered species. ........................................................................................................................................... ........................................................................................................................................... ........................................................................................................................................... ........................................................................................................................................... ........................................................................................................................................... ........................................................................................................................................... ........................................................................................................................................... ..................................................................................................................................... [4] [Total: 11]
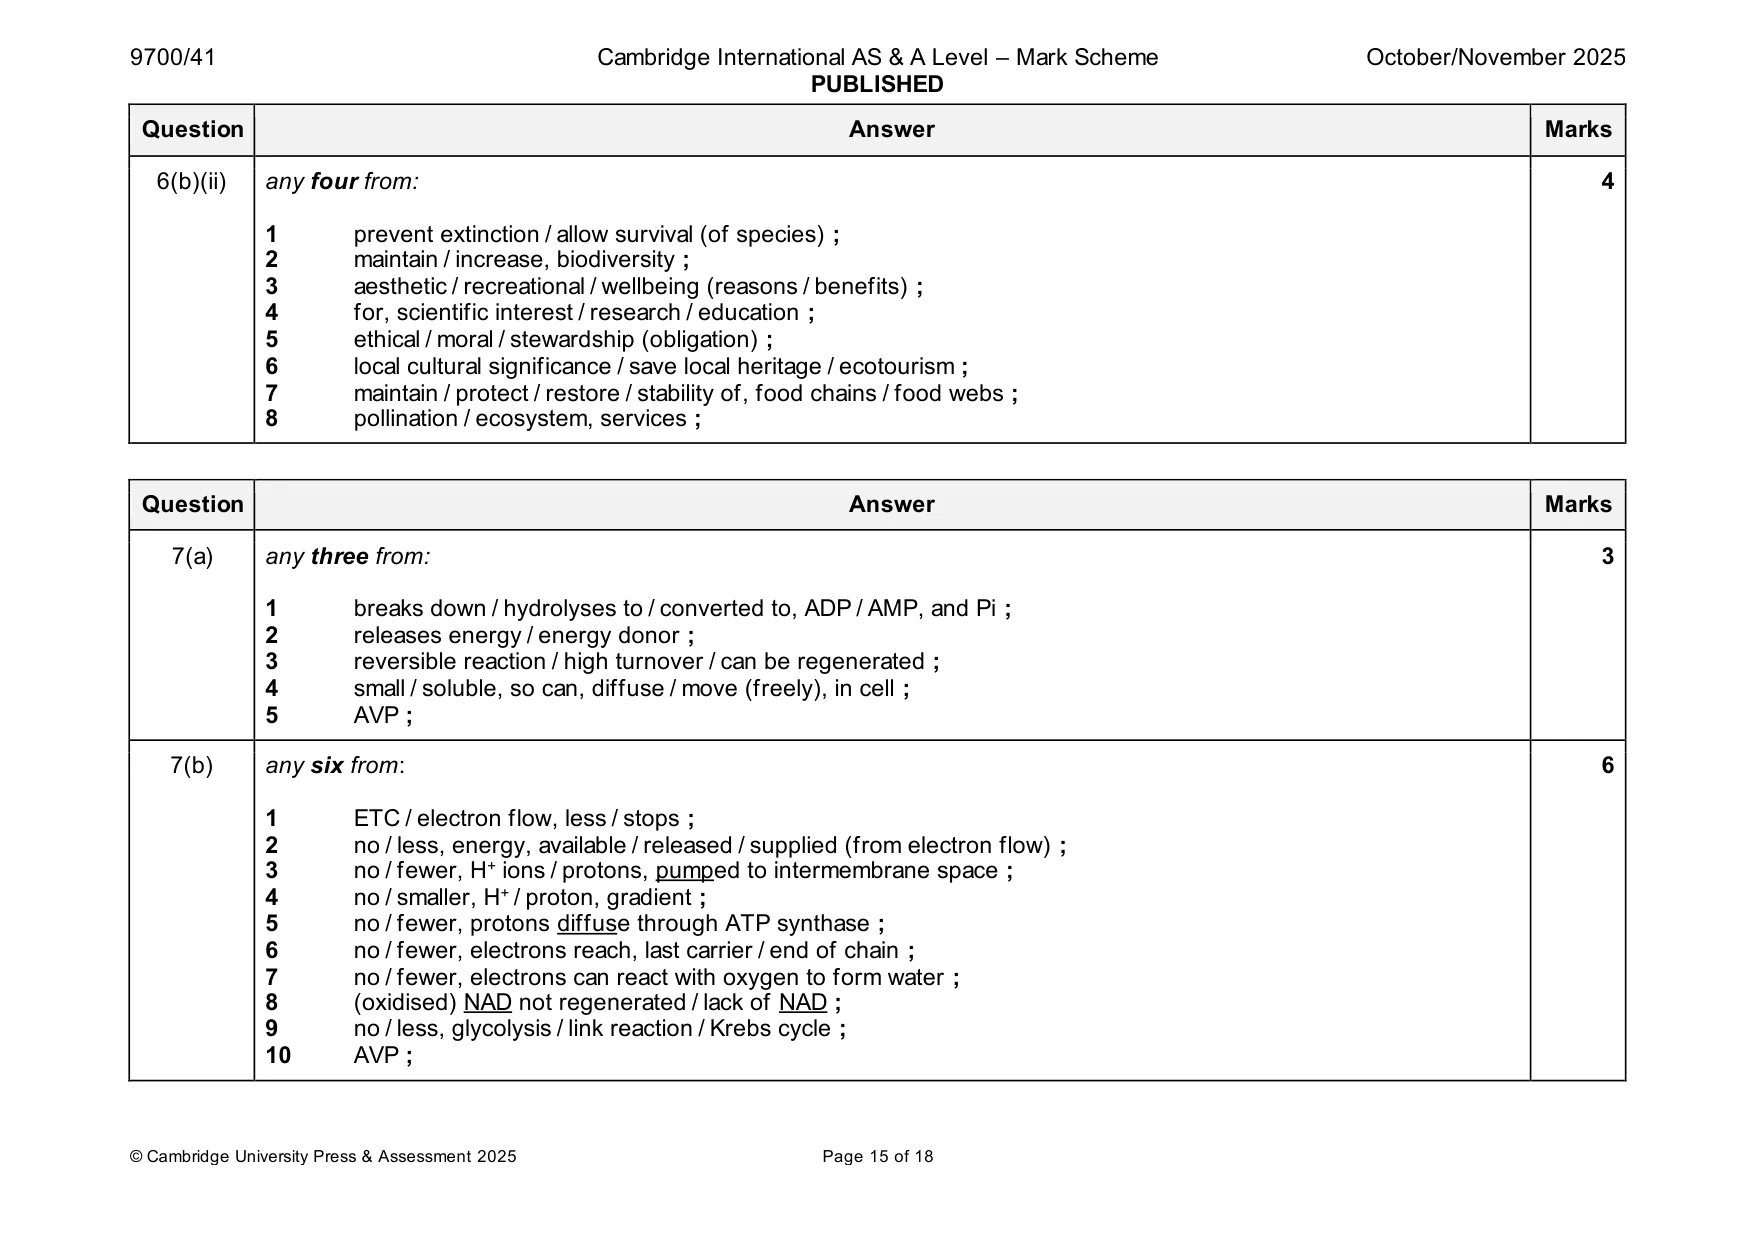
Mark scheme: 6(a)(i) any three from: 3 1 identify / protect / prioritise, species most at risk ; 2 provide data to / advise, governments / scientists / zoos / industry ; 3 so action can be taken to protect a species ; 4 example of conservation action ; 5 AVP ; 6(a)(ii) in Europe / west or where, endangered / EN (context must be stated) 2 1 P. arion less abundant (compared to, Asia / NT) ; 2 more threatened / higher risk of extinction ; 3 AVP ; 6(b)(i) 1 habitat, degradation / change / loss ; 2 2 due to, (change in) farming / development ; 3 lack of, food plants / flowers for food ; 6(b)(ii) any four from: 4 1 prevent extinction / allow survival (of species) ; 2 maintain / increase, biodiversity ; 3 aesthetic / recreational / wellbeing (reasons / benefits) ; 4 for, scientific interest / research / education ; 5 ethical / moral / stewardship (obligation) ; 6 local cultural significance / save local heritage / ecotourism ; 7 maintain / protect / restore / stability of, food chains / food webs ; 8 pollination / ecosystem, services ;
Q7 · In aerobic respiration, most ATP is produced by oxidative phosphorylation
7 In aerobic respiration, most ATP is produced by oxidative phosphorylation. (a) Outline the features of ATP that make it suitable as the universal energy currency. ................................................................................................................................................... ................................................................................................................................................... ................................................................................................................................................... ................................................................................................................................................... ................................................................................................................................................... ................................................................................................................................................... ............................................................................................................................................. [3] (b) Rotenone is a compound that affects oxidative phosphorylation. Rotenone disrupts the first carrier in the electron transport chain by stopping the transfer of electrons from this carrier. Suggest and explain how rotenone reduces the production of ATP and water in aerobic respiration. ................................................................................................................................................... ................................................................................................................................................... ................................................................................................................................................... ................................................................................................................................................... ................................................................................................................................................... ................................................................................................................................................... ................................................................................................................................................... ................................................................................................................................................... ................................................................................................................................................... ................................................................................................................................................... ................................................................................................................................................... ............................................................................................................................................. [6] [Total: 9]
Mark scheme: 7(a) any three from: 3 1 breaks down / hydrolyses to / converted to, ADP / AMP, and Pi ; 2 releases energy / energy donor ; 3 reversible reaction / high turnover / can be regenerated ; 4 small / soluble, so can, diffuse / move (freely), in cell ; 5 AVP ; 7(b) any six from: 6 1 ETC / electron flow, less / stops ; 2 no / less, energy, available / released / supplied (from electron flow) ; 3 no / fewer, H+ ions / protons, pumped to intermembrane space ; 4 no / smaller, H+ / proton, gradient ; 5 no / fewer, protons diffuse through ATP synthase ; 6 no / fewer, electrons reach, last carrier / end of chain ; 7 no / fewer, electrons can react with oxygen to form water ; 8 (oxidised) NAD not regenerated / lack of NAD ; 9 no / less, glycolysis / link reaction / Krebs cycle ; 10 AVP ;
Q8 · LibertyLink® soybean is a genetically modified crop
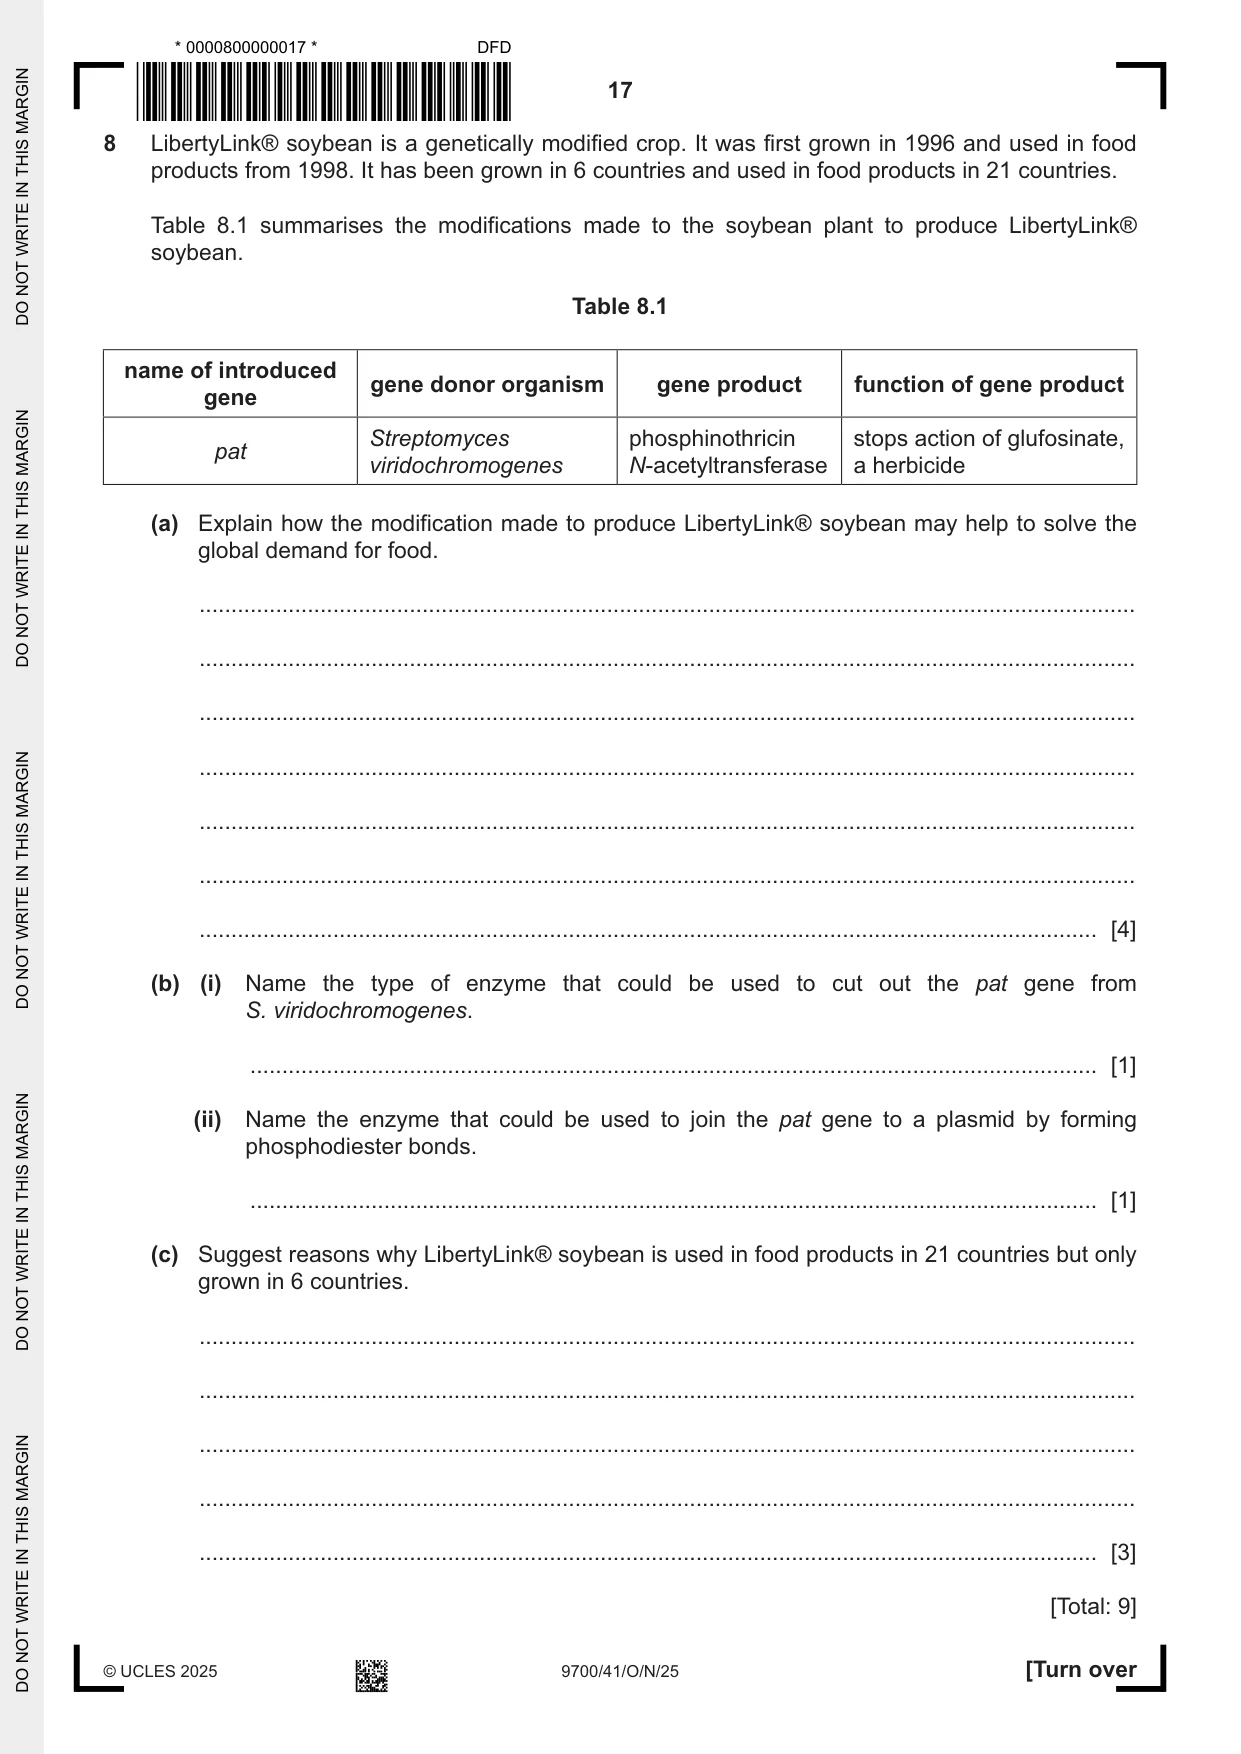
8 LibertyLink® soybean is a genetically modified crop. It was first grown in 1996 and used in food products from 1998. It has been grown in 6 countries and used in food products in 21 countries. Table 8.1 summarises the modifications made to the soybean plant to produce LibertyLink® soybean. Table 8.1 name of introduced gene donor organism gene product function of gene product gene Streptomyces phosphinothricin stops action of glufosinate, pat viridochromogenes N‑acetyltransferase a herbicide (a) Explain how the modification made to produce LibertyLink® soybean may help to solve the global demand for food. ................................................................................................................................................... ................................................................................................................................................... ................................................................................................................................................... ................................................................................................................................................... ................................................................................................................................................... ................................................................................................................................................... ............................................................................................................................................. [4] (b) (i) Name the type of enzyme that could be used to cut out the pat gene from S. viridochromogenes. ..................................................................................................................................... [1] (ii) Name the enzyme that could be used to join the pat gene to a plasmid by forming phosphodiester bonds. ..................................................................................................................................... [1] (c) Suggest reasons why LibertyLink® soybean is used in food products in 21 countries but only grown in 6 countries. ................................................................................................................................................... ................................................................................................................................................... ................................................................................................................................................... ................................................................................................................................................... ............................................................................................................................................. [3] [Total: 9]
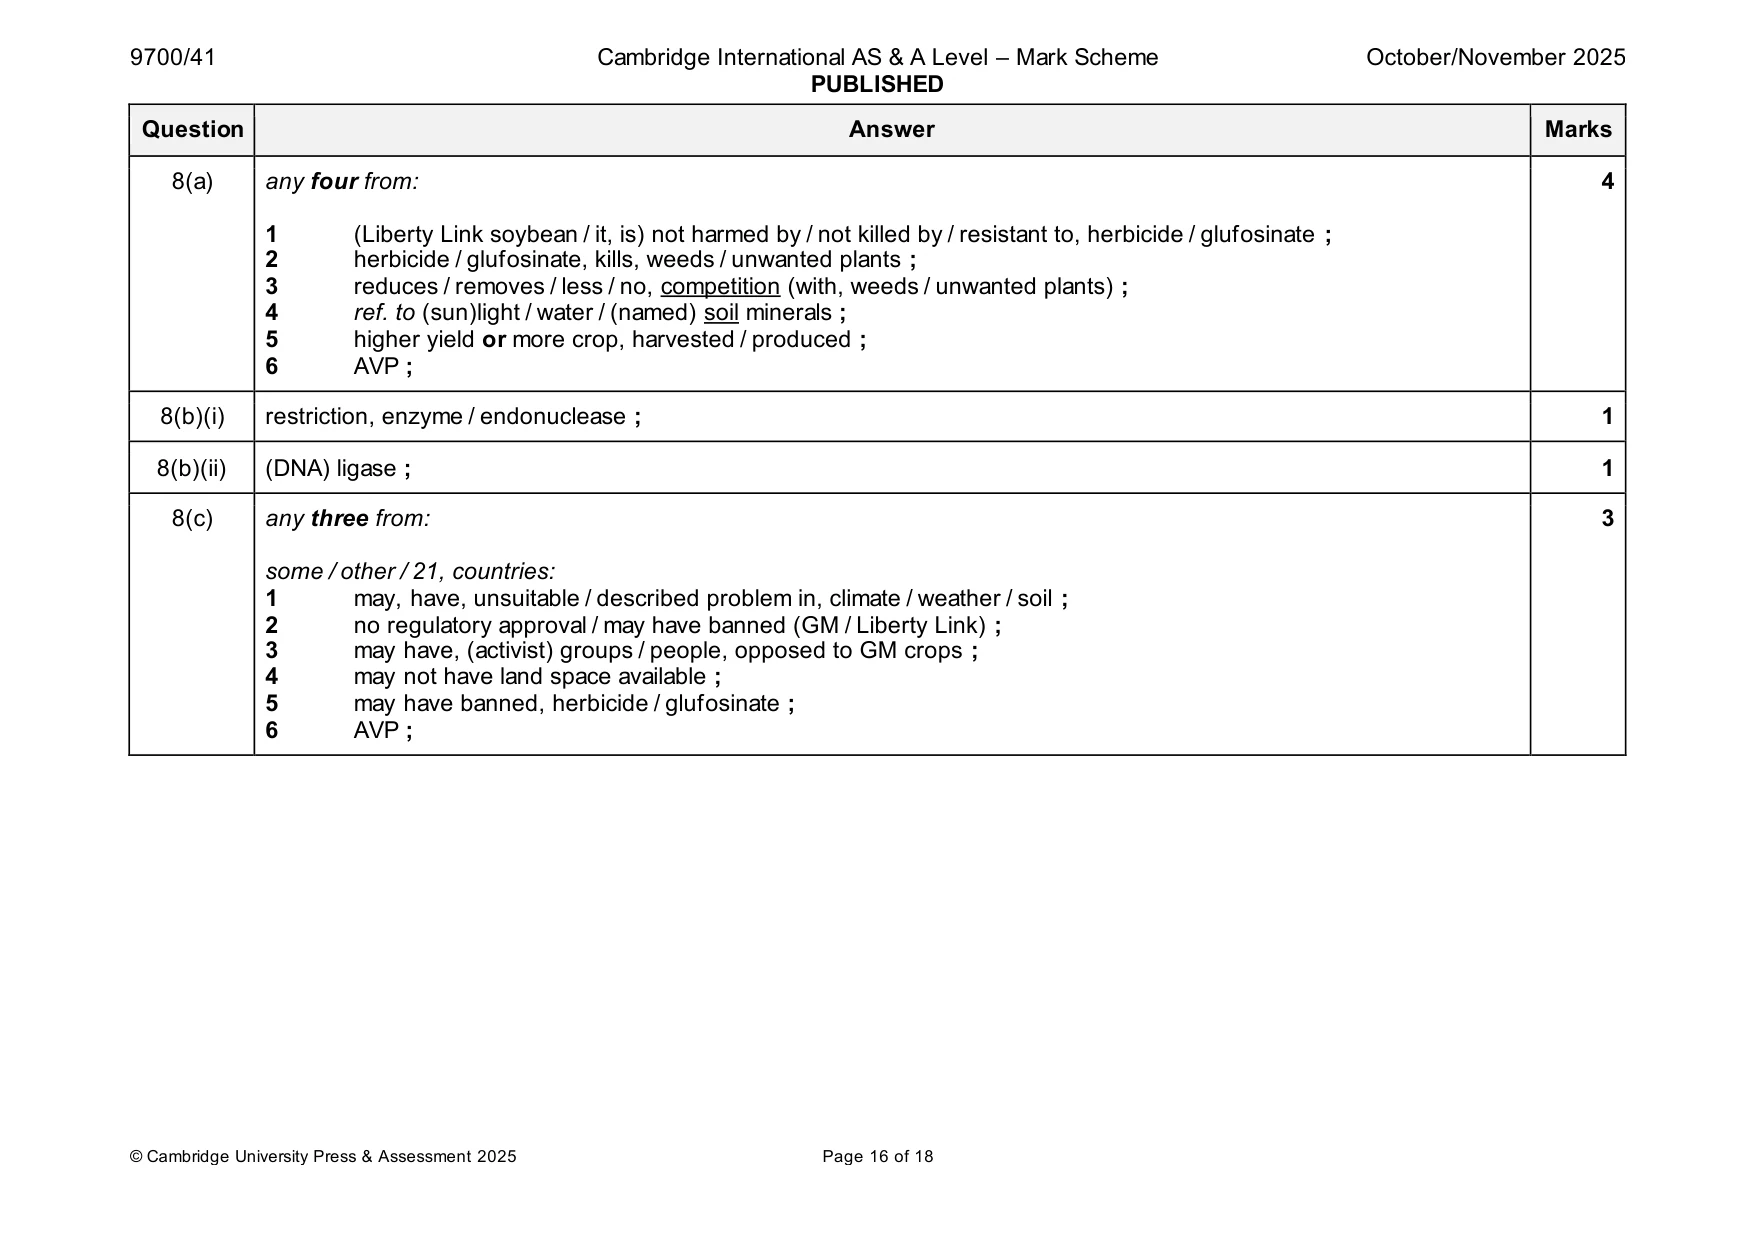
Mark scheme: 8(a) any four from: 4 1 (Liberty Link soybean / it, is) not harmed by / not killed by / resistant to, herbicide / glufosinate ; 2 herbicide / glufosinate, kills, weeds / unwanted plants ; 3 reduces / removes / less / no, competition (with, weeds / unwanted plants) ; 4 ref. to (sun)light / water / (named) soil minerals ; 5 higher yield or more crop, harvested / produced ; 6 AVP ; 8(b)(i) restriction, enzyme / endonuclease ; 1 8(b)(ii) (DNA) ligase ; 1 8(c) any three from: 3 some / other / 21, countries: 1 may, have, unsuitable / described problem in, climate / weather / soil ; 2 no regulatory approval / may have banned (GM / Liberty Link) ; 3 may have, (activist) groups / people, opposed to GM crops ; 4 may not have land space available ; 5 may have banned, herbicide / glufosinate ; 6 AVP ;
More questions on Genetically modified organisms in agriculture
Q9 · A longitudinal section of a human kidney
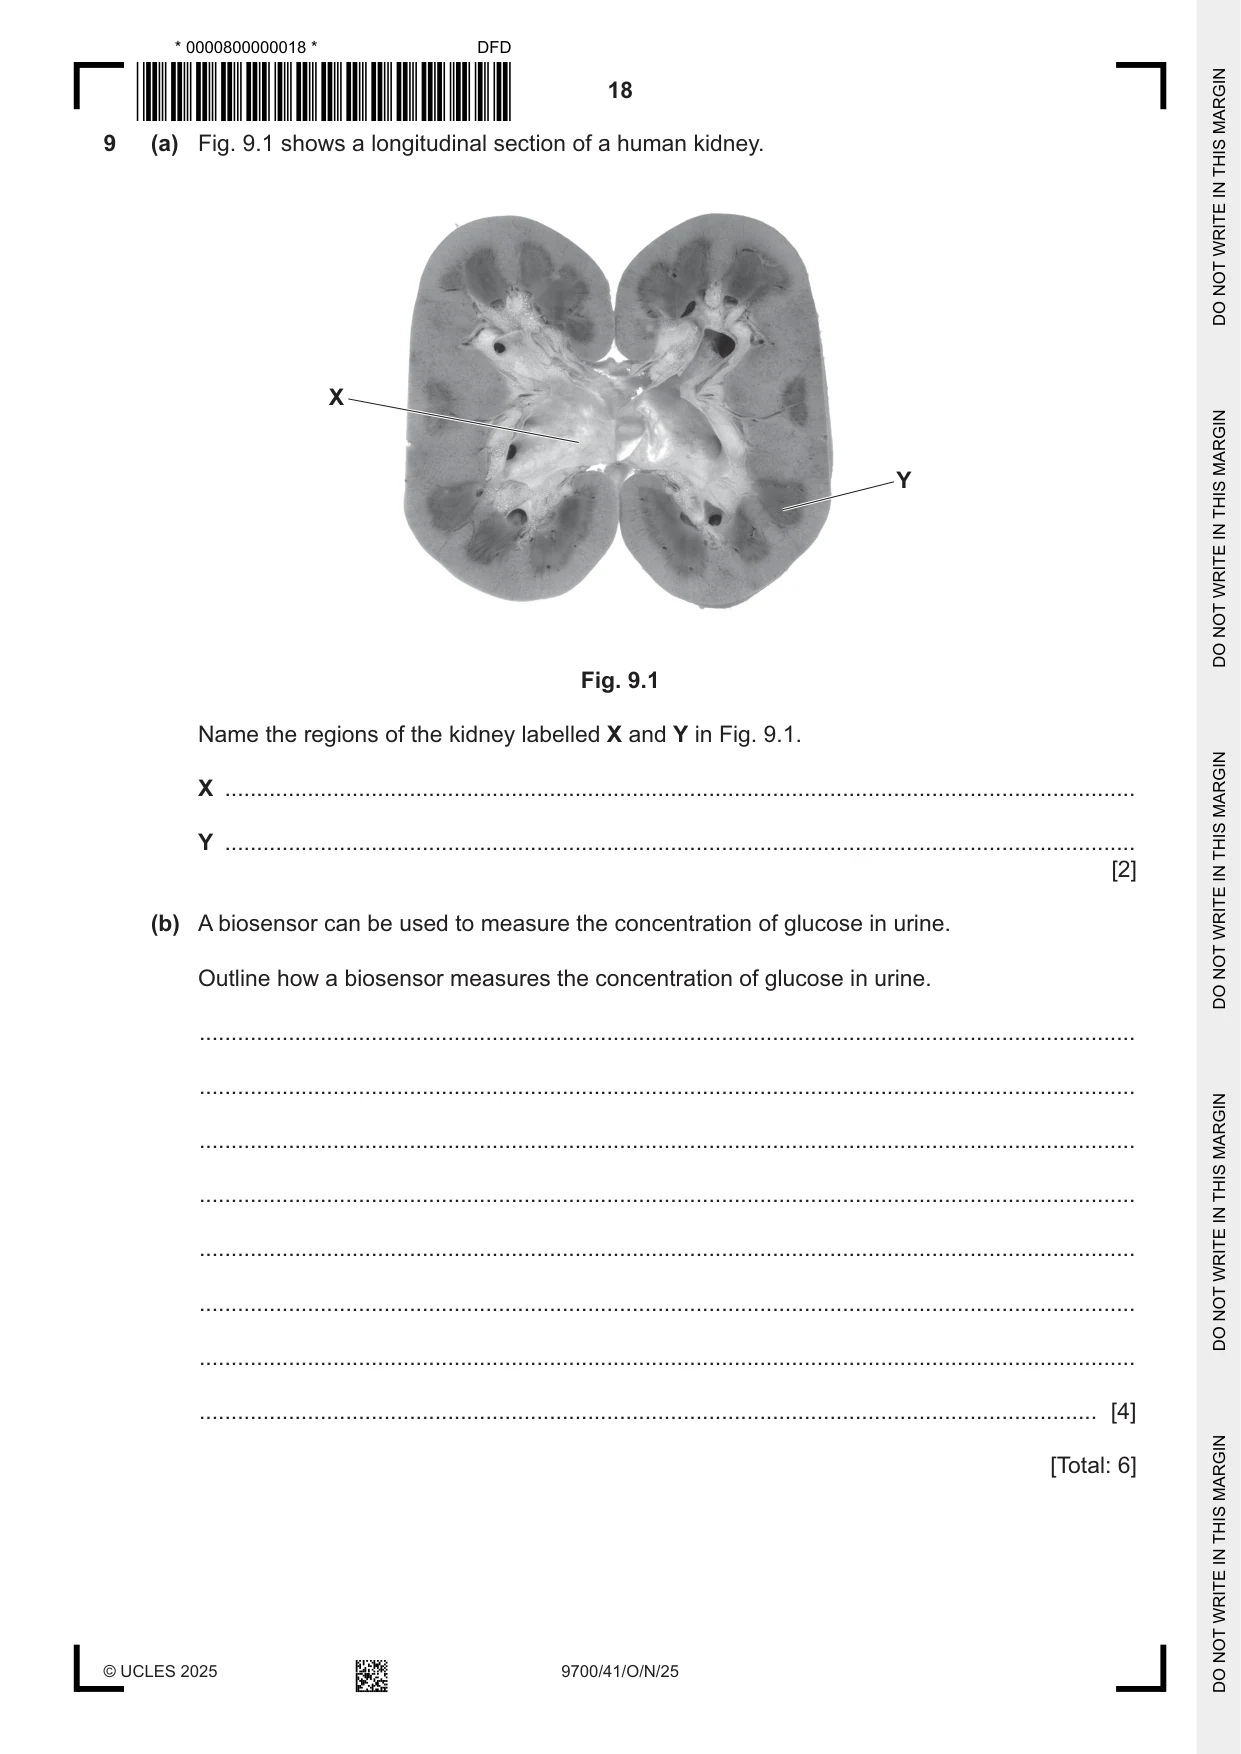
9 (a) Fig. 9.1 shows a longitudinal section of a human kidney. X Y Fig. 9.1 Name the regions of the kidney labelled X and Y in Fig. 9.1. X ............................................................................................................................................... Y ............................................................................................................................................... [2] (b) A biosensor can be used to measure the concentration of glucose in urine. Outline how a biosensor measures the concentration of glucose in urine. ................................................................................................................................................... ................................................................................................................................................... ................................................................................................................................................... ................................................................................................................................................... ................................................................................................................................................... ................................................................................................................................................... ................................................................................................................................................... ............................................................................................................................................. [4] [Total: 6]
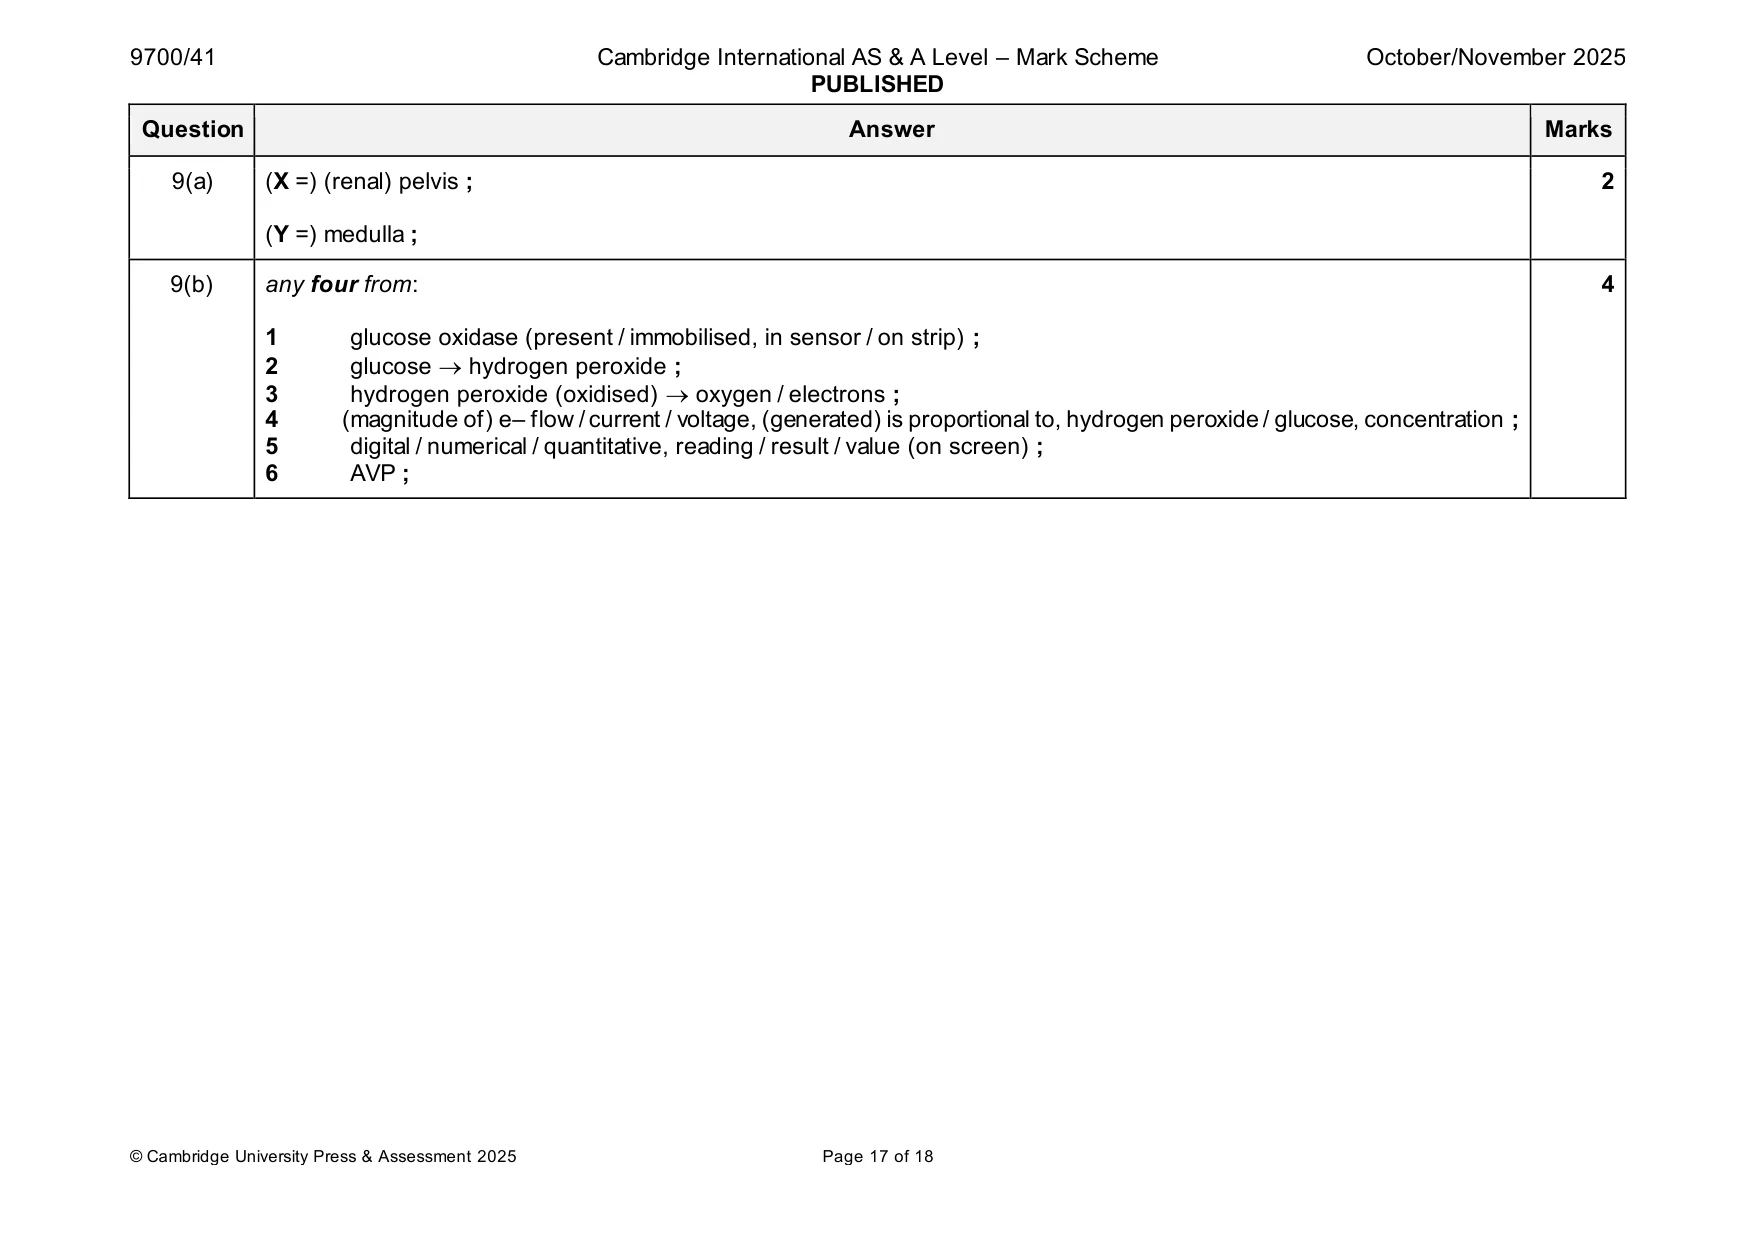
Mark scheme: 9(a) (X =) (renal) pelvis ; 2 (Y =) medulla ; 9(b) any four from: 4 1 glucose oxidase (present / immobilised, in sensor / on strip) ; 2 glucose → hydrogen peroxide ; 3 hydrogen peroxide (oxidised) → oxygen / electrons ; 4 (magnitude of) e– flow / current / voltage, (generated) is proportional to, hydrogen peroxide / glucose, concentration ; 5 digital / numerical / quantitative, reading / result / value (on screen) ; 6 AVP ;
Q10 · Explain the relationship between genes, proteins and phenotype, with reference to two…
10 Explain the relationship between genes, proteins and phenotype, with reference to two examples of genetic diseases in humans. .......................................................................................................................................................... .......................................................................................................................................................... .......................................................................................................................................................... .......................................................................................................................................................... .......................................................................................................................................................... .......................................................................................................................................................... .......................................................................................................................................................... .......................................................................................................................................................... .......................................................................................................................................................... .......................................................................................................................................................... .......................................................................................................................................................... .......................................................................................................................................................... .......................................................................................................................................................... .......................................................................................................................................................... .......................................................................................................................................................... .................................................................................................................................................... [6]
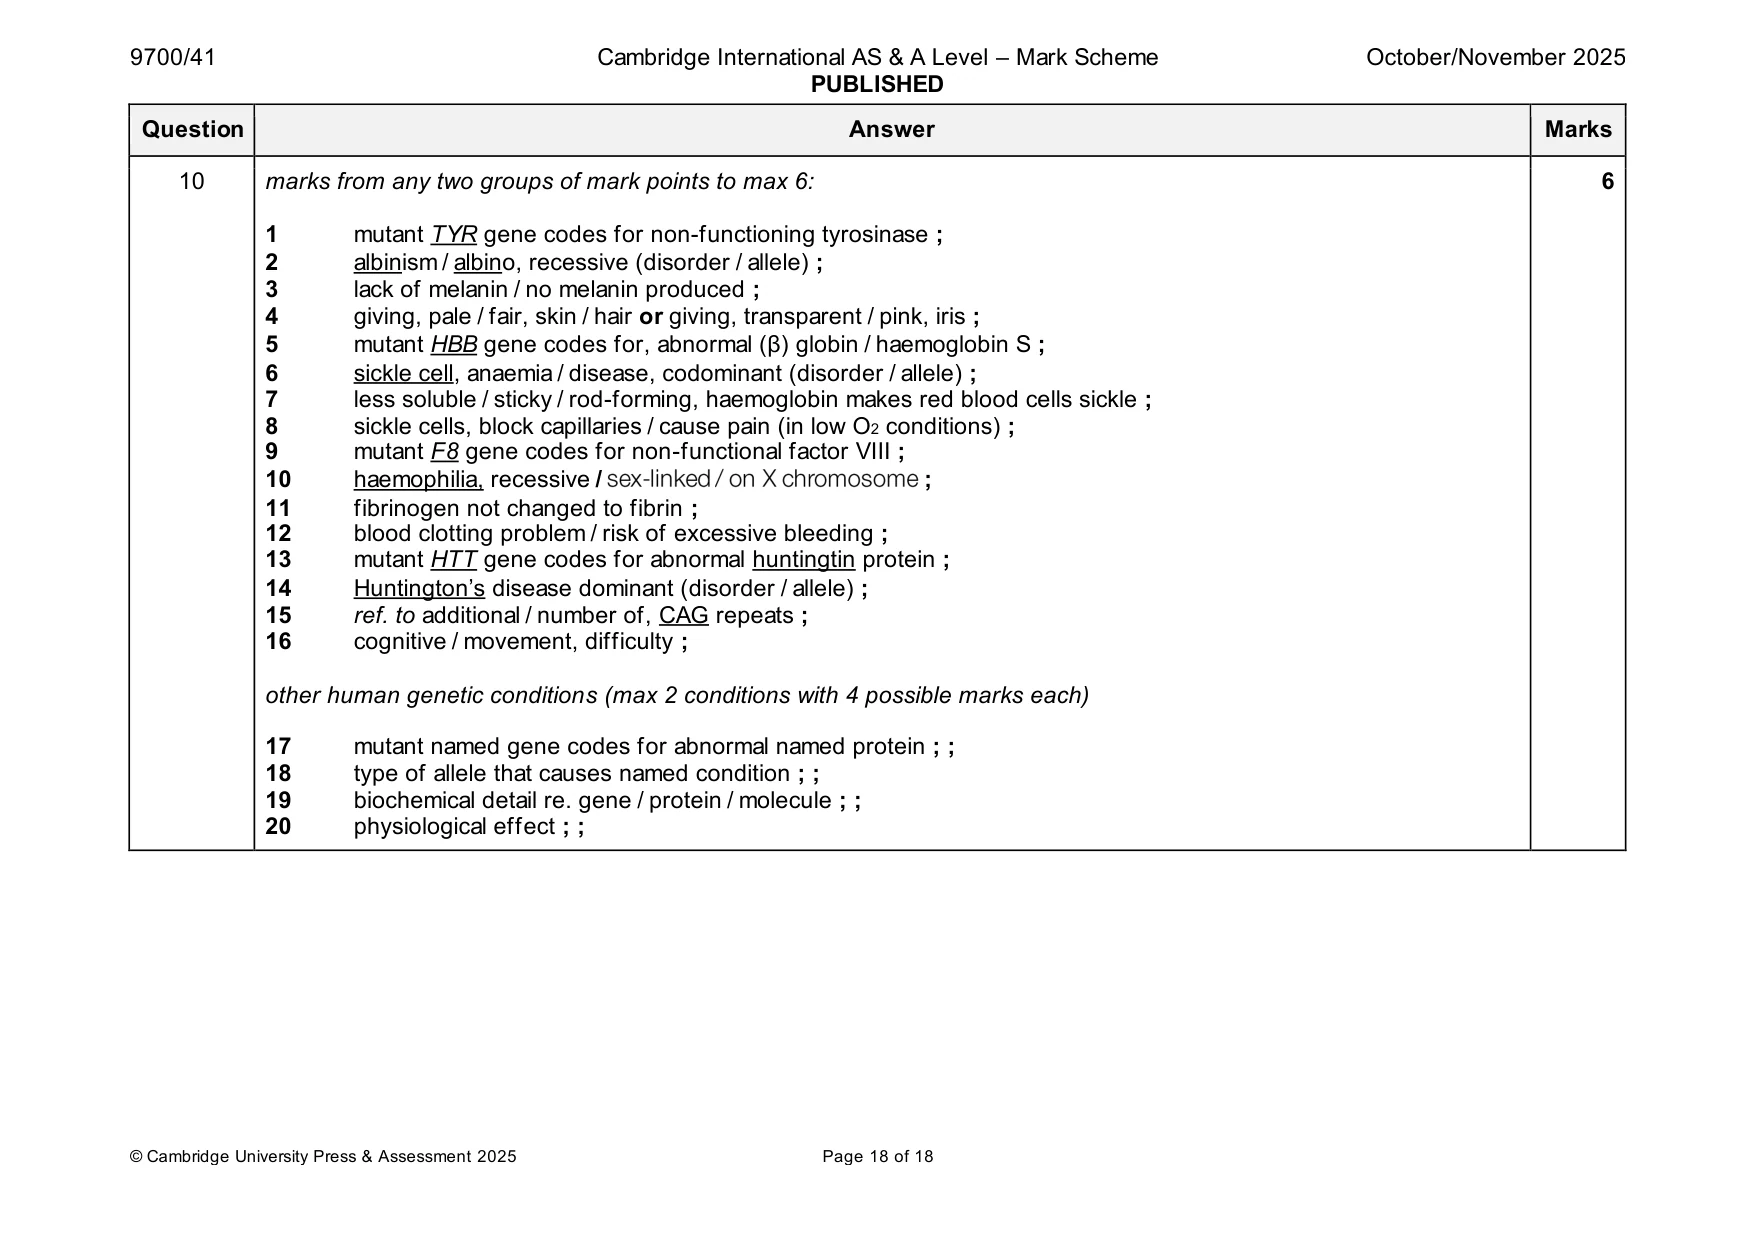
Mark scheme: 10 marks from any two groups of mark points to max 6: 6 1 mutant TYR gene codes for non-functioning tyrosinase ; 2 albinism / albino, recessive (disorder / allele) ; 3 lack of melanin / no melanin produced ; 4 giving, pale / fair, skin / hair or giving, transparent / pink, iris ; 5 mutant HBB gene codes for, abnormal (β) globin / haemoglobin S ; 6 sickle cell, anaemia / disease, codominant (disorder / allele) ; 7 less soluble / sticky / rod-forming, haemoglobin makes red blood cells sickle ; 8 sickle cells, block capillaries / cause pain (in low O2 conditions) ; 9 mutant F8 gene codes for non-functional factor VIII ; 10 haemophilia, recessive / sex -linked / on X chromosome ; 11 fibrinogen not changed to fibrin ; 12 blood clotting problem / risk of excessive bleeding ; 13 mutant HTT gene codes for abnormal huntingtin protein ; 14 Huntington’s disease dominant (disorder / allele) ; 15 ref. to additional / number of, CAG repeats ; 16 cognitive / movement, difficulty ; other human genetic conditions (max 2 conditions with 4 possible marks each) 17 mutant named gene codes for abnormal named protein ; ; 18 type of allele that causes named condition ; ; 19 biochemical detail re. gene / protein / molecule ; ; 20 physiological effect ; ;
What was in this paper
The subtopics covered by these 10 questions, and how many questions each got. Open one in a new tab to see every Cambridge question on it.
What you needed in this session
Cambridge’s own grade thresholds for 2025 Oct/Nov, Paper 4 · Variant 1. A higher threshold means an easier paper — the bar moves with how the cohort did.