Cambridge A Level Biology 9700 — 2024 Oct/Nov Paper 4 · Variant 1
9700/41/O/N/24 · 10 questions · 100 marks · ≈113 min
The question paper and its mark scheme, free to read here and free to download. This is Cambridge’s own paper, exactly as it was sat.
Question paper24 pages
Mark scheme15 pages
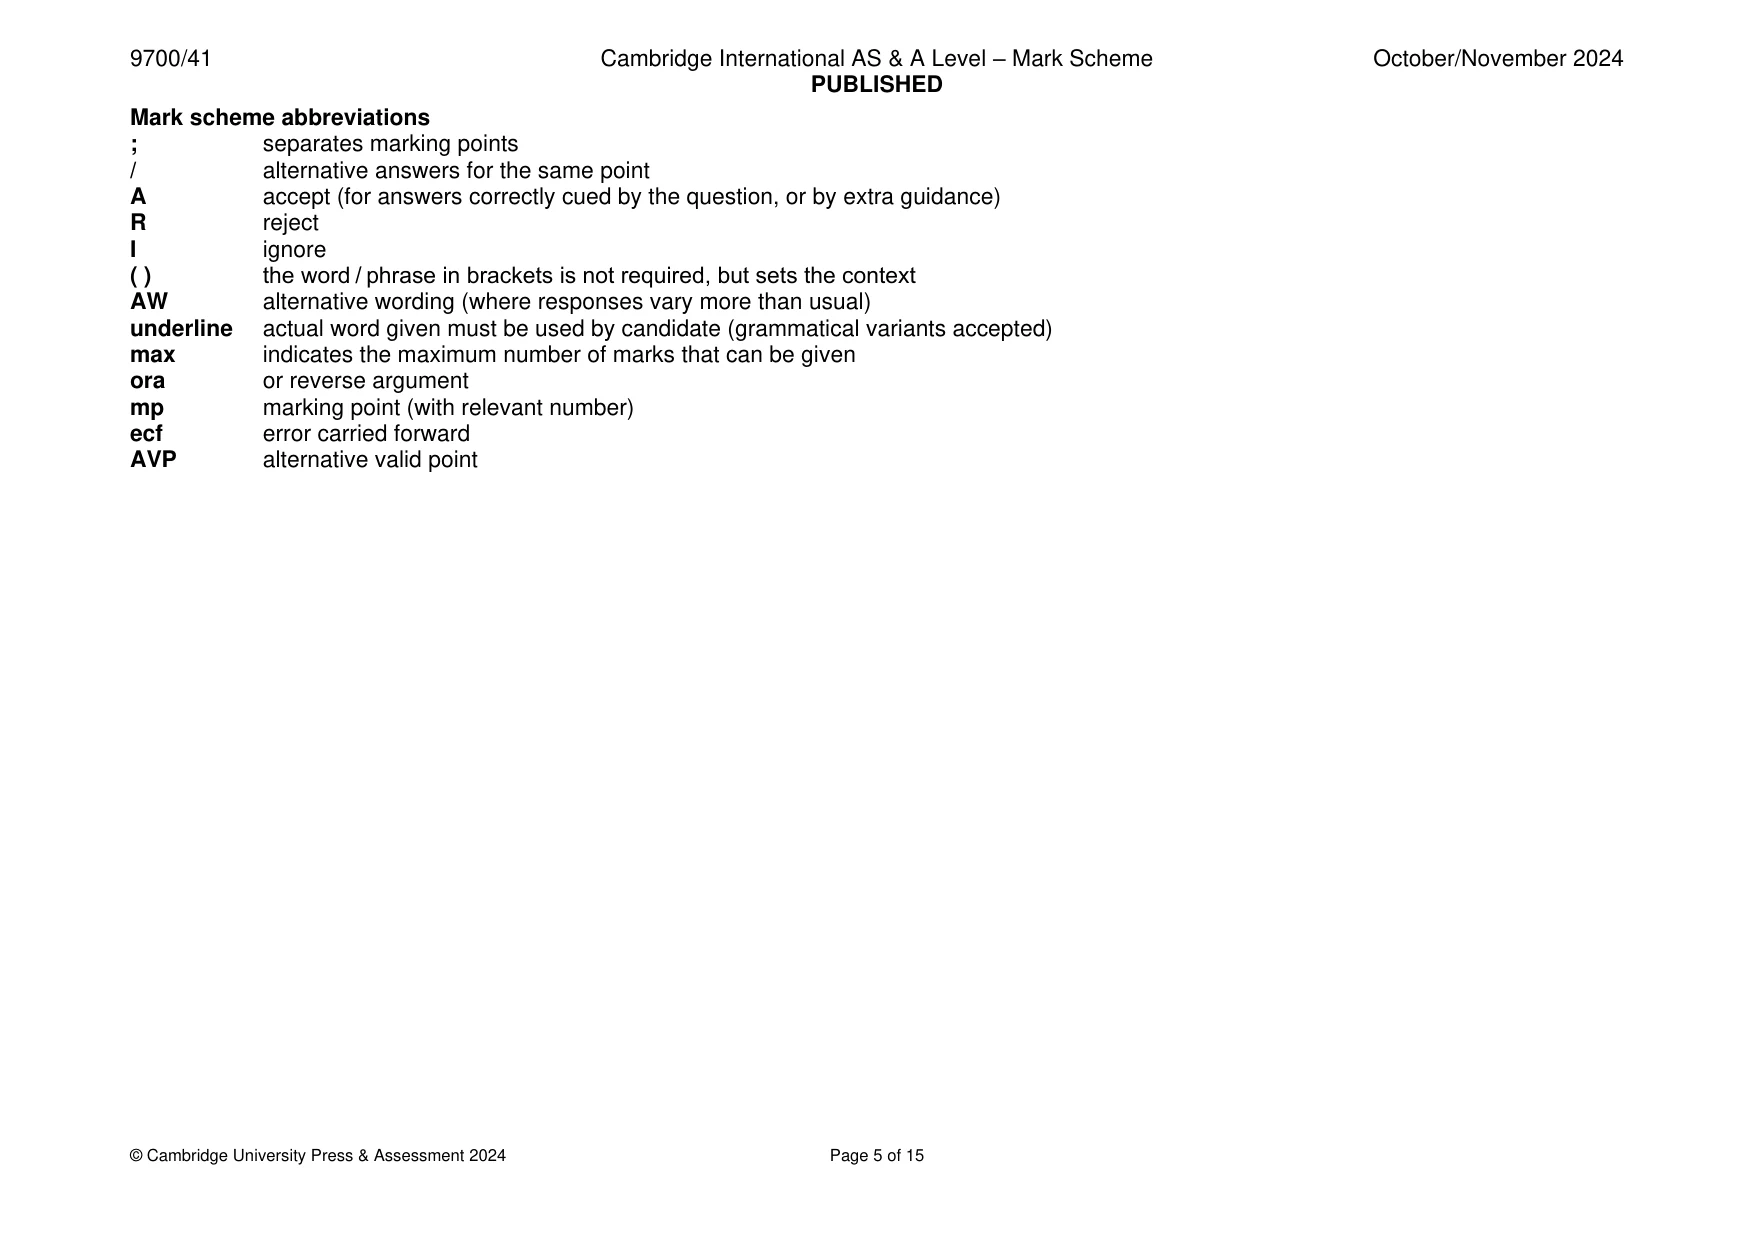
Answers below. Sit the paper first if you are practising.
Questions as text
Q1 · Different species of animal have neurones with different characteristics
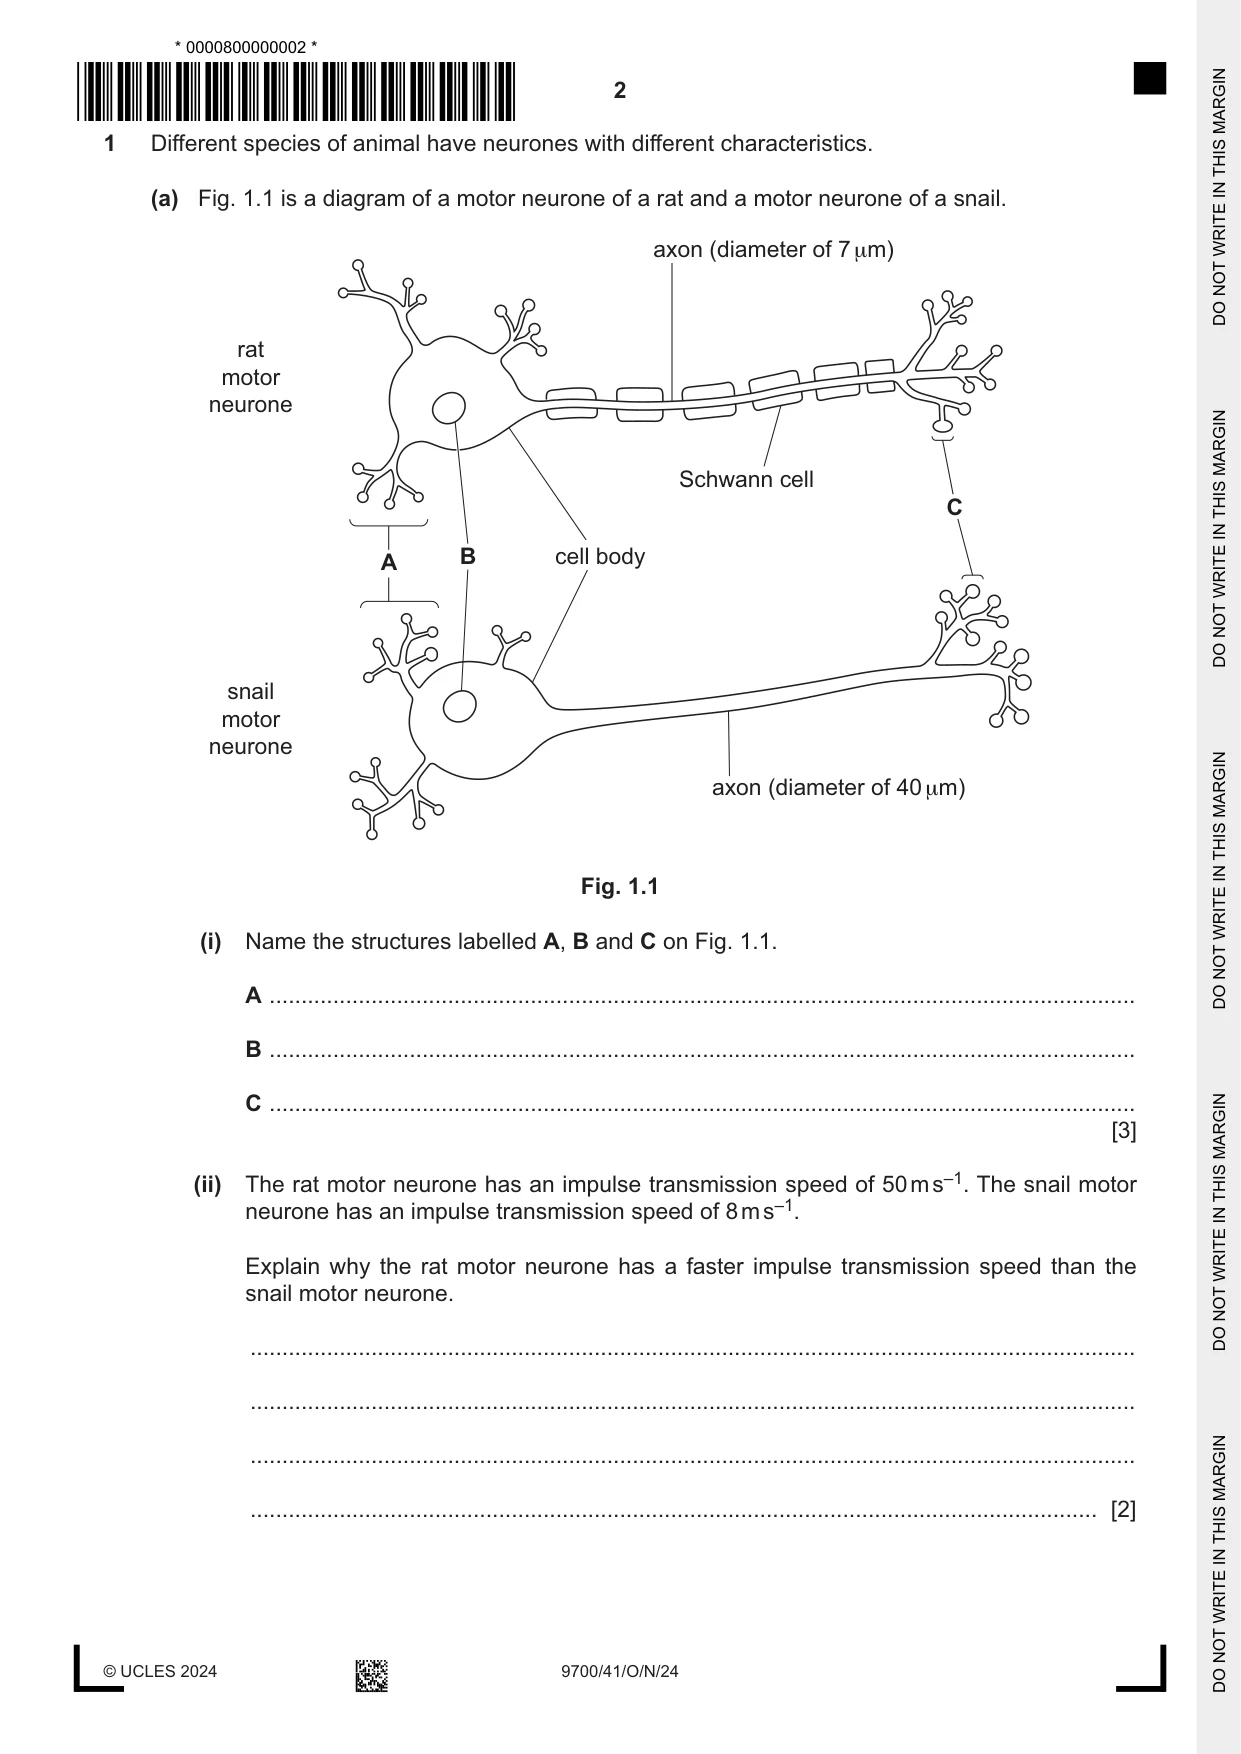
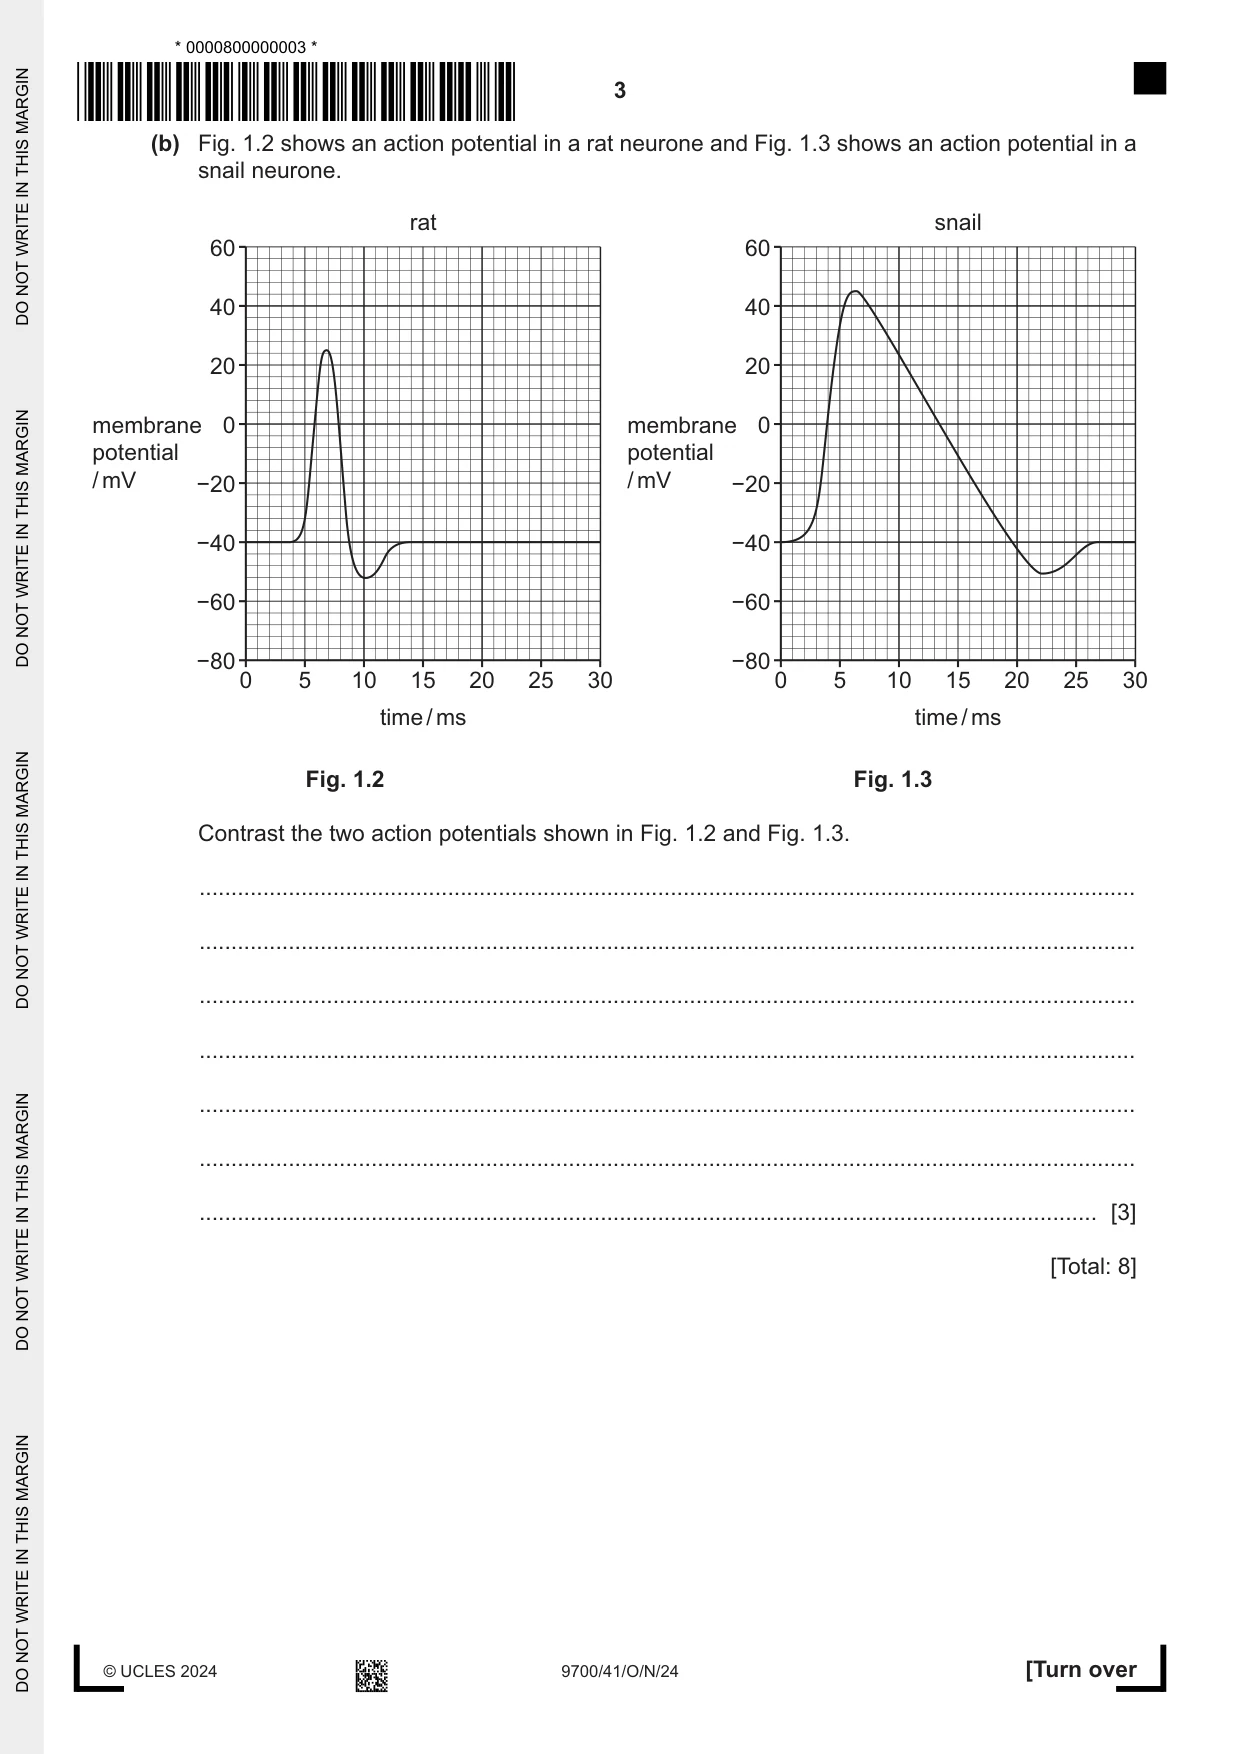
1 Different species of animal have neurones with different characteristics. (a) Fig. 1.1 is a diagram of a motor neurone of a rat and a motor neurone of a snail. axon (diameter of 7 μm) rat motor neurone Schwann cell C B cell body A snail motor neurone axon (diameter of 40 μm) Fig. 1.1 (i) Name the structures labelled A, B and C on Fig. 1.1. A ........................................................................................................................................ B ........................................................................................................................................ C ........................................................................................................................................ [3] (ii) The rat motor neurone has an impulse transmission speed of 50 m s–1. The snail motor neurone has an impulse transmission speed of 8 m s–1. Explain why the rat motor neurone has a faster impulse transmission speed than the snail motor neurone. ........................................................................................................................................... ........................................................................................................................................... ........................................................................................................................................... ..................................................................................................................................... [2] (b) Fig. 1.2 shows an action potential in a rat neurone and Fig. 1.3 shows an action potential in a snail neurone. rat snail 60 60 40 40 20 20 membrane 0 membrane 0 potential potential / mV −20 / mV −20 −40 −40 −60 −60 −80 −80 0 5 10 15 20 25 30 0 5 10 15 20 25 30 time / ms time / ms Fig. 1.2 Fig. 1.3 Contrast the two action potentials shown in Fig. 1.2 and Fig. 1.3. ................................................................................................................................................... ................................................................................................................................................... ................................................................................................................................................... ................................................................................................................................................... ................................................................................................................................................... ................................................................................................................................................... ............................................................................................................................................. [3] [Total: 8]
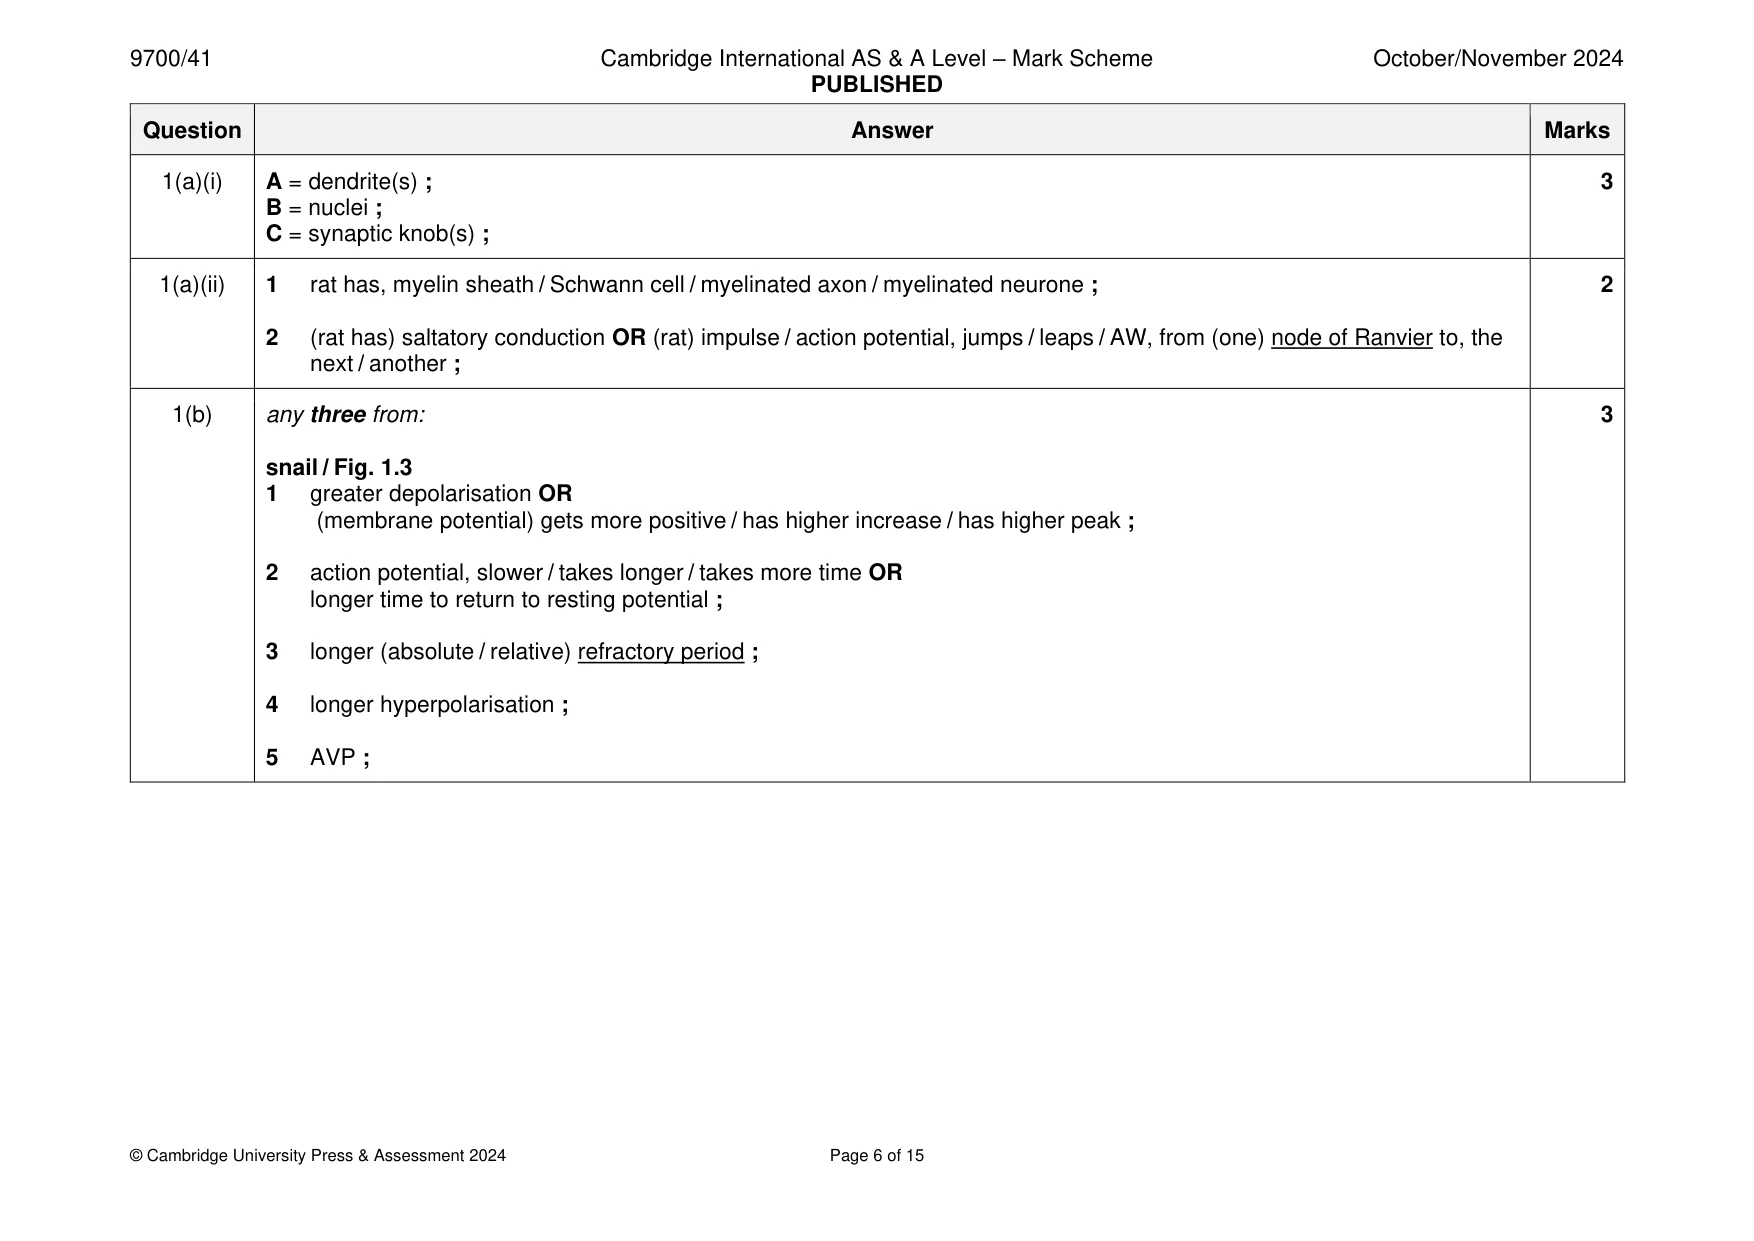
Mark scheme: Question Answer Marks 1(a)(i) A = dendrite(s) ; 3 B = nuclei ; C = synaptic knob(s) ; 1(a)(ii) 1 rat has, myelin sheath / Schwann cell / myelinated axon / myelinated neurone ; 2 2 (rat has) saltatory conduction OR (rat) impulse / action potential, jumps / leaps / AW, from (one) node of Ranvier to, the next / another ; 1(b) any three from: 3 snail / Fig. 1.3 1 greater depolarisation OR (membrane potential) gets more positive / has higher increase / has higher peak ; 2 action potential, slower / takes longer / takes more time OR longer time to return to resting potential ; 3 longer (absolute / relative) refractory period ; 4 longer hyperpolarisation ; 5 AVP ;
Q2 · The leaves of many plants have stomata that show a regular daily rhythm of opening and…
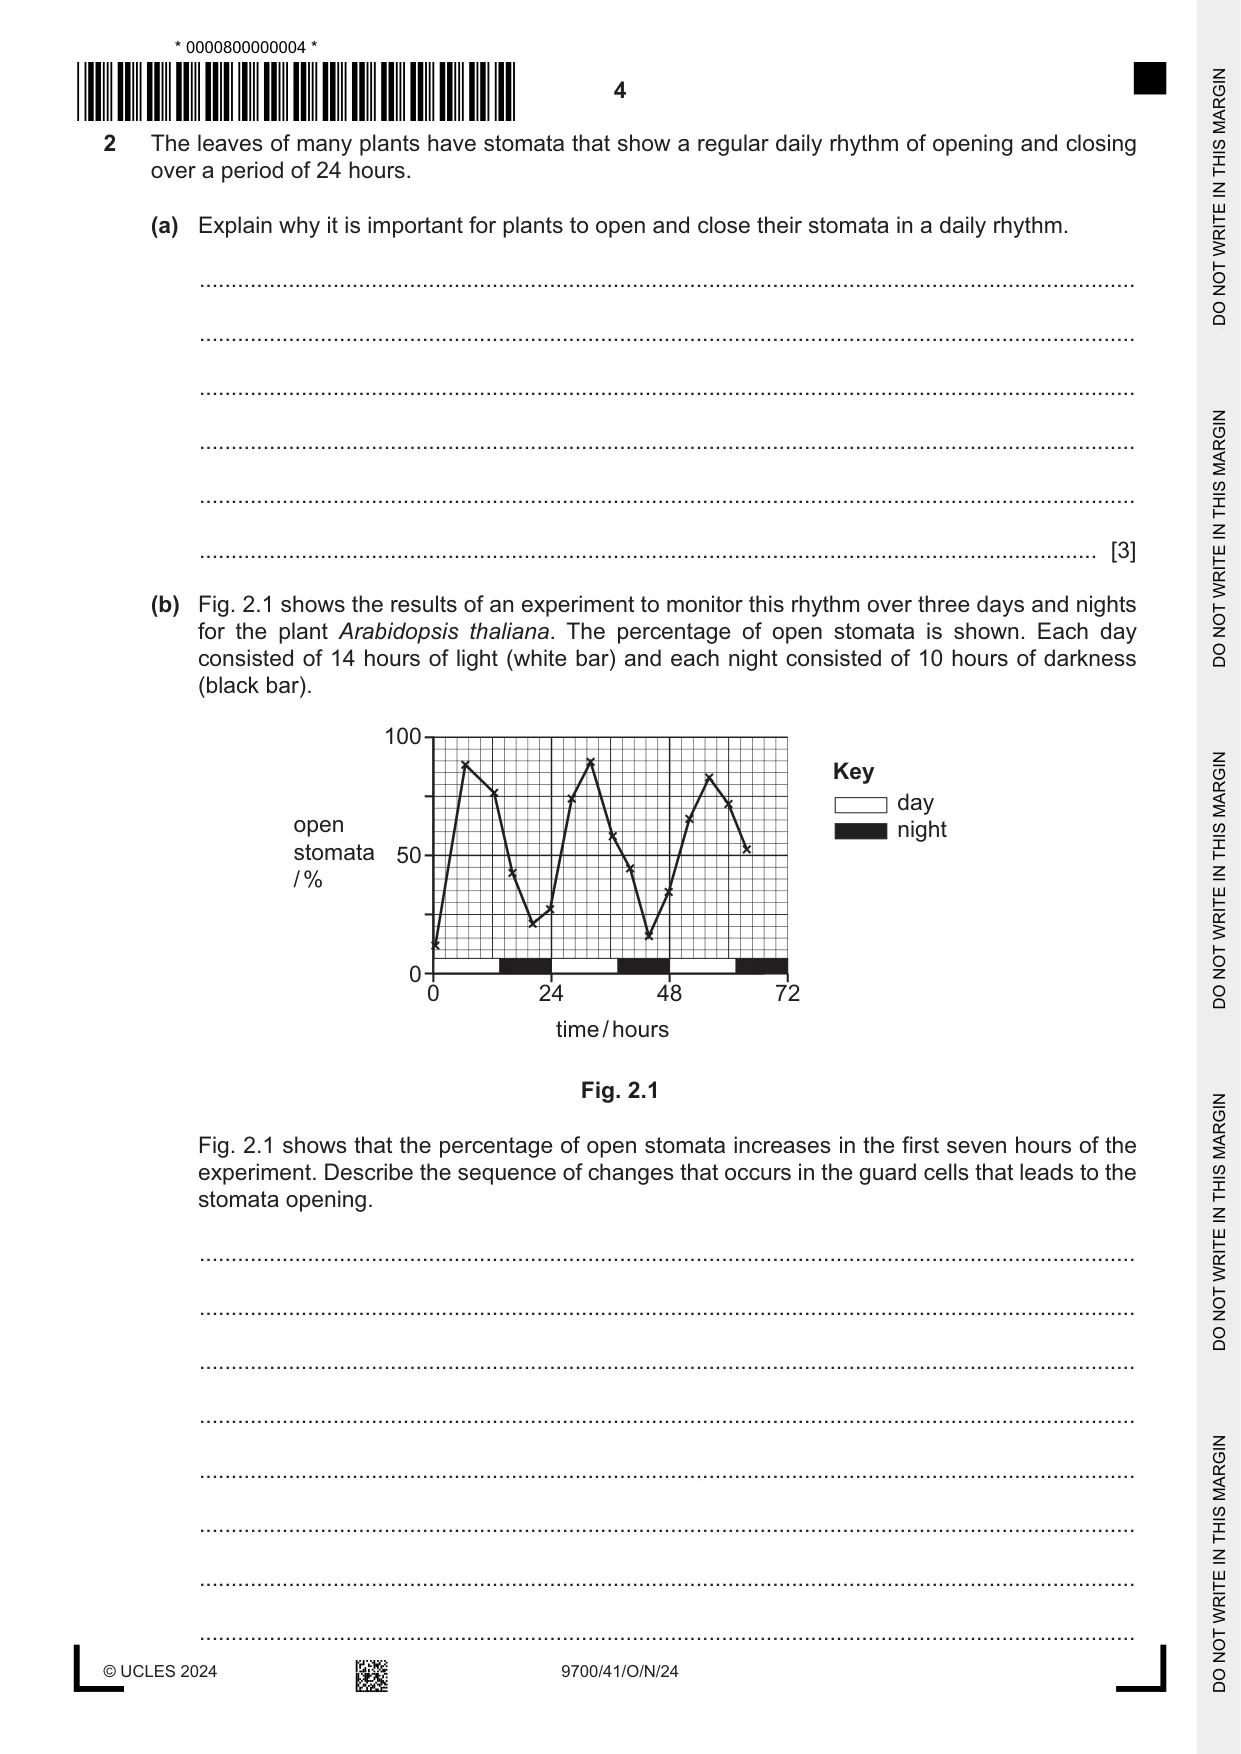
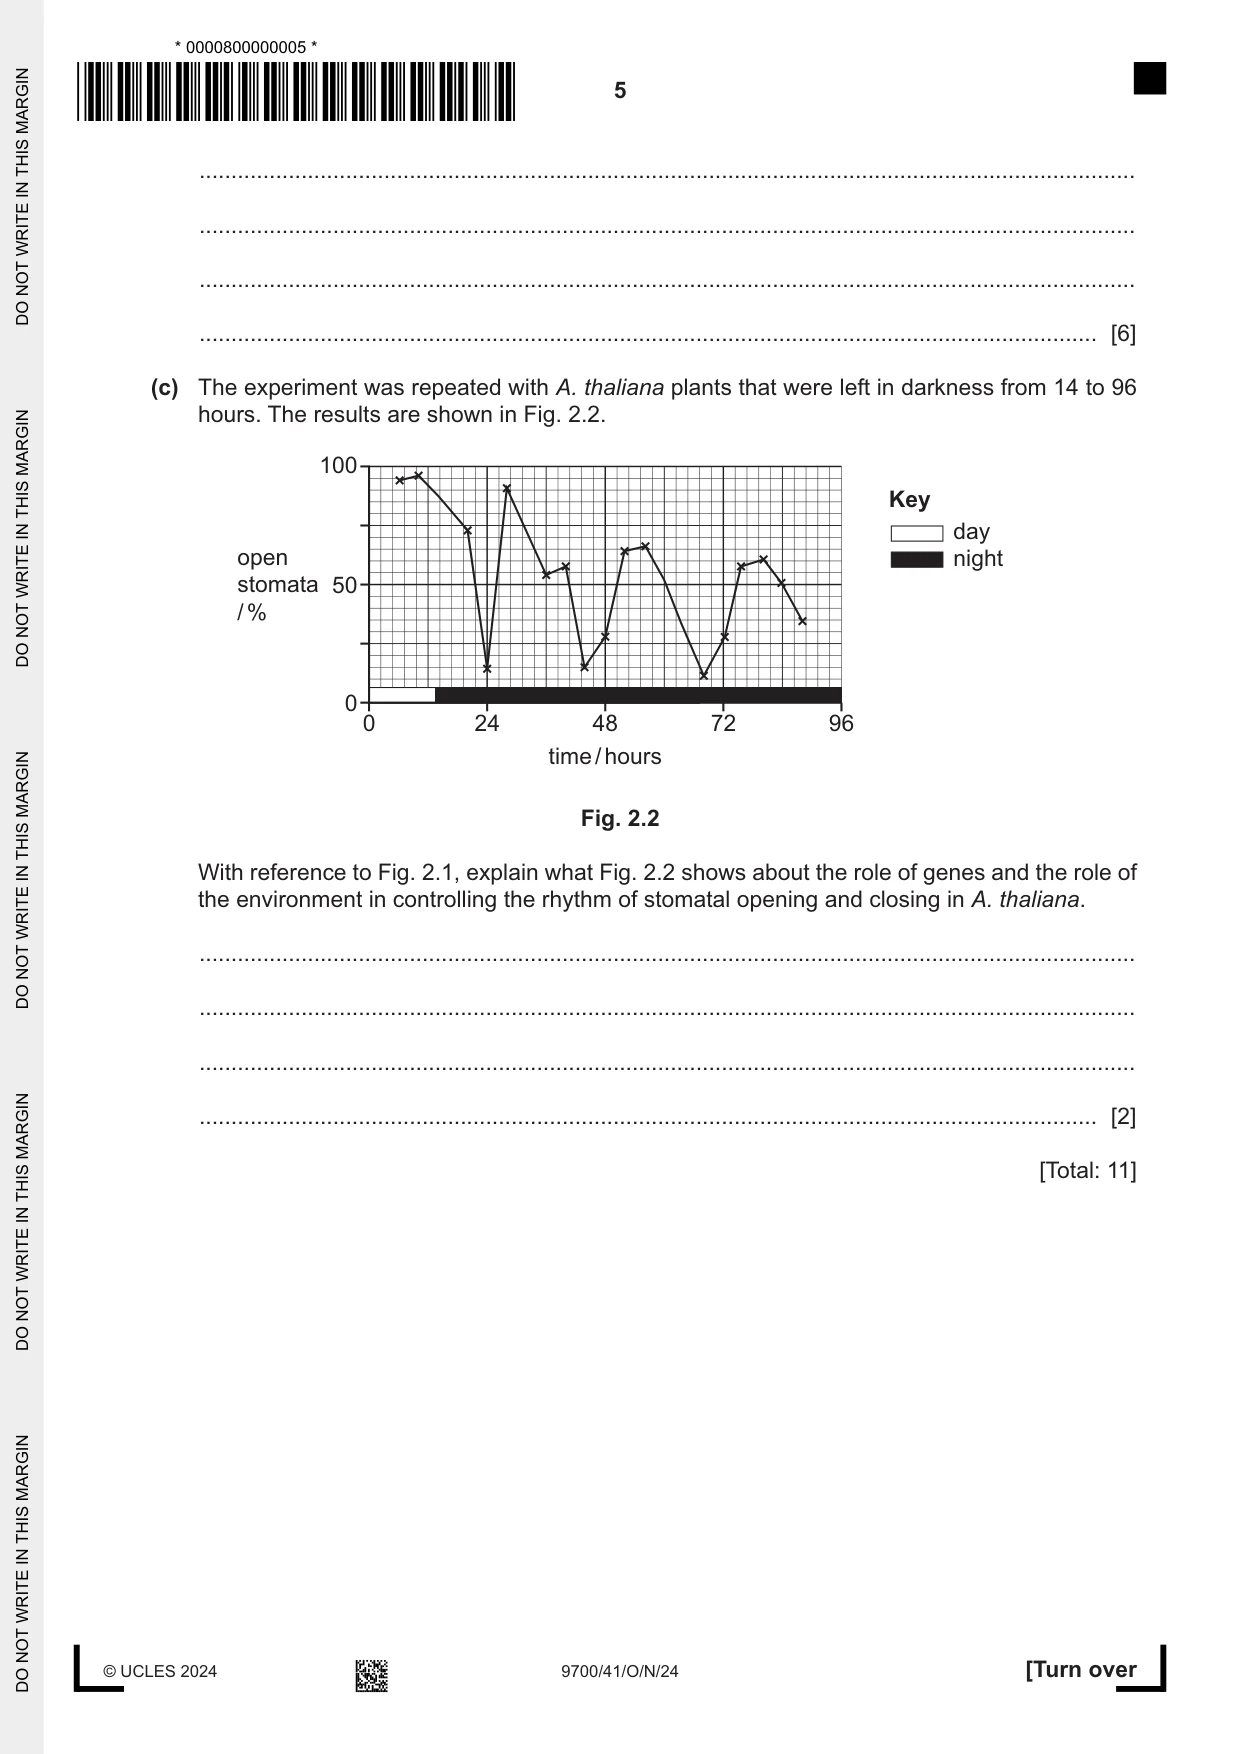
2 The leaves of many plants have stomata that show a regular daily rhythm of opening and closing over a period of 24 hours. (a) Explain why it is important for plants to open and close their stomata in a daily rhythm. ................................................................................................................................................... ................................................................................................................................................... ................................................................................................................................................... ................................................................................................................................................... ................................................................................................................................................... ............................................................................................................................................. [3] (b) Fig. 2.1 shows the results of an experiment to monitor this rhythm over three days and nights for the plant Arabidopsis thaliana. The percentage of open stomata is shown. Each day consisted of 14 hours of light (white bar) and each night consisted of 10 hours of darkness (black bar). 100 Key day open night stomata 50 / % 0 0 24 48 72 time / hours Fig. 2.1 Fig. 2.1 shows that the percentage of open stomata increases in the first seven hours of the experiment. Describe the sequence of changes that occurs in the guard cells that leads to the stomata opening. ................................................................................................................................................... ................................................................................................................................................... ................................................................................................................................................... ................................................................................................................................................... ................................................................................................................................................... ................................................................................................................................................... ................................................................................................................................................... ................................................................................................................................................... ................................................................................................................................................... ................................................................................................................................................... ................................................................................................................................................... ............................................................................................................................................. [6] (c) The experiment was repeated with A. thaliana plants that were left in darkness from 14 to 96 hours. The results are shown in Fig. 2.2. 100 Key day open night stomata 50 / % 0 0 24 48 72 96 time / hours Fig. 2.2 With reference to Fig. 2.1, explain what Fig. 2.2 shows about the role of genes and the role of the environment in controlling the rhythm of stomatal opening and closing in A. thaliana. ................................................................................................................................................... ................................................................................................................................................... ................................................................................................................................................... ............................................................................................................................................. [2] [Total: 11]
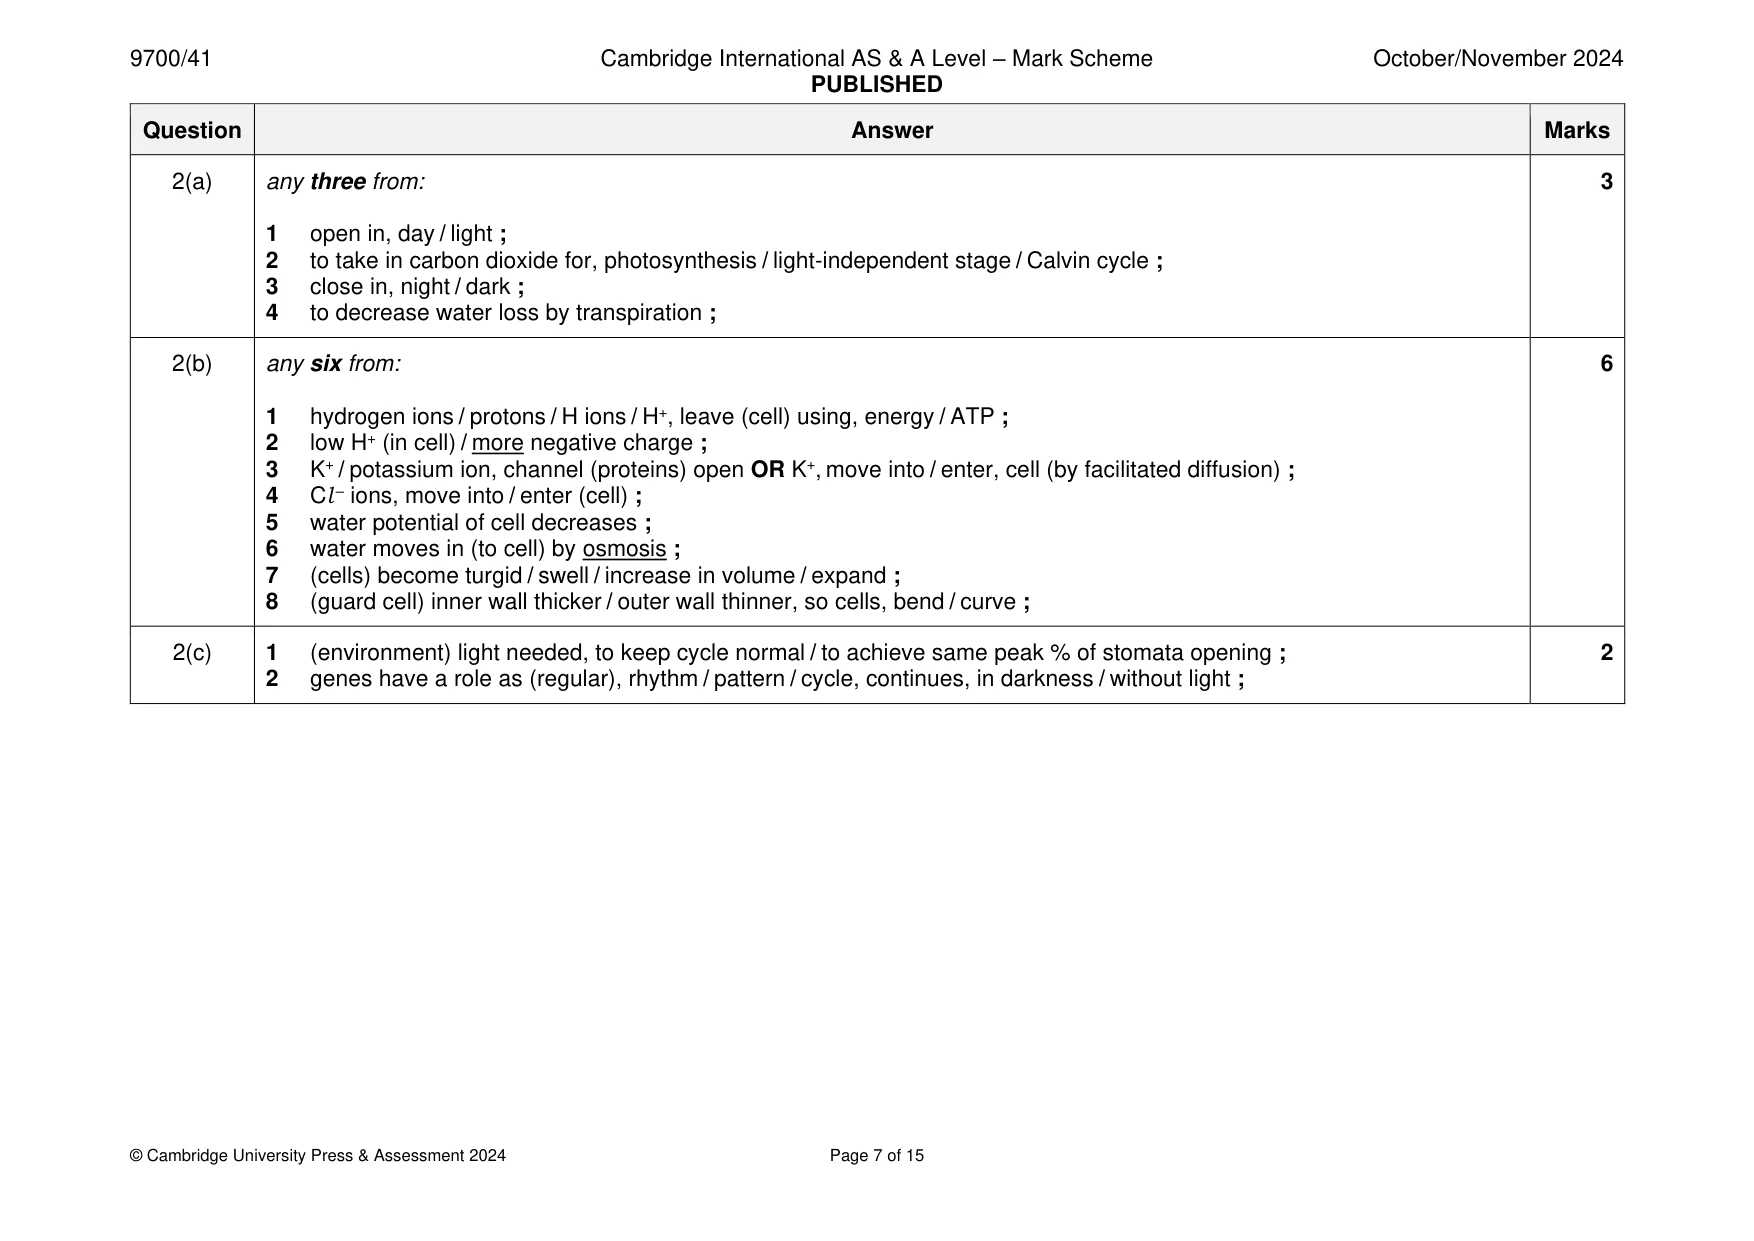
Mark scheme: 2(a) any three from: 3 1 open in, day / light ; 2 to take in carbon dioxide for, photosynthesis / light-independent stage / Calvin cycle ; 3 close in, night / dark ; 4 to decrease water loss by transpiration ; 2(b) any six from: 6 1 hydrogen ions / protons / H ions / H+, leave (cell) using, energy / ATP ; 2 low H+ (in cell) / more negative charge ; 3 K+ / potassium ion, channel (proteins) open OR K+, move into / enter, cell (by facilitated diffusion) ; 4 Cl – ions, move into / enter (cell) ; 5 water potential of cell decreases ; 6 water moves in (to cell) by osmosis ; 7 (cells) become turgid / swell / increase in volume / expand ; 8 (guard cell) inner wall thicker / outer wall thinner, so cells, bend / curve ; 2(c) 1 (environment) light needed, to keep cycle normal / to achieve same peak % of stomata opening ; 2 2 genes have a role as (regular), rhythm / pattern / cycle, continues, in darkness / without light ;
Q3 · During aerobic respiration, cells respire substrates such as glucose to produce ATP
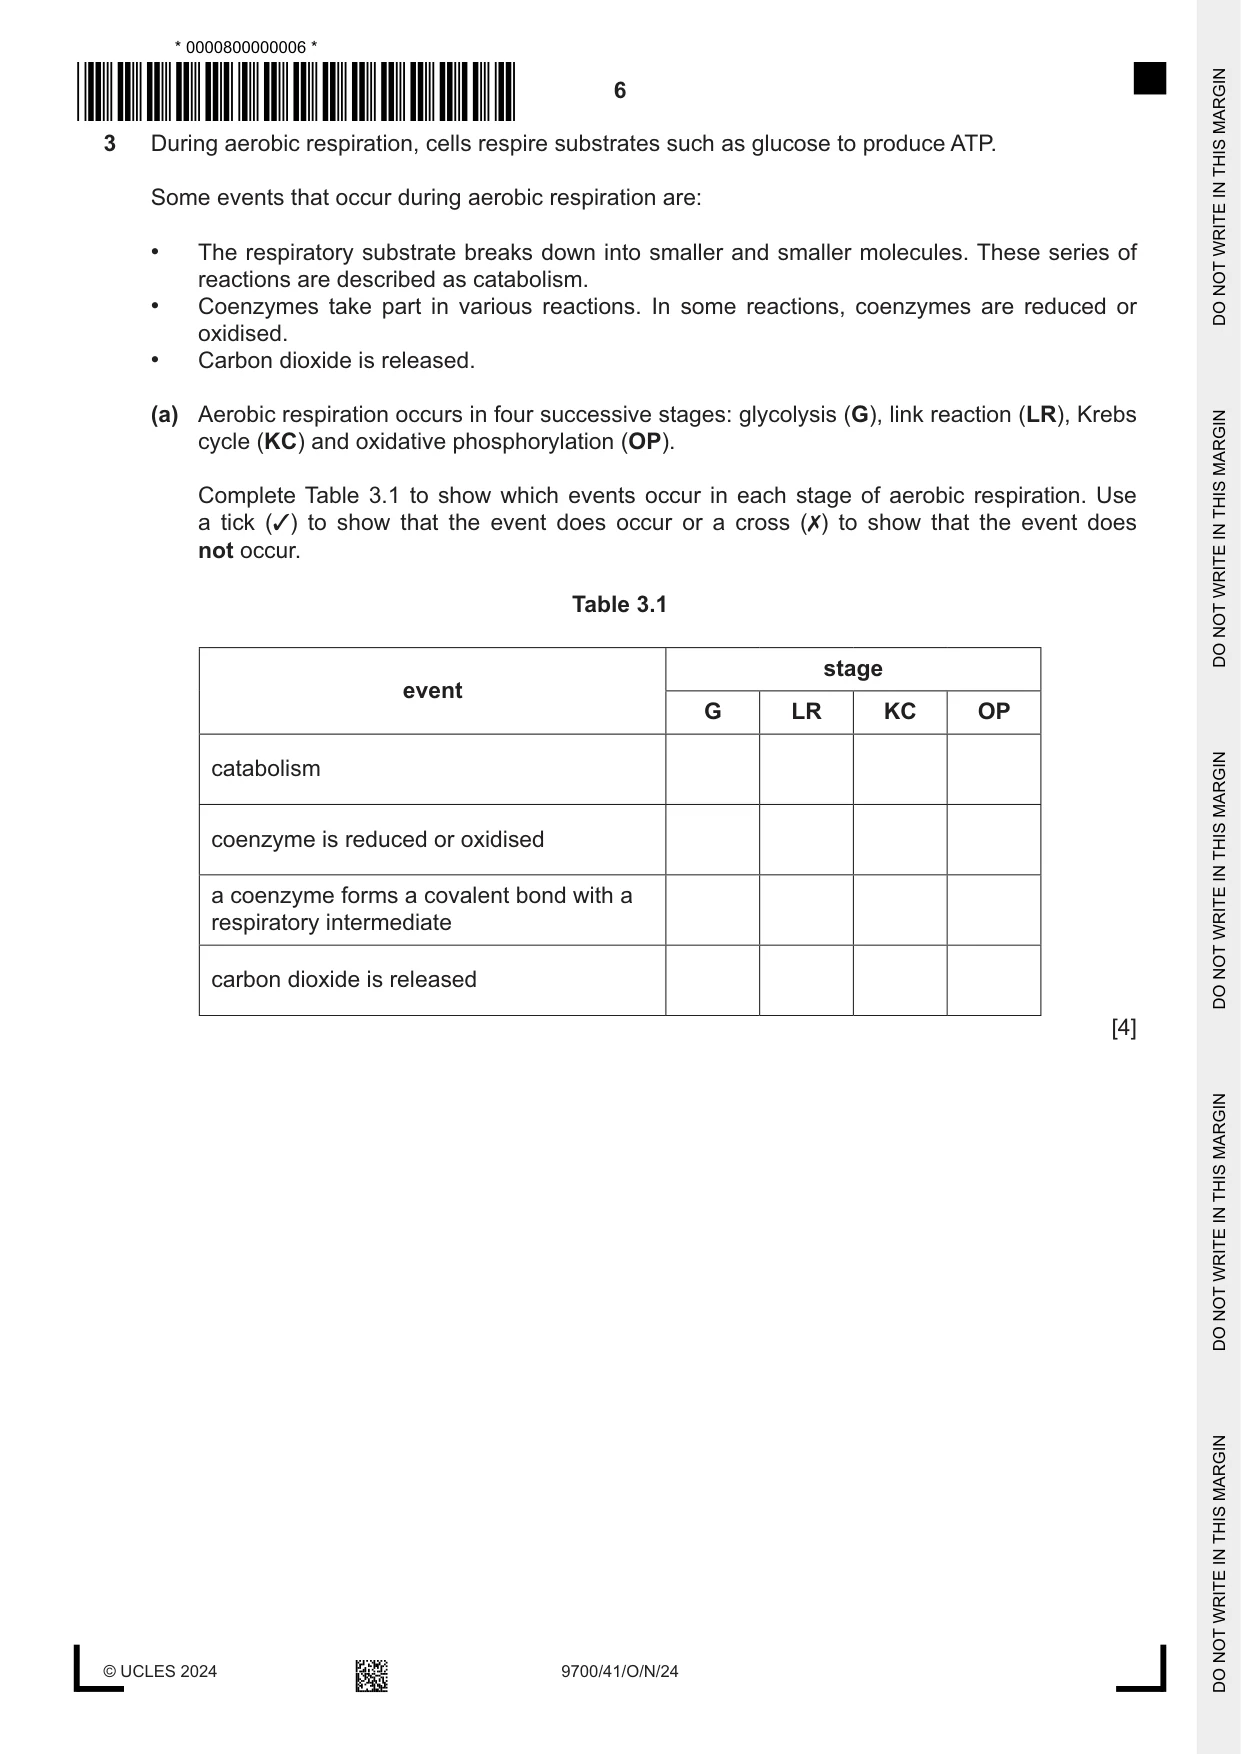
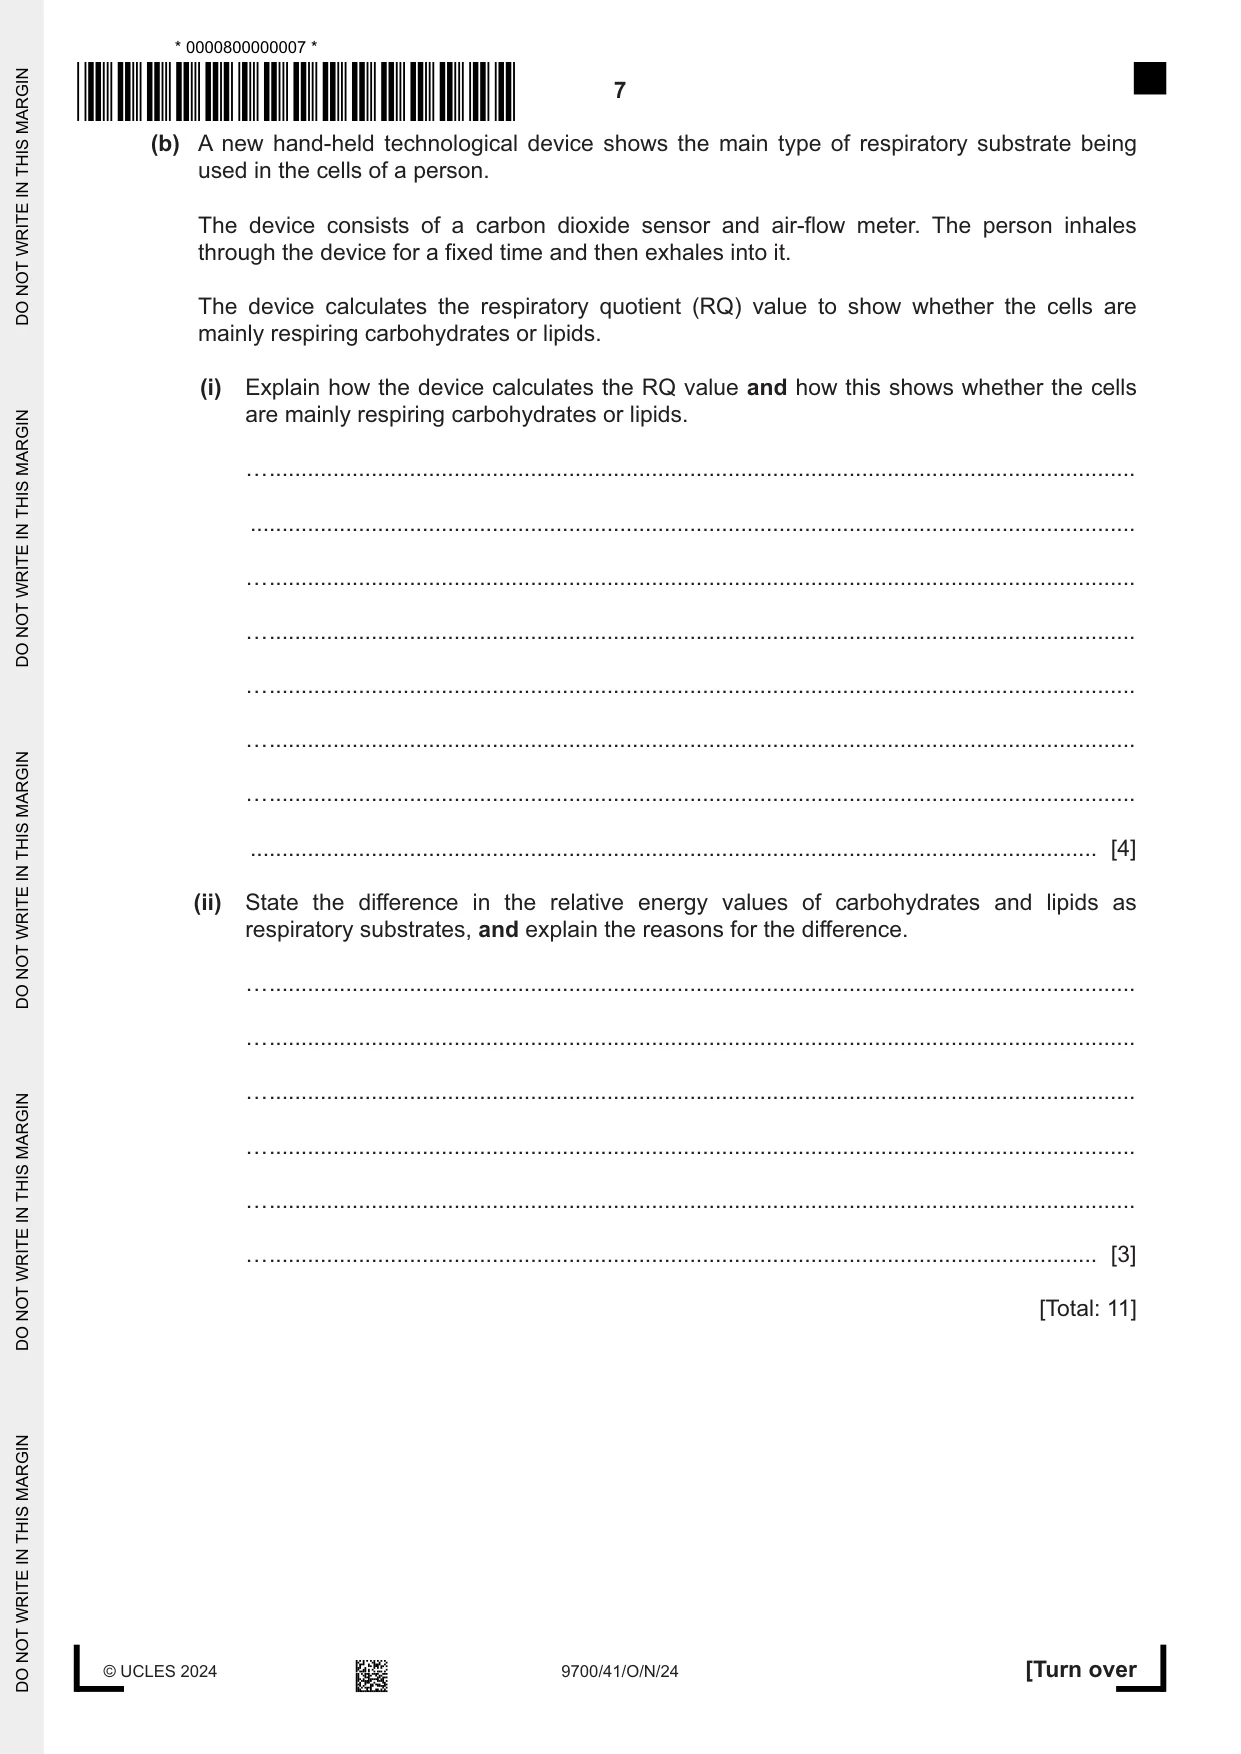
3 During aerobic respiration, cells respire substrates such as glucose to produce ATP. Some events that occur during aerobic respiration are: • The respiratory substrate breaks down into smaller and smaller molecules. These series of reactions are described as catabolism. • Coenzymes take part in various reactions. In some reactions, coenzymes are reduced or oxidised. • Carbon dioxide is released. (a) Aerobic respiration occurs in four successive stages: glycolysis (G), link reaction (LR), Krebs cycle (KC) and oxidative phosphorylation (OP). Complete Table 3.1 to show which events occur in each stage of aerobic respiration. Use a tick (✓) to show that the event does occur or a cross (✗) to show that the event does not occur. Table 3.1 stage event G LR KC OP catabolism coenzyme is reduced or oxidised a coenzyme forms a covalent bond with a respiratory intermediate carbon dioxide is released [4] (b) A new hand‑held technological device shows the main type of respiratory substrate being used in the cells of a person. The device consists of a carbon dioxide sensor and air‑flow meter. The person inhales through the device for a fixed time and then exhales into it. The device calculates the respiratory quotient (RQ) value to show whether the cells are mainly respiring carbohydrates or lipids. (i) Explain how the device calculates the RQ value and how this shows whether the cells are mainly respiring carbohydrates or lipids. … ........................................................................................................................................ ........................................................................................................................................... … ........................................................................................................................................ … ........................................................................................................................................ … ........................................................................................................................................ … ........................................................................................................................................ … ........................................................................................................................................ ..................................................................................................................................... [4] (ii) State the difference in the relative energy values of carbohydrates and lipids as respiratory substrates, and explain the reasons for the difference. … ........................................................................................................................................ … ........................................................................................................................................ … ........................................................................................................................................ … ........................................................................................................................................ … ........................................................................................................................................ … .................................................................................................................................. [3] [Total: 11]
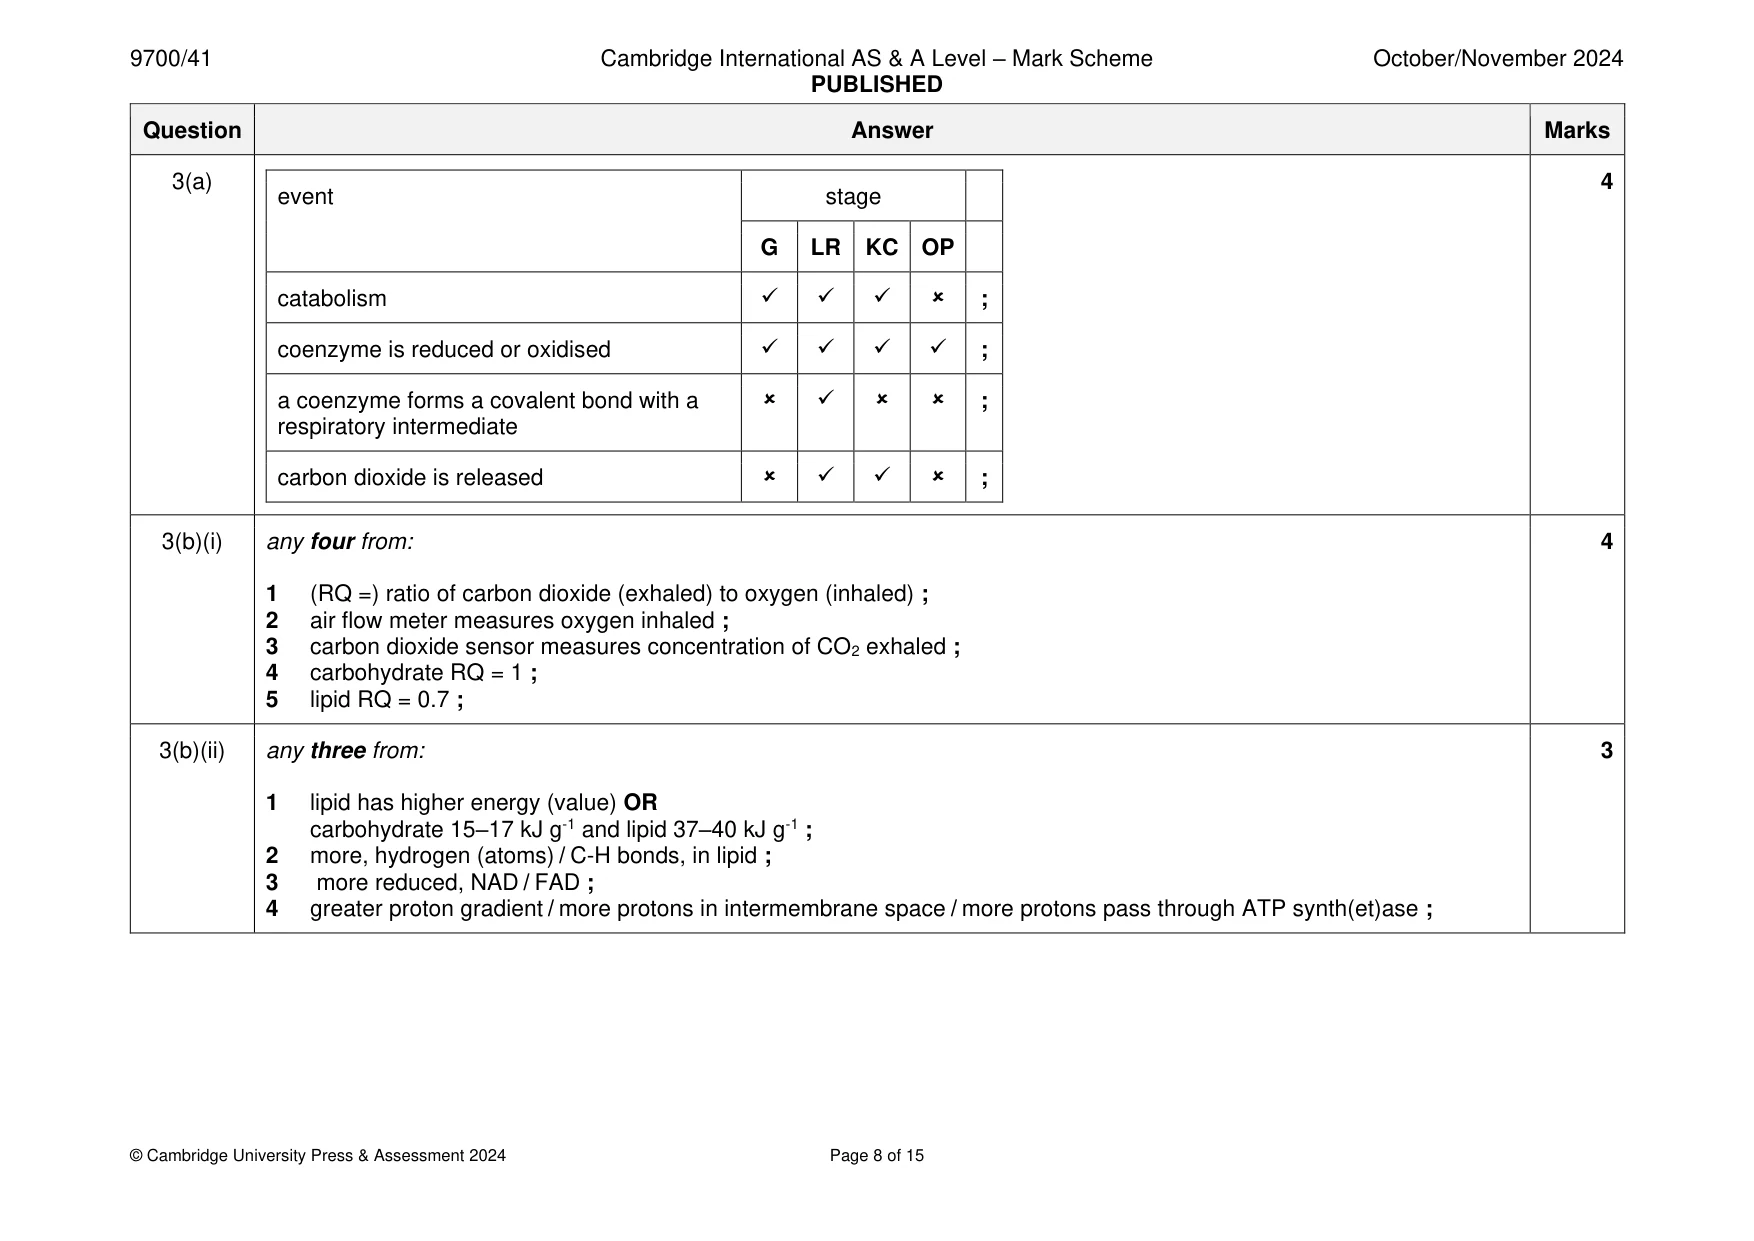
Mark scheme: 3(a) 4 event stage G LR KC OP catabolism ✓ ✓ ✓ ; coenzyme is reduced or oxidised ✓ ✓ ✓ ✓ ; a coenzyme forms a covalent bond with a ✓ ; respiratory intermediate carbon dioxide is released ✓ ✓ ; 3(b)(i) any four from: 4 1 (RQ =) ratio of carbon dioxide (exhaled) to oxygen (inhaled) ; 2 air flow meter measures oxygen inhaled ; 3 carbon dioxide sensor measures concentration of CO2 exhaled ; 4 carbohydrate RQ = 1 ; 5 lipid RQ = 0.7 ; 3(b)(ii) any three from: 3 1 lipid has higher energy (value) OR carbohydrate 15–17 kJ g-1 and lipid 37–40 kJ g-1 ; 2 more, hydrogen (atoms) / C-H bonds, in lipid ; 3 more reduced, NAD / FAD ; 4 greater proton gradient / more protons in intermembrane space / more protons pass through ATP synth(et)ase ;
Q4 · The leaves of Mimosa pudica plants are made of a number of structures known as pinnae
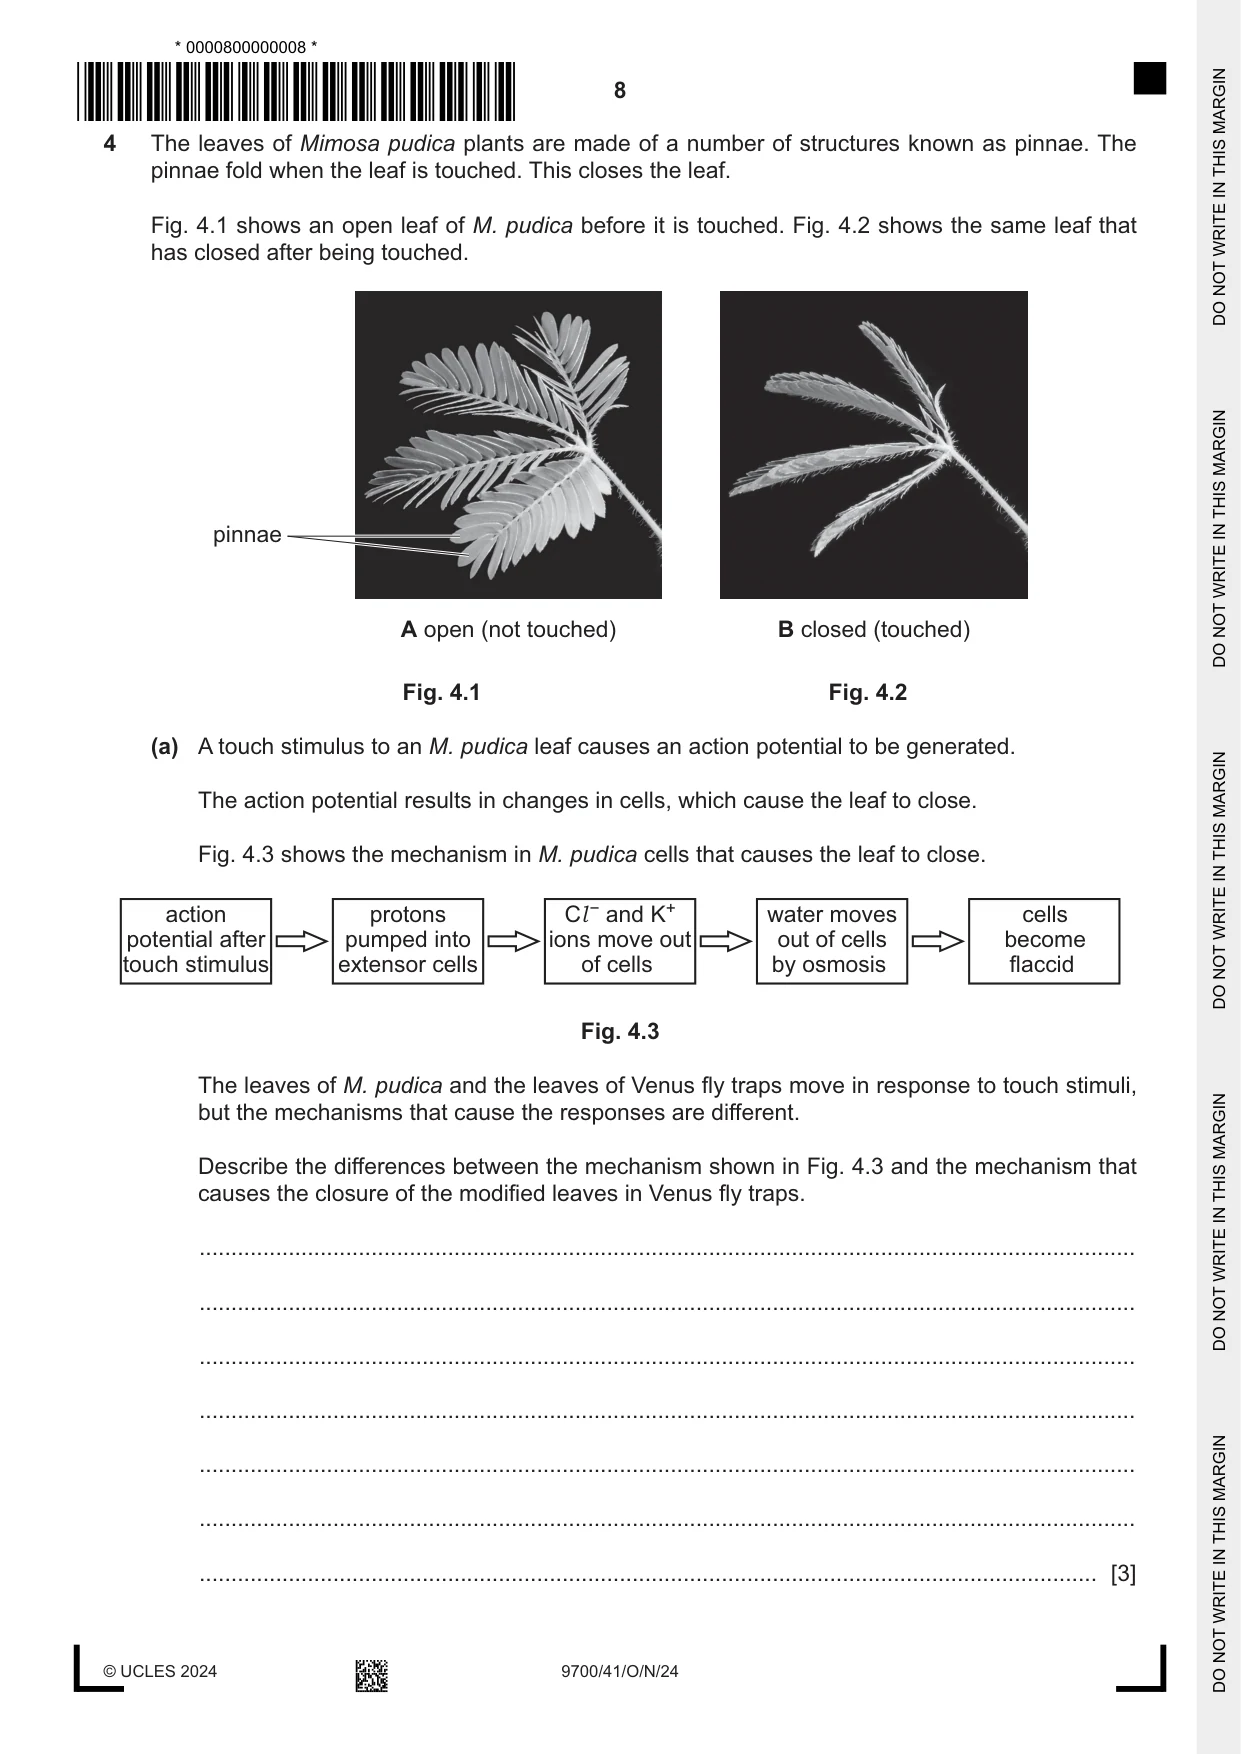
4 The leaves of Mimosa pudica plants are made of a number of structures known as pinnae. The pinnae fold when the leaf is touched. This closes the leaf. Fig. 4.1 shows an open leaf of M. pudica before it is touched. Fig. 4.2 shows the same leaf that has closed after being touched. pinnae A open (not touched) B closed (touched) Fig. 4.1 Fig. 4.2 (a) A touch stimulus to an M. pudica leaf causes an action potential to be generated. The action potential results in changes in cells, which cause the leaf to close. Fig. 4.3 shows the mechanism in M. pudica cells that causes the leaf to close. action protons Cl − and K+ water moves cells potential after pumped into ions move out out of cells become touch stimulus extensor cells of cells by osmosis flaccid Fig. 4.3 The leaves of M. pudica and the leaves of Venus fly traps move in response to touch stimuli, but the mechanisms that cause the responses are different. Describe the differences between the mechanism shown in Fig. 4.3 and the mechanism that causes the closure of the modified leaves in Venus fly traps. ................................................................................................................................................... ................................................................................................................................................... ................................................................................................................................................... ................................................................................................................................................... ................................................................................................................................................... ................................................................................................................................................... ............................................................................................................................................. [3] (b) The rate of photosynthesis decreases by 40% when the leaves of M. pudica close. Explain why the rate of photosynthesis decreases when the leaves of M. pudica close. ................................................................................................................................................... ................................................................................................................................................... ................................................................................................................................................... ................................................................................................................................................... ............................................................................................................................................. [2] (c) Plants can carry out cyclic photophosphorylation and non‑cyclic photophosphorylation during the light‑dependent stage of photosynthesis. These processes occur at the grana of chloroplasts. Outline the similarities and differences between cyclic photophosphorylation and non‑cyclic photophosphorylation. ................................................................................................................................................... ................................................................................................................................................... ................................................................................................................................................... ................................................................................................................................................... ................................................................................................................................................... ................................................................................................................................................... ................................................................................................................................................... ................................................................................................................................................... ................................................................................................................................................... ................................................................................................................................................... ................................................................................................................................................... ................................................................................................................................................... ................................................................................................................................................... ................................................................................................................................................... ................................................................................................................................................... ................................................................................................................................................... ............................................................................................................................................. [6] [Total: 11]
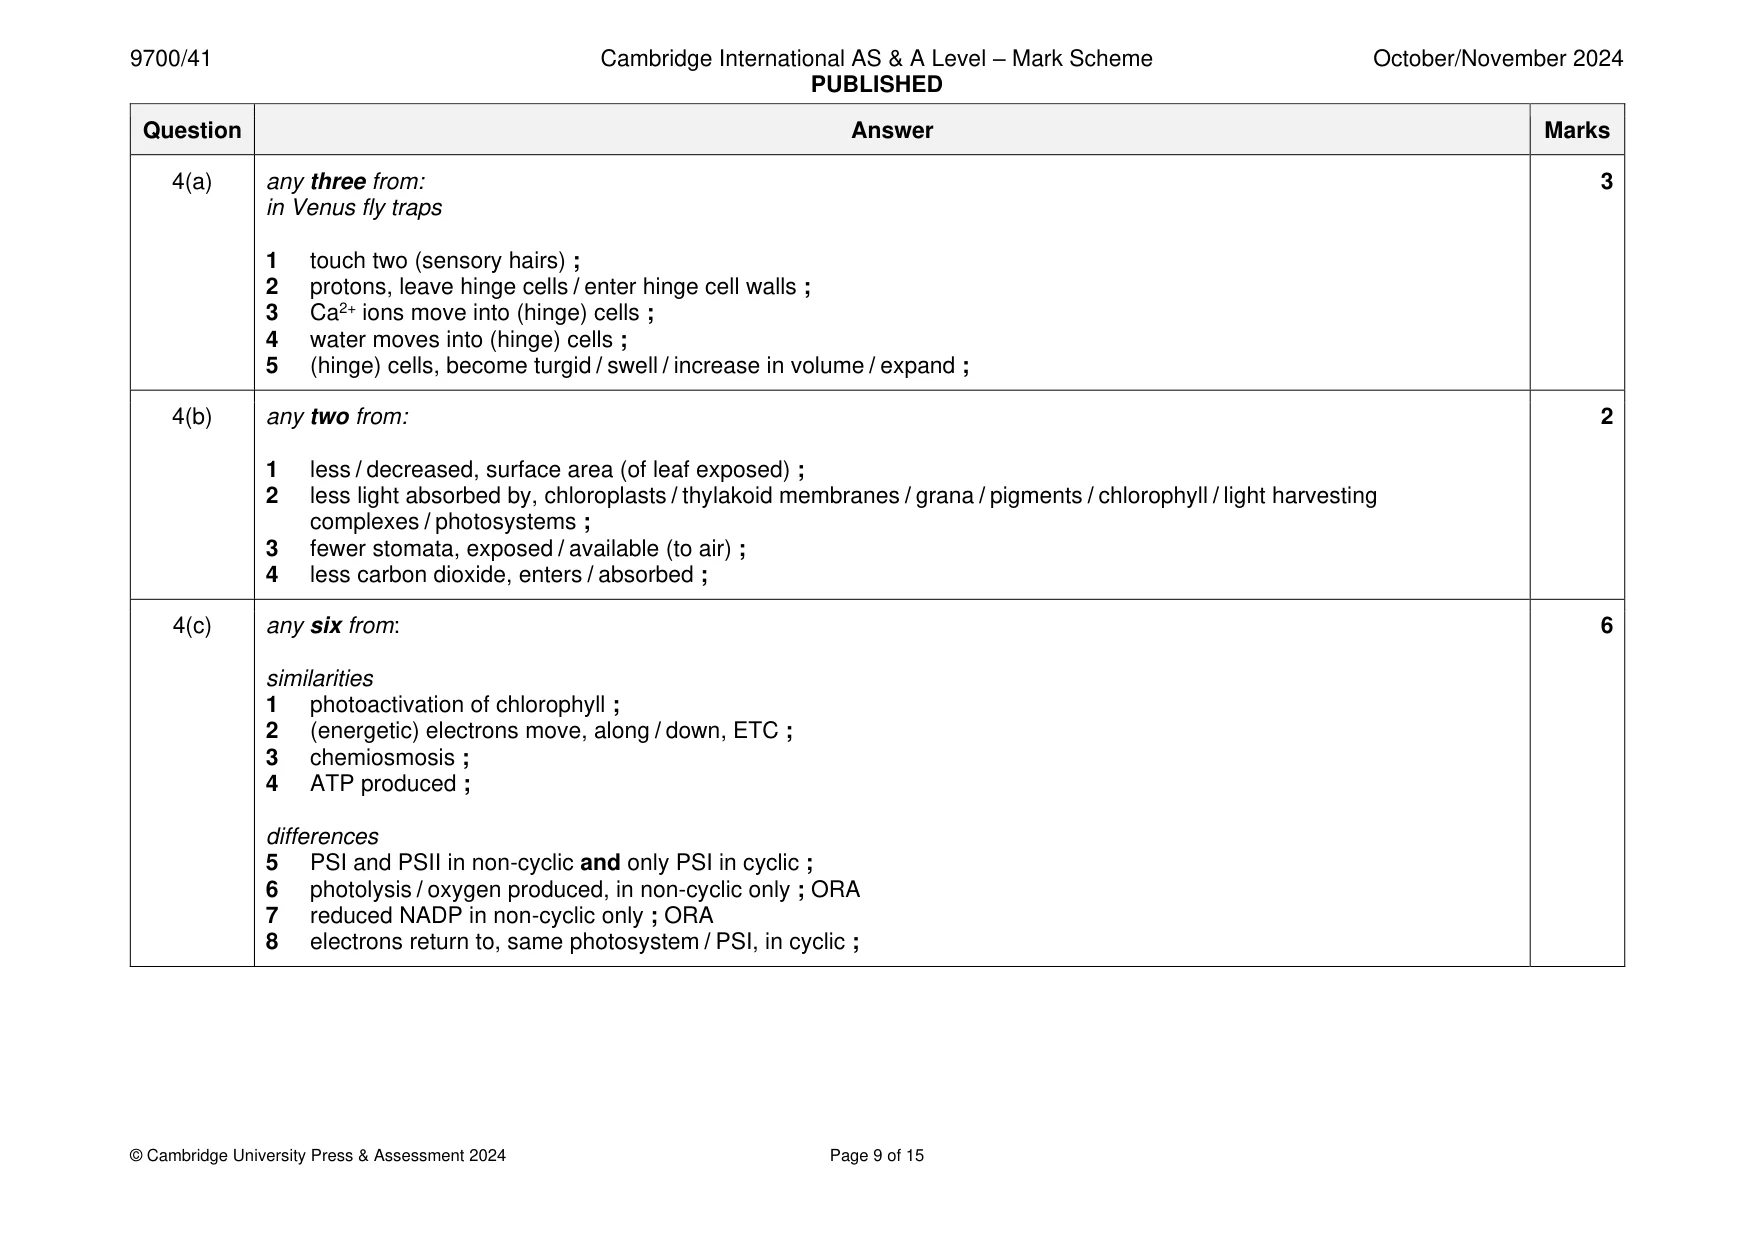
Mark scheme: 4(a) any three from: 3 in Venus fly traps 1 touch two (sensory hairs) ; 2 protons, leave hinge cells / enter hinge cell walls ; 3 Ca2+ ions move into (hinge) cells ; 4 water moves into (hinge) cells ; 5 (hinge) cells, become turgid / swell / increase in volume / expand ; 4(b) any two from: 2 1 less / decreased, surface area (of leaf exposed) ; 2 less light absorbed by, chloroplasts / thylakoid membranes / grana / pigments / chlorophyll / light harvesting complexes / photosystems ; 3 fewer stomata, exposed / available (to air) ; 4 less carbon dioxide, enters / absorbed ; 4(c) any six from: 6 similarities 1 photoactivation of chlorophyll ; 2 (energetic) electrons move, along / down, ETC ; 3 chemiosmosis ; 4 ATP produced ; differences 5 PSI and PSII in non-cyclic and only PSI in cyclic ; 6 photolysis / oxygen produced, in non-cyclic only ; ORA 7 reduced NADP in non-cyclic only ; ORA 8 electrons return to, same photosystem / PSI, in cyclic ;
More questions on Photosynthesis as an energy transfer process
Q5 · Lunularia cruciata is a primitive plant
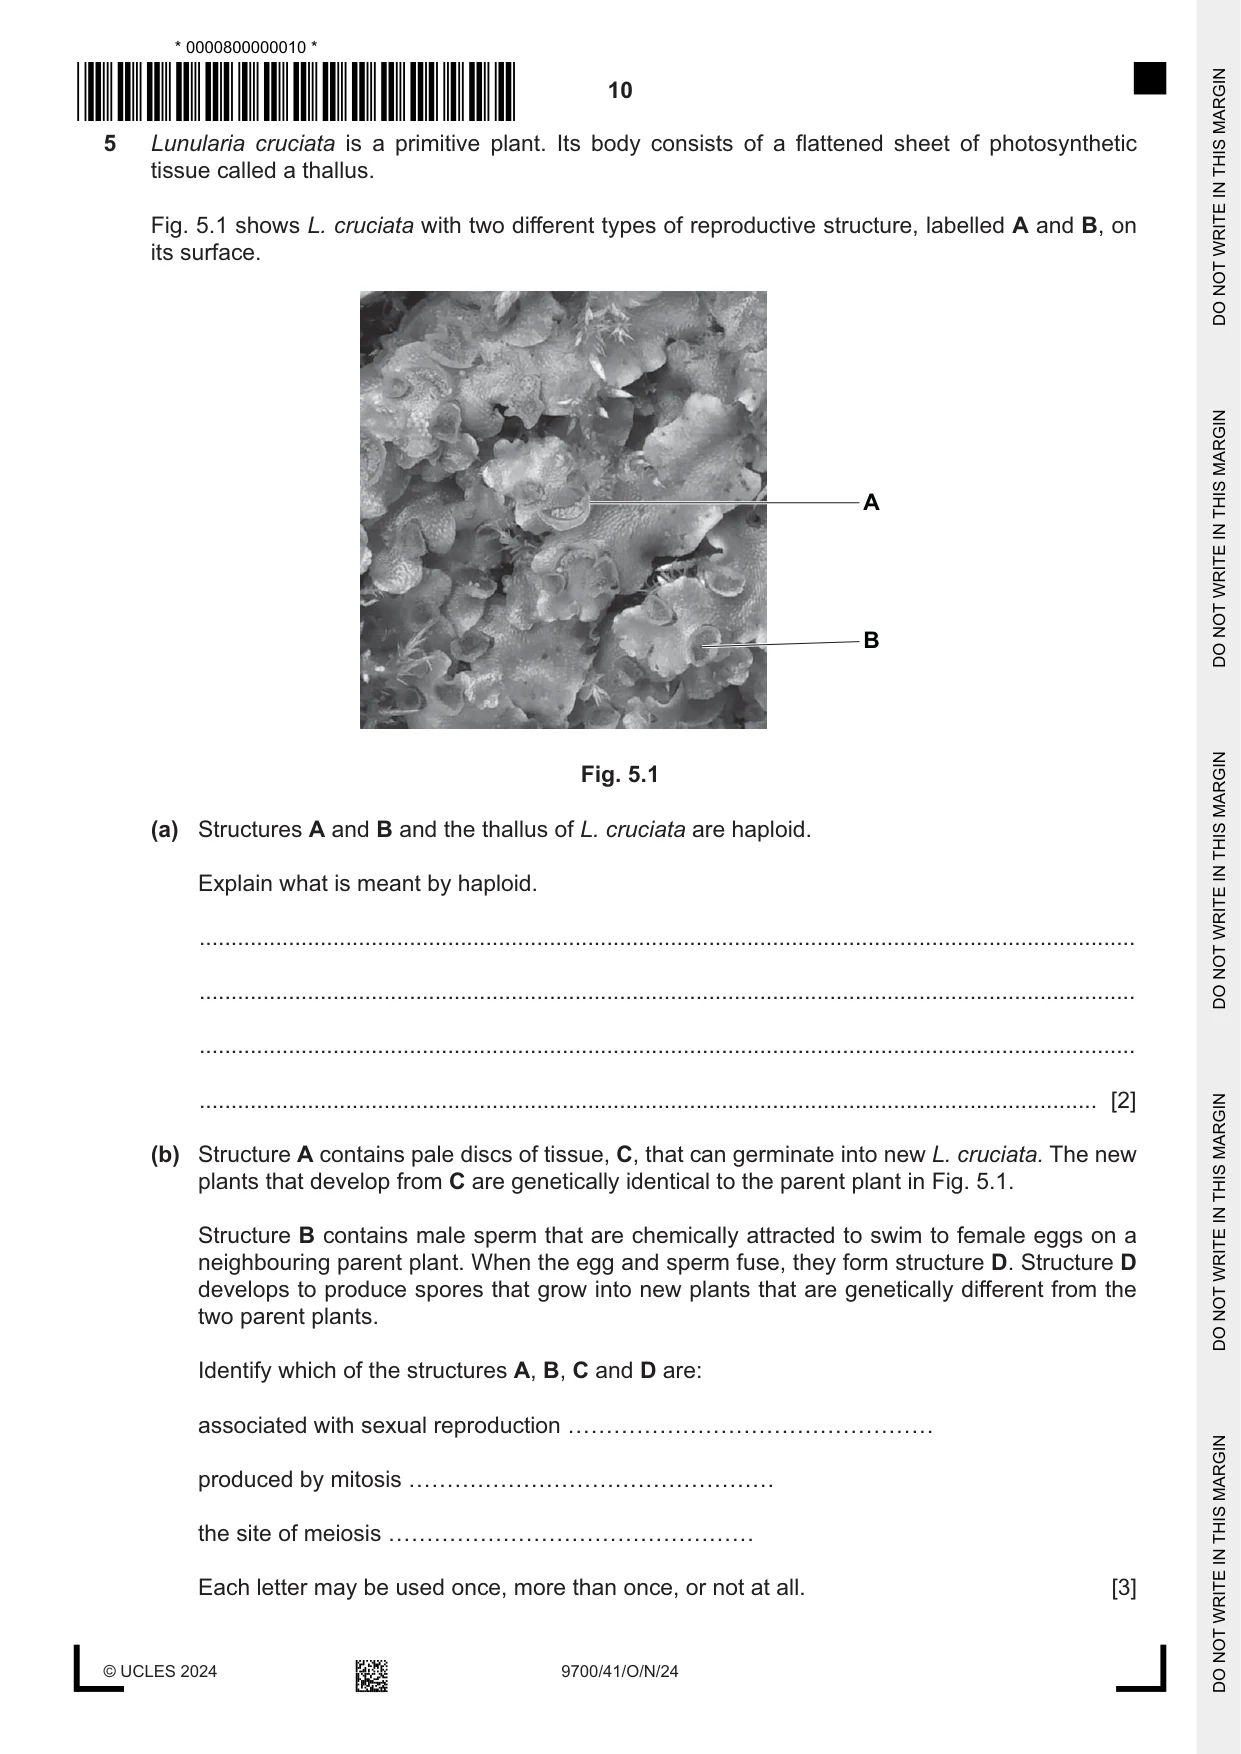
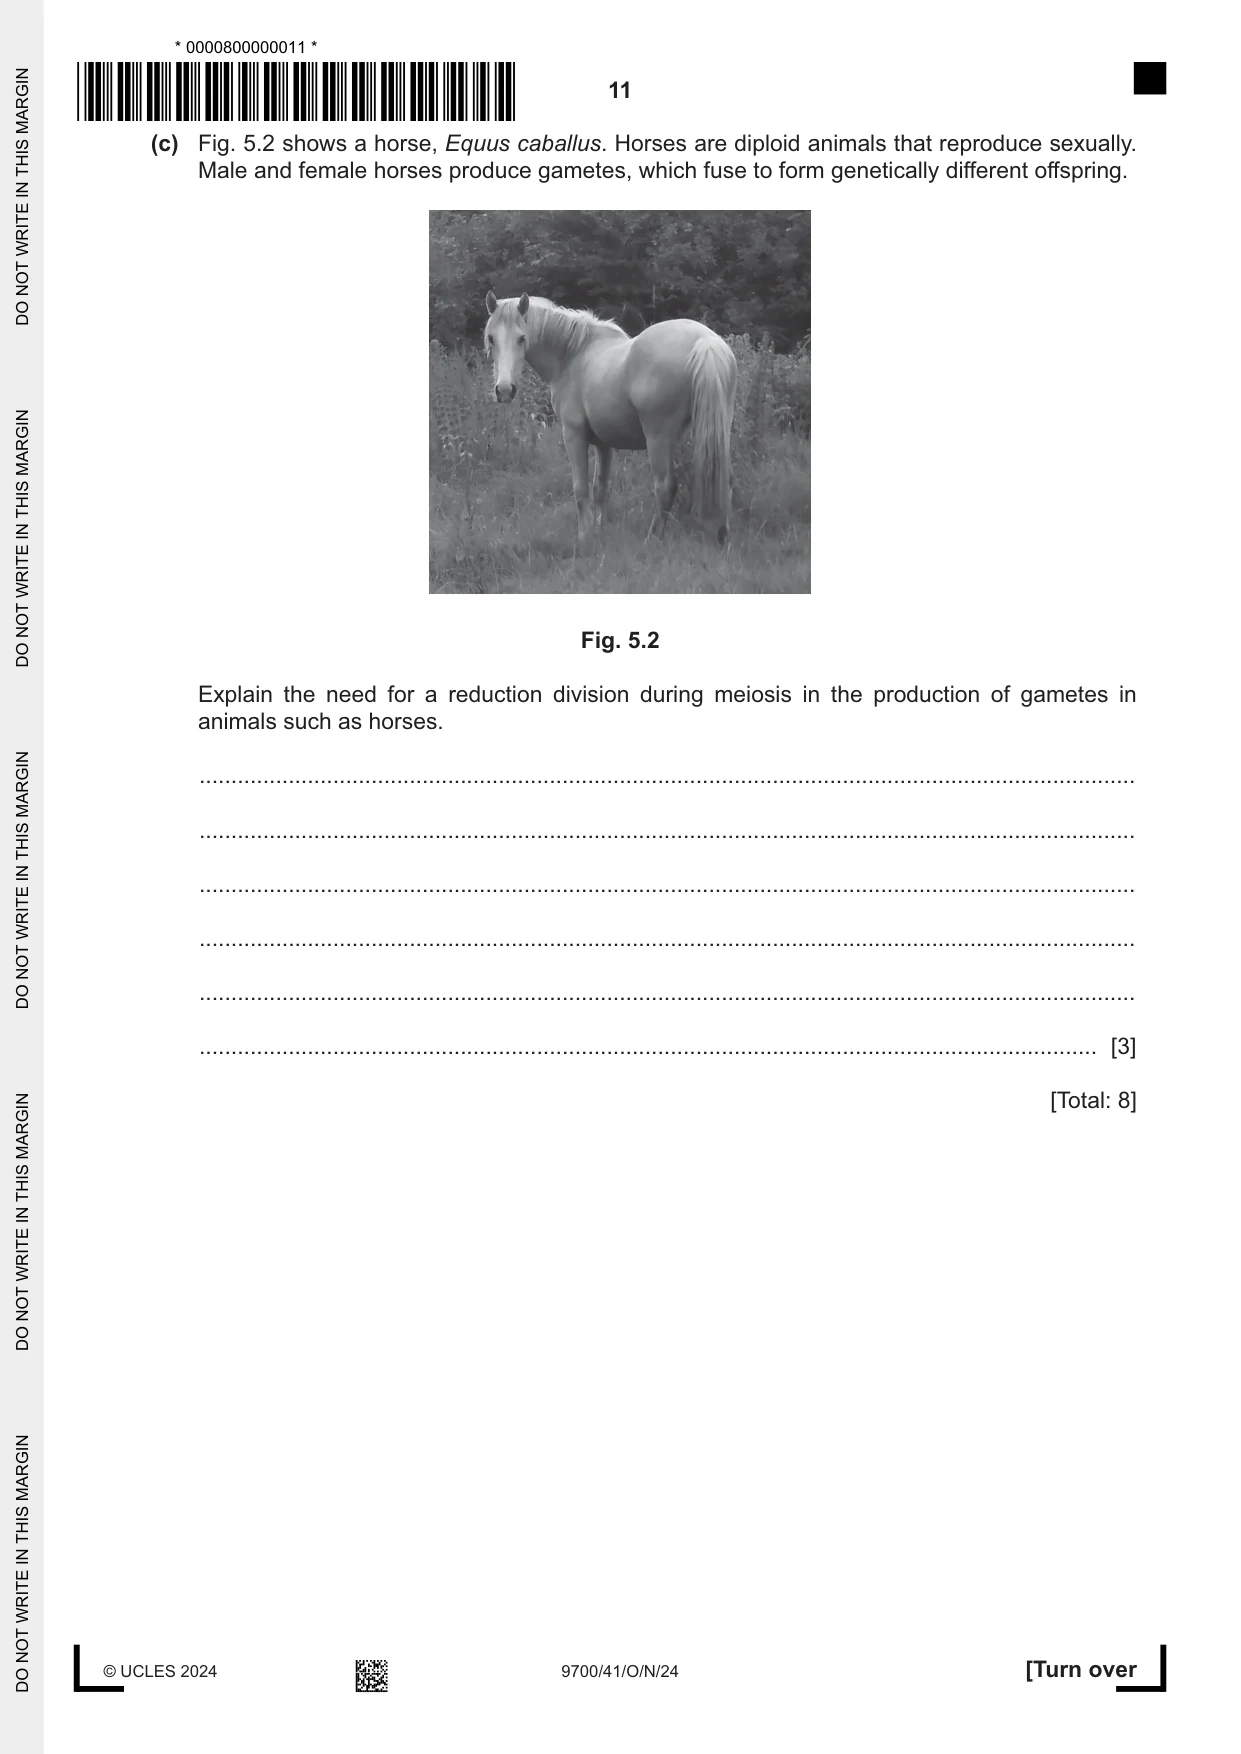
5 Lunularia cruciata is a primitive plant. Its body consists of a flattened sheet of photosynthetic tissue called a thallus. Fig. 5.1 shows L. cruciata with two different types of reproductive structure, labelled A and B, on its surface. A B Fig. 5.1 (a) Structures A and B and the thallus of L. cruciata are haploid. Explain what is meant by haploid. ................................................................................................................................................... ................................................................................................................................................... ................................................................................................................................................... ............................................................................................................................................. [2] (b) Structure A contains pale discs of tissue, C, that can germinate into new L. cruciata. The new plants that develop from C are genetically identical to the parent plant in Fig. 5.1. Structure B contains male sperm that are chemically attracted to swim to female eggs on a neighbouring parent plant. When the egg and sperm fuse, they form structure D. Structure D develops to produce spores that grow into new plants that are genetically different from the two parent plants. Identify which of the structures A, B, C and D are: associated with sexual reproduction ………………………………………… produced by mitosis ………………………………………… the site of meiosis ………………………………………… Each letter may be used once, more than once, or not at all. [3] (c) Fig. 5.2 shows a horse, Equus caballus. Horses are diploid animals that reproduce sexually. Male and female horses produce gametes, which fuse to form genetically different offspring. Fig. 5.2 Explain the need for a reduction division during meiosis in the production of gametes in animals such as horses. ................................................................................................................................................... ................................................................................................................................................... ................................................................................................................................................... ................................................................................................................................................... ................................................................................................................................................... ............................................................................................................................................. [3] [Total: 8]
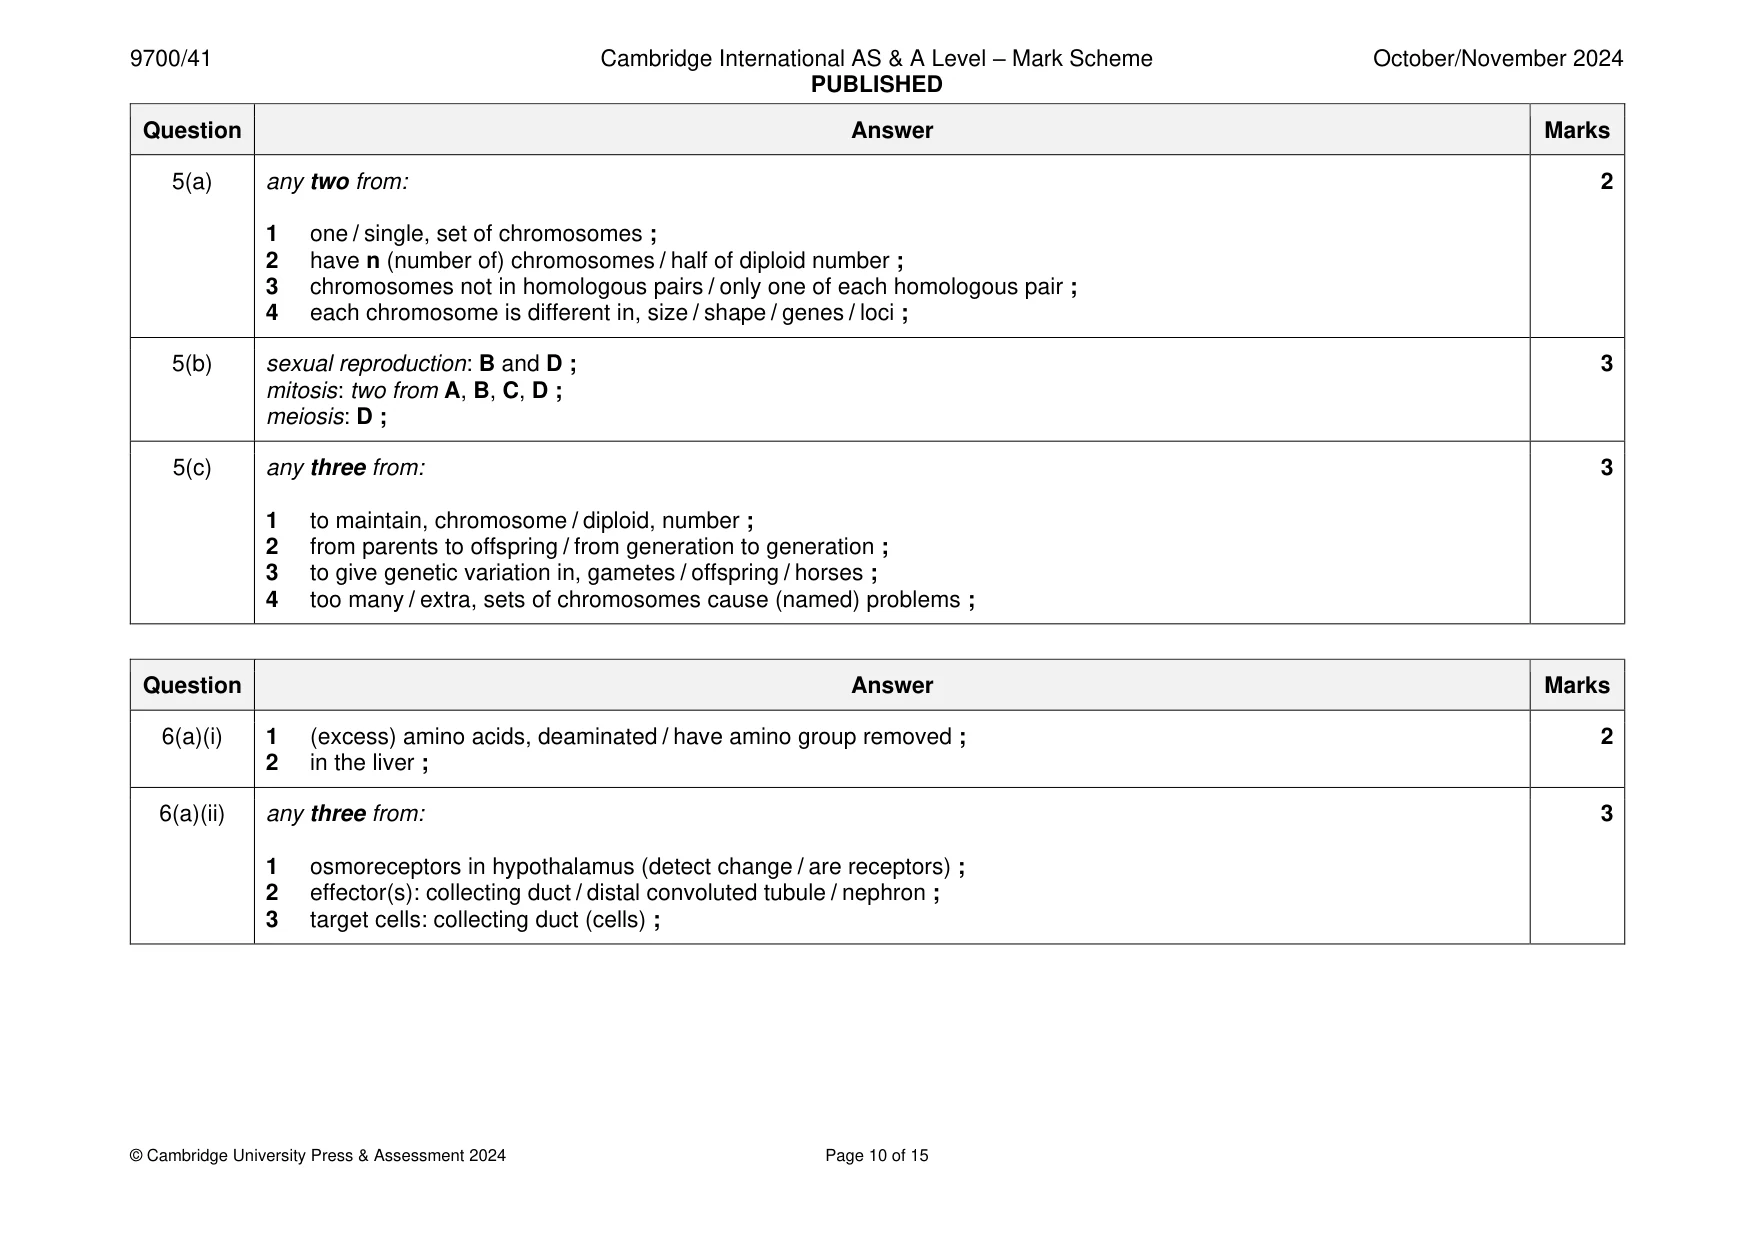
Mark scheme: 5(a) any two from: 2 1 one / single, set of chromosomes ; 2 have n (number of) chromosomes / half of diploid number ; 3 chromosomes not in homologous pairs / only one of each homologous pair ; 4 each chromosome is different in, size / shape / genes / loci ; 5(b) sexual reproduction: B and D ; 3 mitosis: two from A, B, C, D ; meiosis: D ; 5(c) any three from: 3 1 to maintain, chromosome / diploid, number ; 2 from parents to offspring / from generation to generation ; 3 to give genetic variation in, gametes / offspring / horses ; 4 too many / extra, sets of chromosomes cause (named) problems ;
More questions on Replication and division of nuclei and cells
Q6 · The mammalian kidney is responsible for: • the excretion of urea • osmoregulation (the…
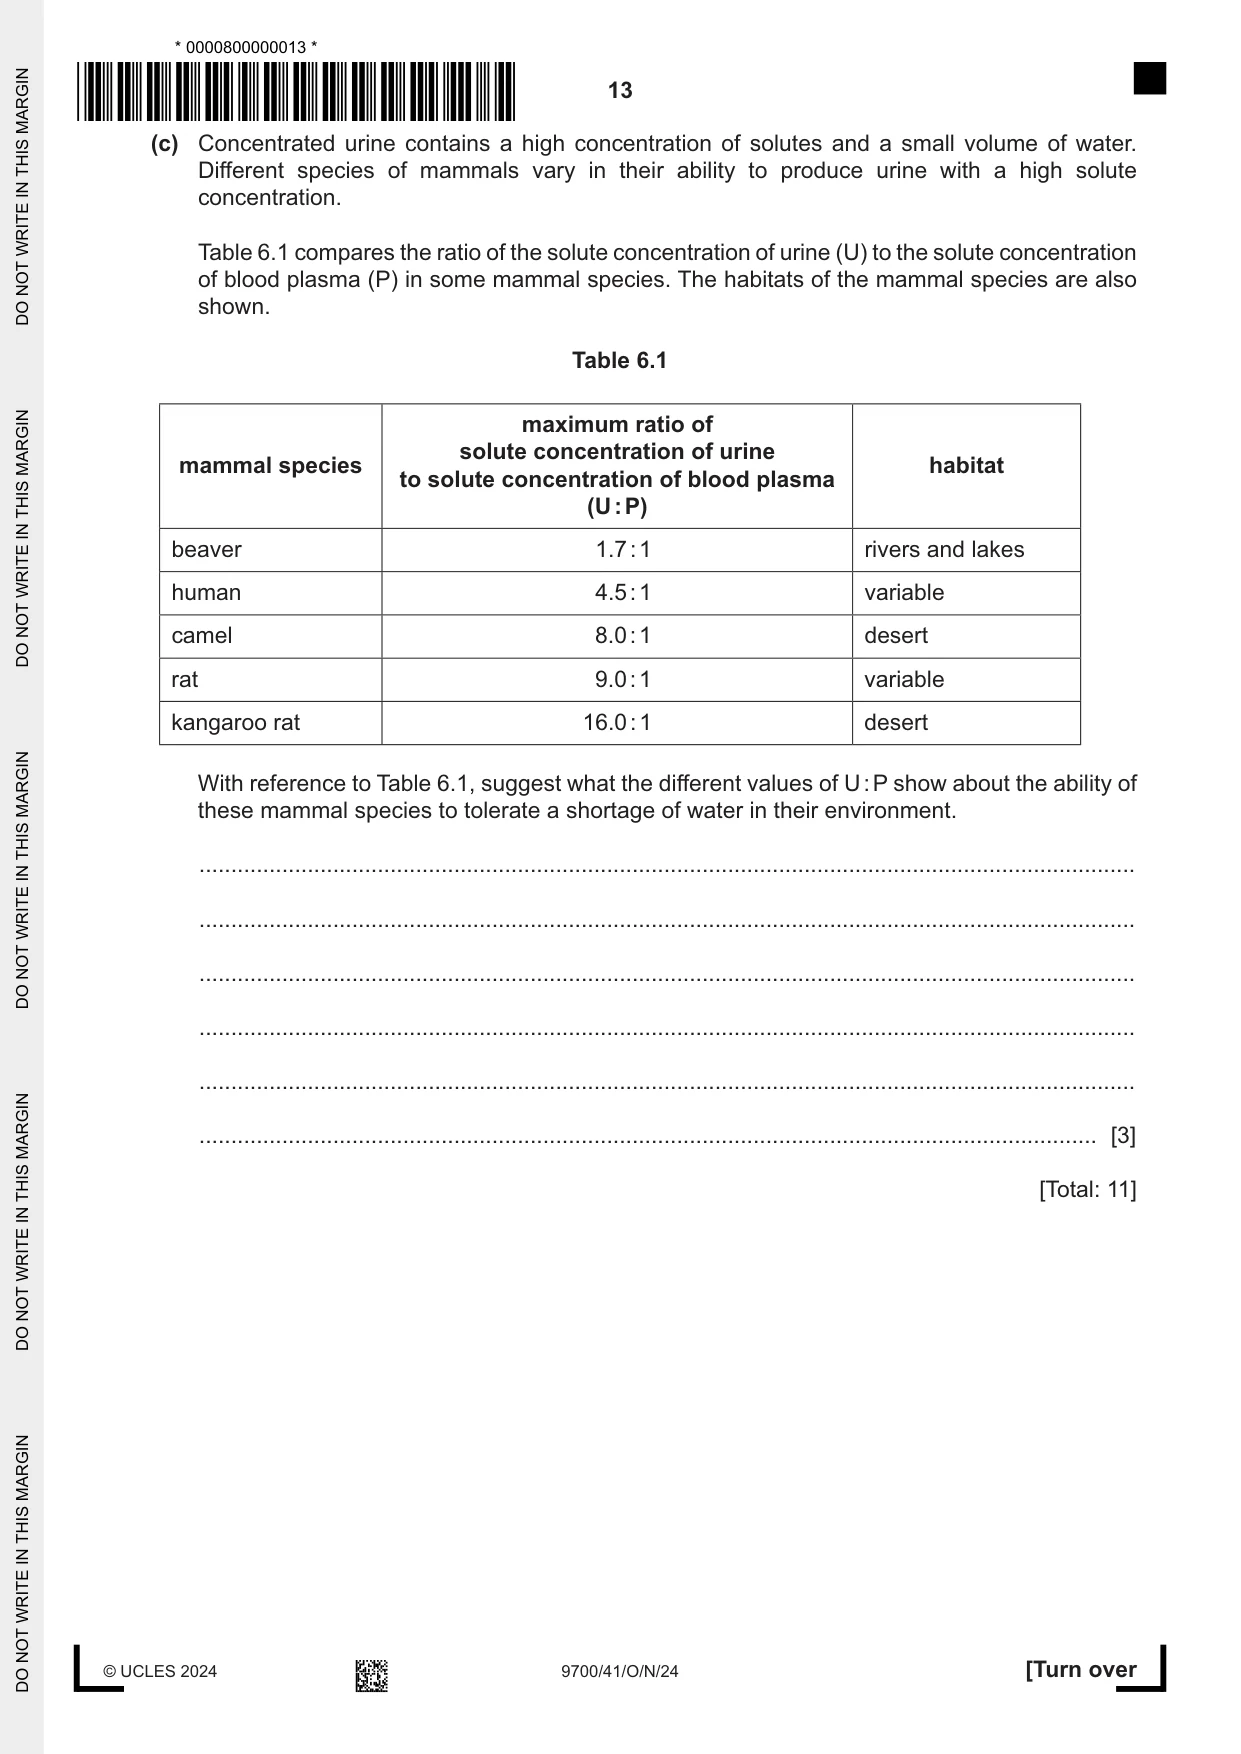
6 The mammalian kidney is responsible for: • the excretion of urea • osmoregulation (the homeostatic control of the water potential of the blood). (a) (i) Outline how and where the excretory product urea is made in the body. ........................................................................................................................................... ........................................................................................................................................... ..................................................................................................................................... [2] (ii) Homeostatic control of the water potential of blood includes receptors, effectors and target cells. Identify the names and locations of these components of homeostatic control in osmoregulation. ........................................................................................................................................... ........................................................................................................................................... ........................................................................................................................................... ........................................................................................................................................... ........................................................................................................................................... ..................................................................................................................................... [3] (b) The glomerulus and Bowman’s capsule of the nephron are important in the formation of urine. Outline the role of the glomerulus and Bowman’s capsule in the formation of urine. ................................................................................................................................................... ................................................................................................................................................... ................................................................................................................................................... ................................................................................................................................................... ................................................................................................................................................... ................................................................................................................................................... ................................................................................................................................................... ............................................................................................................................................. [3] (c) Concentrated urine contains a high concentration of solutes and a small volume of water. Different species of mammals vary in their ability to produce urine with a high solute concentration. Table 6.1 compares the ratio of the solute concentration of urine (U) to the solute concentration of blood plasma (P) in some mammal species. The habitats of the mammal species are also shown. Table 6.1 maximum ratio of solute concentration of urine mammal species habitat to solute concentration of blood plasma (U : P) beaver 1.7 : 1 rivers and lakes human 4.5 : 1 variable camel 8.0 : 1 desert rat 9.0 : 1 variable kangaroo rat 16.0 : 1 desert With reference to Table 6.1, suggest what the different values of U : P show about the ability of these mammal species to tolerate a shortage of water in their environment. ................................................................................................................................................... ................................................................................................................................................... ................................................................................................................................................... ................................................................................................................................................... ................................................................................................................................................... ............................................................................................................................................. [3] [Total: 11]
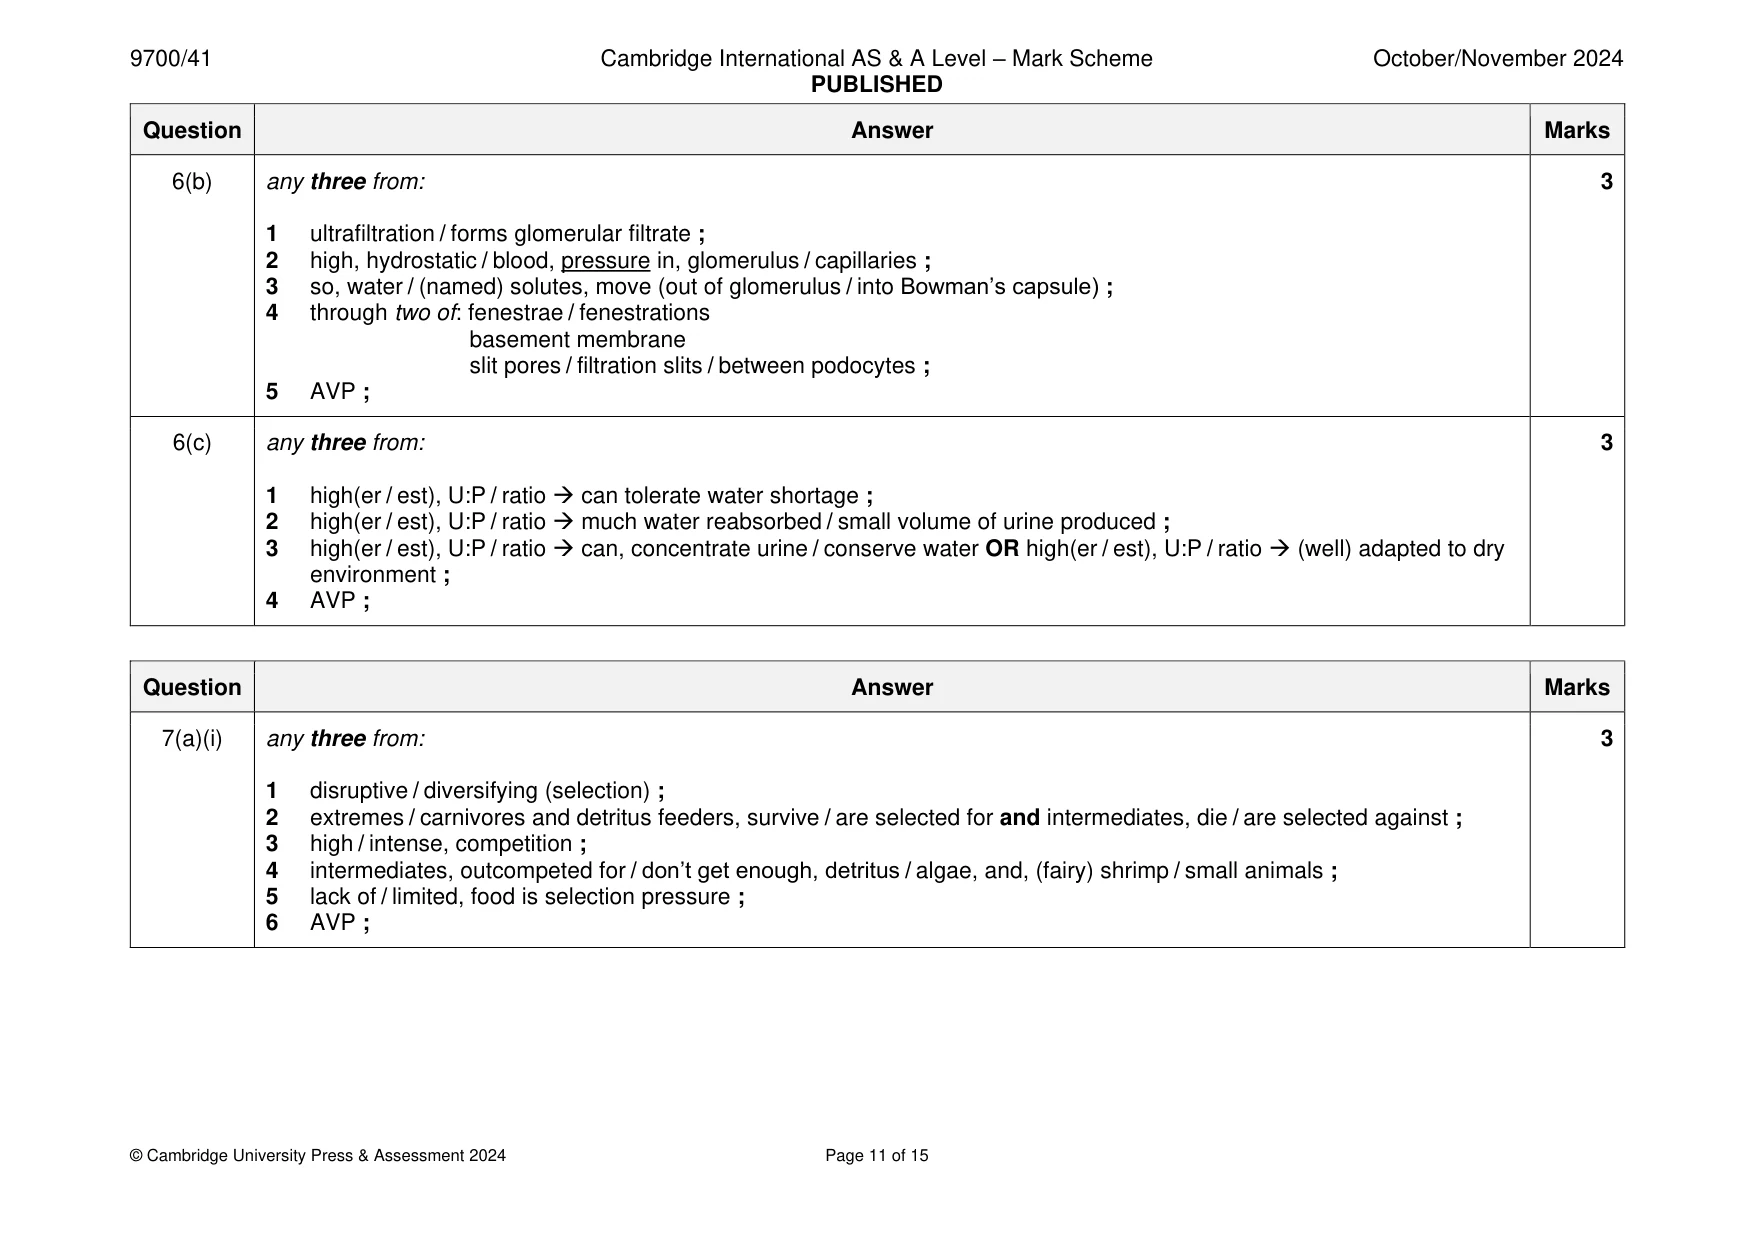
Mark scheme: 6(a)(i) 1 (excess) amino acids, deaminated / have amino group removed ; 2 2 in the liver ; 6(a)(ii) any three from: 3 1 osmoreceptors in hypothalamus (detect change / are receptors) ; 2 effector(s): collecting duct / distal convoluted tubule / nephron ; 3 target cells: collecting duct (cells) ; 6(b) any three from: 3 1 ultrafiltration / forms glomerular filtrate ; 2 high, hydrostatic / blood, pressure in, glomerulus / capillaries ; 3 so, water / (named) solutes, move (out of glomerulus / into Bowman’s capsule) ; 4 through two of: fenestrae / fenestrations basement membrane slit pores / filtration slits / between podocytes ; 5 AVP ; 6(c) any three from: 3 1 high(er / est), U:P / ratio → can tolerate water shortage ; 2 high(er / est), U:P / ratio → much water reabsorbed / small volume of urine produced ; 3 high(er / est), U:P / ratio → can, concentrate urine / conserve water OR high(er / est), U:P / ratio → (well) adapted to dry environment ; 4 AVP ;
Q7 · Spea multiplicata is one of several species of American spadefoot toad
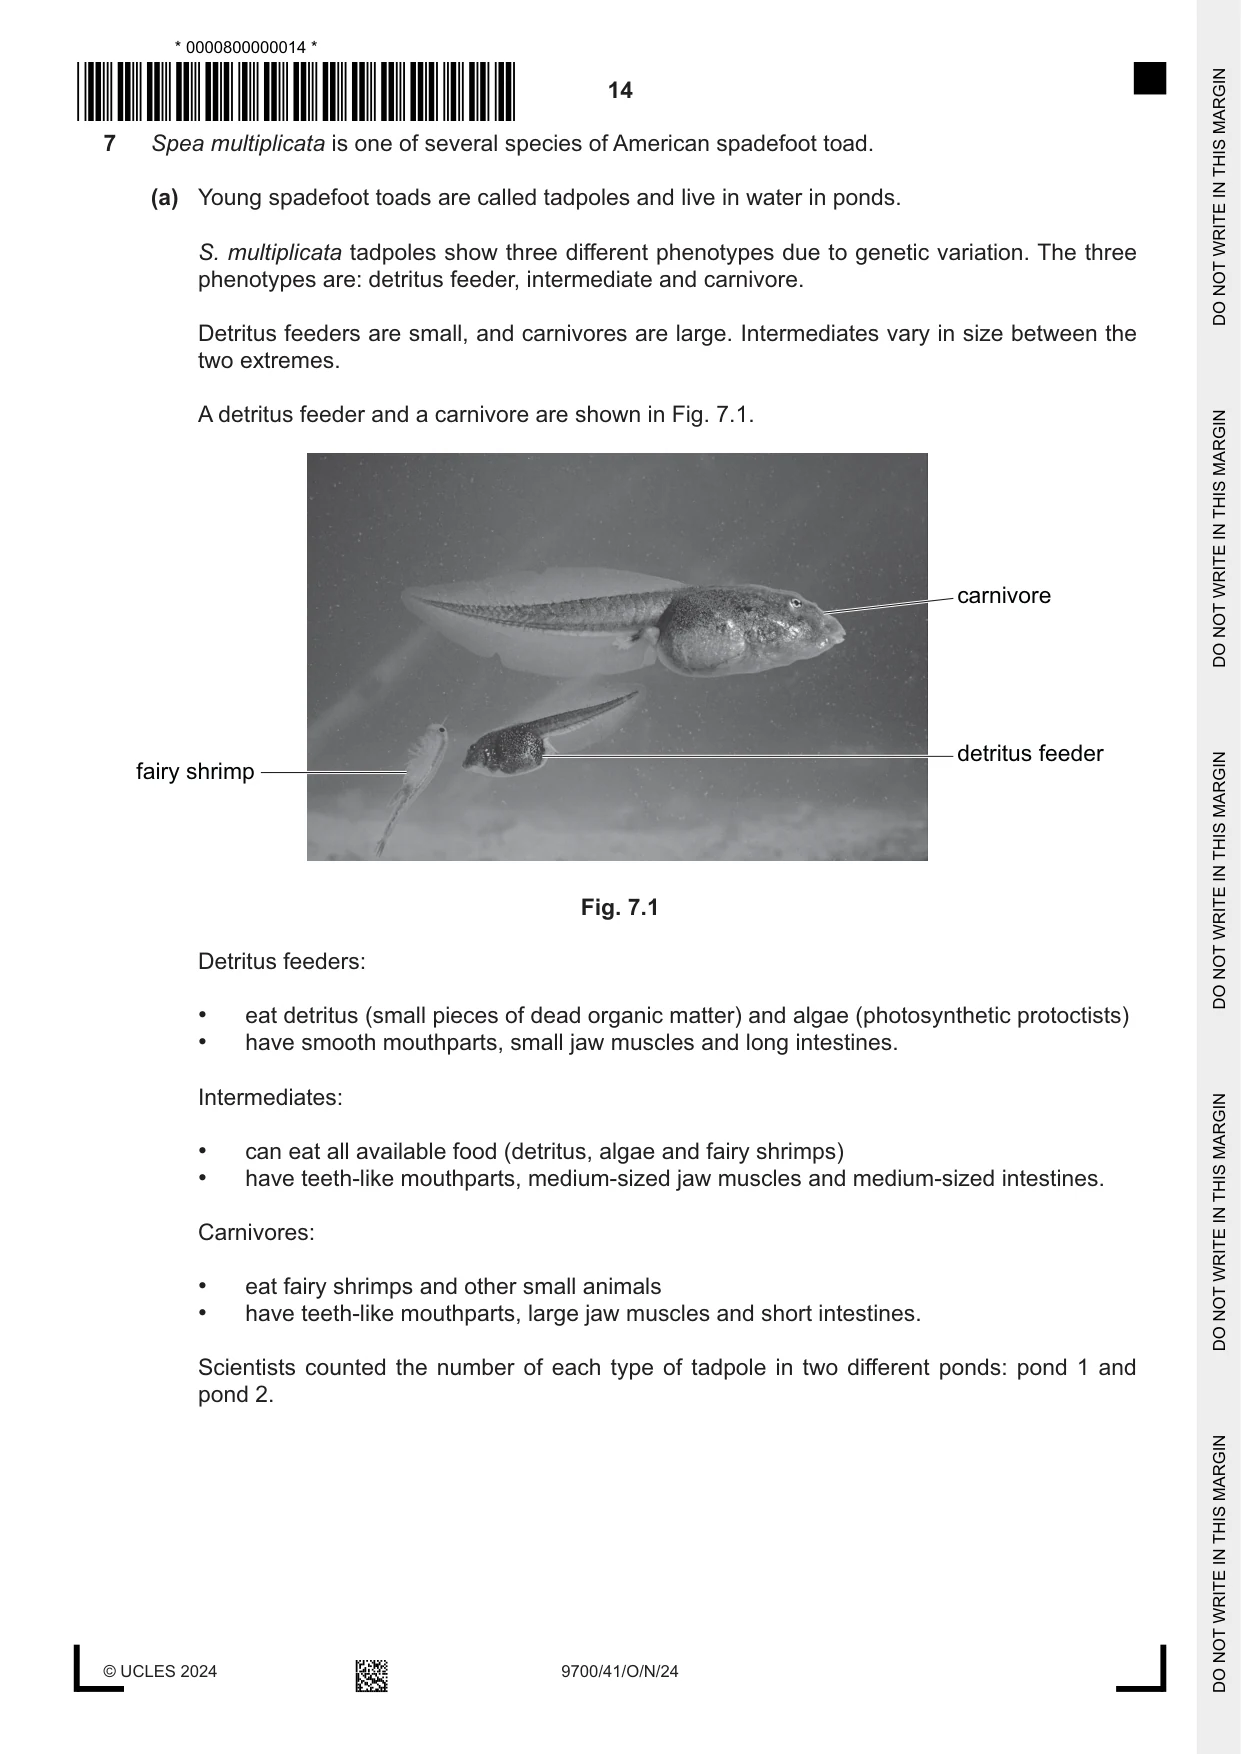
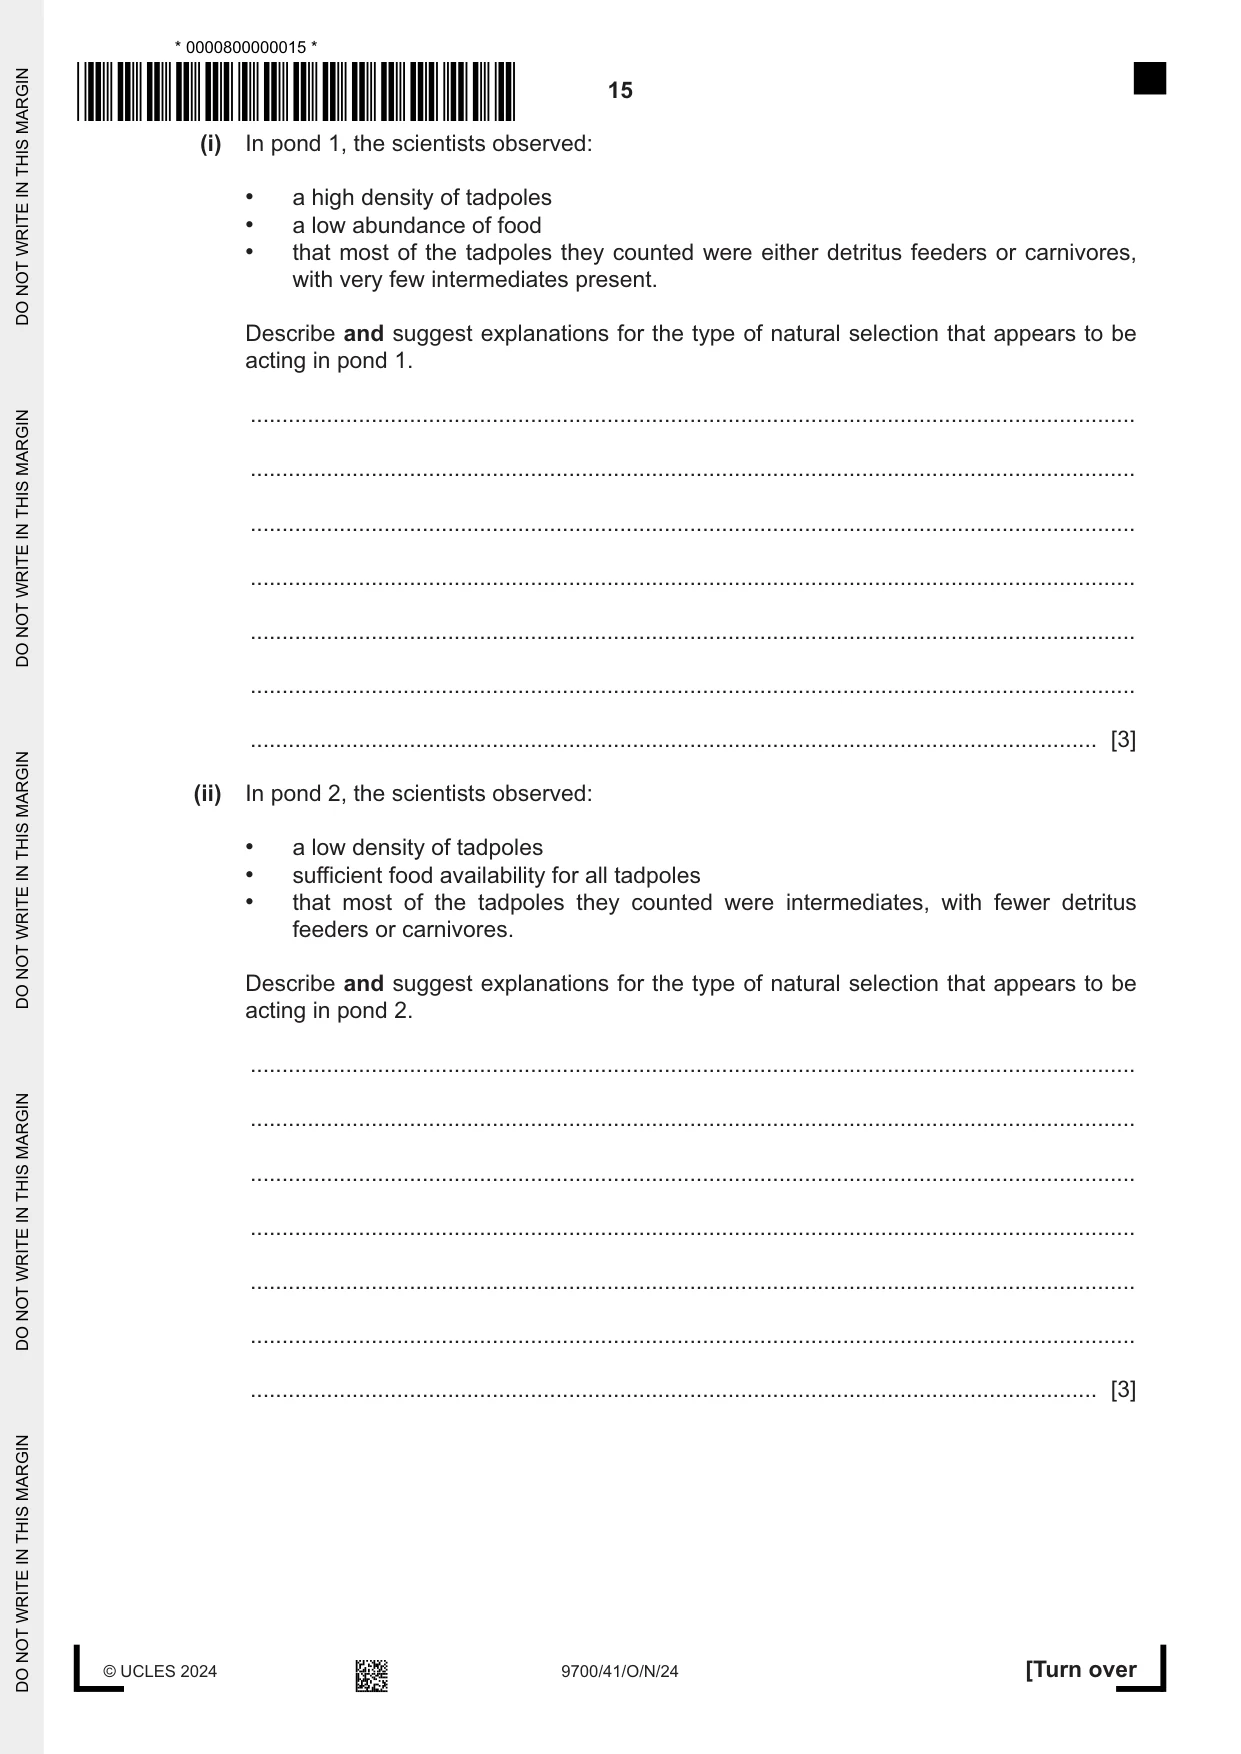
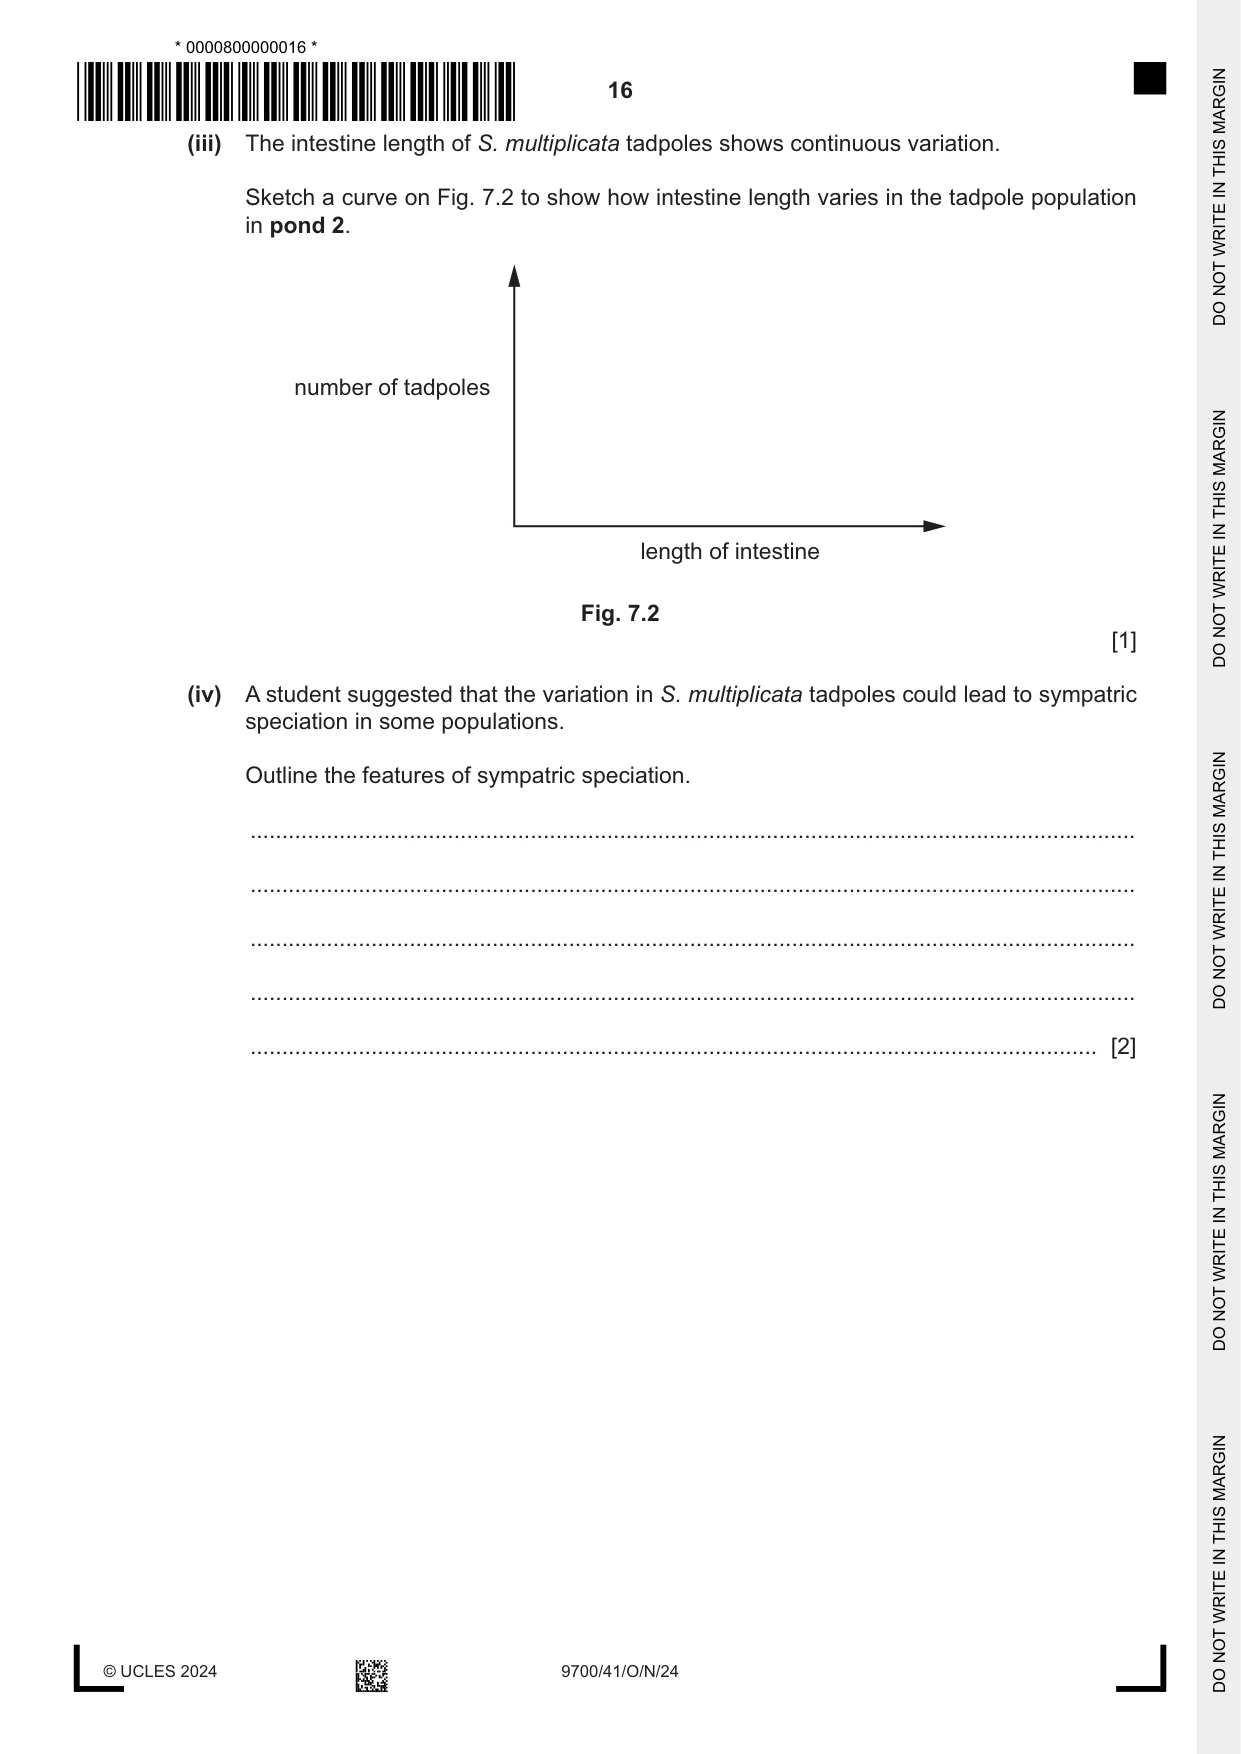
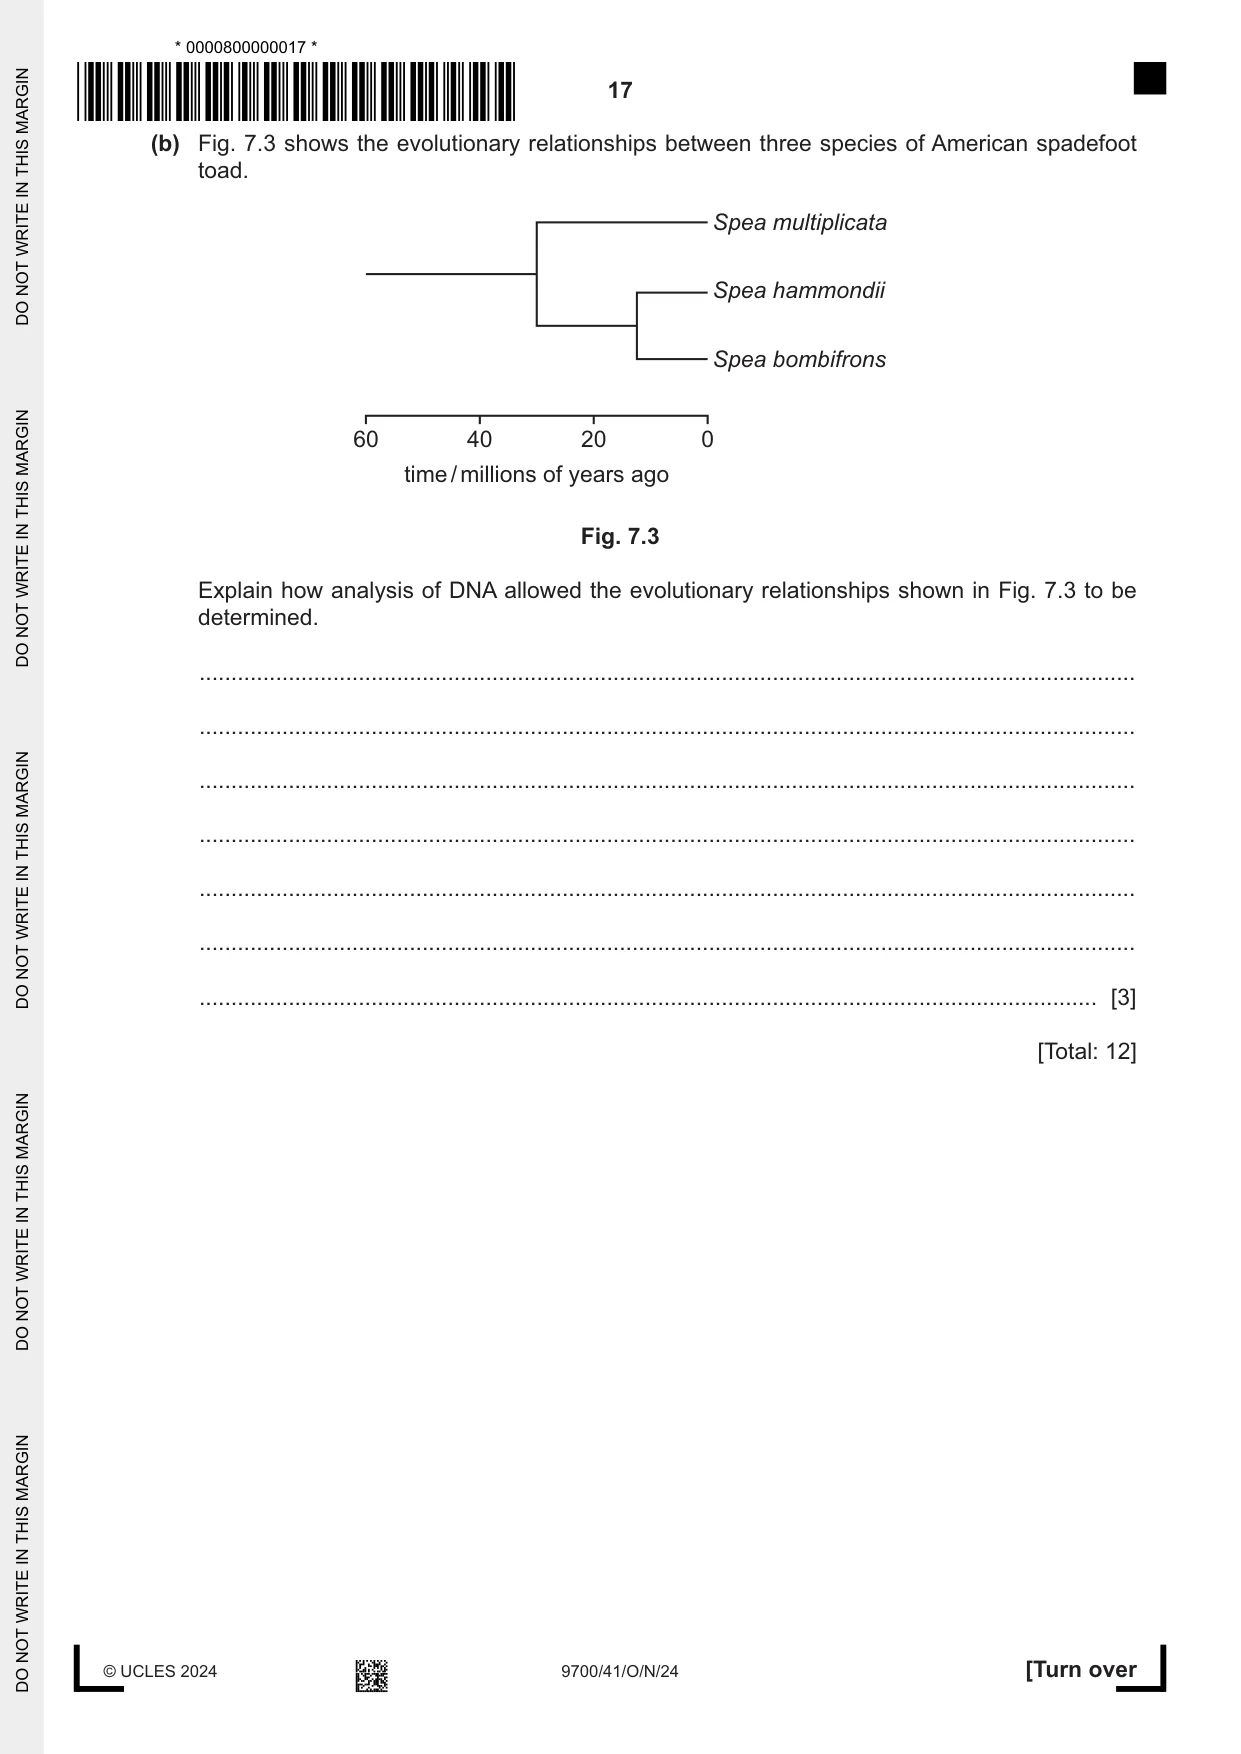
7 Spea multiplicata is one of several species of American spadefoot toad. (a) Young spadefoot toads are called tadpoles and live in water in ponds. S. multiplicata tadpoles show three different phenotypes due to genetic variation. The three phenotypes are: detritus feeder, intermediate and carnivore. Detritus feeders are small, and carnivores are large. Intermediates vary in size between the two extremes. A detritus feeder and a carnivore are shown in Fig. 7.1. carnivore detritus feeder fairy shrimp Fig. 7.1 Detritus feeders: • eat detritus (small pieces of dead organic matter) and algae (photosynthetic protoctists) • have smooth mouthparts, small jaw muscles and long intestines. Intermediates: • can eat all available food (detritus, algae and fairy shrimps) • have teeth‑like mouthparts, medium‑sized jaw muscles and medium‑sized intestines. Carnivores: • eat fairy shrimps and other small animals • have teeth‑like mouthparts, large jaw muscles and short intestines. Scientists counted the number of each type of tadpole in two different ponds: pond 1 and pond 2. (i) In pond 1, the scientists observed: • a high density of tadpoles • a low abundance of food • that most of the tadpoles they counted were either detritus feeders or carnivores, with very few intermediates present. Describe and suggest explanations for the type of natural selection that appears to be acting in pond 1. ........................................................................................................................................... ........................................................................................................................................... ........................................................................................................................................... ........................................................................................................................................... ........................................................................................................................................... ........................................................................................................................................... ..................................................................................................................................... [3] (ii) In pond 2, the scientists observed: • a low density of tadpoles • sufficient food availability for all tadpoles • that most of the tadpoles they counted were intermediates, with fewer detritus feeders or carnivores. Describe and suggest explanations for the type of natural selection that appears to be acting in pond 2. ........................................................................................................................................... ........................................................................................................................................... ........................................................................................................................................... ........................................................................................................................................... ........................................................................................................................................... ........................................................................................................................................... ..................................................................................................................................... [3] (iii) The intestine length of S. multiplicata tadpoles shows continuous variation. Sketch a curve on Fig. 7.2 to show how intestine length varies in the tadpole population in pond 2. number of tadpoles length of intestine Fig. 7.2 [1] (iv) A student suggested that the variation in S. multiplicata tadpoles could lead to sympatric speciation in some populations. Outline the features of sympatric speciation. ........................................................................................................................................... ........................................................................................................................................... ........................................................................................................................................... ........................................................................................................................................... ..................................................................................................................................... [2] (b) Fig. 7.3 shows the evolutionary relationships between three species of American spadefoot toad. Spea multiplicata Spea hammondii Spea bombifrons 60 40 20 0 time / millions of years ago Fig. 7.3 Explain how analysis of DNA allowed the evolutionary relationships shown in Fig. 7.3 to be determined. ................................................................................................................................................... ................................................................................................................................................... ................................................................................................................................................... ................................................................................................................................................... ................................................................................................................................................... ................................................................................................................................................... ............................................................................................................................................. [3] [Total: 12]
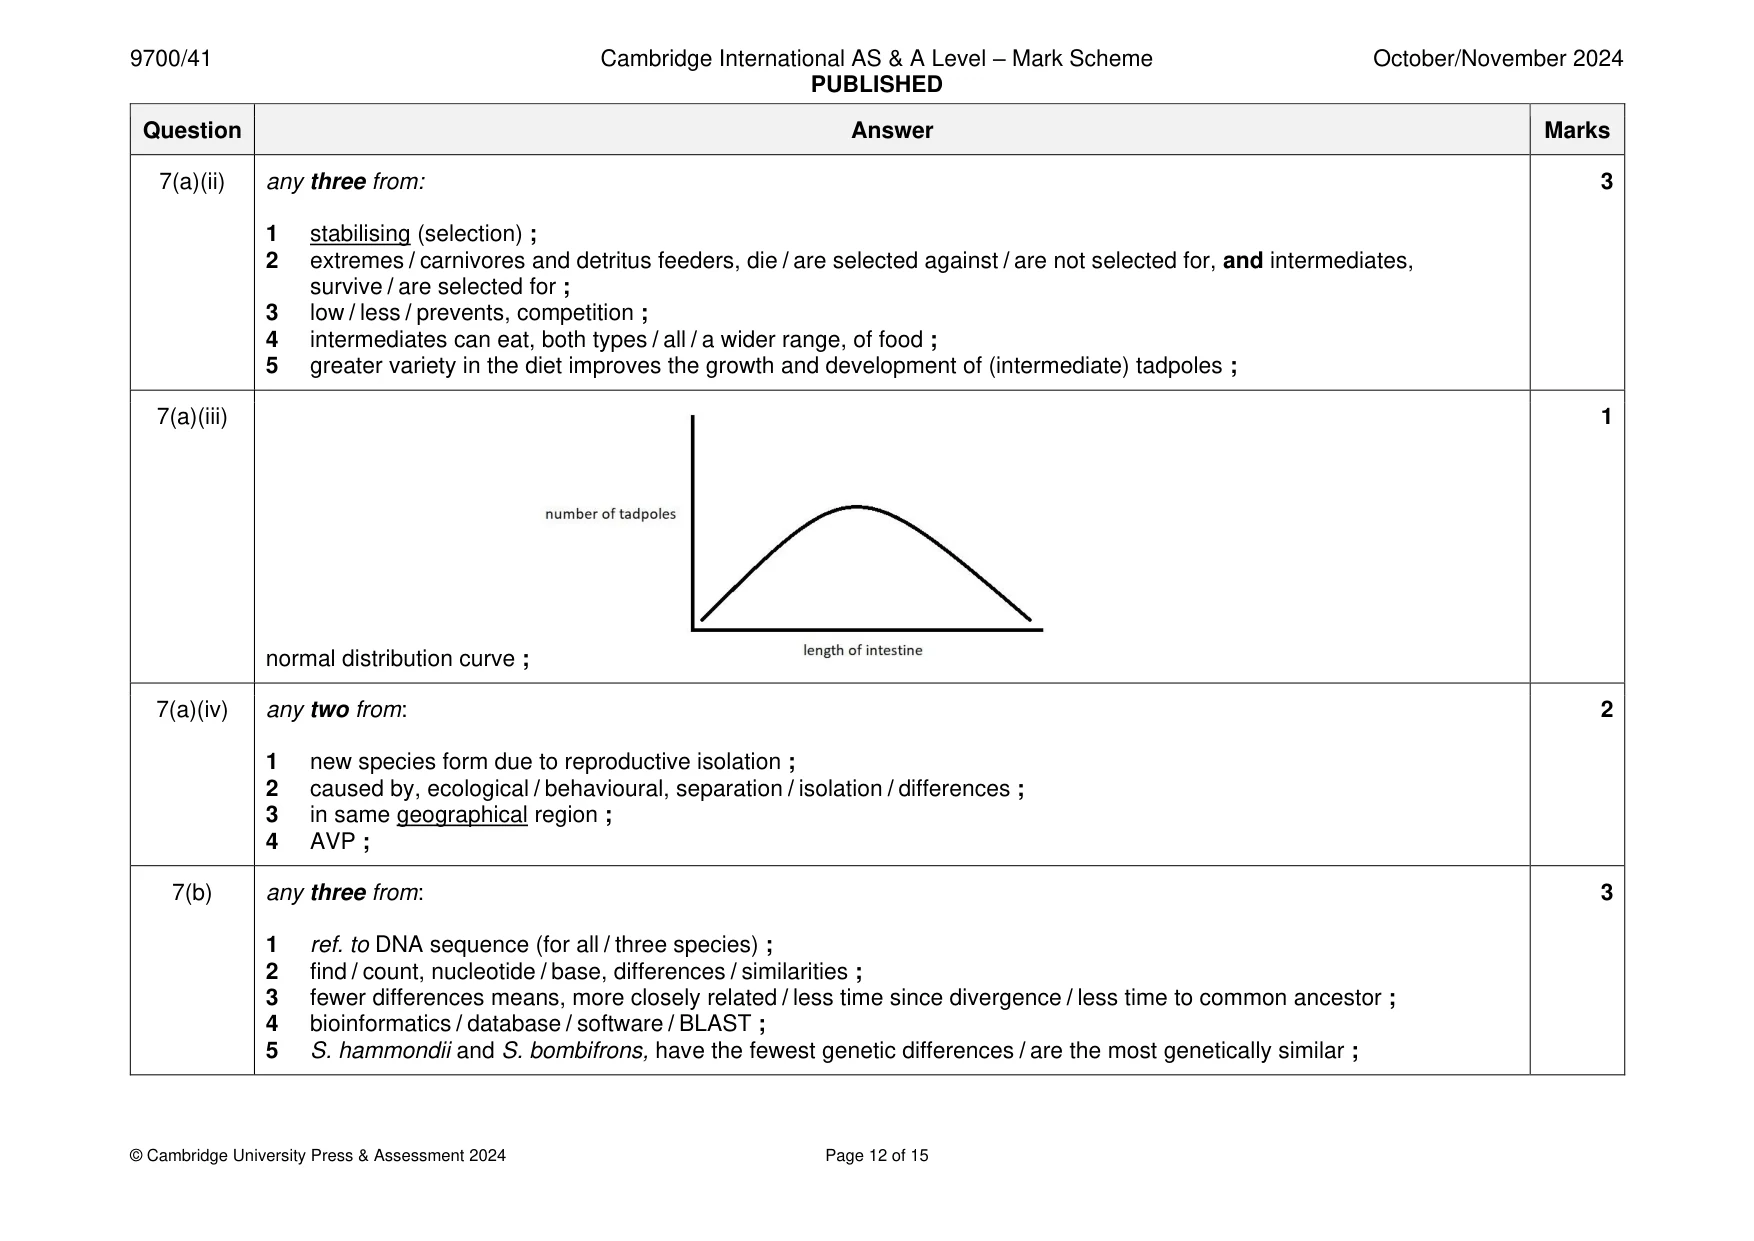
Mark scheme: 7(a)(i) any three from: 3 1 disruptive / diversifying (selection) ; 2 extremes / carnivores and detritus feeders, survive / are selected for and intermediates, die / are selected against ; 3 high / intense, competition ; 4 intermediates, outcompeted for / don’t get enough, detritus / algae, and, (fairy) shrimp / small animals ; 5 lack of / limited, food is selection pressure ; 6 AVP ; 7(a)(ii) any three from: 3 1 stabilising (selection) ; 2 extremes / carnivores and detritus feeders, die / are selected against / are not selected for, and intermediates, survive / are selected for ; 3 low / less / prevents, competition ; 4 intermediates can eat, both types / all / a wider range, of food ; 5 greater variety in the diet improves the growth and development of (intermediate) tadpoles ; 7(a)(iii) 1 normal distribution curve ; 7(a)(iv) any two from: 2 1 new species form due to reproductive isolation ; 2 caused by, ecological / behavioural, separation / isolation / differences ; 3 in same geographical region ; 4 AVP ; 7(b) any three from: 3 1 ref. to DNA sequence (for all / three species) ; 2 find / count, nucleotide / base, differences / similarities ; 3 fewer differences means, more closely related / less time since divergence / less time to common ancestor ; 4 bioinformatics / database / software / BLAST ; 5 S. hammondii and S. bombifrons, have the fewest genetic differences / are the most genetically similar ;
Q8 · Scientists use many different techniques in genetic engineering
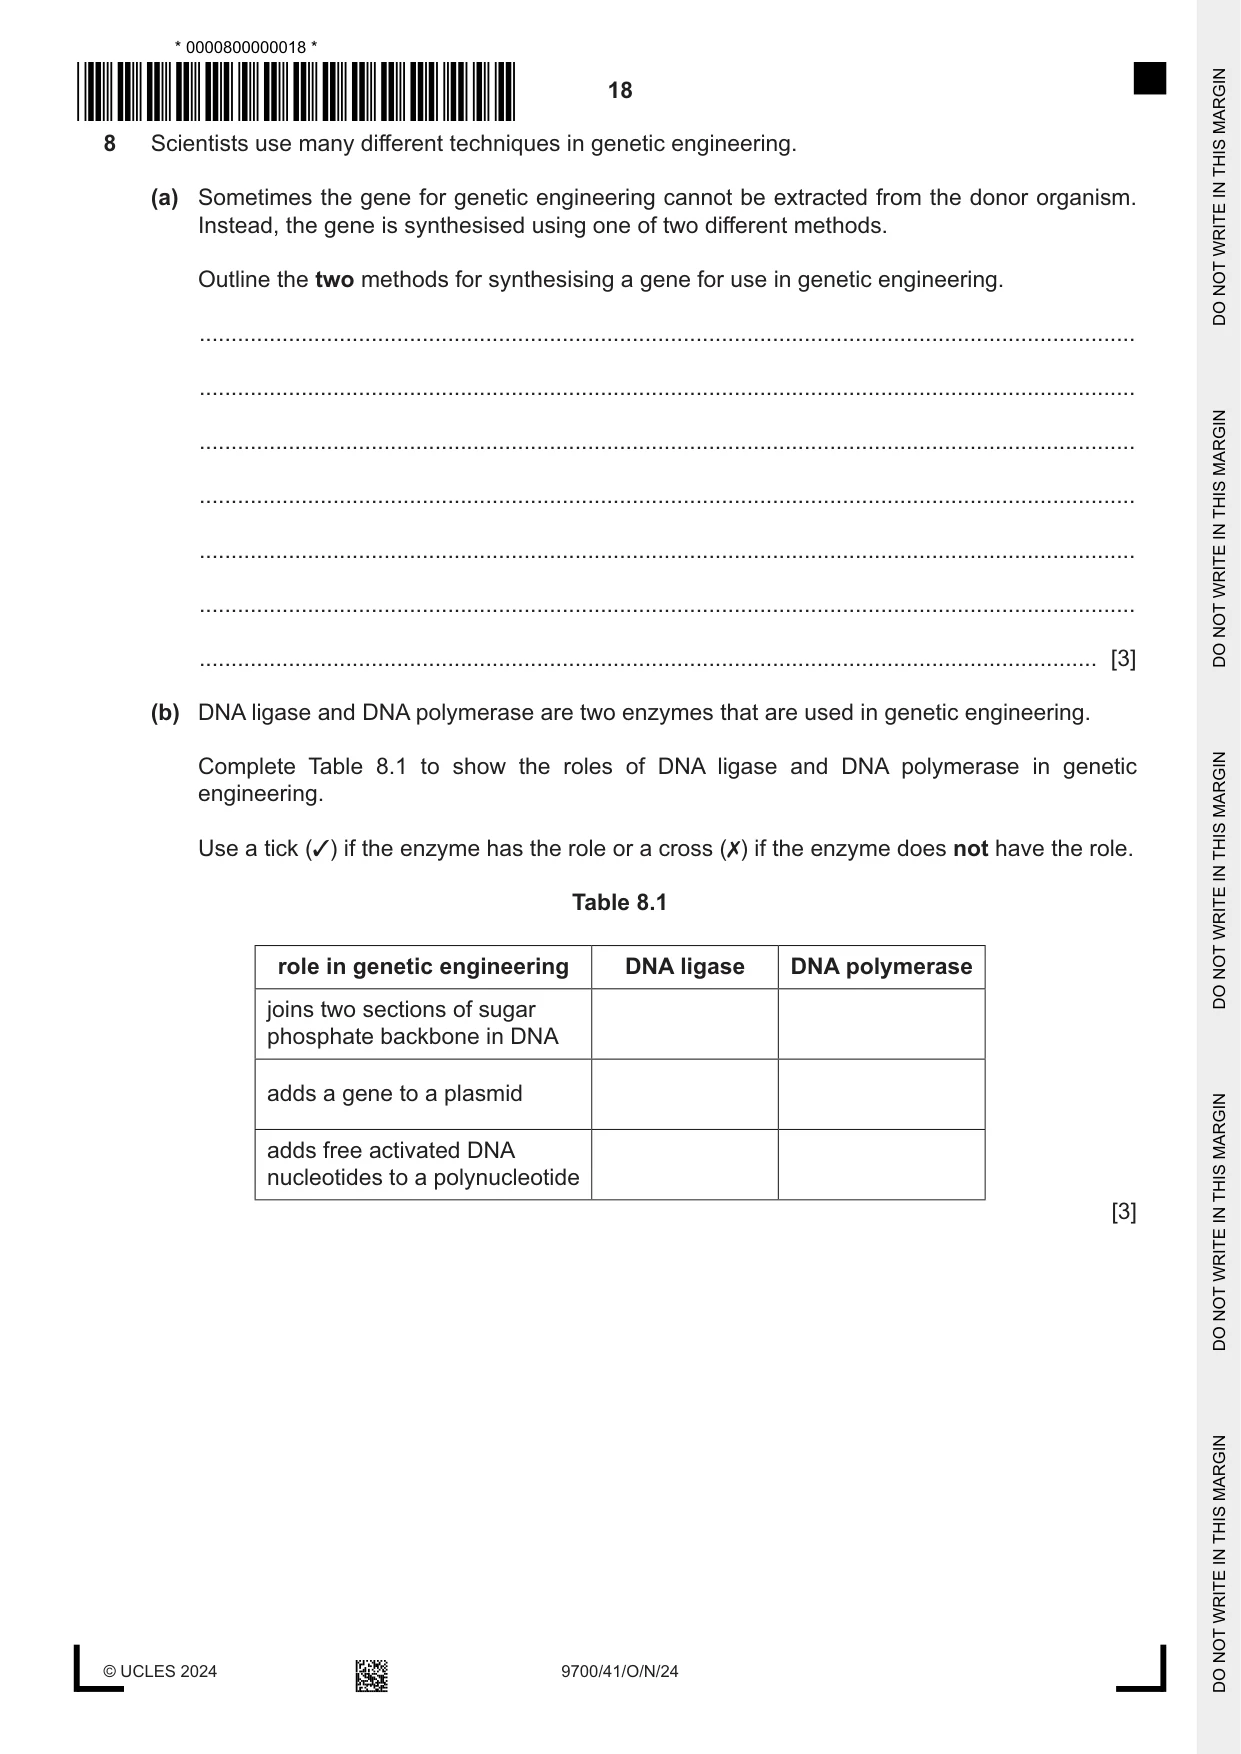
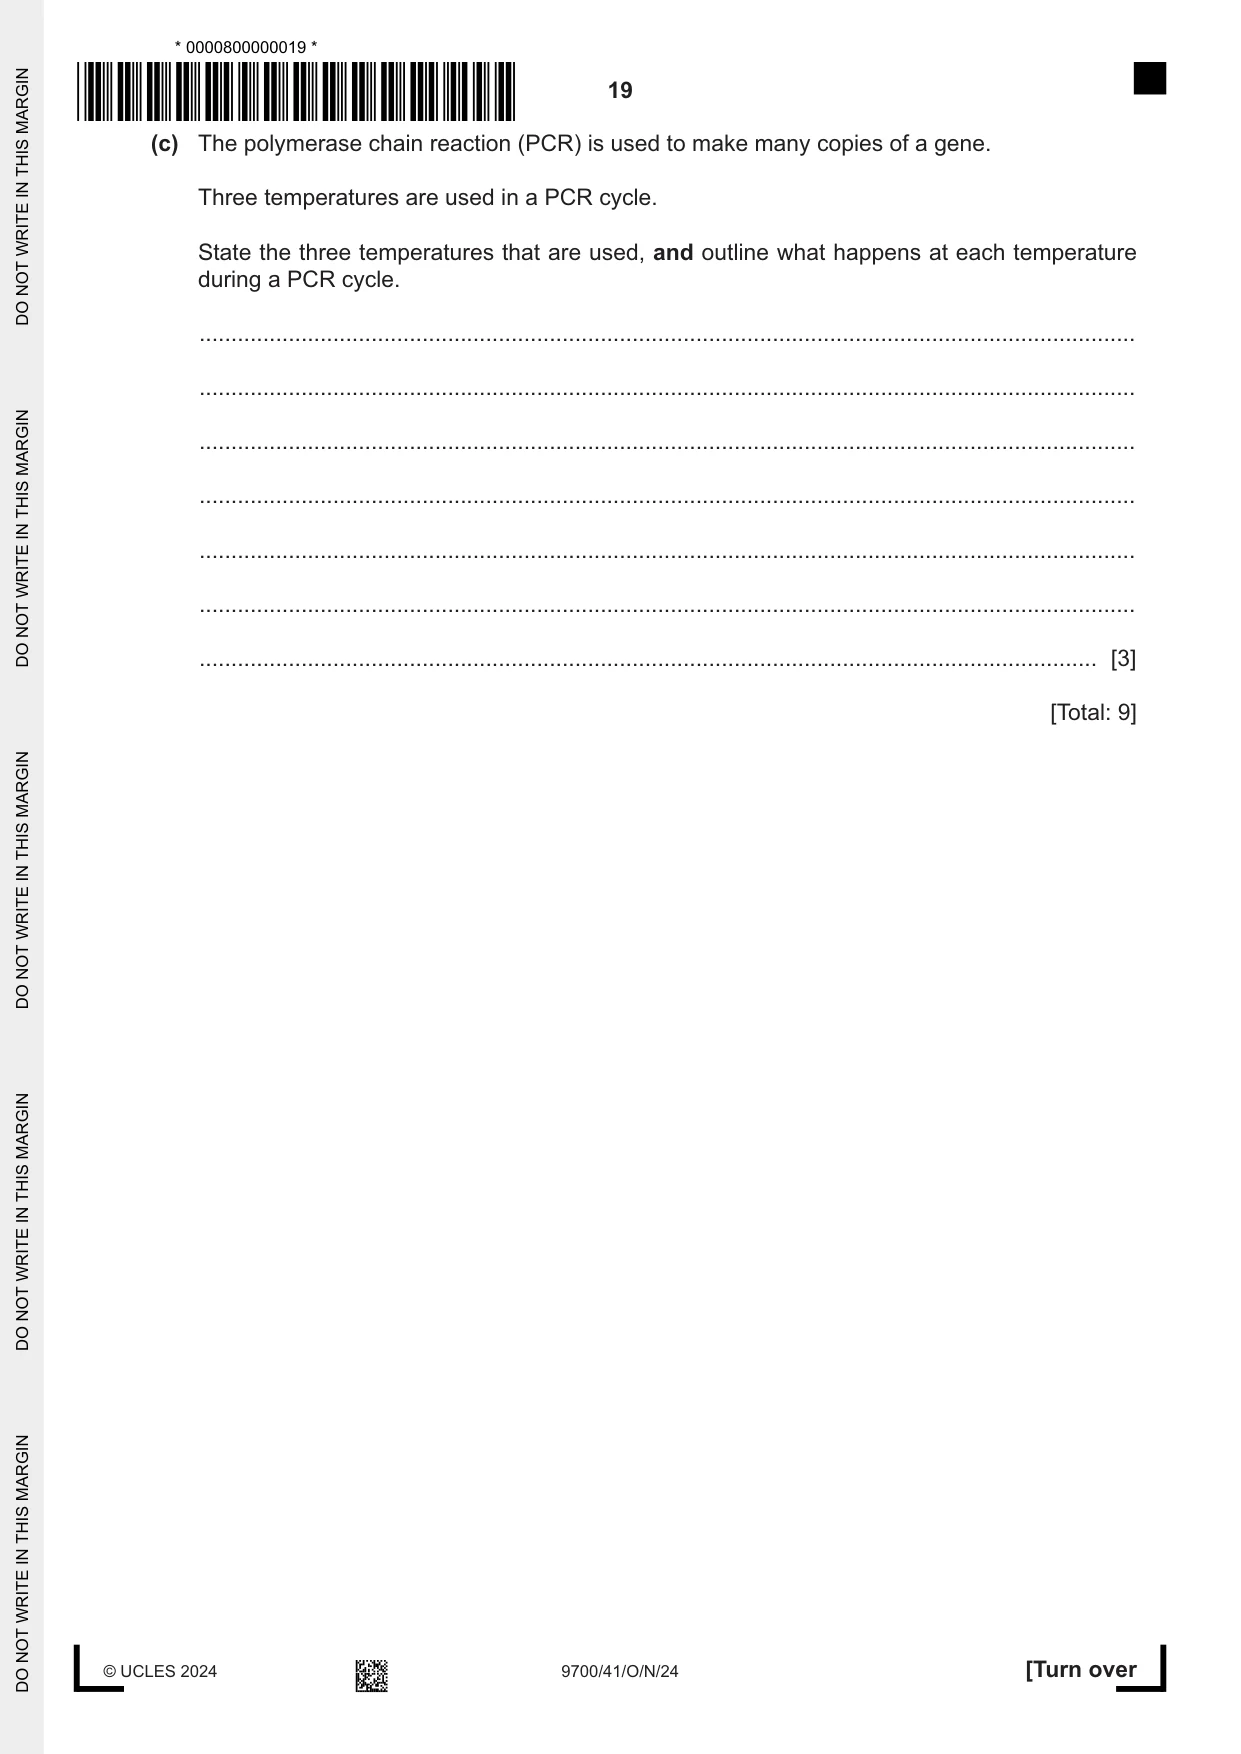
8 Scientists use many different techniques in genetic engineering. (a) Sometimes the gene for genetic engineering cannot be extracted from the donor organism. Instead, the gene is synthesised using one of two different methods. Outline the two methods for synthesising a gene for use in genetic engineering. ................................................................................................................................................... ................................................................................................................................................... ................................................................................................................................................... ................................................................................................................................................... ................................................................................................................................................... ................................................................................................................................................... ............................................................................................................................................. [3] (b) DNA ligase and DNA polymerase are two enzymes that are used in genetic engineering. Complete Table 8.1 to show the roles of DNA ligase and DNA polymerase in genetic engineering. Use a tick (✓) if the enzyme has the role or a cross (✗) if the enzyme does not have the role. Table 8.1 role in genetic engineering DNA ligase DNA polymerase joins two sections of sugar phosphate backbone in DNA adds a gene to a plasmid adds free activated DNA nucleotides to a polynucleotide [3] (c) The polymerase chain reaction (PCR) is used to make many copies of a gene. Three temperatures are used in a PCR cycle. State the three temperatures that are used, and outline what happens at each temperature during a PCR cycle. ................................................................................................................................................... ................................................................................................................................................... ................................................................................................................................................... ................................................................................................................................................... ................................................................................................................................................... ................................................................................................................................................... ............................................................................................................................................. [3] [Total: 9]
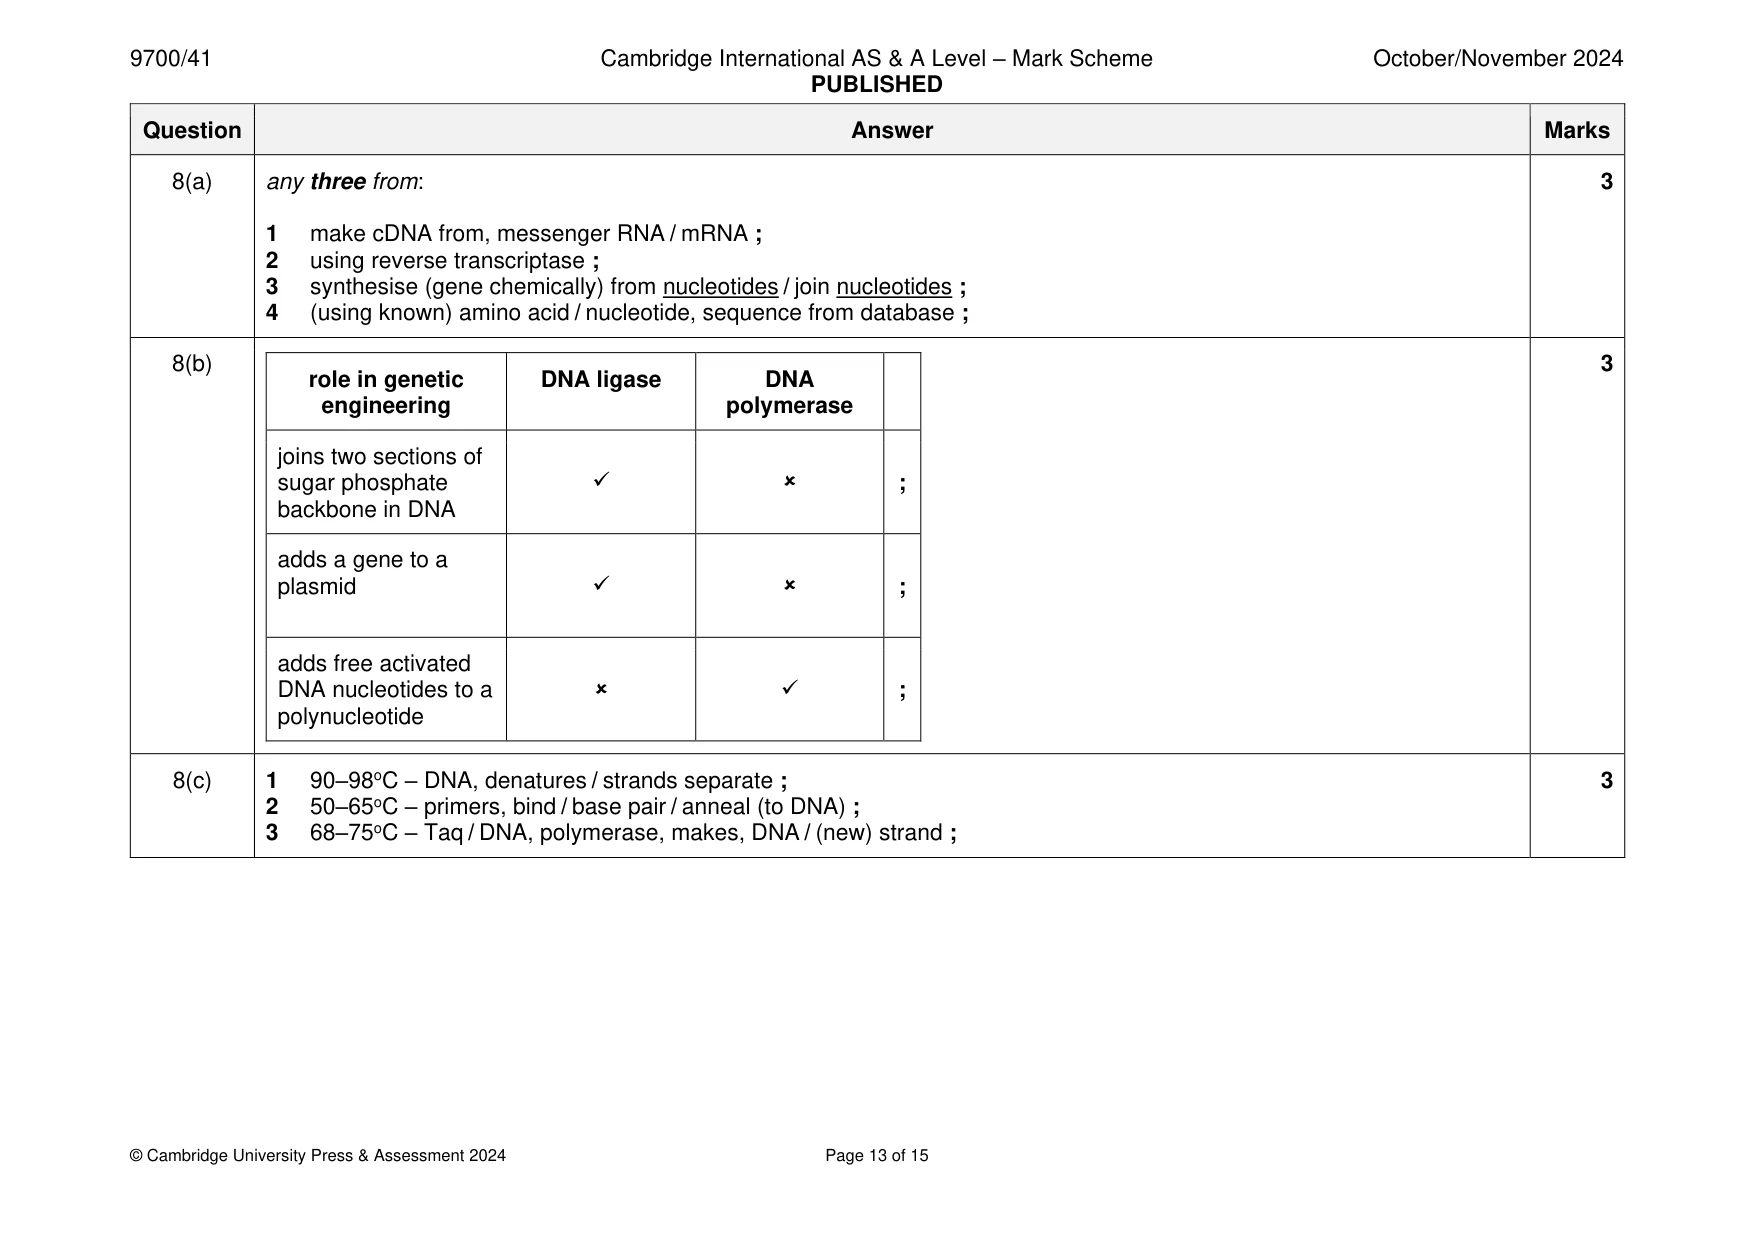
Mark scheme: 8(a) any three from: 3 1 make cDNA from, messenger RNA / mRNA ; 2 using reverse transcriptase ; 3 synthesise (gene chemically) from nucleotides / join nucleotides ; 4 (using known) amino acid / nucleotide, sequence from database ; 8(b) 3 role in genetic DNA ligase DNA engineering polymerase joins two sections of sugar phosphate ✓ ; backbone in DNA adds a gene to a plasmid ✓ ; adds free activated DNA nucleotides to a ✓ ; polynucleotide 8(c) 1 90–98oC – DNA, denatures / strands separate ; 3 2 50–65oC – primers, bind / base pair / anneal (to DNA) ; 3 68–75oC – Taq / DNA, polymerase, makes, DNA / (new) strand ;
Q9 · Lichens are found growing on trees, walls, rocks and soil
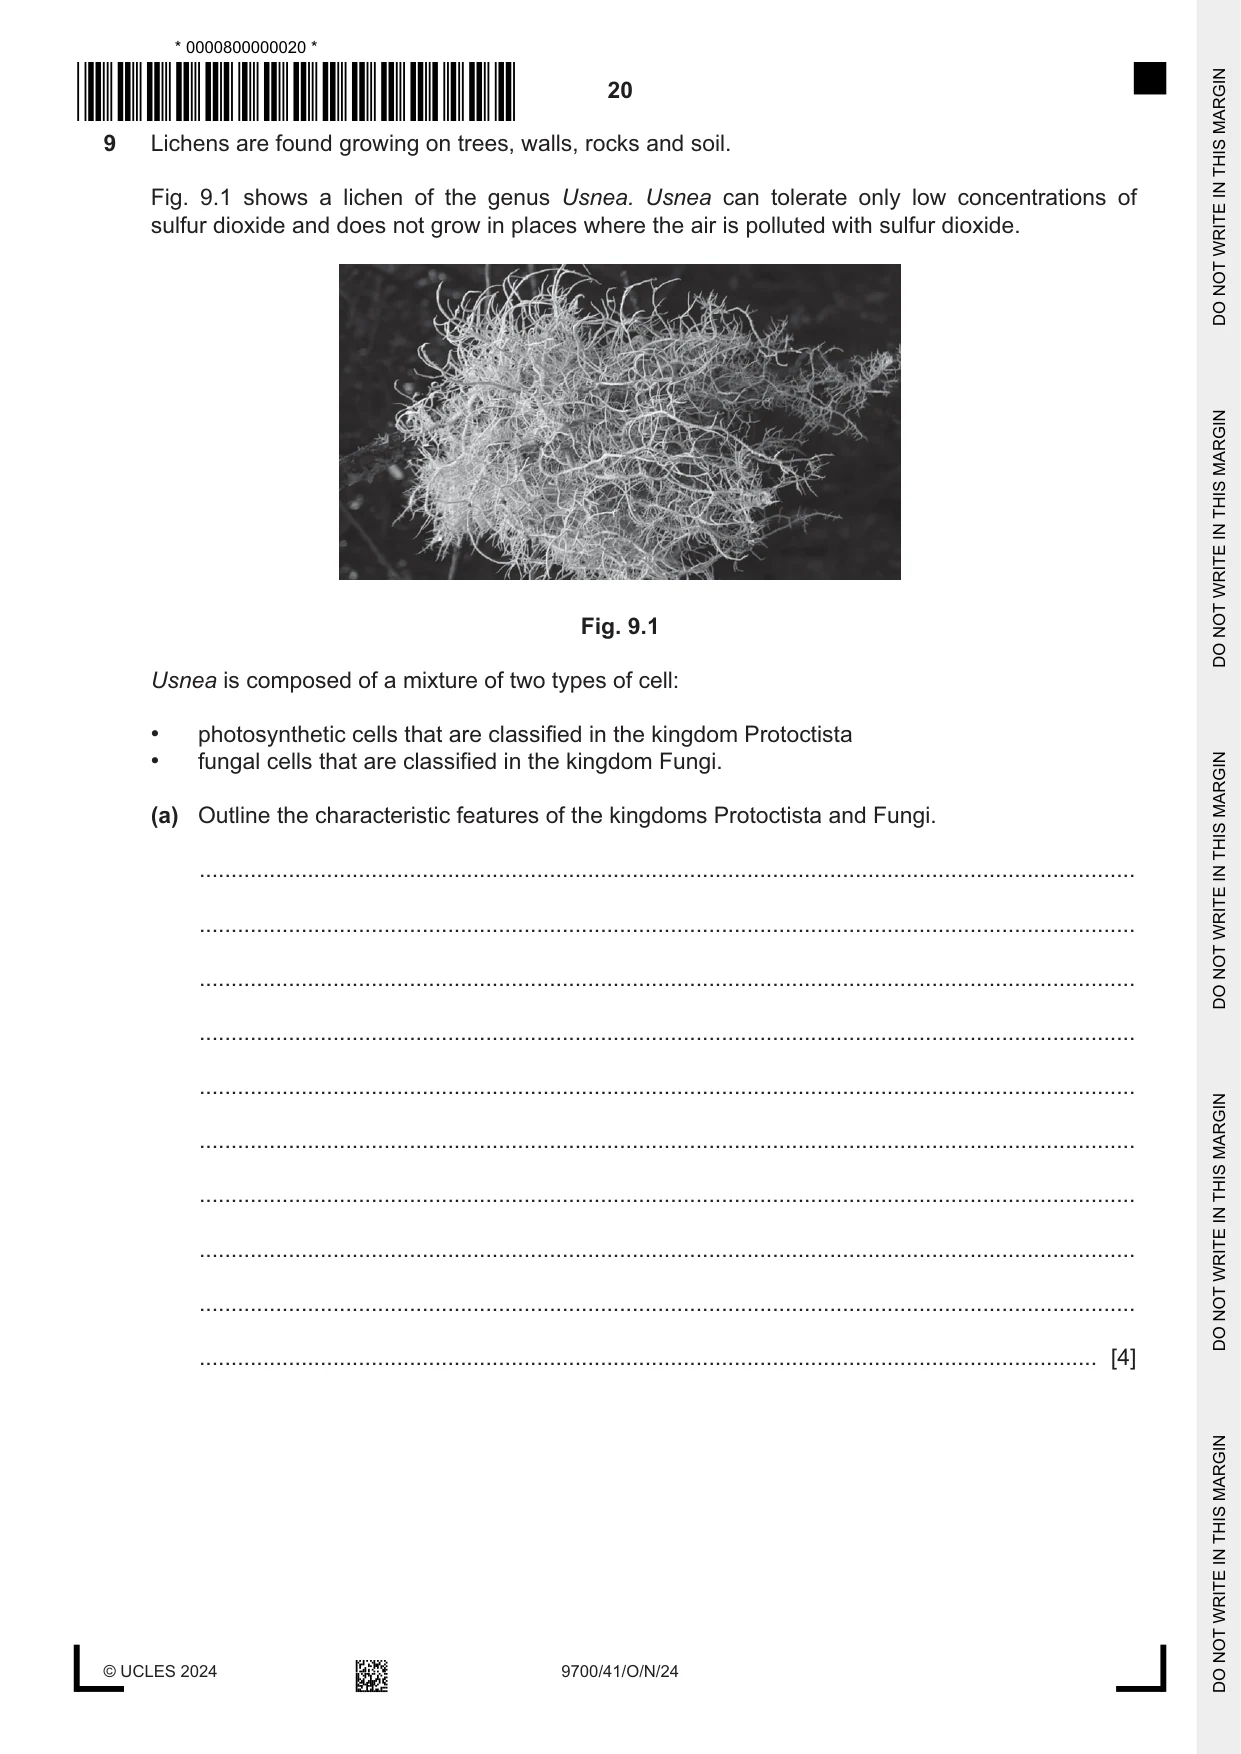
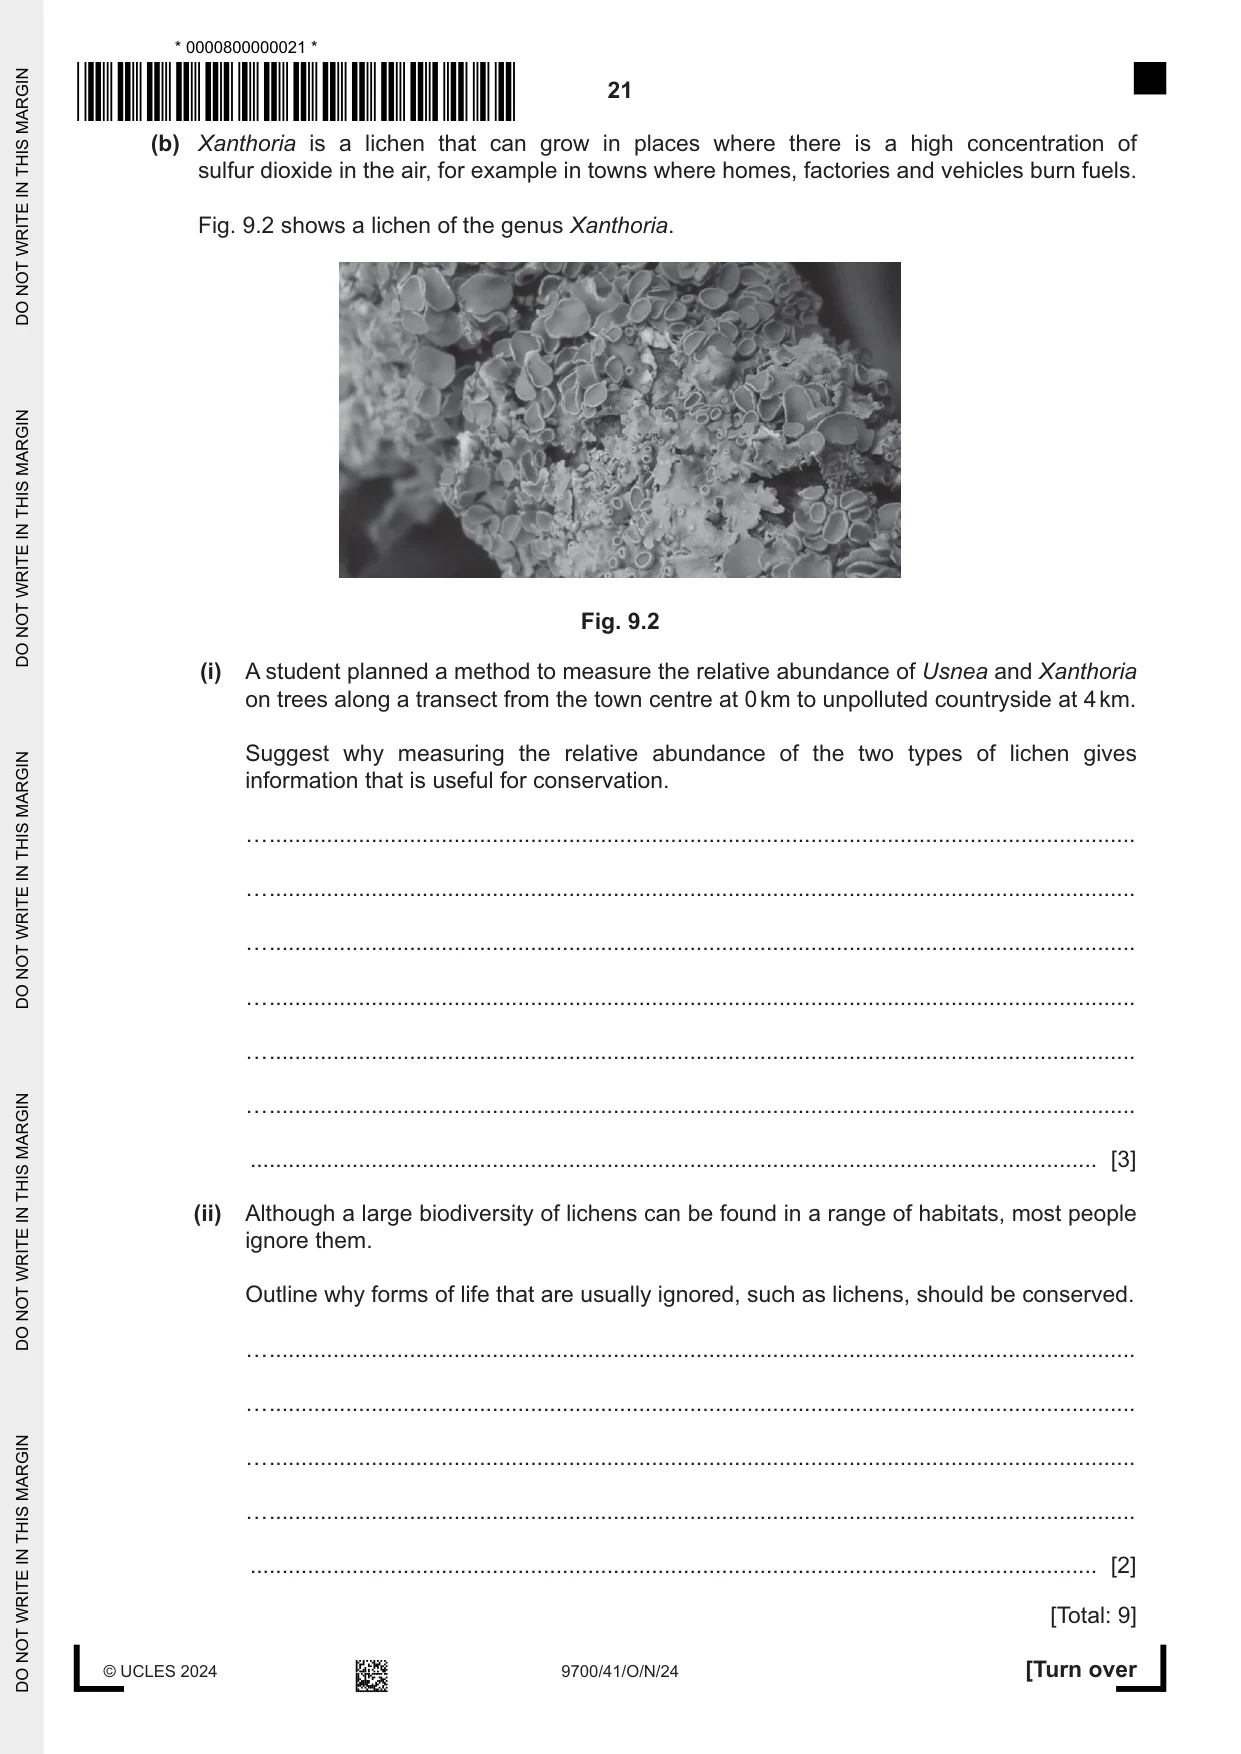
9 Lichens are found growing on trees, walls, rocks and soil. Fig. 9.1 shows a lichen of the genus Usnea. Usnea can tolerate only low concentrations of sulfur dioxide and does not grow in places where the air is polluted with sulfur dioxide. Fig. 9.1 Usnea is composed of a mixture of two types of cell: • photosynthetic cells that are classified in the kingdom Protoctista • fungal cells that are classified in the kingdom Fungi. (a) Outline the characteristic features of the kingdoms Protoctista and Fungi. ................................................................................................................................................... ................................................................................................................................................... ................................................................................................................................................... ................................................................................................................................................... ................................................................................................................................................... ................................................................................................................................................... ................................................................................................................................................... ................................................................................................................................................... ................................................................................................................................................... ............................................................................................................................................. [4] (b) Xanthoria is a lichen that can grow in places where there is a high concentration of sulfur dioxide in the air, for example in towns where homes, factories and vehicles burn fuels. Fig. 9.2 shows a lichen of the genus Xanthoria. Fig. 9.2 (i) A student planned a method to measure the relative abundance of Usnea and Xanthoria on trees along a transect from the town centre at 0 km to unpolluted countryside at 4 km. Suggest why measuring the relative abundance of the two types of lichen gives information that is useful for conservation. … ........................................................................................................................................ … ........................................................................................................................................ … ........................................................................................................................................ … ........................................................................................................................................ … ........................................................................................................................................ … ........................................................................................................................................ ..................................................................................................................................... [3] (ii) Although a large biodiversity of lichens can be found in a range of habitats, most people ignore them. Outline why forms of life that are usually ignored, such as lichens, should be conserved. … ........................................................................................................................................ … ........................................................................................................................................ … ........................................................................................................................................ … ........................................................................................................................................ ..................................................................................................................................... [2] [Total: 9]
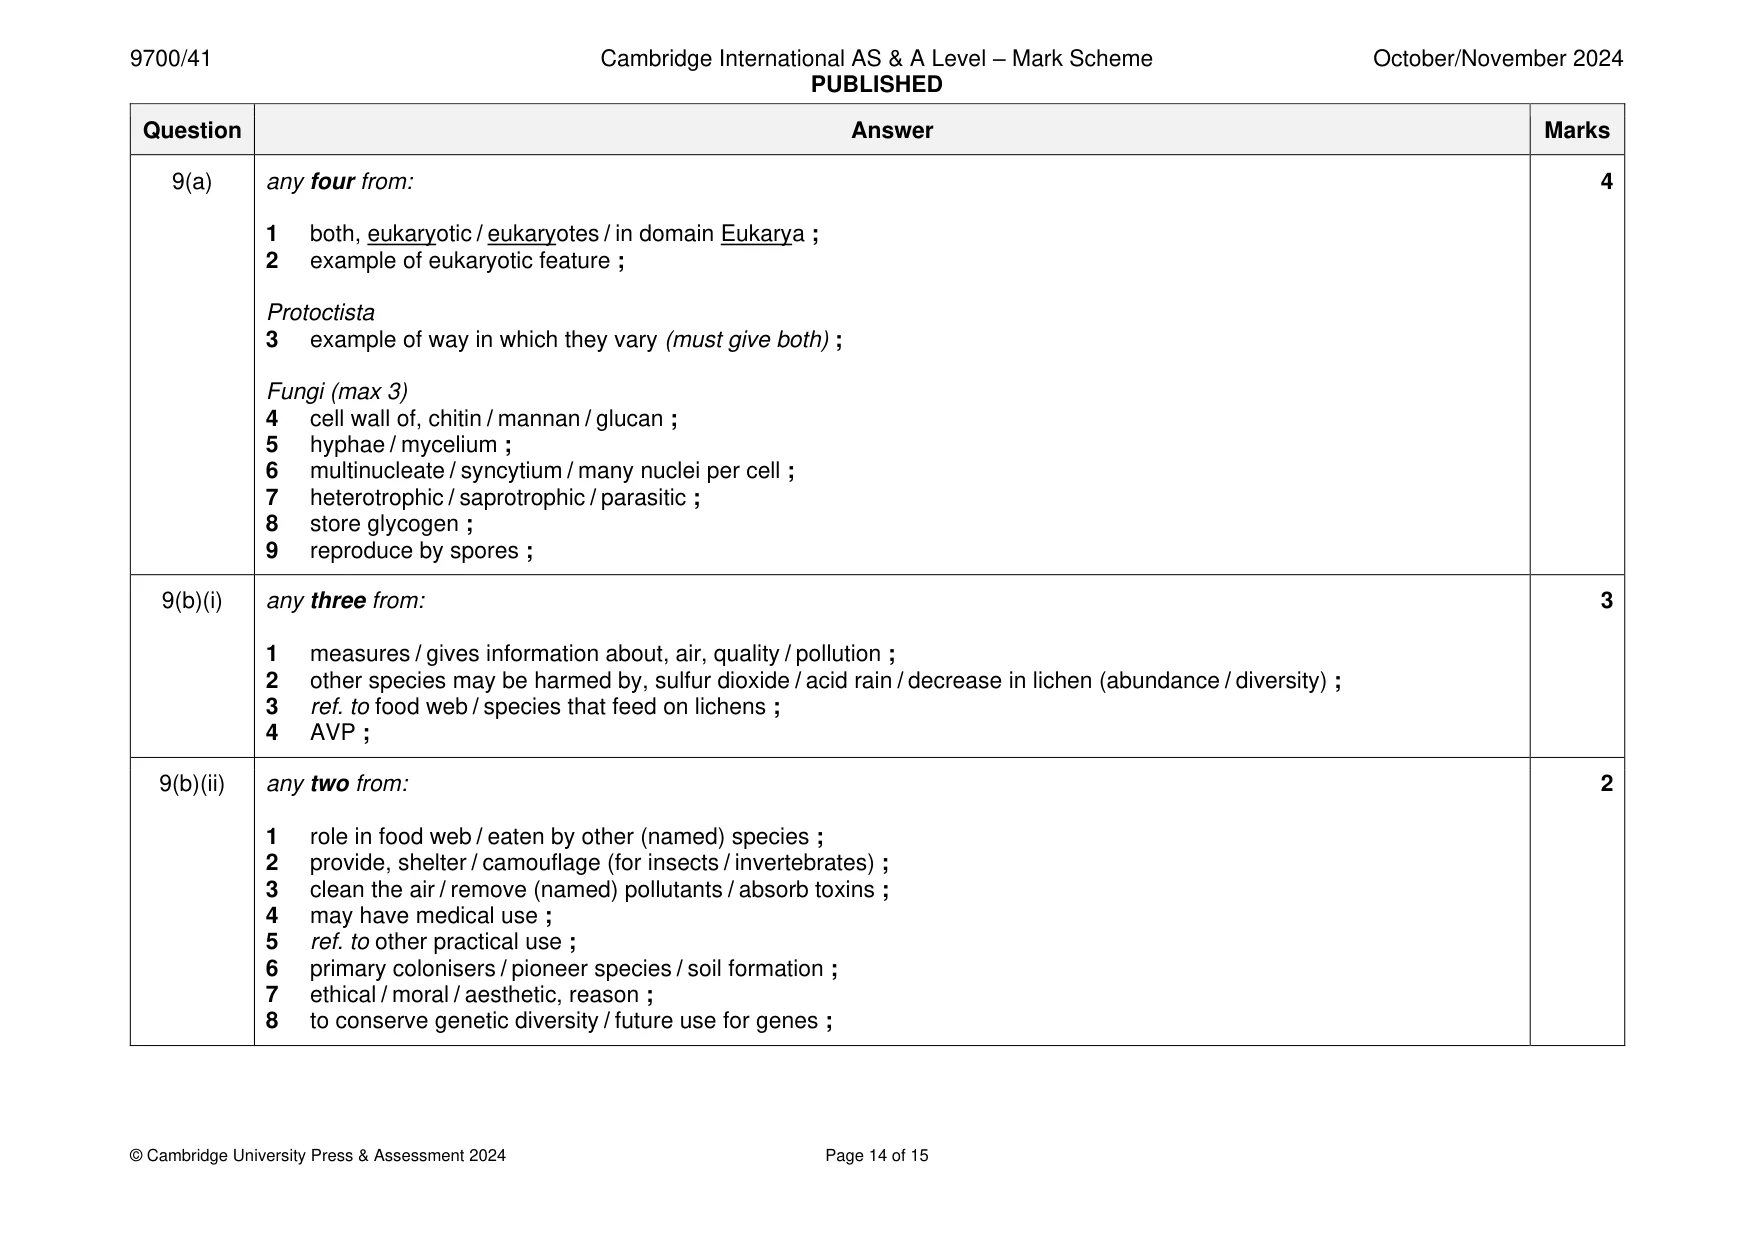
Mark scheme: 9(a) any four from: 4 1 both, eukaryotic / eukaryotes / in domain Eukarya ; 2 example of eukaryotic feature ; Protoctista 3 example of way in which they vary (must give both) ; Fungi (max 3) 4 cell wall of, chitin / mannan / glucan ; 5 hyphae / mycelium ; 6 multinucleate / syncytium / many nuclei per cell ; 7 heterotrophic / saprotrophic / parasitic ; 8 store glycogen ; 9 reproduce by spores ; 9(b)(i) any three from: 3 1 measures / gives information about, air, quality / pollution ; 2 other species may be harmed by, sulfur dioxide / acid rain / decrease in lichen (abundance / diversity) ; 3 ref. to food web / species that feed on lichens ; 4 AVP ; 9(b)(ii) any two from: 2 1 role in food web / eaten by other (named) species ; 2 provide, shelter / camouflage (for insects / invertebrates) ; 3 clean the air / remove (named) pollutants / absorb toxins ; 4 may have medical use ; 5 ref. to other practical use ; 6 primary colonisers / pioneer species / soil formation ; 7 ethical / moral / aesthetic, reason ; 8 to conserve genetic diversity / future use for genes ;
Q10 · Populations of the moth Biston betularia live in Europe and in North America
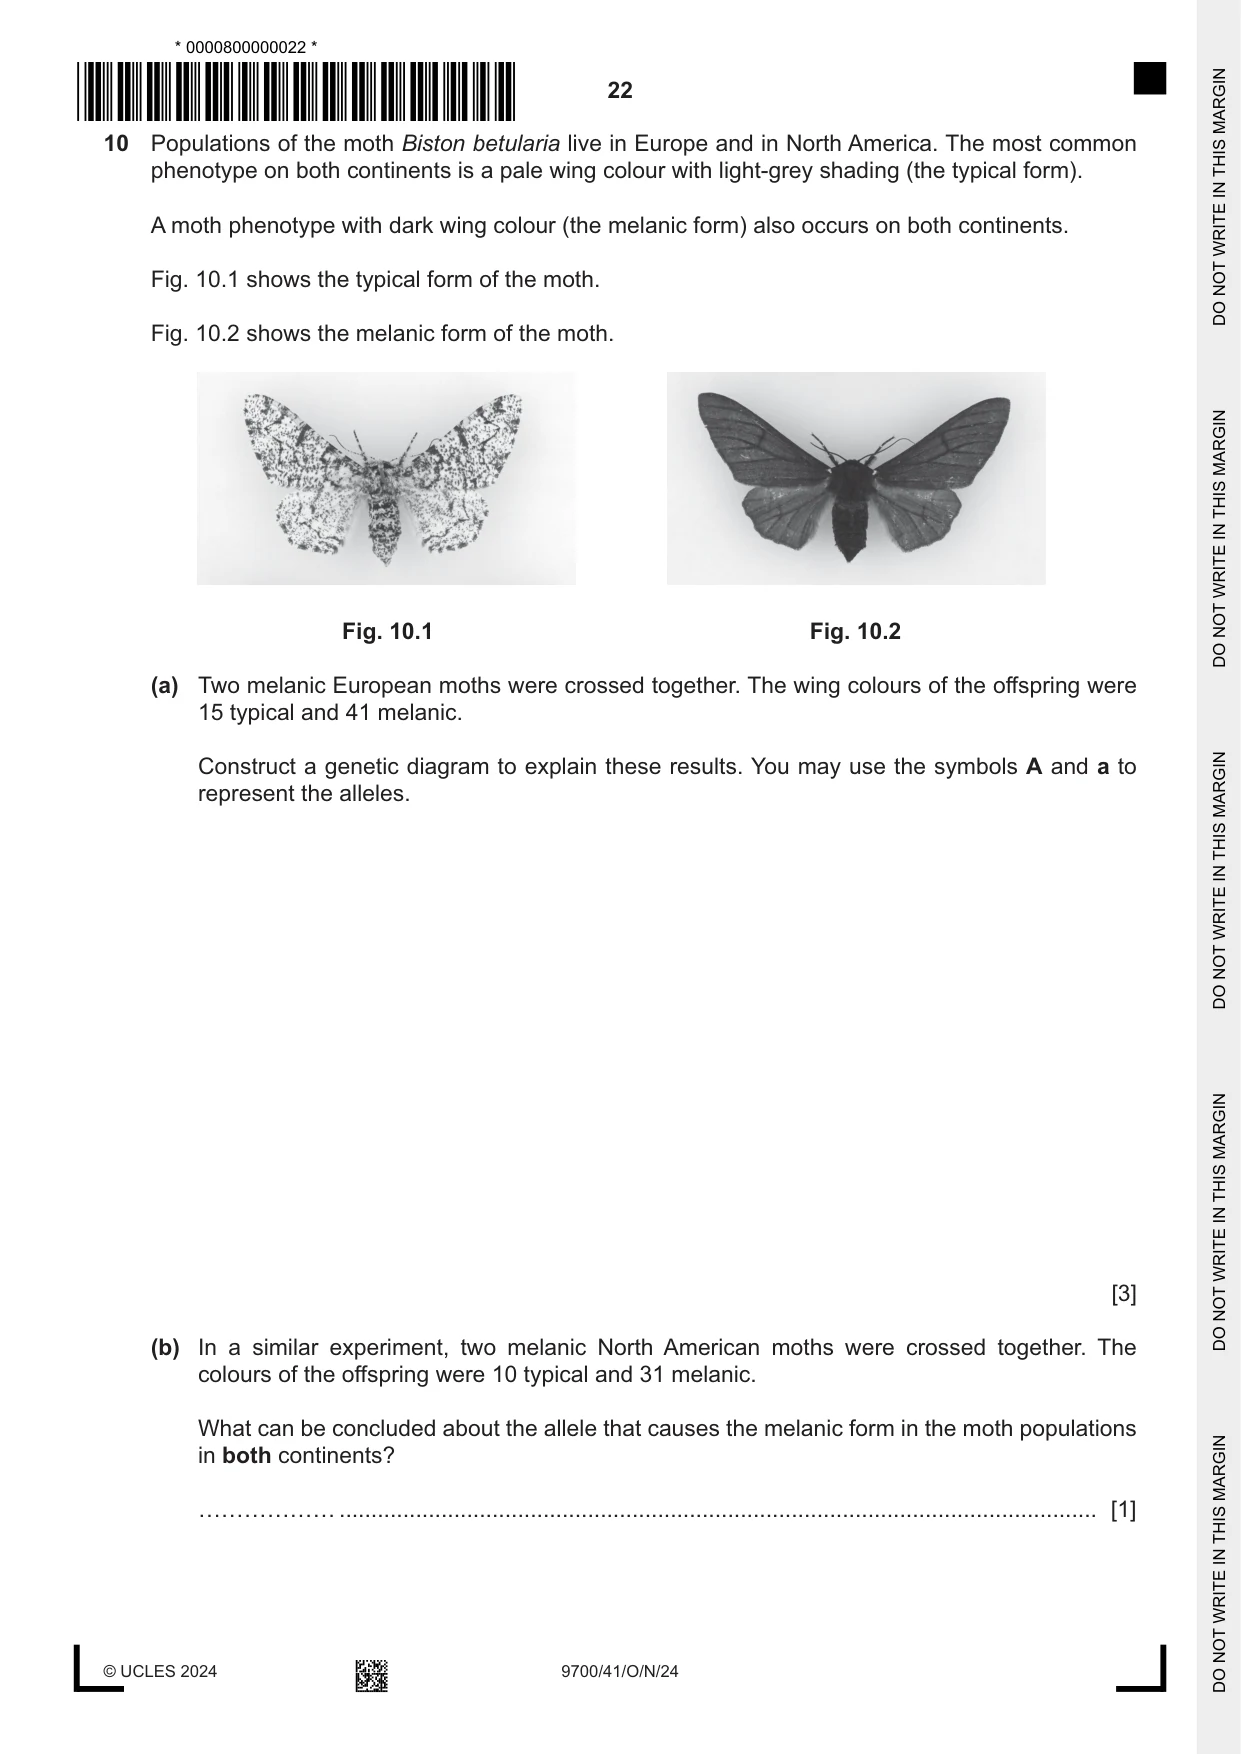
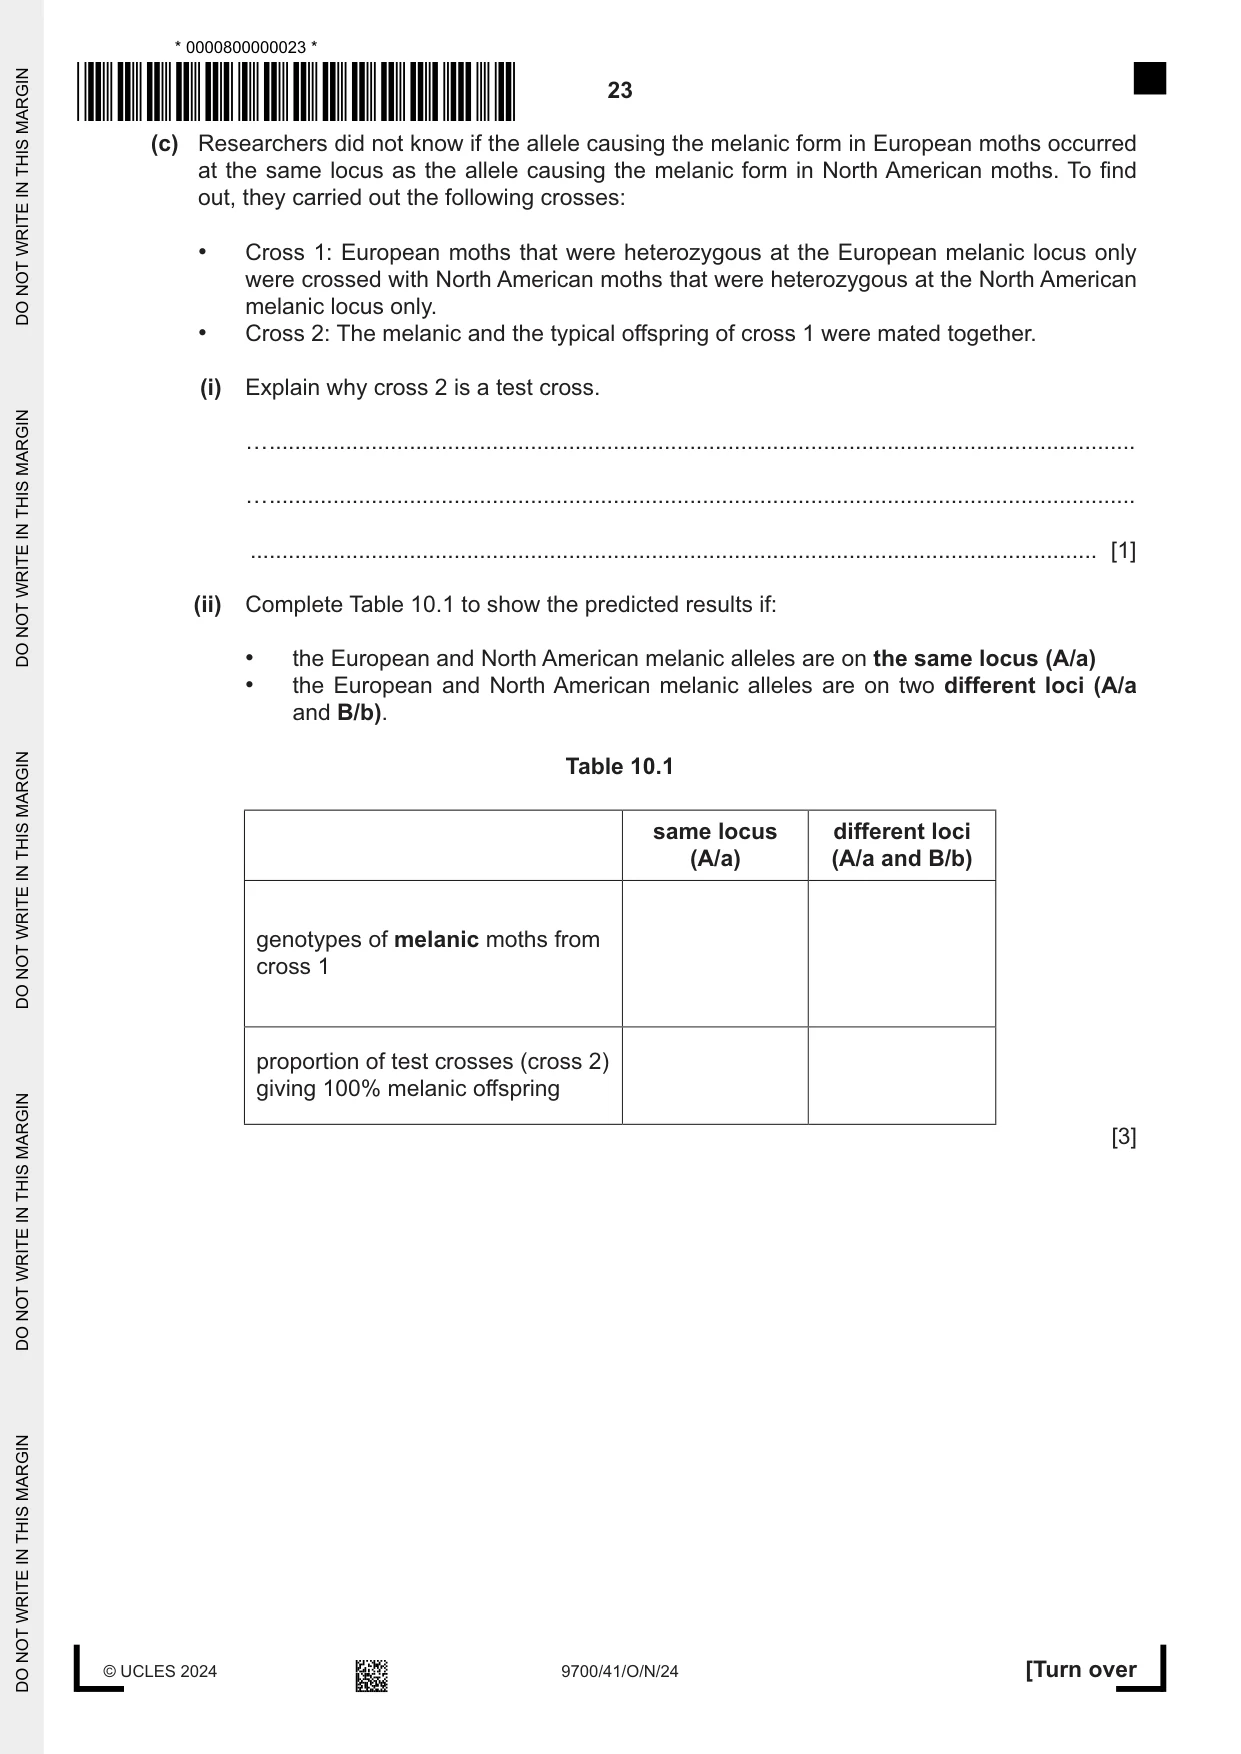
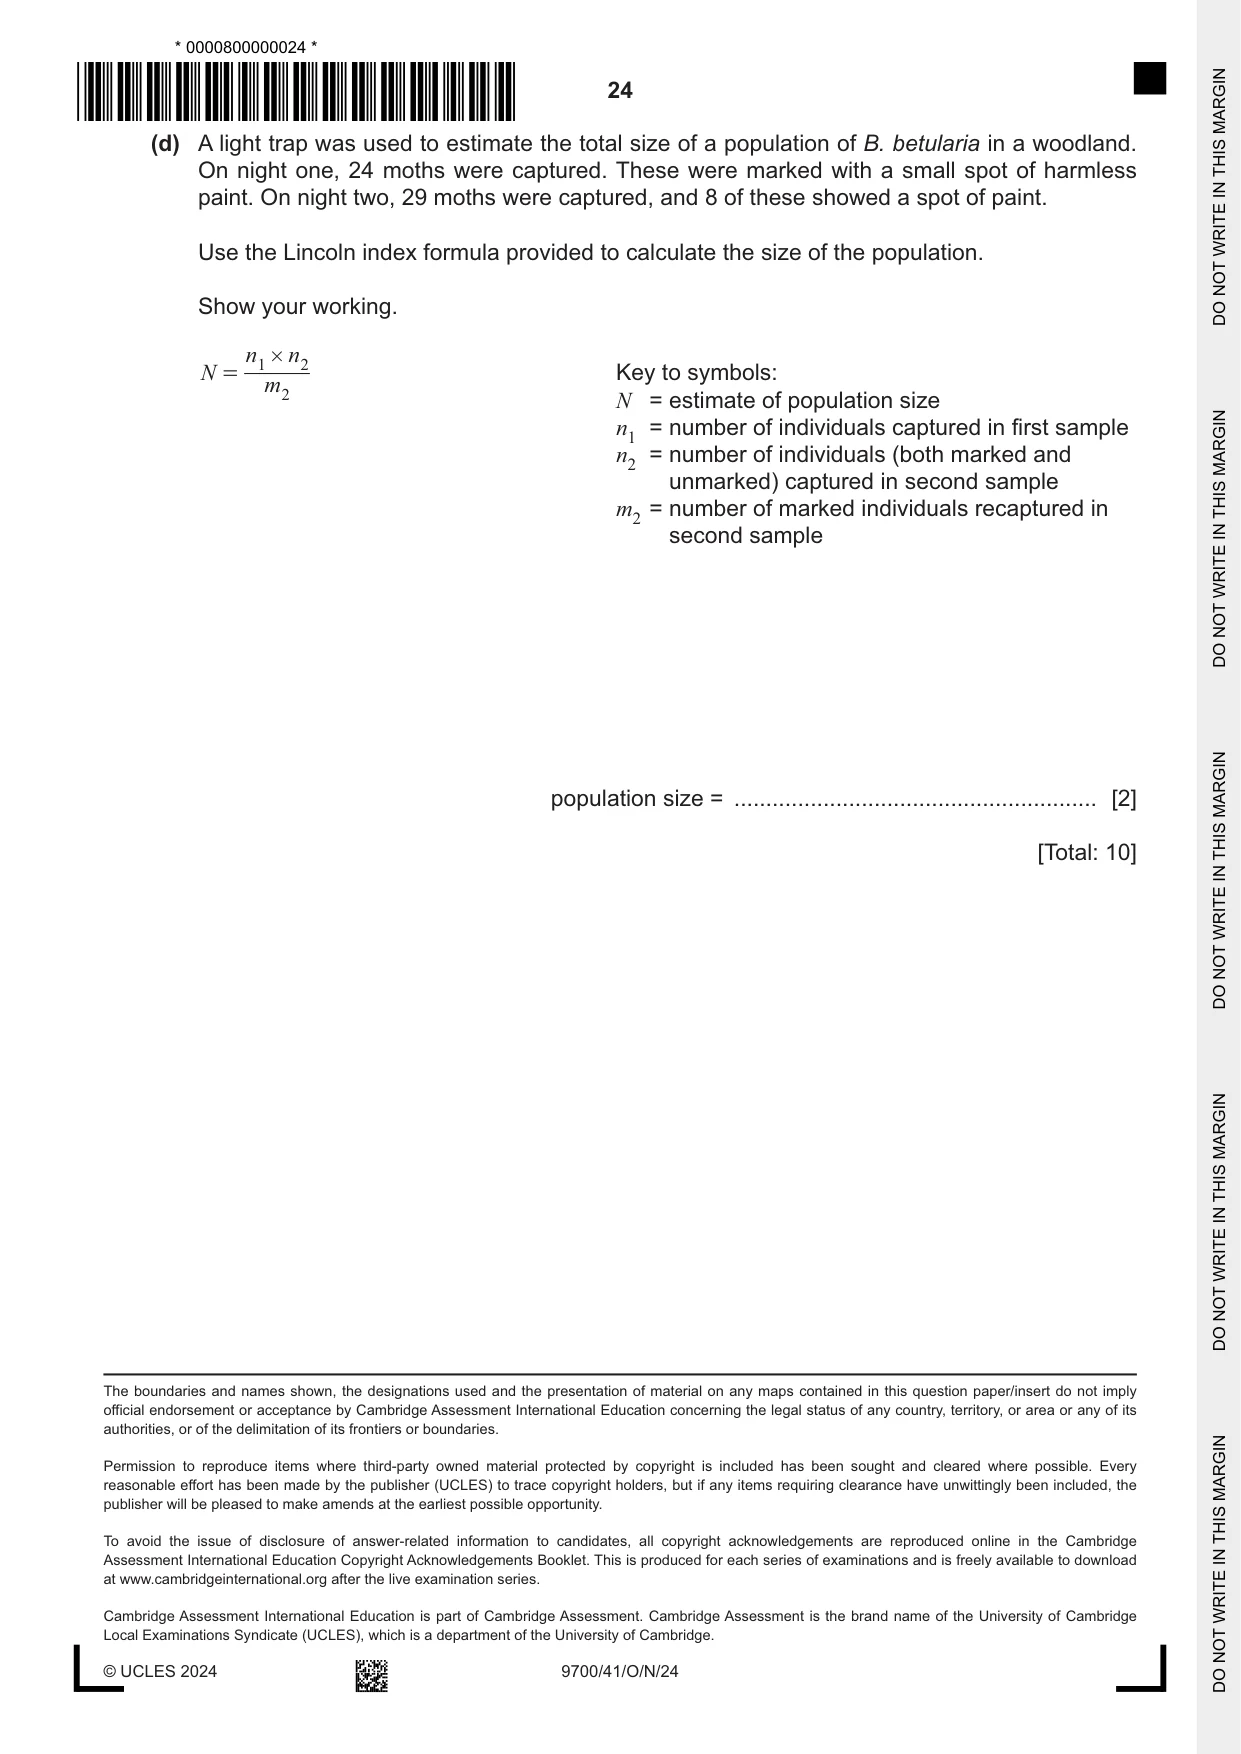
10 Populations of the moth Biston betularia live in Europe and in North America. The most common phenotype on both continents is a pale wing colour with light‑grey shading (the typical form). A moth phenotype with dark wing colour (the melanic form) also occurs on both continents. Fig. 10.1 shows the typical form of the moth. Fig. 10.2 shows the melanic form of the moth. Fig. 10.1 Fig. 10.2 (a) Two melanic European moths were crossed together. The wing colours of the offspring were 15 typical and 41 melanic. Construct a genetic diagram to explain these results. You may use the symbols A and a to represent the alleles. [3] (b) In a similar experiment, two melanic North American moths were crossed together. The colours of the offspring were 10 typical and 31 melanic. What can be concluded about the allele that causes the melanic form in the moth populations in both continents? ……………… ....................................................................................................................... [1] (c) Researchers did not know if the allele causing the melanic form in European moths occurred at the same locus as the allele causing the melanic form in North American moths. To find out, they carried out the following crosses: • Cross 1: European moths that were heterozygous at the European melanic locus only were crossed with North American moths that were heterozygous at the North American melanic locus only. • Cross 2: The melanic and the typical offspring of cross 1 were mated together. (i) Explain why cross 2 is a test cross. … ........................................................................................................................................ … ........................................................................................................................................ ..................................................................................................................................... [1] (ii) Complete Table 10.1 to show the predicted results if: • the European and North American melanic alleles are on the same locus (A/a) • the European and North American melanic alleles are on two different loci (A/a and B/b). Table 10.1 same locus different loci (A/a) (A/a and B/b) genotypes of melanic moths from cross 1 proportion of test crosses (cross 2) giving 100% melanic offspring [3] (d) A light trap was used to estimate the total size of a population of B. betularia in a woodland. On night one, 24 moths were captured. These were marked with a small spot of harmless paint. On night two, 29 moths were captured, and 8 of these showed a spot of paint. Use the Lincoln index formula provided to calculate the size of the population. Show your working. n # n N = 1 2 Key to symbols: m 2 N = estimate of population size n1 = number of individuals captured in first sample n2 = number of individuals (both marked and unmarked) captured in second sample m2 = number of marked individuals recaptured in second sample population size = ......................................................... [2] [Total: 10] The boundaries and names shown, the designations used and the presentation of material on any maps contained in this question paper/insert do not imply official endorsement or acceptance by Cambridge Assessment International Education concerning the legal status of any country, territory, or area or any of its authorities, or of the delimitation of its frontiers or boundaries.
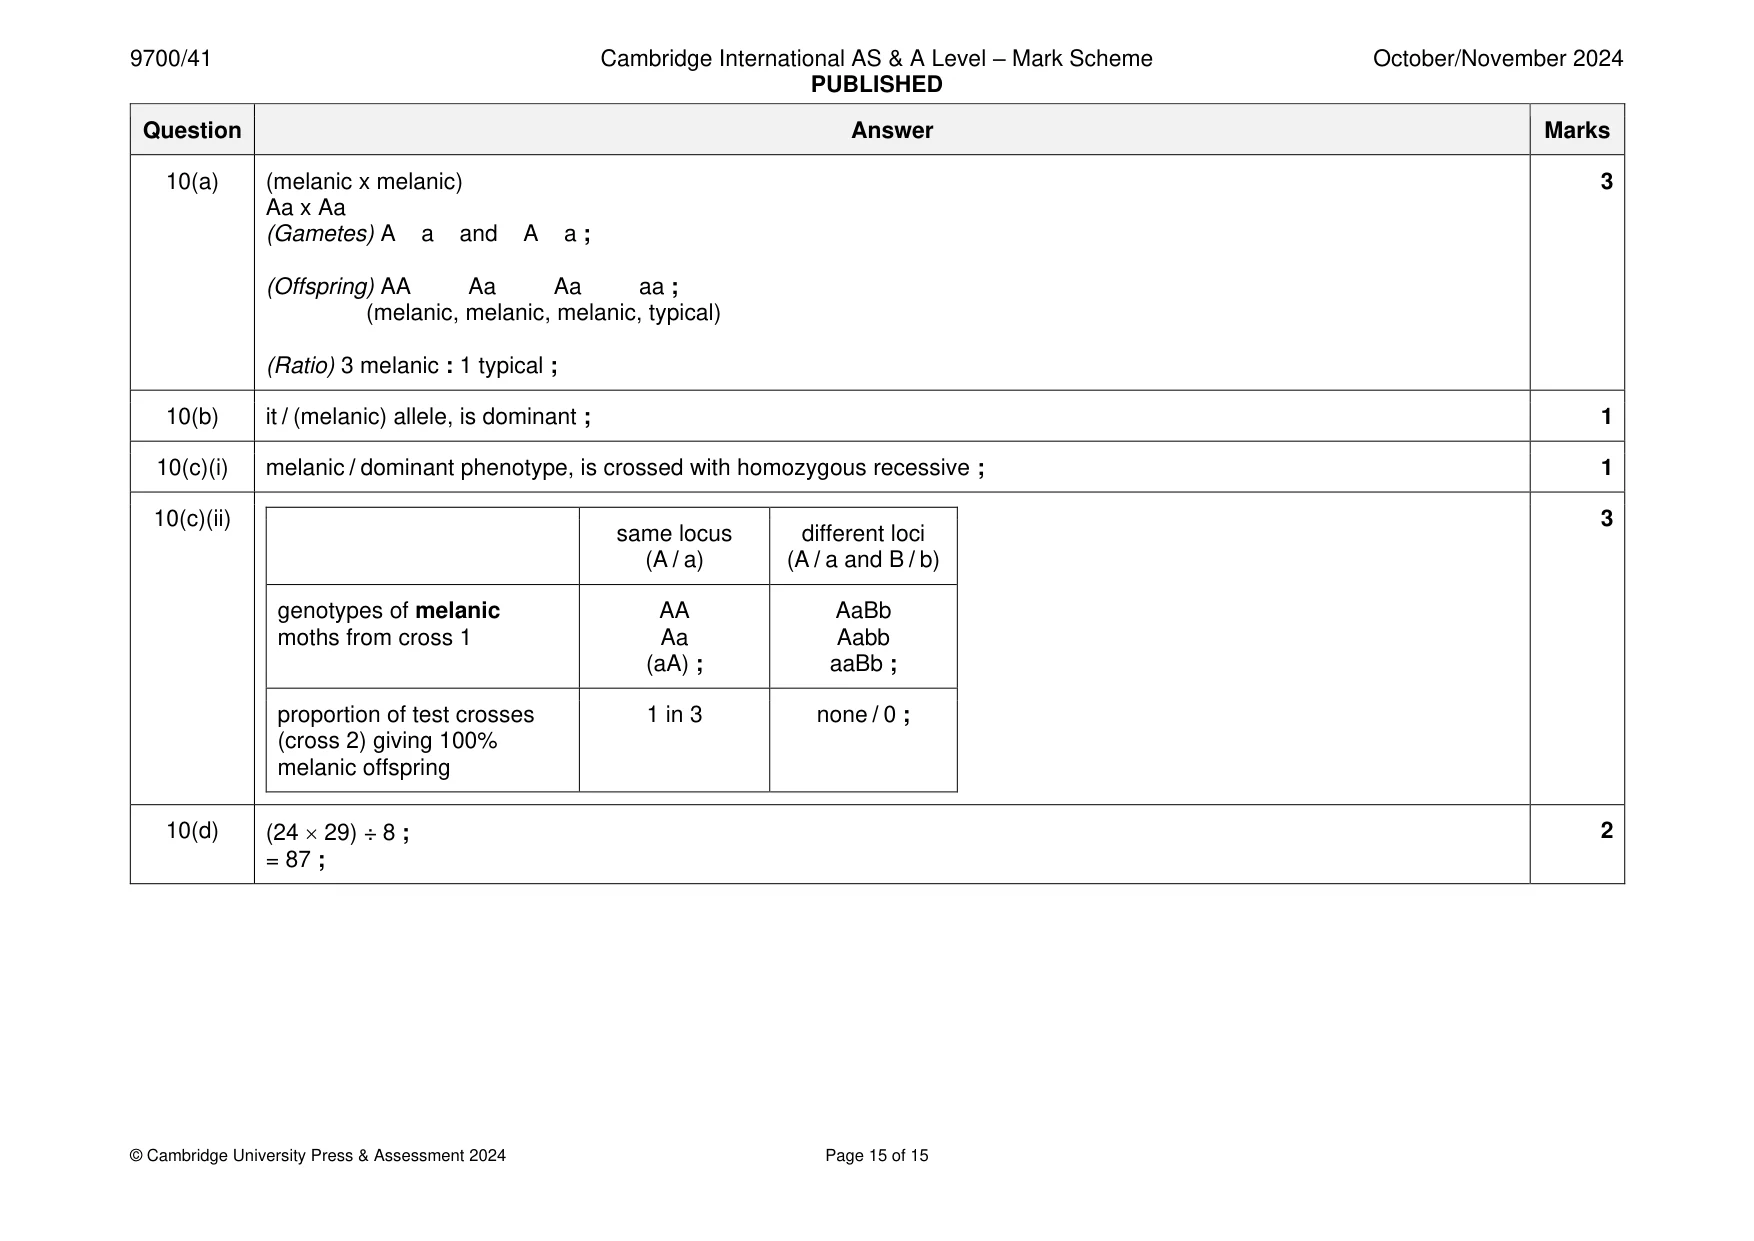
Mark scheme: 10(a) (melanic x melanic) 3 Aa x Aa (Gametes) A a and A a ; (Offspring) AA Aa Aa aa ; (melanic, melanic, melanic, typical) (Ratio) 3 melanic : 1 typical ; 10(b) it / (melanic) allele, is dominant ; 1 10(c)(i) melanic / dominant phenotype, is crossed with homozygous recessive ; 1 10(c)(ii) 3 same locus different loci (A / a) (A / a and B / b) genotypes of melanic AA AaBb moths from cross 1 Aa Aabb (aA) ; aaBb ; proportion of test crosses 1 in 3 none / 0 ; (cross 2) giving 100% melanic offspring 10(d) (24 29) ÷ 8 ; 2 = 87 ;
More questions on Passage of information from parents to offspring
What was in this paper
The subtopics covered by these 10 questions, and how many questions each got. Open one in a new tab to see every Cambridge question on it.
What you needed in this session
Cambridge’s own grade thresholds for 2024 Oct/Nov, Paper 4 · Variant 1. A higher threshold means an easier paper — the bar moves with how the cohort did.