Cambridge A Level Biology 9700 — 2023 May/June Paper 4 · Variant 1
9700/41/M/J/23 · 10 questions · 100 marks · ≈113 min
The question paper and its mark scheme, free to read here and free to download. This is Cambridge’s own paper, exactly as it was sat.
Question paper24 pages
Mark scheme17 pages
Answers below. Sit the paper first if you are practising.
Questions as text
Q1 · A transmission electron micrograph of part of a chloroplast
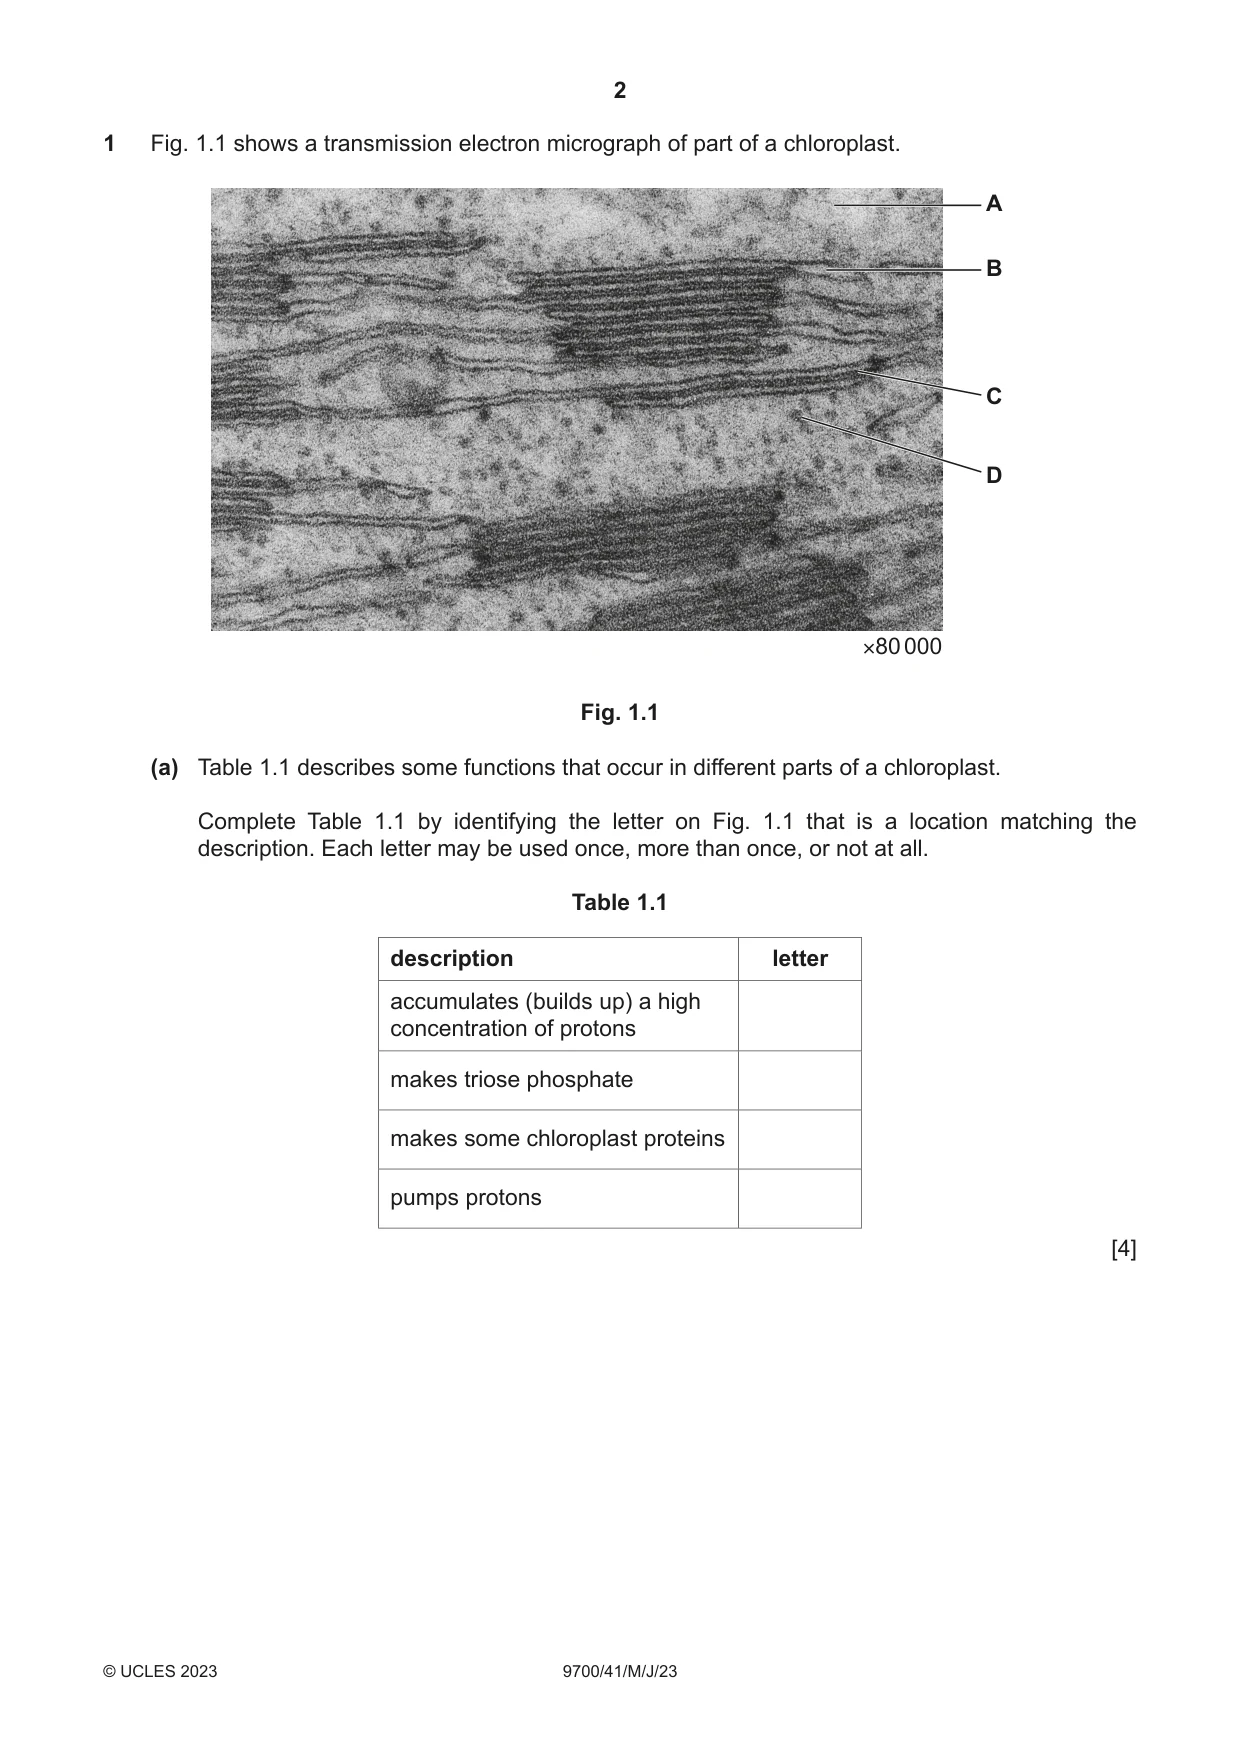
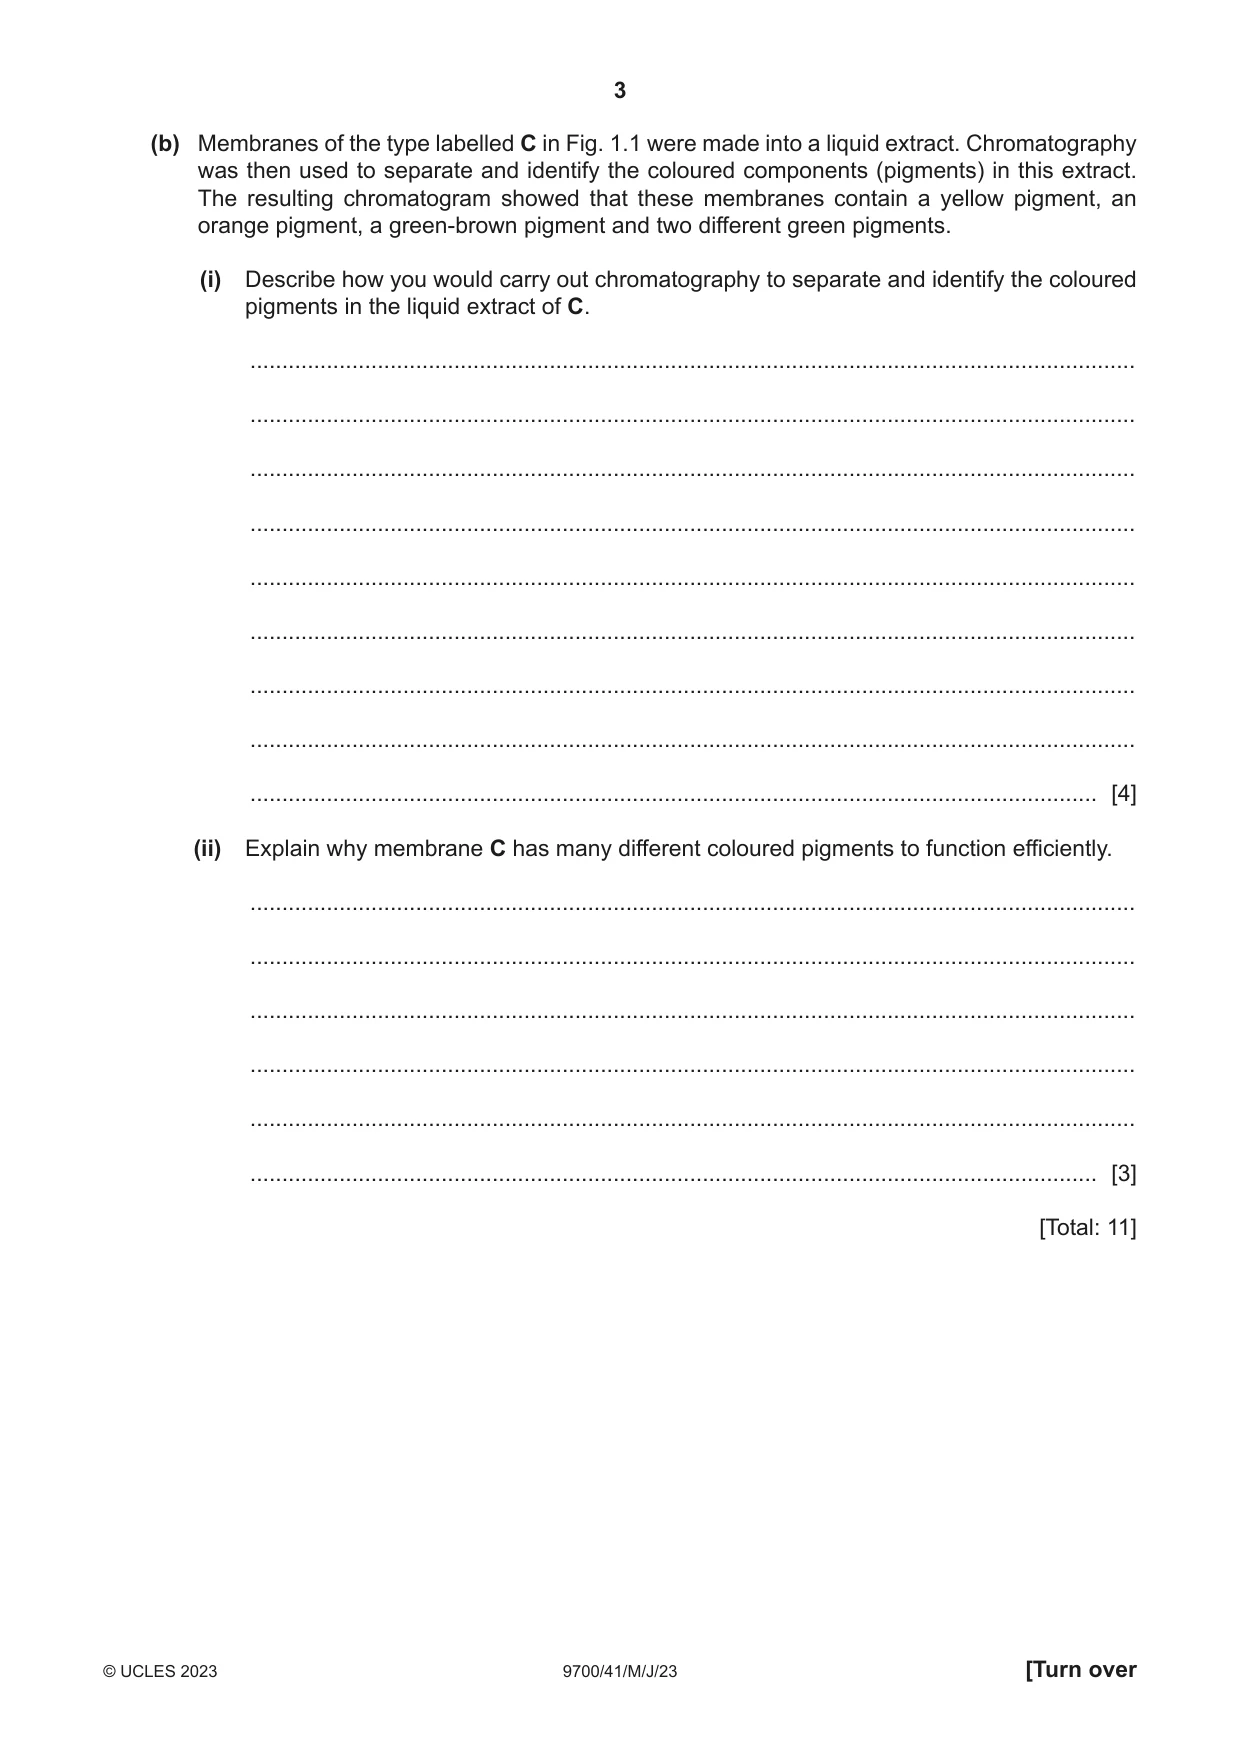
1 Fig. 1.1 shows a transmission electron micrograph of part of a chloroplast. A B C D ×80 000 Fig. 1.1 (a) Table 1.1 describes some functions that occur in different parts of a chloroplast. Complete Table 1.1 by identifying the letter on Fig. 1.1 that is a location matching the description. Each letter may be used once, more than once, or not at all. Table 1.1 description letter accumulates (builds up) a high concentration of protons makes triose phosphate makes some chloroplast proteins pumps protons [4] (b) Membranes of the type labelled C in Fig. 1.1 were made into a liquid extract. Chromatography was then used to separate and identify the coloured components (pigments) in this extract. The resulting chromatogram showed that these membranes contain a yellow pigment, an orange pigment, a green-brown pigment and two different green pigments. (i) Describe how you would carry out chromatography to separate and identify the coloured pigments in the liquid extract of C. ........................................................................................................................................... ........................................................................................................................................... ........................................................................................................................................... ........................................................................................................................................... ........................................................................................................................................... ........................................................................................................................................... ........................................................................................................................................... ........................................................................................................................................... ..................................................................................................................................... [4] (ii) Explain why membrane C has many different coloured pigments to function efficiently. ........................................................................................................................................... ........................................................................................................................................... ........................................................................................................................................... ........................................................................................................................................... ........................................................................................................................................... ..................................................................................................................................... [3] [Total: 11]
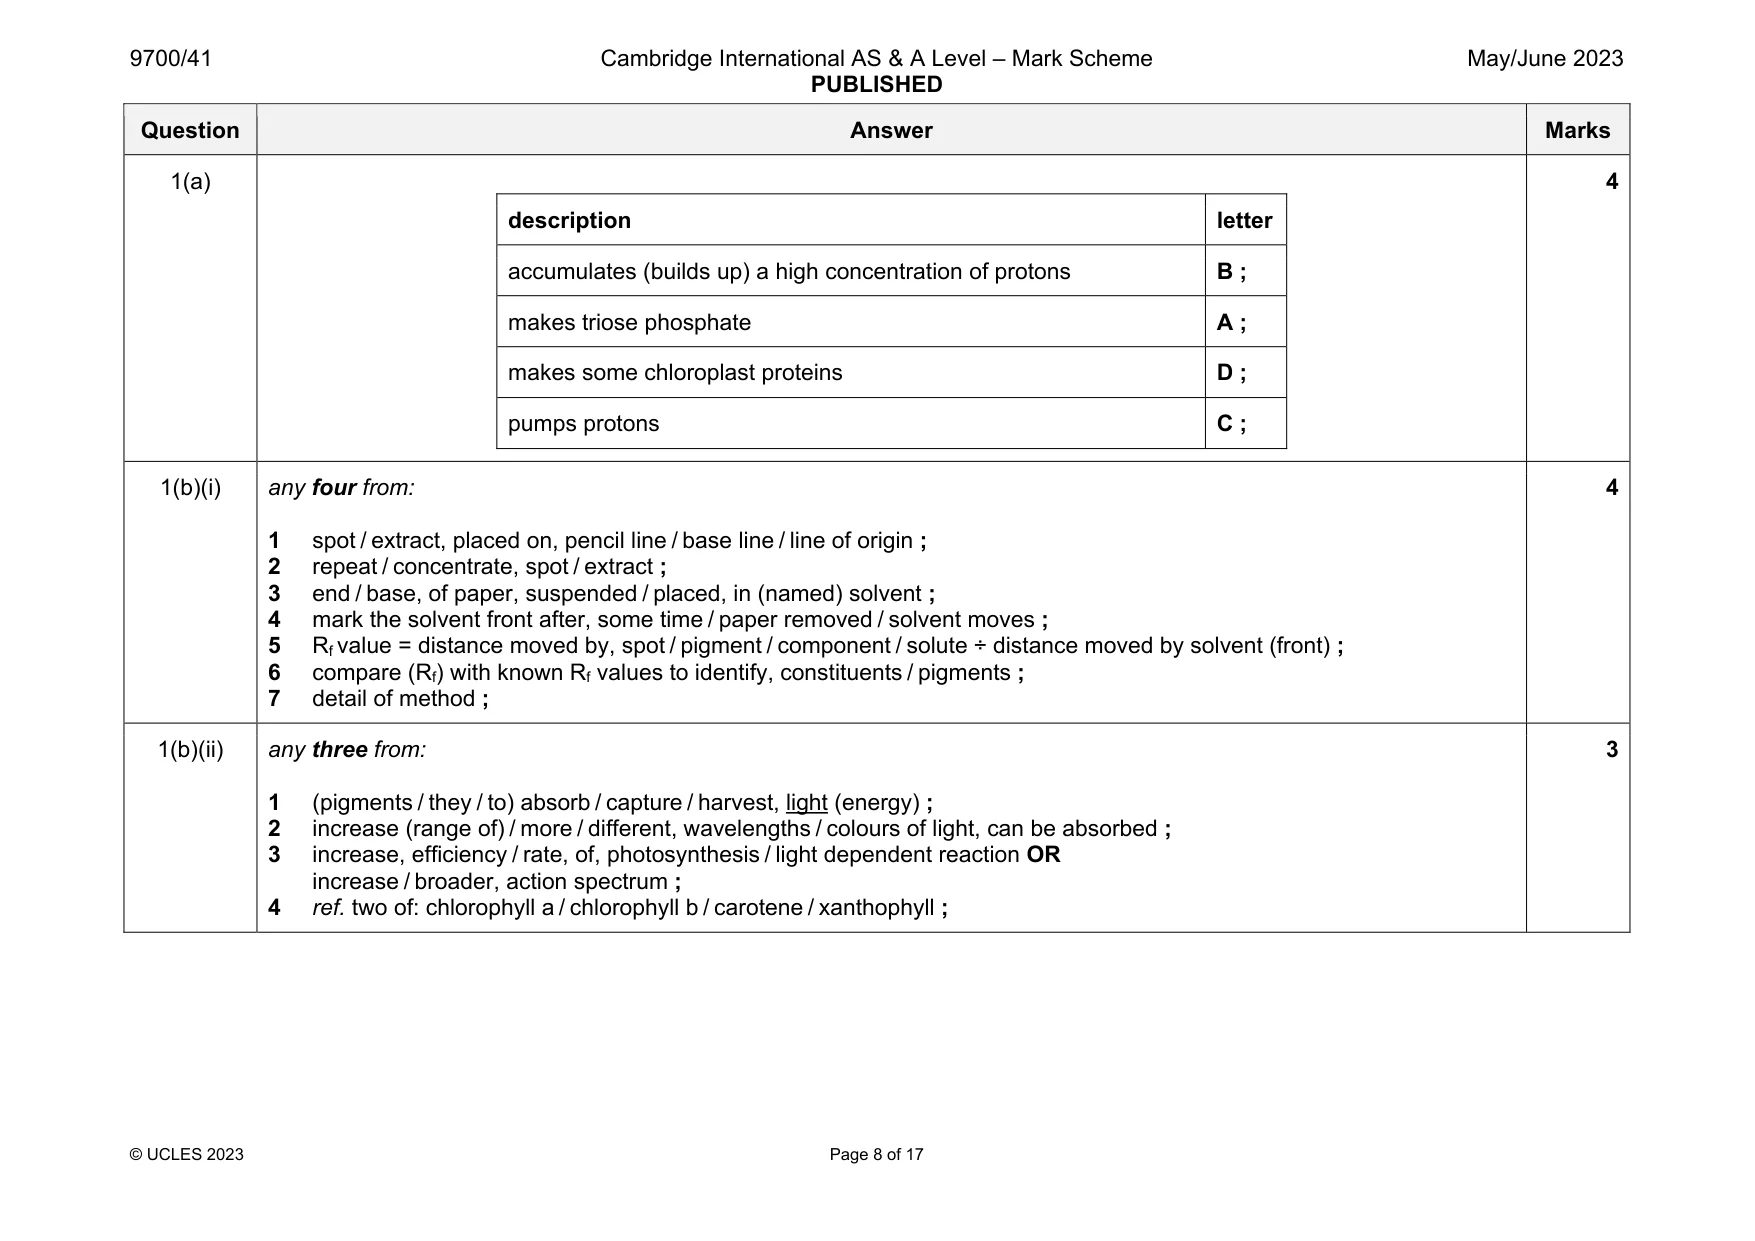
Mark scheme: 1(a) description letter accumulates (builds up) a high concentration of protons B ; makes triose phosphate A ; makes some chloroplast proteins D ; pumps protons C ; 4 1(b)(i) any four from: 1 spot / extract, placed on, pencil line / base line / line of origin ; 2 repeat / concentrate, spot / extract ; 3 end / base, of paper, suspended / placed, in (named) solvent ; 4 mark the solvent front after, some time / paper removed / solvent moves ; 5 Rf value = distance moved by, spot / pigment / component / solute ÷ distance moved by solvent (front) ; 6 compare (Rf) with known Rf values to identify, constituents / pigments ; 7 detail of method ; 4 1(b)(ii) any three from: 1 (pigments / they / to) absorb / capture / harvest, light (energy) ; 2 increase (range of) / more / different, wavelengths / colours of light, can be absorbed ; 3 increase, efficiency / rate, of, photosynthesis / light dependent reaction OR increase / broader, action spectrum ; 4 ref. two of: chlorophyll a / chlorophyll b / carotene / xanthophyll ; 3
More questions on Photosynthesis as an energy transfer process
Q2 · The natural ecosystem on Hawadax Island in Alaska was disrupted in the 1780s when brown…
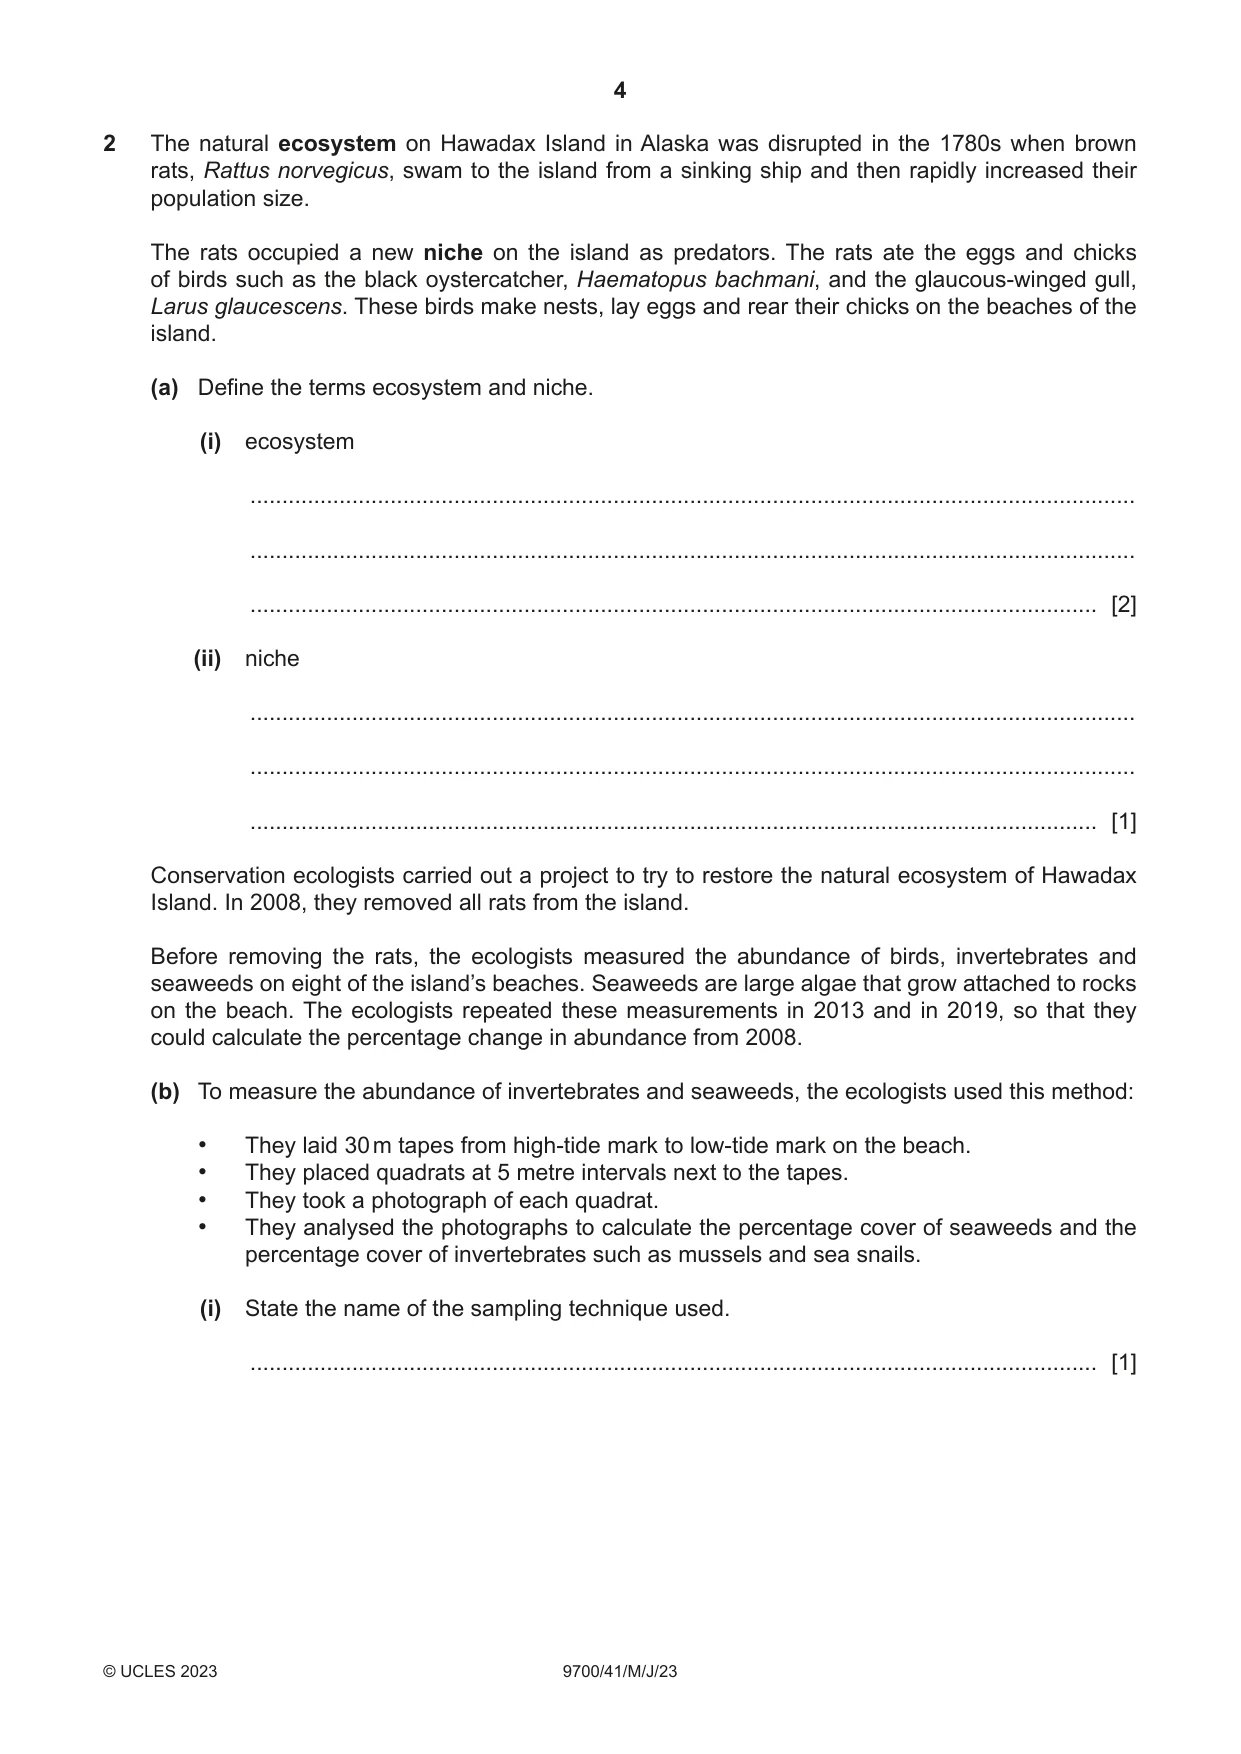
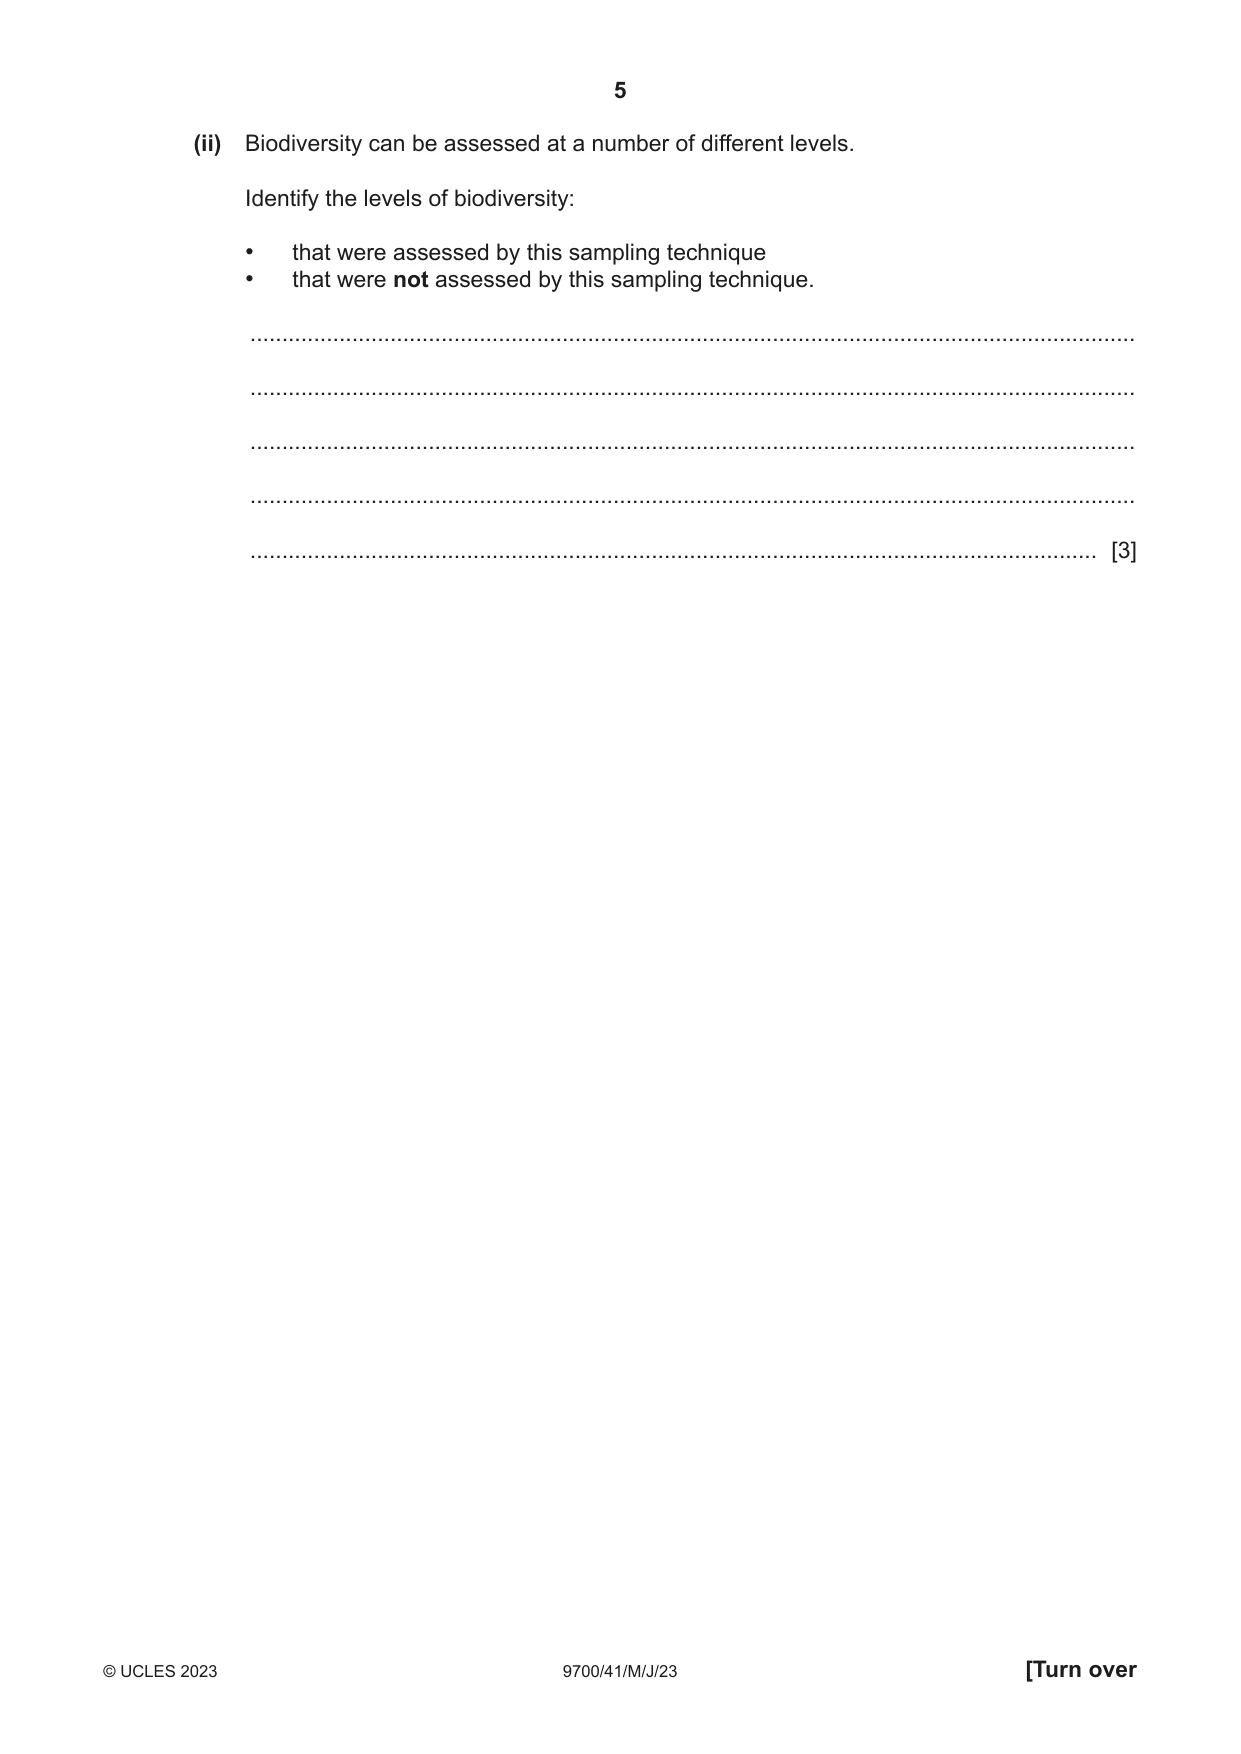
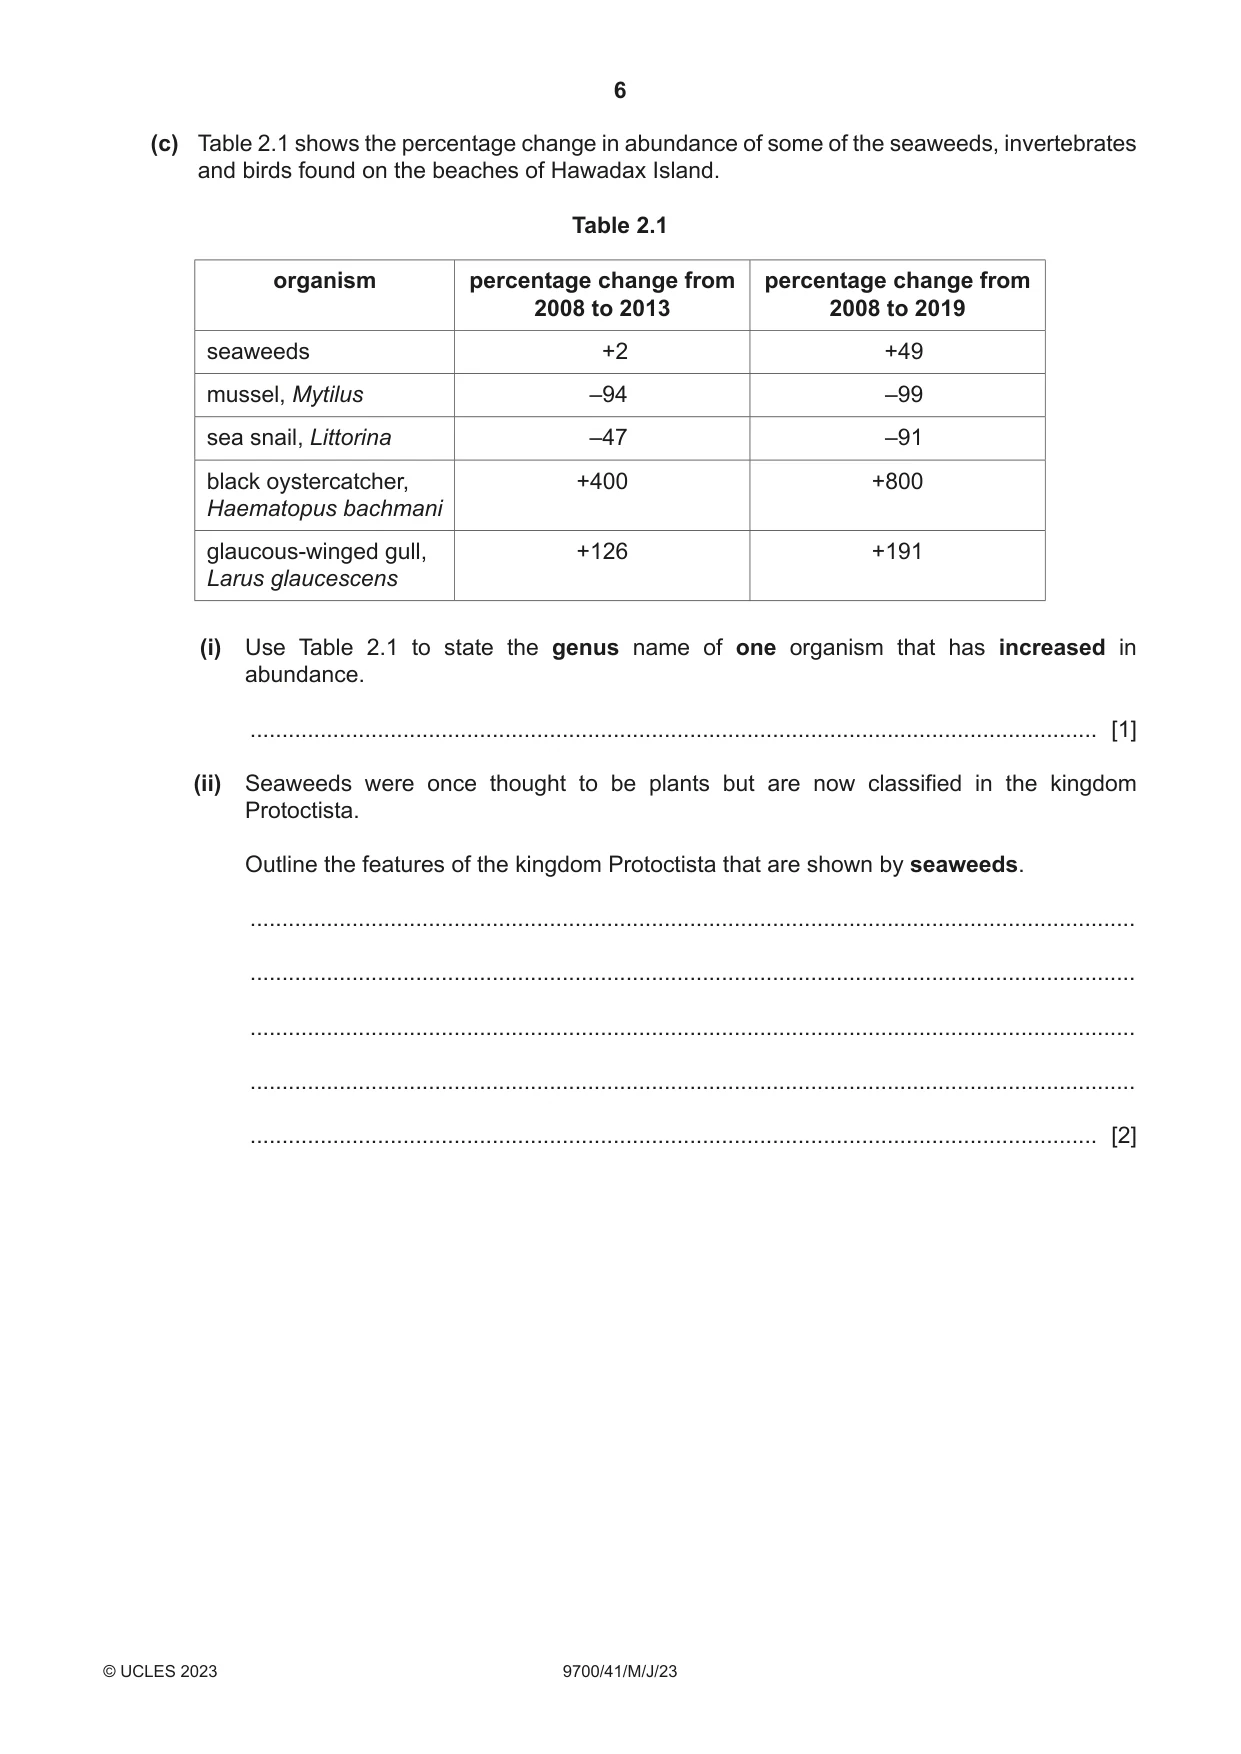
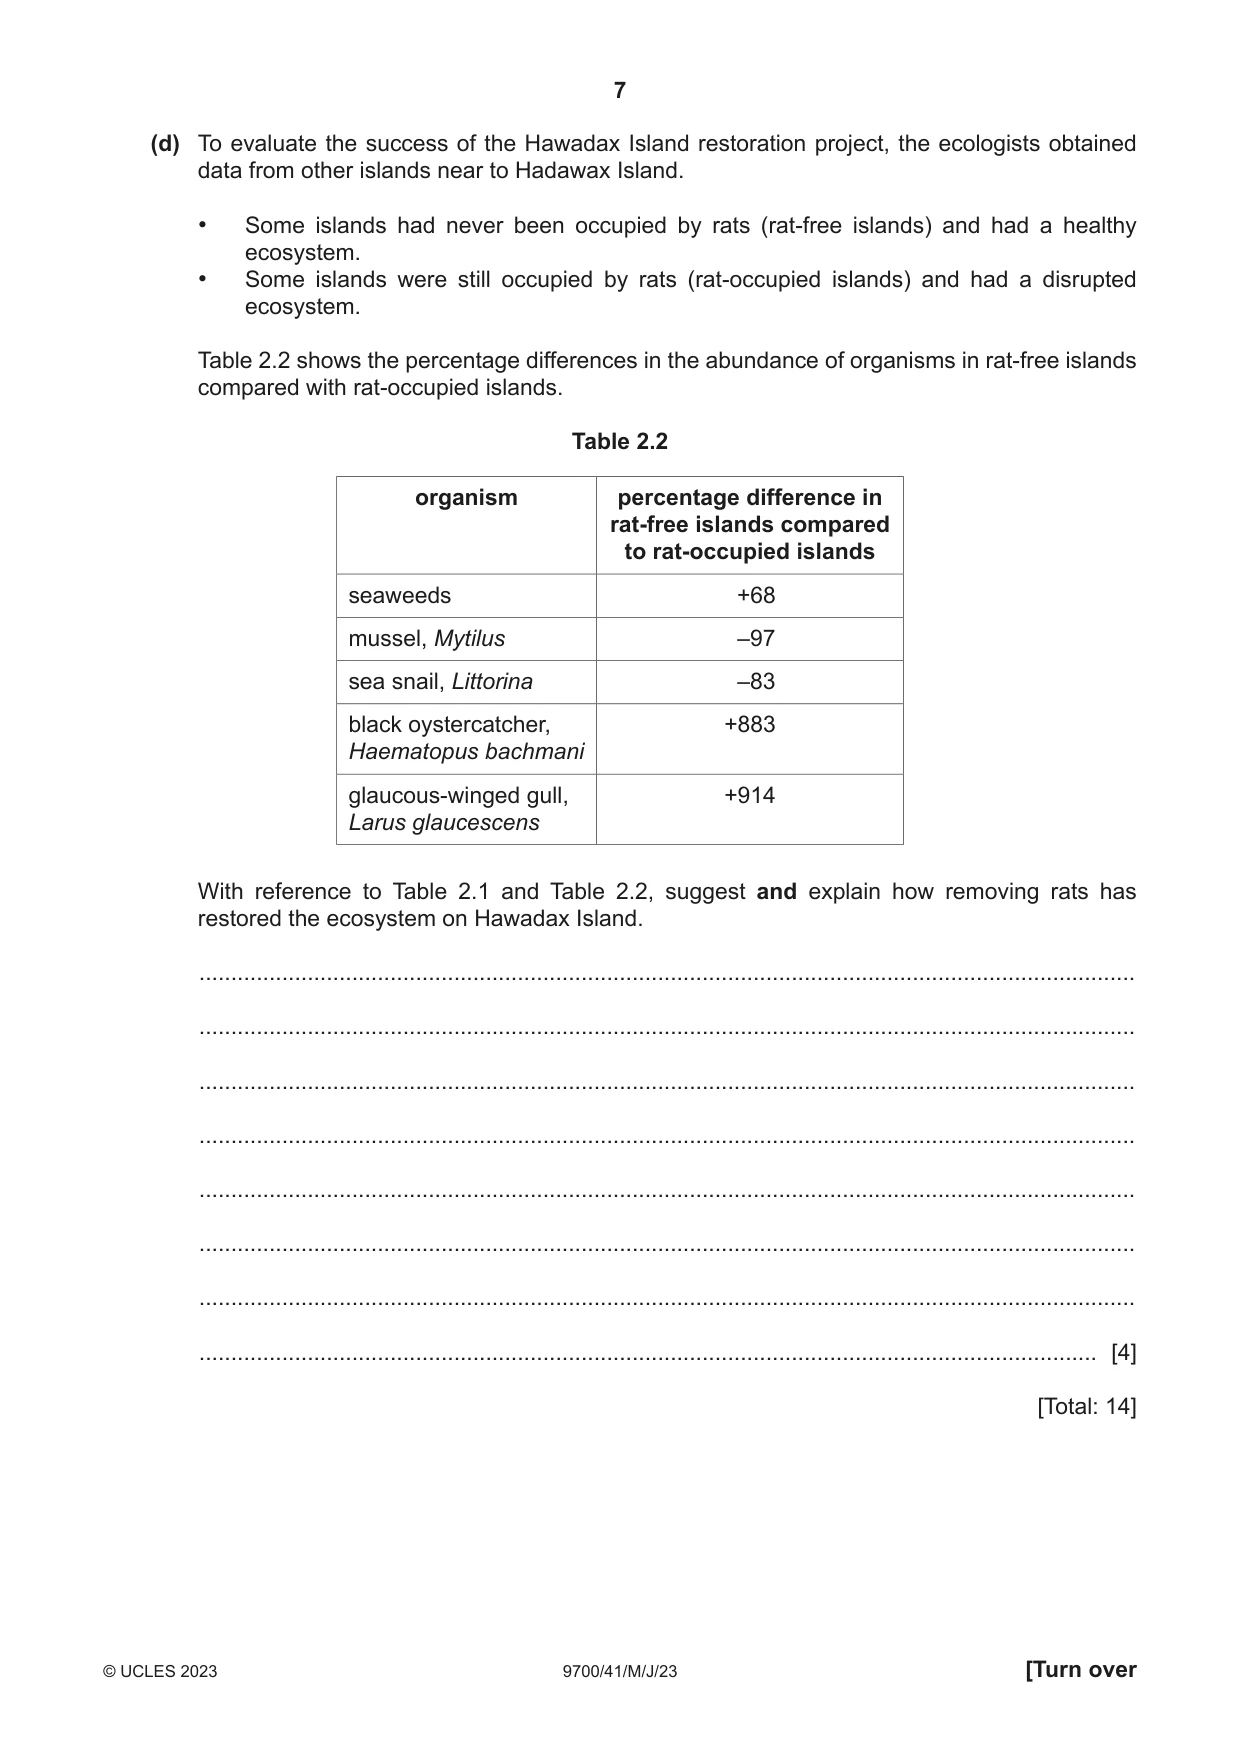
2 The natural ecosystem on Hawadax Island in Alaska was disrupted in the 1780s when brown rats, Rattus norvegicus, swam to the island from a sinking ship and then rapidly increased their population size. The rats occupied a new niche on the island as predators. The rats ate the eggs and chicks of birds such as the black oystercatcher, Haematopus bachmani, and the glaucous-winged gull, Larus glaucescens. These birds make nests, lay eggs and rear their chicks on the beaches of the island. (a) Define the terms ecosystem and niche. (i) ecosystem ........................................................................................................................................... ........................................................................................................................................... ..................................................................................................................................... [2] (ii) niche ........................................................................................................................................... ........................................................................................................................................... ..................................................................................................................................... [1] Conservation ecologists carried out a project to try to restore the natural ecosystem of Hawadax Island. In 2008, they removed all rats from the island. Before removing the rats, the ecologists measured the abundance of birds, invertebrates and seaweeds on eight of the island’s beaches. Seaweeds are large algae that grow attached to rocks on the beach. The ecologists repeated these measurements in 2013 and in 2019, so that they could calculate the percentage change in abundance from 2008. (b) To measure the abundance of invertebrates and seaweeds, the ecologists used this method: • They laid 30 m tapes from high-tide mark to low-tide mark on the beach. • They placed quadrats at 5 metre intervals next to the tapes. • They took a photograph of each quadrat. • They analysed the photographs to calculate the percentage cover of seaweeds and the percentage cover of invertebrates such as mussels and sea snails. (i) State the name of the sampling technique used. ..................................................................................................................................... [1] (ii) Biodiversity can be assessed at a number of different levels. Identify the levels of biodiversity: • that were assessed by this sampling technique • that were not assessed by this sampling technique. ........................................................................................................................................... ........................................................................................................................................... ........................................................................................................................................... ........................................................................................................................................... ..................................................................................................................................... [3] (c) Table 2.1 shows the percentage change in abundance of some of the seaweeds, invertebrates and birds found on the beaches of Hawadax Island. Table 2.1 organism percentage change from percentage change from 2008 to 2013 2008 to 2019 seaweeds +2 +49 mussel, Mytilus –94 –99 sea snail, Littorina –47 –91 black oystercatcher, +400 +800 Haematopus bachmani glaucous-winged gull, +126 +191 Larus glaucescens (i) Use Table 2.1 to state the genus name of one organism that has increased in abundance. ..................................................................................................................................... [1] (ii) Seaweeds were once thought to be plants but are now classified in the kingdom Protoctista. Outline the features of the kingdom Protoctista that are shown by seaweeds. ........................................................................................................................................... ........................................................................................................................................... ........................................................................................................................................... ........................................................................................................................................... ..................................................................................................................................... [2] (d) To evaluate the success of the Hawadax Island restoration project, the ecologists obtained data from other islands near to Hadawax Island. • Some islands had never been occupied by rats (rat-free islands) and had a healthy ecosystem. • Some islands were still occupied by rats (rat-occupied islands) and had a disrupted ecosystem. Table 2.2 shows the percentage differences in the abundance of organisms in rat-free islands compared with rat-occupied islands. Table 2.2 organism percentage difference in rat-free islands compared to rat-occupied islands seaweeds +68 mussel, Mytilus –97 sea snail, Littorina –83 black oystercatcher, +883 Haematopus bachmani glaucous-winged gull, +914 Larus glaucescens With reference to Table 2.1 and Table 2.2, suggest and explain how removing rats has restored the ecosystem on Hawadax Island. ................................................................................................................................................... ................................................................................................................................................... ................................................................................................................................................... ................................................................................................................................................... ................................................................................................................................................... ................................................................................................................................................... ................................................................................................................................................... ............................................................................................................................................. [4] [Total: 14]
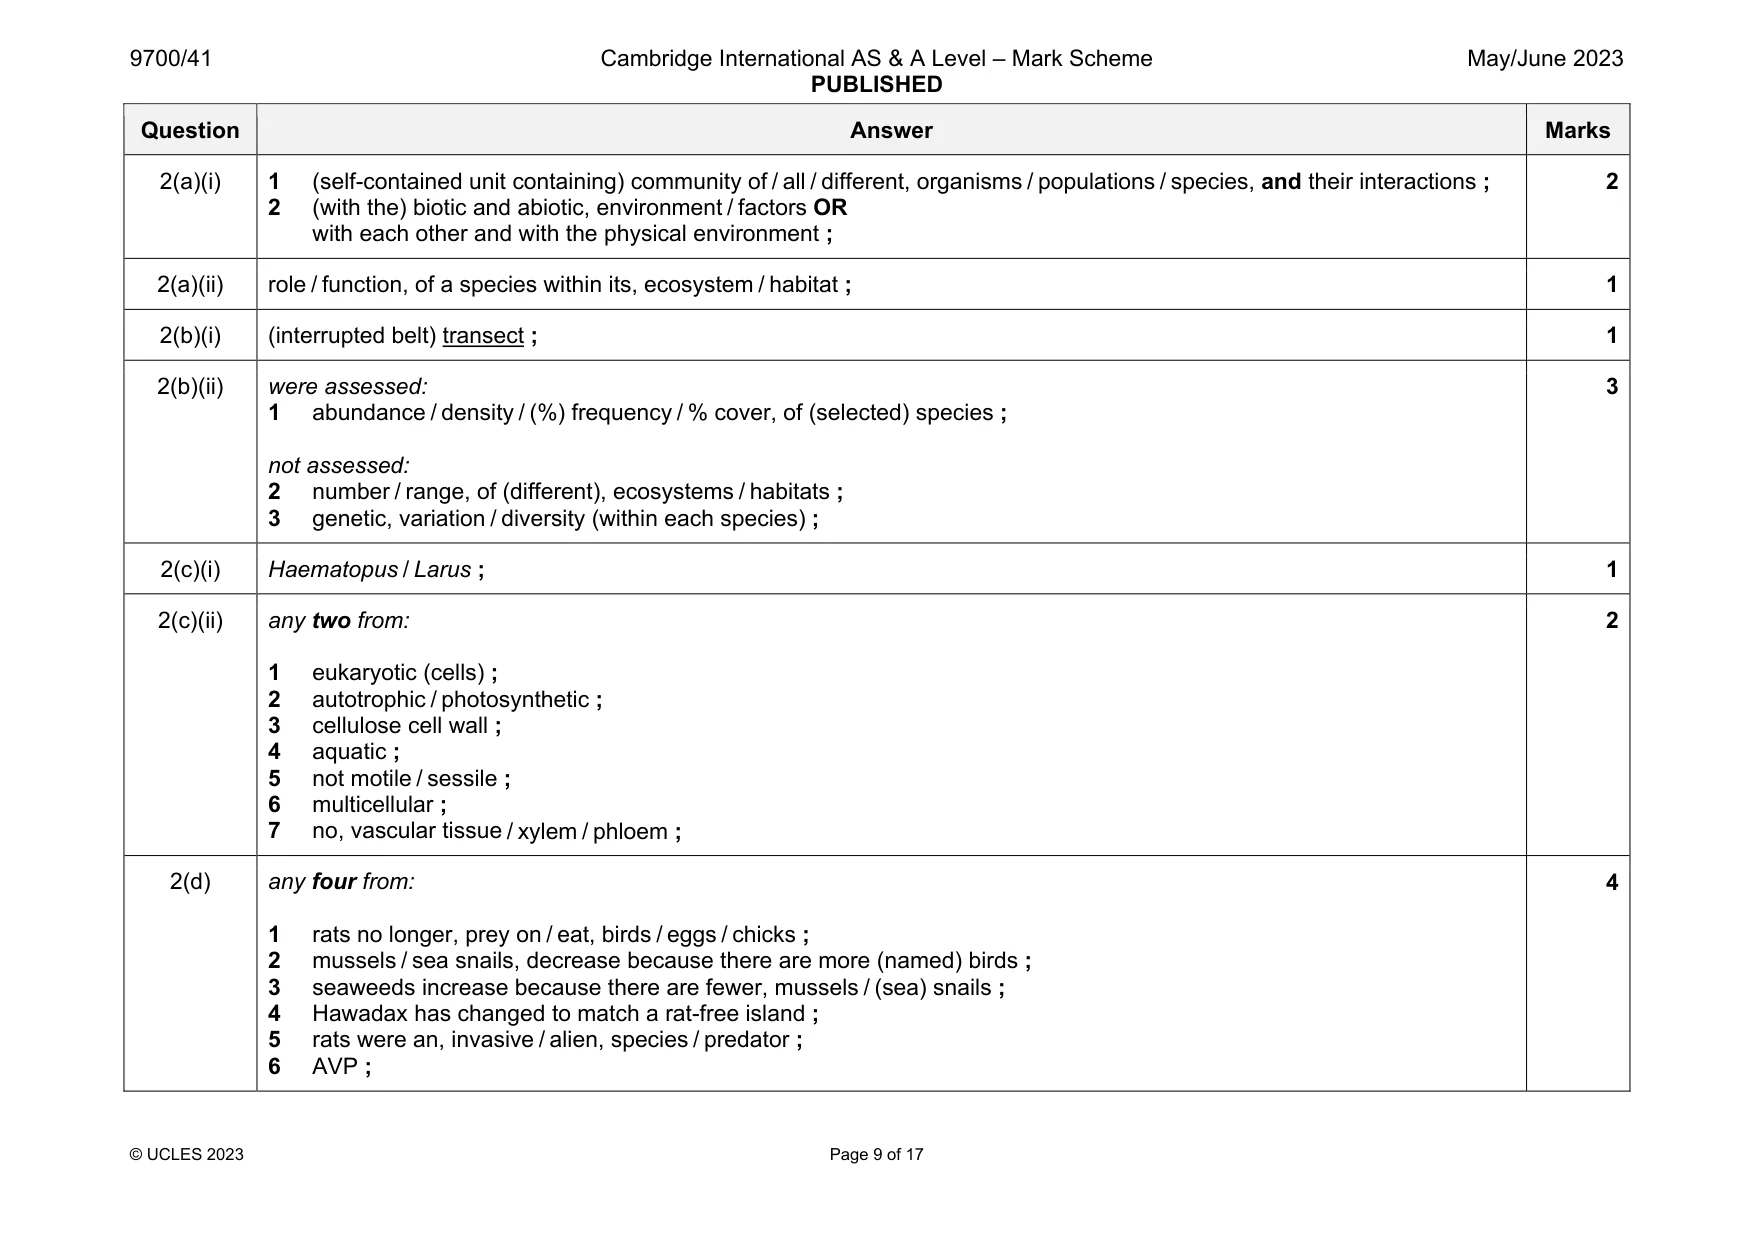
Mark scheme: 2(a)(i) 1 (self-contained unit containing) community of / all / different, organisms / populations / species, and their interactions ; 2 (with the) biotic and abiotic, environment / factors OR with each other and with the physical environment ; 2 2(a)(ii) role / function, of a species within its, ecosystem / habitat ; 1 2(b)(i) (interrupted belt) transect ; 1 2(b)(ii) were assessed: 1 abundance / density / (%) frequency / % cover, of (selected) species ; not assessed: 2 number / range, of (different), ecosystems / habitats ; 3 genetic, variation / diversity (within each species) ; 3 2(c)(i) Haematopus / Larus ; 1 2(c)(ii) any two from: 1 eukaryotic (cells) ; 2 autotrophic / photosynthetic ; 3 cellulose cell wall ; 4 aquatic ; 5 not motile / sessile ; 6 multicellular ; 7 no, vascular tissue / xylem / phloem ; 2 2(d) any four from: 1 rats no longer, prey on / eat, birds / eggs / chicks ; 2 mussels / sea snails, decrease because there are more (named) birds ; 3 seaweeds increase because there are fewer, mussels / (sea) snails ; 4 Hawadax has changed to match a rat-free island ; 5 rats were an, invasive / alien, species / predator ; 6 AVP ; 4
Q3 · Oryza is a genus of grass plants that includes the rice, Oryza sativa, a food crop
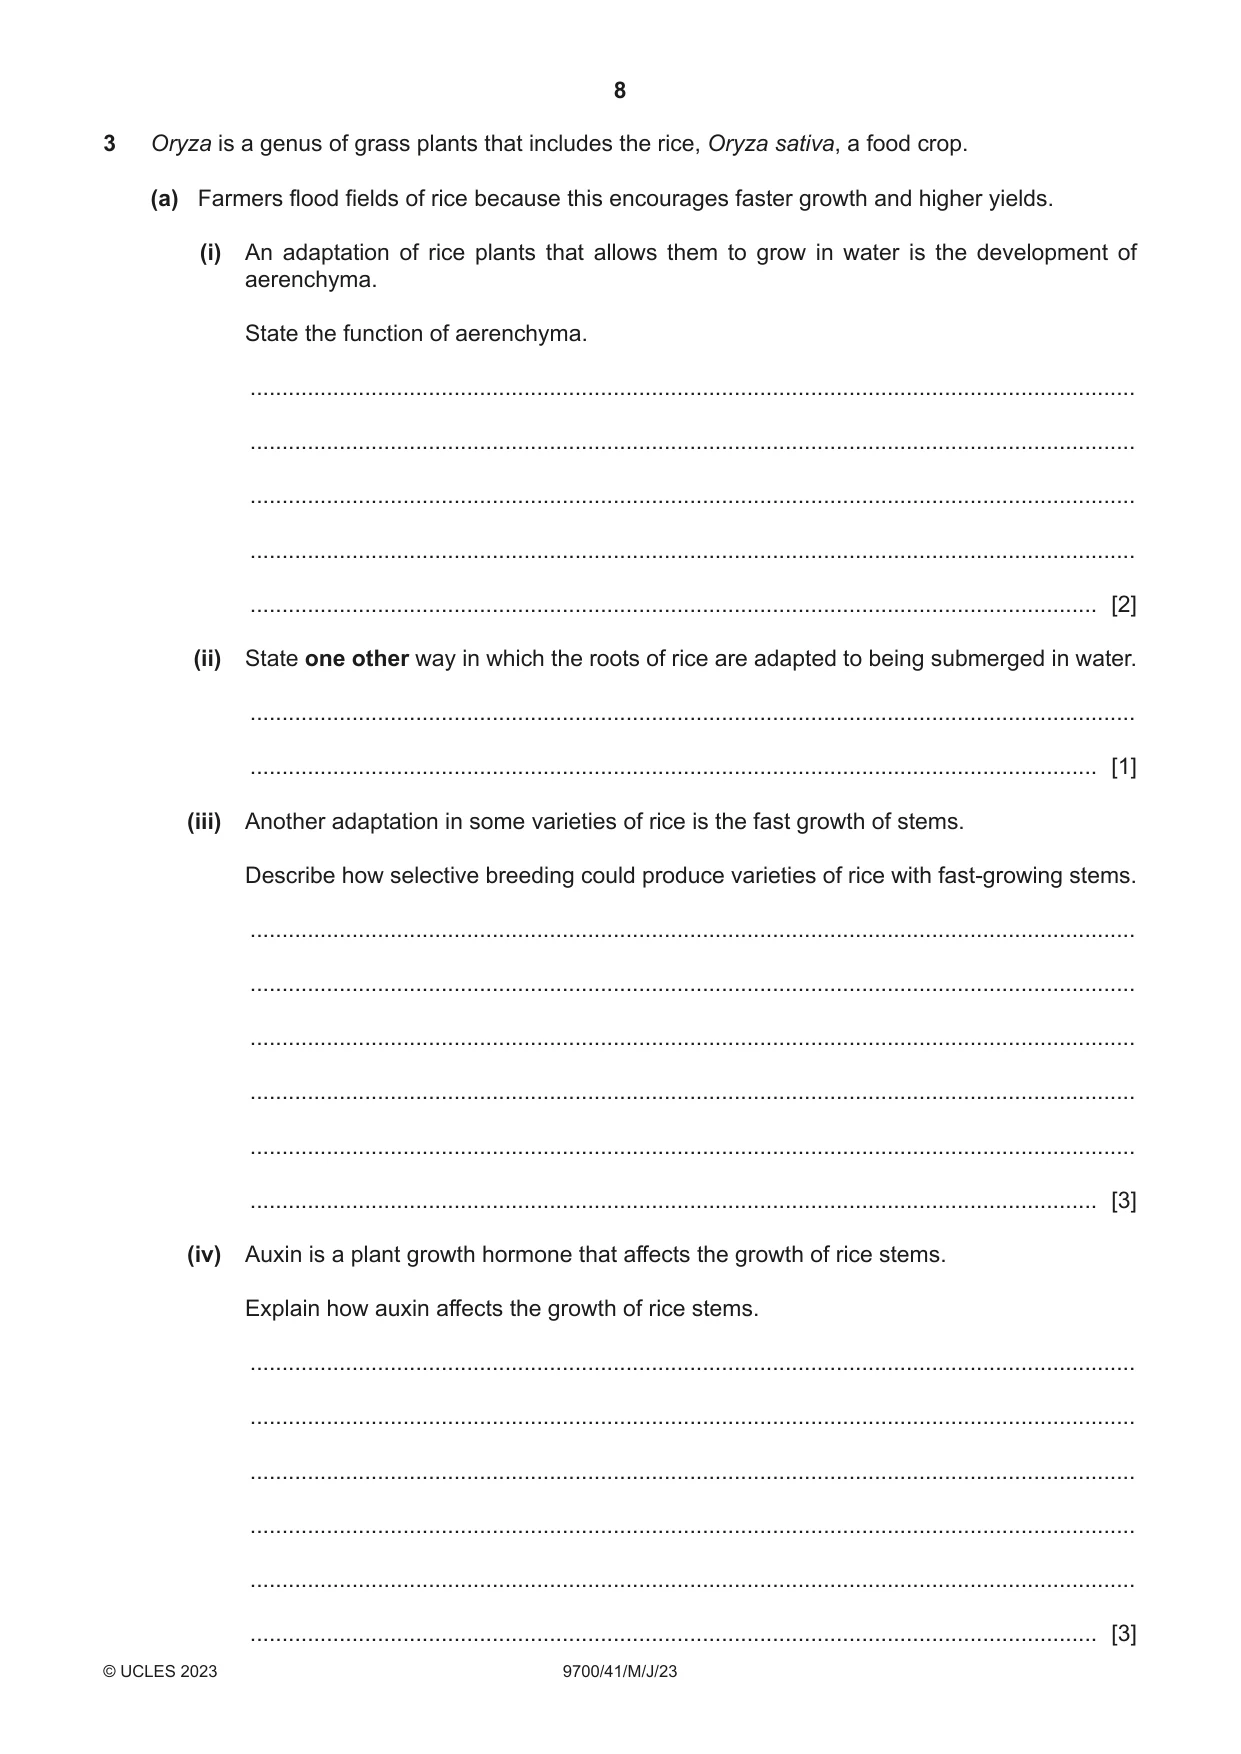
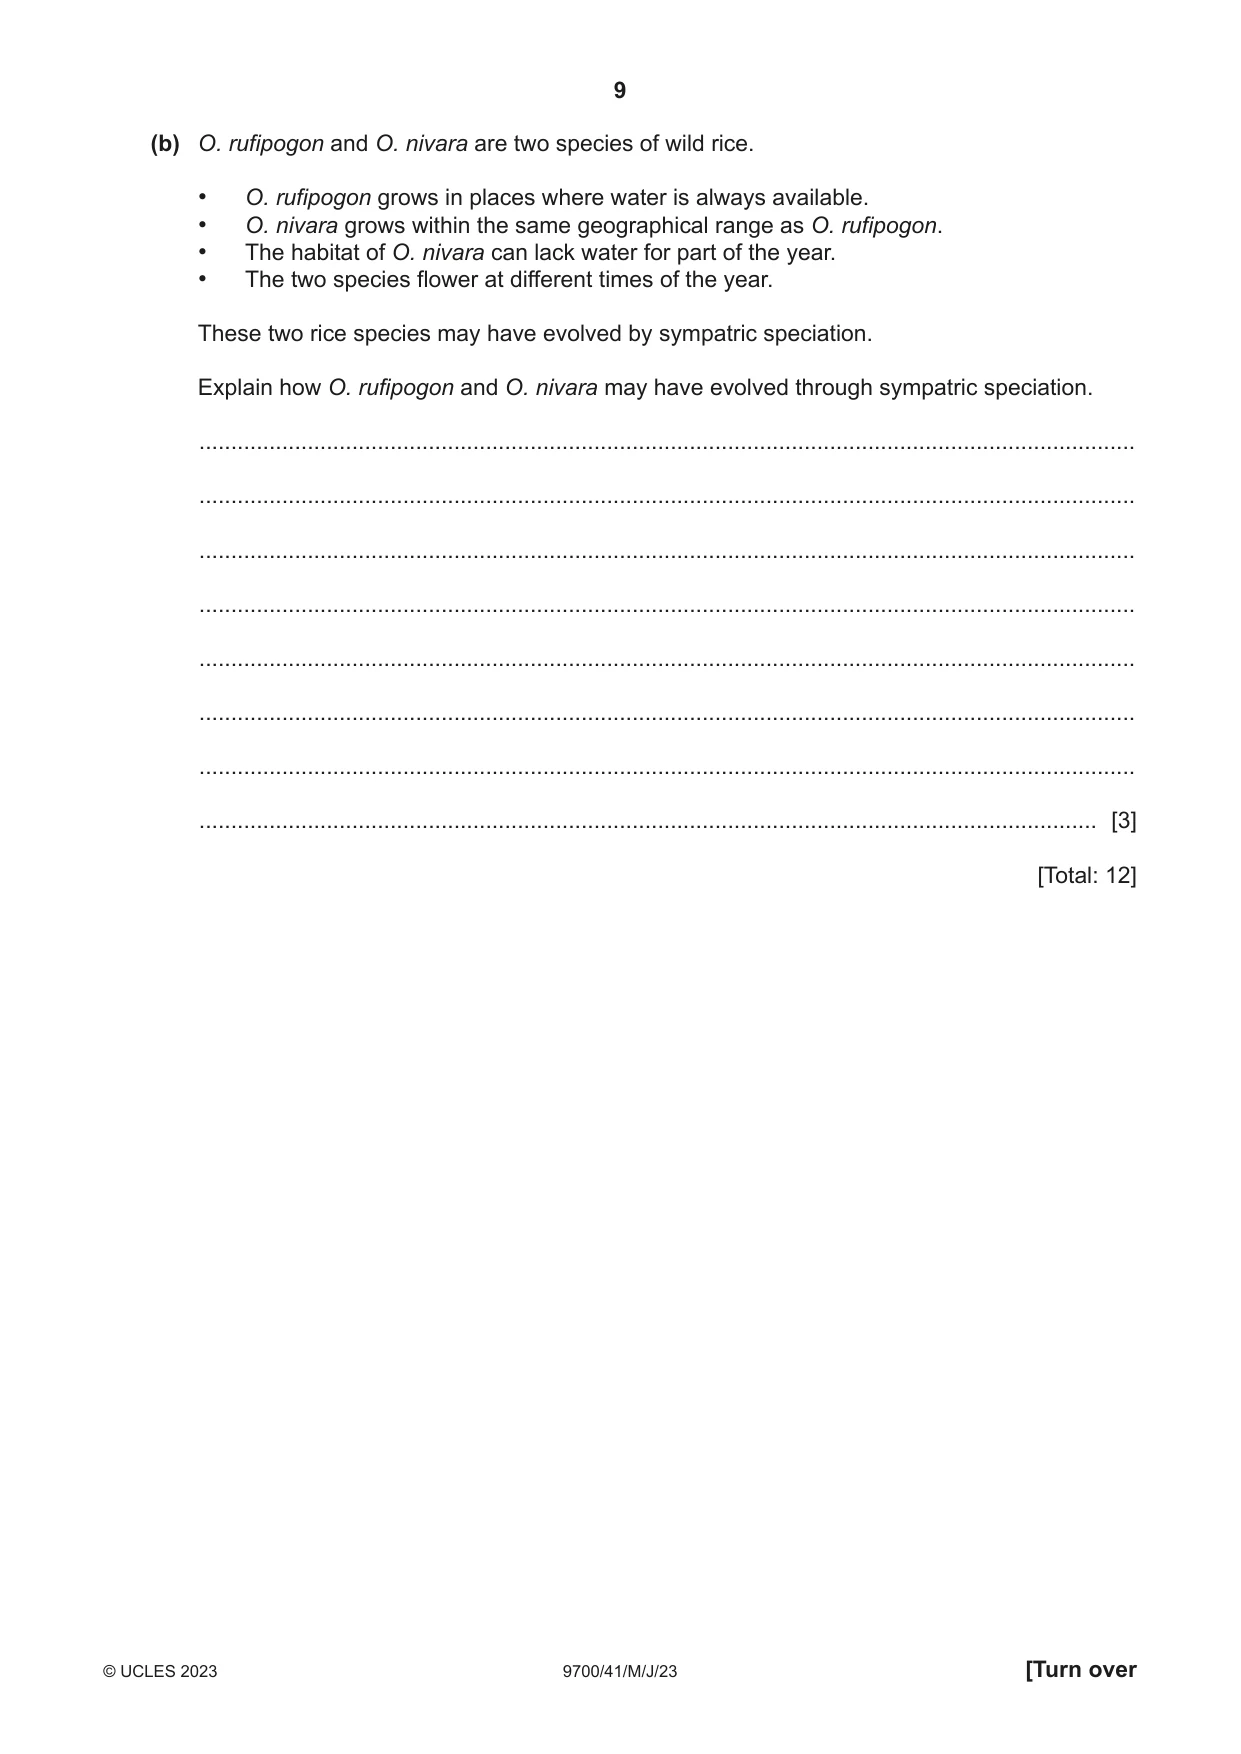
3 Oryza is a genus of grass plants that includes the rice, Oryza sativa, a food crop. (a) Farmers flood fields of rice because this encourages faster growth and higher yields. (i) An adaptation of rice plants that allows them to grow in water is the development of aerenchyma. State the function of aerenchyma. ........................................................................................................................................... ........................................................................................................................................... ........................................................................................................................................... ........................................................................................................................................... ..................................................................................................................................... [2] (ii) State one other way in which the roots of rice are adapted to being submerged in water. ........................................................................................................................................... ..................................................................................................................................... [1] (iii) Another adaptation in some varieties of rice is the fast growth of stems. Describe how selective breeding could produce varieties of rice with fast-growing stems. ........................................................................................................................................... ........................................................................................................................................... ........................................................................................................................................... ........................................................................................................................................... ........................................................................................................................................... ..................................................................................................................................... [3] (iv) Auxin is a plant growth hormone that affects the growth of rice stems. Explain how auxin affects the growth of rice stems. ........................................................................................................................................... ........................................................................................................................................... ........................................................................................................................................... ........................................................................................................................................... ........................................................................................................................................... ..................................................................................................................................... [3] (b) O. rufipogon and O. nivara are two species of wild rice. • O. rufipogon grows in places where water is always available. • O. nivara grows within the same geographical range as O. rufipogon. • The habitat of O. nivara can lack water for part of the year. • The two species flower at different times of the year. These two rice species may have evolved by sympatric speciation. Explain how O. rufipogon and O. nivara may have evolved through sympatric speciation. ................................................................................................................................................... ................................................................................................................................................... ................................................................................................................................................... ................................................................................................................................................... ................................................................................................................................................... ................................................................................................................................................... ................................................................................................................................................... ............................................................................................................................................. [3] [Total: 12]
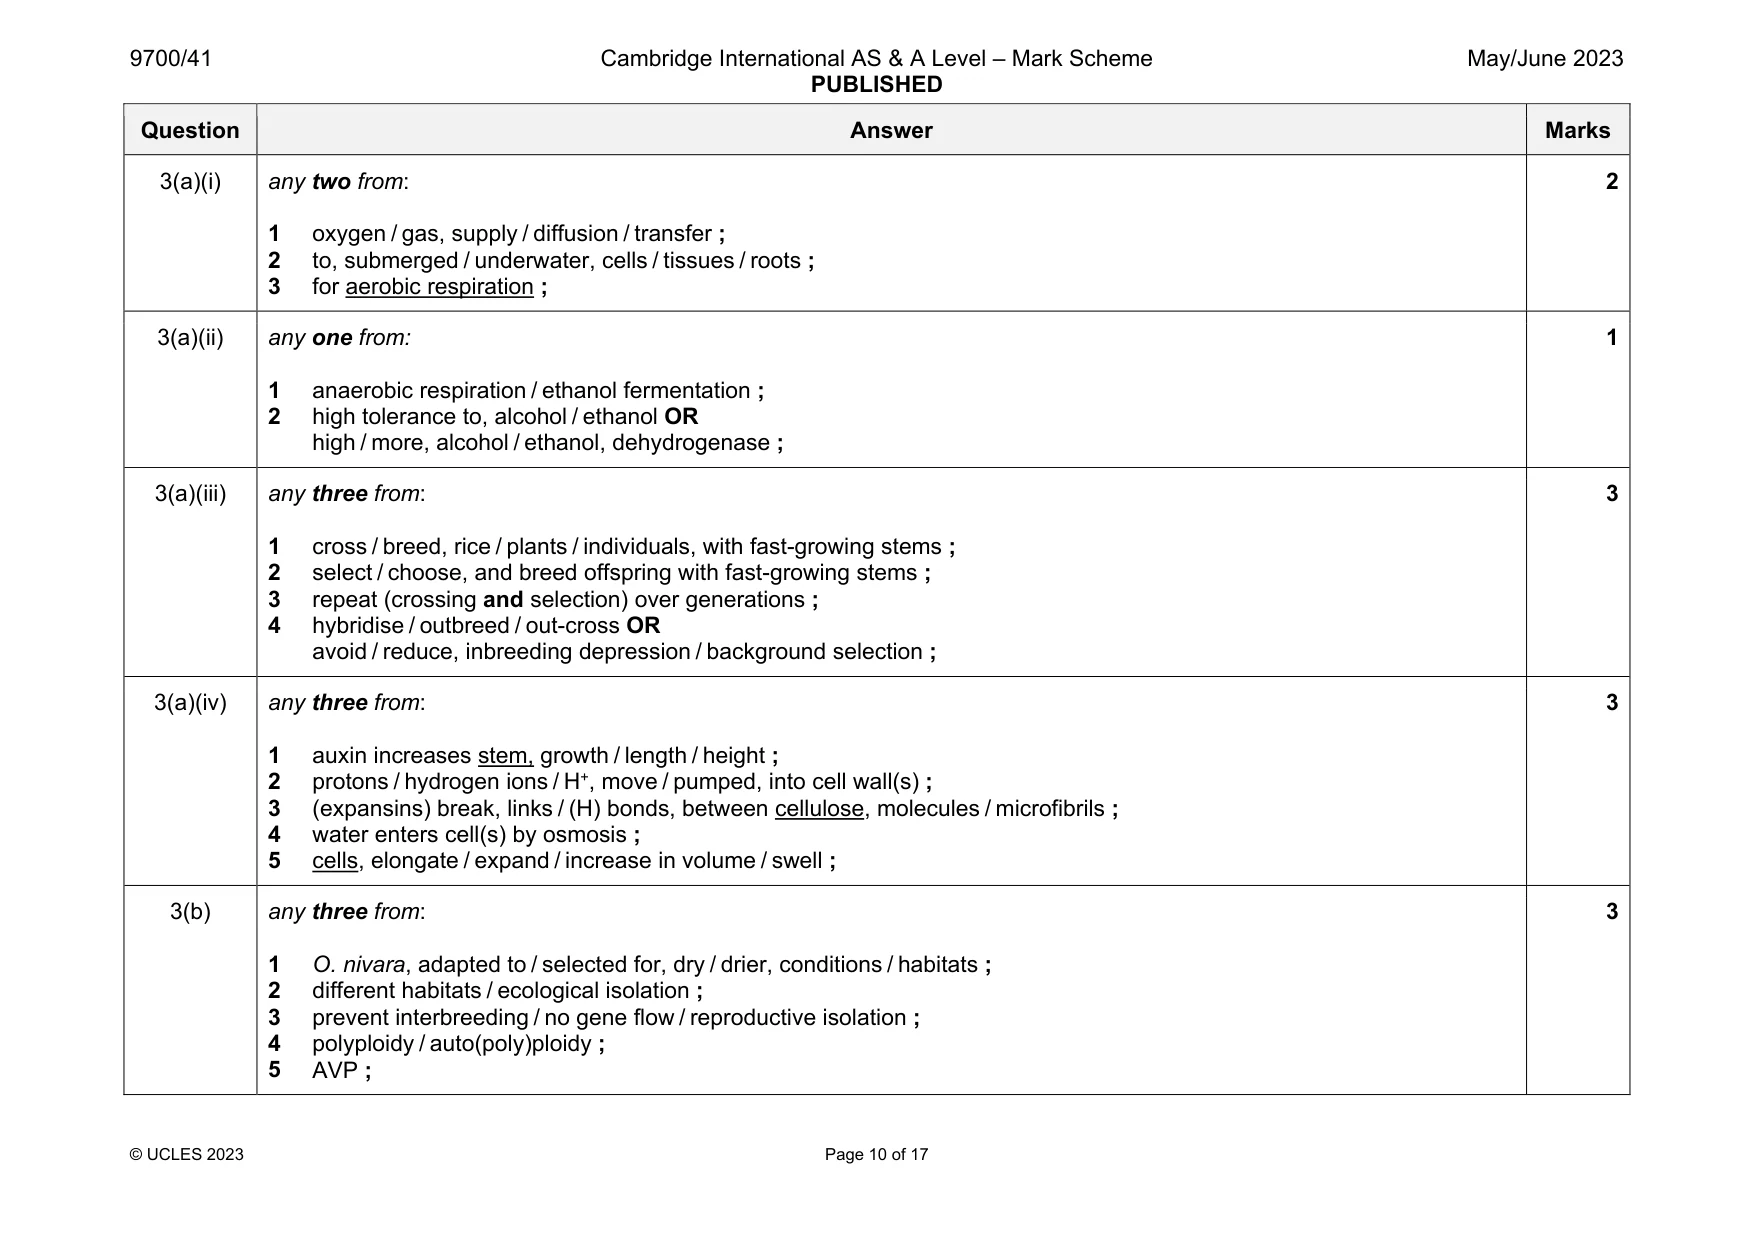
Mark scheme: 3(a)(i) any two from: 1 oxygen / gas, supply / diffusion / transfer ; 2 to, submerged / underwater, cells / tissues / roots ; 3 for aerobic respiration ; 2 3(a)(ii) any one from: 1 anaerobic respiration / ethanol fermentation ; 2 high tolerance to, alcohol / ethanol OR high / more, alcohol / ethanol, dehydrogenase ; 1 3(a)(iii) any three from: 1 cross / breed, rice / plants / individuals, with fast-growing stems ; 2 select / choose, and breed offspring with fast-growing stems ; 3 repeat (crossing and selection) over generations ; 4 hybridise / outbreed / out-cross OR avoid / reduce, inbreeding depression / background selection ; 3 3(a)(iv) any three from: 1 auxin increases stem, growth / length / height ; 2 protons / hydrogen ions / H+, move / pumped, into cell wall(s) ; 3 (expansins) break, links / (H) bonds, between cellulose, molecules / microfibrils ; 4 water enters cell(s) by osmosis ; 5 cells, elongate / expand / increase in volume / swell ; 3 3(b) any three from: 1 O. nivara, adapted to / selected for, dry / drier, conditions / habitats ; 2 different habitats / ecological isolation ; 3 prevent interbreeding / no gene flow / reproductive isolation ; 4 polyploidy / auto(poly)ploidy ; 5 AVP ; 3
Q4 · Recombinant human proteins can be used to treat disease
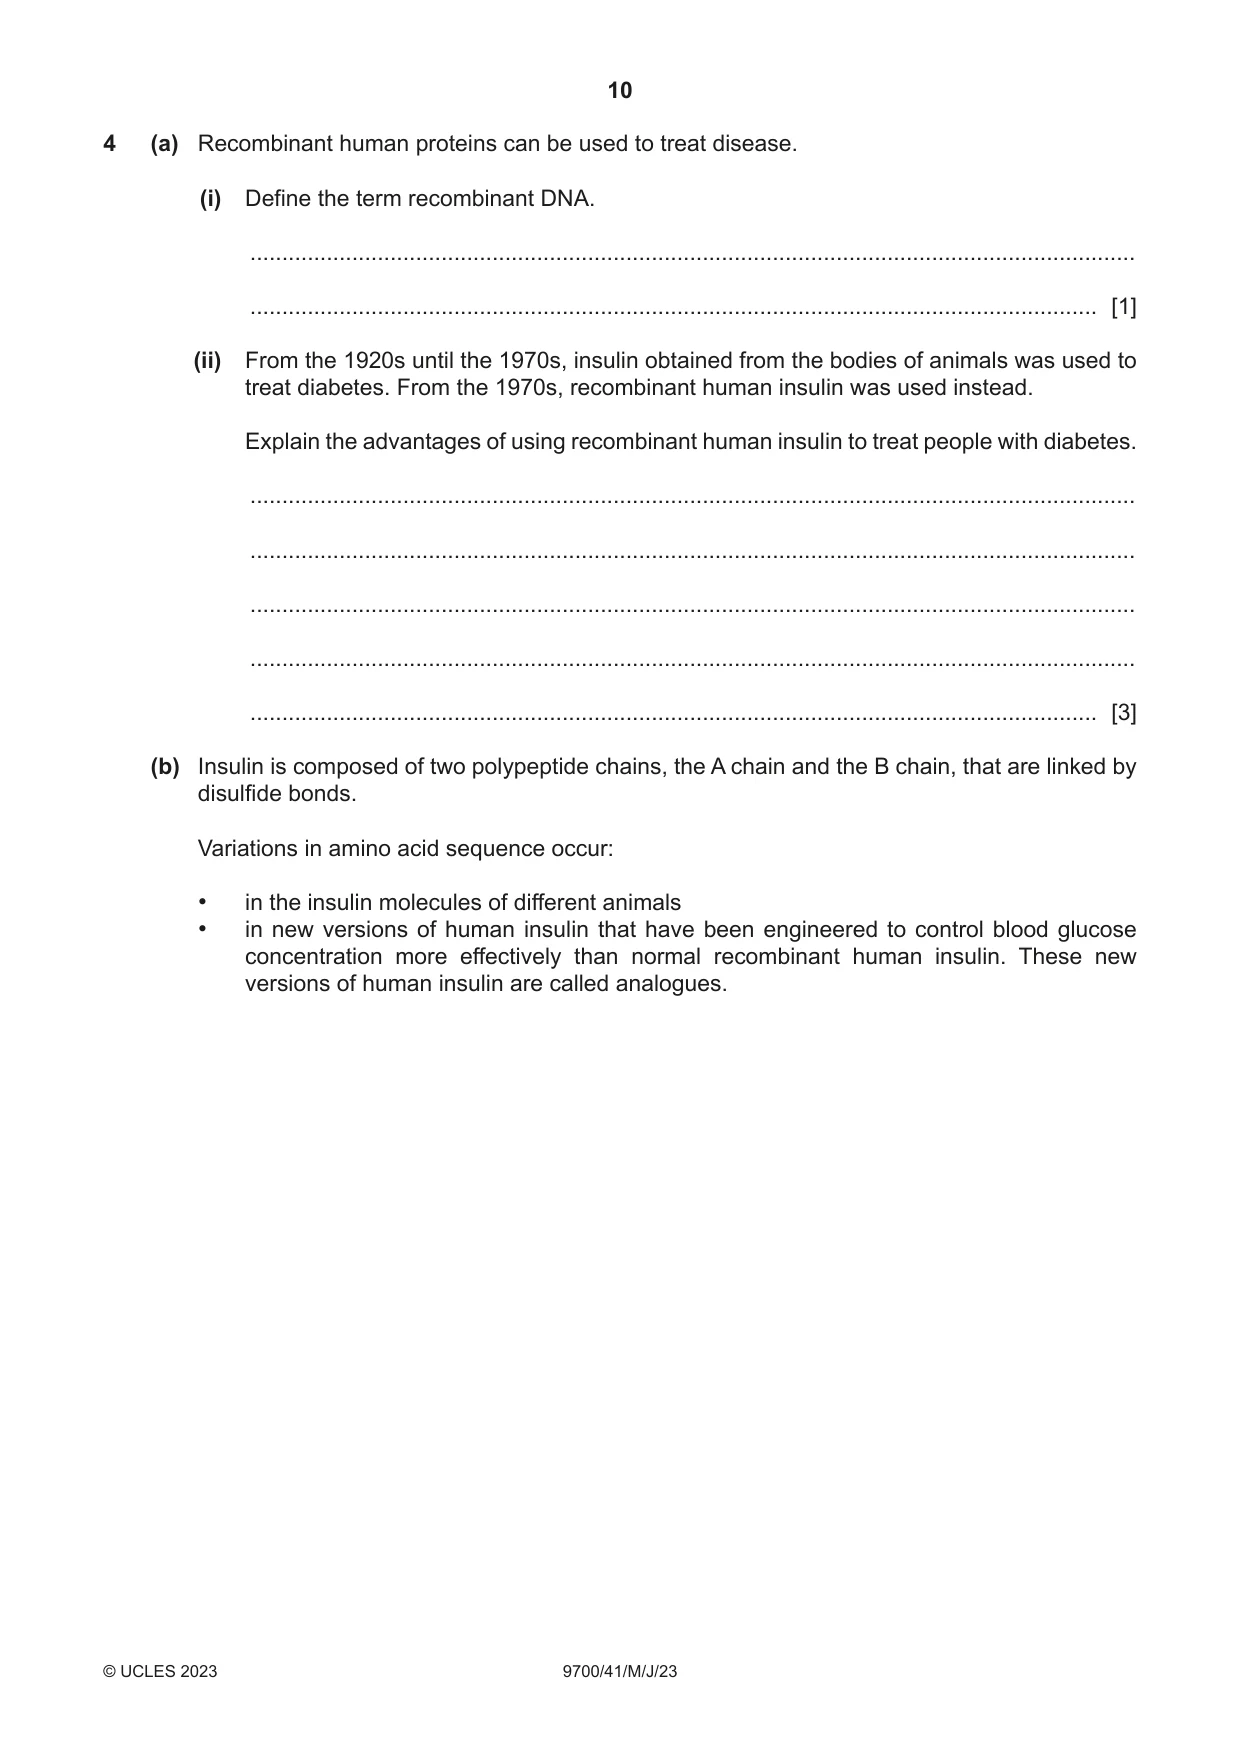
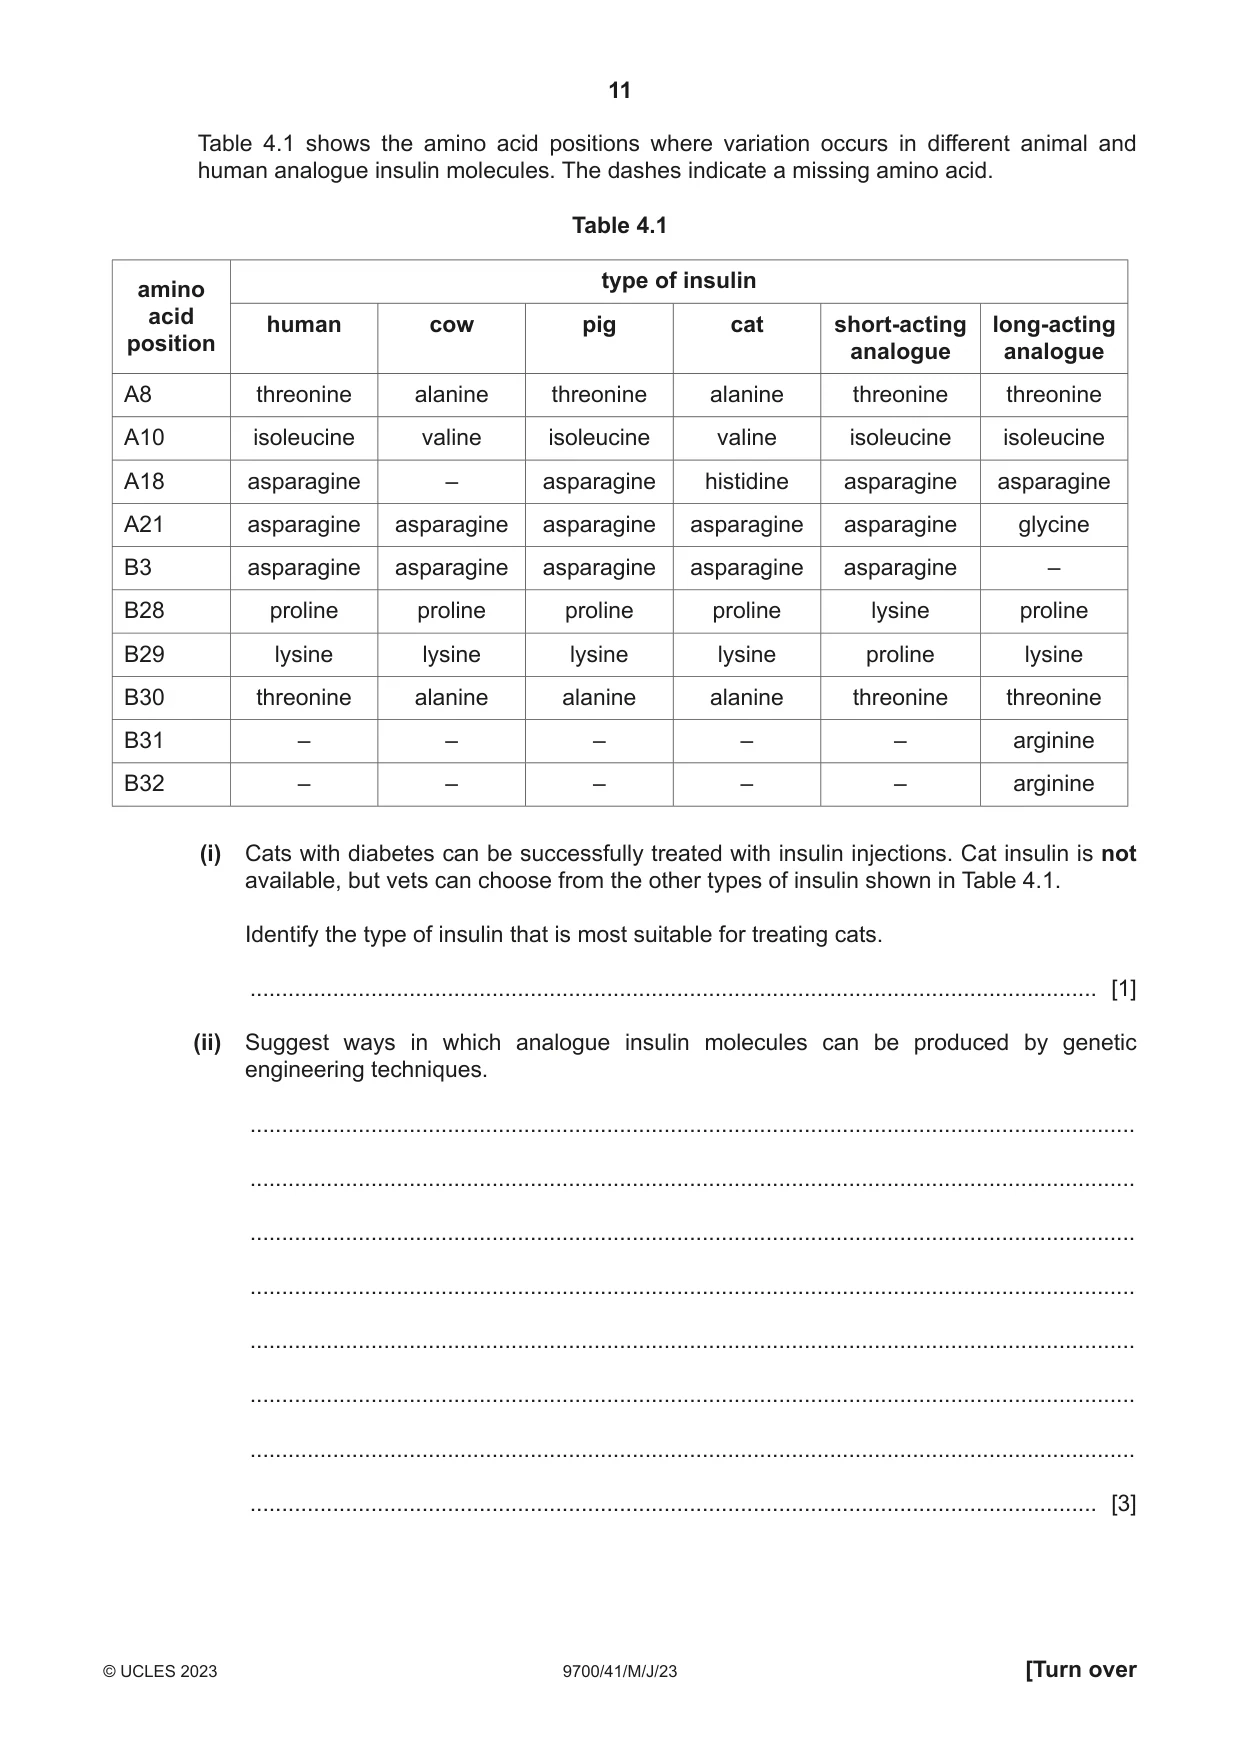
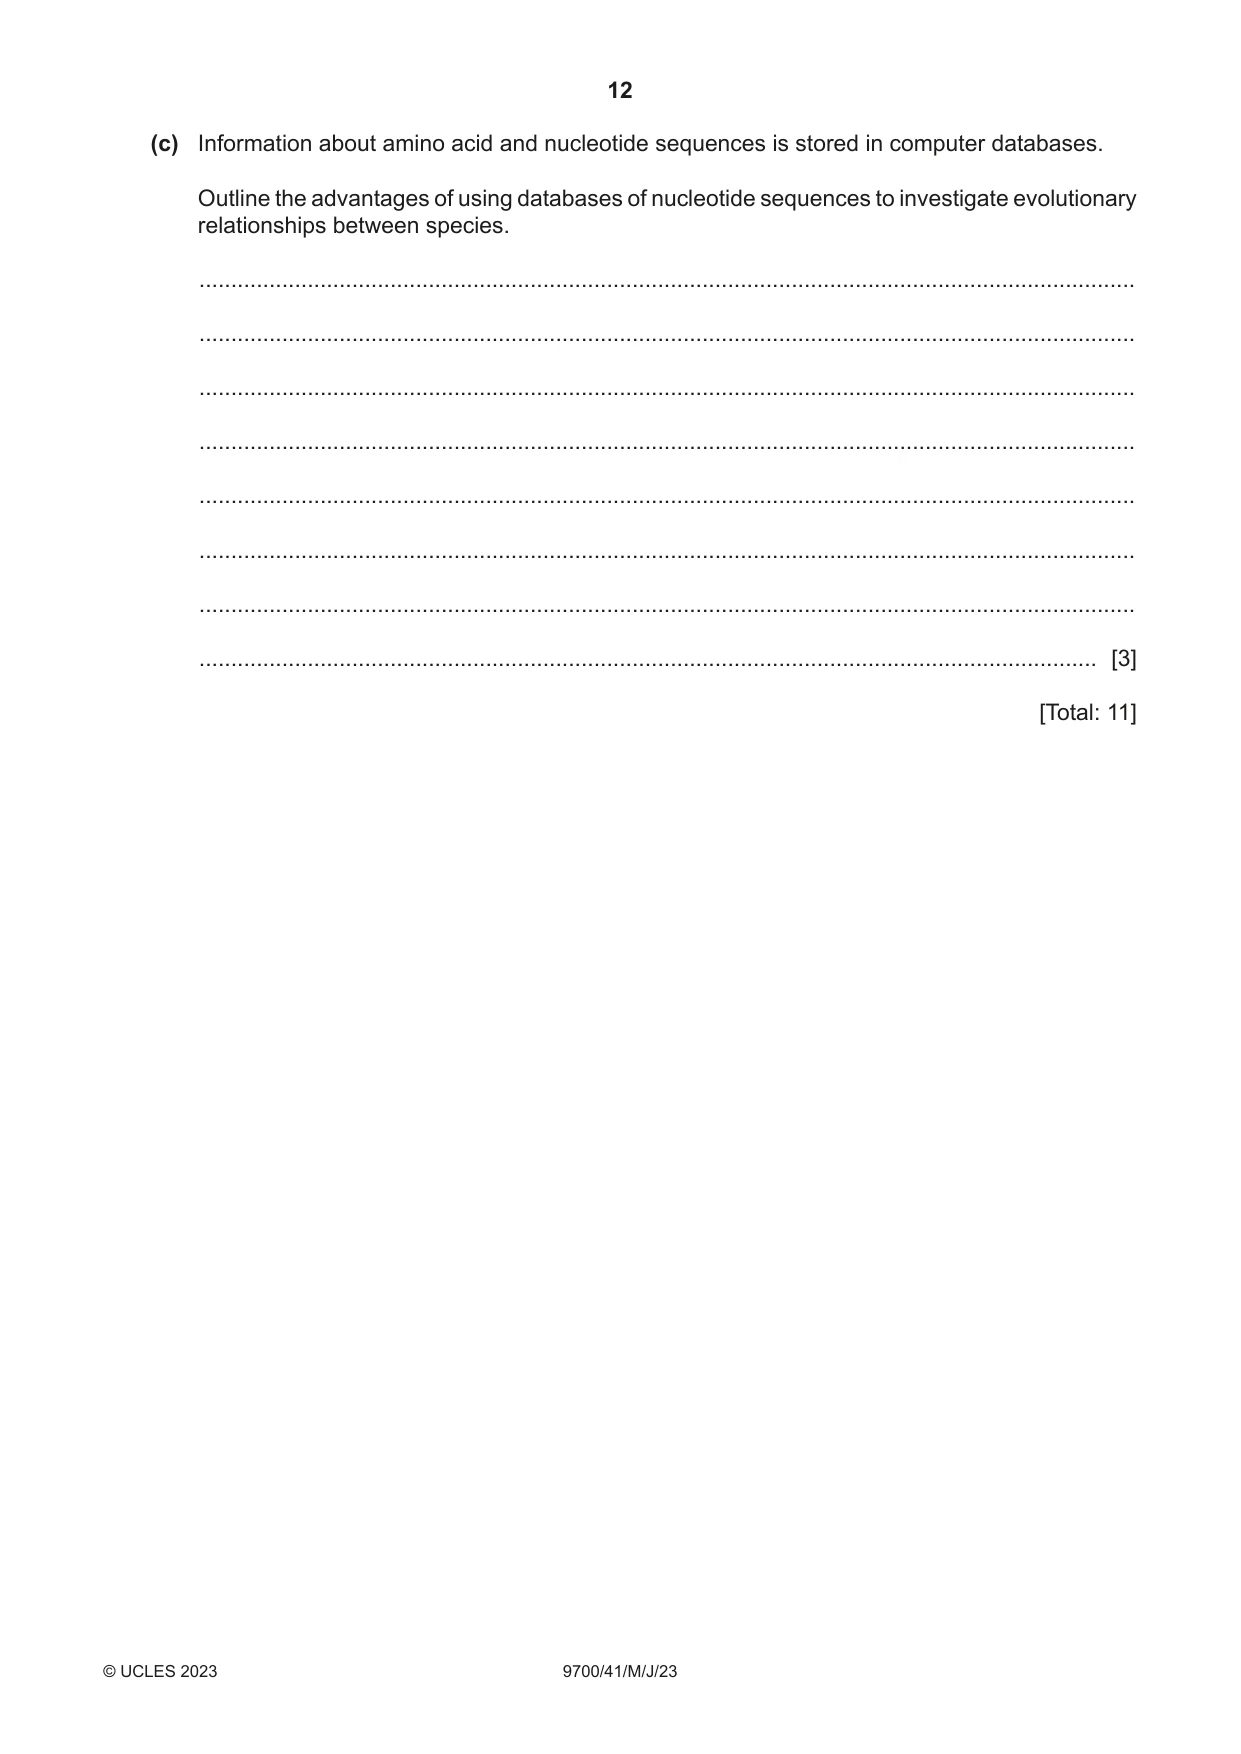
4 (a) Recombinant human proteins can be used to treat disease. (i) Define the term recombinant DNA. ........................................................................................................................................... ..................................................................................................................................... [1] (ii) From the 1920s until the 1970s, insulin obtained from the bodies of animals was used to treat diabetes. From the 1970s, recombinant human insulin was used instead. Explain the advantages of using recombinant human insulin to treat people with diabetes. ........................................................................................................................................... ........................................................................................................................................... ........................................................................................................................................... ........................................................................................................................................... ..................................................................................................................................... [3] (b) Insulin is composed of two polypeptide chains, the A chain and the B chain, that are linked by disulfide bonds. Variations in amino acid sequence occur: • in the insulin molecules of different animals • in new versions of human insulin that have been engineered to control blood glucose concentration more effectively than normal recombinant human insulin. These new versions of human insulin are called analogues. Table 4.1 shows the amino acid positions where variation occurs in different animal and human analogue insulin molecules. The dashes indicate a missing amino acid. Table 4.1 type of insulin amino acid human cow pig cat short-acting long-acting position analogue analogue A8 threonine alanine threonine alanine threonine threonine A10 isoleucine valine isoleucine valine isoleucine isoleucine A18 asparagine – asparagine histidine asparagine asparagine A21 asparagine asparagine asparagine asparagine asparagine glycine B3 asparagine asparagine asparagine asparagine asparagine – B28 proline proline proline proline lysine proline B29 lysine lysine lysine lysine proline lysine B30 threonine alanine alanine alanine threonine threonine B31 – – – – – arginine B32 – – – – – arginine (i) Cats with diabetes can be successfully treated with insulin injections. Cat insulin is not available, but vets can choose from the other types of insulin shown in Table 4.1. Identify the type of insulin that is most suitable for treating cats. ..................................................................................................................................... [1] (ii) Suggest ways in which analogue insulin molecules can be produced by genetic engineering techniques. ........................................................................................................................................... ........................................................................................................................................... ........................................................................................................................................... ........................................................................................................................................... ........................................................................................................................................... ........................................................................................................................................... ........................................................................................................................................... ..................................................................................................................................... [3] (c) Information about amino acid and nucleotide sequences is stored in computer databases. Outline the advantages of using databases of nucleotide sequences to investigate evolutionary relationships between species. ................................................................................................................................................... ................................................................................................................................................... ................................................................................................................................................... ................................................................................................................................................... ................................................................................................................................................... ................................................................................................................................................... ................................................................................................................................................... ............................................................................................................................................. [3] [Total: 11]
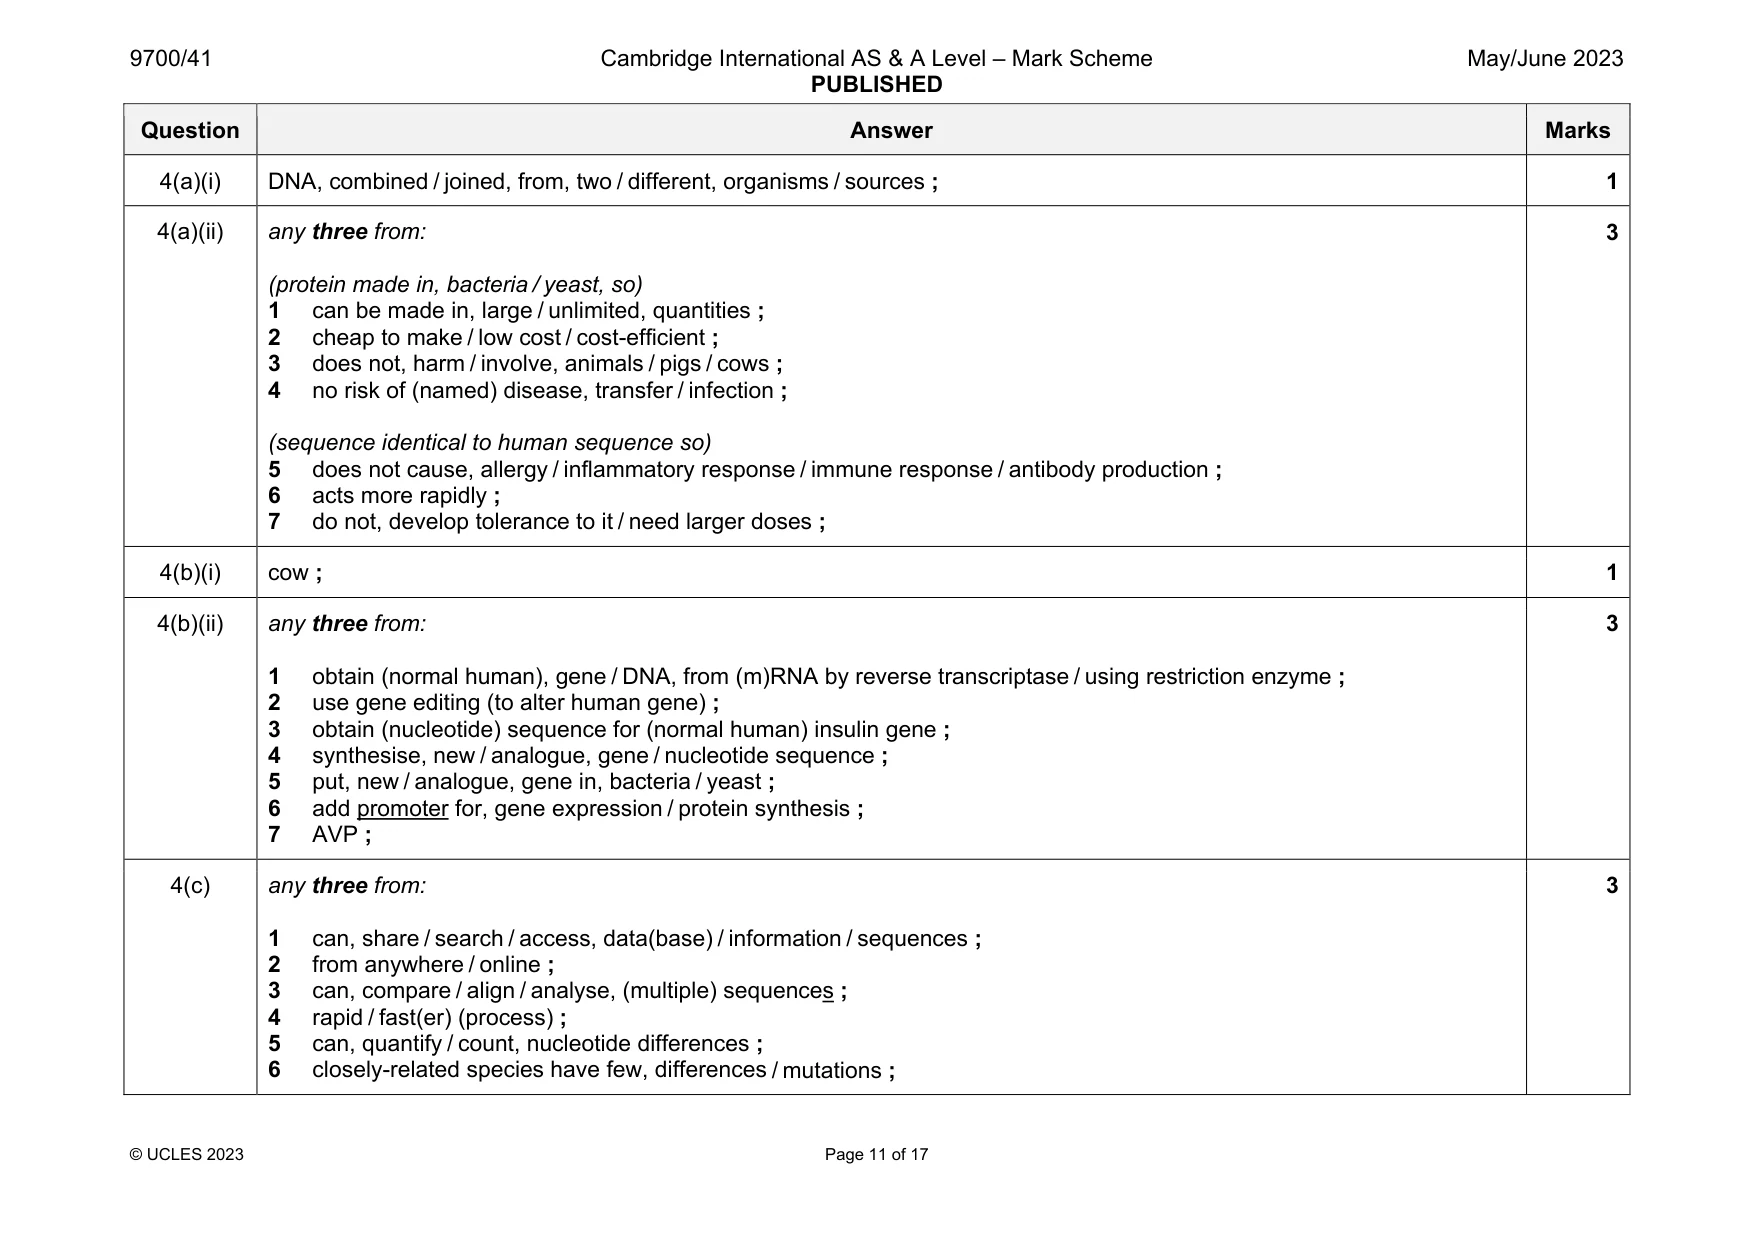
Mark scheme: 4(a)(i) DNA, combined / joined, from, two / different, organisms / sources ; 1 4(a)(ii) any three from: (protein made in, bacteria / yeast, so) 1 can be made in, large / unlimited, quantities ; 2 cheap to make / low cost / cost-efficient ; 3 does not, harm / involve, animals / pigs / cows ; 4 no risk of (named) disease, transfer / infection ; (sequence identical to human sequence so) 5 does not cause, allergy / inflammatory response / immune response / antibody production ; 6 acts more rapidly ; 7 do not, develop tolerance to it / need larger doses ; 3 4(b)(i) cow ; 1 4(b)(ii) any three from: 1 obtain (normal human), gene / DNA, from (m)RNA by reverse transcriptase / using restriction enzyme ; 2 use gene editing (to alter human gene) ; 3 obtain (nucleotide) sequence for (normal human) insulin gene ; 4 synthesise, new / analogue, gene / nucleotide sequence ; 5 put, new / analogue, gene in, bacteria / yeast ; 6 add promoter for, gene expression / protein synthesis ; 7 AVP ; 3 4(c) any three from: 1 can, share / search / access, data(base) / information / sequences ; 2 from anywhere / online ; 3 can, compare / align / analyse, (multiple) sequences ; 4 rapid / fast(er) (process) ; 5 can, quantify / count, nucleotide differences ; 6 closely-related species have few, differences / mutations ; 3
Q5 · The kidney is an important organ of homeostasis
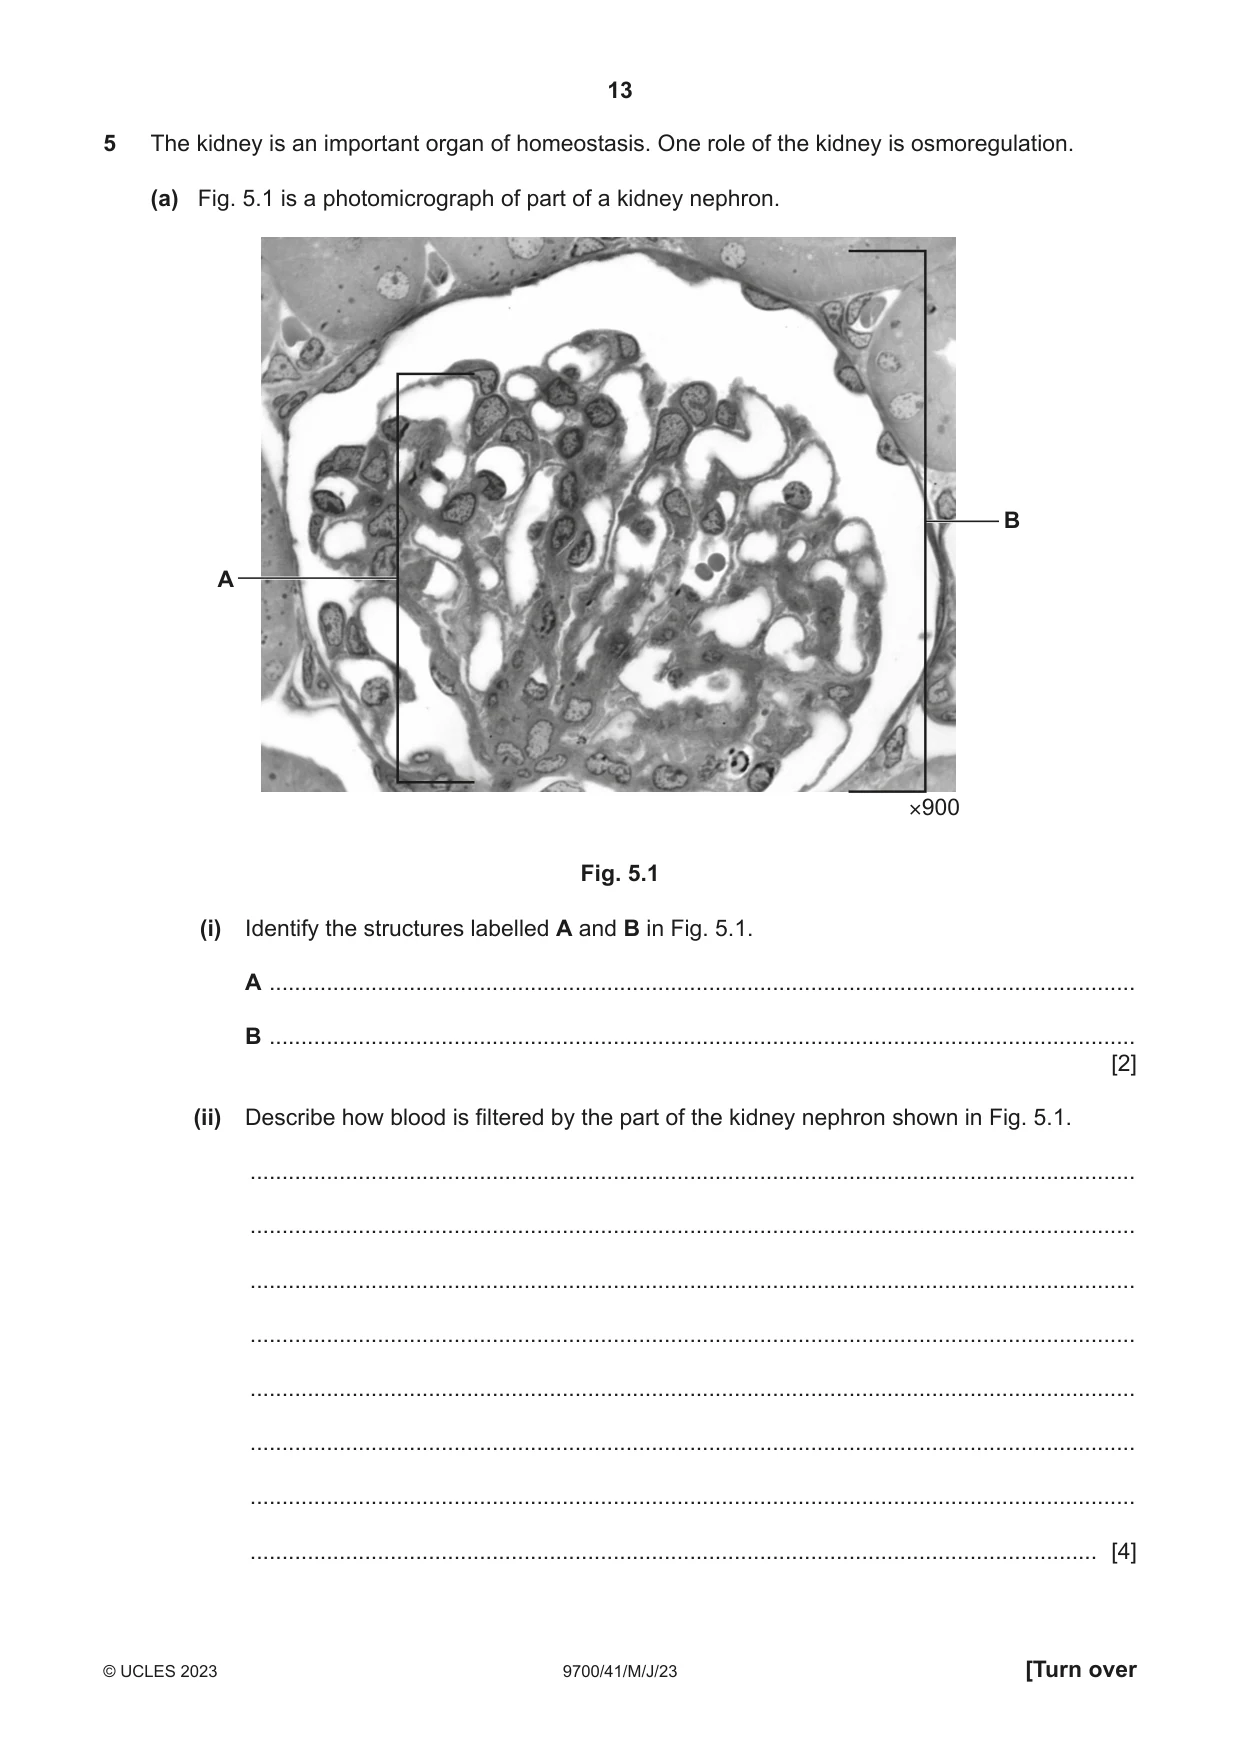
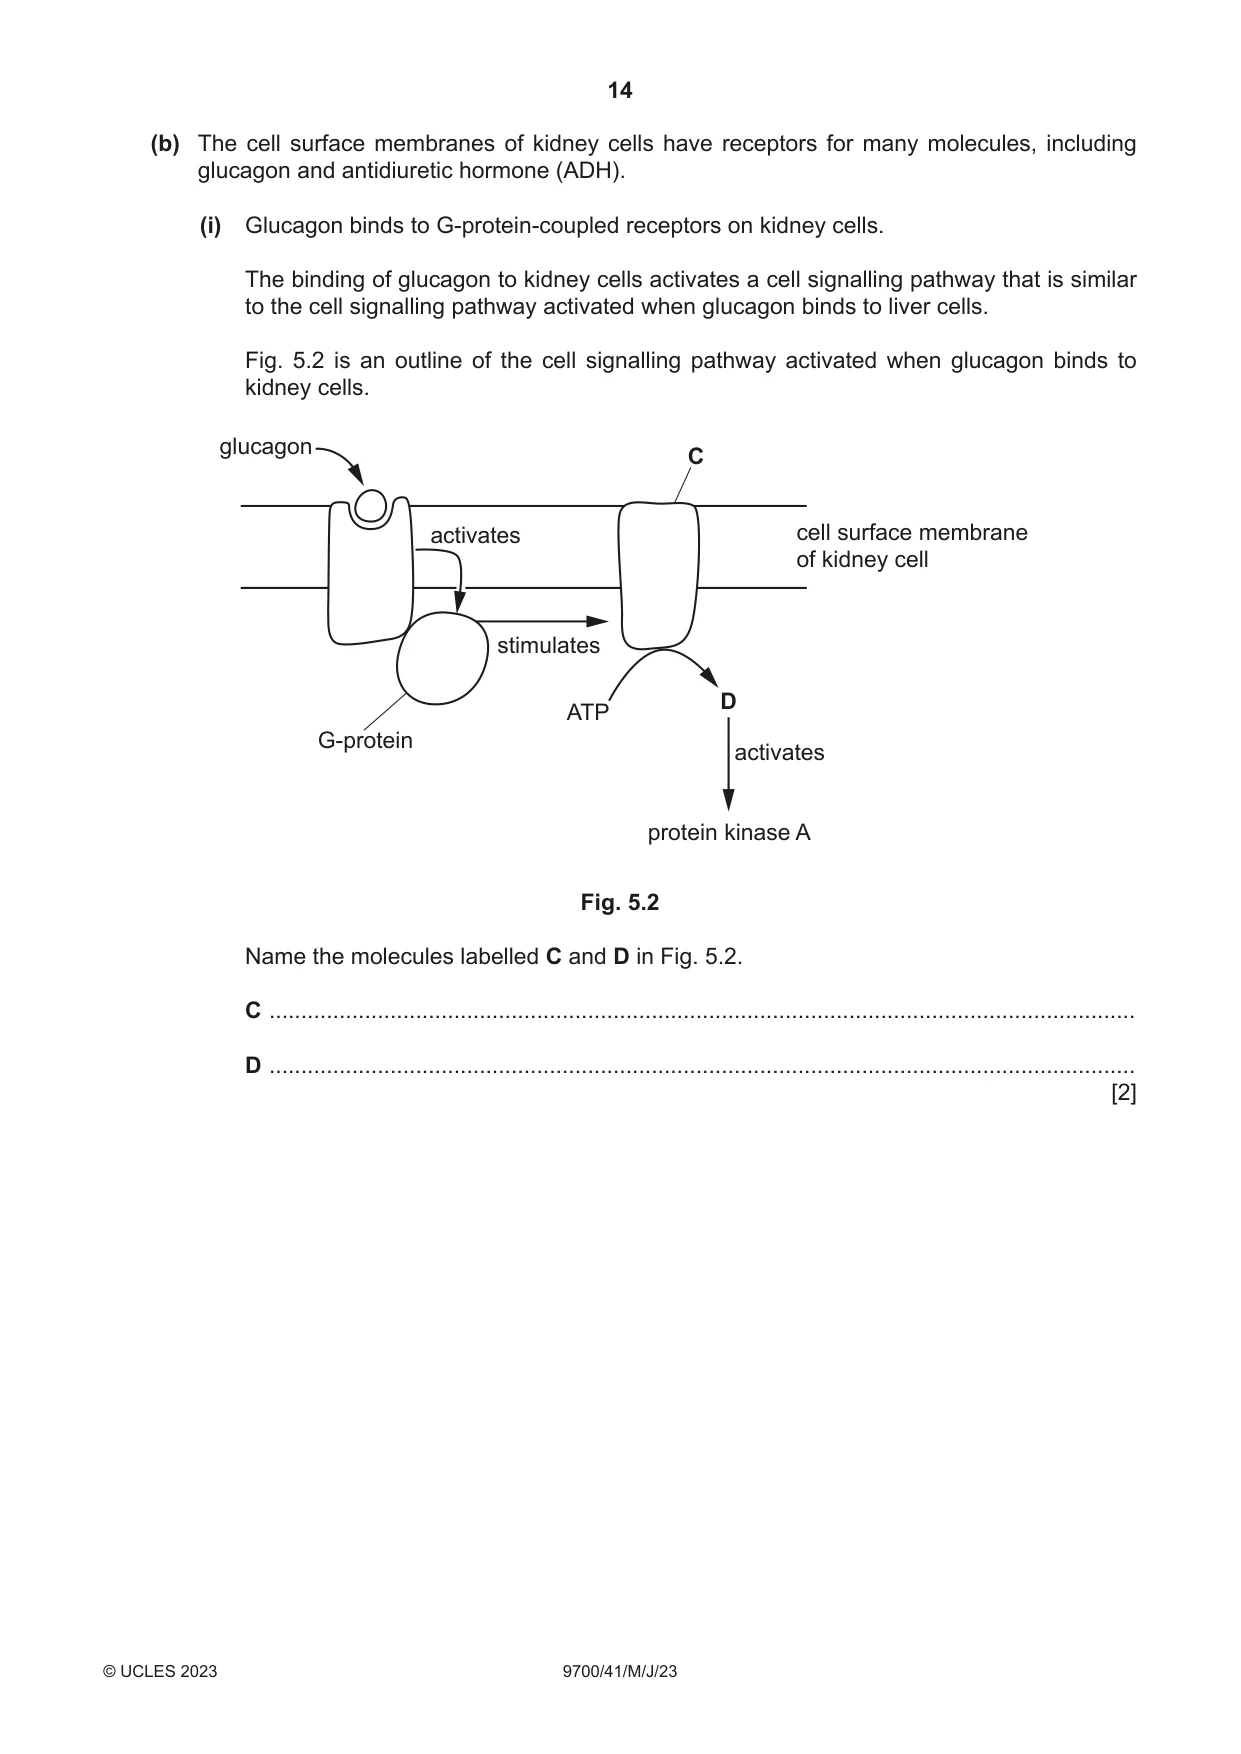
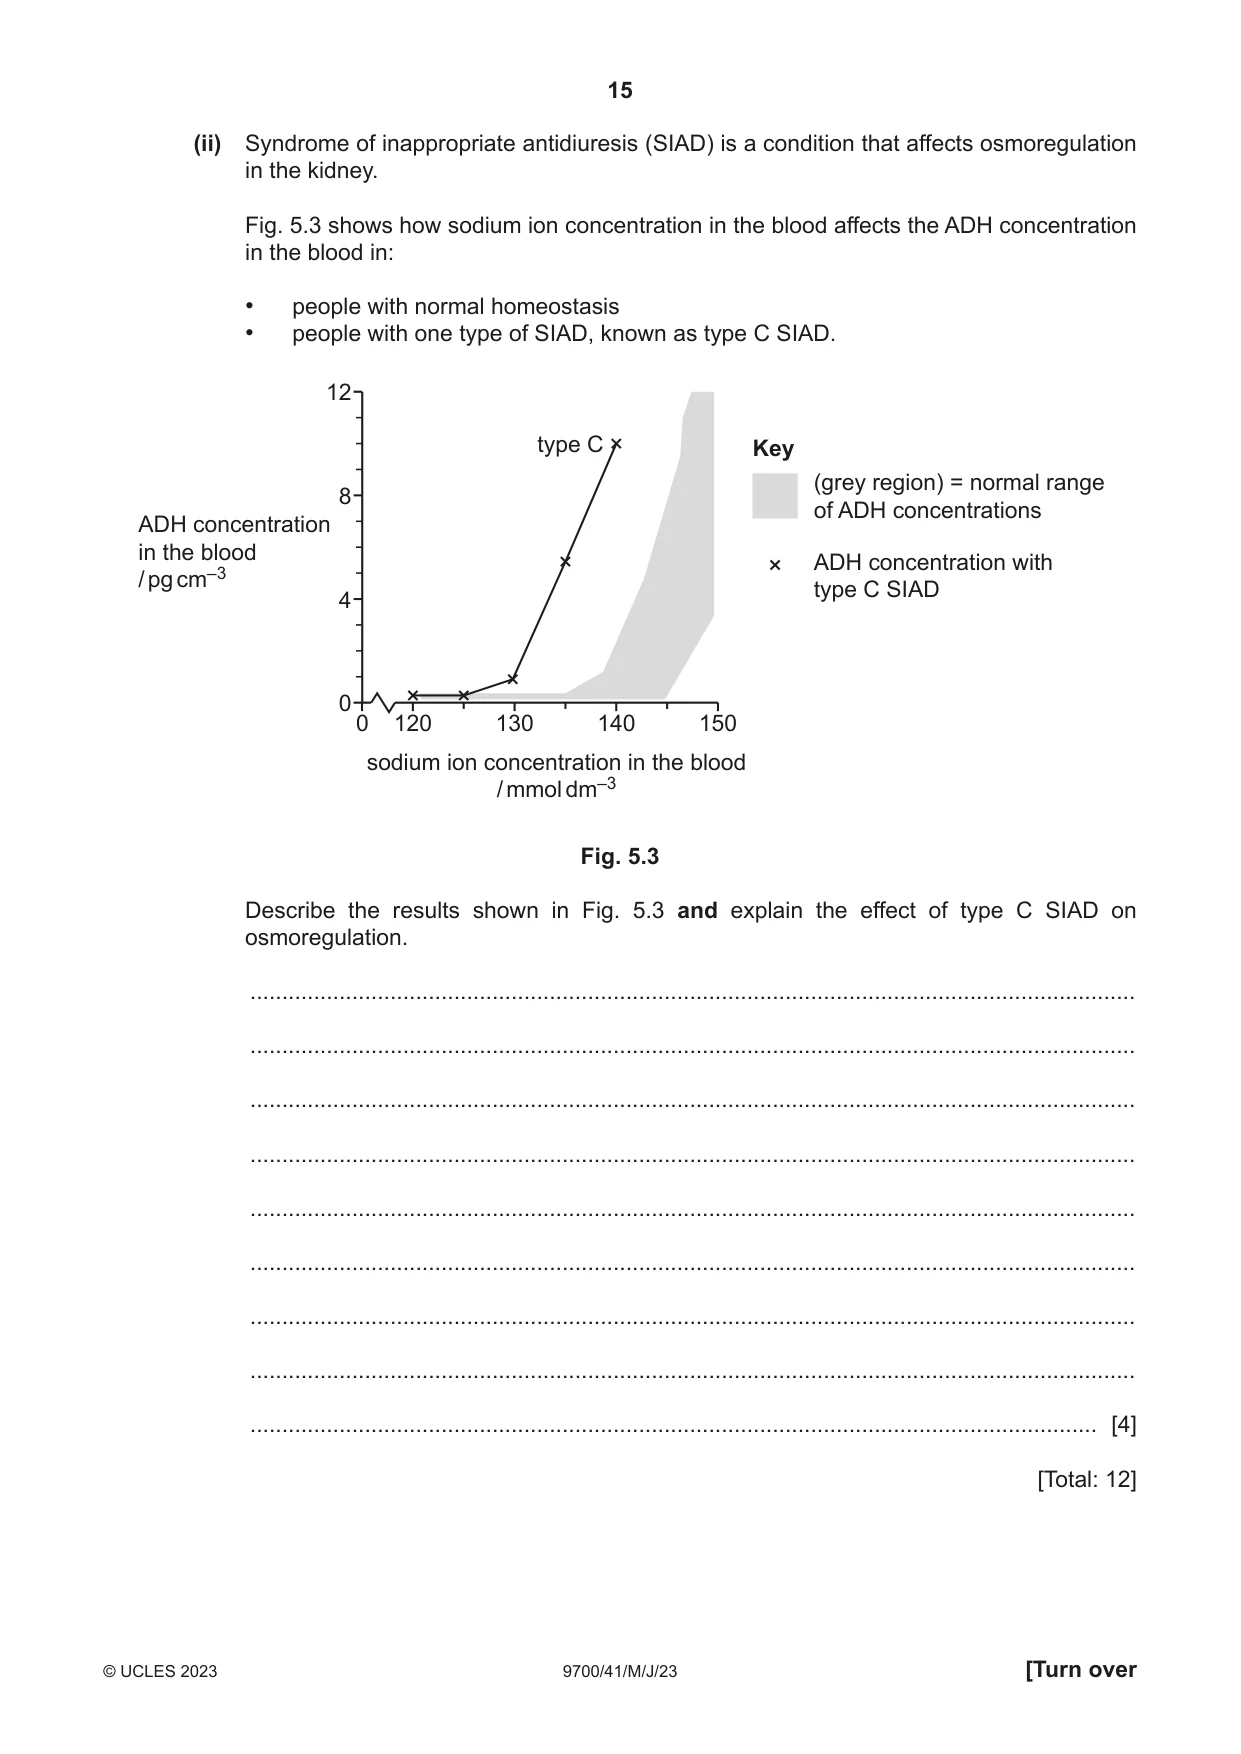
5 The kidney is an important organ of homeostasis. One role of the kidney is osmoregulation. (a) Fig. 5.1 is a photomicrograph of part of a kidney nephron. B A ×900 Fig. 5.1 (i) Identify the structures labelled A and B in Fig. 5.1. A ........................................................................................................................................ B ........................................................................................................................................ [2] (ii) Describe how blood is filtered by the part of the kidney nephron shown in Fig. 5.1. ........................................................................................................................................... ........................................................................................................................................... ........................................................................................................................................... ........................................................................................................................................... ........................................................................................................................................... ........................................................................................................................................... ........................................................................................................................................... ..................................................................................................................................... [4] (b) The cell surface membranes of kidney cells have receptors for many molecules, including glucagon and antidiuretic hormone (ADH). (i) Glucagon binds to G-protein-coupled receptors on kidney cells. The binding of glucagon to kidney cells activates a cell signalling pathway that is similar to the cell signalling pathway activated when glucagon binds to liver cells. Fig. 5.2 is an outline of the cell signalling pathway activated when glucagon binds to kidney cells. glucagon C activates cell surface membrane of kidney cell stimulates D ATP G-protein activates protein kinase A Fig. 5.2 Name the molecules labelled C and D in Fig. 5.2. C ........................................................................................................................................ D ........................................................................................................................................ [2] (ii) Syndrome of inappropriate antidiuresis (SIAD) is a condition that affects osmoregulation in the kidney. Fig. 5.3 shows how sodium ion concentration in the blood affects the ADH concentration in the blood in: • people with normal homeostasis • people with one type of SIAD, known as type C SIAD. 12 type C Key (grey region) = normal range 8 of ADH concentrationsADH concentration in the blood ADH concentration with / pg cm–3 type C SIAD 4 0 0 120 130 140 150 sodium ion concentration in the blood / mmol dm–3 Fig. 5.3 Describe the results shown in Fig. 5.3 and explain the effect of type C SIAD on osmoregulation. ........................................................................................................................................... ........................................................................................................................................... ........................................................................................................................................... ........................................................................................................................................... ........................................................................................................................................... ........................................................................................................................................... ........................................................................................................................................... ........................................................................................................................................... ..................................................................................................................................... [4] [Total: 12]
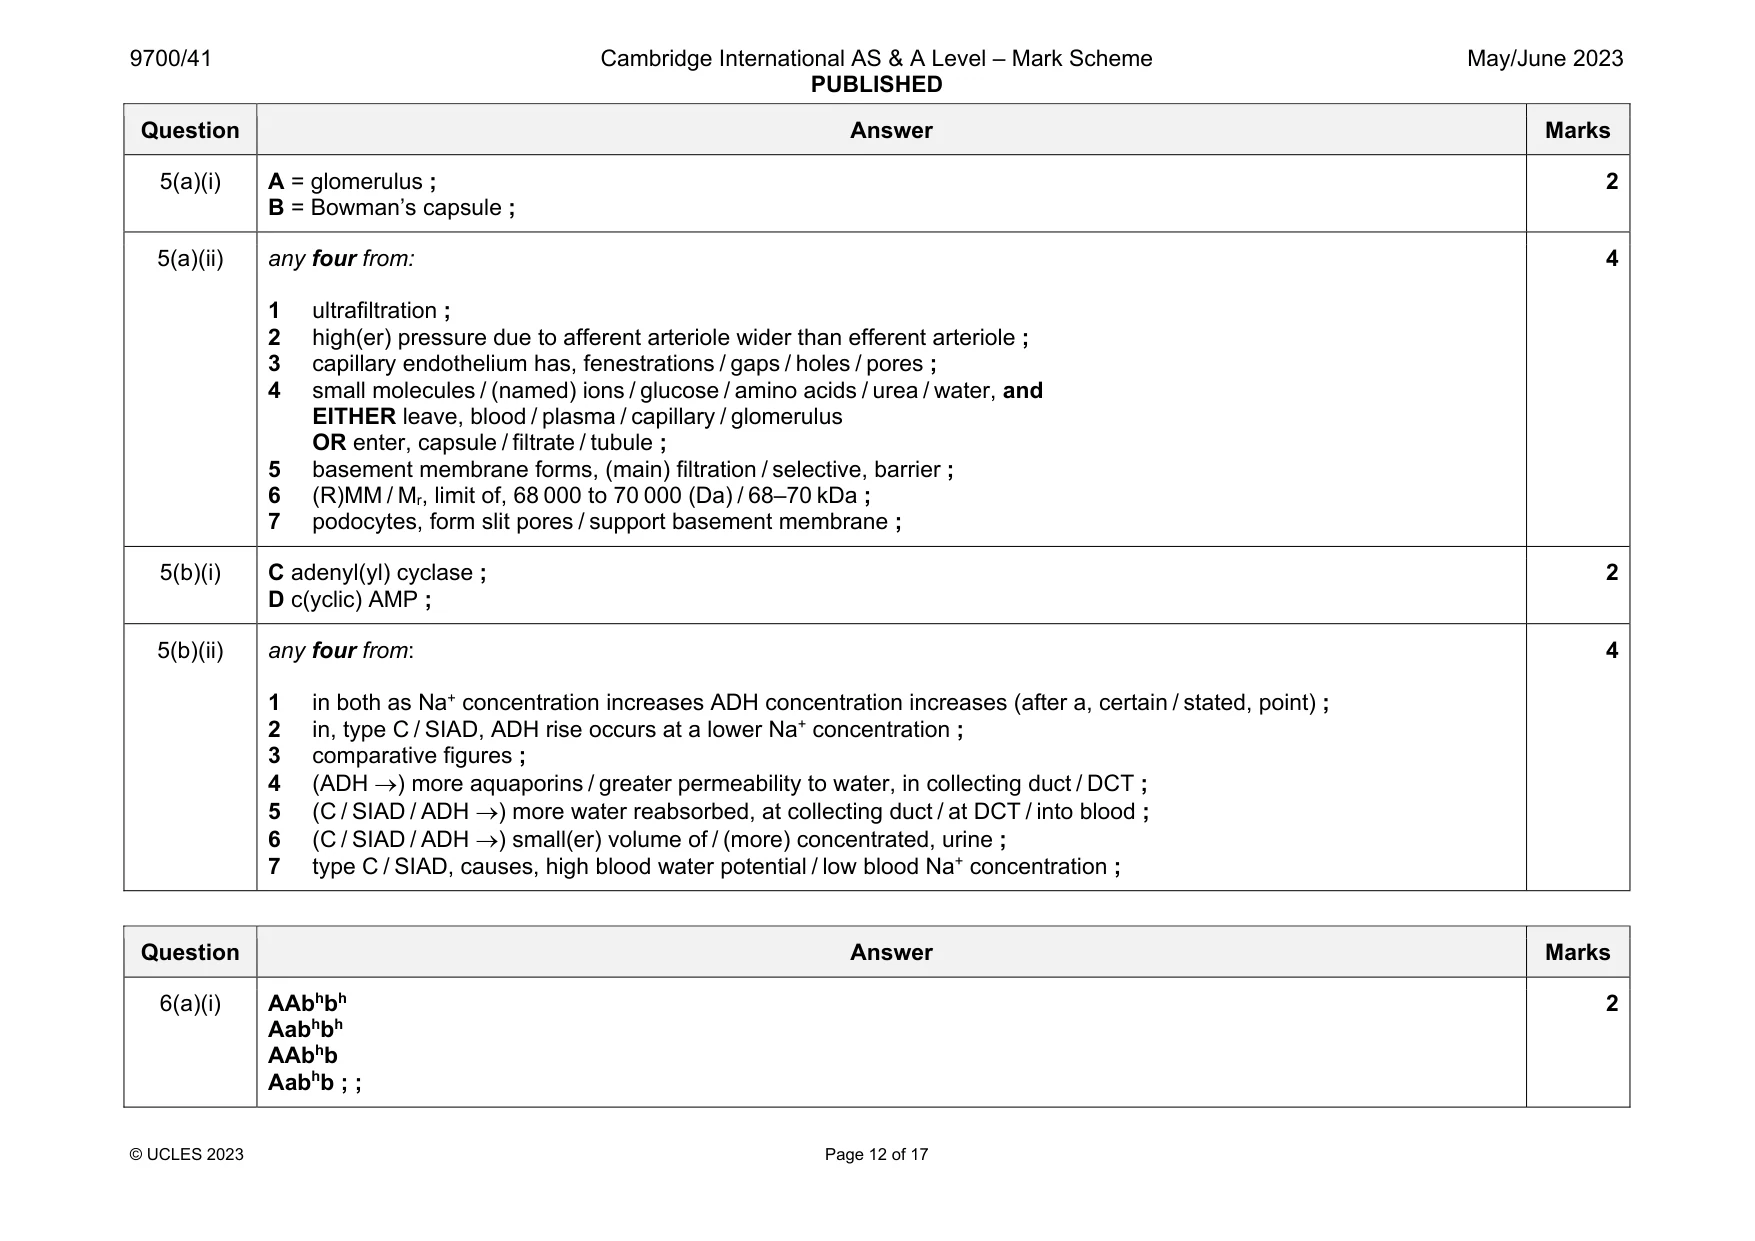
Mark scheme: 5(a)(i) A = glomerulus ; B = Bowman’s capsule ; 2 5(a)(ii) any four from: 1 ultrafiltration ; 2 high(er) pressure due to afferent arteriole wider than efferent arteriole ; 3 capillary endothelium has, fenestrations / gaps / holes / pores ; 4 small molecules / (named) ions / glucose / amino acids / urea / water, and EITHER leave, blood / plasma / capillary / glomerulus OR enter, capsule / filtrate / tubule ; 5 basement membrane forms, (main) filtration / selective, barrier ; 6 (R)MM / Mr, limit of, 68 000 to 70 000 (Da) / 68–70 kDa ; 7 podocytes, form slit pores / support basement membrane ; 4 5(b)(i) C adenyl(yl) cyclase ; D c(yclic) AMP ; 2 5(b)(ii) any four from: 1 in both as Na+ concentration increases ADH concentration increases (after a, certain / stated, point) ; 2 in, type C / SIAD, ADH rise occurs at a lower Na+ concentration ; 3 comparative figures ; 4 (ADH ) more aquaporins / greater permeability to water, in collecting duct / DCT ; 5 (C / SIAD / ADH ) more water reabsorbed, at collecting duct / at DCT / into blood ; 6 (C / SIAD / ADH ) small(er) volume of / (more) concentrated, urine ; 7 type C / SIAD, causes, high blood water potential / low blood Na+ concentration ; 4
Q6 · Domestic rabbits vary in the length and colour of their fur
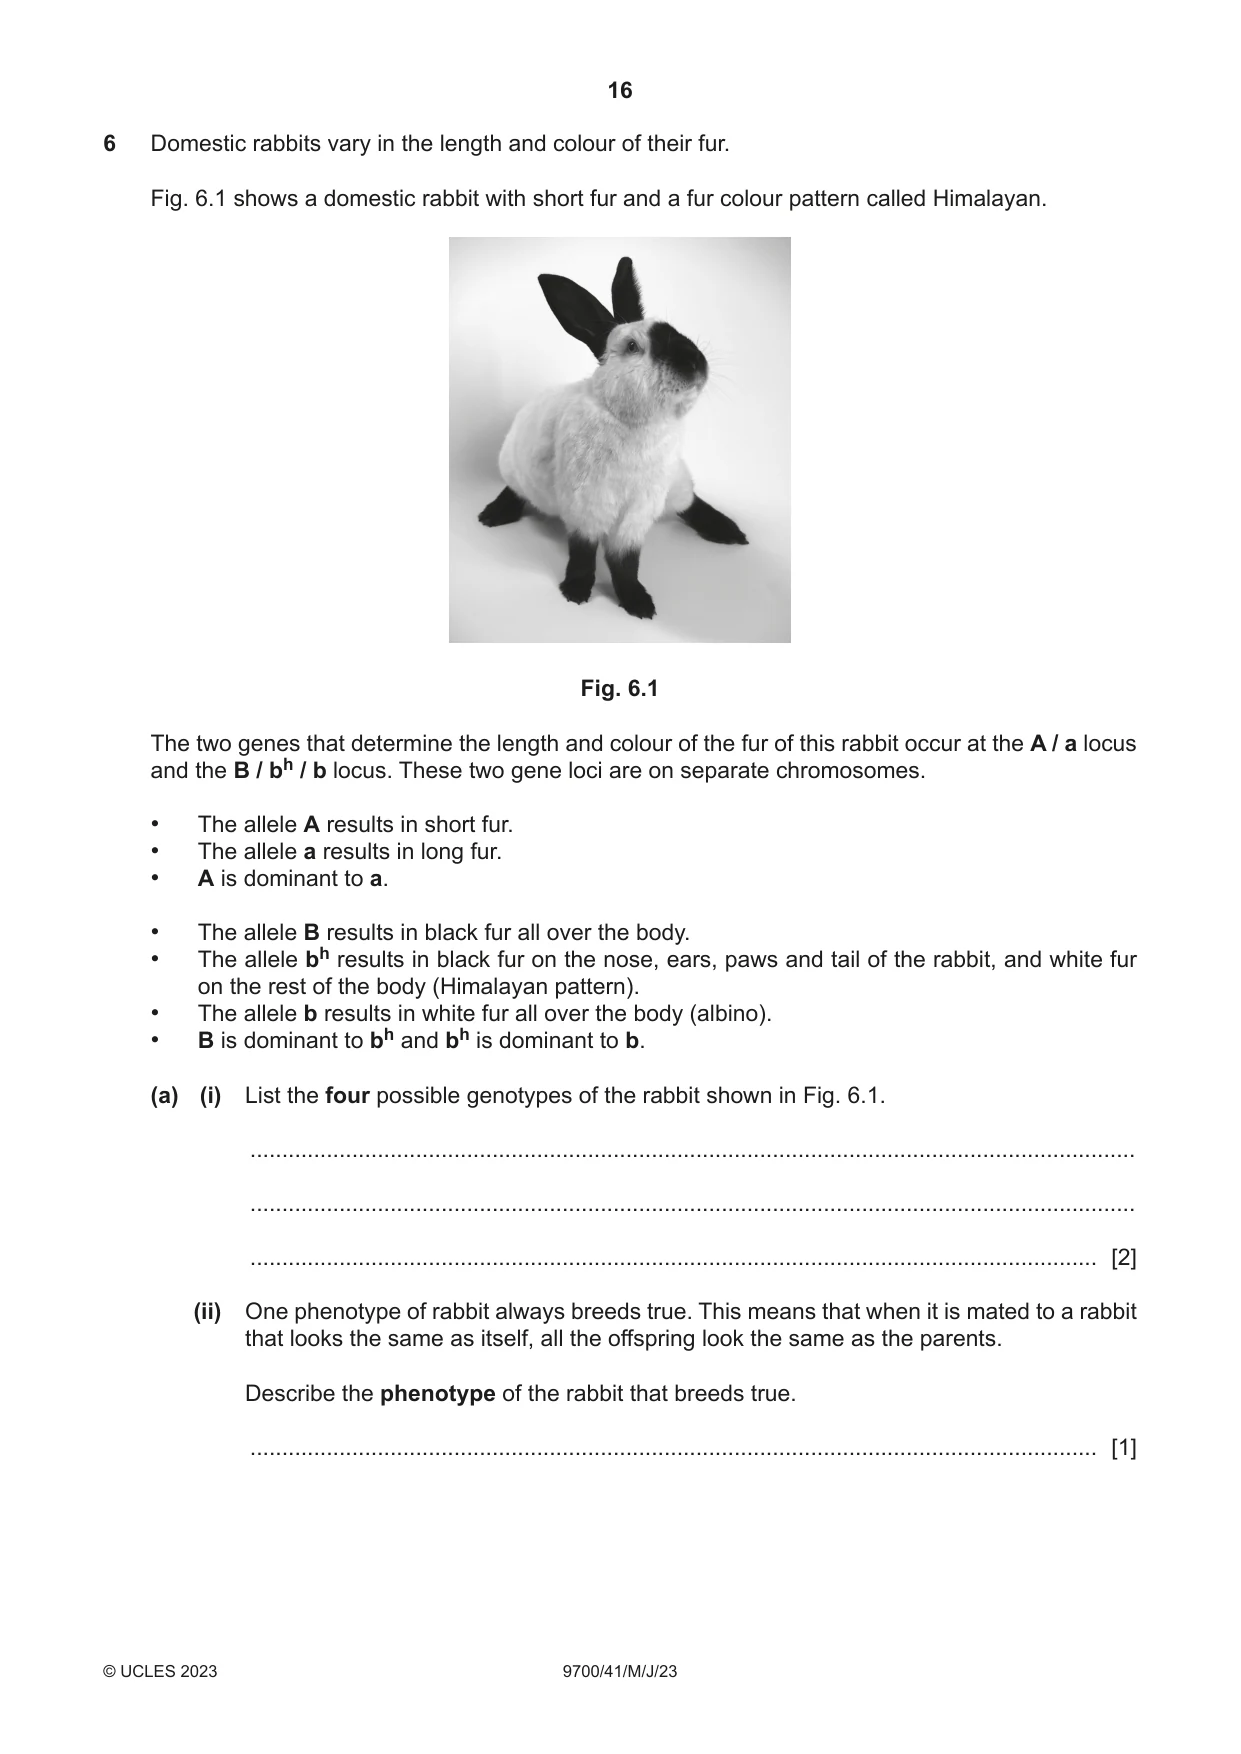
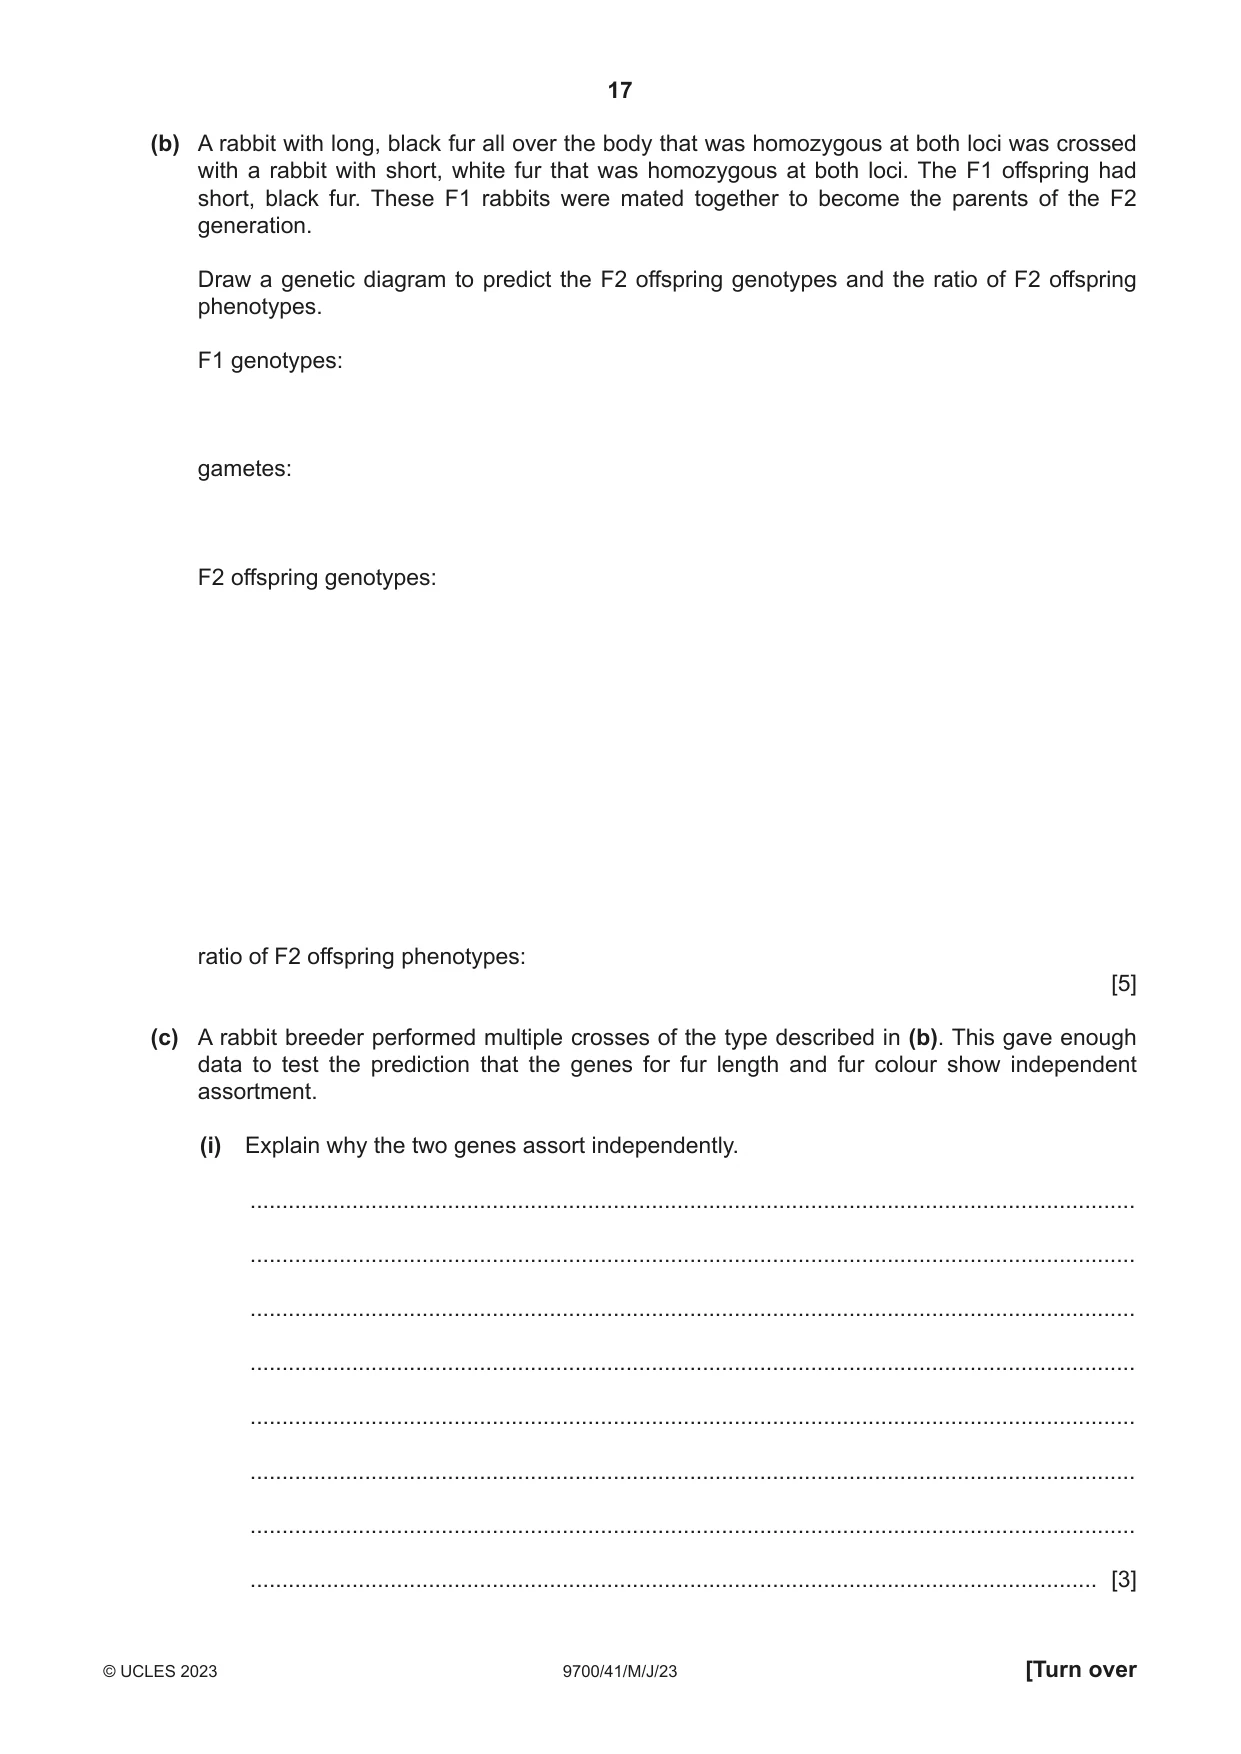
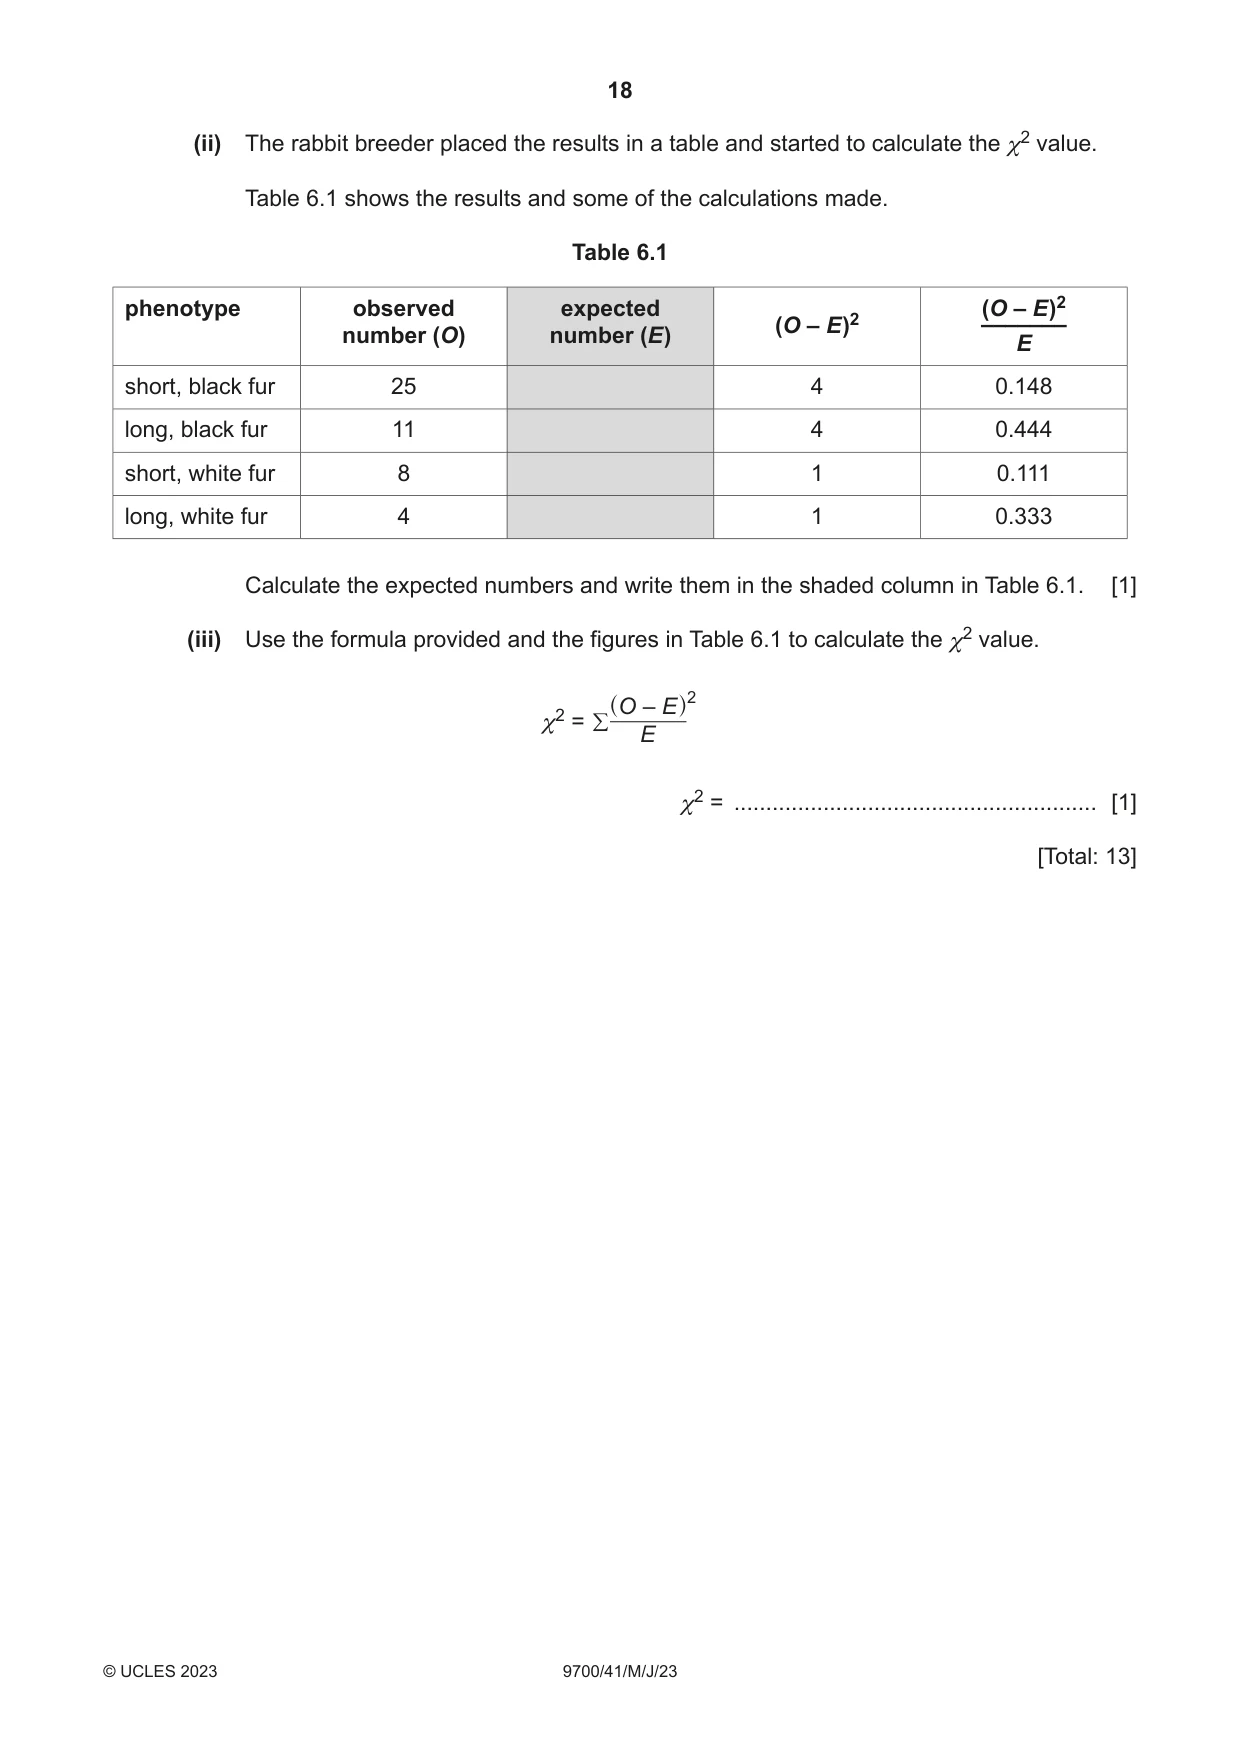
6 Domestic rabbits vary in the length and colour of their fur. Fig. 6.1 shows a domestic rabbit with short fur and a fur colour pattern called Himalayan. Fig. 6.1 The two genes that determine the length and colour of the fur of this rabbit occur at the A / a locus and the B / bh / b locus. These two gene loci are on separate chromosomes. • The allele A results in short fur. • The allele a results in long fur. • A is dominant to a. • The allele B results in black fur all over the body. • The allele bh results in black fur on the nose, ears, paws and tail of the rabbit, and white fur on the rest of the body (Himalayan pattern). • The allele b results in white fur all over the body (albino). • B is dominant to bh and bh is dominant to b. (a) (i) List the four possible genotypes of the rabbit shown in Fig. 6.1. ........................................................................................................................................... ........................................................................................................................................... ..................................................................................................................................... [2] (ii) One phenotype of rabbit always breeds true. This means that when it is mated to a rabbit that looks the same as itself, all the offspring look the same as the parents. Describe the phenotype of the rabbit that breeds true. ..................................................................................................................................... [1] (b) A rabbit with long, black fur all over the body that was homozygous at both loci was crossed with a rabbit with short, white fur that was homozygous at both loci. The F1 offspring had short, black fur. These F1 rabbits were mated together to become the parents of the F2 generation. Draw a genetic diagram to predict the F2 offspring genotypes and the ratio of F2 offspring phenotypes. F1 genotypes: gametes: F2 offspring genotypes: ratio of F2 offspring phenotypes: [5] (c) A rabbit breeder performed multiple crosses of the type described in (b). This gave enough data to test the prediction that the genes for fur length and fur colour show independent assortment. (i) Explain why the two genes assort independently. ........................................................................................................................................... ........................................................................................................................................... ........................................................................................................................................... ........................................................................................................................................... ........................................................................................................................................... ........................................................................................................................................... ........................................................................................................................................... ..................................................................................................................................... [3] (ii) The rabbit breeder placed the results in a table and started to calculate the χ 2 value. Table 6.1 shows the results and some of the calculations made. Table 6.1 phenotype observed expected (O – E )2 (O – E )2 ––––––– number (O) number (E ) E short, black fur 25 4 0.148 long, black fur 11 4 0.444 short, white fur 8 1 0.111 long, white fur 4 1 0.333 Calculate the expected numbers and write them in the shaded column in Table 6.1. [1] (iii) Use the formula provided and the figures in Table 6.1 to calculate the χ 2 value. O – E 2 χ 2 = / ^ h E χ 2 = ......................................................... [1] [Total: 13]
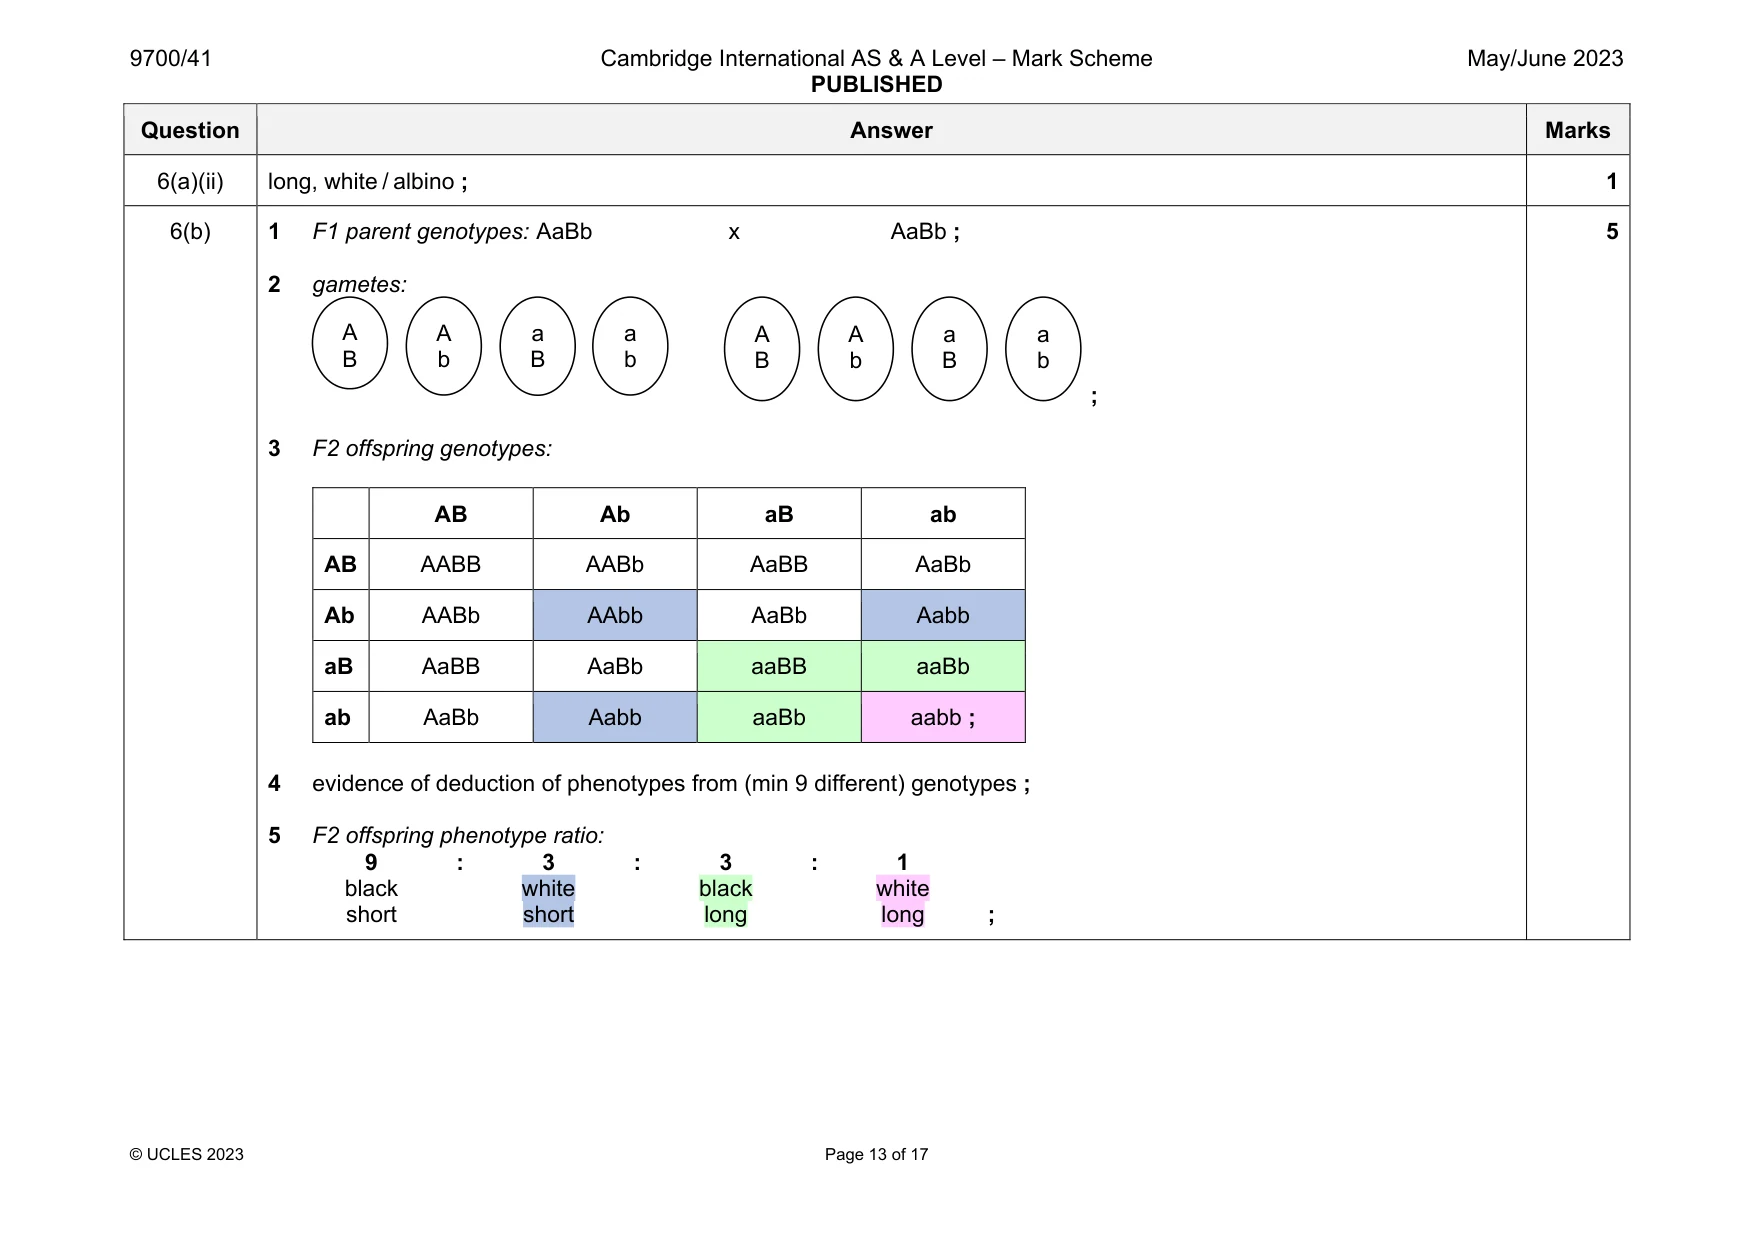
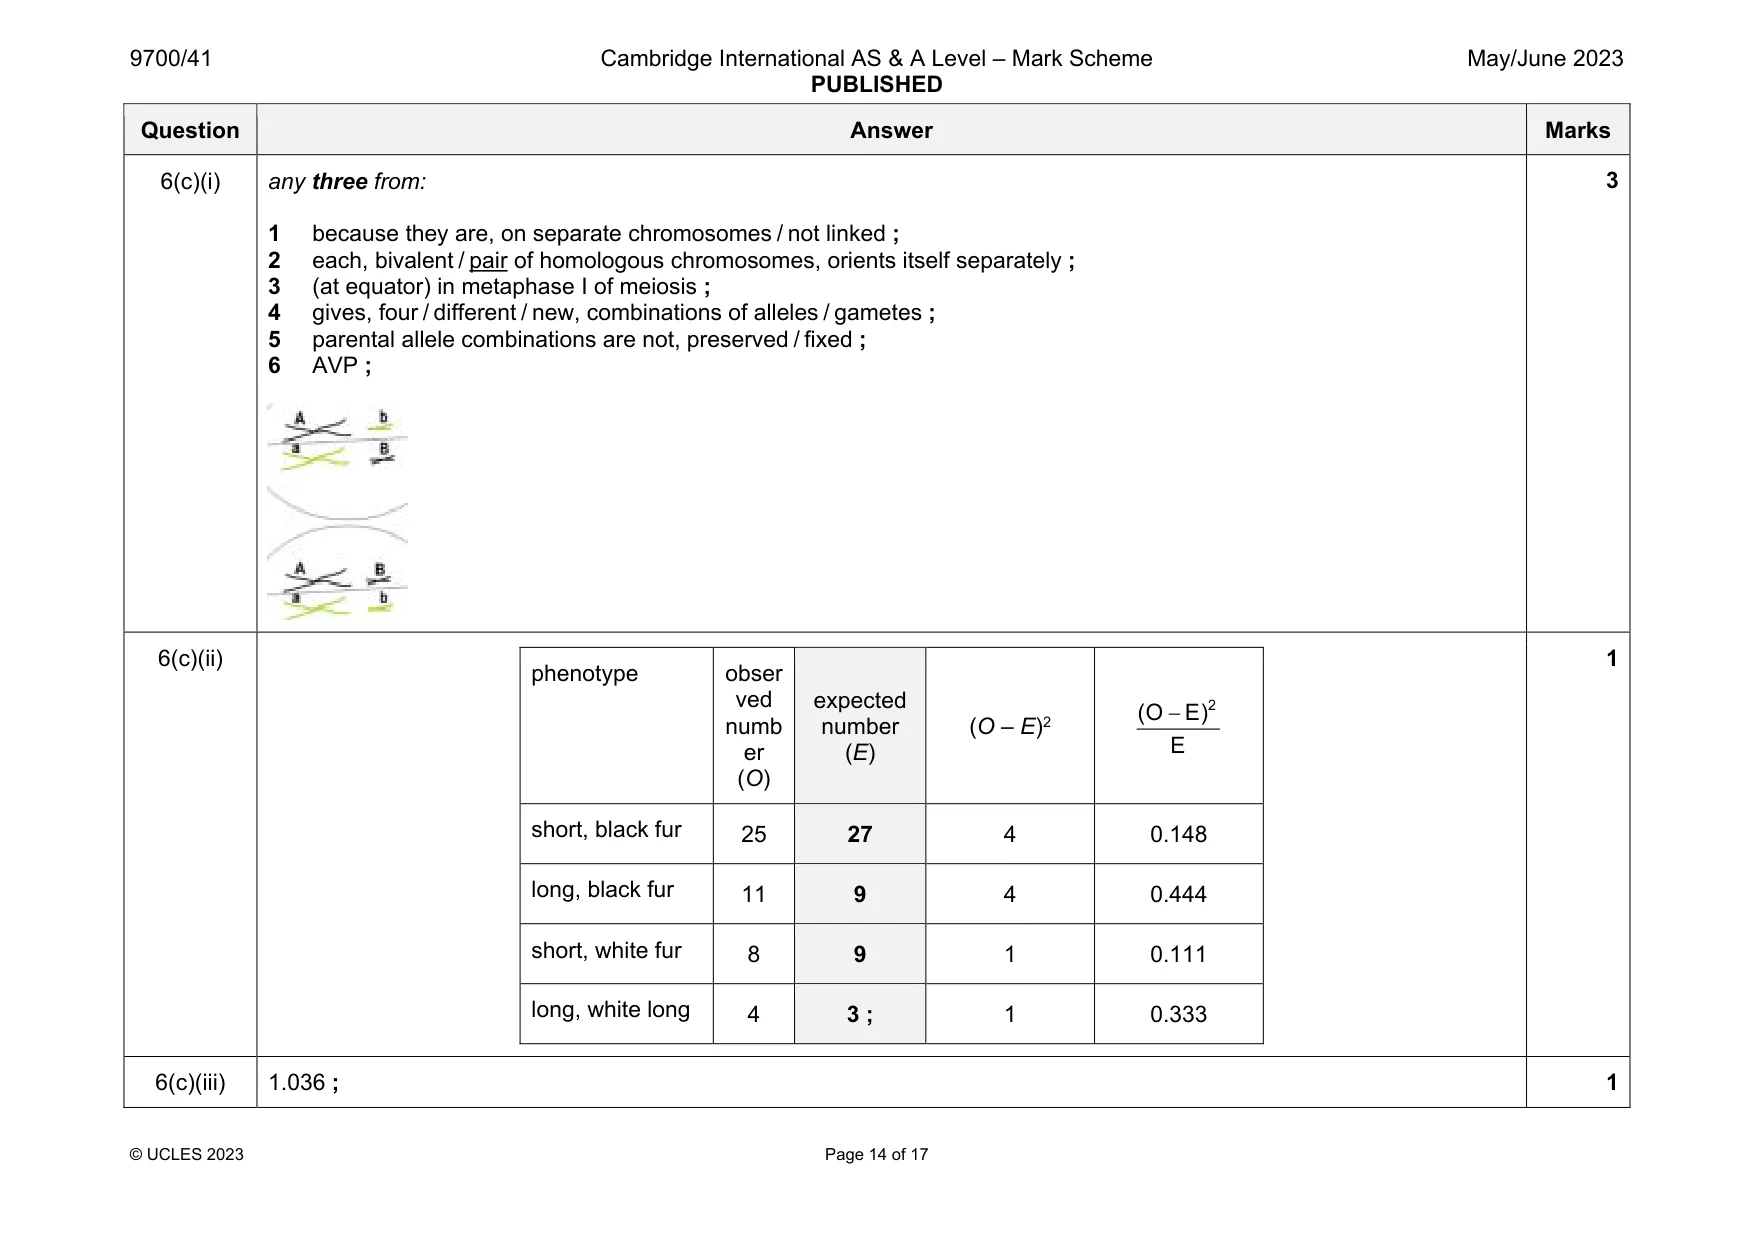
Mark scheme: 6(a)(i) Aabhbh AAbhb Aabhb ; ; Question Answer Marks 6(a)(ii) long, white / albino ; 1 6(b) 1 F1 parent genotypes: AaBb x AaBb ; 2 gametes: ; 3 F2 offspring genotypes: AB Ab aB ab AB AABB AABb AaBB AaBb Ab AABb AAbb AaBb Aabb aB AaBB AaBb aaBB aaBb ab AaBb Aabb aaBb aabb ; 4 evidence of deduction of phenotypes from (min 9 different) genotypes ; 5 F2 offspring phenotype ratio: 9 : 3 : 3 : 1 black white black white short short long long ; 5 A b A B a B a b A b A B a B a b Question Answer Marks 6(c)(i) any three from: 1 because they are, on separate chromosomes / not linked ; 2 each, bivalent / pair of homologous chromosomes, orients itself separately ; 3 (at equator) in metaphase I of meiosis ; 4 gives, four / different / new, combinations of alleles / gametes ; 5 parental allele combinations are not, preserved / fixed ; 6 AVP ; 3 6(c)(ii) phenotype obser ved numb er (O) expected number (E) (O – E)2 2 (O E) E short, black fur 25 27 4 0.148 long, black fur 11 9 4 0.444 short, white fur 8 9 1 0.111 long, white long 4 3 ; 1 0.333 1 6(c)(iii) 1.036 ; 1
More questions on Passage of information from parents to offspring
Q7 · Amino acids are the monomers that are used to produce proteins in organisms
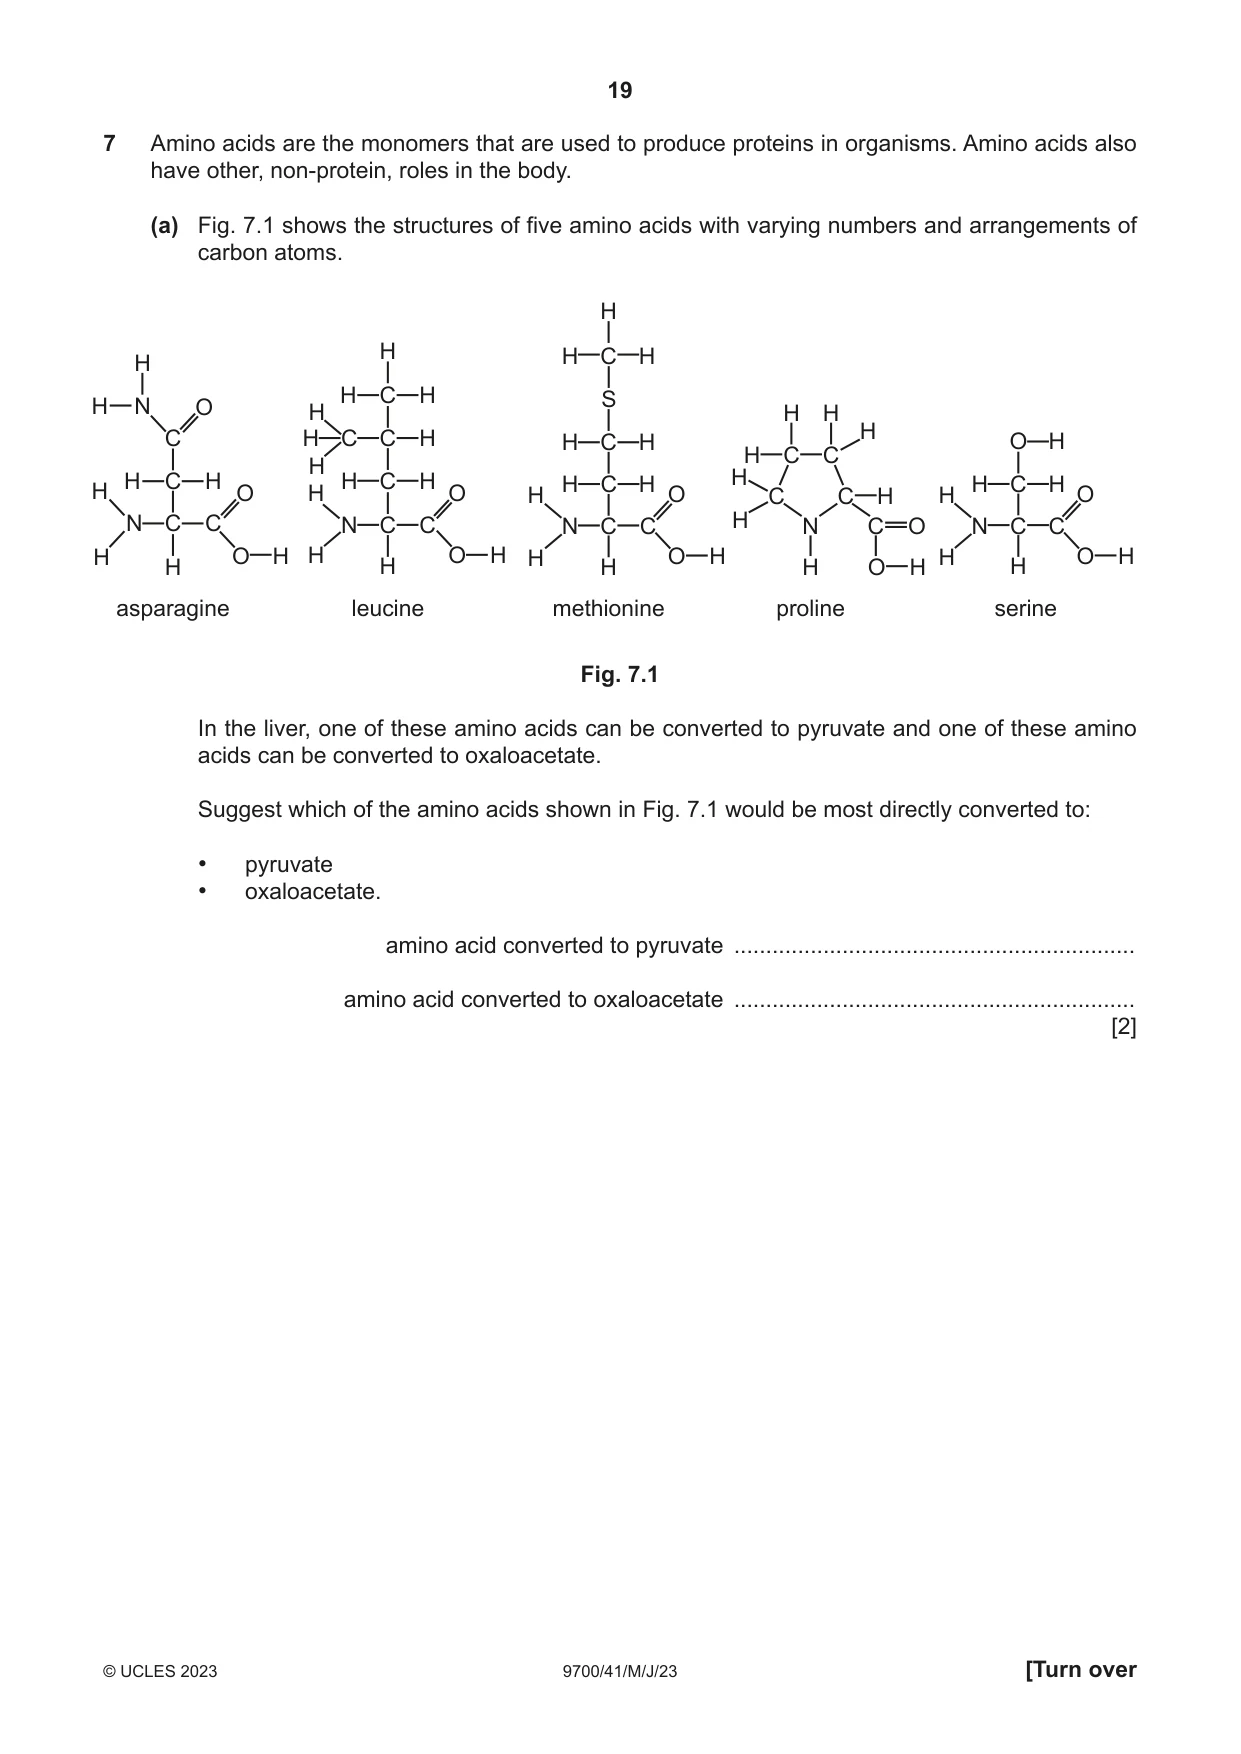
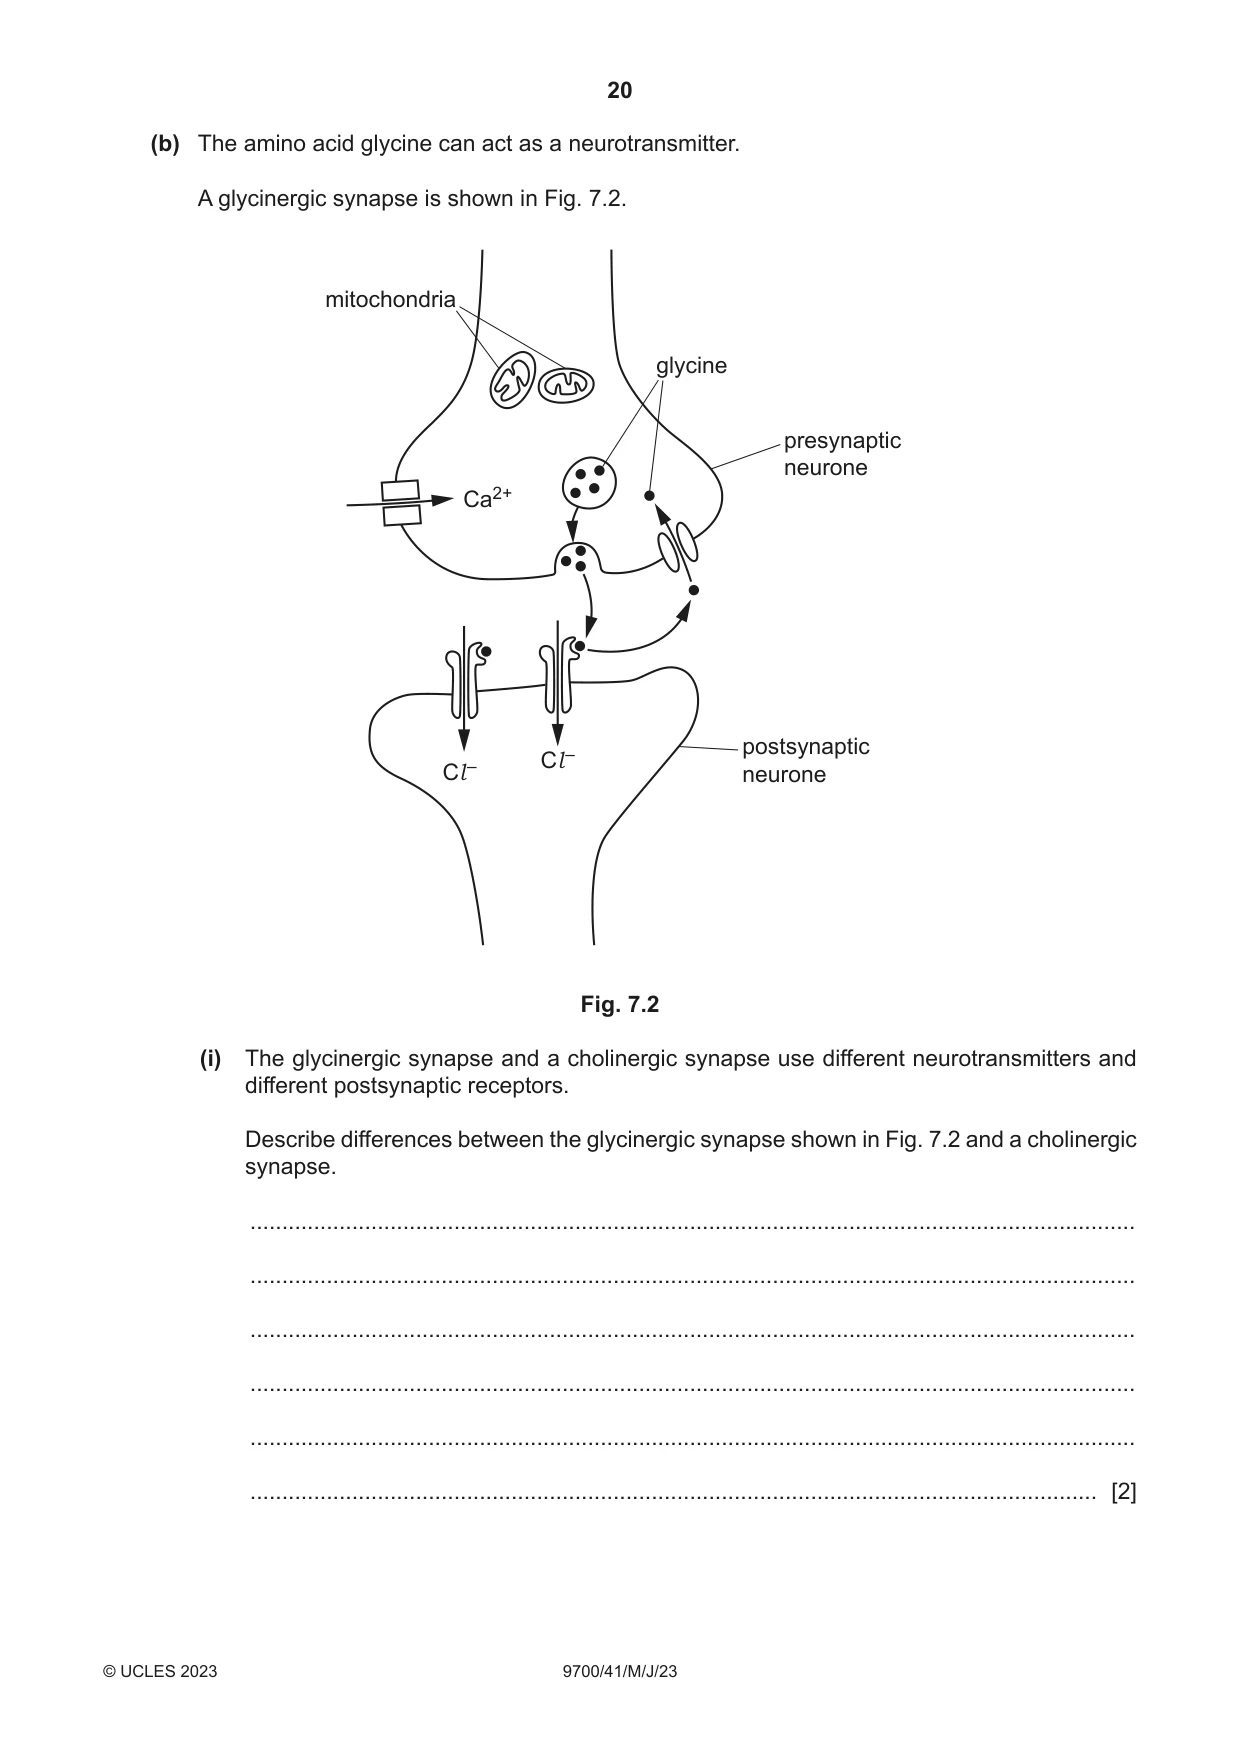
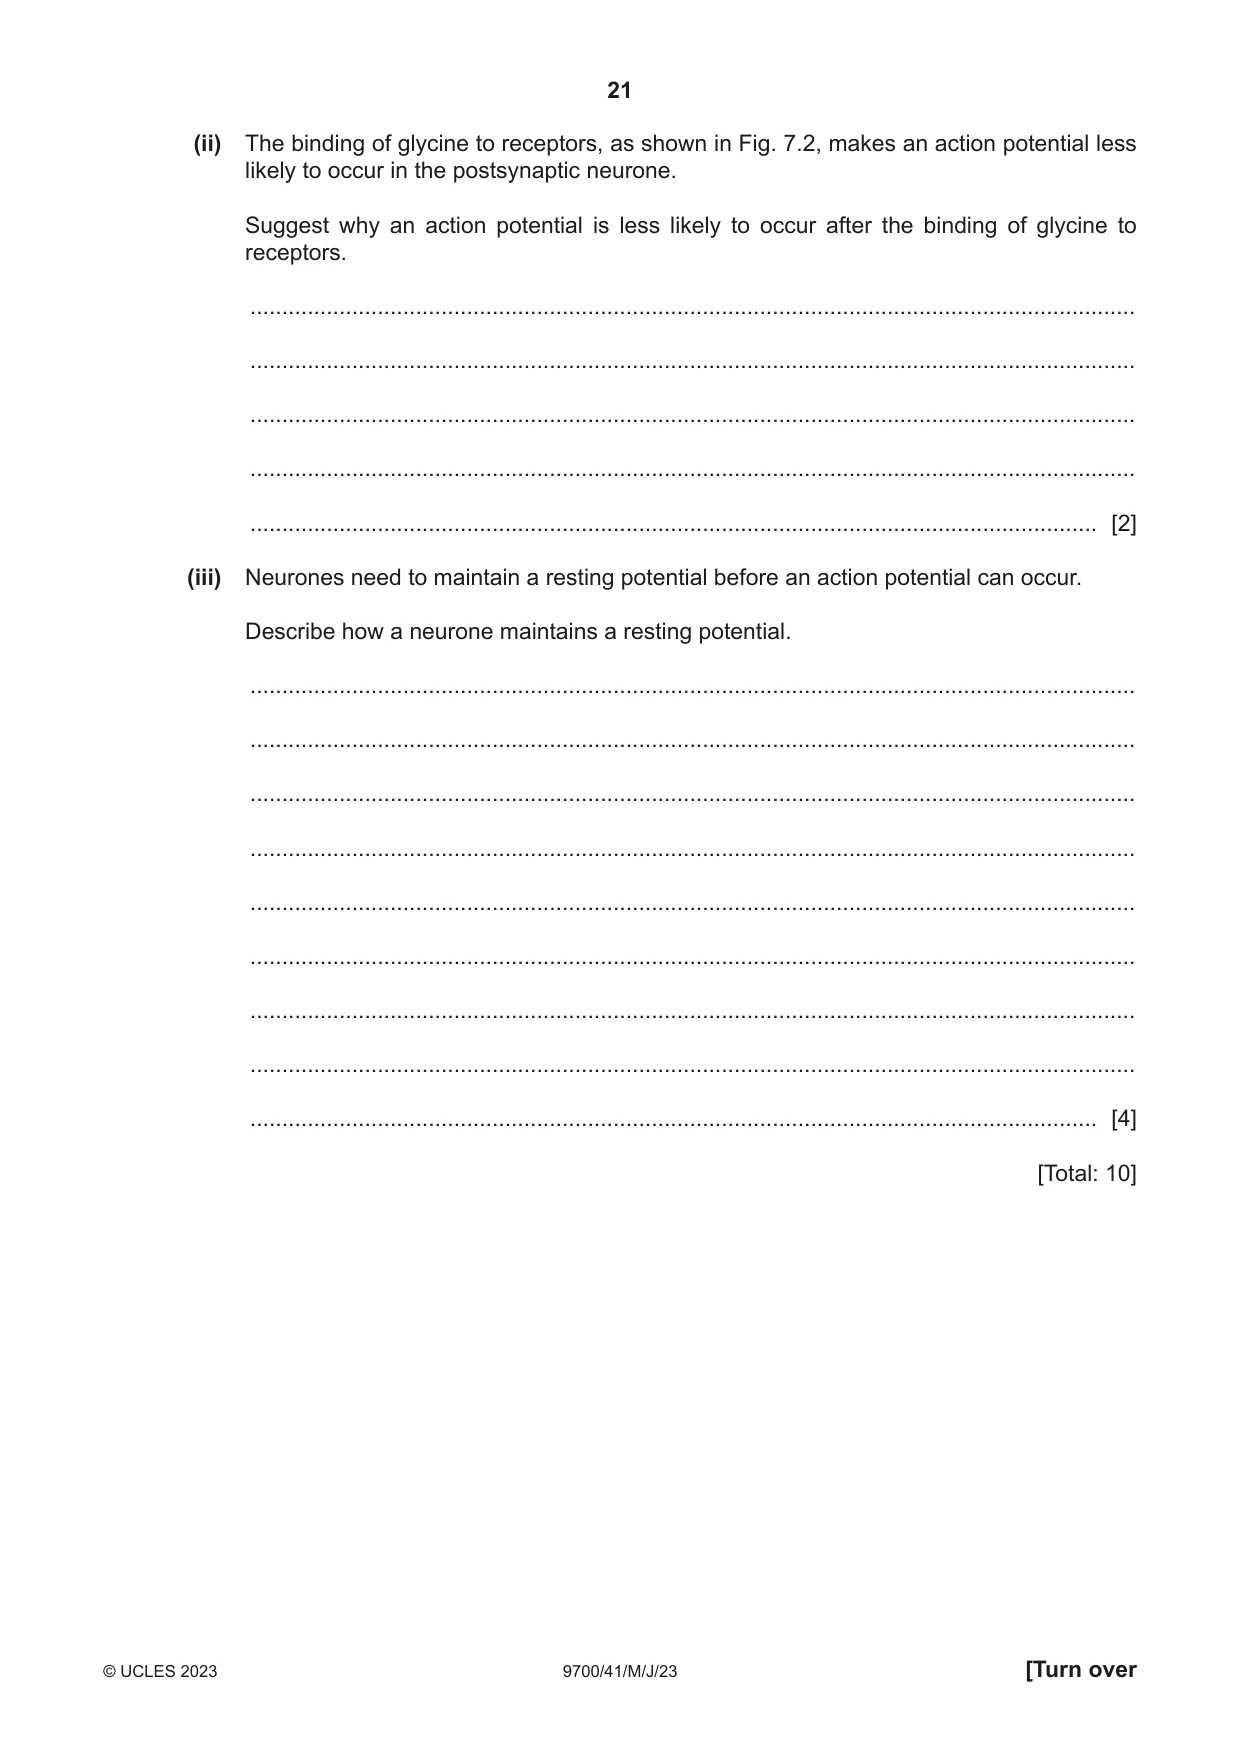
7 Amino acids are the monomers that are used to produce proteins in organisms. Amino acids also have other, non-protein, roles in the body. (a) Fig. 7.1 shows the structures of five amino acids with varying numbers and arrangements of carbon atoms. H H H C H H H C H SH N O H H H H C H C C H H C H O H H C C H H C H H C H H C H H H C HH O H O H O C C H H O N C C N C C N C C H N C O N C C H O H H O H H O H H O H H H H H O H H asparagine leucine methionine proline serine Fig. 7.1 In the liver, one of these amino acids can be converted to pyruvate and one of these amino acids can be converted to oxaloacetate. Suggest which of the amino acids shown in Fig. 7.1 would be most directly converted to: • pyruvate • oxaloacetate. amino acid converted to pyruvate ............................................................... amino acid converted to oxaloacetate ............................................................... [2] (b) The amino acid glycine can act as a neurotransmitter. A glycinergic synapse is shown in Fig. 7.2. mitochondria glycine presynaptic neurone Ca2+ – postsynaptic – Cl Cl neurone Fig. 7.2 (i) The glycinergic synapse and a cholinergic synapse use different neurotransmitters and different postsynaptic receptors. Describe differences between the glycinergic synapse shown in Fig. 7.2 and a cholinergic synapse. ........................................................................................................................................... ........................................................................................................................................... ........................................................................................................................................... ........................................................................................................................................... ........................................................................................................................................... ..................................................................................................................................... [2] (ii) The binding of glycine to receptors, as shown in Fig. 7.2, makes an action potential less likely to occur in the postsynaptic neurone. Suggest why an action potential is less likely to occur after the binding of glycine to receptors. ........................................................................................................................................... ........................................................................................................................................... ........................................................................................................................................... ........................................................................................................................................... ..................................................................................................................................... [2] (iii) Neurones need to maintain a resting potential before an action potential can occur. Describe how a neurone maintains a resting potential. ........................................................................................................................................... ........................................................................................................................................... ........................................................................................................................................... ........................................................................................................................................... ........................................................................................................................................... ........................................................................................................................................... ........................................................................................................................................... ........................................................................................................................................... ..................................................................................................................................... [4] [Total: 10]
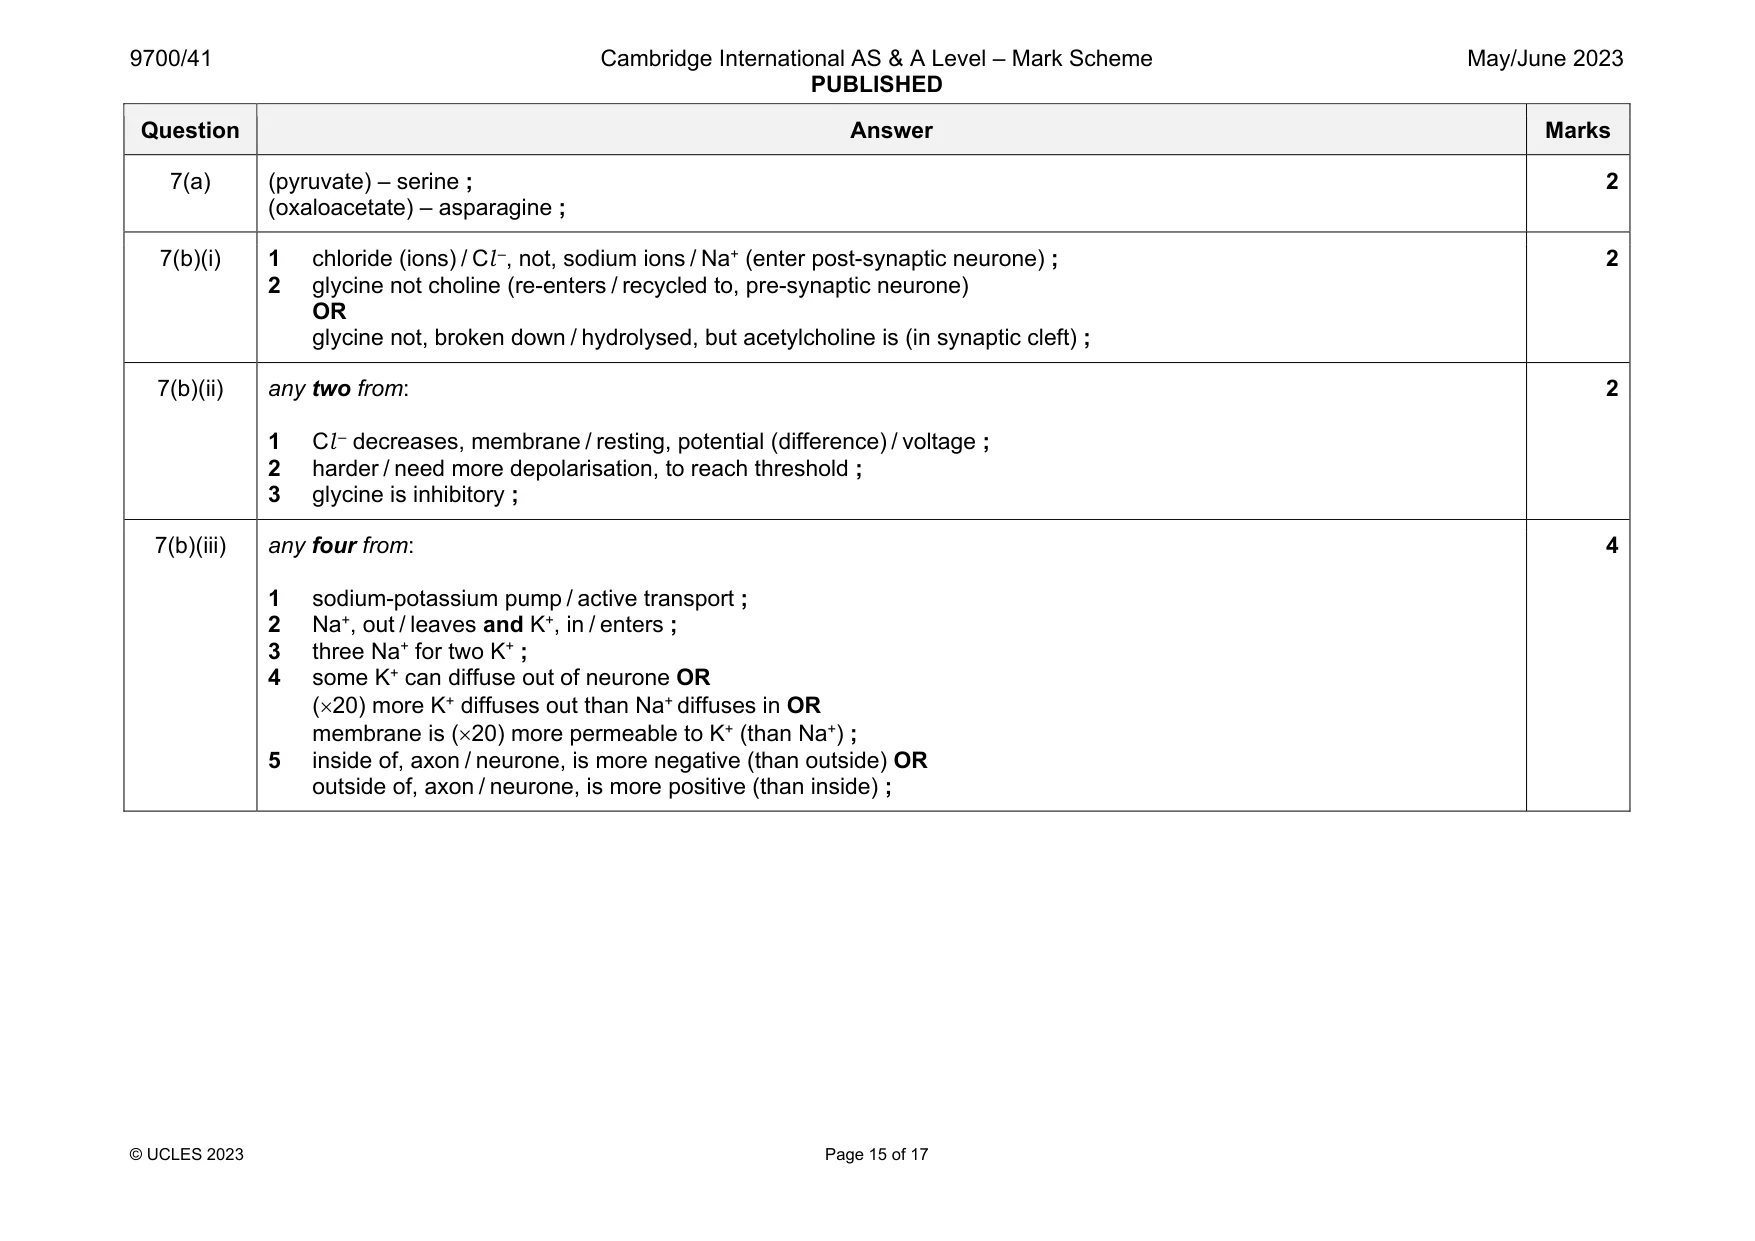
Mark scheme: 7(a) (pyruvate) – serine ; (oxaloacetate) – asparagine ; 2 7(b)(i) 1 chloride (ions) / Cl –, not, sodium ions / Na+ (enter post-synaptic neurone) ; 2 glycine not choline (re-enters / recycled to, pre-synaptic neurone) OR glycine not, broken down / hydrolysed, but acetylcholine is (in synaptic cleft) ; 2 7(b)(ii) any two from: 1 Cl – decreases, membrane / resting, potential (difference) / voltage ; 2 harder / need more depolarisation, to reach threshold ; 3 glycine is inhibitory ; 2 7(b)(iii) any four from: 1 sodium-potassium pump / active transport ; 2 Na+, out / leaves and K+, in / enters ; 3 three Na+ for two K+ ; 4 some K+ can diffuse out of neurone OR (20) more K+ diffuses out than Na+ diffuses in OR membrane is (20) more permeable to K+ (than Na+) ; 5 inside of, axon / neurone, is more negative (than outside) OR outside of, axon / neurone, is more positive (than inside) ; 4
Q8 · A cell from the testis of a locust at the late prophase I stage of meiosis
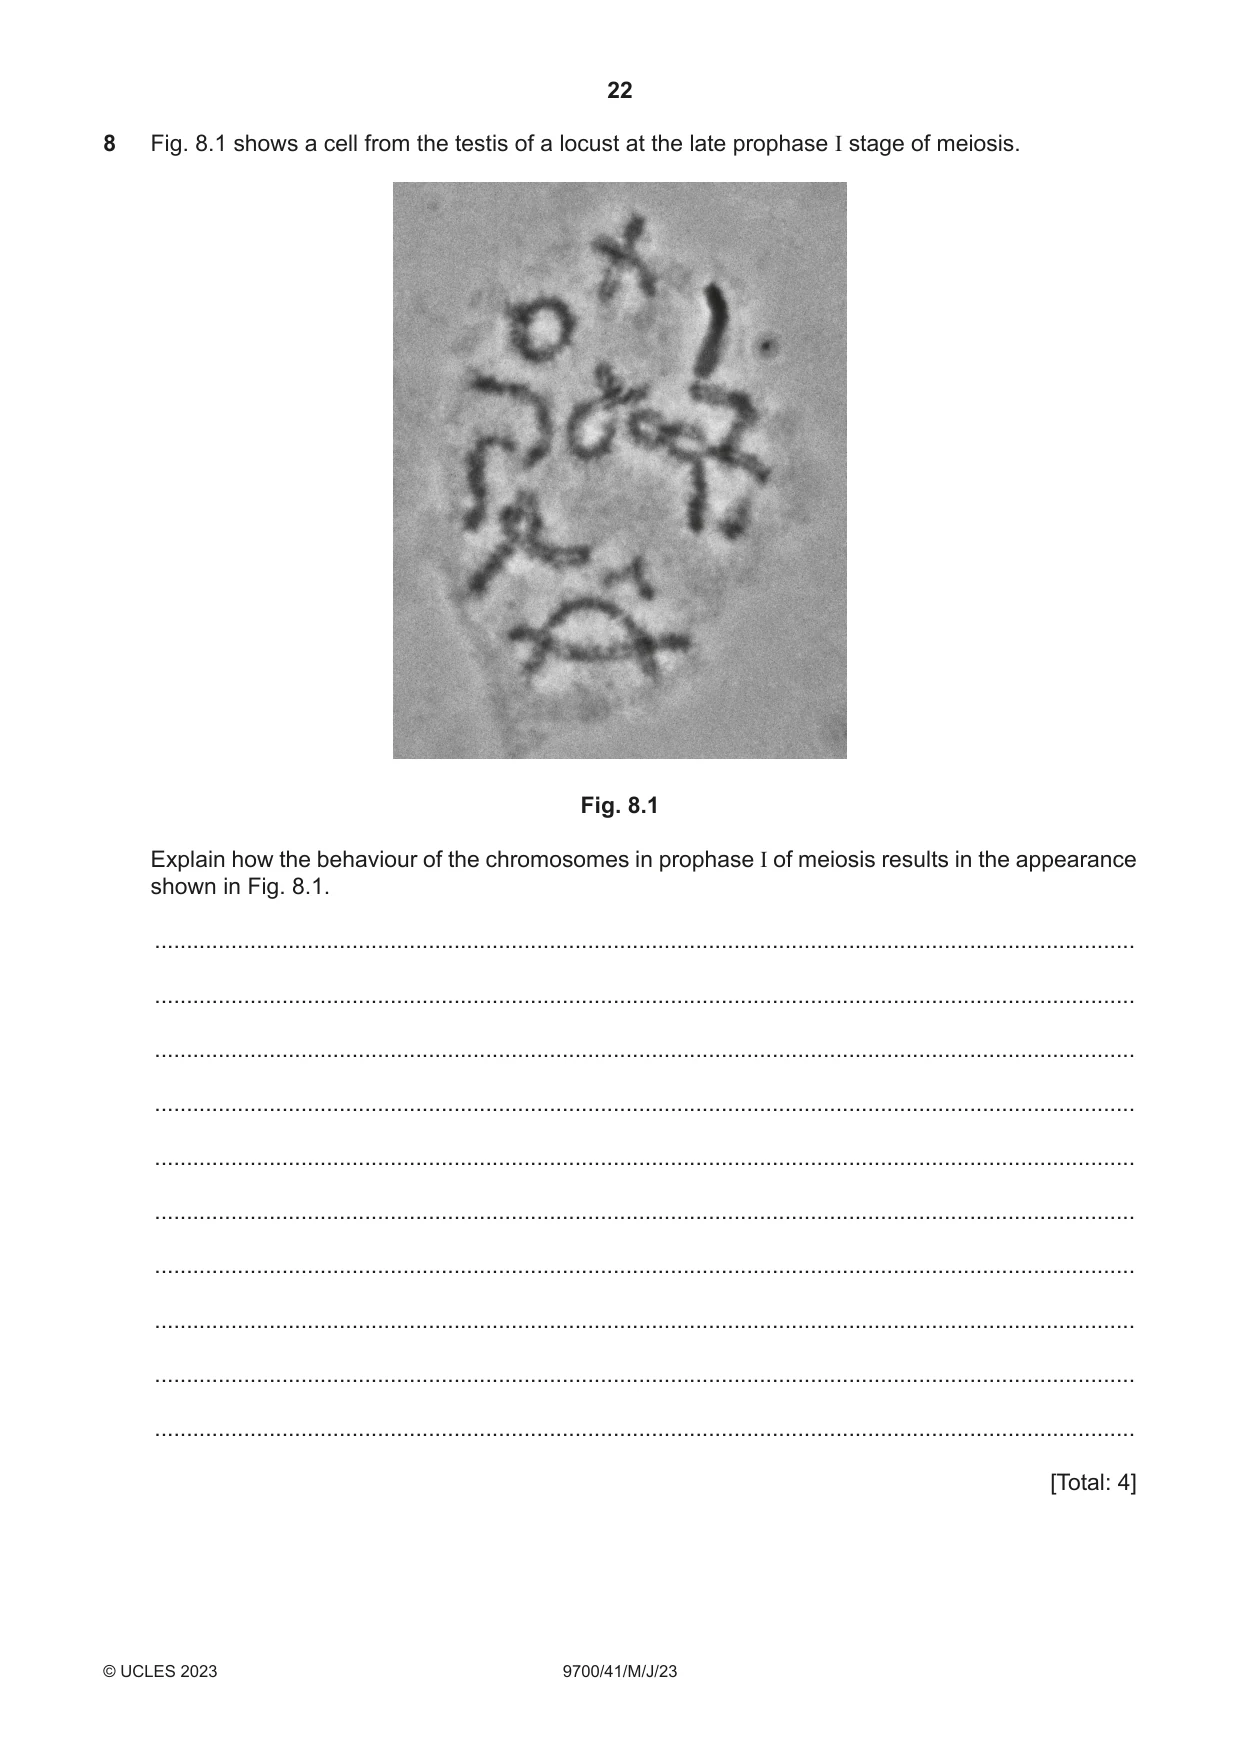
8 Fig. 8.1 shows a cell from the testis of a locust at the late prophase I stage of meiosis. Fig. 8.1 Explain how the behaviour of the chromosomes in prophase I of meiosis results in the appearance shown in Fig. 8.1. .......................................................................................................................................................... .......................................................................................................................................................... .......................................................................................................................................................... .......................................................................................................................................................... .......................................................................................................................................................... .......................................................................................................................................................... .......................................................................................................................................................... .......................................................................................................................................................... .......................................................................................................................................................... .......................................................................................................................................................... [Total: 4]
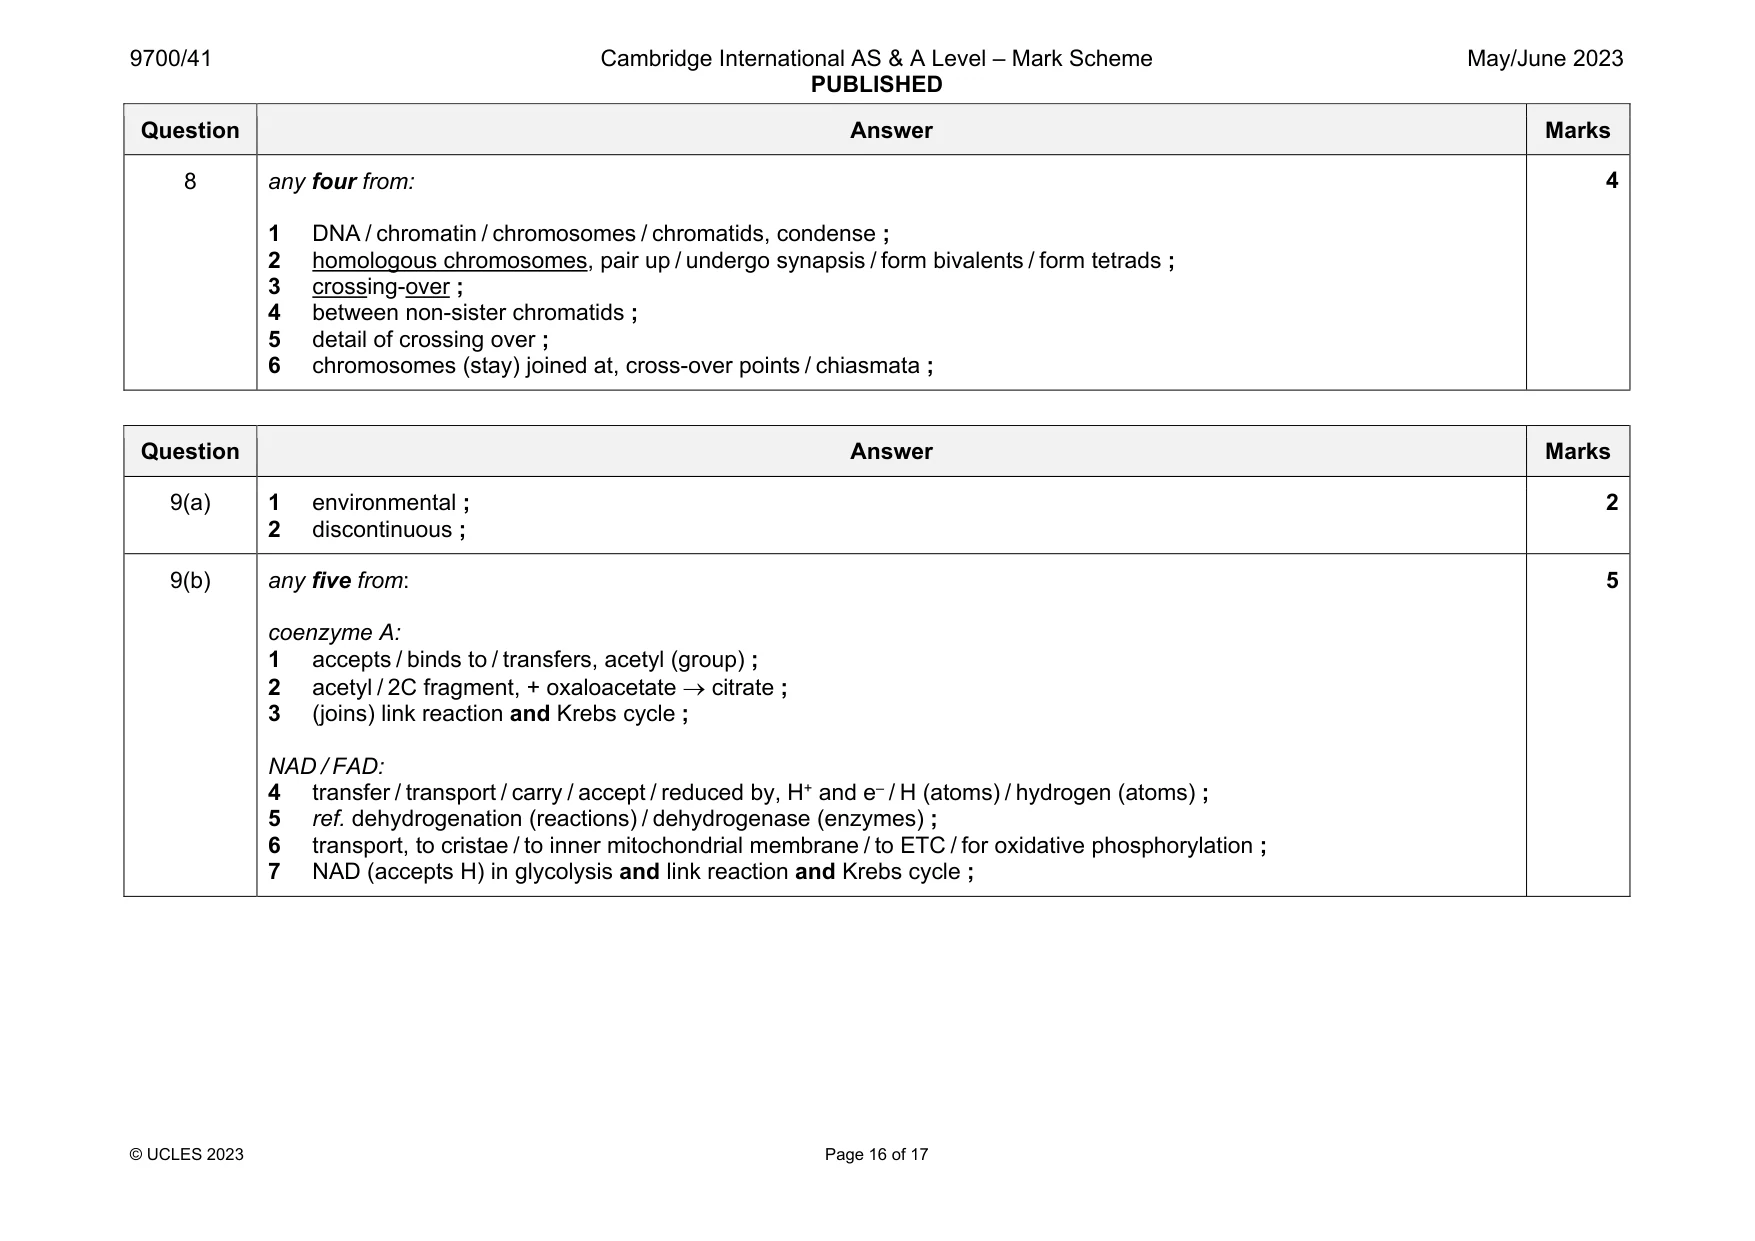
Mark scheme: 8 any four from: 1 DNA / chromatin / chromosomes / chromatids, condense ; 2 homologous chromosomes, pair up / undergo synapsis / form bivalents / form tetrads ; 3 crossing-over ; 4 between non-sister chromatids ; 5 detail of crossing over ; 6 chromosomes (stay) joined at, cross-over points / chiasmata ;
Q9 · Many factors affect the rate of cellular respiration
9 Many factors affect the rate of cellular respiration. (a) Pyruvate carboxylase (PC) deficiency is a rare disease. The rate of respiration in the cells of a person with PC deficiency is much lower than normal. The passage describes the occurrence of PC deficiency in human populations. Complete the passage by using the most appropriate scientific terms. PC deficiency affects one in 250 000 people. A person either has the disease or does not, so there are no intermediate forms of the disease. PC deficiency is caused by a genetic mutation in one gene. Whether a person develops the disease is not influenced by ......................................... factors. The distribution of PC deficiency in human populations shows ......................................... variation. [2] (b) Coenzymes are important in aerobic respiration. Outline the roles of named coenzymes in aerobic respiration. ................................................................................................................................................... ................................................................................................................................................... ................................................................................................................................................... ................................................................................................................................................... ................................................................................................................................................... ................................................................................................................................................... ................................................................................................................................................... ................................................................................................................................................... ................................................................................................................................................... ............................................................................................................................................. [5] [Total: 7] 10 Sweet peas are garden plants that vary in height. • Tall sweet peas grow to 200 cm in height. • Dwarf sweet peas grow to 30 cm in height. • Tall sweet peas contain a dominant Le allele. • Dwarf sweet peas are homozygous for the recessive le allele. Explain how the lele genotype results in the dwarf phenotype in sweet peas, with reference to the effect of lele on: • enzyme synthesis • hormone production • the expression of genes affecting plant growth. .......................................................................................................................................................... .......................................................................................................................................................... .......................................................................................................................................................... .......................................................................................................................................................... .......................................................................................................................................................... .......................................................................................................................................................... .......................................................................................................................................................... .......................................................................................................................................................... .......................................................................................................................................................... .......................................................................................................................................................... .......................................................................................................................................................... .......................................................................................................................................................... .......................................................................................................................................................... .......................................................................................................................................................... [Total: 6] The boundaries and names shown, the designations used and the presentation of material on any maps contained in this question paper/insert do not imply official endorsement or acceptance by Cambridge Assessment International Education concerning the legal status of any country, territory, or area or any of its authorities, or of the delimitation of its frontiers or boundaries.
Mark scheme: 9(a) 1 environmental ; 2 discontinuous ; 9(b) any five from: coenzyme A: 1 accepts / binds to / transfers, acetyl (group) ; 2 acetyl / 2C fragment, + oxaloacetate citrate ; 3 (joins) link reaction and Krebs cycle ; NAD / FAD: 4 transfer / transport / carry / accept / reduced by, H+ and e– / H (atoms) / hydrogen (atoms) ; 5 ref. dehydrogenation (reactions) / dehydrogenase (enzymes) ; 6 transport, to cristae / to inner mitochondrial membrane / to ETC / for oxidative phosphorylation ; 7 NAD (accepts H) in glycolysis and link reaction and Krebs cycle ; 5
Q10 · Sweet peas are garden plants that vary in height
10 Sweet peas are garden plants that vary in height. • Tall sweet peas grow to 200 cm in height. • Dwarf sweet peas grow to 30 cm in height. • Tall sweet peas contain a dominant Le allele. • Dwarf sweet peas are homozygous for the recessive le allele. Explain how the lele genotype results in the dwarf phenotype in sweet peas, with reference to the effect of lele on: • enzyme synthesis • hormone production • the expression of genes affecting plant growth. .......................................................................................................................................................... .......................................................................................................................................................... .......................................................................................................................................................... .......................................................................................................................................................... .......................................................................................................................................................... .......................................................................................................................................................... .......................................................................................................................................................... .......................................................................................................................................................... .......................................................................................................................................................... .......................................................................................................................................................... .......................................................................................................................................................... .......................................................................................................................................................... .......................................................................................................................................................... .......................................................................................................................................................... [Total: 6] The boundaries and names shown, the designations used and the presentation of material on any maps contained in this question paper/insert do not imply official endorsement or acceptance by Cambridge Assessment International Education concerning the legal status of any country, territory, or area or any of its authorities, or of the delimitation of its frontiers or boundaries.
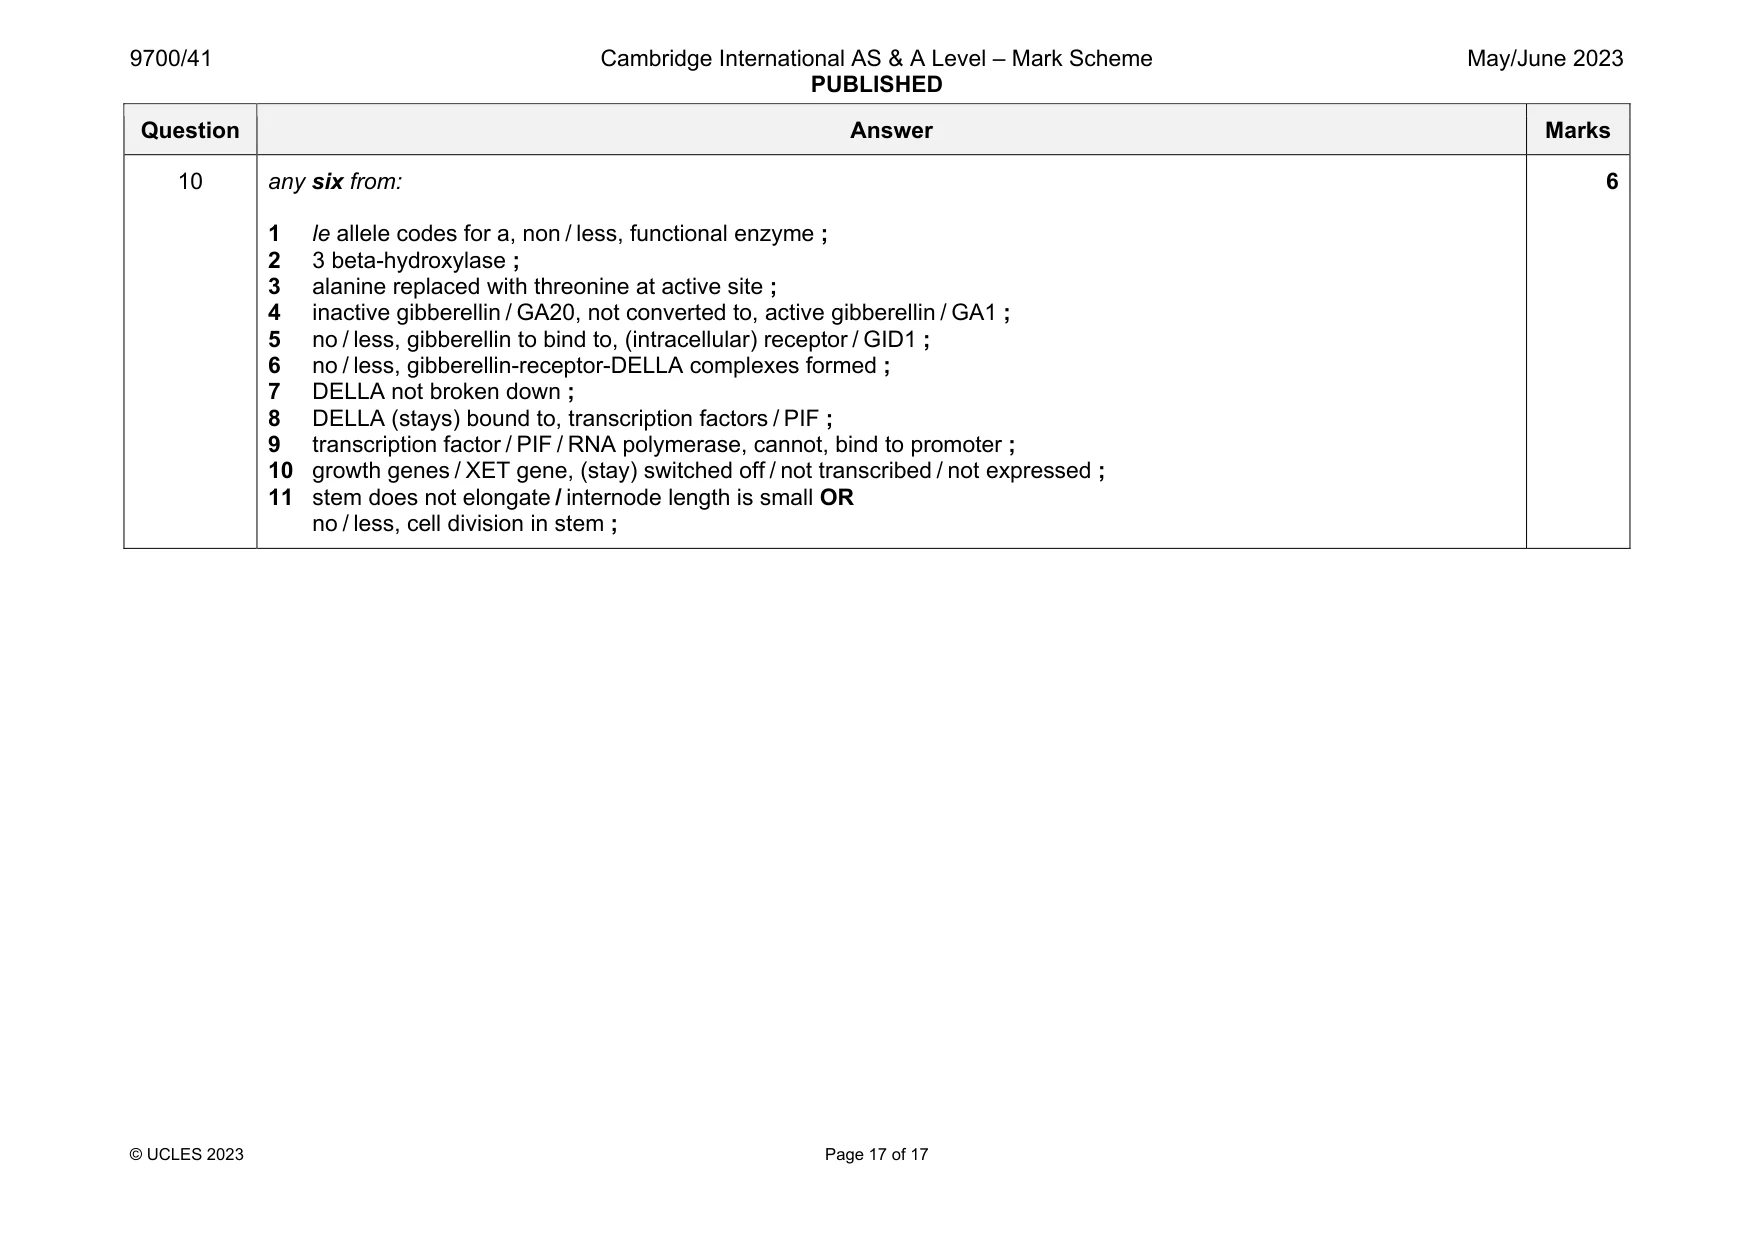
Mark scheme: 10 any six from: 1 le allele codes for a, non / less, functional enzyme ; 2 3 beta-hydroxylase ; 3 alanine replaced with threonine at active site ; 4 inactive gibberellin / GA20, not converted to, active gibberellin / GA1 ; 5 no / less, gibberellin to bind to, (intracellular) receptor / GID1 ; 6 no / less, gibberellin-receptor-DELLA complexes formed ; 7 DELLA not broken down ; 8 DELLA (stays) bound to, transcription factors / PIF ; 9 transcription factor / PIF / RNA polymerase, cannot, bind to promoter ; 10 growth genes / XET gene, (stay) switched off / not transcribed / not expressed ; 11 stem does not elongate / internode length is small OR no / less, cell division in stem ; 6
What was in this paper
The subtopics covered by these 10 questions, and how many questions each got. Open one in a new tab to see every Cambridge question on it.
What you needed in this session
Cambridge’s own grade thresholds for 2023 May/June, Paper 4 · Variant 1. A higher threshold means an easier paper — the bar moves with how the cohort did.