Cambridge A Level Biology 9700 — 2023 Oct/Nov Paper 4 · Variant 1
9700/41/O/N/23 · 10 questions · 100 marks · ≈113 min
The question paper and its mark scheme, free to read here and free to download. This is Cambridge’s own paper, exactly as it was sat.
Question paper28 pages



Mark scheme16 pages
Answers below. Sit the paper first if you are practising.
Questions as text
Q1 · Chloroplasts carry out photosynthesis
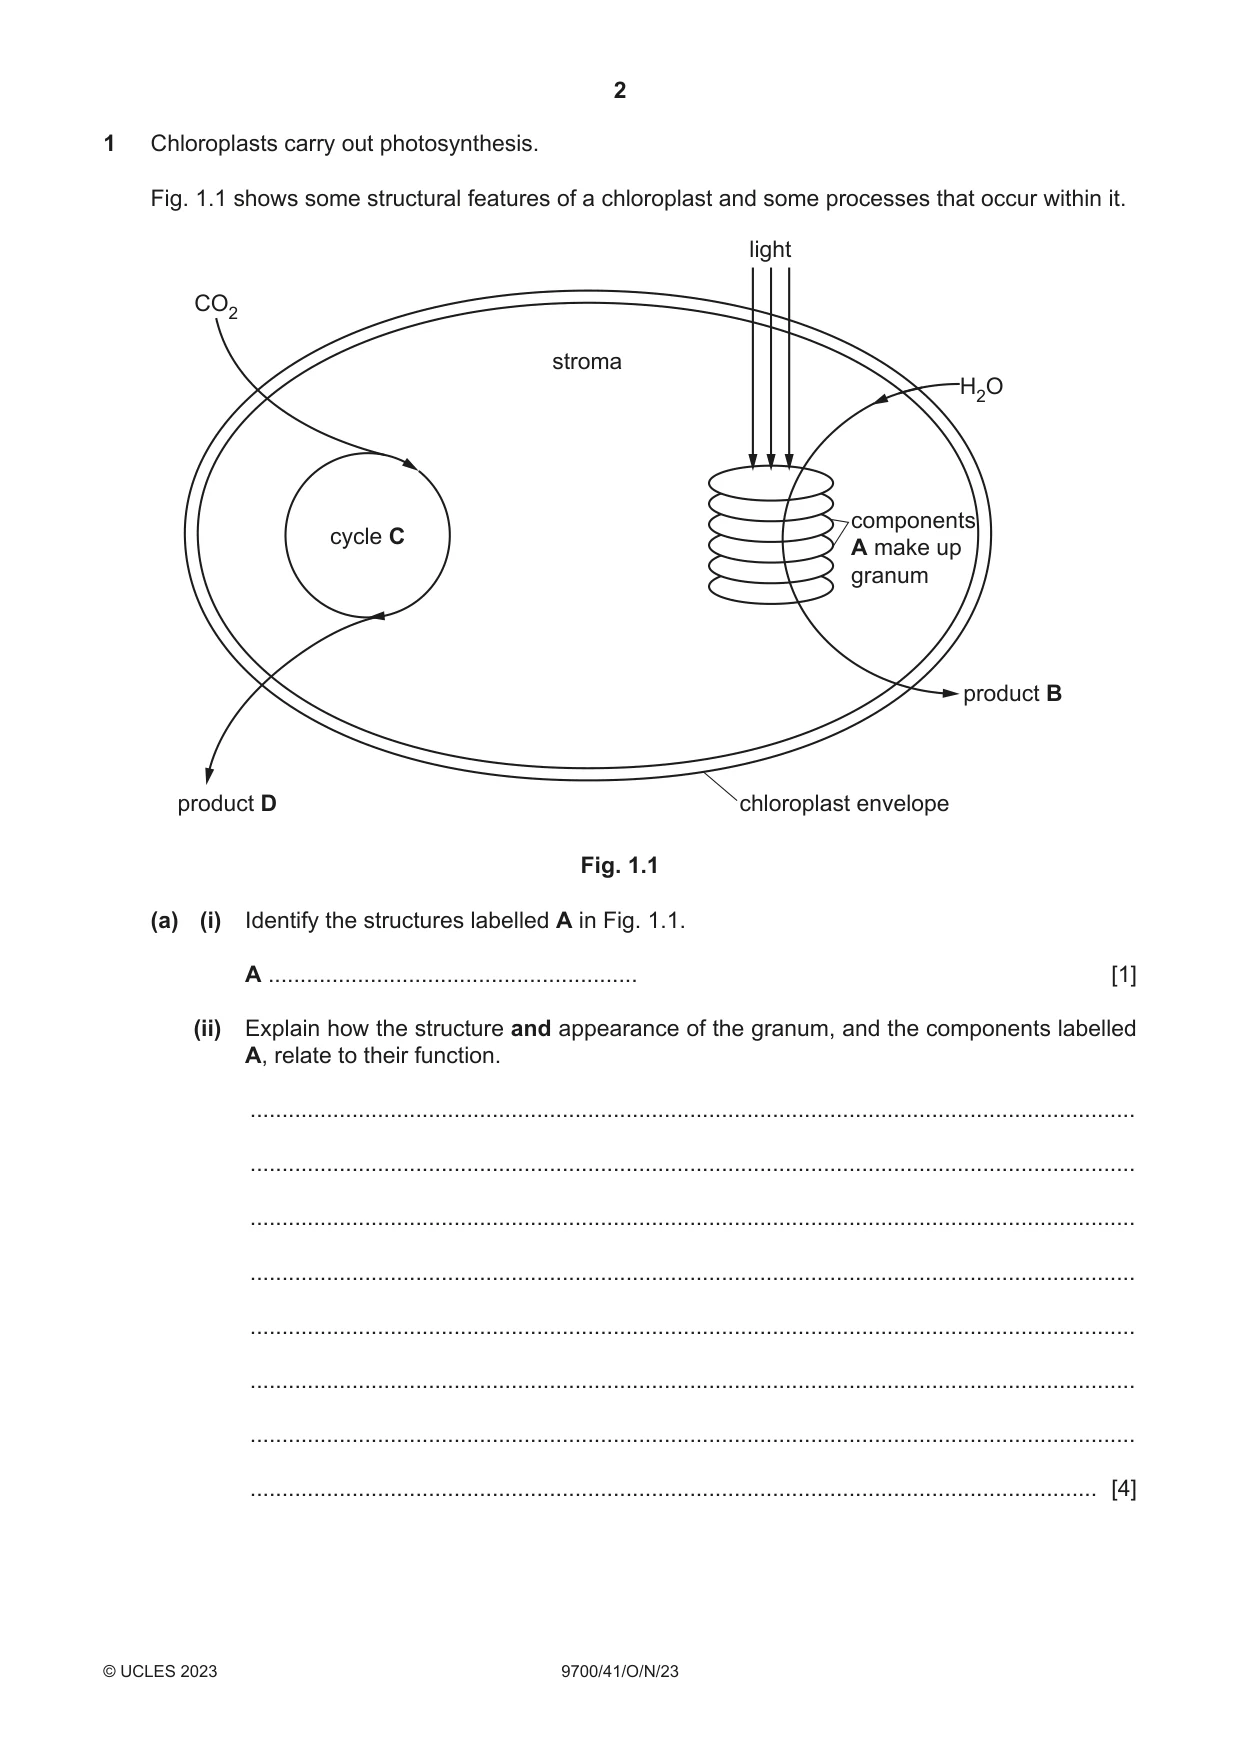
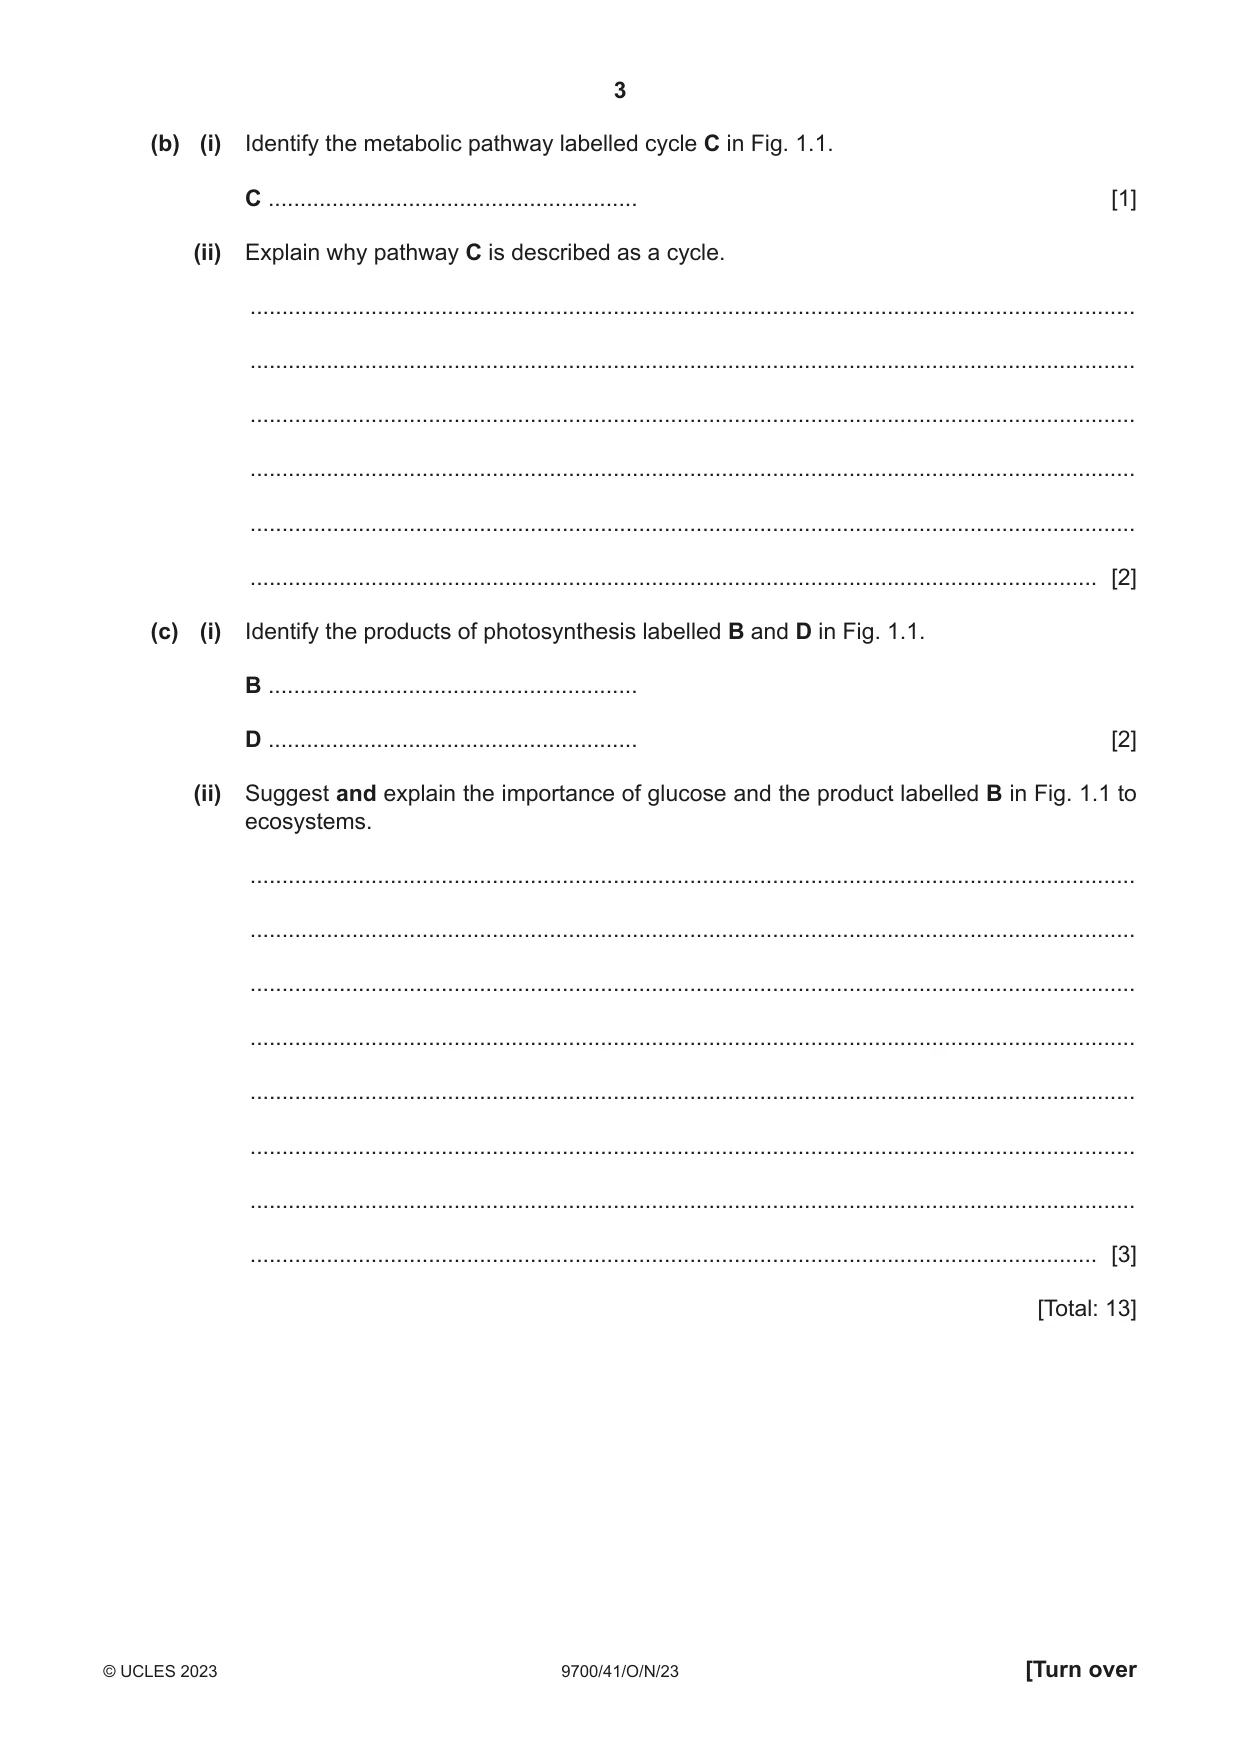
1 Chloroplasts carry out photosynthesis. Fig. 1.1 shows some structural features of a chloroplast and some processes that occur within it. light CO2 stroma H2O components cycle C A make up granum product B product D chloroplast envelope Fig. 1.1 (a) (i) Identify the structures labelled A in Fig. 1.1. A .......................................................... [1] (ii) Explain how the structure and appearance of the granum, and the components labelled A, relate to their function. ........................................................................................................................................... ........................................................................................................................................... ........................................................................................................................................... ........................................................................................................................................... ........................................................................................................................................... ........................................................................................................................................... ........................................................................................................................................... ..................................................................................................................................... [4] (b) (i) Identify the metabolic pathway labelled cycle C in Fig. 1.1. C .......................................................... [1] (ii) Explain why pathway C is described as a cycle. ........................................................................................................................................... ........................................................................................................................................... ........................................................................................................................................... ........................................................................................................................................... ........................................................................................................................................... ..................................................................................................................................... [2] (c) (i) Identify the products of photosynthesis labelled B and D in Fig. 1.1. B .......................................................... D .......................................................... [2] (ii) Suggest and explain the importance of glucose and the product labelled B in Fig. 1.1 to ecosystems. ........................................................................................................................................... ........................................................................................................................................... ........................................................................................................................................... ........................................................................................................................................... ........................................................................................................................................... ........................................................................................................................................... ........................................................................................................................................... ..................................................................................................................................... [3] [Total: 13]
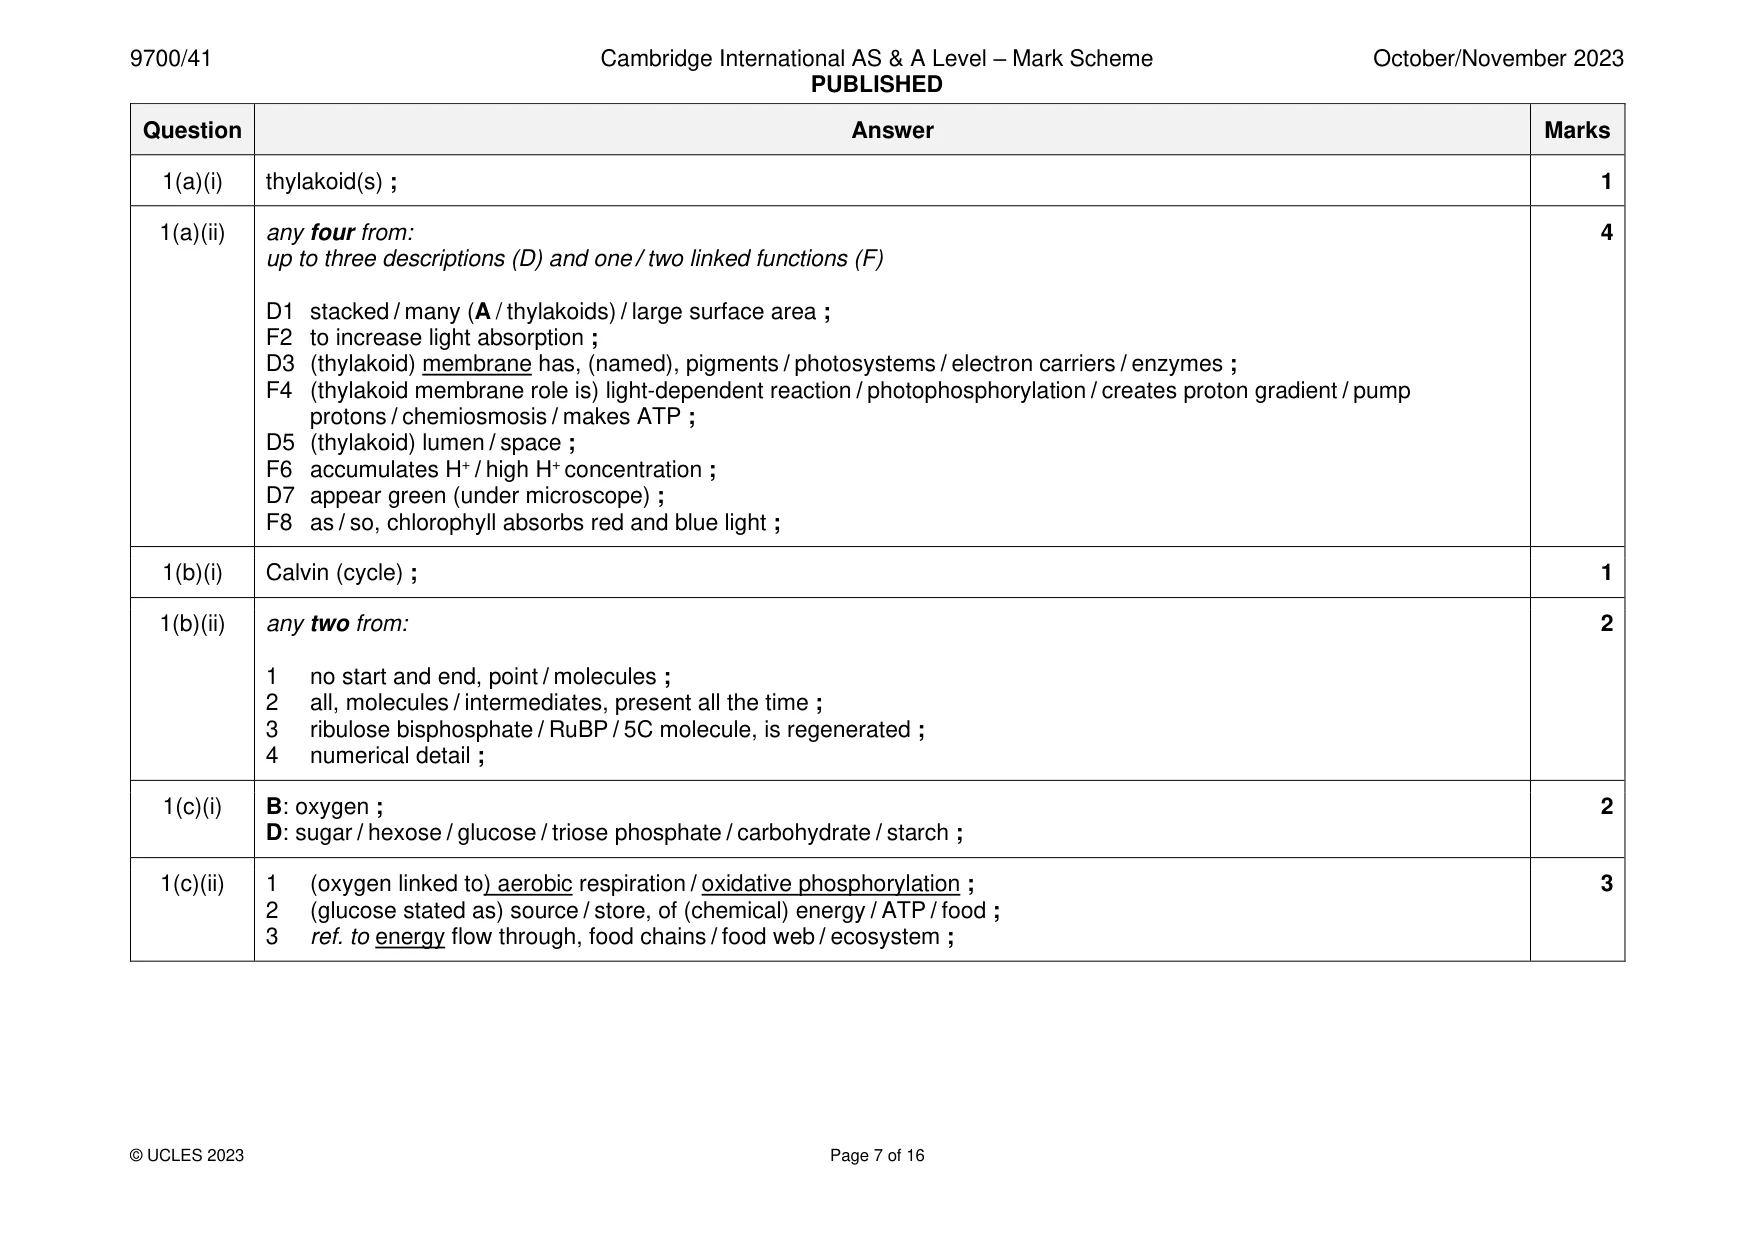
Mark scheme: Question Answer Marks 1(a)(i) thylakoid(s) ; 1 1(a)(ii) any four from: 4 up to three descriptions (D) and one / two linked functions (F) D1 stacked / many (A / thylakoids) / large surface area ; F2 to increase light absorption ; D3 (thylakoid) membrane has, (named), pigments / photosystems / electron carriers / enzymes ; F4 (thylakoid membrane role is) light-dependent reaction / photophosphorylation / creates proton gradient / pump protons / chemiosmosis / makes ATP ; D5 (thylakoid) lumen / space ; F6 accumulates H+ / high H+ concentration ; D7 appear green (under microscope) ; F8 as / so, chlorophyll absorbs red and blue light ; 1(b)(i) Calvin (cycle) ; 1 1(b)(ii) any two from: 2 1 no start and end, point / molecules ; 2 all, molecules / intermediates, present all the time ; 3 ribulose bisphosphate / RuBP / 5C molecule, is regenerated ; 4 numerical detail ; 1(c)(i) B: oxygen ; 2 D: sugar / hexose / glucose / triose phosphate / carbohydrate / starch ; 1(c)(ii) 1 (oxygen linked to) aerobic respiration / oxidative phosphorylation ; 3 2 (glucose stated as) source / store, of (chemical) energy / ATP / food ; 3 ref. to energy flow through, food chains / food web / ecosystem ;
More questions on Photosynthesis as an energy transfer process
Q2 · Biodiversity can be assessed at three different levels
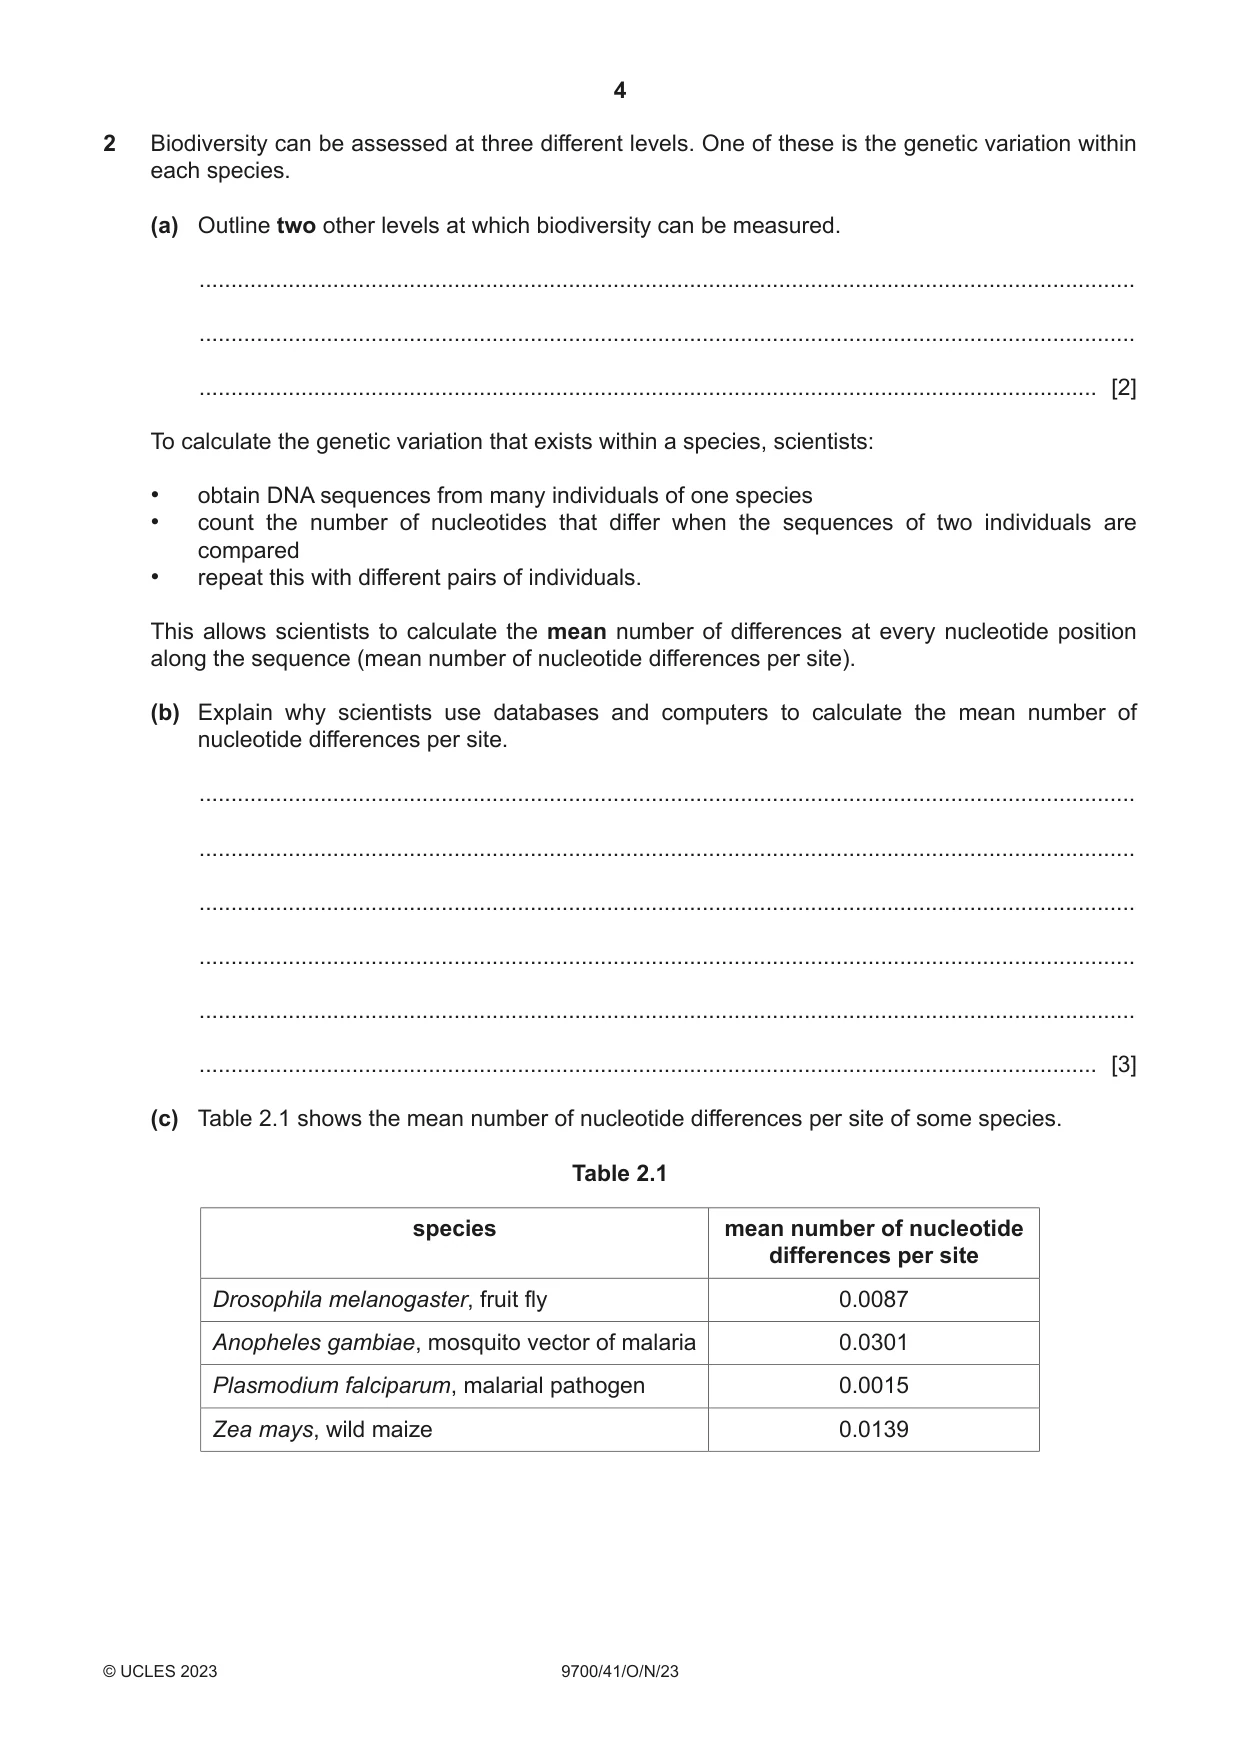
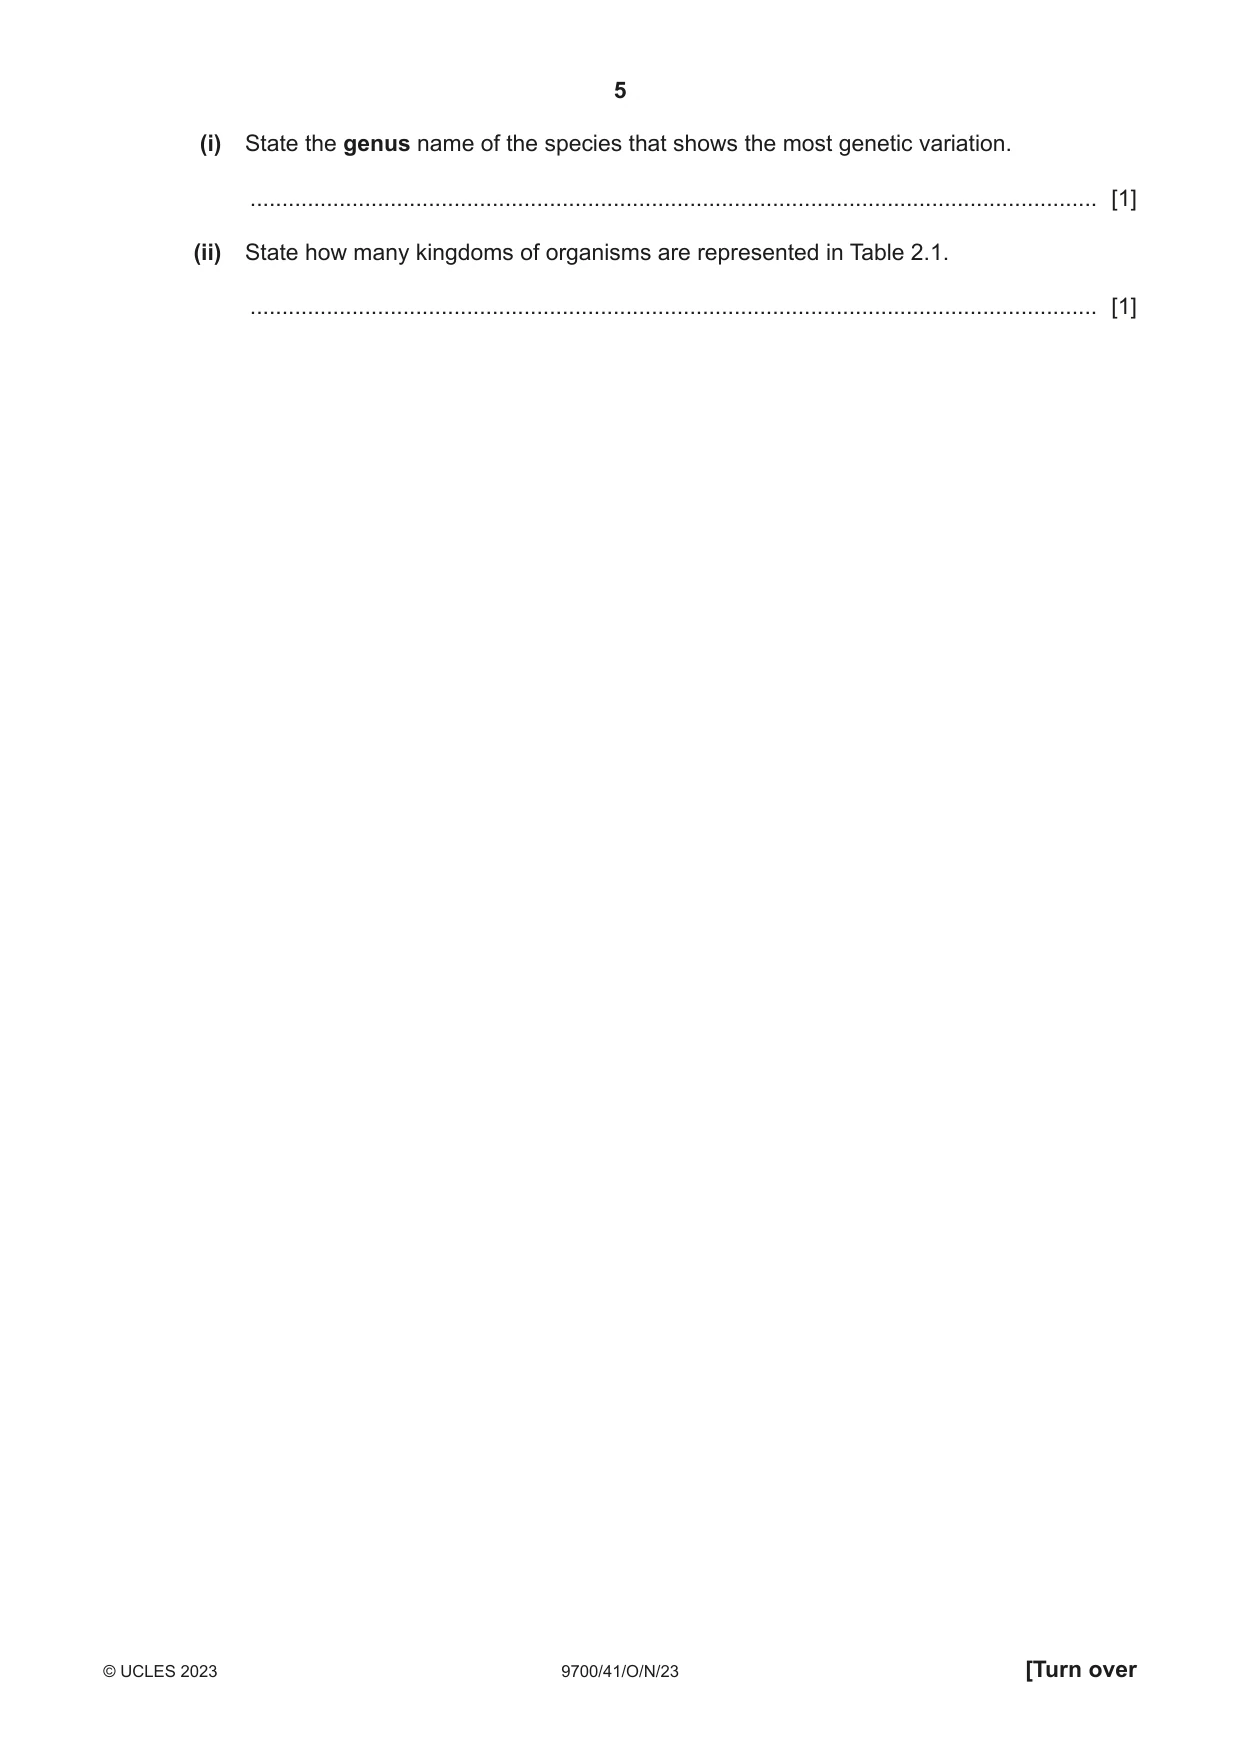
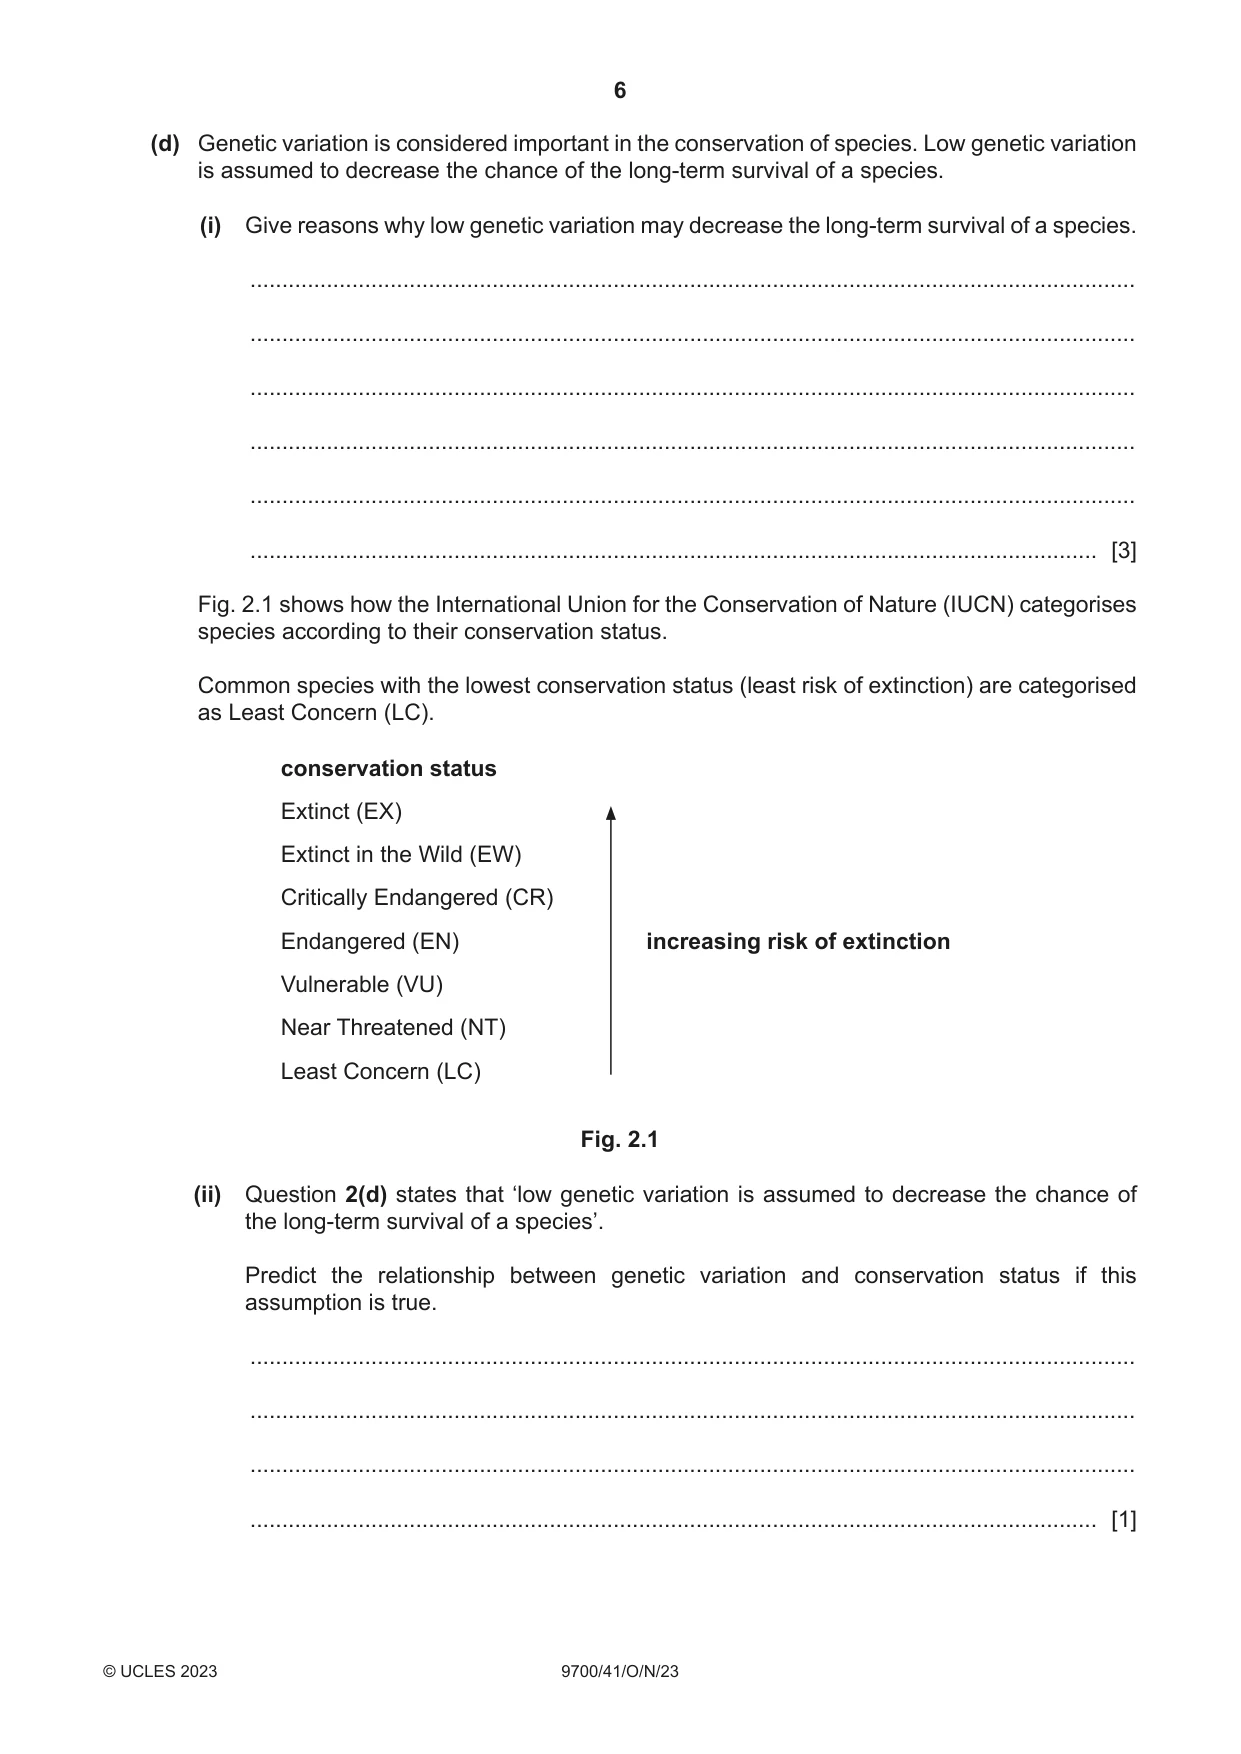
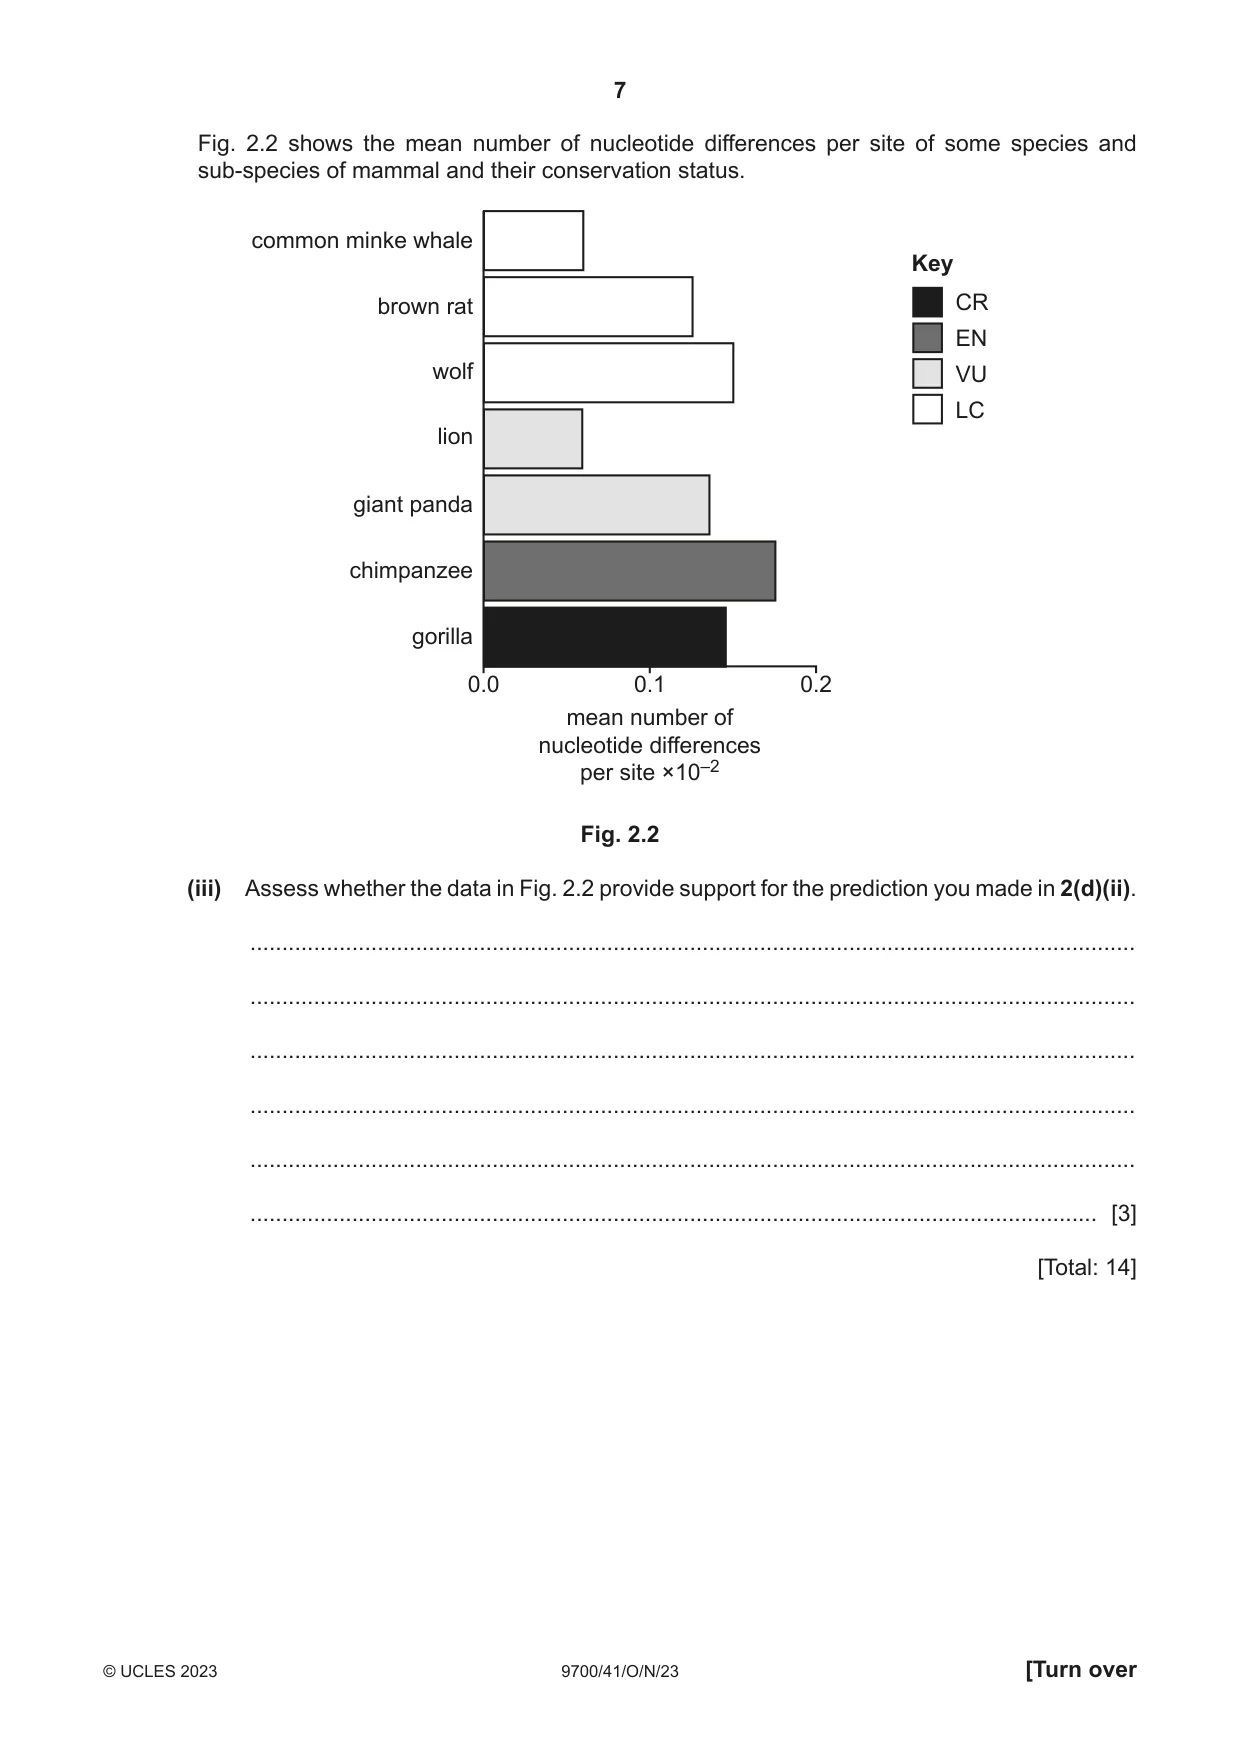
2 Biodiversity can be assessed at three different levels. One of these is the genetic variation within each species. (a) Outline two other levels at which biodiversity can be measured. ................................................................................................................................................... ................................................................................................................................................... ............................................................................................................................................. [2] To calculate the genetic variation that exists within a species, scientists: • obtain DNA sequences from many individuals of one species • count the number of nucleotides that differ when the sequences of two individuals are compared • repeat this with different pairs of individuals. This allows scientists to calculate the mean number of differences at every nucleotide position along the sequence (mean number of nucleotide differences per site). (b) Explain why scientists use databases and computers to calculate the mean number of nucleotide differences per site. ................................................................................................................................................... ................................................................................................................................................... ................................................................................................................................................... ................................................................................................................................................... ................................................................................................................................................... ............................................................................................................................................. [3] (c) Table 2.1 shows the mean number of nucleotide differences per site of some species. Table 2.1 species mean number of nucleotide differences per site Drosophila melanogaster, fruit fly 0.0087 Anopheles gambiae, mosquito vector of malaria 0.0301 Plasmodium falciparum, malarial pathogen 0.0015 Zea mays, wild maize 0.0139 (i) State the genus name of the species that shows the most genetic variation. ..................................................................................................................................... [1] (ii) State how many kingdoms of organisms are represented in Table 2.1. ..................................................................................................................................... [1] (d) Genetic variation is considered important in the conservation of species. Low genetic variation is assumed to decrease the chance of the long-term survival of a species. (i) Give reasons why low genetic variation may decrease the long-term survival of a species. ........................................................................................................................................... ........................................................................................................................................... ........................................................................................................................................... ........................................................................................................................................... ........................................................................................................................................... ..................................................................................................................................... [3] Fig. 2.1 shows how the International Union for the Conservation of Nature (IUCN) categorises species according to their conservation status. Common species with the lowest conservation status (least risk of extinction) are categorised as Least Concern (LC). conservation status Extinct (EX) Extinct in the Wild (EW) Critically Endangered (CR) Endangered (EN) increasing risk of extinction Vulnerable (VU) Near Threatened (NT) Least Concern (LC) Fig. 2.1 (ii) Question 2(d) states that ‘low genetic variation is assumed to decrease the chance of the long-term survival of a species’. Predict the relationship between genetic variation and conservation status if this assumption is true. ........................................................................................................................................... ........................................................................................................................................... ........................................................................................................................................... ..................................................................................................................................... [1] Fig. 2.2 shows the mean number of nucleotide differences per site of some species and sub-species of mammal and their conservation status. common minke whale Key brown rat CR EN wolf VU LC lion giant panda chimpanzee gorilla 0.0 0.1 0.2 mean number of nucleotide differences per site ×10–2 Fig. 2.2 (iii) Assess whether the data in Fig. 2.2 provide support for the prediction you made in 2(d)(ii). ........................................................................................................................................... ........................................................................................................................................... ........................................................................................................................................... ........................................................................................................................................... ........................................................................................................................................... ..................................................................................................................................... [3] [Total: 14]
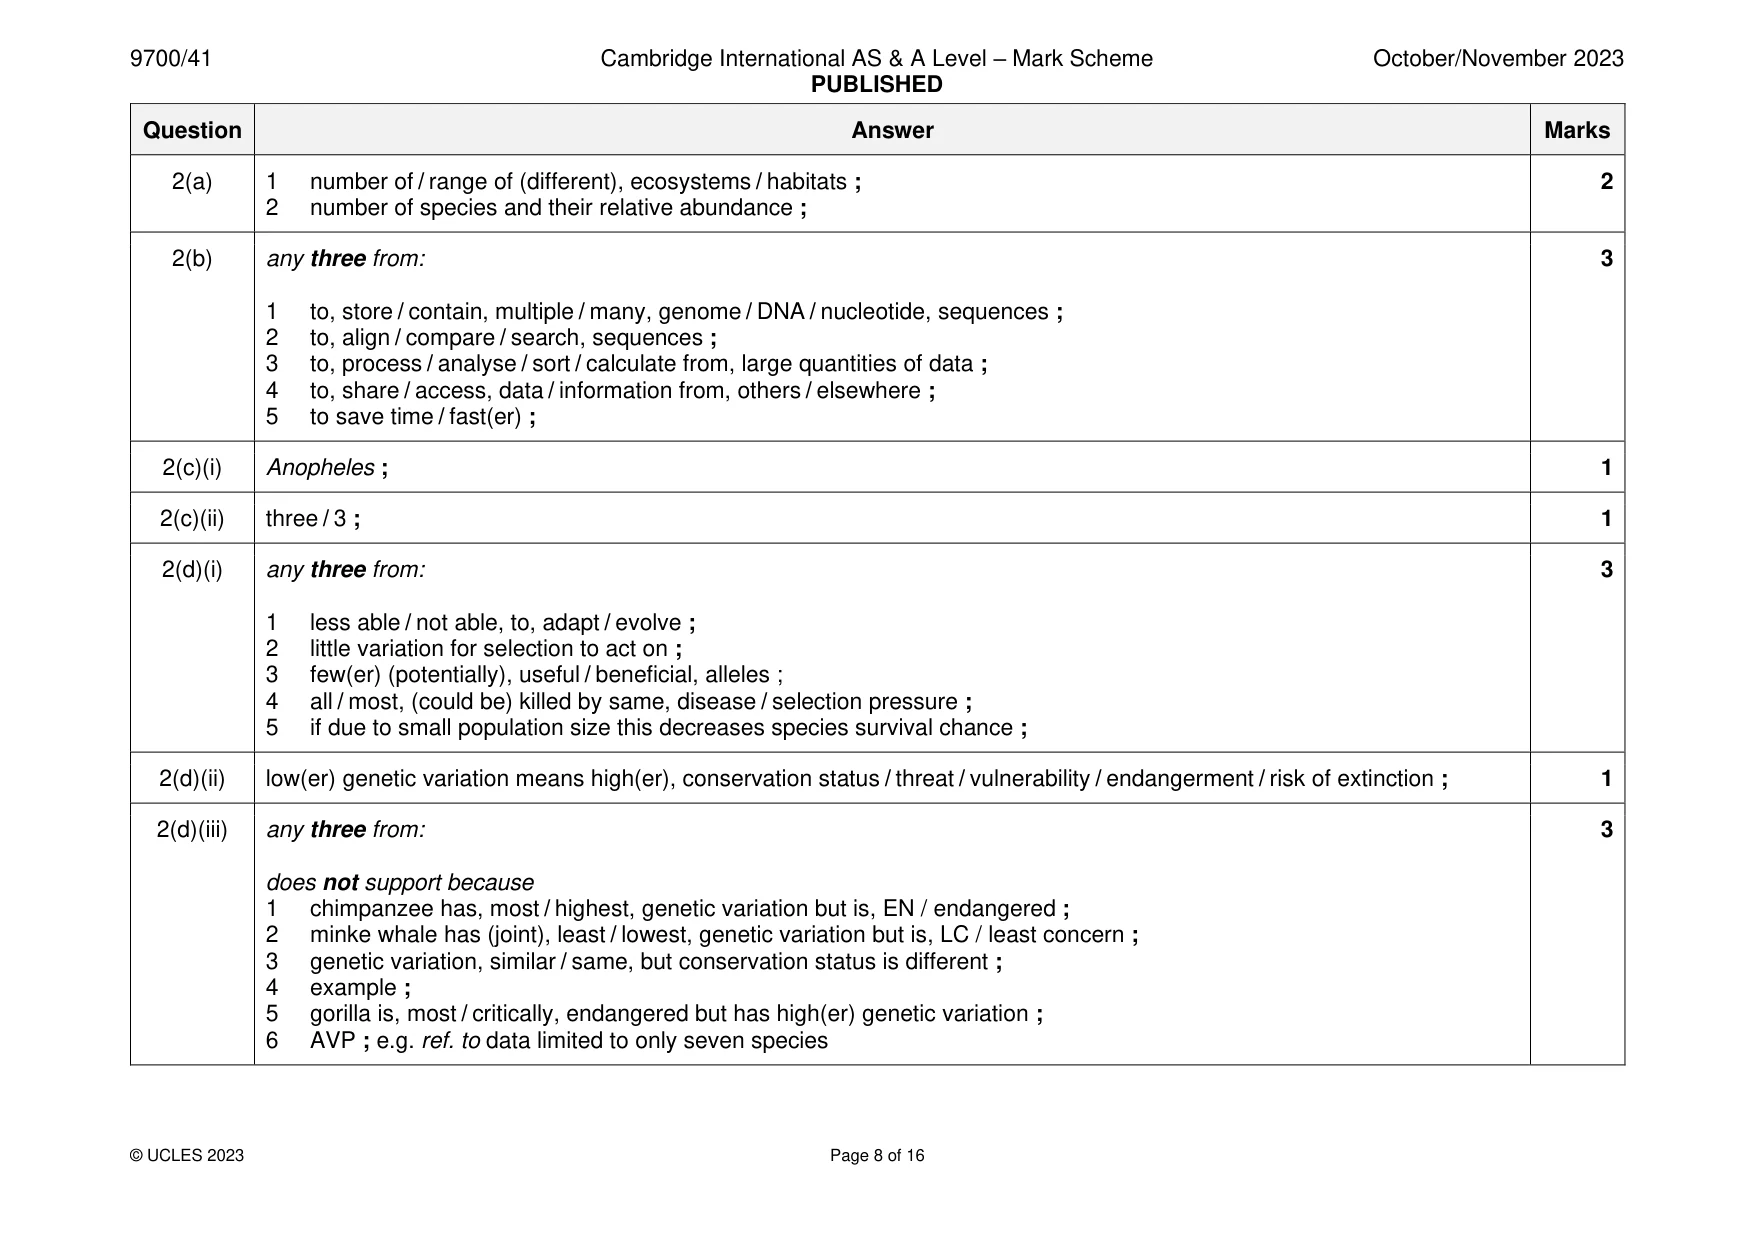
Mark scheme: 2(a) 1 number of / range of (different), ecosystems / habitats ; 2 2 number of species and their relative abundance ; 2(b) any three from: 3 1 to, store / contain, multiple / many, genome / DNA / nucleotide, sequences ; 2 to, align / compare / search, sequences ; 3 to, process / analyse / sort / calculate from, large quantities of data ; 4 to, share / access, data / information from, others / elsewhere ; 5 to save time / fast(er) ; 2(c)(i) Anopheles ; 1 2(c)(ii) three / 3 ; 1 2(d)(i) any three from: 3 1 less able / not able, to, adapt / evolve ; 2 little variation for selection to act on ; 3 few(er) (potentially), useful / beneficial, alleles ; 4 all / most, (could be) killed by same, disease / selection pressure ; 5 if due to small population size this decreases species survival chance ; 2(d)(ii) low(er) genetic variation means high(er), conservation status / threat / vulnerability / endangerment / risk of extinction ; 1 2(d)(iii) any three from: 3 does not support because 1 chimpanzee has, most / highest, genetic variation but is, EN / endangered ; 2 minke whale has (joint), least / lowest, genetic variation but is, LC / least concern ; 3 genetic variation, similar / same, but conservation status is different ; 4 example ; 5 gorilla is, most / critically, endangered but has high(er) genetic variation ; 6 AVP ; e.g. ref. to data limited to only seven species
Q3 · There are more than 600 plant species in the genus Ipomoea
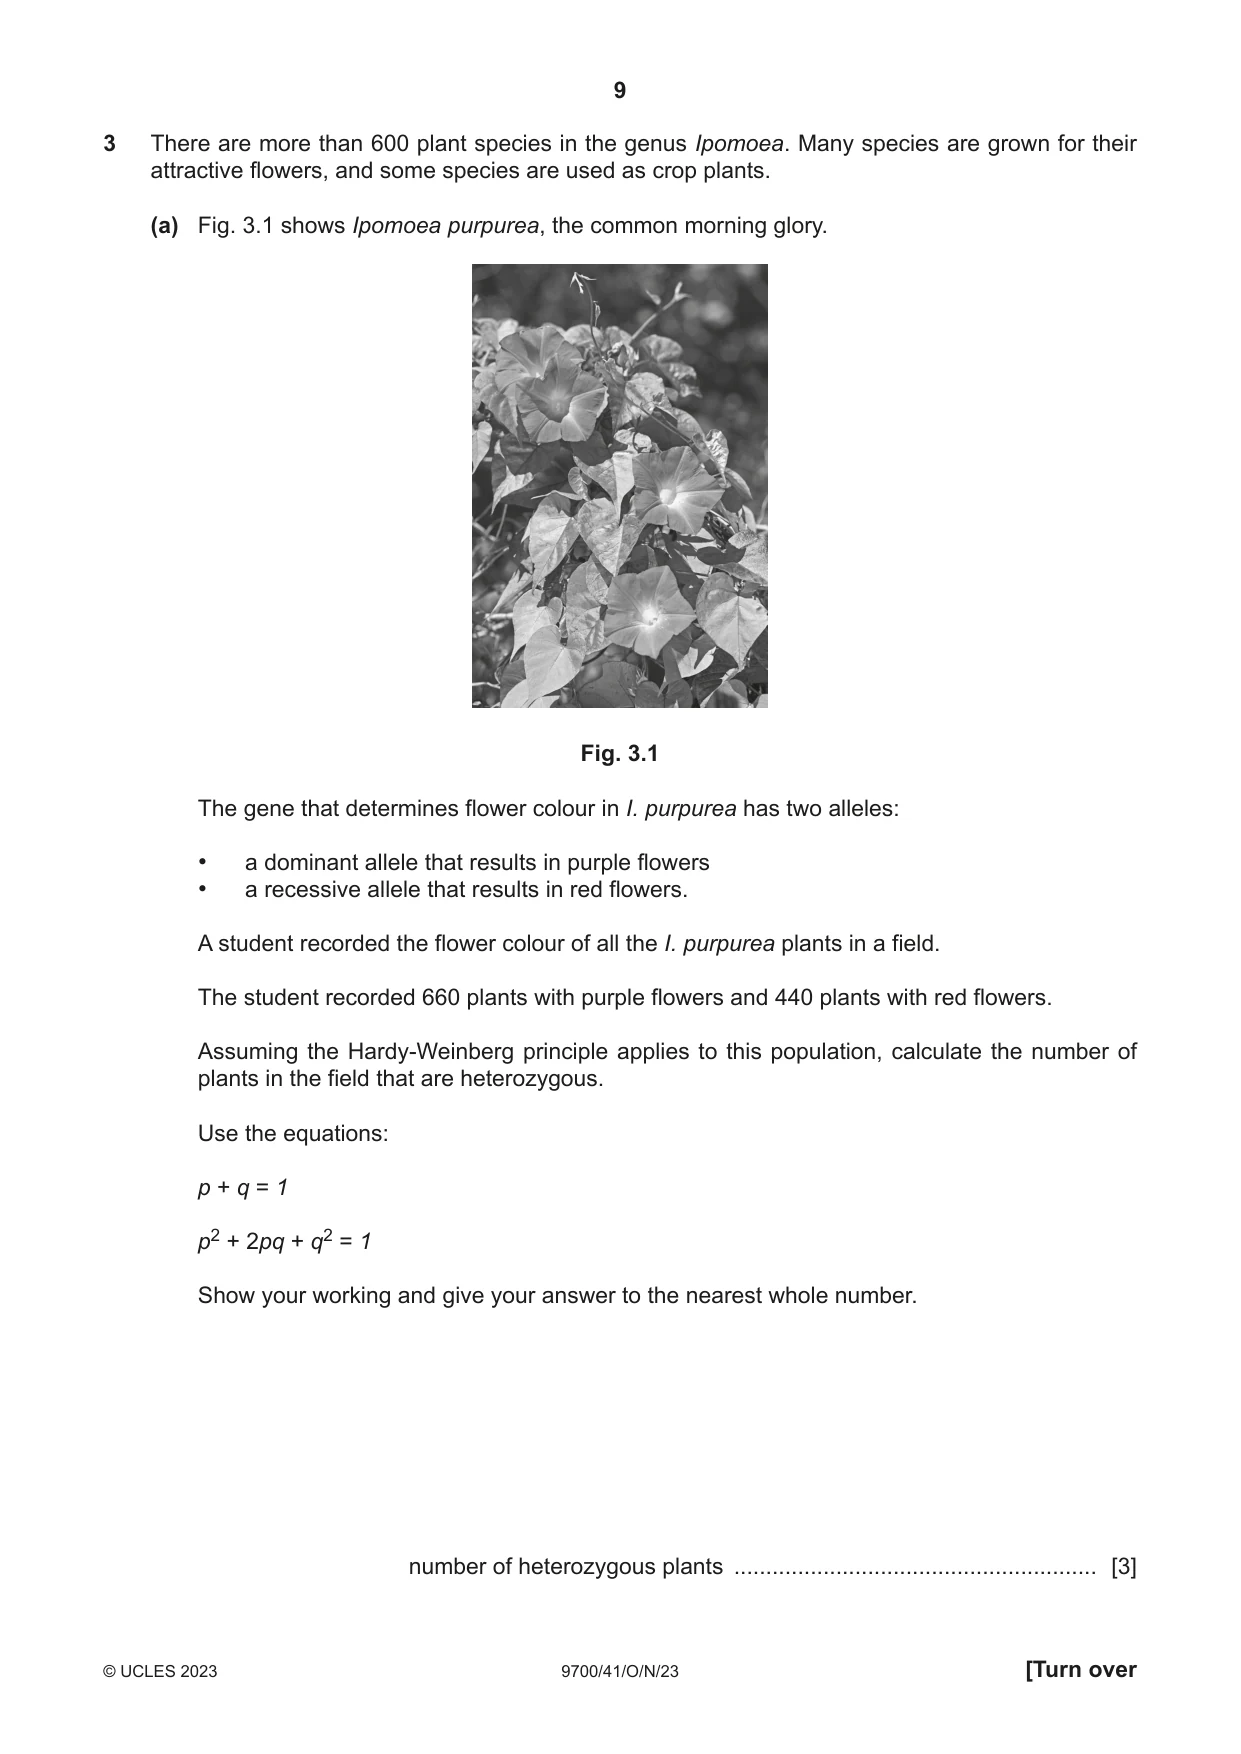
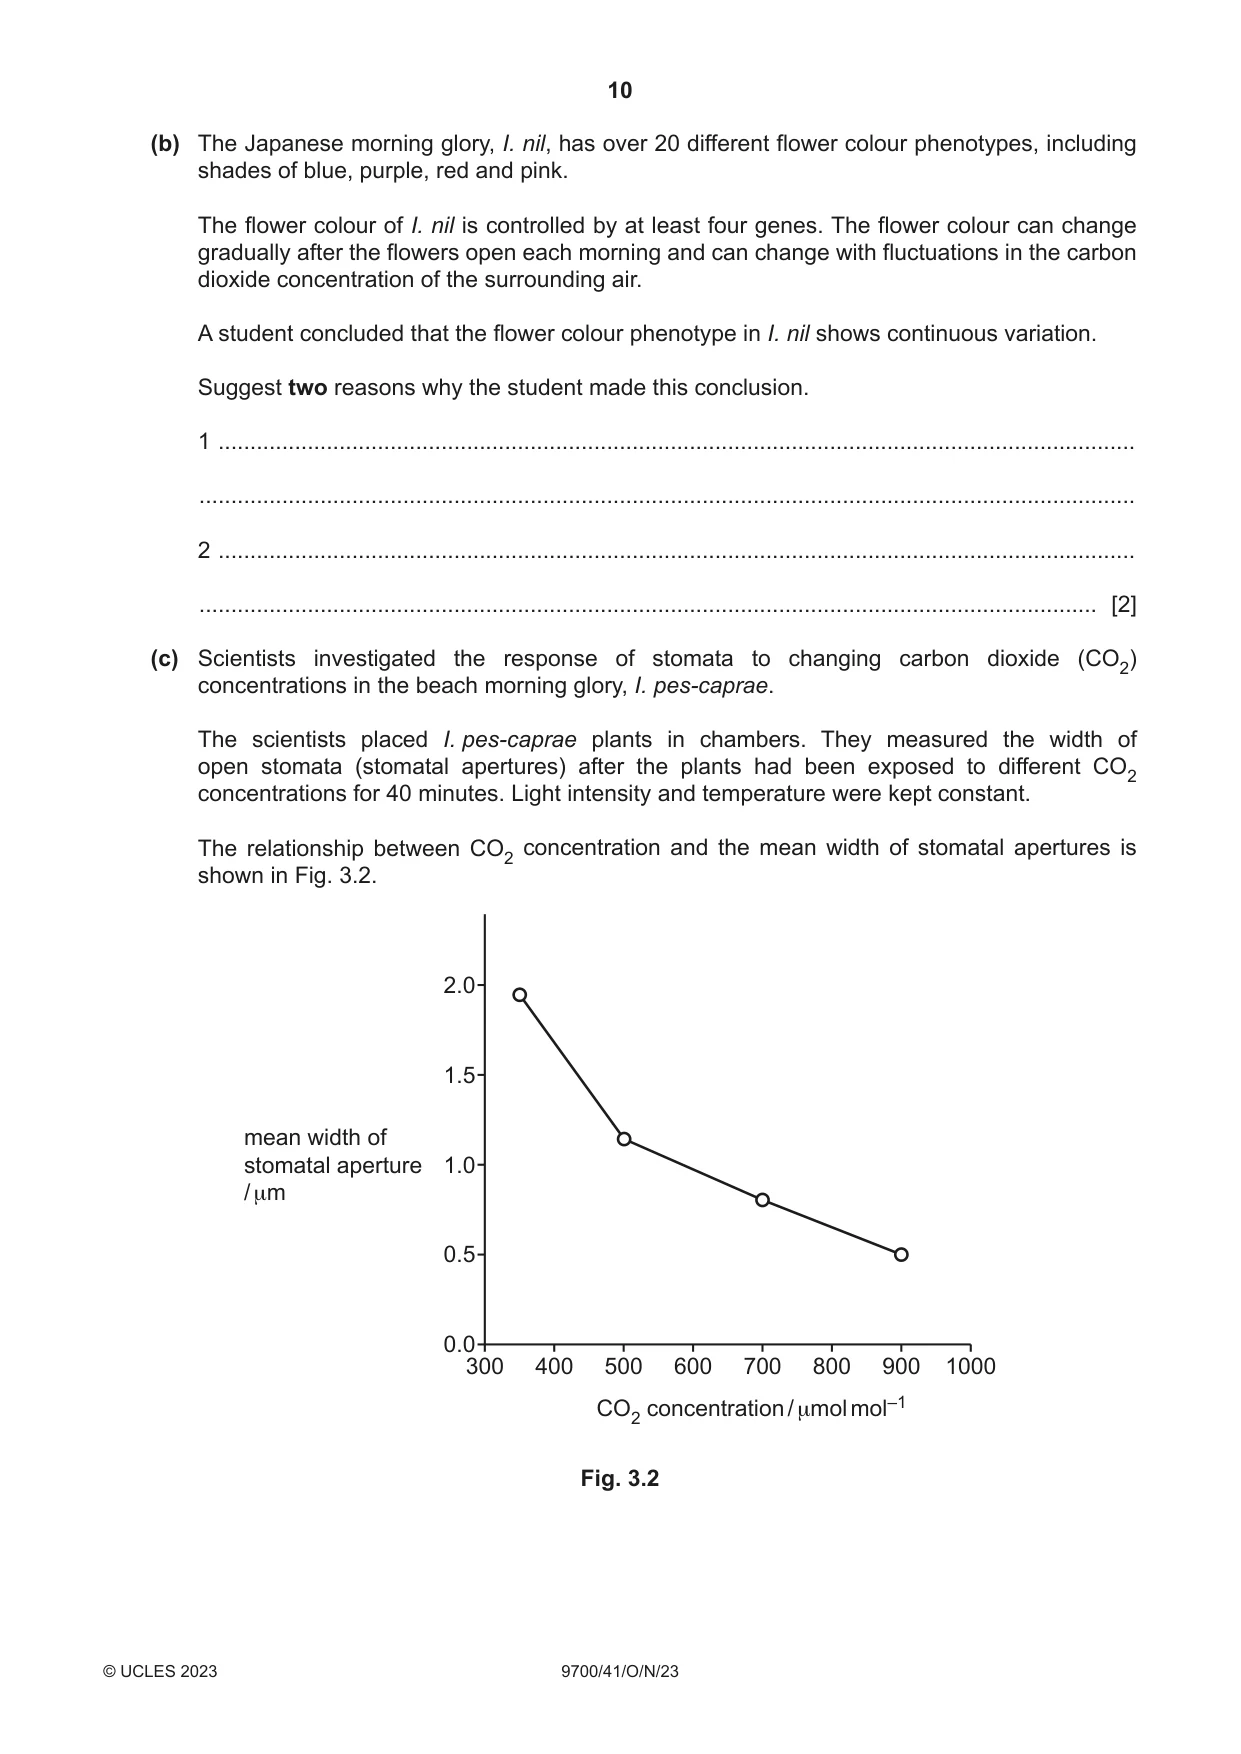
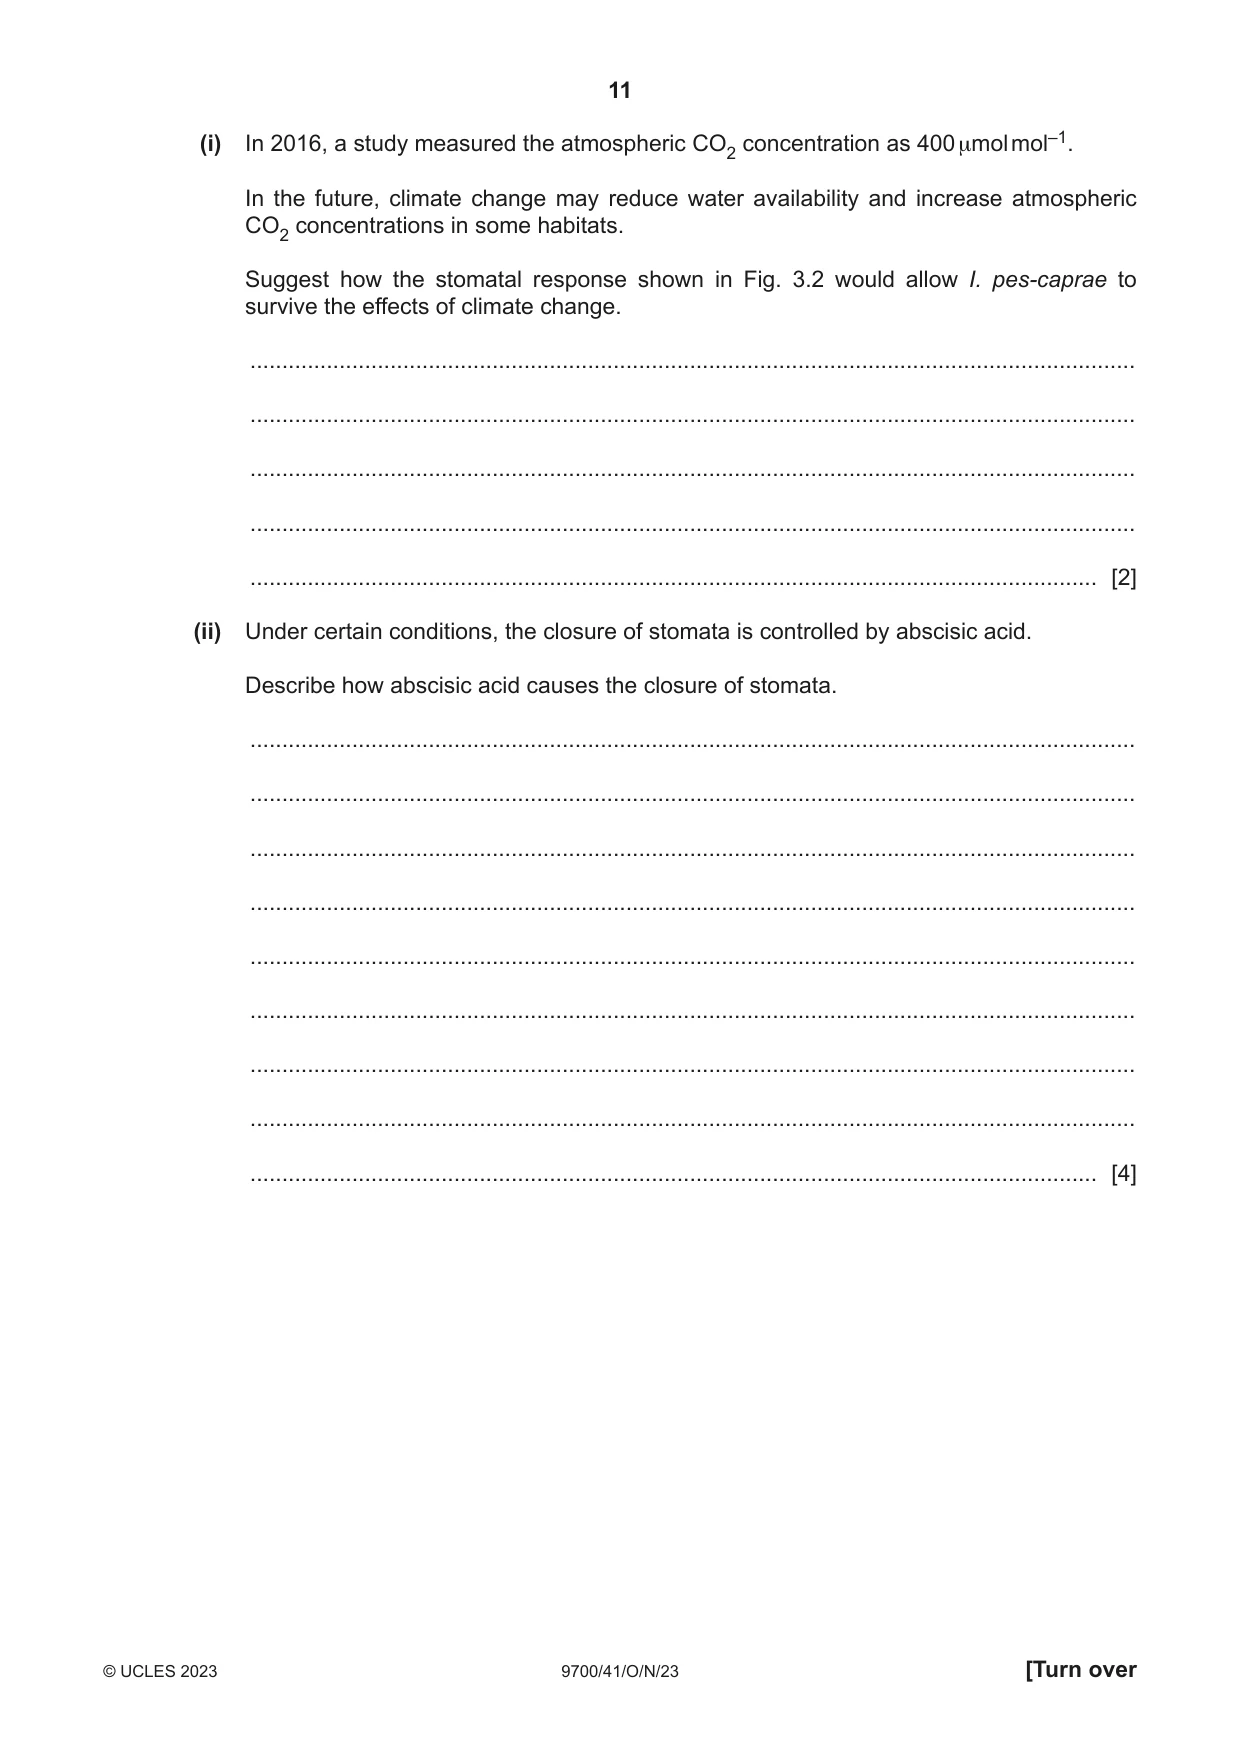
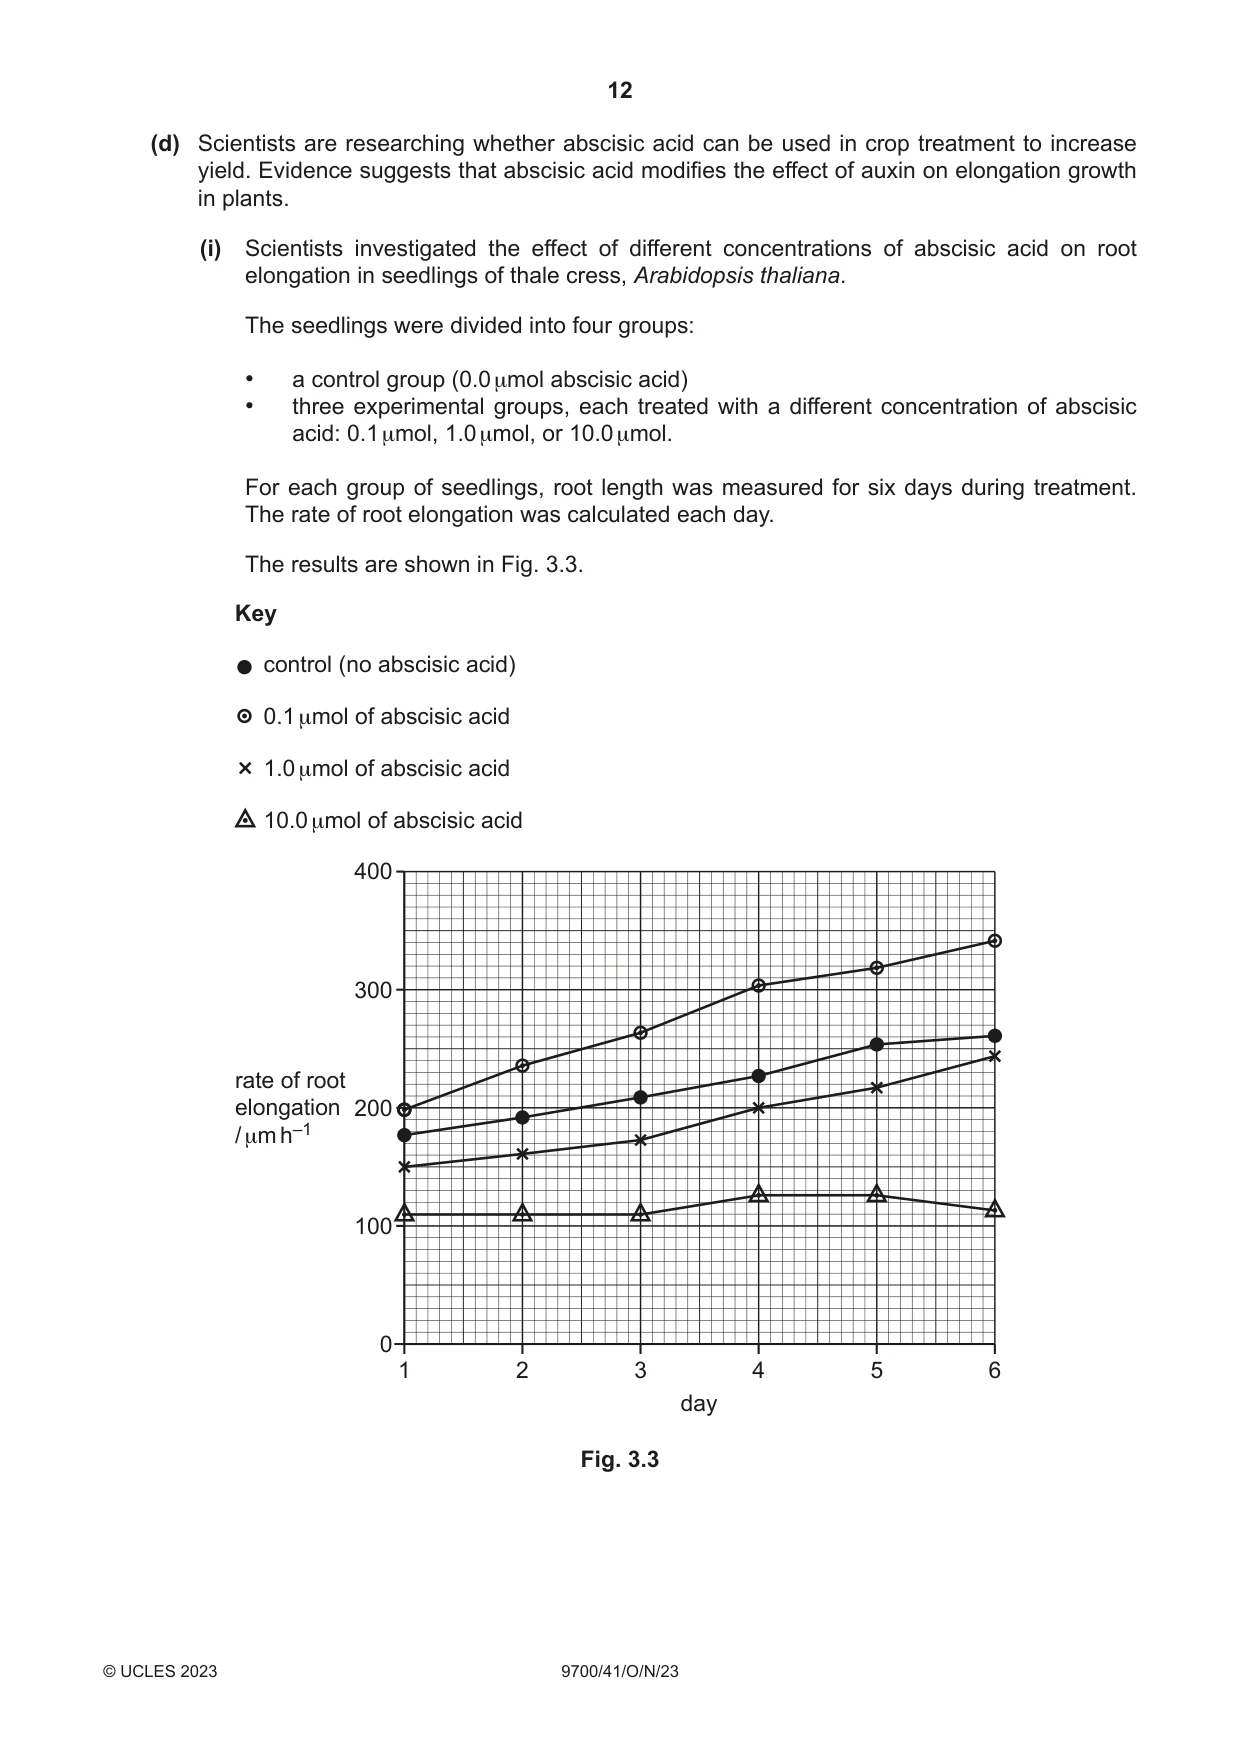
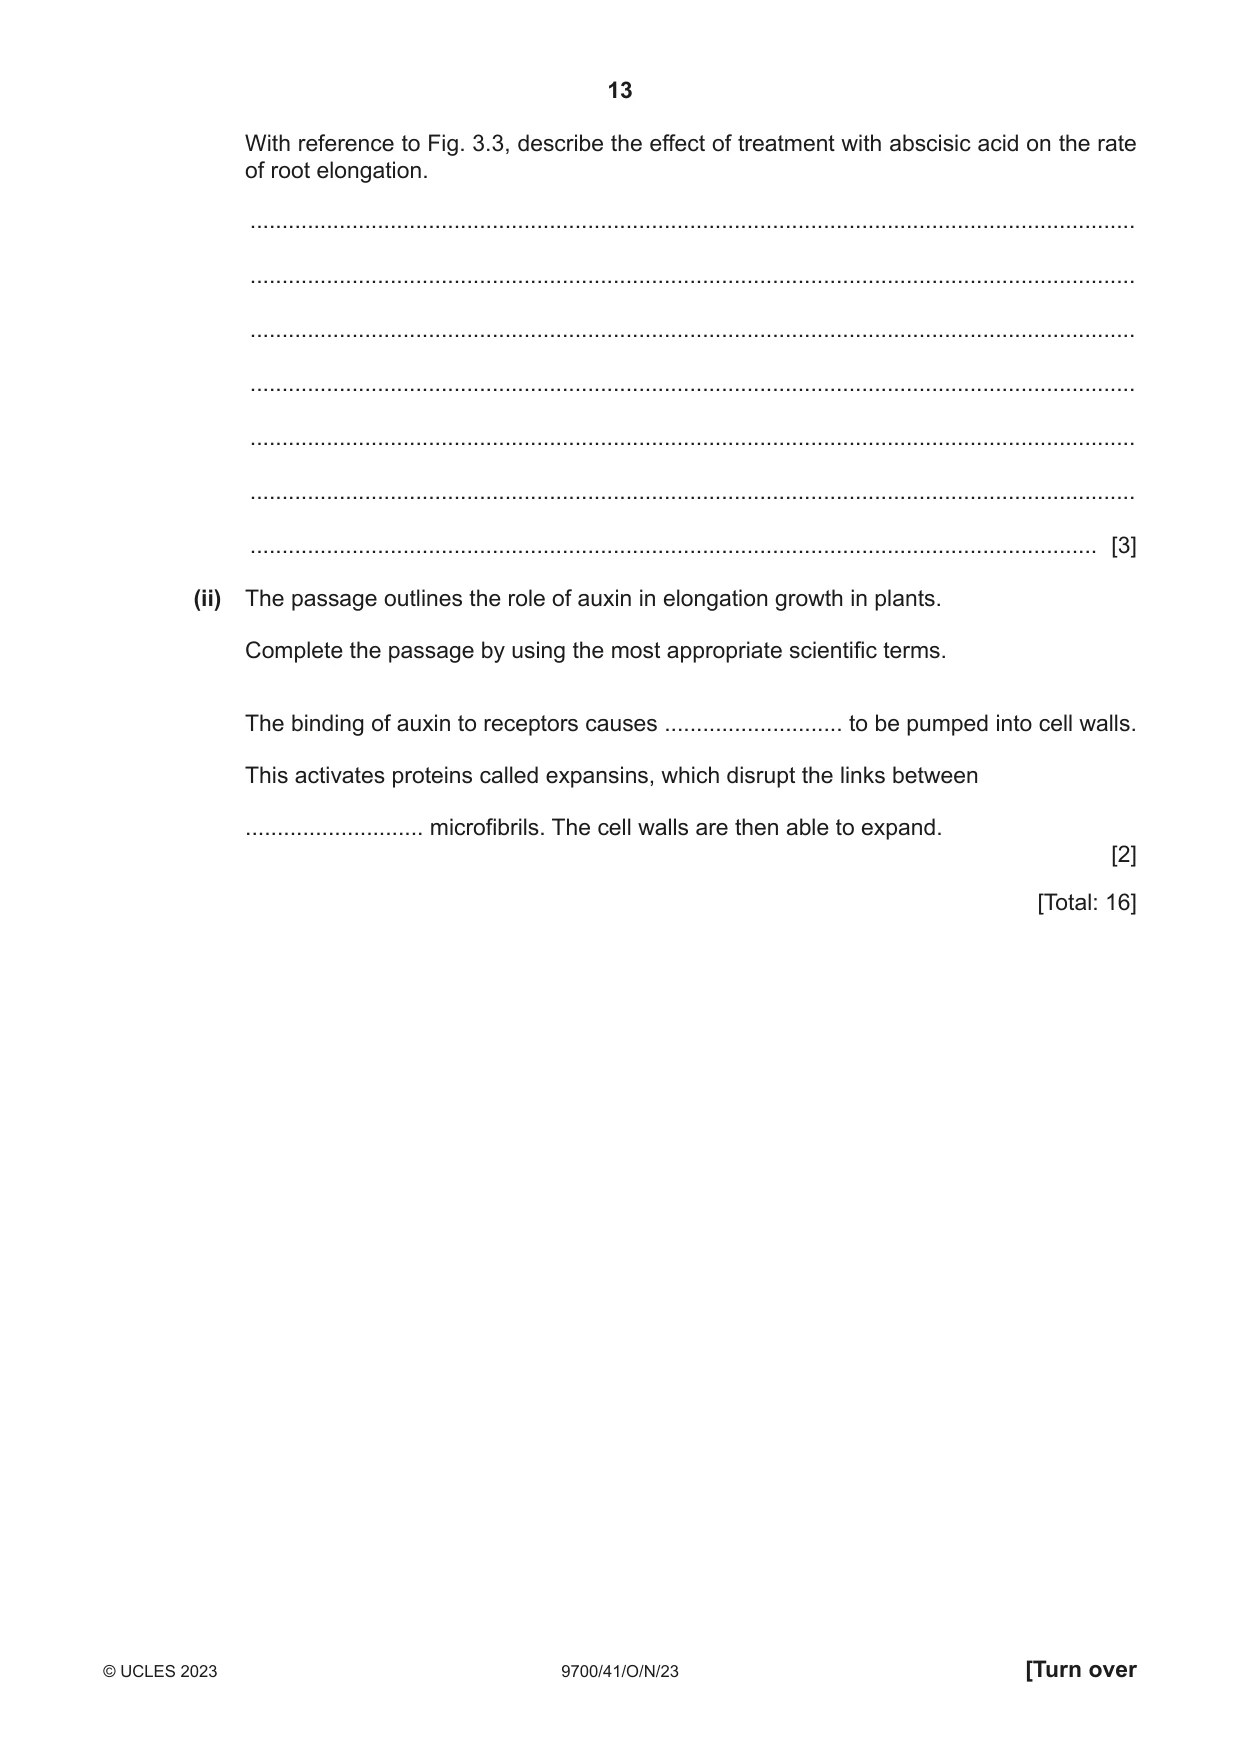
3 There are more than 600 plant species in the genus Ipomoea. Many species are grown for their attractive flowers, and some species are used as crop plants. (a) Fig. 3.1 shows Ipomoea purpurea, the common morning glory. Fig. 3.1 The gene that determines flower colour in I. purpurea has two alleles: • a dominant allele that results in purple flowers • a recessive allele that results in red flowers. A student recorded the flower colour of all the I. purpurea plants in a field. The student recorded 660 plants with purple flowers and 440 plants with red flowers. Assuming the Hardy-Weinberg principle applies to this population, calculate the number of plants in the field that are heterozygous. Use the equations: p + q = 1 p2 + 2pq + q2 = 1 Show your working and give your answer to the nearest whole number. number of heterozygous plants ......................................................... [3] (b) The Japanese morning glory, I. nil, has over 20 different flower colour phenotypes, including shades of blue, purple, red and pink. The flower colour of I. nil is controlled by at least four genes. The flower colour can change gradually after the flowers open each morning and can change with fluctuations in the carbon dioxide concentration of the surrounding air. A student concluded that the flower colour phenotype in I. nil shows continuous variation. Suggest two reasons why the student made this conclusion. 1 ................................................................................................................................................ ................................................................................................................................................... 2 ................................................................................................................................................ ............................................................................................................................................. [2] (c) Scientists investigated the response of stomata to changing carbon dioxide (CO2) concentrations in the beach morning glory, I. pes-caprae. The scientists placed I. pes-caprae plants in chambers. They measured the width of open stomata (stomatal apertures) after the plants had been exposed to different CO2 concentrations for 40 minutes. Light intensity and temperature were kept constant. The relationship between CO2 concentration and the mean width of stomatal apertures is shown in Fig. 3.2. 2.0 1.5 mean width of stomatal aperture 1.0 / μm 0.5 0.0 300 400 500 600 700 800 900 1000 CO2 concentration / μmol mol–1 Fig. 3.2 (i) In 2016, a study measured the atmospheric CO2 concentration as 400 μmol mol–1. In the future, climate change may reduce water availability and increase atmospheric CO2 concentrations in some habitats. Suggest how the stomatal response shown in Fig. 3.2 would allow I. pes-caprae to survive the effects of climate change. ........................................................................................................................................... ........................................................................................................................................... ........................................................................................................................................... ........................................................................................................................................... ..................................................................................................................................... [2] (ii) Under certain conditions, the closure of stomata is controlled by abscisic acid. Describe how abscisic acid causes the closure of stomata. ........................................................................................................................................... ........................................................................................................................................... ........................................................................................................................................... ........................................................................................................................................... ........................................................................................................................................... ........................................................................................................................................... ........................................................................................................................................... ........................................................................................................................................... ..................................................................................................................................... [4] (d) Scientists are researching whether abscisic acid can be used in crop treatment to increase yield. Evidence suggests that abscisic acid modifies the effect of auxin on elongation growth in plants. (i) Scientists investigated the effect of different concentrations of abscisic acid on root elongation in seedlings of thale cress, Arabidopsis thaliana. The seedlings were divided into four groups: • a control group (0.0 μmol abscisic acid) • three experimental groups, each treated with a different concentration of abscisic acid: 0.1 μmol, 1.0 μmol, or 10.0 μmol. For each group of seedlings, root length was measured for six days during treatment. The rate of root elongation was calculated each day. The results are shown in Fig. 3.3. Key control (no abscisic acid) 0.1 μmol of abscisic acid 1.0 μmol of abscisic acid 10.0 μmol of abscisic acid 400 300 rate of root elongation 200 / μm h–1 100 0 1 2 3 4 5 6 day Fig. 3.3 With reference to Fig. 3.3, describe the effect of treatment with abscisic acid on the rate of root elongation. ........................................................................................................................................... ........................................................................................................................................... ........................................................................................................................................... ........................................................................................................................................... ........................................................................................................................................... ........................................................................................................................................... ..................................................................................................................................... [3] (ii) The passage outlines the role of auxin in elongation growth in plants. Complete the passage by using the most appropriate scientific terms. The binding of auxin to receptors causes ............................ to be pumped into cell walls. This activates proteins called expansins, which disrupt the links between ............................ microfibrils. The cell walls are then able to expand. [2] [Total: 16]
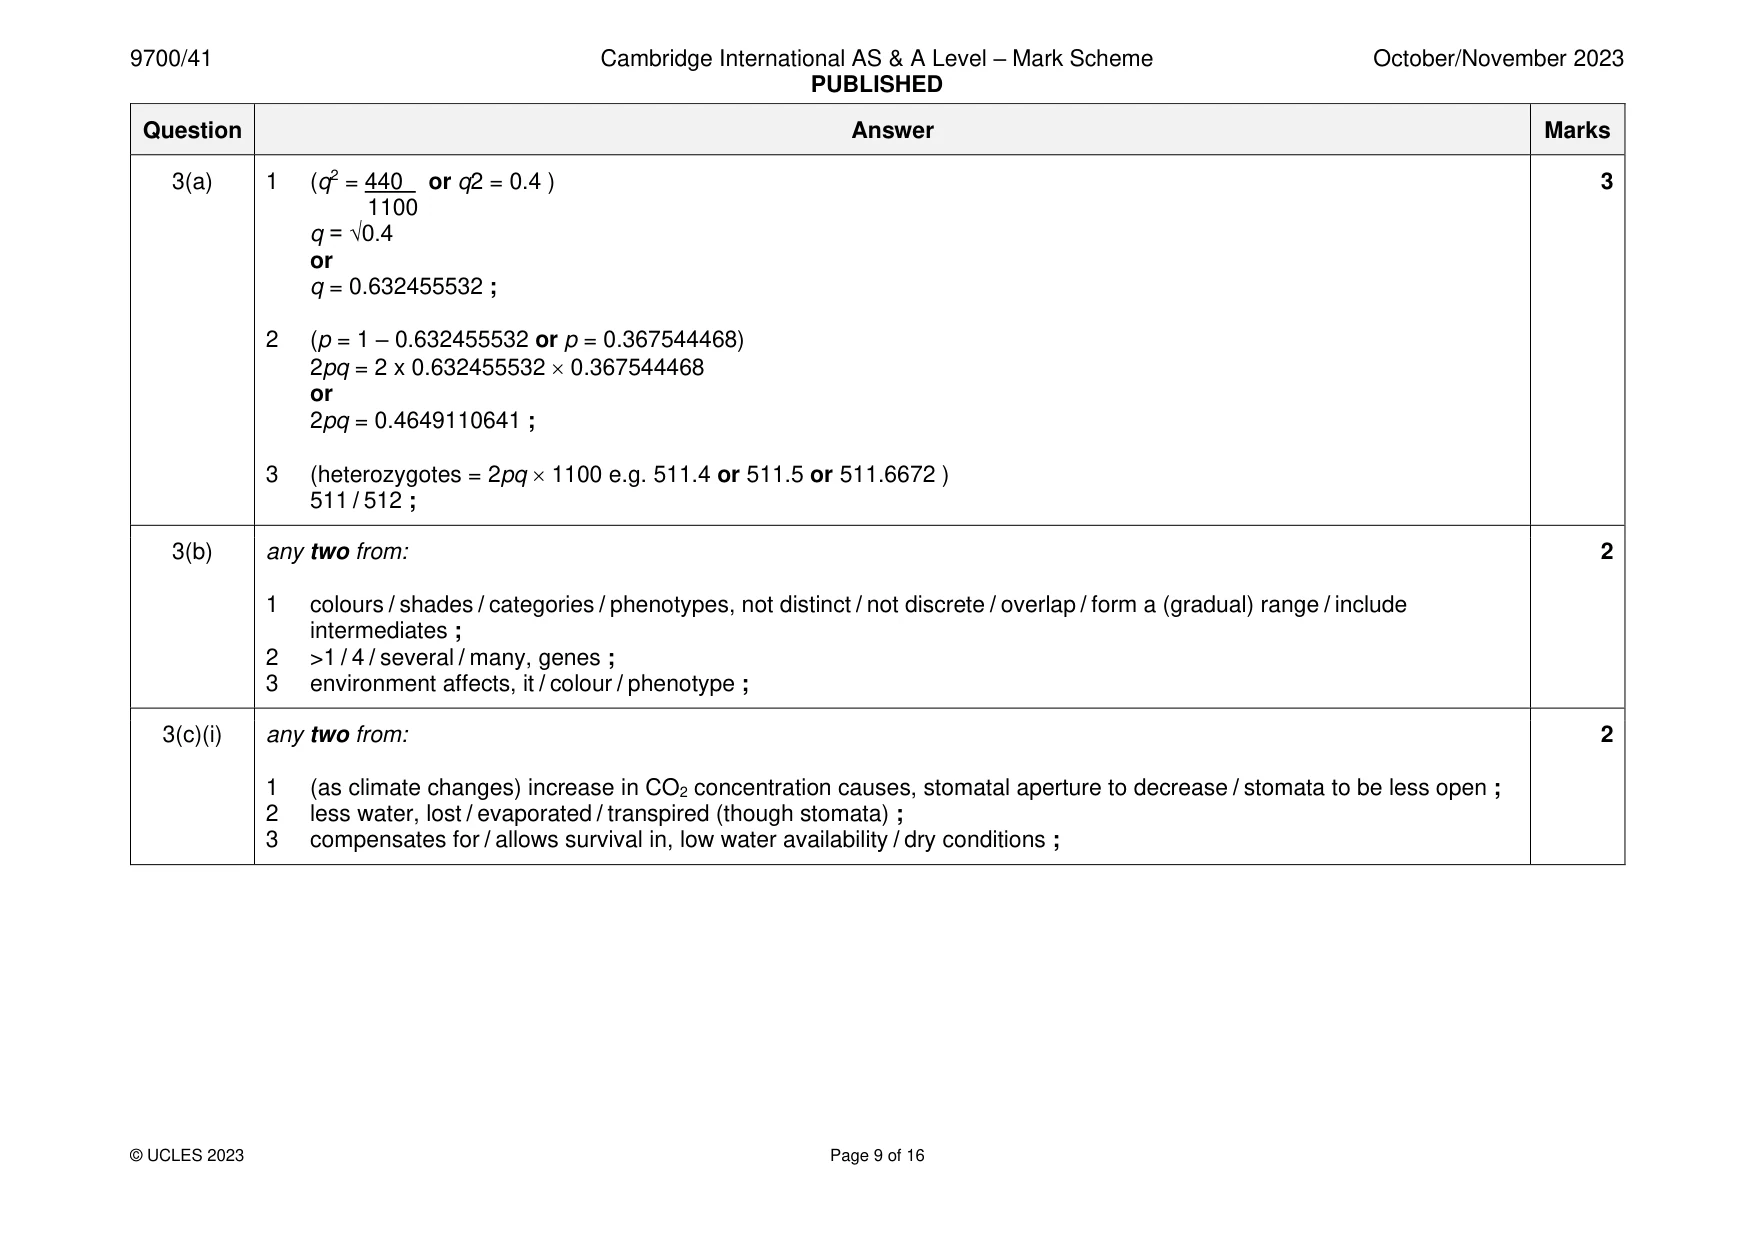
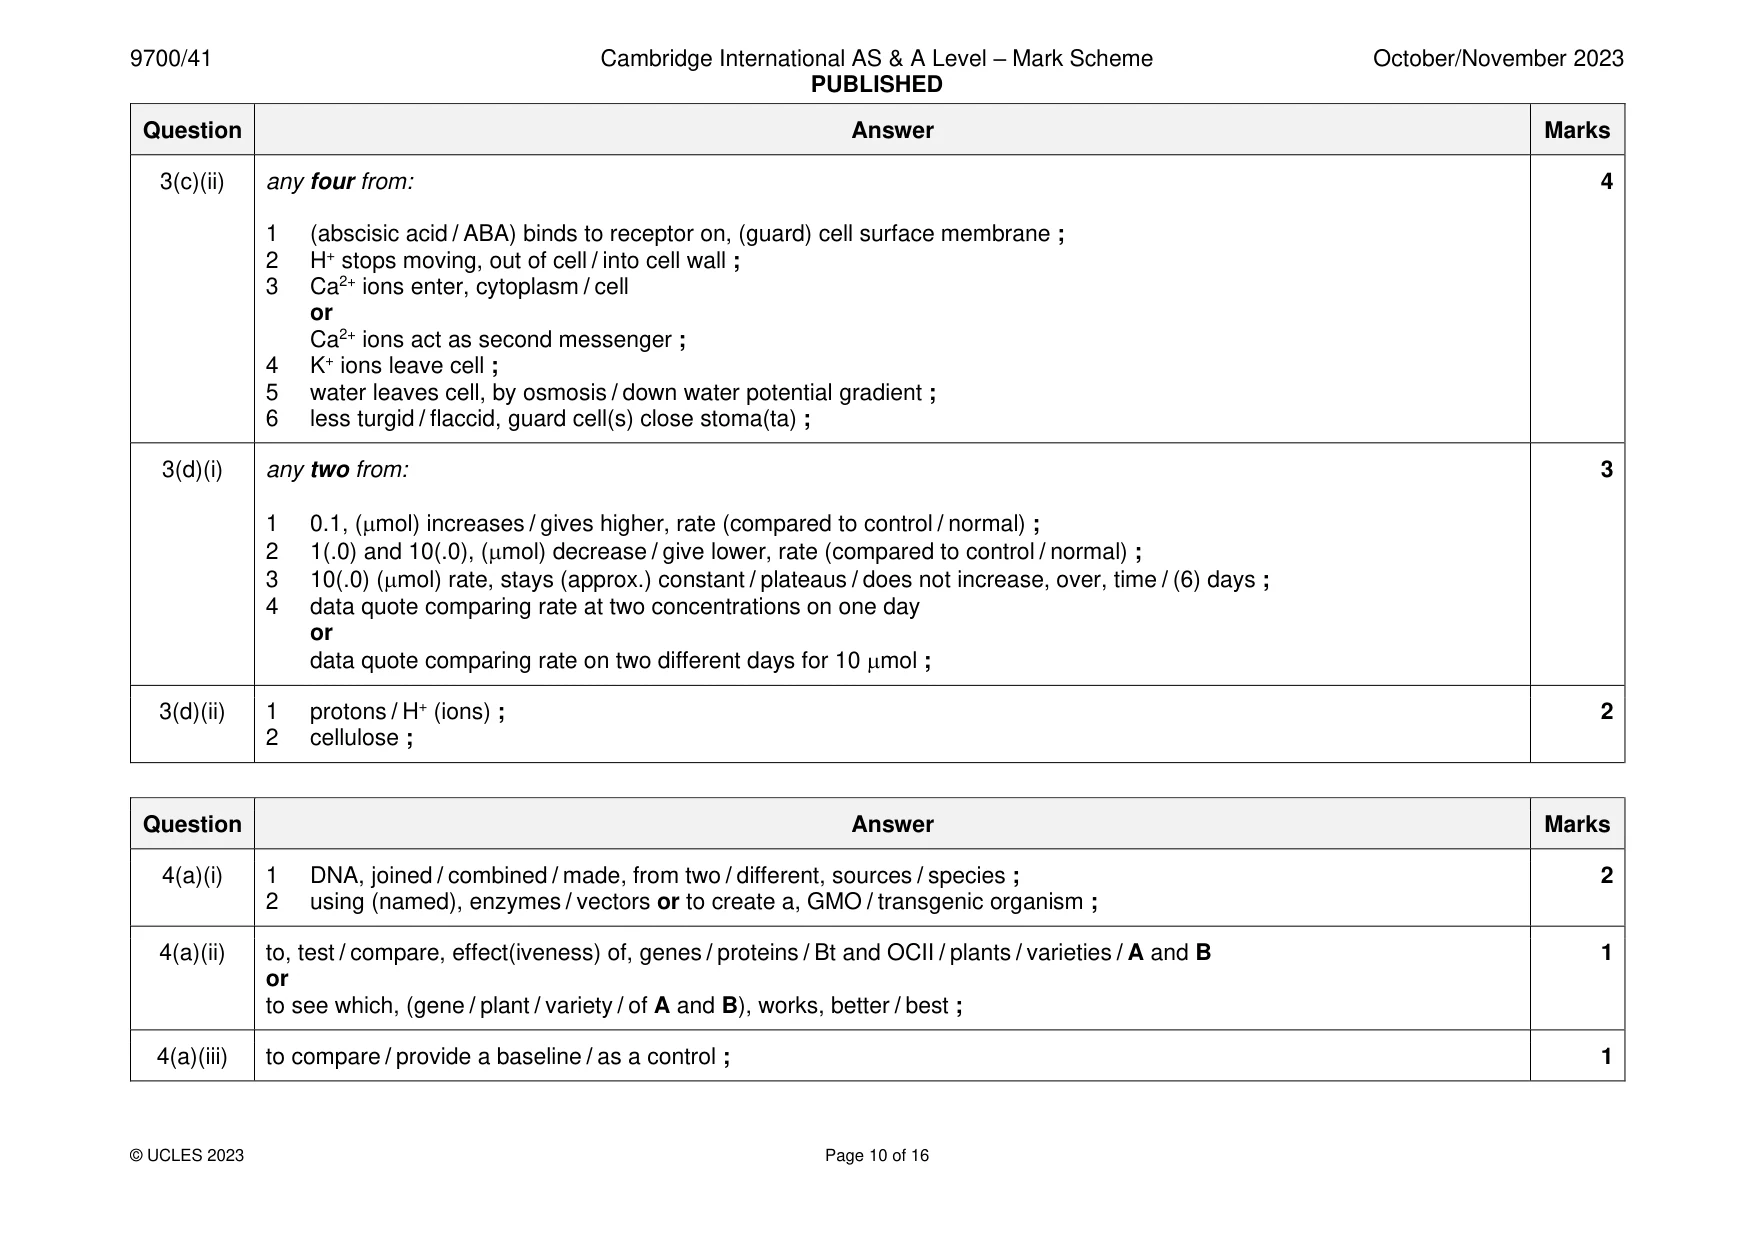
Mark scheme: 3(a) 1 (q2 = 440 or q2 = 0.4 ) 3 1100 q = √0.4 or q = 0.632455532 ; 2 (p = 1 – 0.632455532 or p = 0.367544468) 2pq = 2 x 0.632455532 0.367544468 or 2pq = 0.4649110641 ; 3 (heterozygotes = 2pq 1100 e.g. 511.4 or 511.5 or 511.6672 ) 511 / 512 ; 3(b) any two from: 2 1 colours / shades / categories / phenotypes, not distinct / not discrete / overlap / form a (gradual) range / include intermediates ; 2 >1 / 4 / several / many, genes ; 3 environment affects, it / colour / phenotype ; 3(c)(i) any two from: 2 1 (as climate changes) increase in CO2 concentration causes, stomatal aperture to decrease / stomata to be less open ; 2 less water, lost / evaporated / transpired (though stomata) ; 3 compensates for / allows survival in, low water availability / dry conditions ; 3(c)(ii) any four from: 4 1 (abscisic acid / ABA) binds to receptor on, (guard) cell surface membrane ; 2 H+ stops moving, out of cell / into cell wall ; 3 Ca2+ ions enter, cytoplasm / cell or Ca2+ ions act as second messenger ; 4 K+ ions leave cell ; 5 water leaves cell, by osmosis / down water potential gradient ; 6 less turgid / flaccid, guard cell(s) close stoma(ta) ; 3(d)(i) any two from: 3 1 0.1, (mol) increases / gives higher, rate (compared to control / normal) ; 2 1(.0) and 10(.0), (mol) decrease / give lower, rate (compared to control / normal) ; 3 10(.0) (mol) rate, stays (approx.) constant / plateaus / does not increase, over, time / (6) days ; 4 data quote comparing rate at two concentrations on one day or data quote comparing rate on two different days for 10 mol ; 3(d)(ii) 1 protons / H+ (ions) ; 2 2 cellulose ;
Q4 · The potato plant, Solanum tuberosum, is an important food crop
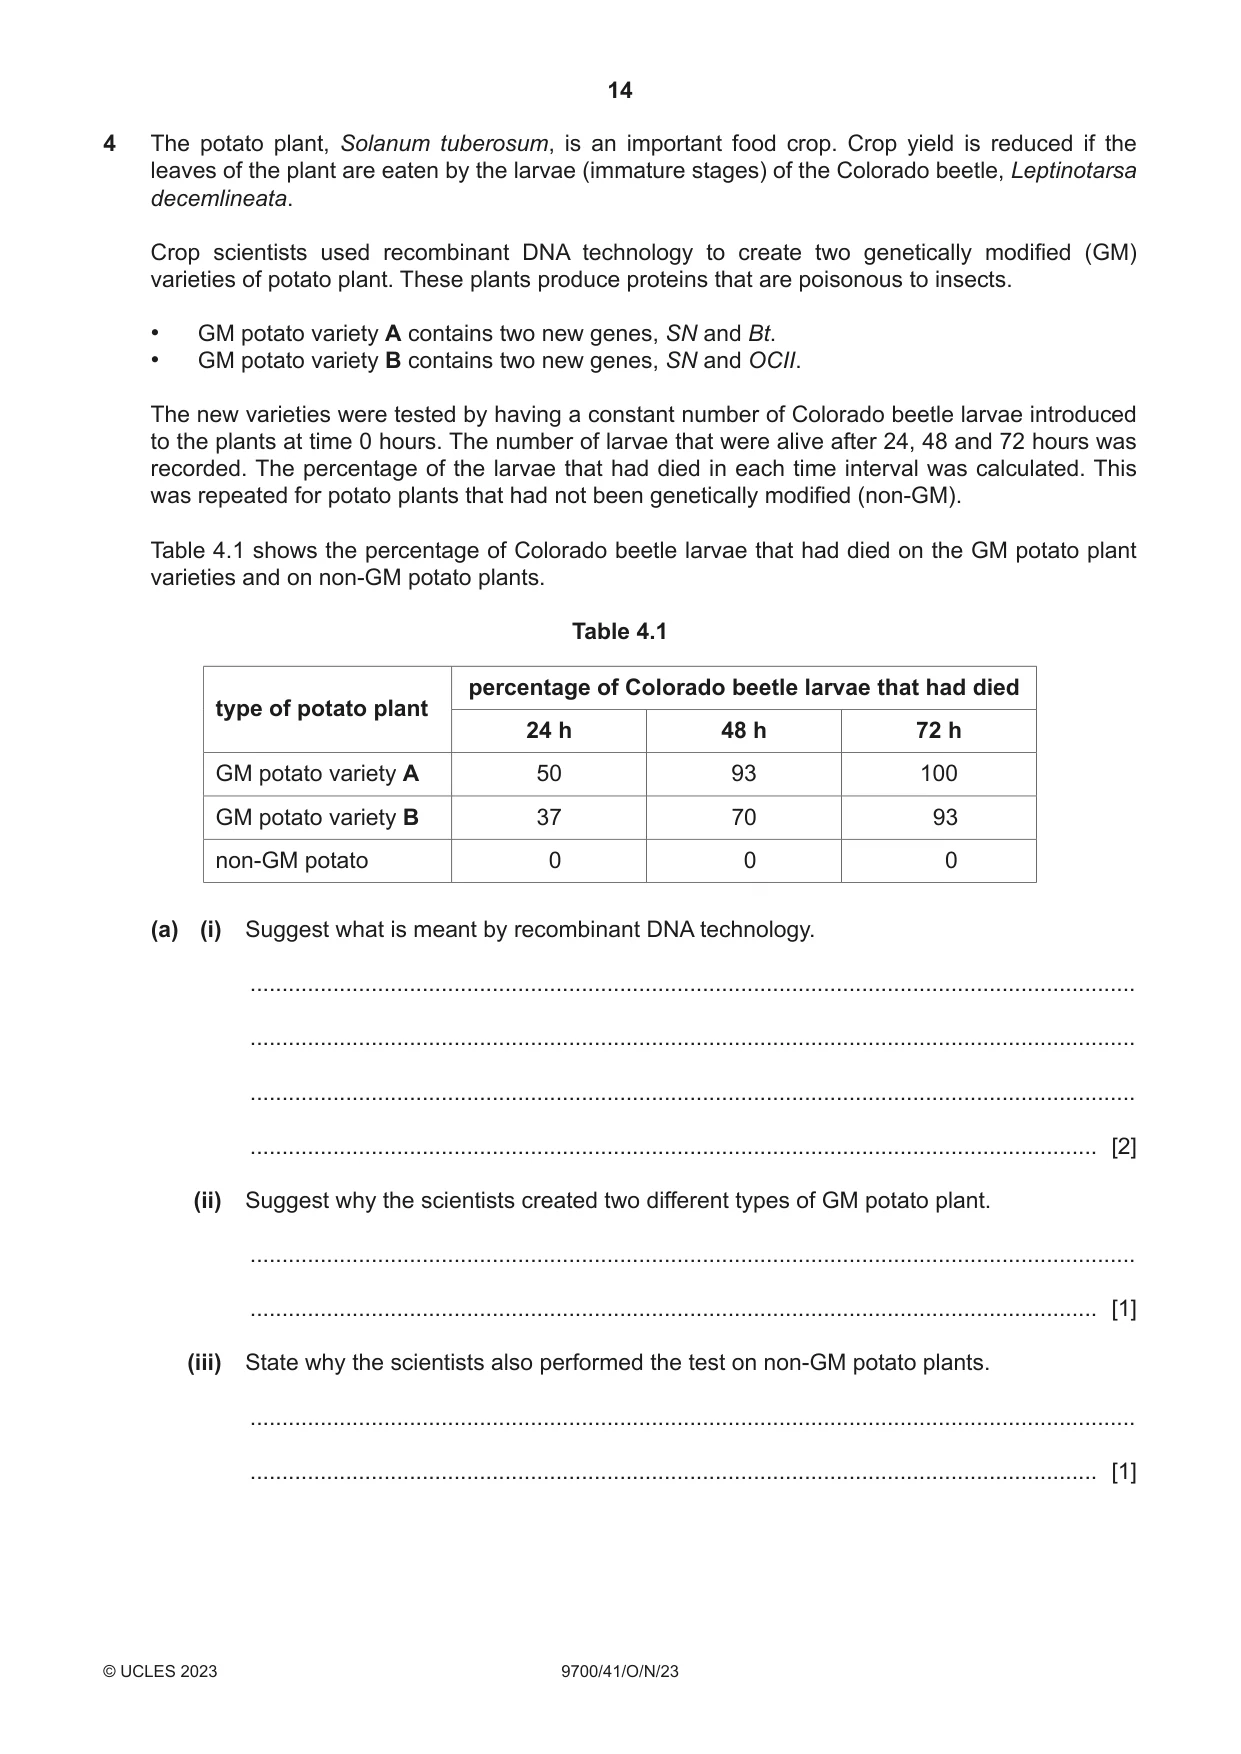
4 The potato plant, Solanum tuberosum, is an important food crop. Crop yield is reduced if the leaves of the plant are eaten by the larvae (immature stages) of the Colorado beetle, Leptinotarsa decemlineata. Crop scientists used recombinant DNA technology to create two genetically modified (GM) varieties of potato plant. These plants produce proteins that are poisonous to insects. • GM potato variety A contains two new genes, SN and Bt. • GM potato variety B contains two new genes, SN and OCII. The new varieties were tested by having a constant number of Colorado beetle larvae introduced to the plants at time 0 hours. The number of larvae that were alive after 24, 48 and 72 hours was recorded. The percentage of the larvae that had died in each time interval was calculated. This was repeated for potato plants that had not been genetically modified (non-GM). Table 4.1 shows the percentage of Colorado beetle larvae that had died on the GM potato plant varieties and on non-GM potato plants. Table 4.1 percentage of Colorado beetle larvae that had died type of potato plant 24 h 48 h 72 h GM potato variety A 50 93 100 GM potato variety B 37 70 93 non-GM potato 0 0 0 (a) (i) Suggest what is meant by recombinant DNA technology. ........................................................................................................................................... ........................................................................................................................................... ........................................................................................................................................... ..................................................................................................................................... [2] (ii) Suggest why the scientists created two different types of GM potato plant. ........................................................................................................................................... ..................................................................................................................................... [1] (iii) State why the scientists also performed the test on non-GM potato plants. ........................................................................................................................................... ..................................................................................................................................... [1] (b) Discuss how the results in Table 4.1 provide information that could help to solve the global demand for food. ................................................................................................................................................... ................................................................................................................................................... ................................................................................................................................................... ................................................................................................................................................... ................................................................................................................................................... ................................................................................................................................................... ................................................................................................................................................... ............................................................................................................................................. [3] [Total: 7]
Mark scheme: 4(a)(i) 1 DNA, joined / combined / made, from two / different, sources / species ; 2 2 using (named), enzymes / vectors or to create a, GMO / transgenic organism ; 4(a)(ii) to, test / compare, effect(iveness) of, genes / proteins / Bt and OCII / plants / varieties / A and B 1 or to see which, (gene / plant / variety / of A and B), works, better / best ; 4(a)(iii) to compare / provide a baseline / as a control ; 1 4(b) 1 A and B kill larvae ; 3 2 GM increases, yield of / food from (potatoes) ; 3 A, is best / kills most / works faster / should be grown / will provide most food ;
Q5 · The respiratory quotient (RQ) values for different respiratory substrates can be…
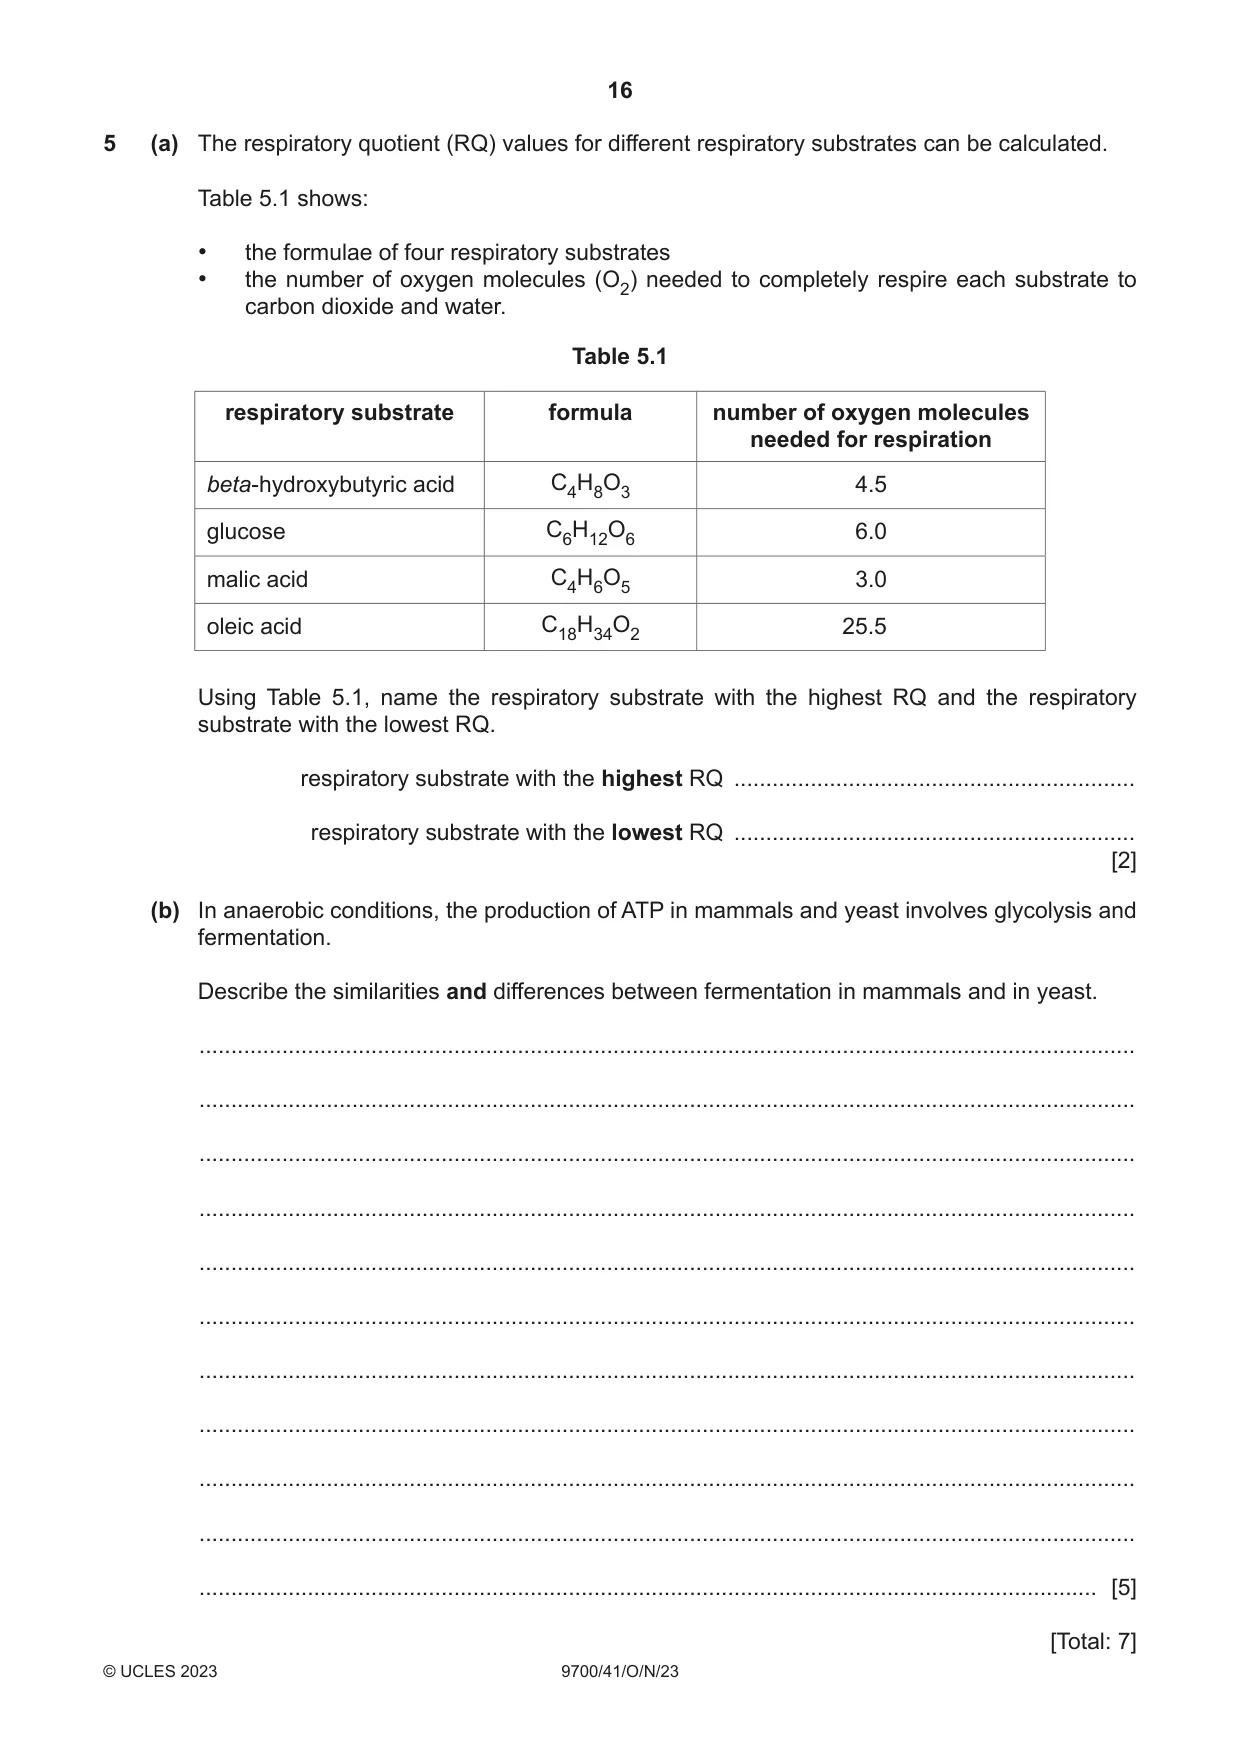
5 (a) The respiratory quotient (RQ) values for different respiratory substrates can be calculated. Table 5.1 shows: • the formulae of four respiratory substrates • the number of oxygen molecules (O2) needed to completely respire each substrate to carbon dioxide and water. Table 5.1 respiratory substrate formula number of oxygen molecules needed for respiration beta-hydroxybutyric acid C4H8O3 4.5 glucose C6H12O6 6.0 malic acid C4H6O5 3.0 oleic acid C18H34O2 25.5 Using Table 5.1, name the respiratory substrate with the highest RQ and the respiratory substrate with the lowest RQ. respiratory substrate with the highest RQ ............................................................... respiratory substrate with the lowest RQ ............................................................... [2] (b) In anaerobic conditions, the production of ATP in mammals and yeast involves glycolysis and fermentation. Describe the similarities and differences between fermentation in mammals and in yeast. ................................................................................................................................................... ................................................................................................................................................... ................................................................................................................................................... ................................................................................................................................................... ................................................................................................................................................... ................................................................................................................................................... ................................................................................................................................................... ................................................................................................................................................... ................................................................................................................................................... ................................................................................................................................................... ............................................................................................................................................. [5] [Total: 7]
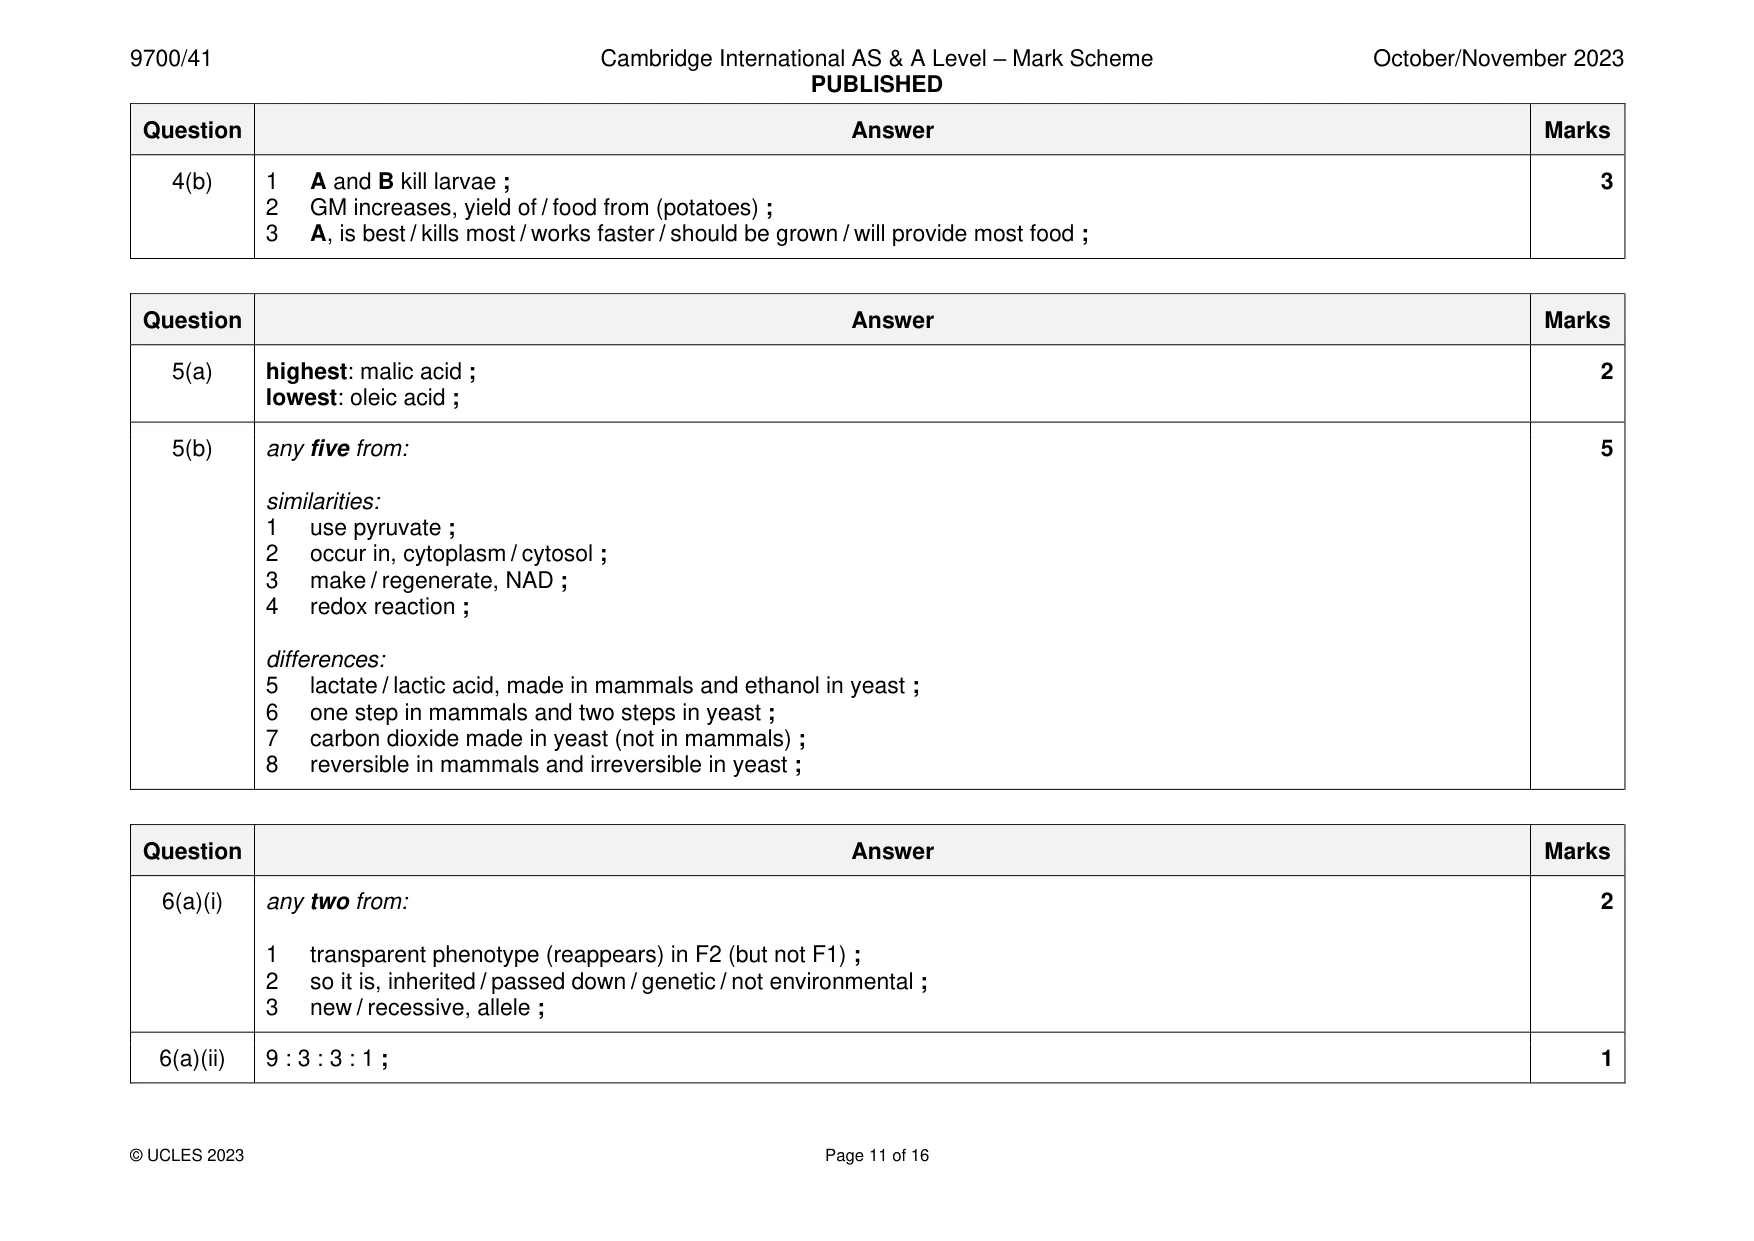
Mark scheme: 5(a) highest: malic acid ; 2 lowest: oleic acid ; 5(b) any five from: 5 similarities: 1 use pyruvate ; 2 occur in, cytoplasm / cytosol ; 3 make / regenerate, NAD ; 4 redox reaction ; differences: 5 lactate / lactic acid, made in mammals and ethanol in yeast ; 6 one step in mammals and two steps in yeast ; 7 carbon dioxide made in yeast (not in mammals) ; 8 reversible in mammals and irreversible in yeast ;
Q6 · The tiger barb, Puntigrus tetrazona, is a South American fish that is popular worldwide…
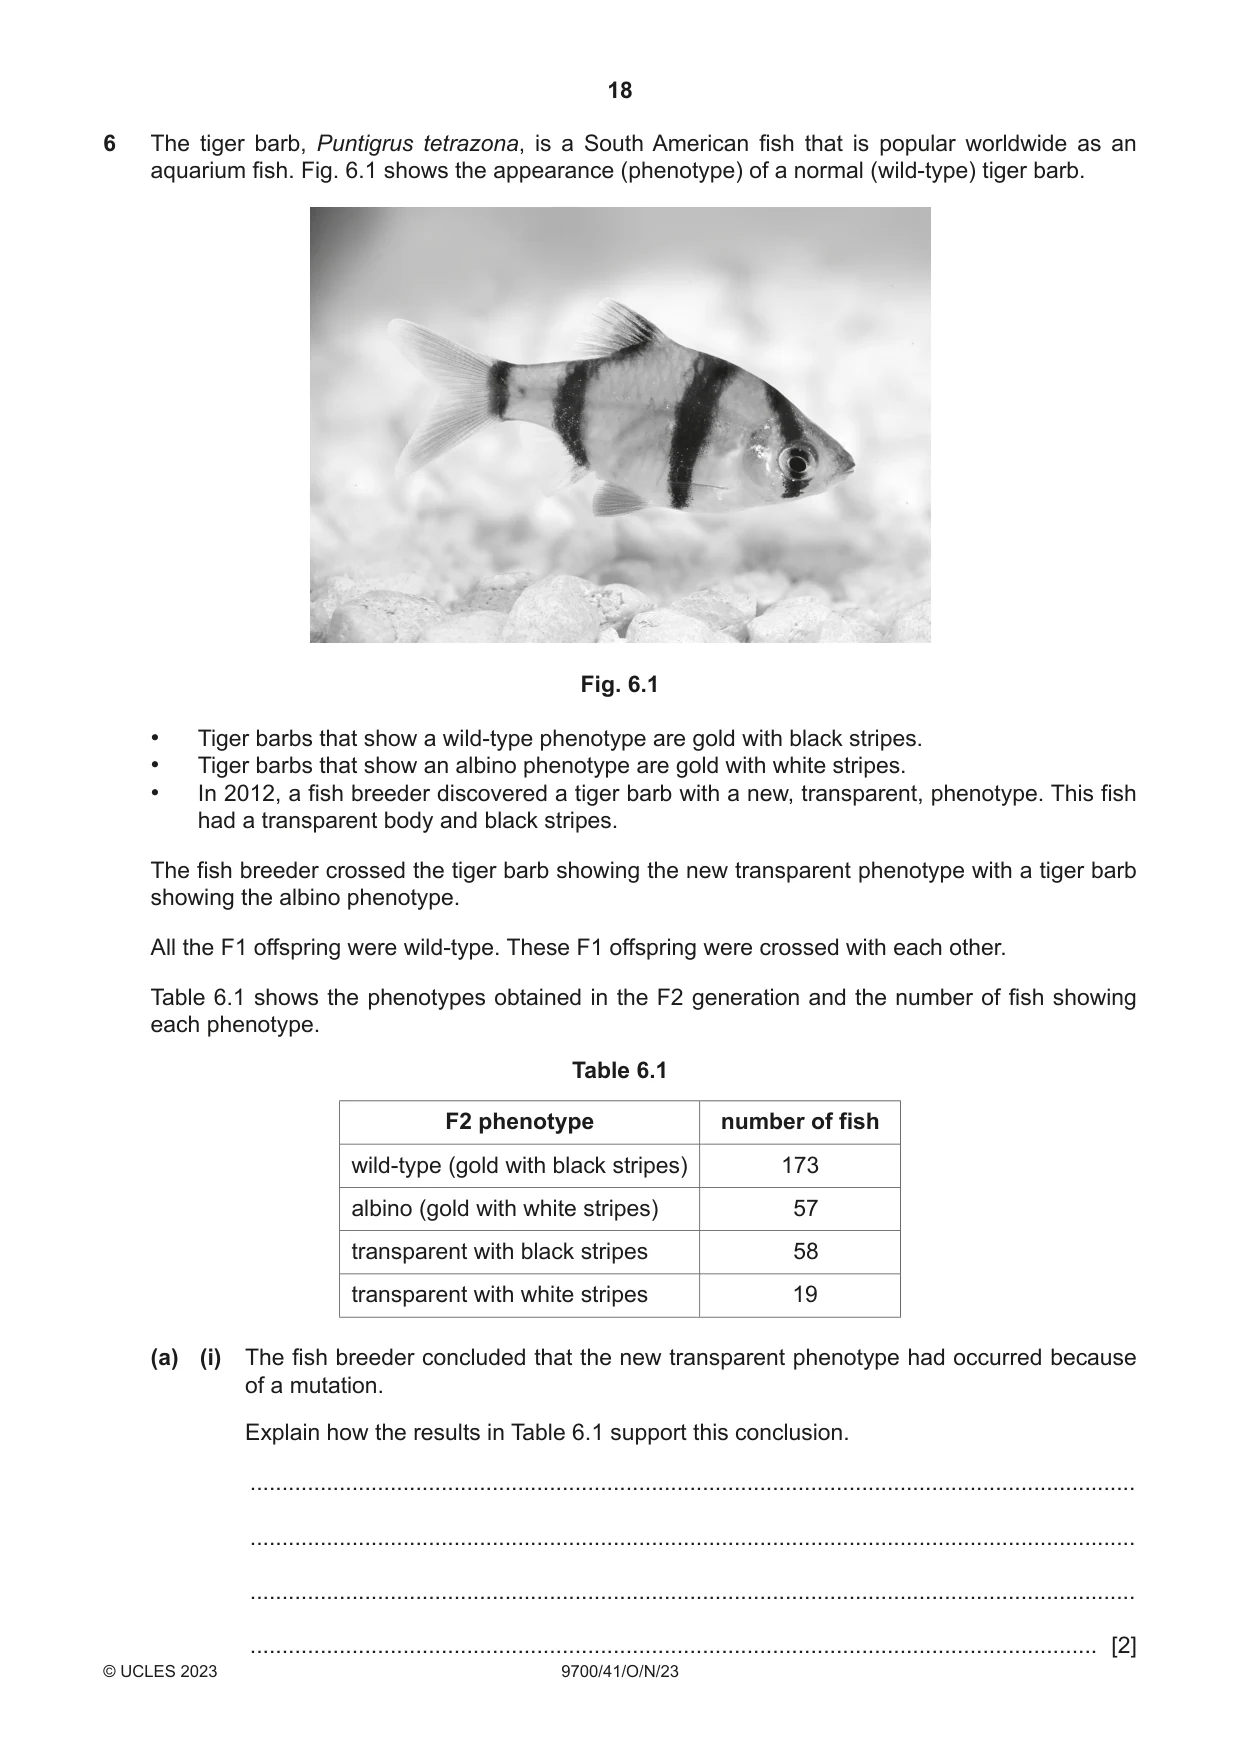
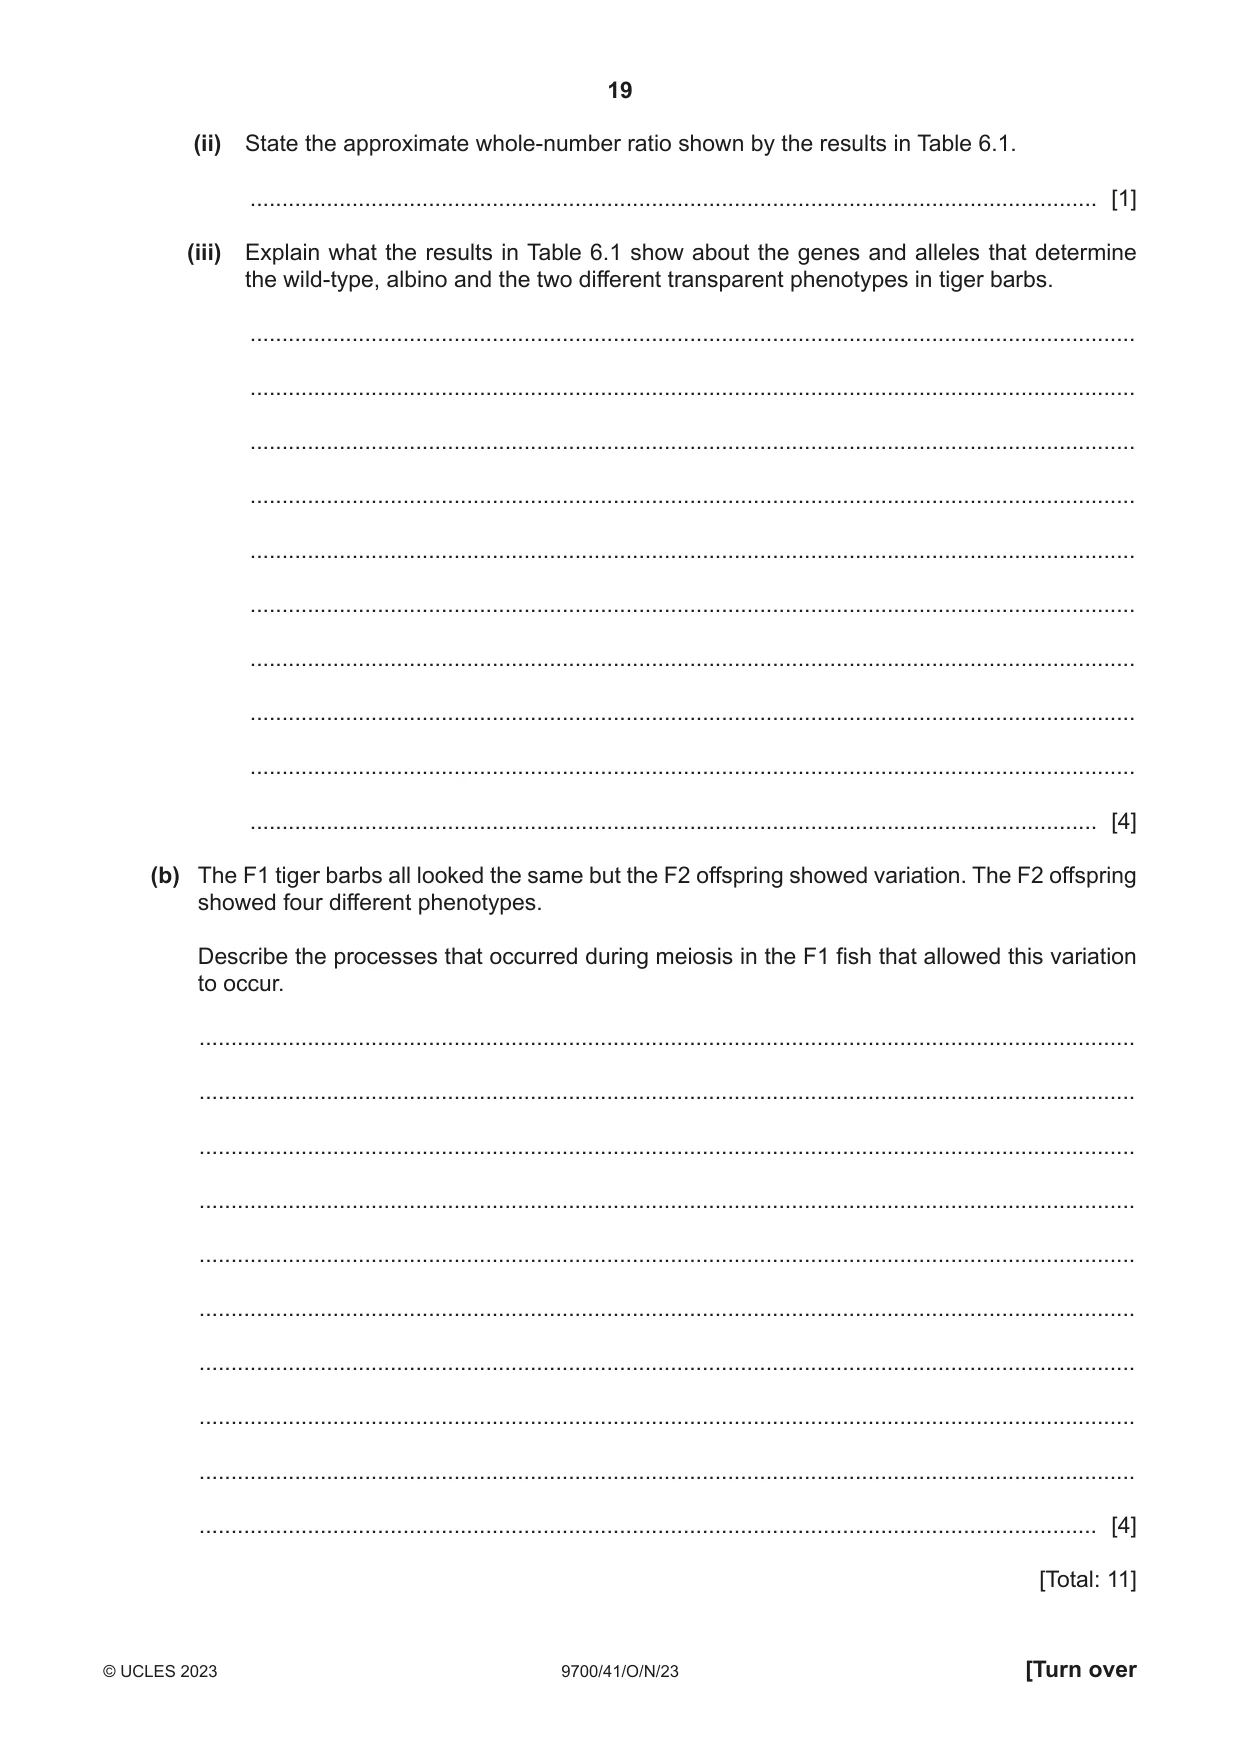
6 The tiger barb, Puntigrus tetrazona, is a South American fish that is popular worldwide as an aquarium fish. Fig. 6.1 shows the appearance (phenotype) of a normal (wild-type) tiger barb. Fig. 6.1 • Tiger barbs that show a wild-type phenotype are gold with black stripes. • Tiger barbs that show an albino phenotype are gold with white stripes. • In 2012, a fish breeder discovered a tiger barb with a new, transparent, phenotype. This fish had a transparent body and black stripes. The fish breeder crossed the tiger barb showing the new transparent phenotype with a tiger barb showing the albino phenotype. All the F1 offspring were wild-type. These F1 offspring were crossed with each other. Table 6.1 shows the phenotypes obtained in the F2 generation and the number of fish showing each phenotype. Table 6.1 F2 phenotype number of fish wild-type (gold with black stripes) 173 albino (gold with white stripes) 57 transparent with black stripes 58 transparent with white stripes 19 (a) (i) The fish breeder concluded that the new transparent phenotype had occurred because of a mutation. Explain how the results in Table 6.1 support this conclusion. ........................................................................................................................................... ........................................................................................................................................... ........................................................................................................................................... ..................................................................................................................................... [2] (ii) State the approximate whole-number ratio shown by the results in Table 6.1. ..................................................................................................................................... [1] (iii) Explain what the results in Table 6.1 show about the genes and alleles that determine the wild-type, albino and the two different transparent phenotypes in tiger barbs. ........................................................................................................................................... ........................................................................................................................................... ........................................................................................................................................... ........................................................................................................................................... ........................................................................................................................................... ........................................................................................................................................... ........................................................................................................................................... ........................................................................................................................................... ........................................................................................................................................... ..................................................................................................................................... [4] (b) The F1 tiger barbs all looked the same but the F2 offspring showed variation. The F2 offspring showed four different phenotypes. Describe the processes that occurred during meiosis in the F1 fish that allowed this variation to occur. ................................................................................................................................................... ................................................................................................................................................... ................................................................................................................................................... ................................................................................................................................................... ................................................................................................................................................... ................................................................................................................................................... ................................................................................................................................................... ................................................................................................................................................... ................................................................................................................................................... ............................................................................................................................................. [4] [Total: 11]
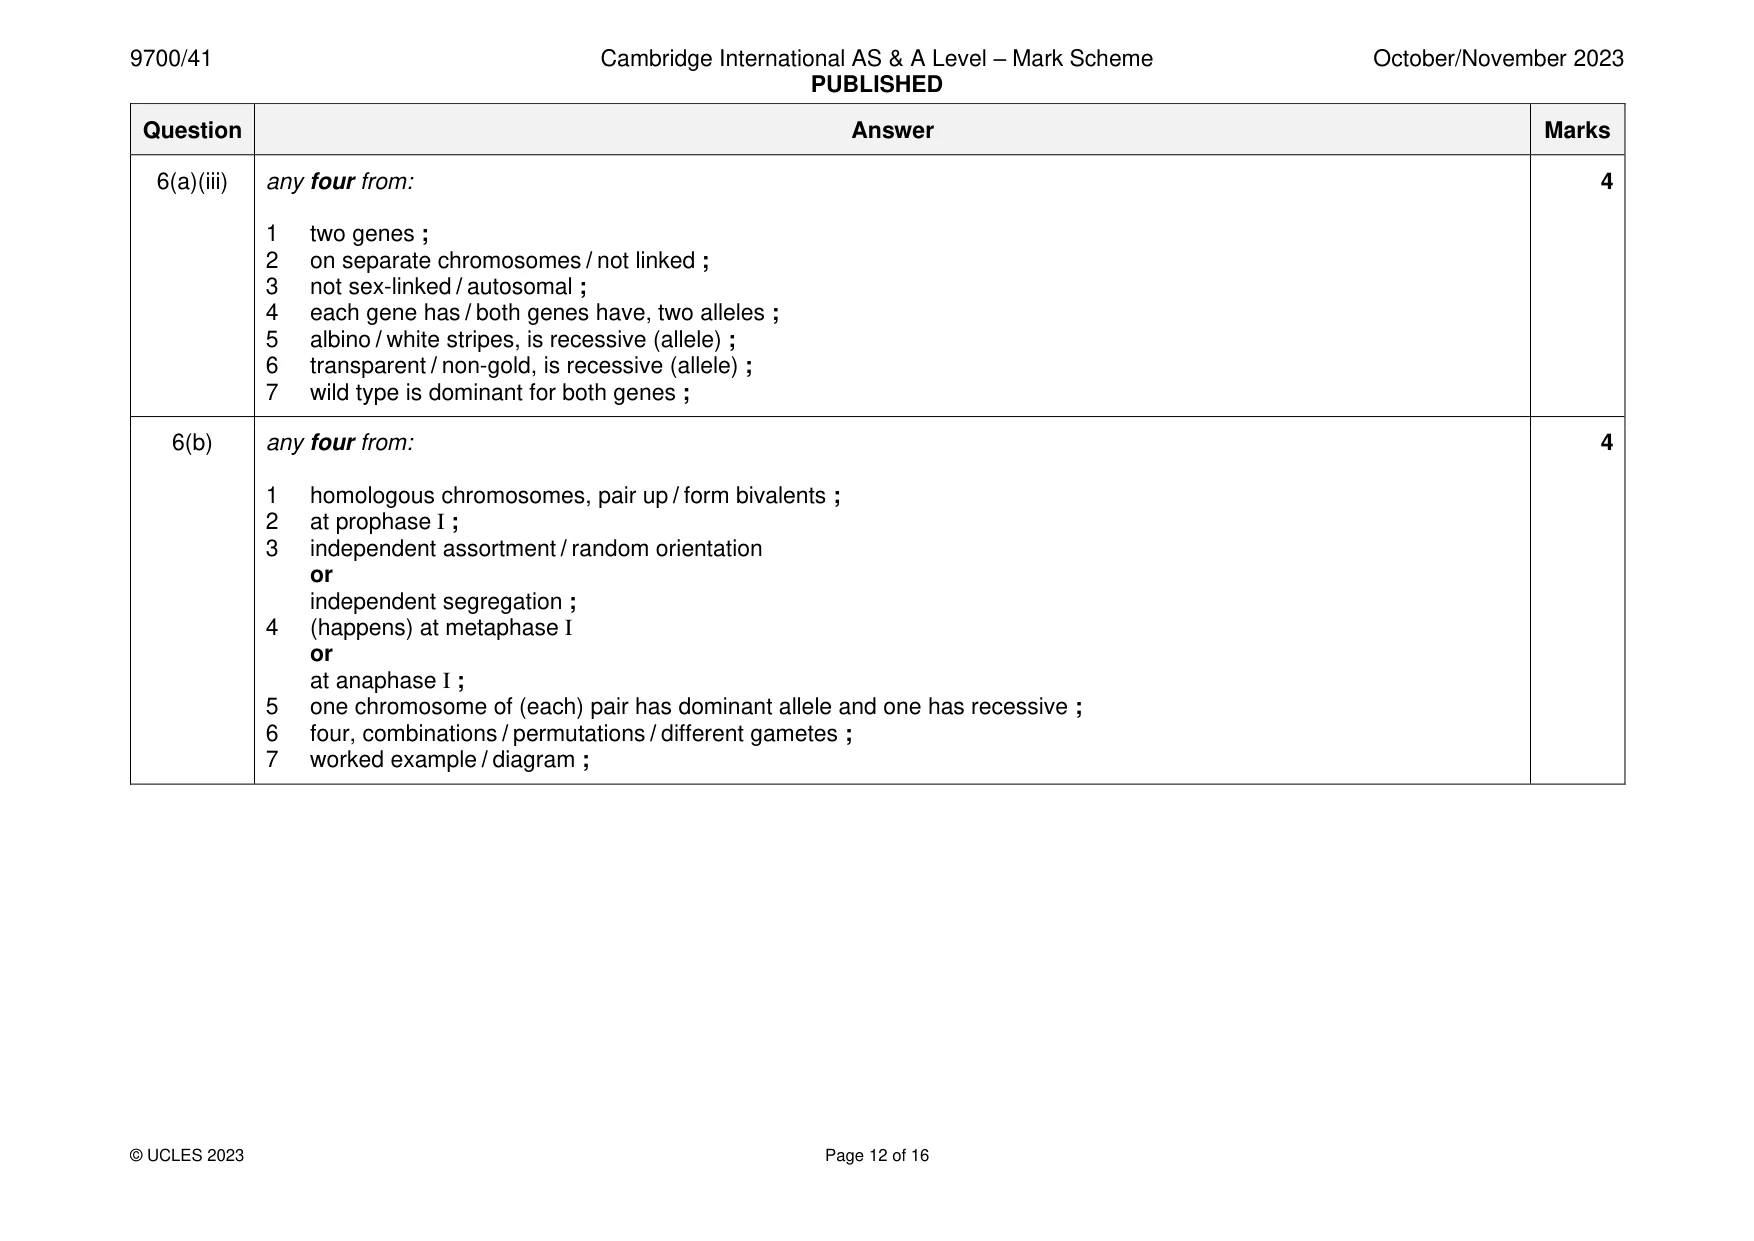
Mark scheme: 6(a)(i) any two from: 2 1 transparent phenotype (reappears) in F2 (but not F1) ; 2 so it is, inherited / passed down / genetic / not environmental ; 3 new / recessive, allele ; 6(a)(ii) 9 : 3 : 3 : 1 ; 1 6(a)(iii) any four from: 4 1 two genes ; 2 on separate chromosomes / not linked ; 3 not sex-linked / autosomal ; 4 each gene has / both genes have, two alleles ; 5 albino / white stripes, is recessive (allele) ; 6 transparent / non-gold, is recessive (allele) ; 7 wild type is dominant for both genes ; 6(b) any four from: 4 1 homologous chromosomes, pair up / form bivalents ; 2 at prophase I ; 3 independent assortment / random orientation or independent segregation ; 4 (happens) at metaphase I or at anaphase I ; 5 one chromosome of (each) pair has dominant allele and one has recessive ; 6 four, combinations / permutations / different gametes ; 7 worked example / diagram ;
More questions on Passage of information from parents to offspring
Q7 · When an impulse arrives at a neuromuscular junction, it stimulates a muscle fibre of…
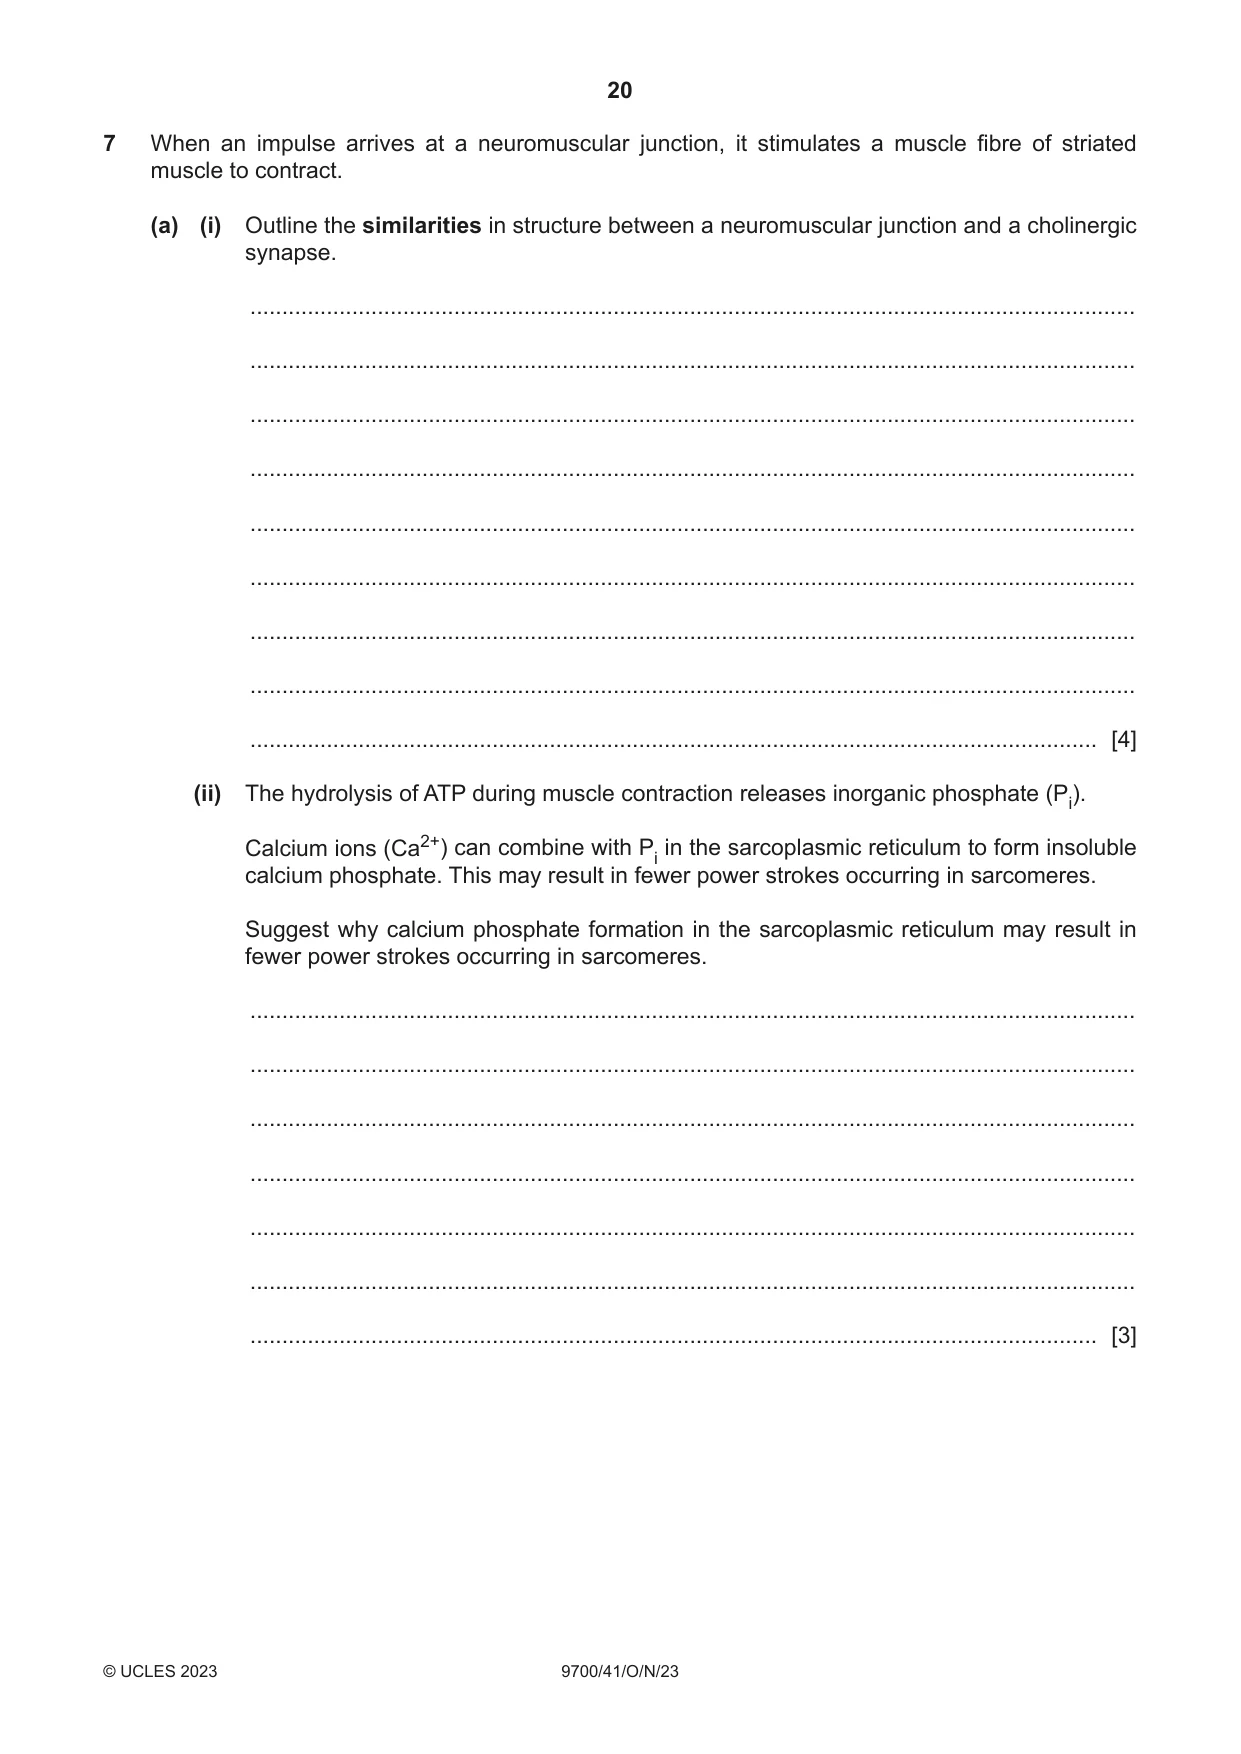
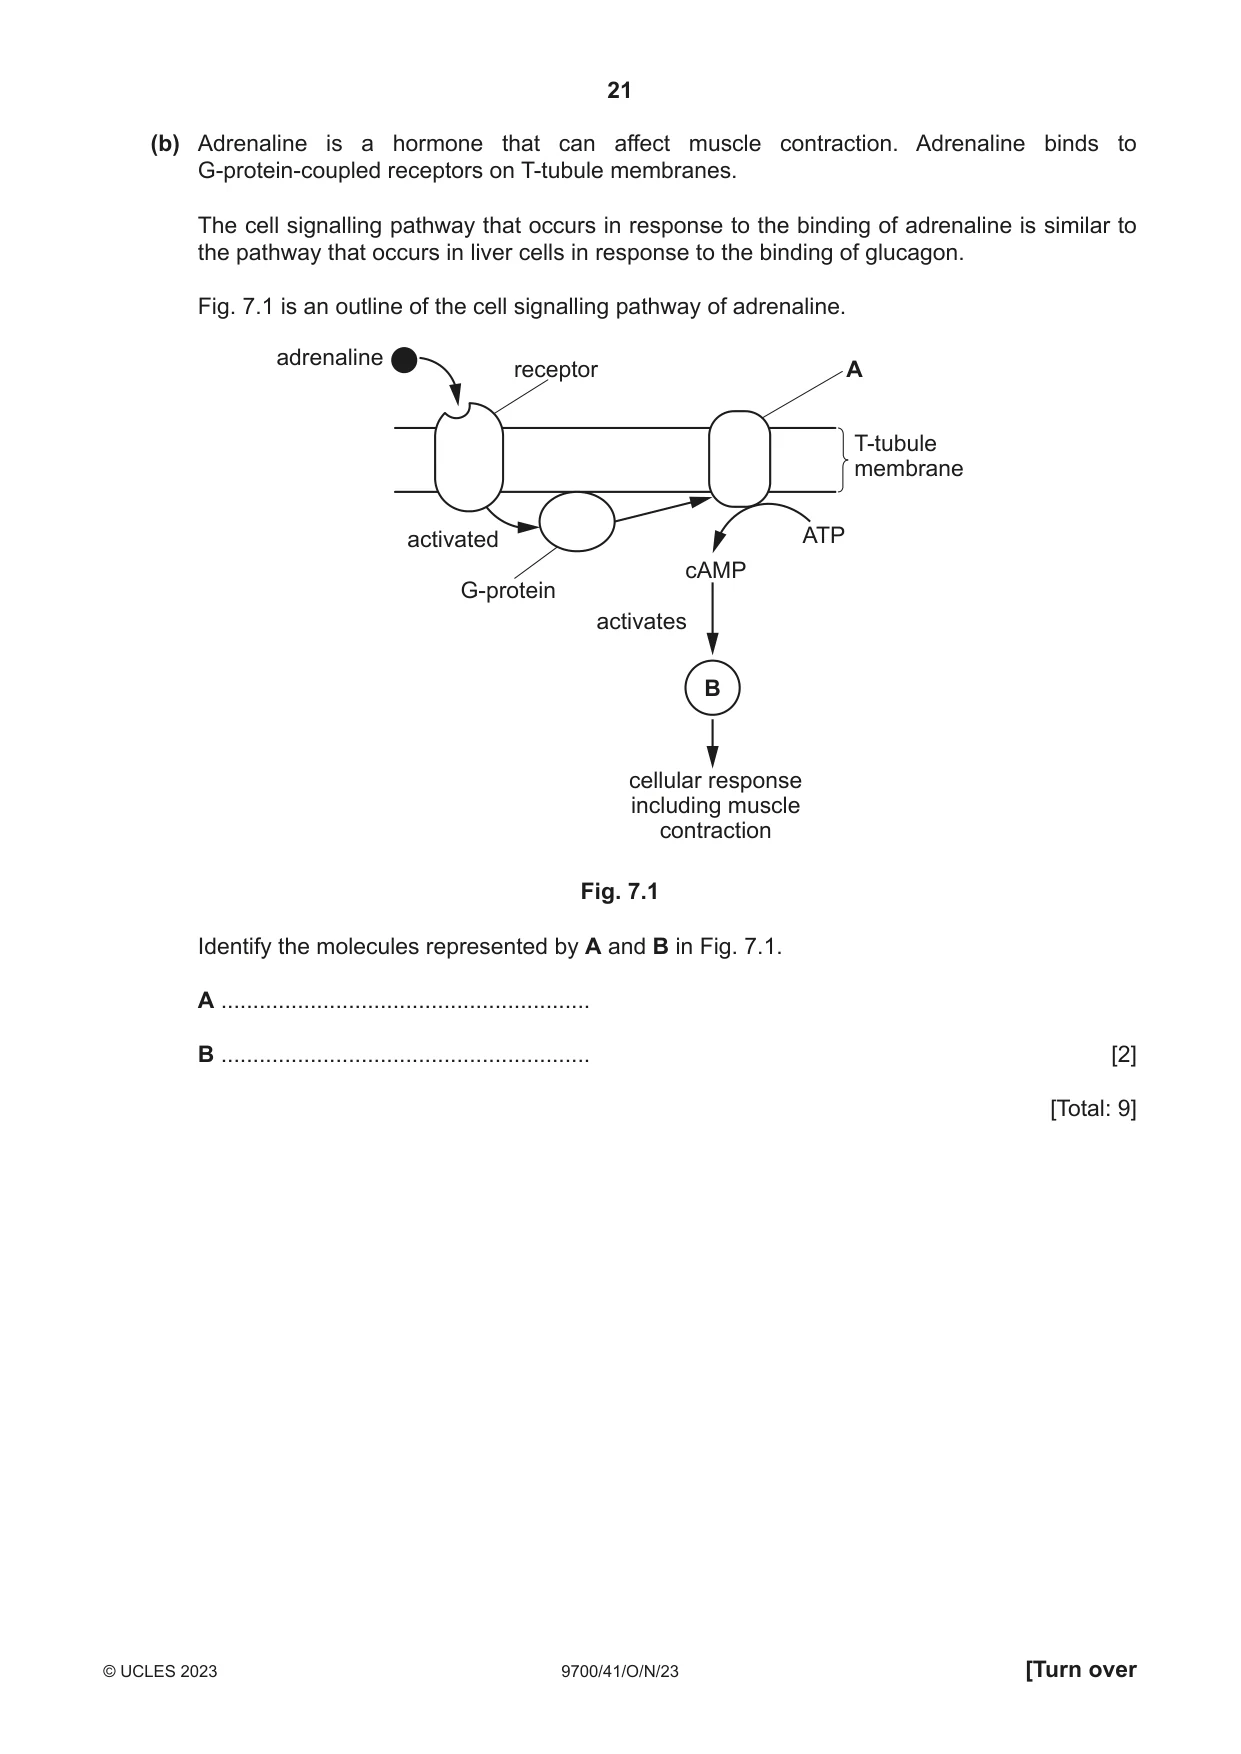
7 When an impulse arrives at a neuromuscular junction, it stimulates a muscle fibre of striated muscle to contract. (a) (i) Outline the similarities in structure between a neuromuscular junction and a cholinergic synapse. ........................................................................................................................................... ........................................................................................................................................... ........................................................................................................................................... ........................................................................................................................................... ........................................................................................................................................... ........................................................................................................................................... ........................................................................................................................................... ........................................................................................................................................... ..................................................................................................................................... [4] (ii) The hydrolysis of ATP during muscle contraction releases inorganic phosphate (Pi). Calcium ions (Ca2+) can combine with Pi in the sarcoplasmic reticulum to form insoluble calcium phosphate. This may result in fewer power strokes occurring in sarcomeres. Suggest why calcium phosphate formation in the sarcoplasmic reticulum may result in fewer power strokes occurring in sarcomeres. ........................................................................................................................................... ........................................................................................................................................... ........................................................................................................................................... ........................................................................................................................................... ........................................................................................................................................... ........................................................................................................................................... ..................................................................................................................................... [3] (b) Adrenaline is a hormone that can affect muscle contraction. Adrenaline binds to G-protein-coupled receptors on T-tubule membranes. The cell signalling pathway that occurs in response to the binding of adrenaline is similar to the pathway that occurs in liver cells in response to the binding of glucagon. Fig. 7.1 is an outline of the cell signalling pathway of adrenaline. adrenaline receptor A T-tubule membrane activated ATP cAMP G-protein activates B cellular response including muscle contraction Fig. 7.1 Identify the molecules represented by A and B in Fig. 7.1. A .......................................................... B .......................................................... [2] [Total: 9]
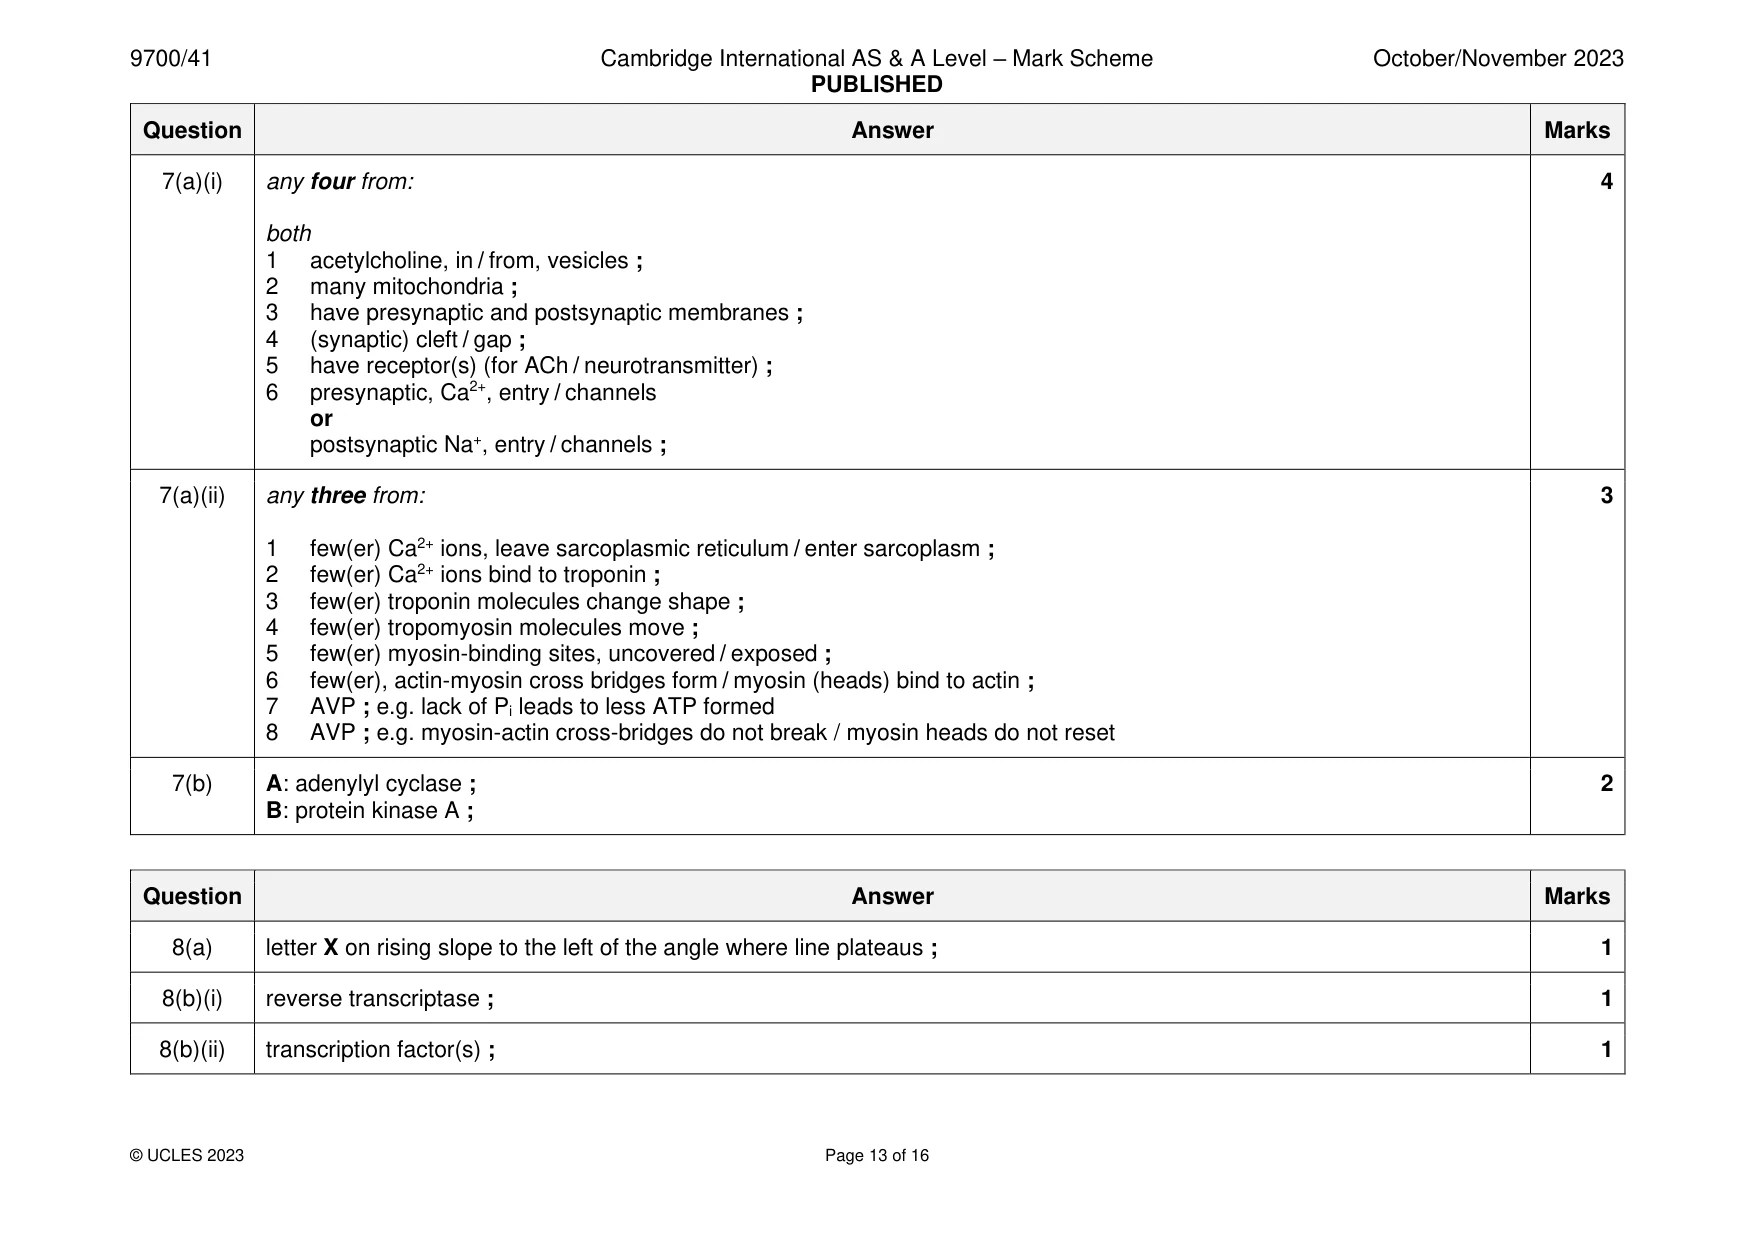
Mark scheme: 7(a)(i) any four from: 4 both 1 acetylcholine, in / from, vesicles ; 2 many mitochondria ; 3 have presynaptic and postsynaptic membranes ; 4 (synaptic) cleft / gap ; 5 have receptor(s) (for ACh / neurotransmitter) ; 6 presynaptic, Ca2+, entry / channels or postsynaptic Na+, entry / channels ; 7(a)(ii) any three from: 3 1 few(er) Ca2+ ions, leave sarcoplasmic reticulum / enter sarcoplasm ; 2 few(er) Ca2+ ions bind to troponin ; 3 few(er) troponin molecules change shape ; 4 few(er) tropomyosin molecules move ; 5 few(er) myosin-binding sites, uncovered / exposed ; 6 few(er), actin-myosin cross bridges form / myosin (heads) bind to actin ; 7 AVP ; e.g. lack of Pi leads to less ATP formed 8 AVP ; e.g. myosin-actin cross-bridges do not break / myosin heads do not reset 7(b) A: adenylyl cyclase ; 2 B: protein kinase A ;
Q8 · Environmental conditions such as light intensity affect plant physiology
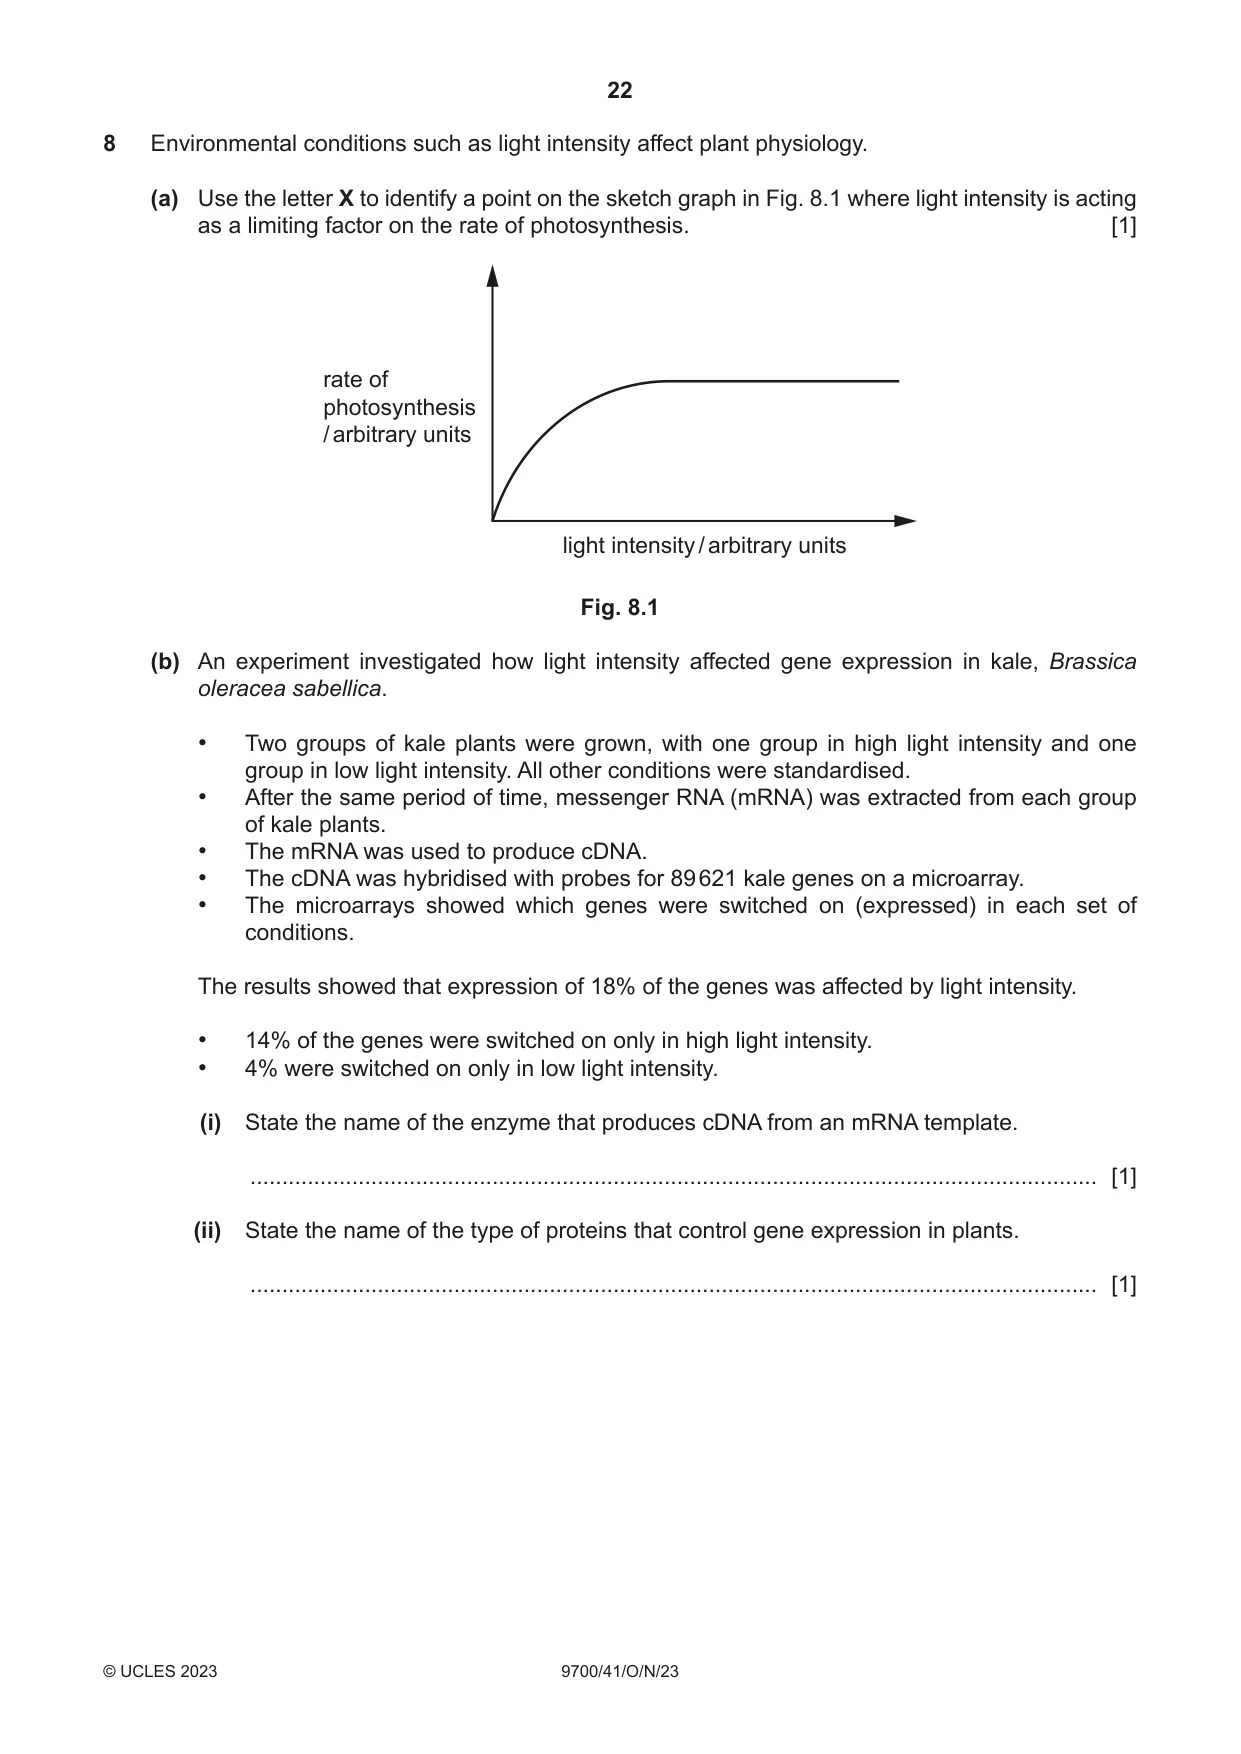
8 Environmental conditions such as light intensity affect plant physiology. (a) Use the letter X to identify a point on the sketch graph in Fig. 8.1 where light intensity is acting as a limiting factor on the rate of photosynthesis. [1] rate of photosynthesis / arbitrary units light intensity / arbitrary units Fig. 8.1 (b) An experiment investigated how light intensity affected gene expression in kale, Brassica oleracea sabellica. • Two groups of kale plants were grown, with one group in high light intensity and one group in low light intensity. All other conditions were standardised. • After the same period of time, messenger RNA (mRNA) was extracted from each group of kale plants. • The mRNA was used to produce cDNA. • The cDNA was hybridised with probes for 89 621 kale genes on a microarray. • The microarrays showed which genes were switched on (expressed) in each set of conditions. The results showed that expression of 18% of the genes was affected by light intensity. • 14% of the genes were switched on only in high light intensity. • 4% were switched on only in low light intensity. (i) State the name of the enzyme that produces cDNA from an mRNA template. ..................................................................................................................................... [1] (ii) State the name of the type of proteins that control gene expression in plants. ..................................................................................................................................... [1] (iii) Suggest why more genes were switched on only in plants growing in high light intensity compared to fewer genes that were switched on only in plants growing in low light intensity. ........................................................................................................................................... ........................................................................................................................................... ........................................................................................................................................... ........................................................................................................................................... ........................................................................................................................................... ........................................................................................................................................... ..................................................................................................................................... [3] [Total: 6]
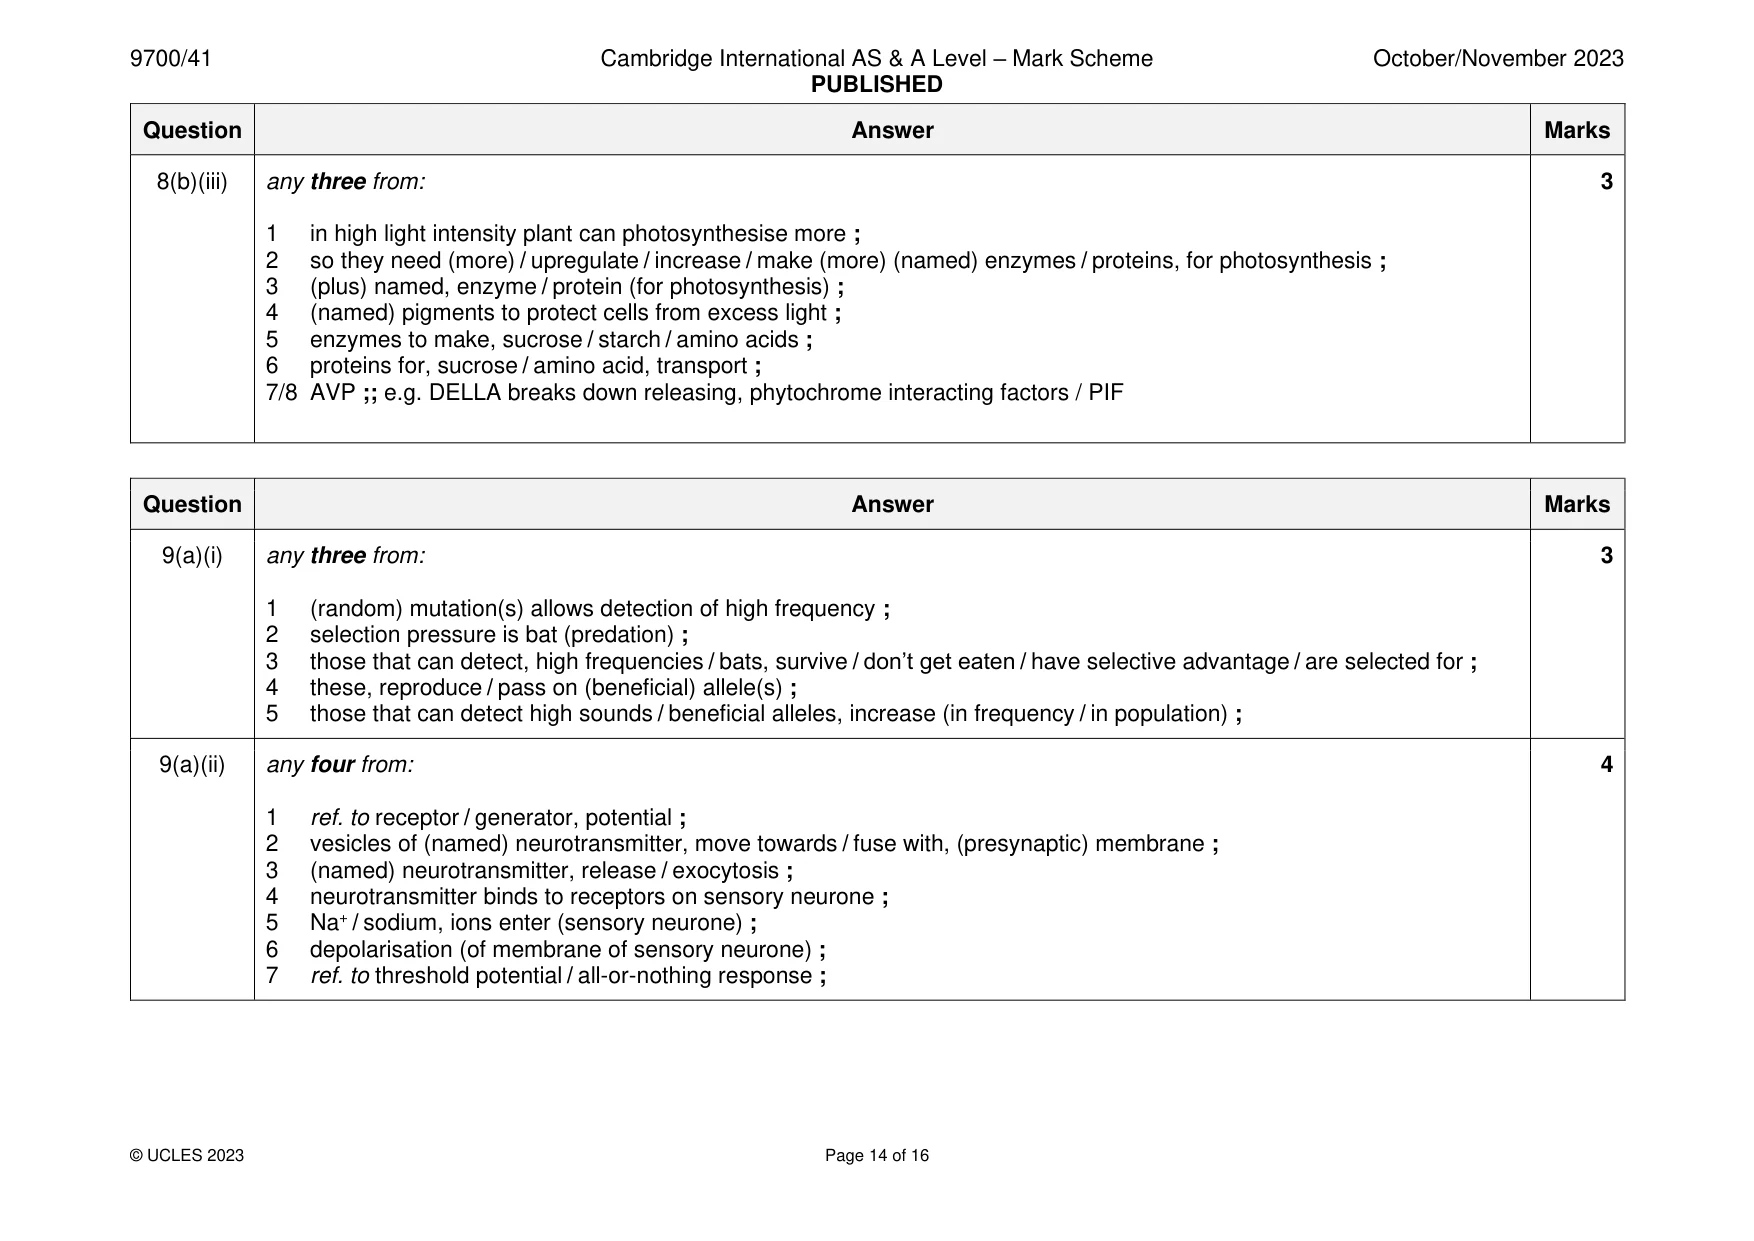
Mark scheme: 8(a) letter X on rising slope to the left of the angle where line plateaus ; 1 8(b)(i) reverse transcriptase ; 1 8(b)(ii) transcription factor(s) ; 1 8(b)(iii) any three from: 3 1 in high light intensity plant can photosynthesise more ; 2 so they need (more) / upregulate / increase / make (more) (named) enzymes / proteins, for photosynthesis ; 3 (plus) named, enzyme / protein (for photosynthesis) ; 4 (named) pigments to protect cells from excess light ; 5 enzymes to make, sucrose / starch / amino acids ; 6 proteins for, sucrose / amino acid, transport ; 7/8 AVP ;; e.g. DELLA breaks down releasing, phytochrome interacting factors / PIF
Q9 · Green lacewings are a family of insects with more than 1300 species
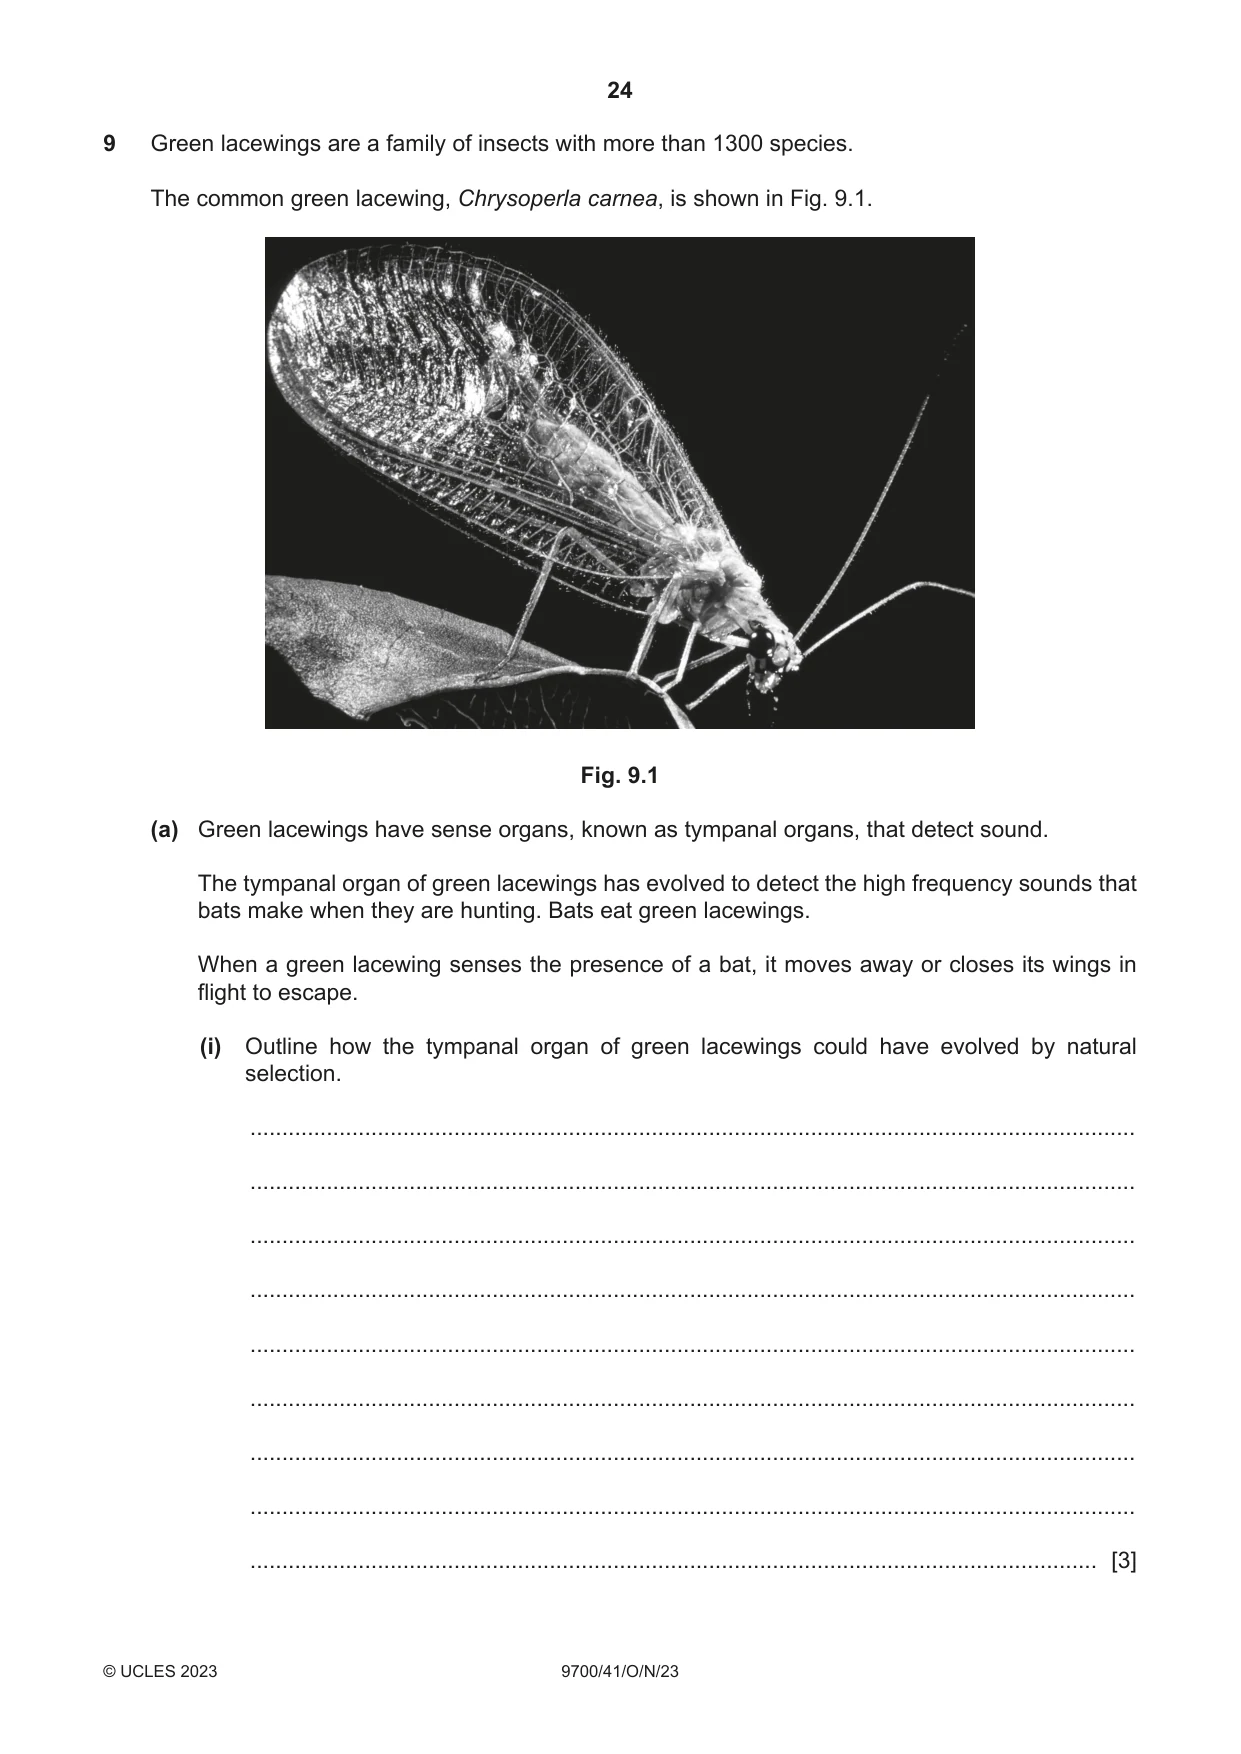
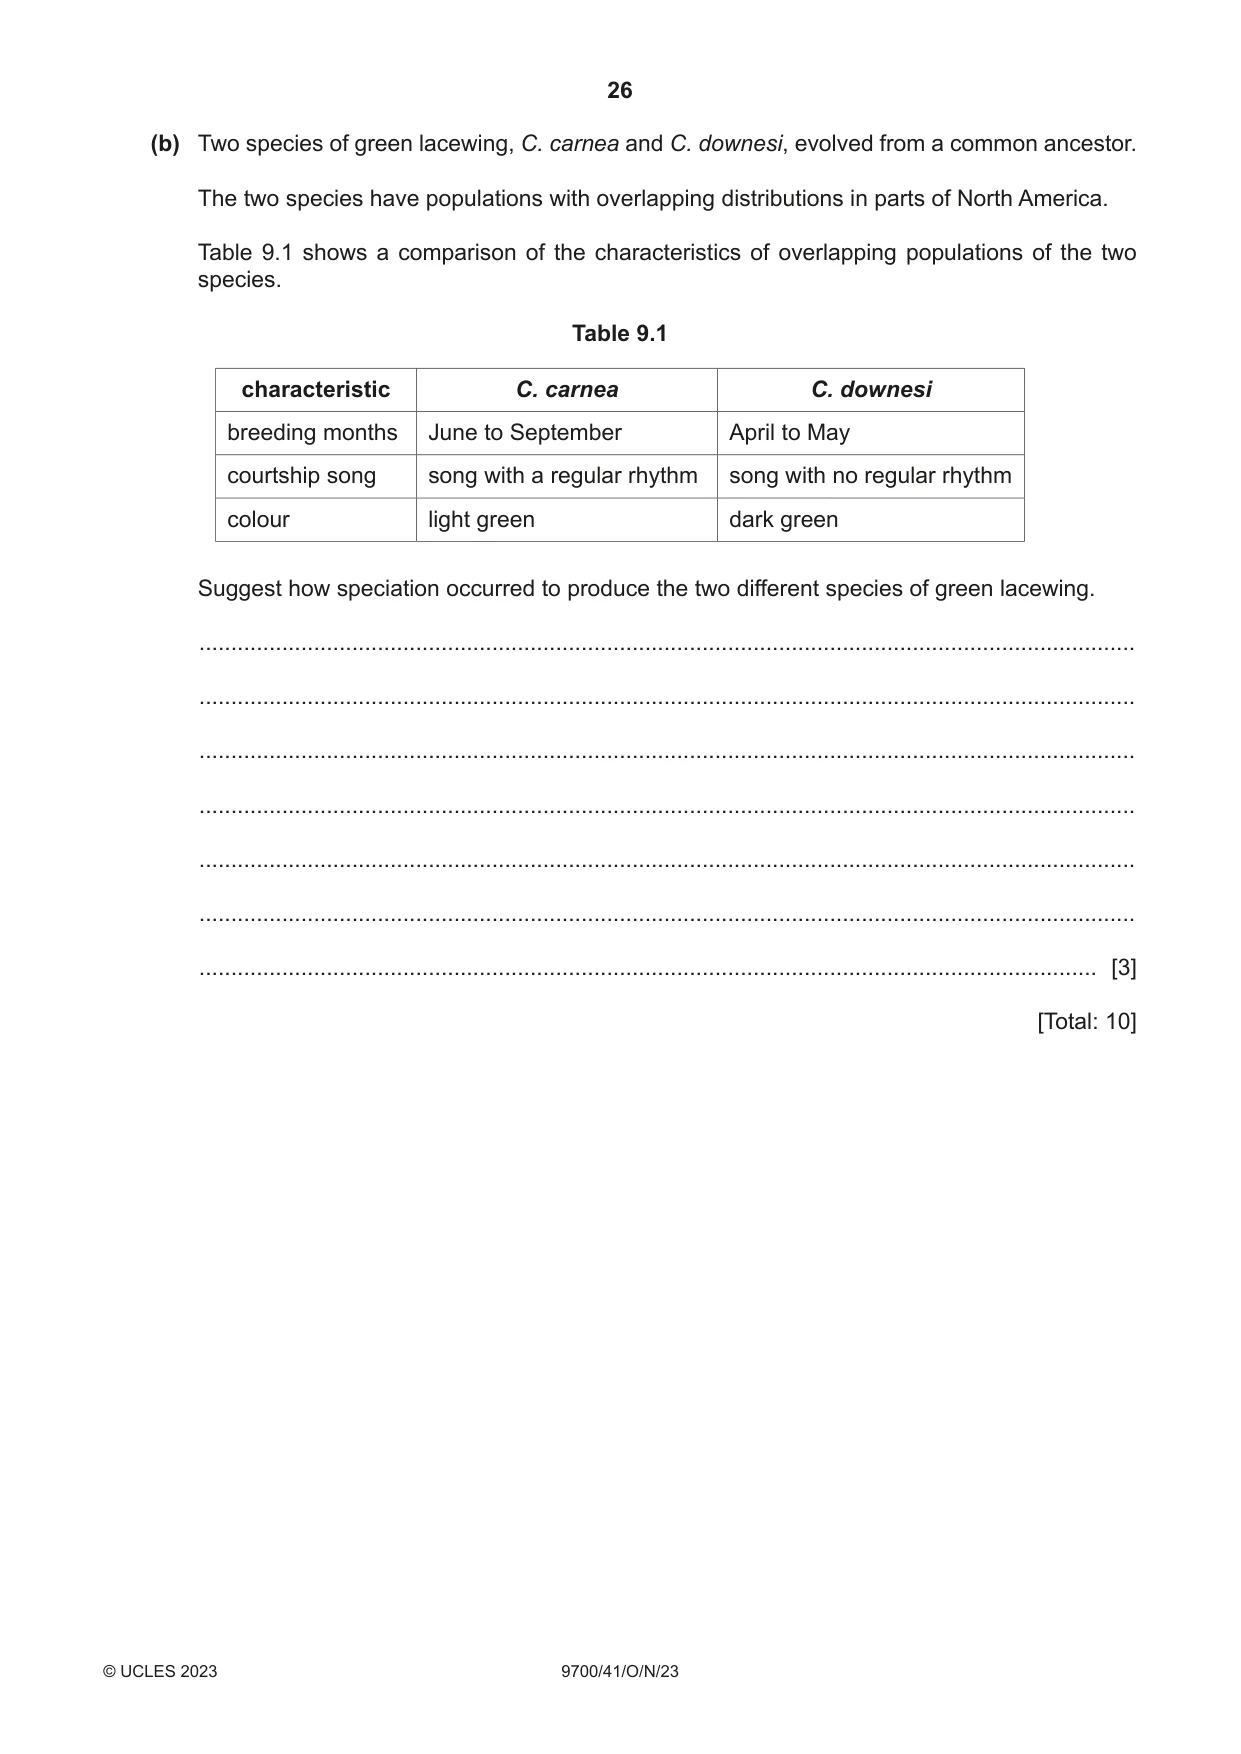
9 Green lacewings are a family of insects with more than 1300 species. The common green lacewing, Chrysoperla carnea, is shown in Fig. 9.1. Fig. 9.1 (a) Green lacewings have sense organs, known as tympanal organs, that detect sound. The tympanal organ of green lacewings has evolved to detect the high frequency sounds that bats make when they are hunting. Bats eat green lacewings. When a green lacewing senses the presence of a bat, it moves away or closes its wings in flight to escape. (i) Outline how the tympanal organ of green lacewings could have evolved by natural selection. ........................................................................................................................................... ........................................................................................................................................... ........................................................................................................................................... ........................................................................................................................................... ........................................................................................................................................... ........................................................................................................................................... ........................................................................................................................................... ........................................................................................................................................... ..................................................................................................................................... [3] (ii) When high frequency sound is detected, the receptor cells in the tympanal organ stimulate the transmission of impulses in sensory neurones. Describe the sequence of events that results in an action potential in a sensory neurone. The first event in the sequence has been given for you. Calcium ions enter the cytoplasm of the receptor cell ................................................. ........................................................................................................................................... ........................................................................................................................................... ........................................................................................................................................... ........................................................................................................................................... ........................................................................................................................................... ........................................................................................................................................... ........................................................................................................................................... ........................................................................................................................................... ..................................................................................................................................... [4] (b) Two species of green lacewing, C. carnea and C. downesi, evolved from a common ancestor. The two species have populations with overlapping distributions in parts of North America. Table 9.1 shows a comparison of the characteristics of overlapping populations of the two species. Table 9.1 characteristic C. carnea C. downesi breeding months June to September April to May courtship song song with a regular rhythm song with no regular rhythm colour light green dark green Suggest how speciation occurred to produce the two different species of green lacewing. ................................................................................................................................................... ................................................................................................................................................... ................................................................................................................................................... ................................................................................................................................................... ................................................................................................................................................... ................................................................................................................................................... ............................................................................................................................................. [3] [Total: 10]
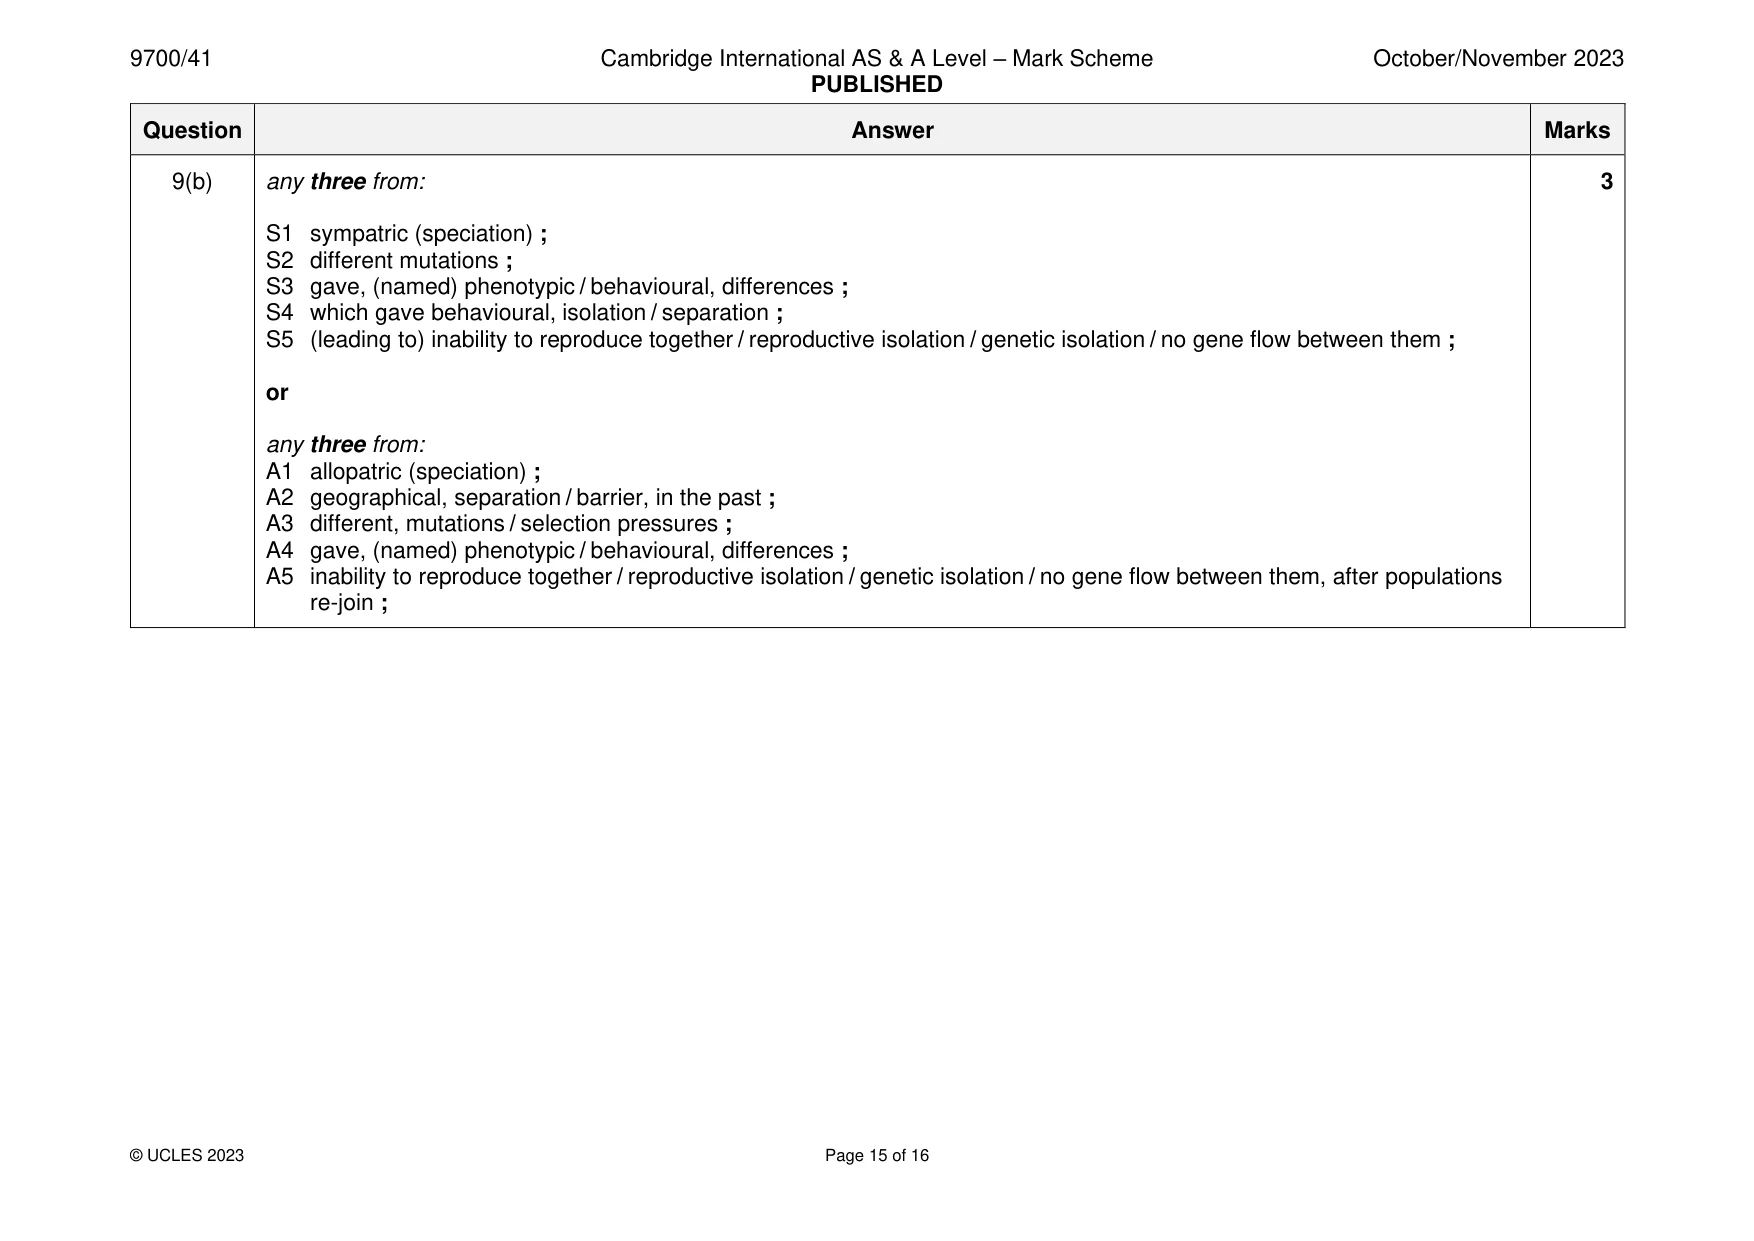
Mark scheme: 9(a)(i) any three from: 3 1 (random) mutation(s) allows detection of high frequency ; 2 selection pressure is bat (predation) ; 3 those that can detect, high frequencies / bats, survive / don’t get eaten / have selective advantage / are selected for ; 4 these, reproduce / pass on (beneficial) allele(s) ; 5 those that can detect high sounds / beneficial alleles, increase (in frequency / in population) ; 9(a)(ii) any four from: 4 1 ref. to receptor / generator, potential ; 2 vesicles of (named) neurotransmitter, move towards / fuse with, (presynaptic) membrane ; 3 (named) neurotransmitter, release / exocytosis ; 4 neurotransmitter binds to receptors on sensory neurone ; 5 Na+ / sodium, ions enter (sensory neurone) ; 6 depolarisation (of membrane of sensory neurone) ; 7 ref. to threshold potential / all-or-nothing response ; 9(b) any three from: 3 S1 sympatric (speciation) ; S2 different mutations ; S3 gave, (named) phenotypic / behavioural, differences ; S4 which gave behavioural, isolation / separation ; S5 (leading to) inability to reproduce together / reproductive isolation / genetic isolation / no gene flow between them ; or any three from: A1 allopatric (speciation) ; A2 geographical, separation / barrier, in the past ; A3 different, mutations / selection pressures ; A4 gave, (named) phenotypic / behavioural, differences ; A5 inability to reproduce together / reproductive isolation / genetic isolation / no gene flow between them, after populations re-join ;
Q10 · Medicine is defined as the diagnosis, treatment and prevention of disease
10 Medicine is defined as the diagnosis, treatment and prevention of disease. Outline the different ways in which genetic technology can be applied to medicine, with reference to named diseases. .......................................................................................................................................................... .......................................................................................................................................................... .......................................................................................................................................................... .......................................................................................................................................................... .......................................................................................................................................................... .......................................................................................................................................................... .......................................................................................................................................................... .......................................................................................................................................................... .......................................................................................................................................................... .......................................................................................................................................................... .......................................................................................................................................................... .......................................................................................................................................................... .......................................................................................................................................................... .......................................................................................................................................................... .......................................................................................................................................................... .......................................................................................................................................................... .......................................................................................................................................................... .......................................................................................................................................................... .................................................................................................................................................... [7]
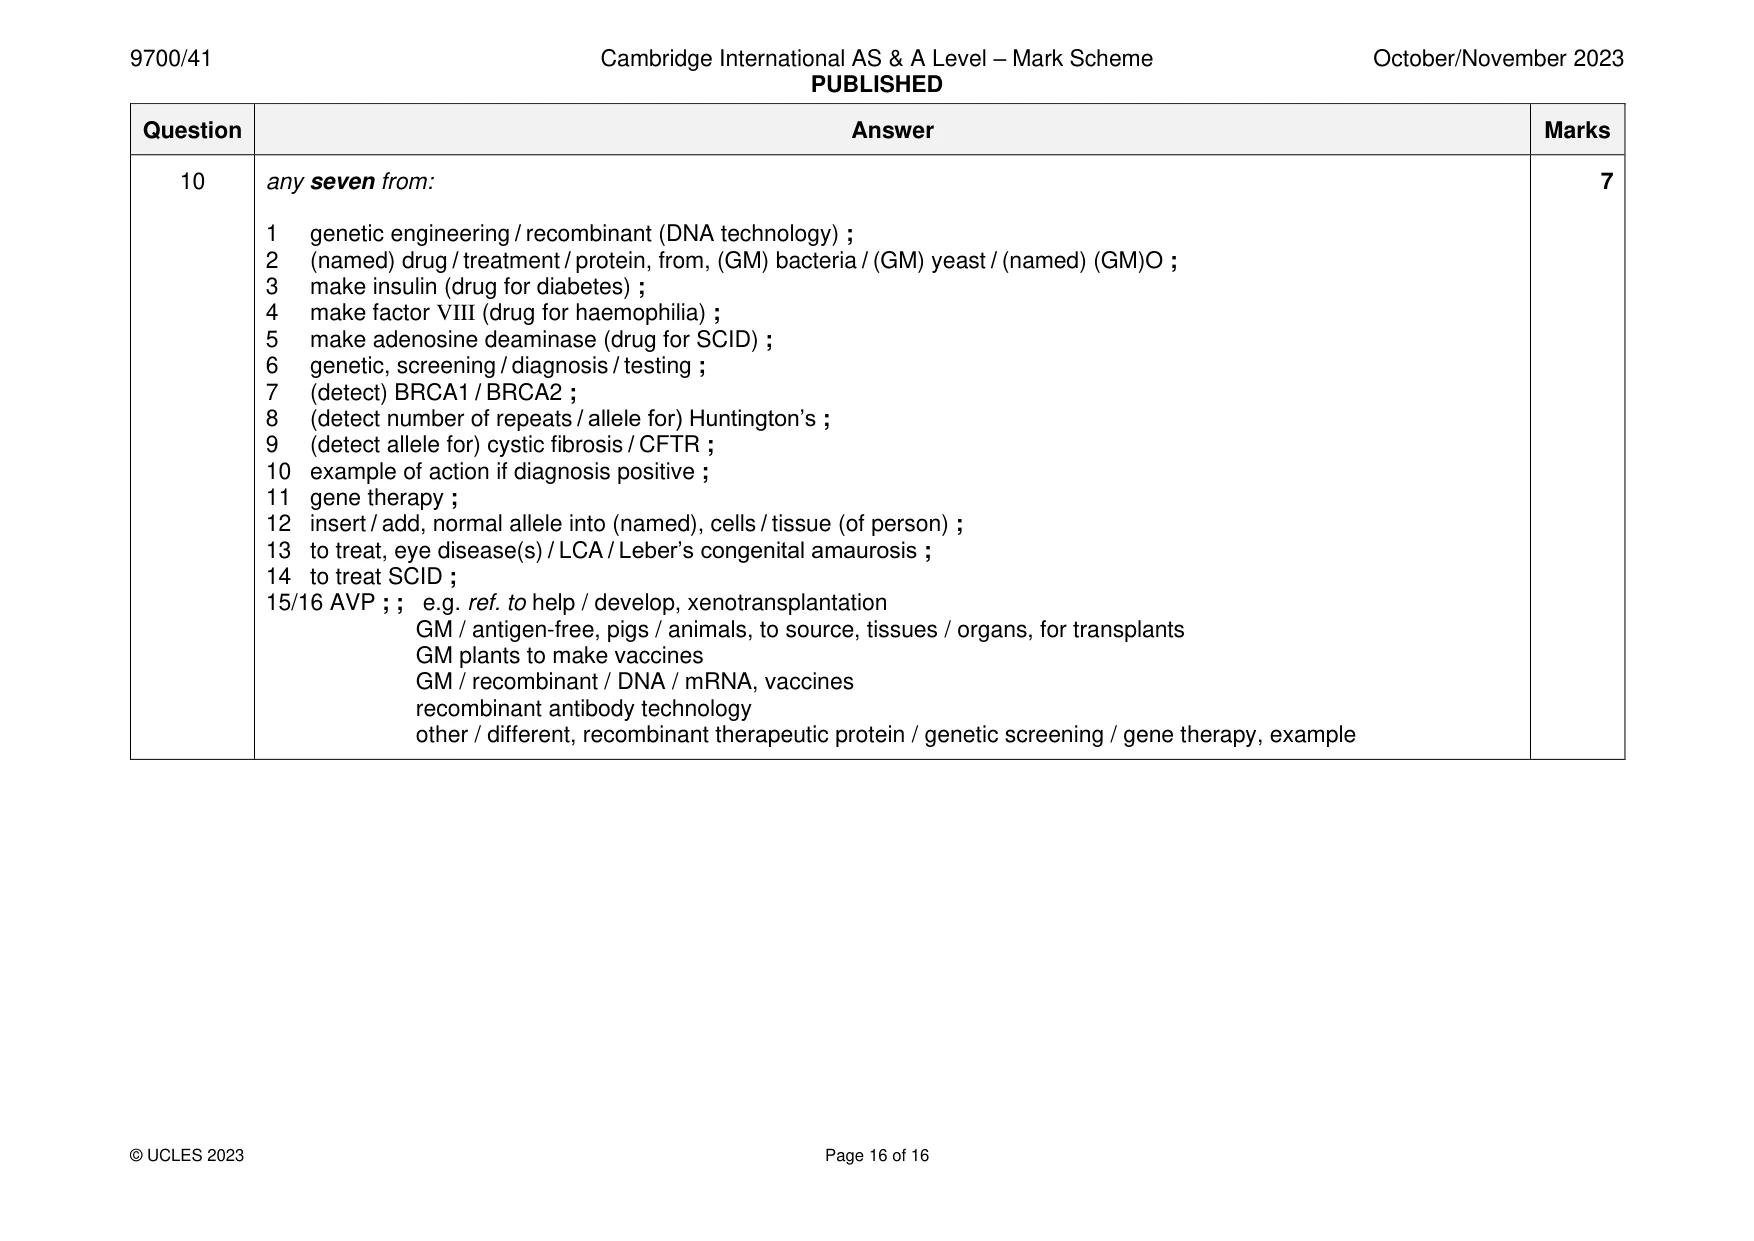
Mark scheme: 10 any seven from: 7 1 genetic engineering / recombinant (DNA technology) ; 2 (named) drug / treatment / protein, from, (GM) bacteria / (GM) yeast / (named) (GM)O ; 3 make insulin (drug for diabetes) ; 4 make factor VIII (drug for haemophilia) ; 5 make adenosine deaminase (drug for SCID) ; 6 genetic, screening / diagnosis / testing ; 7 (detect) BRCA1 / BRCA2 ; 8 (detect number of repeats / allele for) Huntington’s ; 9 (detect allele for) cystic fibrosis / CFTR ; 10 example of action if diagnosis positive ; 11 gene therapy ; 12 insert / add, normal allele into (named), cells / tissue (of person) ; 13 to treat, eye disease(s) / LCA / Leber’s congenital amaurosis ; 14 to treat SCID ; 15/16 AVP ; ; e.g. ref. to help / develop, xenotransplantation GM / antigen-free, pigs / animals, to source, tissues / organs, for transplants GM plants to make vaccines GM / recombinant / DNA / mRNA, vaccines recombinant antibody technology other / different, recombinant therapeutic protein / genetic screening / gene therapy, example
What was in this paper
The subtopics covered by these 10 questions, and how many questions each got. Open one in a new tab to see every Cambridge question on it.
What you needed in this session
Cambridge’s own grade thresholds for 2023 Oct/Nov, Paper 4 · Variant 1. A higher threshold means an easier paper — the bar moves with how the cohort did.