Cambridge A Level Biology 9700 — 2025 May/June Paper 5 · Variant 2
9700/52/M/J/25 · 2 questions · 30 marks · 75 min
The question paper and its mark scheme, free to read here and free to download. This is Cambridge’s own paper, exactly as it was sat.
Question paper12 pages


Mark scheme13 pages
Answers below. Sit the paper first if you are practising.
Questions as text
Q1 · Phosphatases are enzymes that catalyse the removal of phosphate from other molecules…
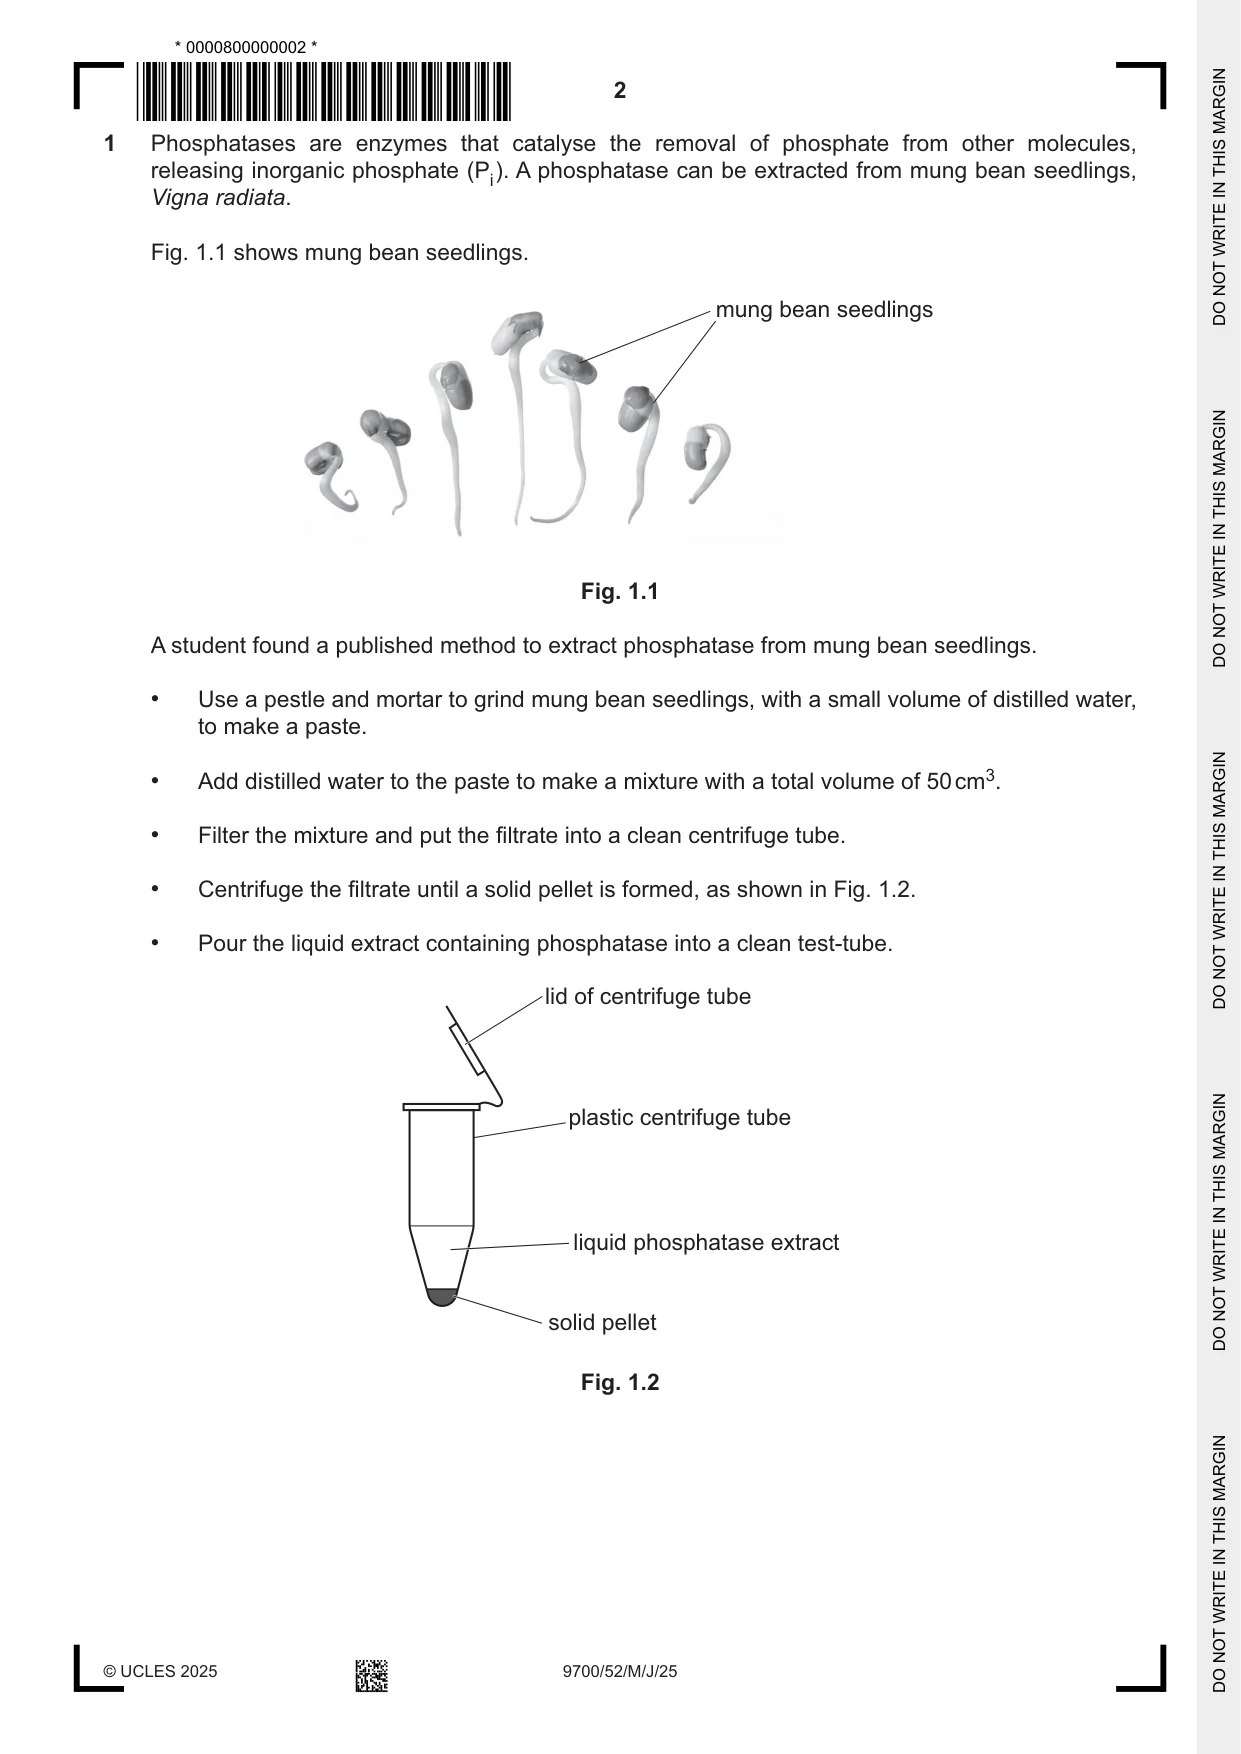
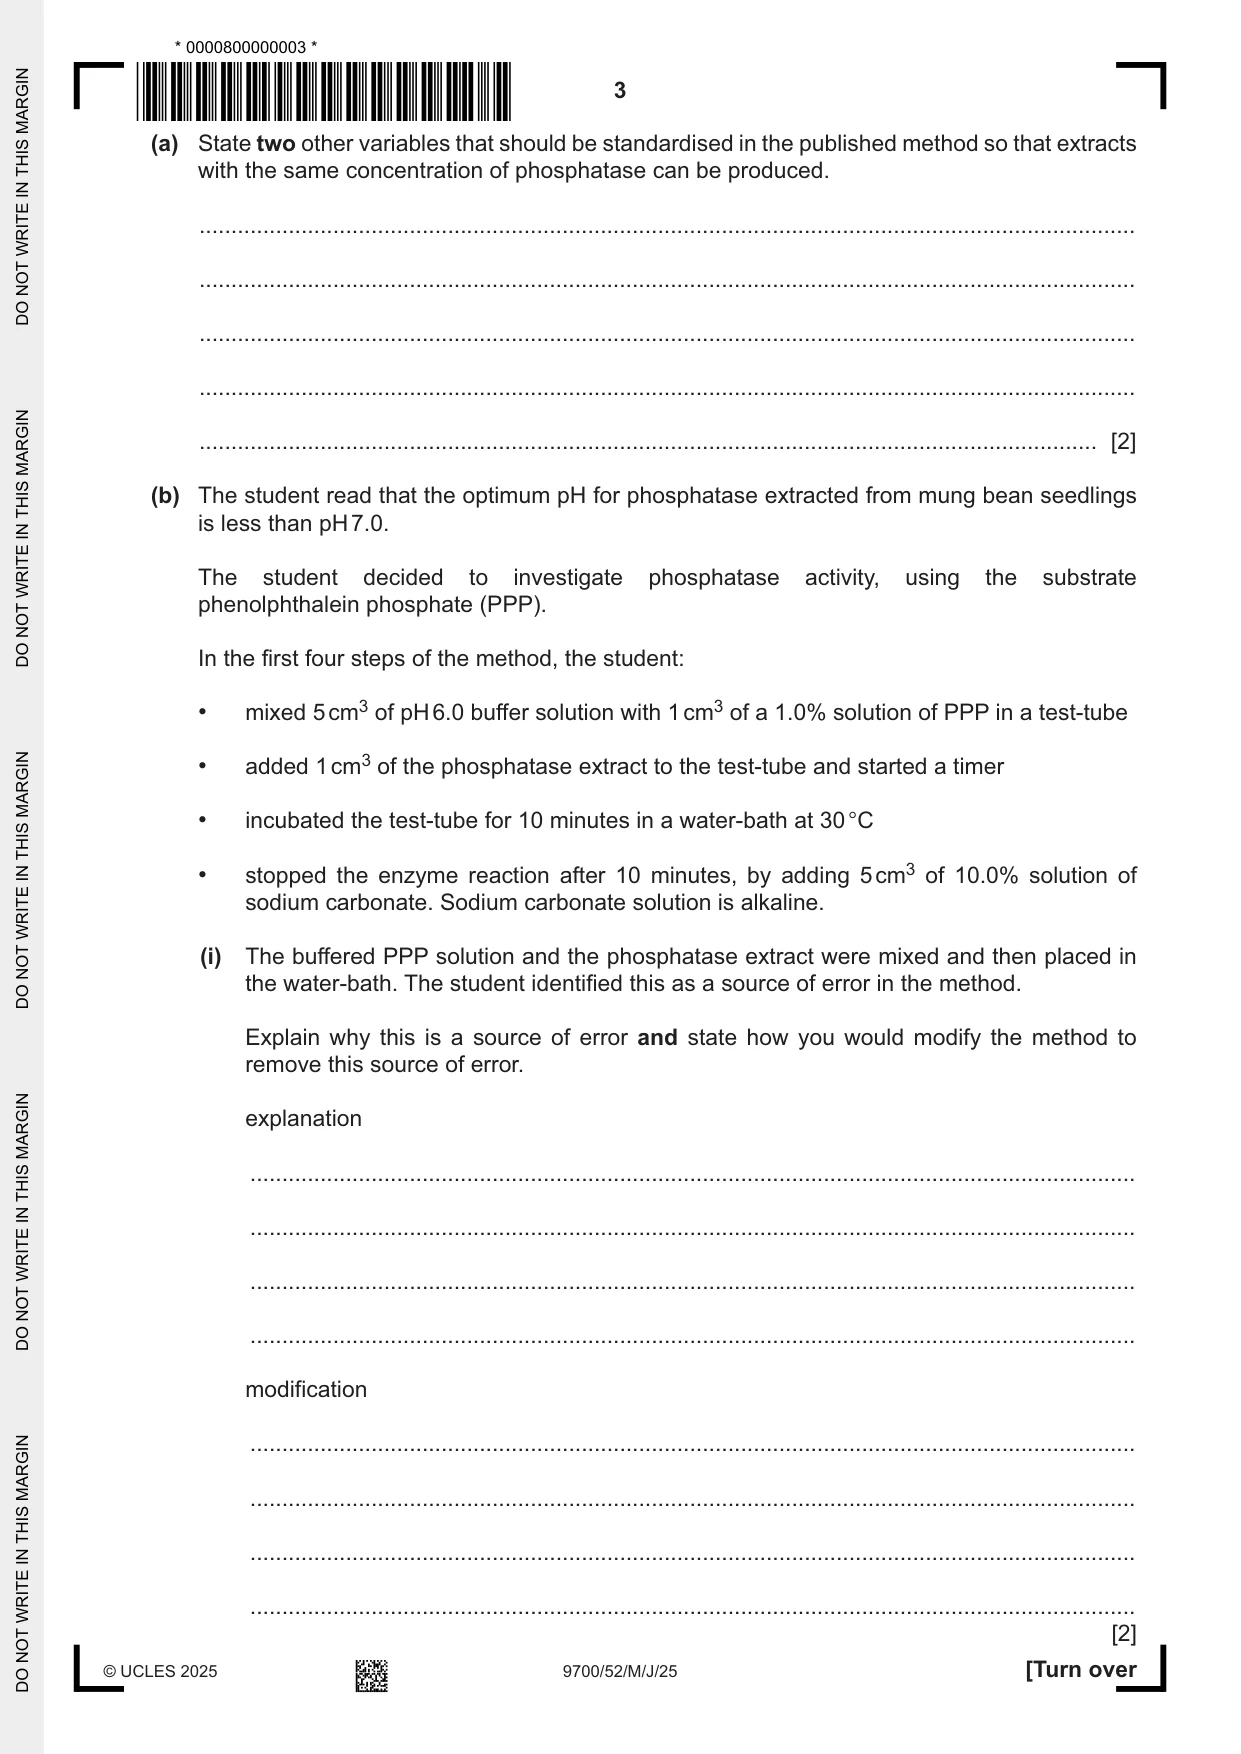
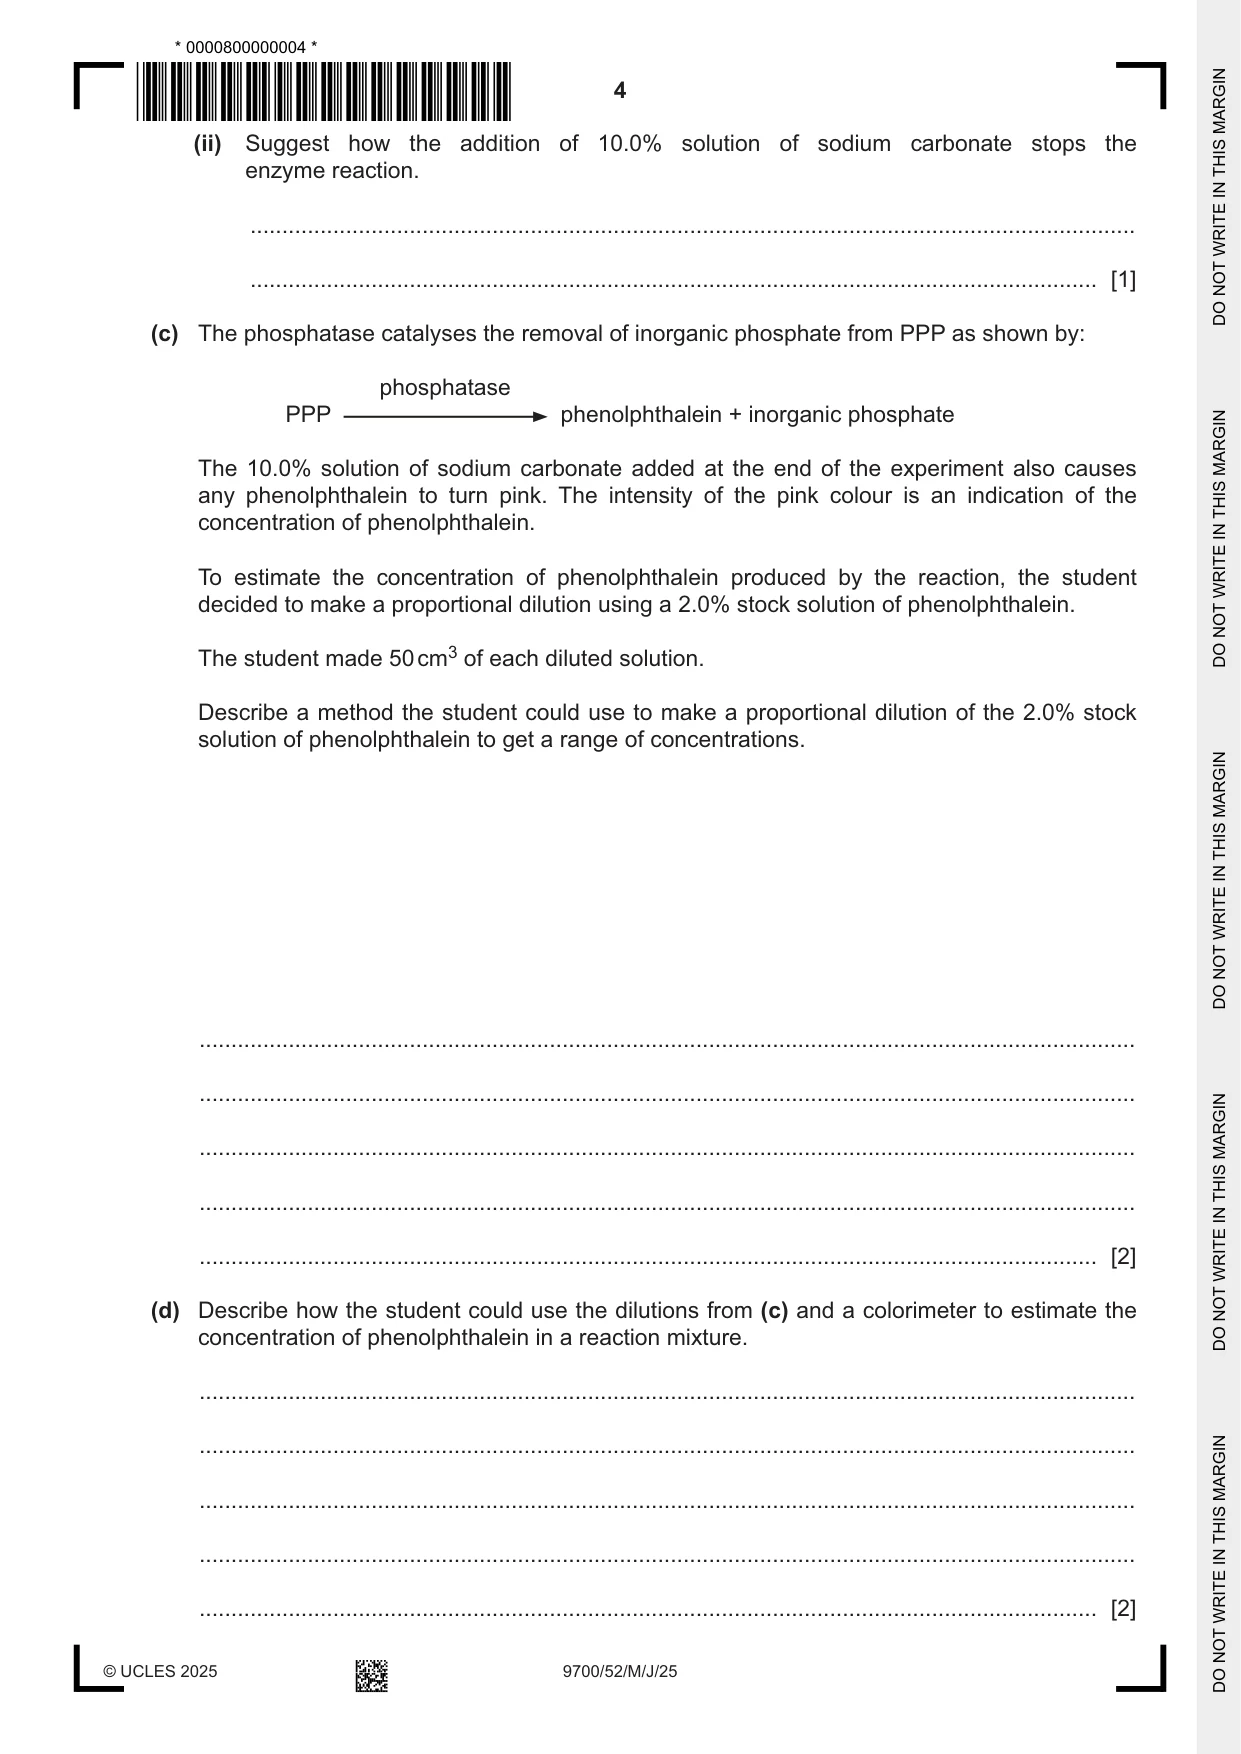
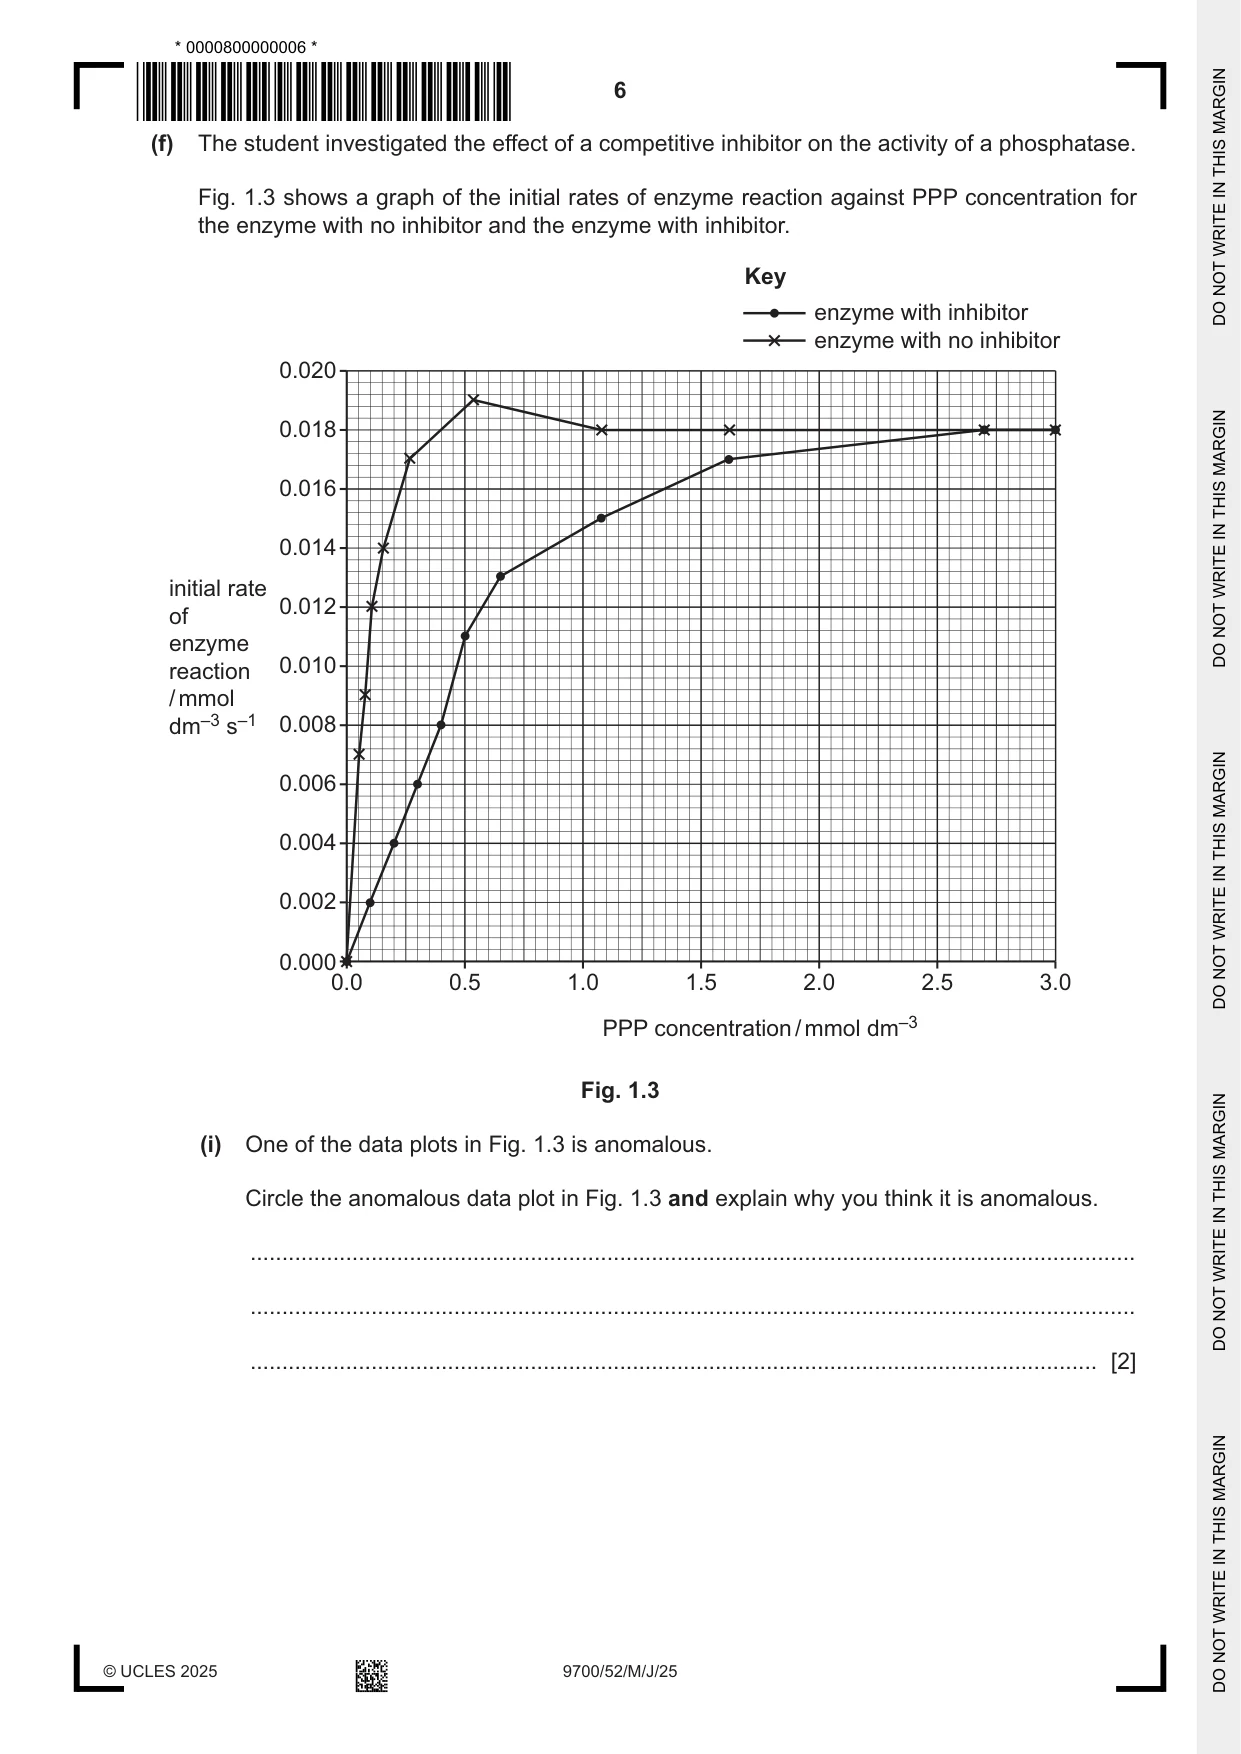
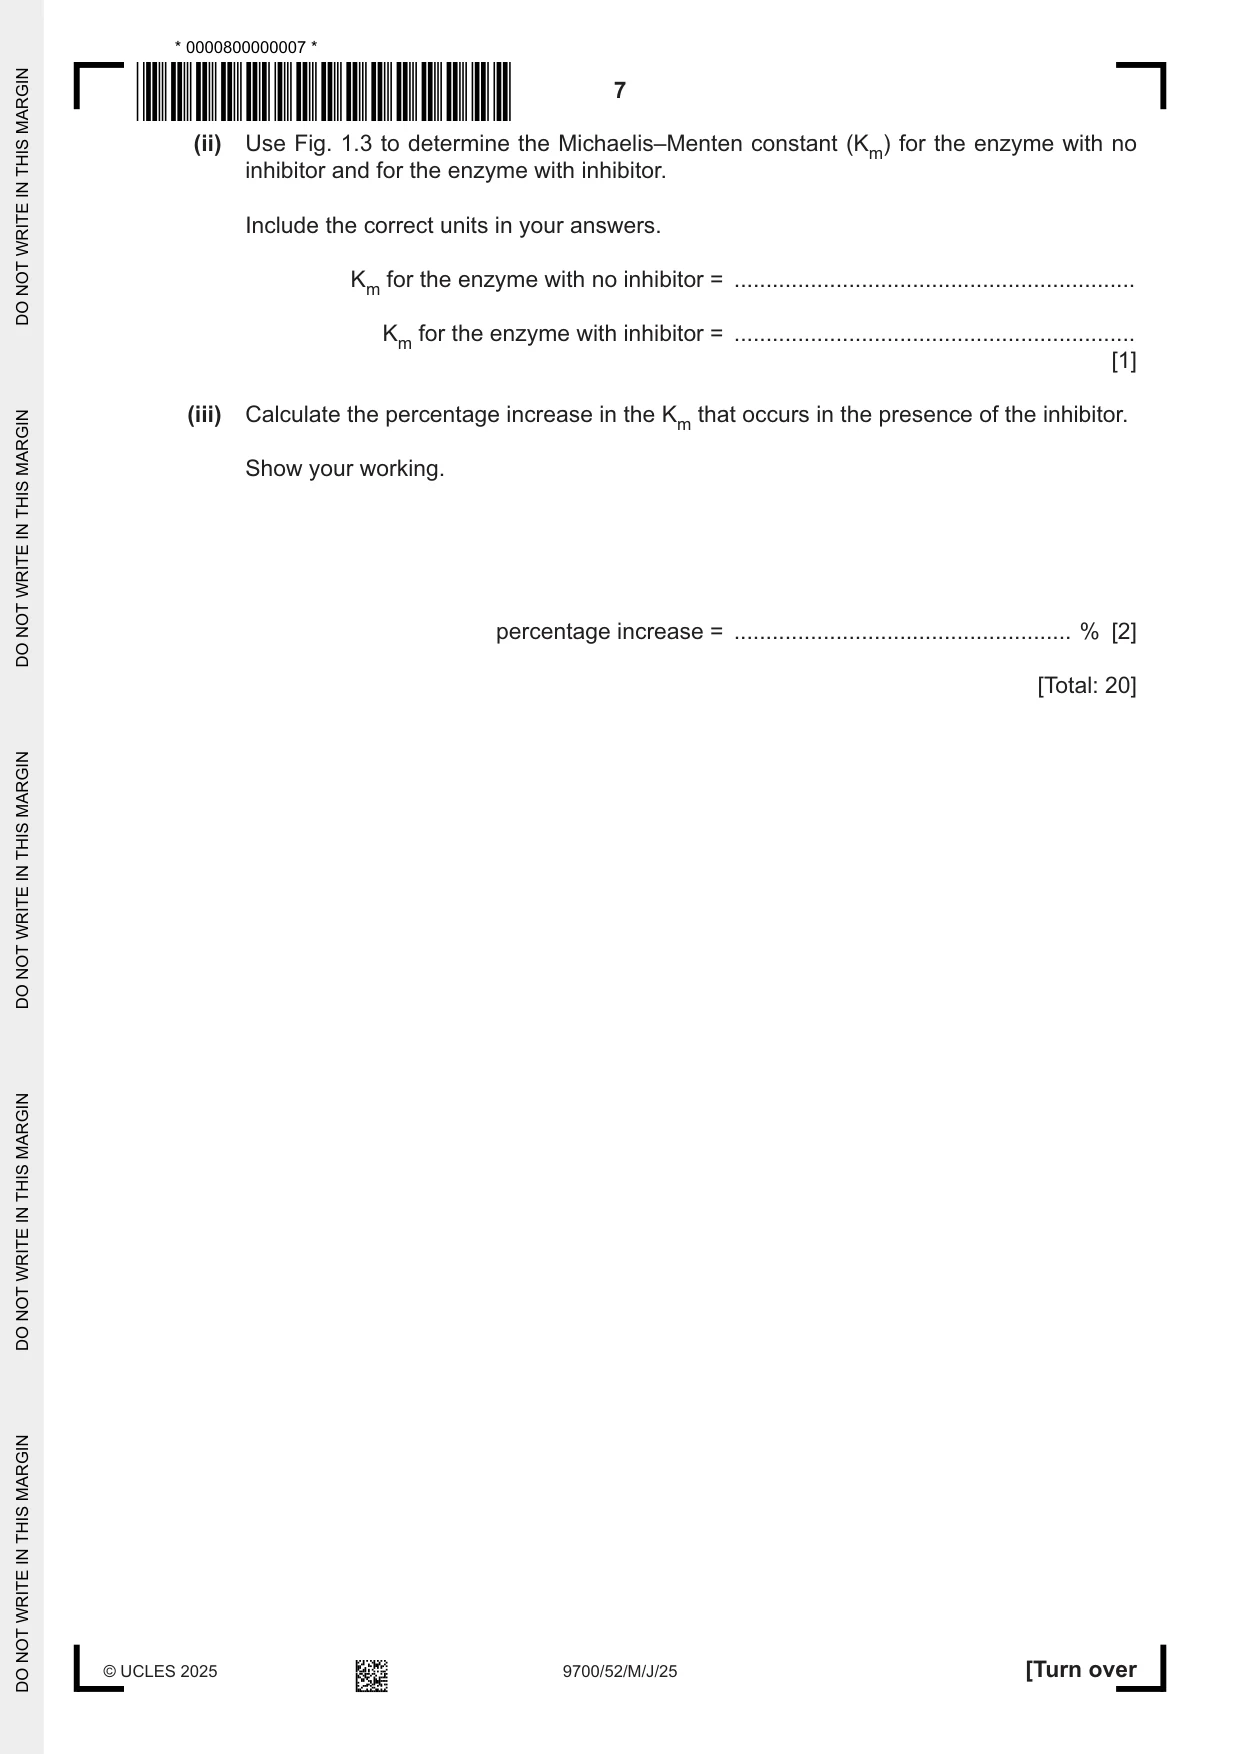
1 Phosphatases are enzymes that catalyse the removal of phosphate from other molecules, releasing inorganic phosphate (Pi). A phosphatase can be extracted from mung bean seedlings, Vigna radiata. Fig. 1.1 shows mung bean seedlings. mung bean seedlings Fig. 1.1 A student found a published method to extract phosphatase from mung bean seedlings. • Use a pestle and mortar to grind mung bean seedlings, with a small volume of distilled water, to make a paste. • Add distilled water to the paste to make a mixture with a total volume of 50 cm3. • Filter the mixture and put the filtrate into a clean centrifuge tube. • Centrifuge the filtrate until a solid pellet is formed, as shown in Fig. 1.2. • Pour the liquid extract containing phosphatase into a clean test-tube. lid of centrifuge tube plastic centrifuge tube liquid phosphatase extract solid pellet Fig. 1.2 (a) State two other variables that should be standardised in the published method so that extracts with the same concentration of phosphatase can be produced. ................................................................................................................................................... ................................................................................................................................................... ................................................................................................................................................... ................................................................................................................................................... ............................................................................................................................................. [2] (b) The student read that the optimum pH for phosphatase extracted from mung bean seedlings is less than pH 7.0. The student decided to investigate phosphatase activity, using the substrate phenolphthalein phosphate (PPP). In the first four steps of the method, the student: • mixed 5 cm3 of pH 6.0 buffer solution with 1 cm3 of a 1.0% solution of PPP in a test-tube • added 1 cm3 of the phosphatase extract to the test-tube and started a timer • incubated the test-tube for 10 minutes in a water-bath at 30 °C • stopped the enzyme reaction after 10 minutes, by adding 5 cm3 of 10.0% solution of sodium carbonate. Sodium carbonate solution is alkaline. (i) The buffered PPP solution and the phosphatase extract were mixed and then placed in the water-bath. The student identified this as a source of error in the method. Explain why this is a source of error and state how you would modify the method to remove this source of error. explanation ........................................................................................................................................... ........................................................................................................................................... ........................................................................................................................................... ........................................................................................................................................... modification ........................................................................................................................................... ........................................................................................................................................... ........................................................................................................................................... ........................................................................................................................................... [2] (ii) Suggest how the addition of 10.0% solution of sodium carbonate stops the enzyme reaction. ........................................................................................................................................... ..................................................................................................................................... [1] (c) The phosphatase catalyses the removal of inorganic phosphate from PPP as shown by: phosphatase PPP phenolphthalein + inorganic phosphate The 10.0% solution of sodium carbonate added at the end of the experiment also causes any phenolphthalein to turn pink. The intensity of the pink colour is an indication of the concentration of phenolphthalein. To estimate the concentration of phenolphthalein produced by the reaction, the student decided to make a proportional dilution using a 2.0% stock solution of phenolphthalein. The student made 50 cm3 of each diluted solution. Describe a method the student could use to make a proportional dilution of the 2.0% stock solution of phenolphthalein to get a range of concentrations. ................................................................................................................................................... ................................................................................................................................................... ................................................................................................................................................... ................................................................................................................................................... ............................................................................................................................................. [2] (d) Describe how the student could use the dilutions from (c) and a colorimeter to estimate the concentration of phenolphthalein in a reaction mixture. ................................................................................................................................................... ................................................................................................................................................... ................................................................................................................................................... ................................................................................................................................................... ............................................................................................................................................. [2] (e) The student decided to determine the optimum pH for phosphatase extract from the mung bean seedlings. Describe a method the student could use to determine the optimum pH for phosphatase. Your method should be set out in a logical order and be detailed enough to allow another person to follow it. Details of how to extract phosphatase from the mung bean seedlings and how to make the dilutions of phenolphthalein solutions should not be included. ................................................................................................................................................... ................................................................................................................................................... ................................................................................................................................................... ................................................................................................................................................... ................................................................................................................................................... ................................................................................................................................................... ................................................................................................................................................... ................................................................................................................................................... ................................................................................................................................................... ................................................................................................................................................... ................................................................................................................................................... ................................................................................................................................................... ................................................................................................................................................... ................................................................................................................................................... ................................................................................................................................................... ................................................................................................................................................... ................................................................................................................................................... ................................................................................................................................................... ................................................................................................................................................... ................................................................................................................................................... ............................................................................................................................................. [6] (f) The student investigated the effect of a competitive inhibitor on the activity of a phosphatase. Fig. 1.3 shows a graph of the initial rates of enzyme reaction against PPP concentration for the enzyme with no inhibitor and the enzyme with inhibitor. Key enzyme with inhibitor enzyme with no inhibitor 0.020 0.018 0.016 0.014 initial rate 0.012 of enzyme reaction 0.010 / mmol dm–3 s–1 0.008 0.006 0.004 0.002 0.000 0.0 0.5 1.0 1.5 2.0 2.5 3.0 PPP concentration / mmol dm–3 Fig. 1.3 (i) One of the data plots in Fig. 1.3 is anomalous. Circle the anomalous data plot in Fig. 1.3 and explain why you think it is anomalous. ........................................................................................................................................... ........................................................................................................................................... ..................................................................................................................................... [2] (ii) Use Fig. 1.3 to determine the Michaelis–Menten constant (Km) for the enzyme with no inhibitor and for the enzyme with inhibitor. Include the correct units in your answers. Km for the enzyme with no inhibitor = ............................................................... Km for the enzyme with inhibitor = ............................................................... [1] (iii) Calculate the percentage increase in the Km that occurs in the presence of the inhibitor. Show your working. percentage increase = ..................................................... % [2] [Total: 20]
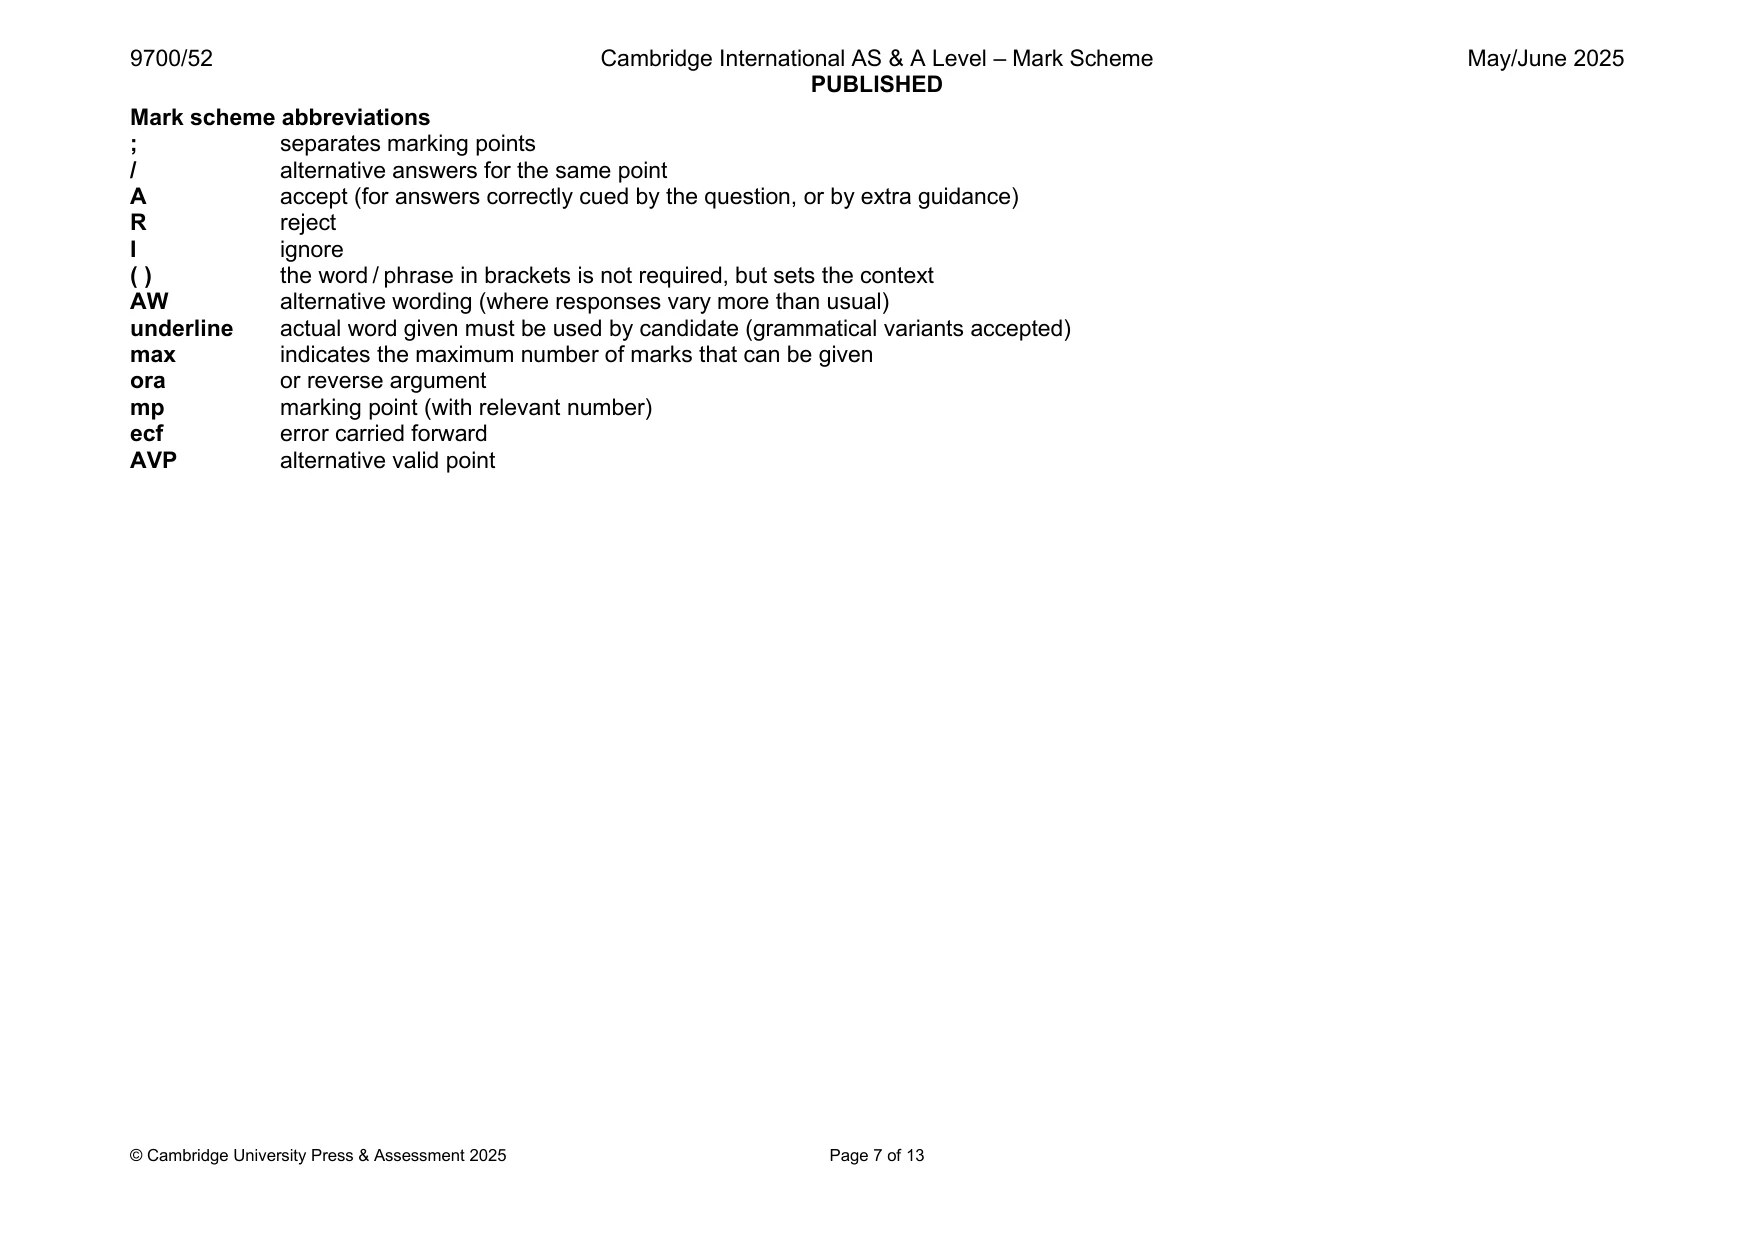
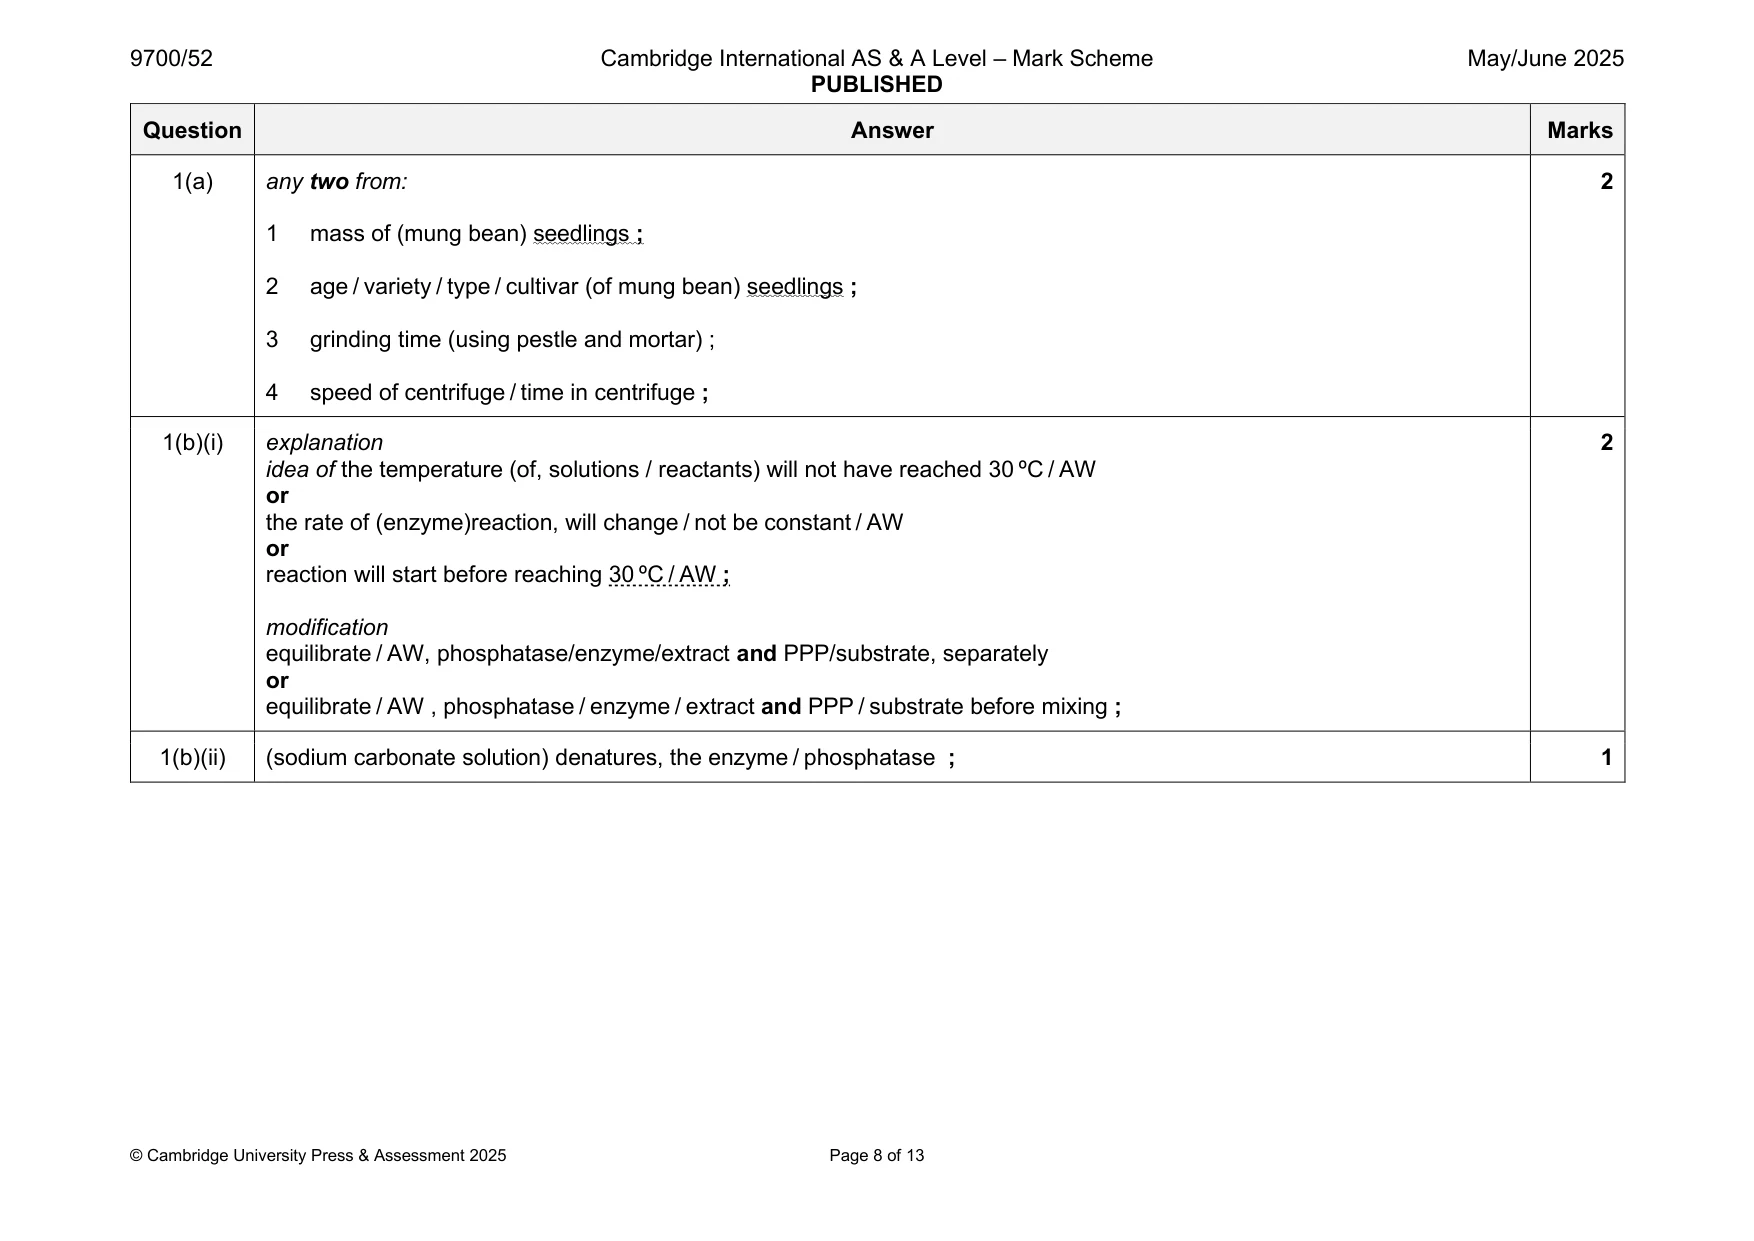
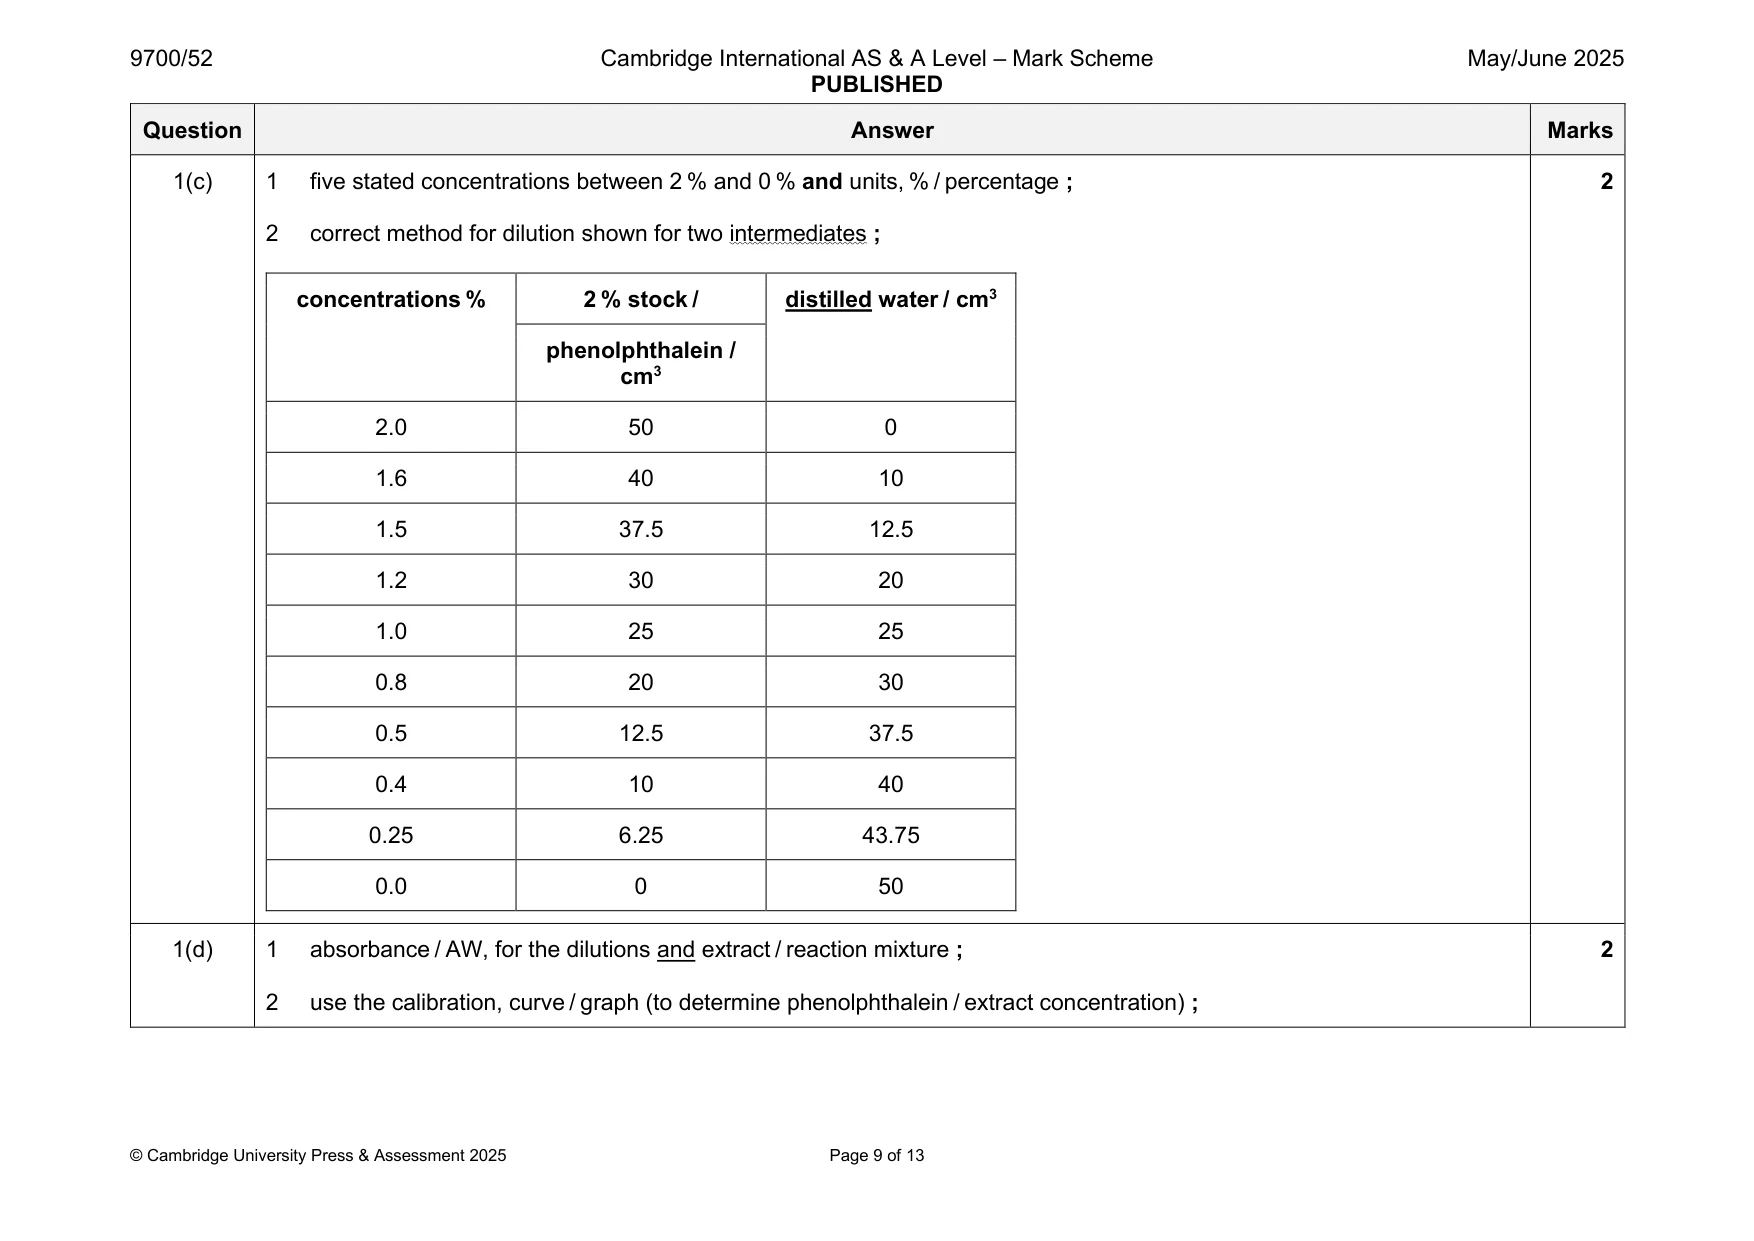
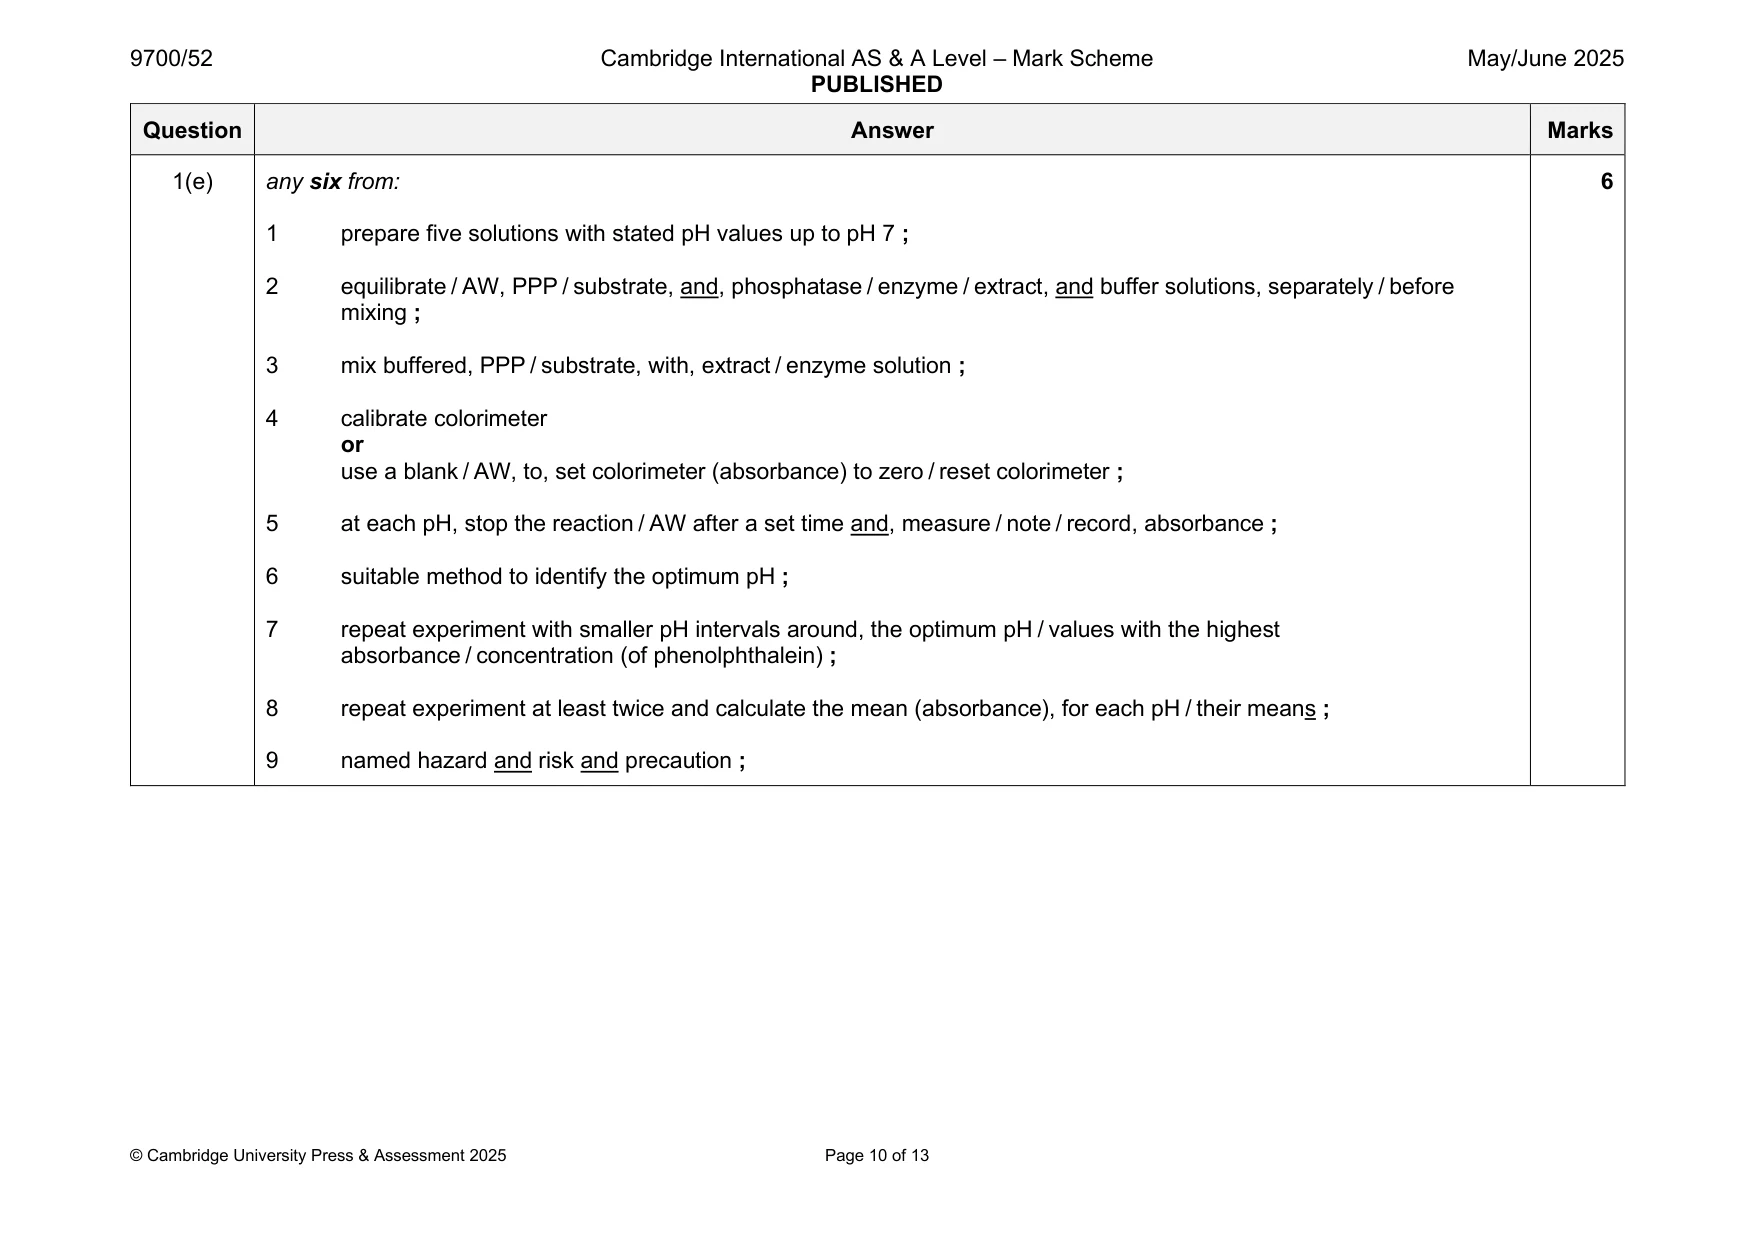
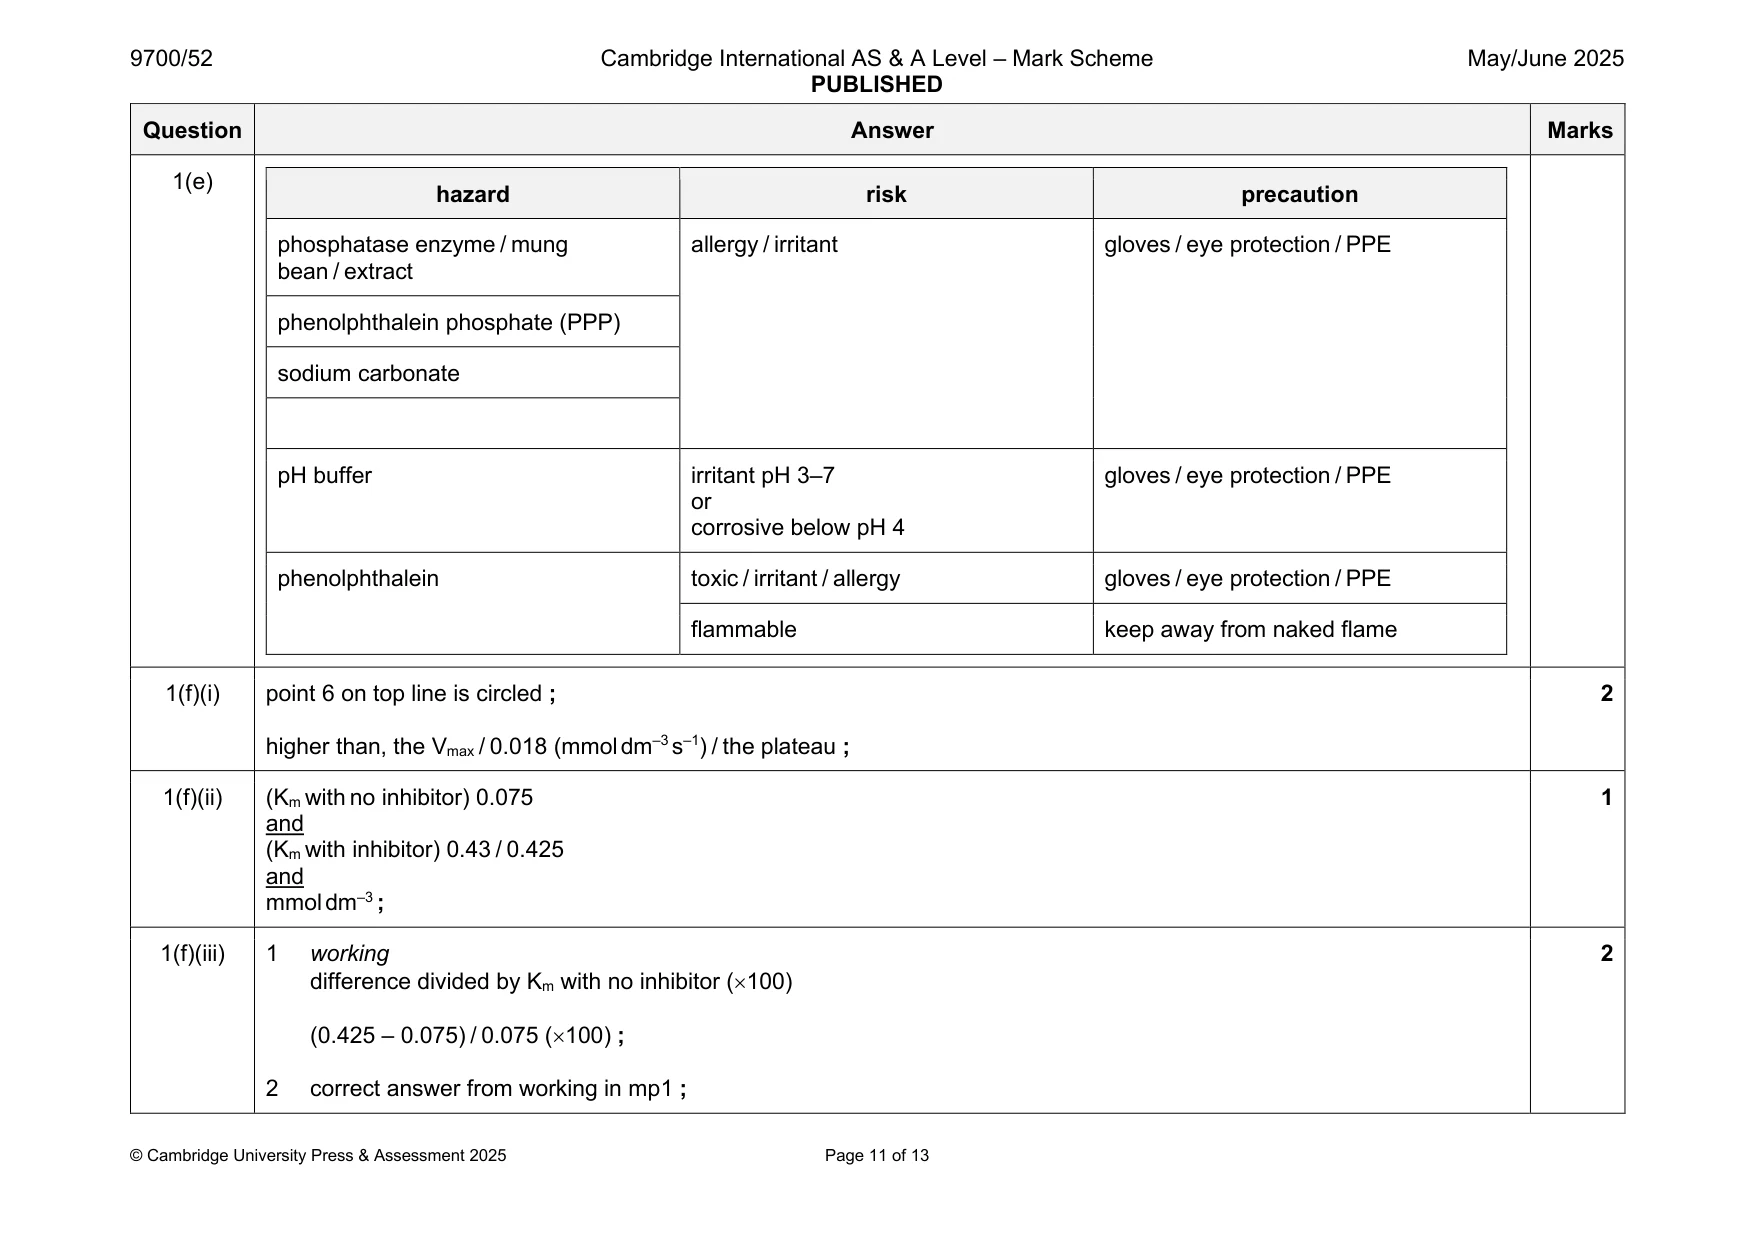
Mark scheme: Question Answer Marks 1(a) any two from: 2 1 mass of (mung bean) seedlings ; 2 age / variety / type / cultivar (of mung bean) seedlings ; 3 grinding time (using pestle and mortar) ; 4 speed of centrifuge / time in centrifuge ; 1(b)(i) explanation 2 idea of the temperature (of, solutions / reactants) will not have reached 30 ºC / AW or the rate of (enzyme)reaction, will change / not be constant / AW or reaction will start before reaching 30 ºC / AW ; modification equilibrate / AW, phosphatase/enzyme/extract and PPP/substrate, separately or equilibrate / AW , phosphatase / enzyme / extract and PPP / substrate before mixing ; 1(b)(ii) (sodium carbonate solution) denatures, the enzyme / phosphatase ; 1 1(c) 1 five stated concentrations between 2 % and 0 % and units, % / percentage ; 2 2 correct method for dilution shown for two intermediates ; concentrations % 2 % stock / distilled water / cm3 phenolphthalein / cm3 2.0 50 0 1.6 40 10 1.5 37.5 12.5 1.2 30 20 1.0 25 25 0.8 20 30 0.5 12.5 37.5 0.4 10 40 0.25 6.25 43.75 0.0 0 50 1(d) 1 absorbance / AW, for the dilutions and extract / reaction mixture ; 2 2 use the calibration, curve / graph (to determine phenolphthalein / extract concentration) ; 1(e) any six from: 6 1 prepare five solutions with stated pH values up to pH 7 ; 2 equilibrate / AW, PPP / substrate, and, phosphatase / enzyme / extract, and buffer solutions, separately / before mixing ; 3 mix buffered, PPP / substrate, with, extract / enzyme solution ; 4 calibrate colorimeter or use a blank / AW, to, set colorimeter (absorbance) to zero / reset colorimeter ; 5 at each pH, stop the reaction / AW after a set time and, measure / note / record, absorbance ; 6 suitable method to identify the optimum pH ; 7 repeat experiment with smaller pH intervals around, the optimum pH / values with the highest absorbance / concentration (of phenolphthalein) ; 8 repeat experiment at least twice and calculate the mean (absorbance), for each pH / their means ; 9 named hazard and risk and precaution ; 1(e) hazard risk precaution phosphatase enzyme / mung allergy / irritant gloves / eye protection / PPE bean / extract phenolphthalein phosphate (PPP) sodium carbonate pH buffer irritant pH 3–7 gloves / eye protection / PPE or corrosive below pH 4 phenolphthalein toxic / irritant / allergy gloves / eye protection / PPE flammable keep away from naked flame 1(f)(i) point 6 on top line is circled ; 2 higher than, the Vmax / 0.018 (mmol dm–3 s–1) / the plateau ; 1(f)(ii) (Km with no inhibitor) 0.075 1 and (Km with inhibitor) 0.43 / 0.425 and mmol dm–3 ; 1(f)(iii) 1 working 2 difference divided by Km with no inhibitor (100) (0.425 – 0.075) / 0.075 (100) ; 2 correct answer from working in mp1 ;
Q2 · Sponges are immobile, aquatic animals that live on rocks and sediment at the bottom of…
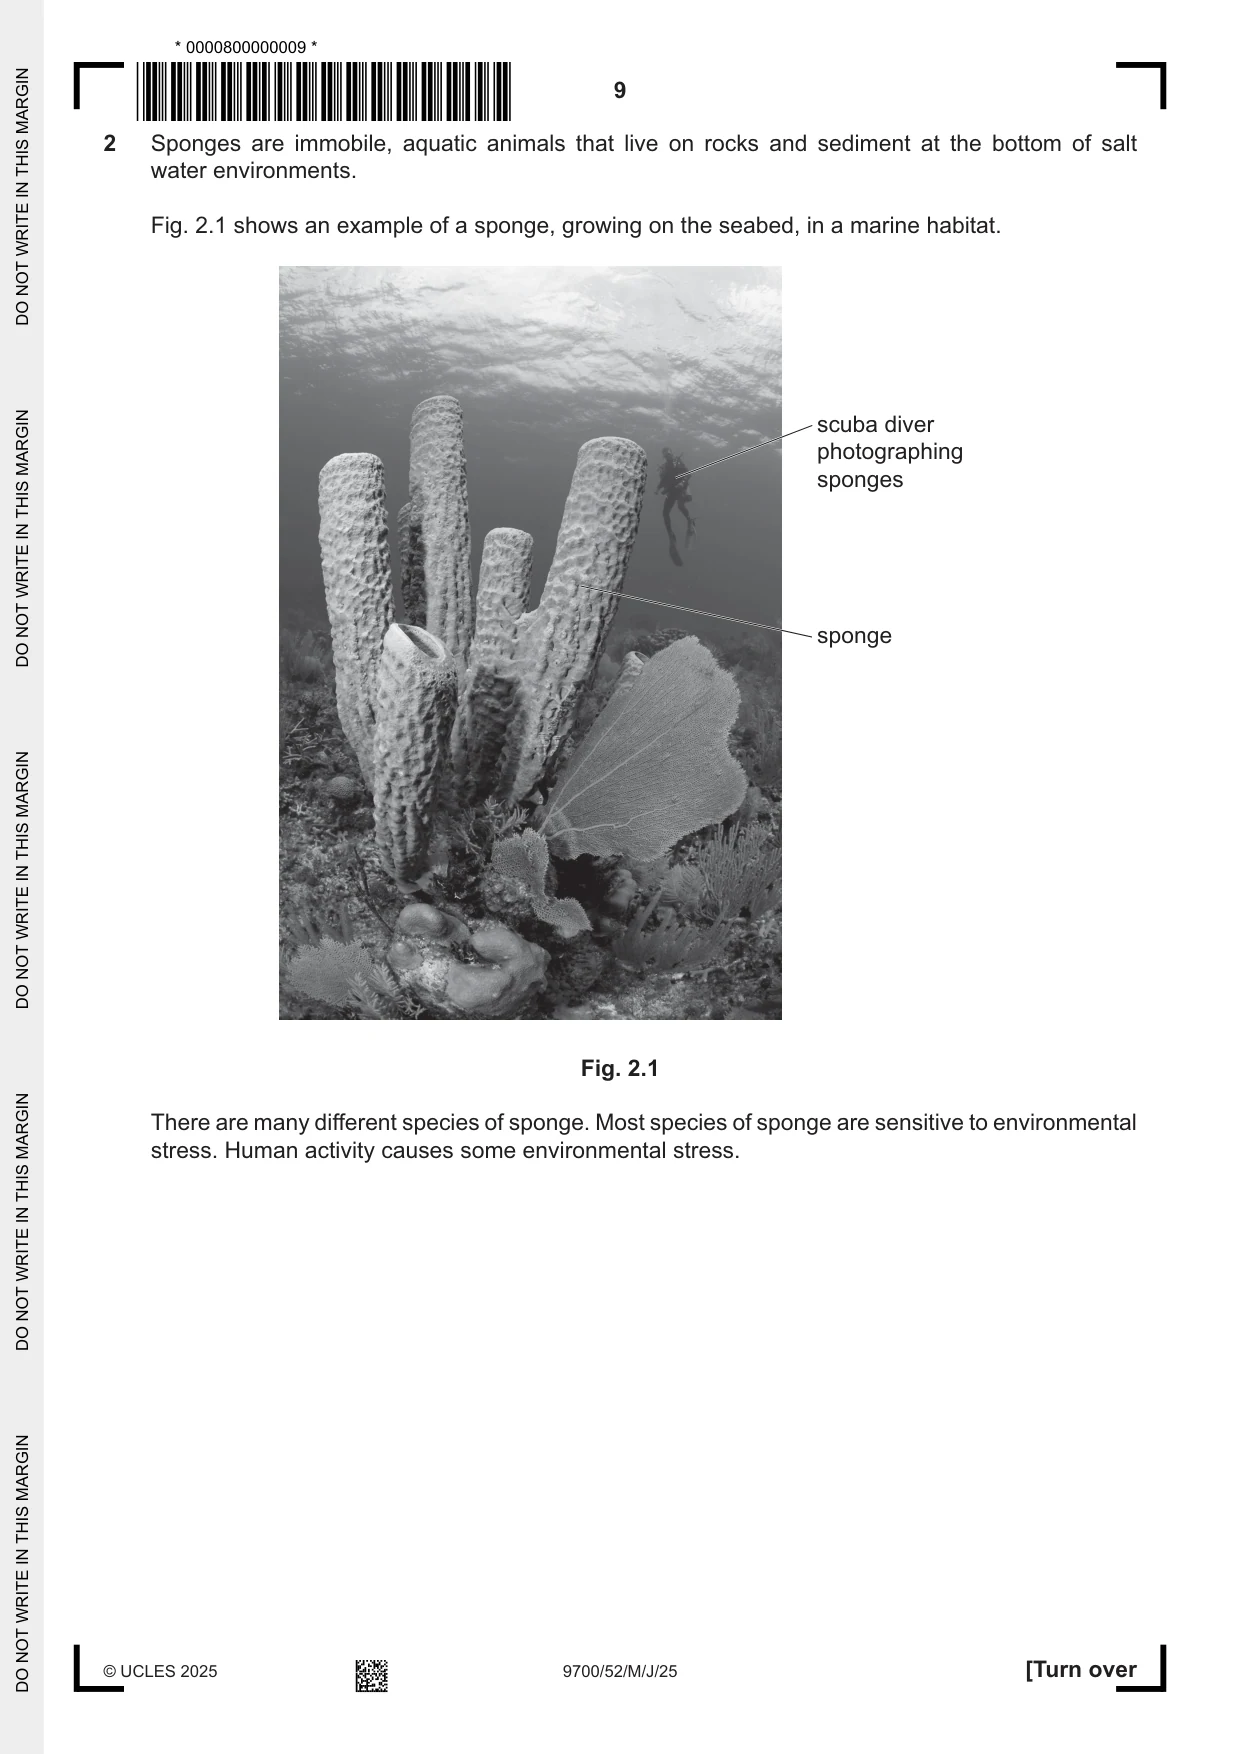
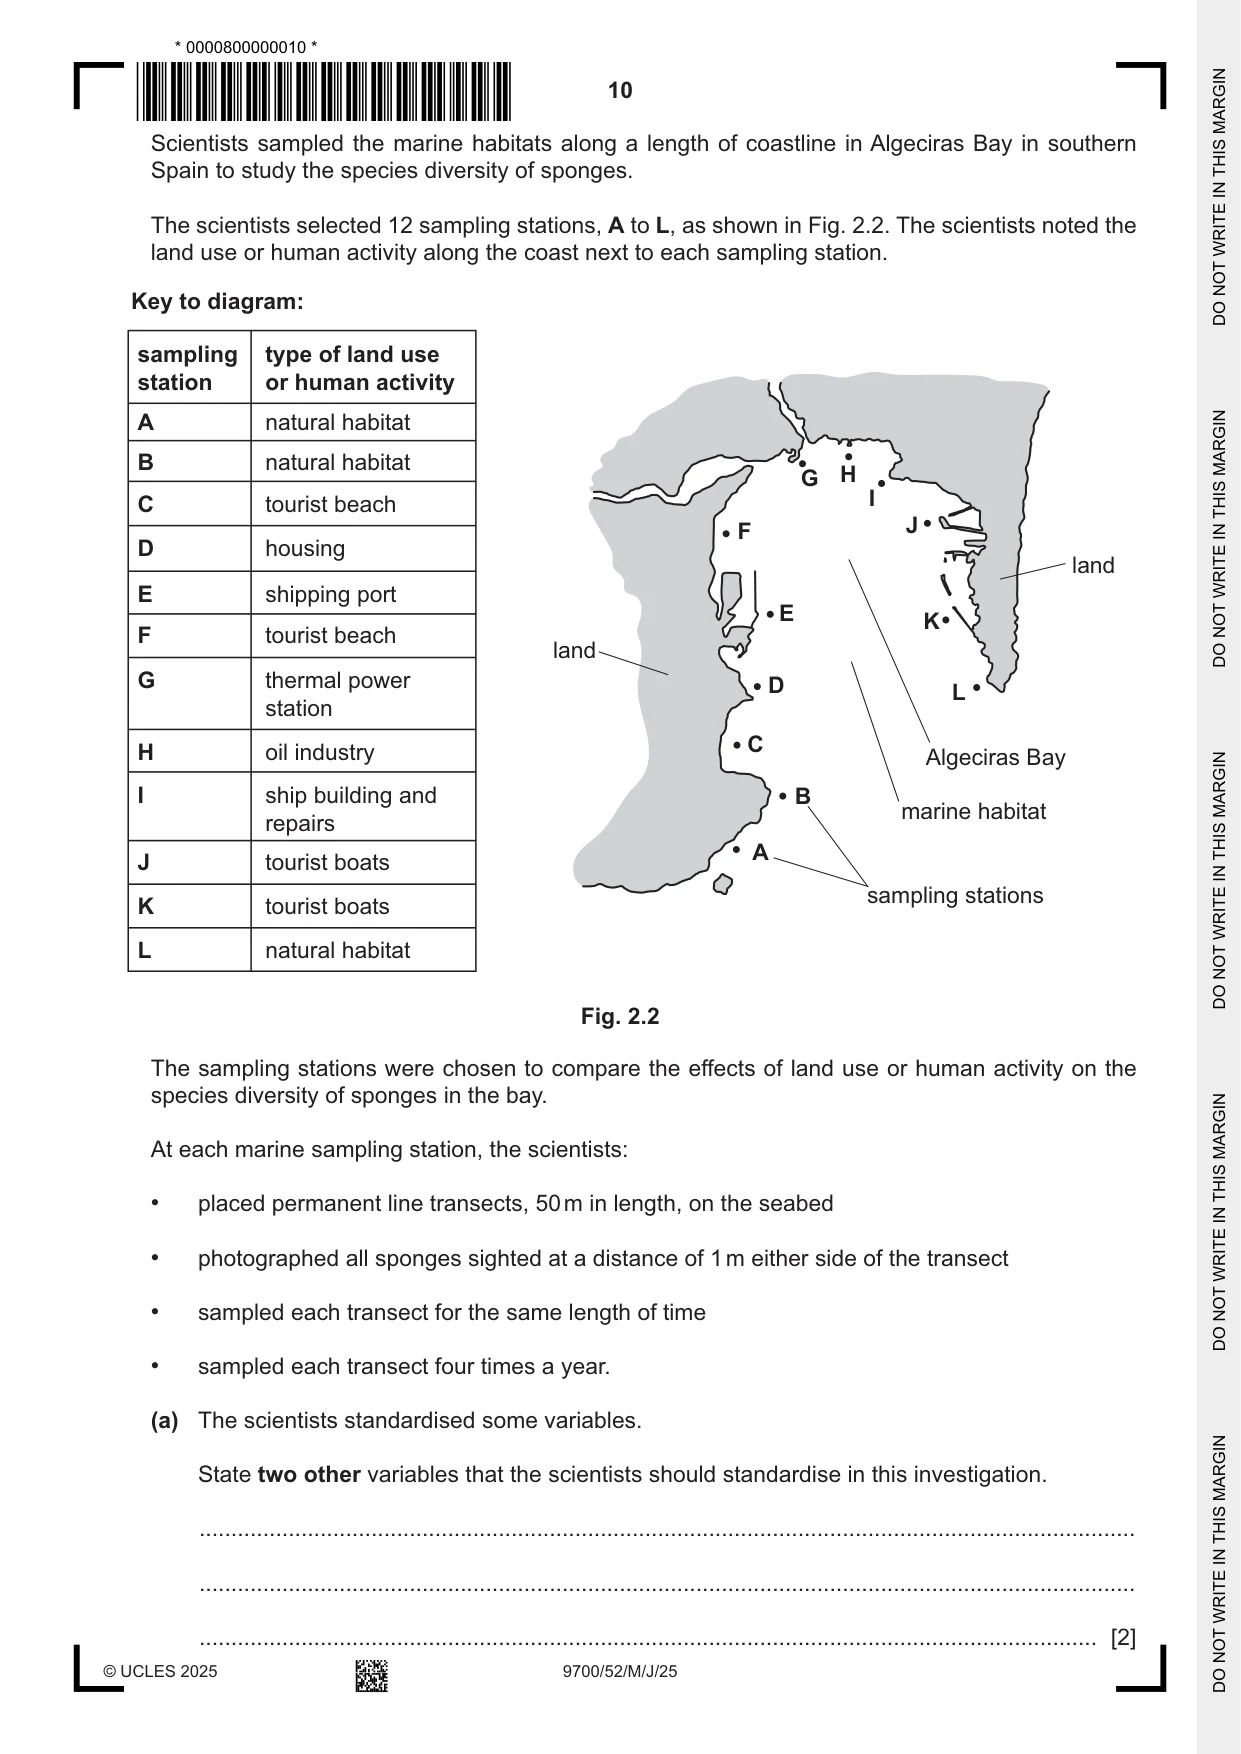
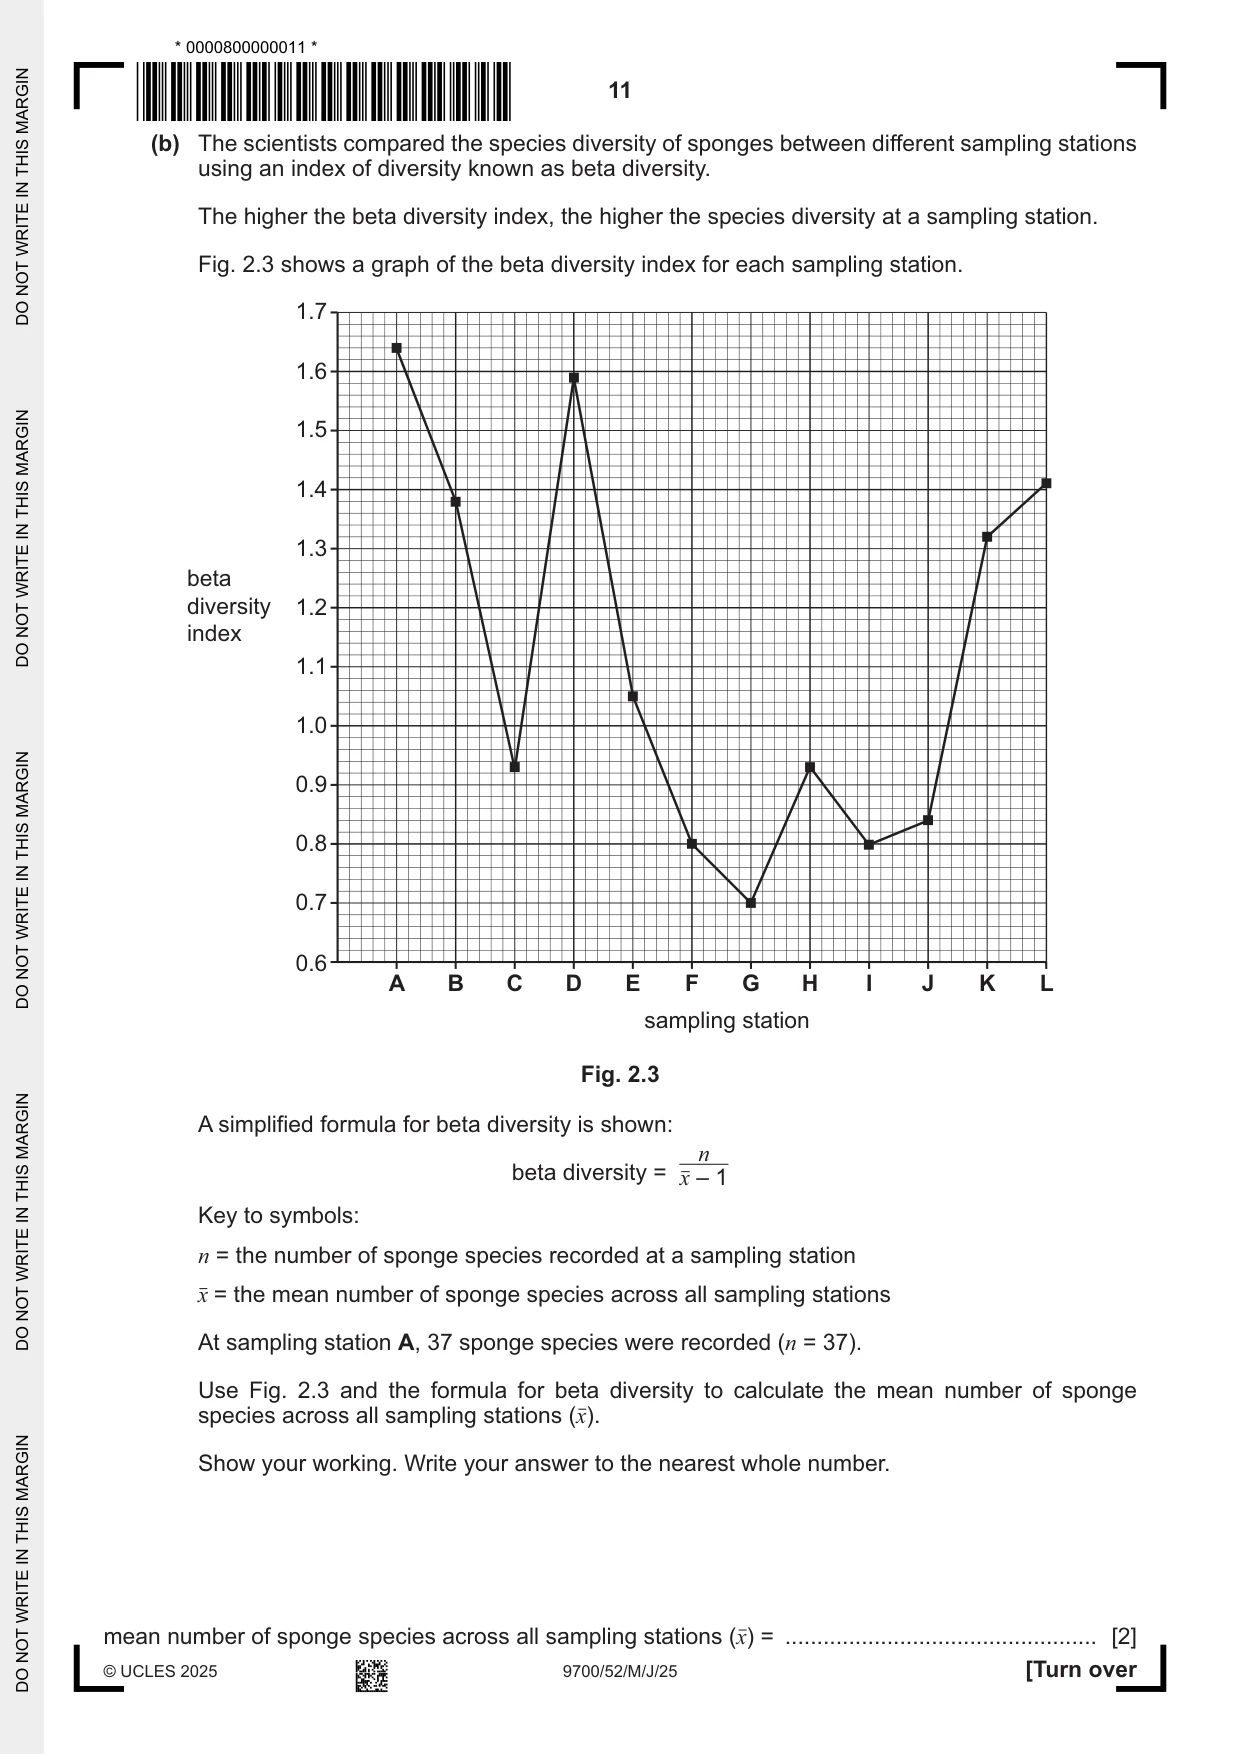
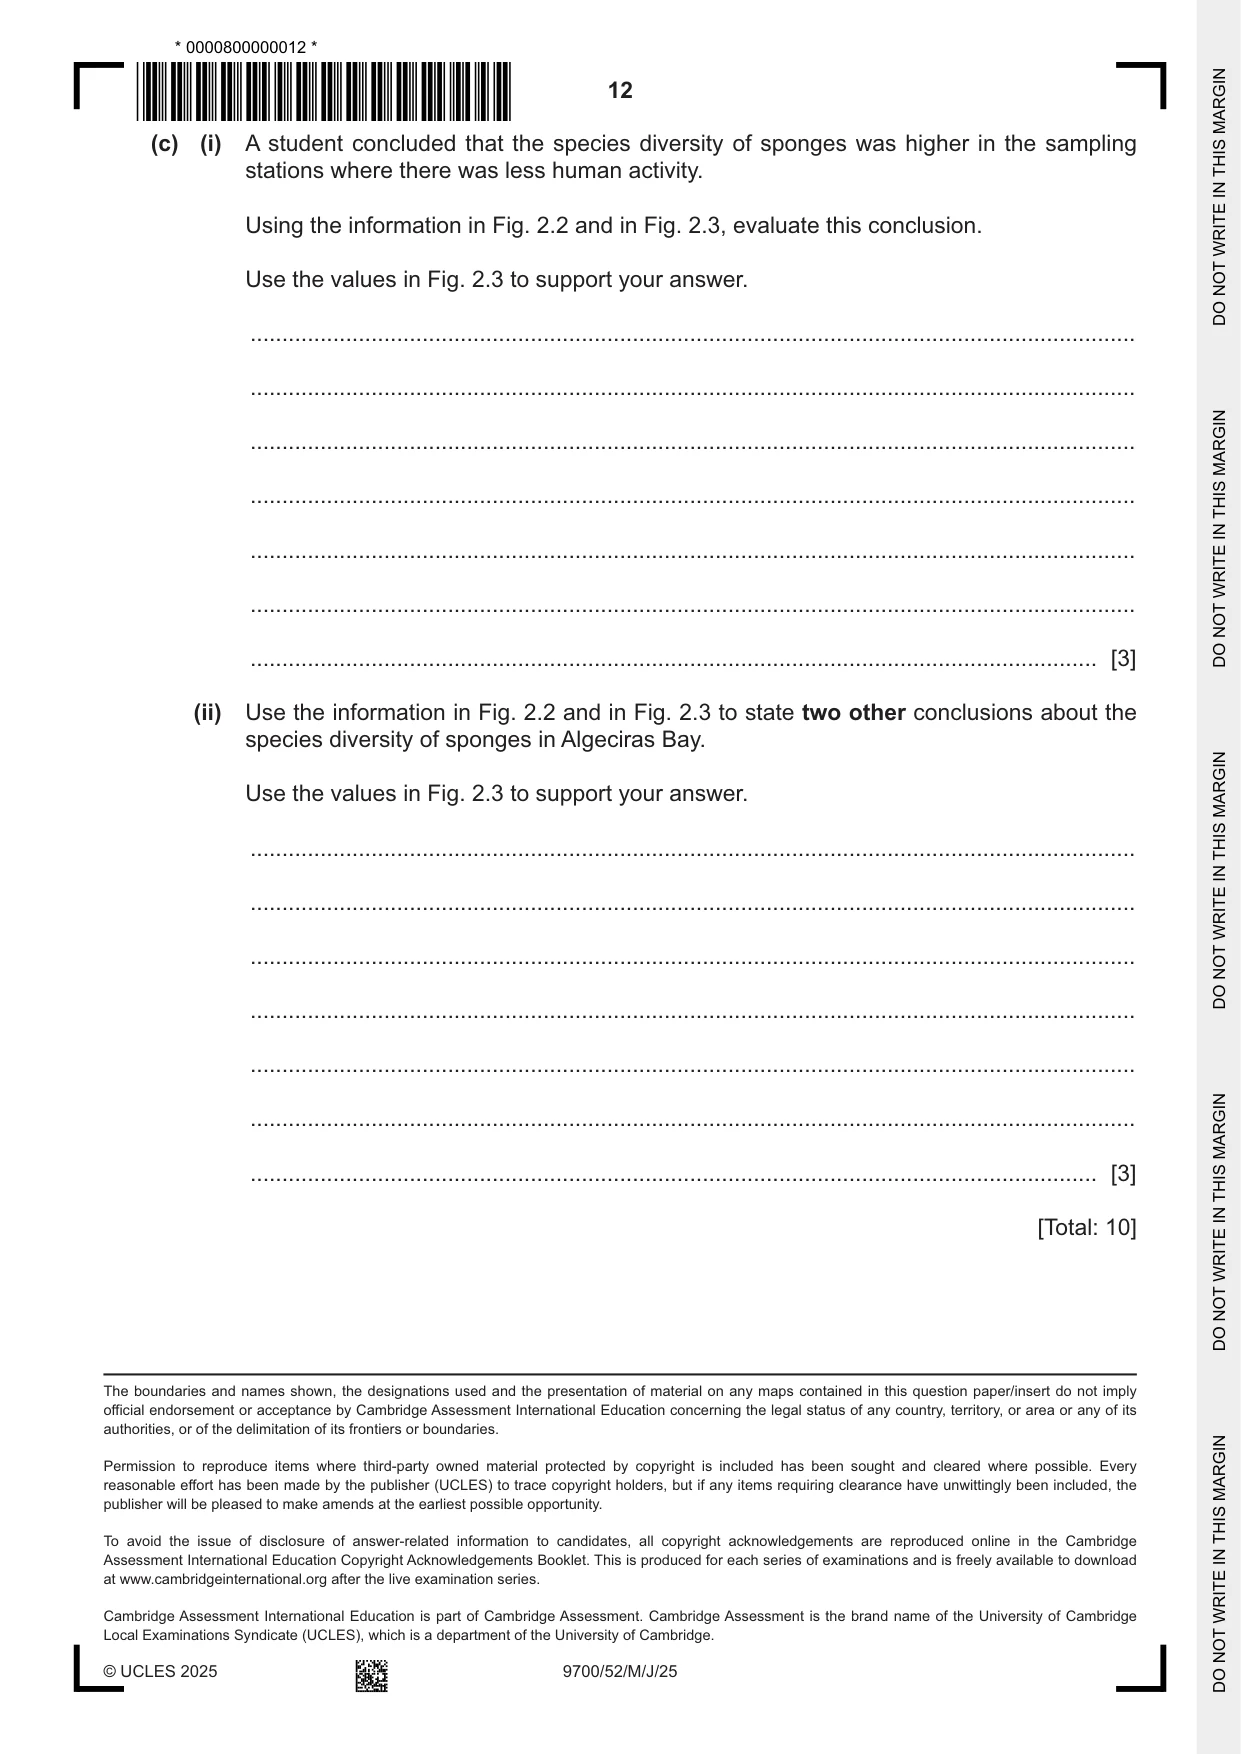
2 Sponges are immobile, aquatic animals that live on rocks and sediment at the bottom of salt water environments. Fig. 2.1 shows an example of a sponge, growing on the seabed, in a marine habitat. scuba diver photographing sponges sponge Fig. 2.1 There are many different species of sponge. Most species of sponge are sensitive to environmental stress. Human activity causes some environmental stress. Scientists sampled the marine habitats along a length of coastline in Algeciras Bay in southern Spain to study the species diversity of sponges. The scientists selected 12 sampling stations, A to L, as shown in Fig. 2.2. The scientists noted the land use or human activity along the coast next to each sampling station. Key to diagram: sampling type of land use station or human activity A natural habitat B natural habitat G H C tourist beach I F J D housing land E shipping port E K F tourist beach land G thermal power D L station CH oil industry Algeciras Bay I ship building and B marine habitat repairs A J tourist boats sampling stations K tourist boats L natural habitat Fig. 2.2 The sampling stations were chosen to compare the effects of land use or human activity on the species diversity of sponges in the bay. At each marine sampling station, the scientists: • placed permanent line transects, 50 m in length, on the seabed • photographed all sponges sighted at a distance of 1 m either side of the transect • sampled each transect for the same length of time • sampled each transect four times a year. (a) The scientists standardised some variables. State two other variables that the scientists should standardise in this investigation. ................................................................................................................................................... ................................................................................................................................................... ............................................................................................................................................. [2] (b) The scientists compared the species diversity of sponges between different sampling stations using an index of diversity known as beta diversity. The higher the beta diversity index, the higher the species diversity at a sampling station. Fig. 2.3 shows a graph of the beta diversity index for each sampling station. 1.7 1.6 1.5 1.4 1.3 beta diversity 1.2 index 1.1 1.0 0.9 0.8 0.7 0.6 A B C D E F G H I J K L sampling station Fig. 2.3 A simplified formula for beta diversity is shown: n beta diversity = x – 1 Key to symbols: n = the number of sponge species recorded at a sampling station x = the mean number of sponge species across all sampling stations At sampling station A, 37 sponge species were recorded (n = 37). Use Fig. 2.3 and the formula for beta diversity to calculate the mean number of sponge species across all sampling stations (x). Show your working. Write your answer to the nearest whole number.
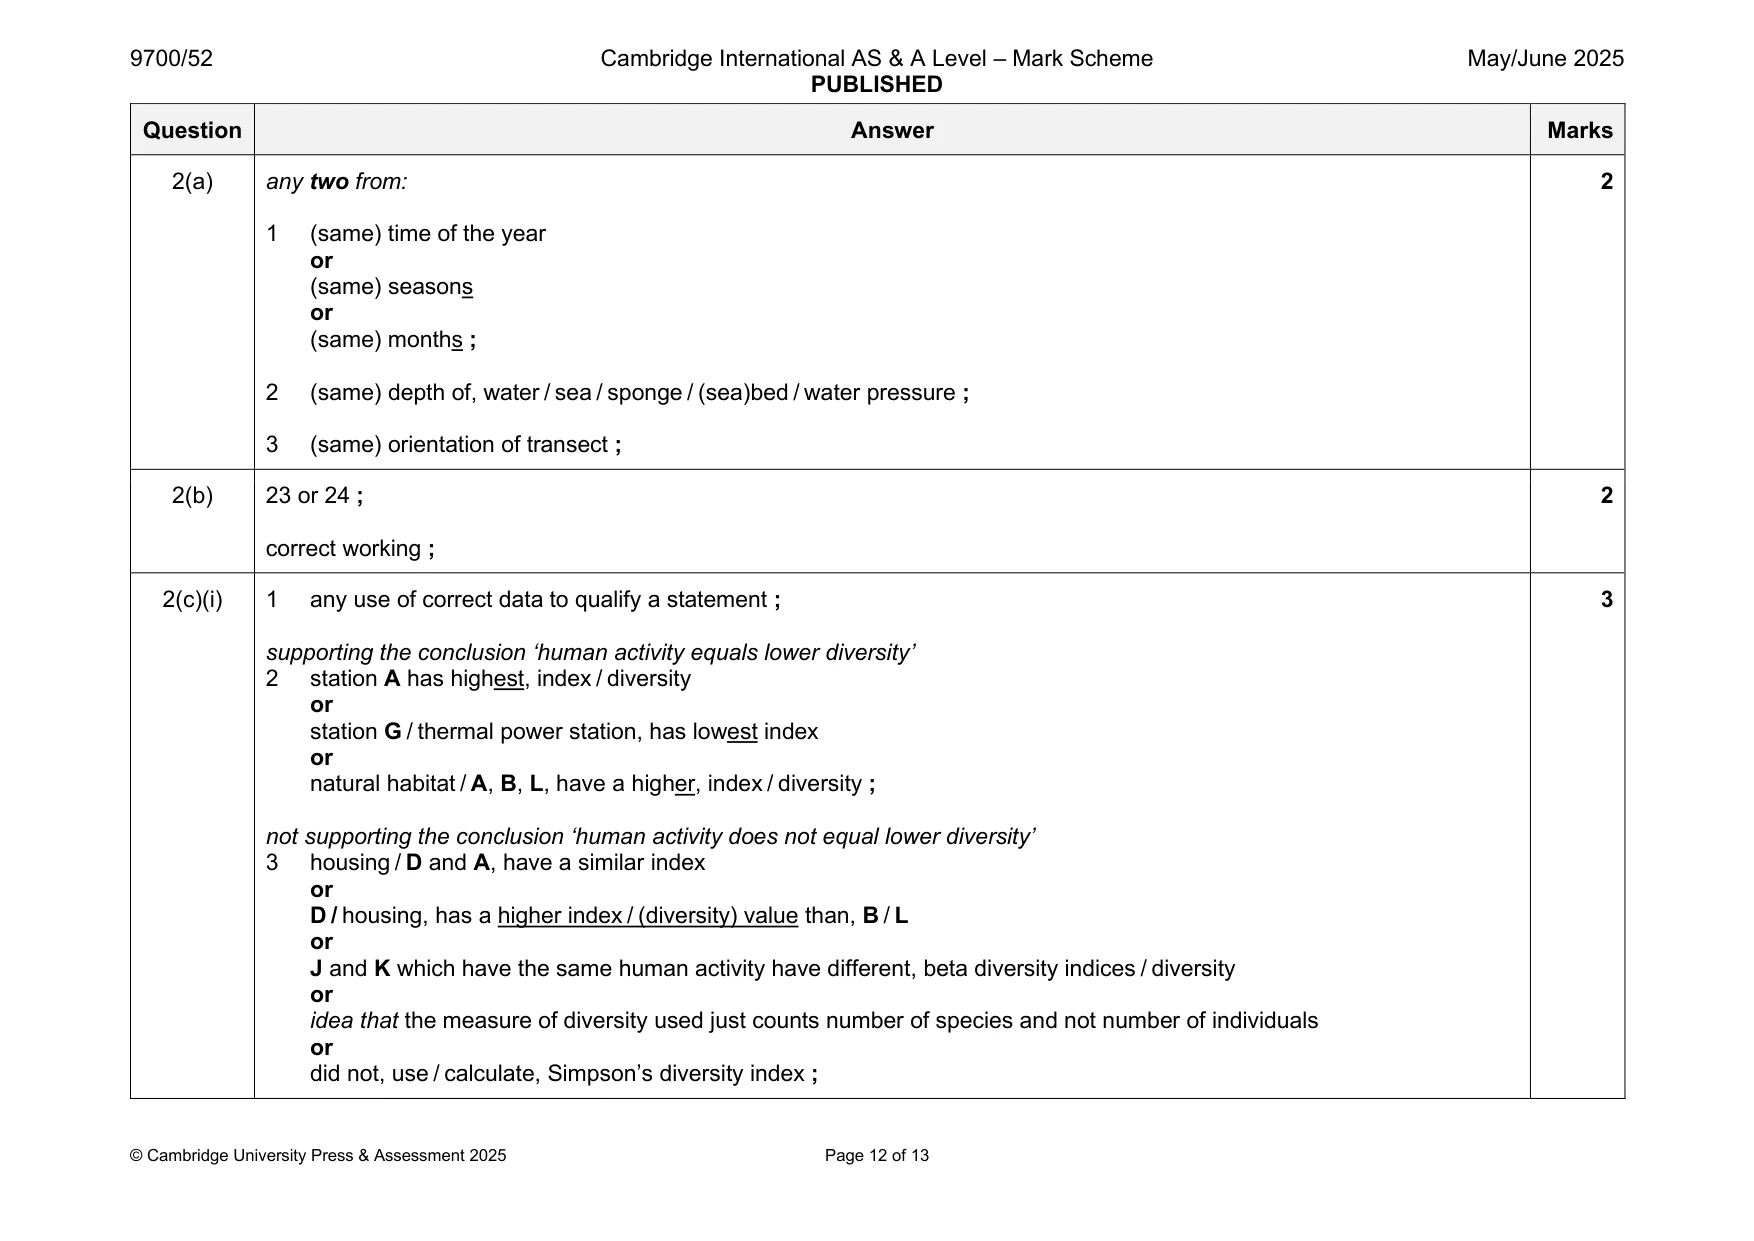
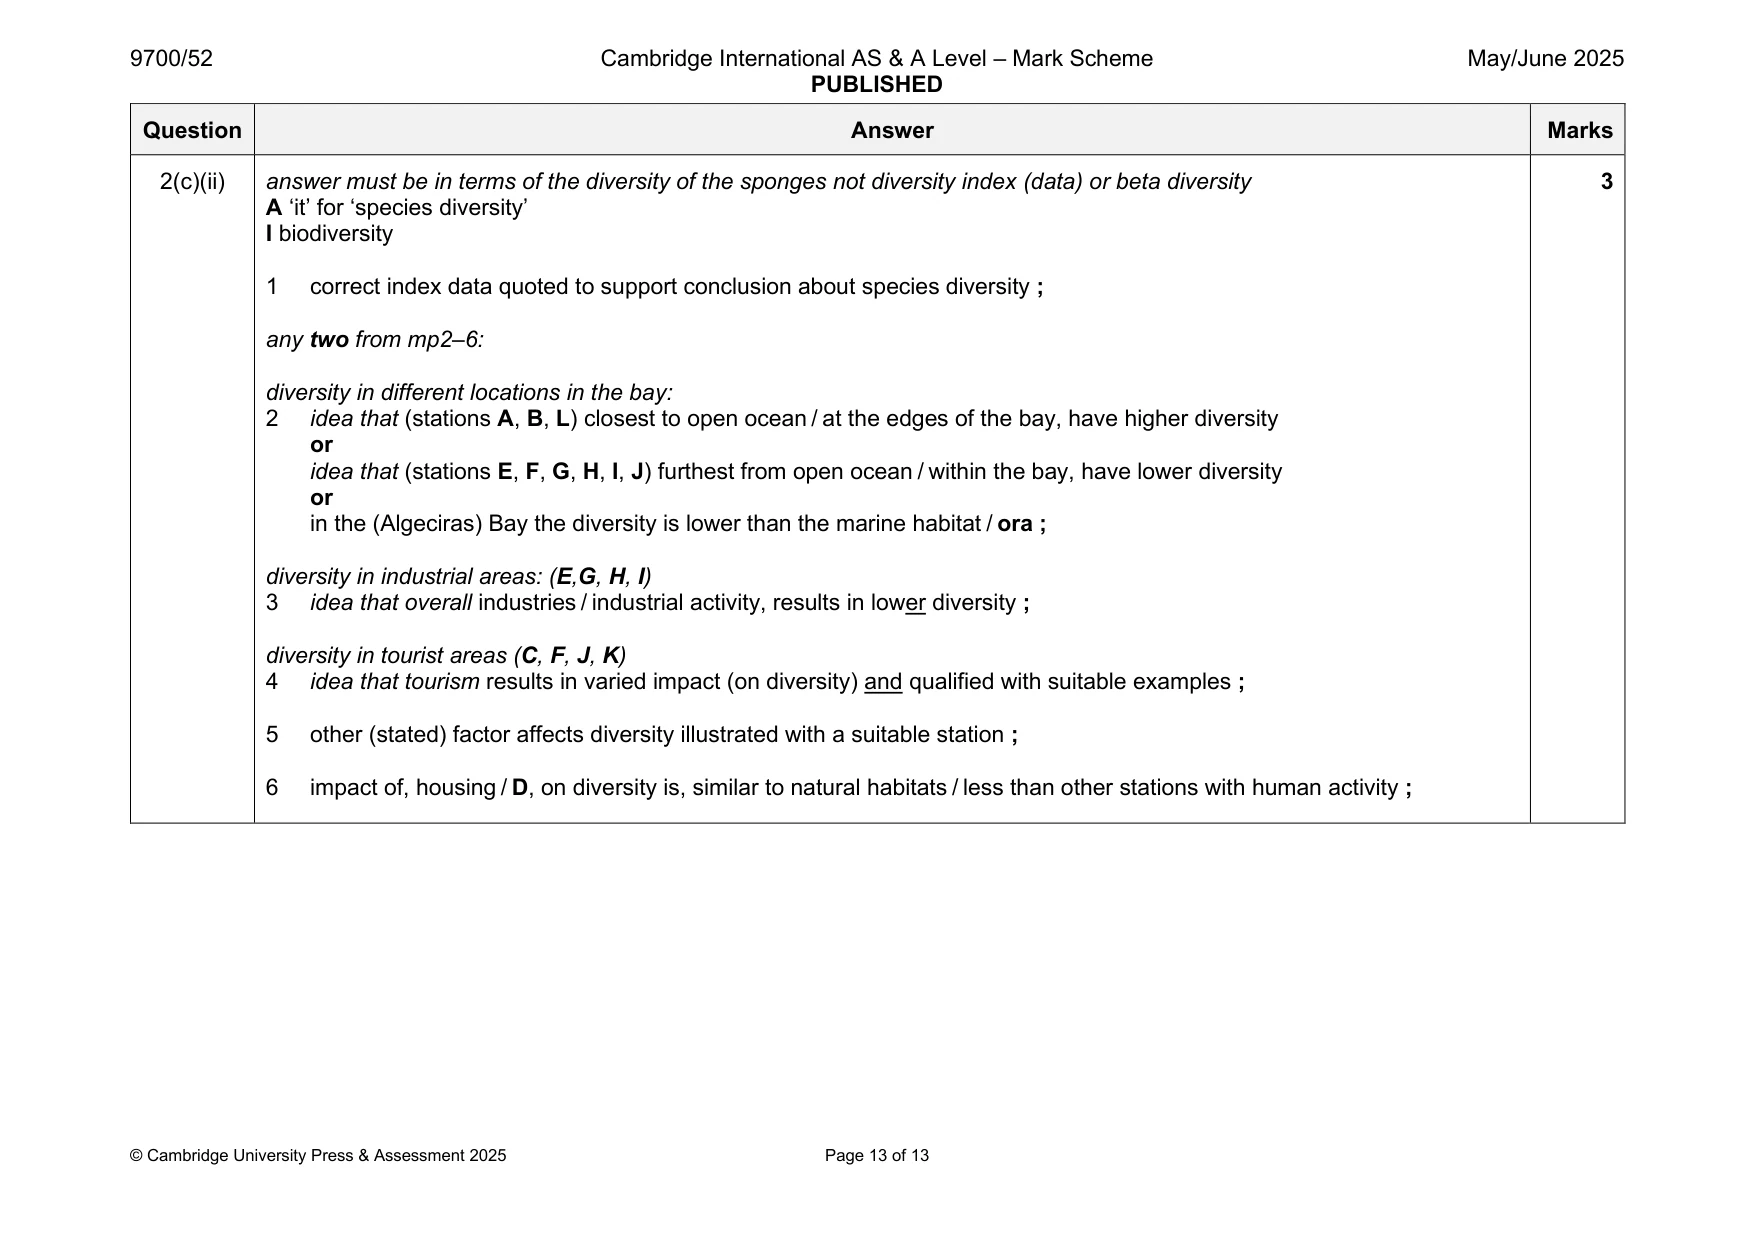
Mark scheme: 2(a) any two from: 2 1 (same) time of the year or (same) seasons or (same) months ; 2 (same) depth of, water / sea / sponge / (sea)bed / water pressure ; 3 (same) orientation of transect ; 2(b) 23 or 24 ; 2 correct working ; 2(c)(i) 1 any use of correct data to qualify a statement ; 3 supporting the conclusion ‘human activity equals lower diversity’ 2 station A has highest, index / diversity or station G / thermal power station, has lowest index or natural habitat / A, B, L, have a higher, index / diversity ; not supporting the conclusion ‘human activity does not equal lower diversity’ 3 housing / D and A, have a similar index or D / housing, has a higher index / (diversity) value than, B / L or J and K which have the same human activity have different, beta diversity indices / diversity or idea that the measure of diversity used just counts number of species and not number of individuals or did not, use / calculate, Simpson’s diversity index ; 2(c)(ii) answer must be in terms of the diversity of the sponges not diversity index (data) or beta diversity 3 A ‘it’ for ‘species diversity’ I biodiversity 1 correct index data quoted to support conclusion about species diversity ; any two from mp2–6: diversity in different locations in the bay: 2 idea that (stations A, B, L) closest to open ocean / at the edges of the bay, have higher diversity or idea that (stations E, F, G, H, I, J) furthest from open ocean / within the bay, have lower diversity or in the (Algeciras) Bay the diversity is lower than the marine habitat / ora ; diversity in industrial areas: (E,G, H, I) 3 idea that overall industries / industrial activity, results in lower diversity ; diversity in tourist areas (C, F, J, K) 4 idea that tourism results in varied impact (on diversity) and qualified with suitable examples ; 5 other (stated) factor affects diversity illustrated with a suitable station ; 6 impact of, housing / D, on diversity is, similar to natural habitats / less than other stations with human activity ;
What was in this paper
The subtopics covered by these 2 questions, and how many questions each got. Open one in a new tab to see every Cambridge question on it.
What you needed in this session
Cambridge’s own grade thresholds for 2025 May/June, Paper 5 · Variant 2. A higher threshold means an easier paper — the bar moves with how the cohort did.