Cambridge A Level Biology 9700 — 2023 Feb/March Paper 5 · Variant 2
9700/52/F/M/23 · 2 questions · 30 marks · ≈34 min
The question paper and its mark scheme, free to read here and free to download. This is Cambridge’s own paper, exactly as it was sat.
Question paper20 pages



Mark scheme10 pages
Answers below. Sit the paper first if you are practising.
Questions as text
Q1 · Potatoes are underground organs made by the potato plant, Solanum tuberosum
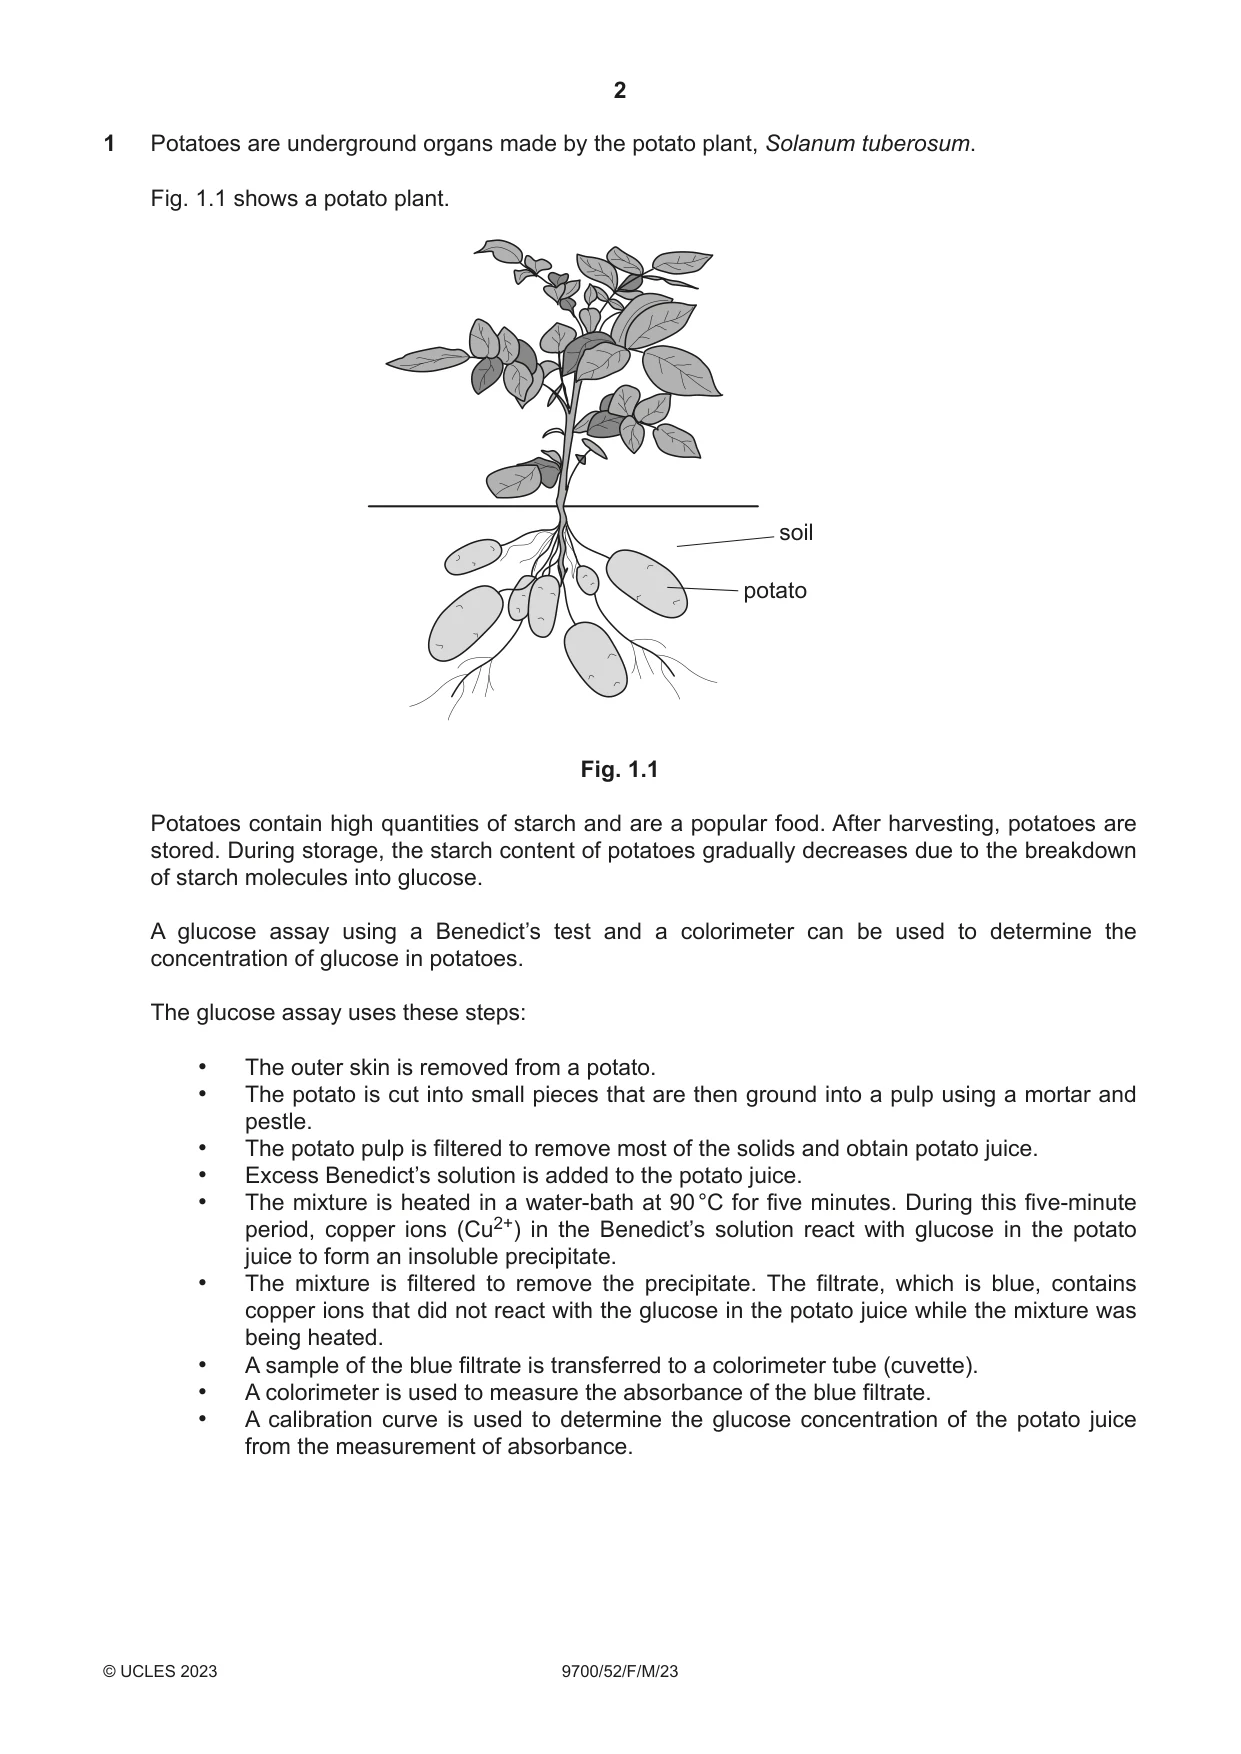
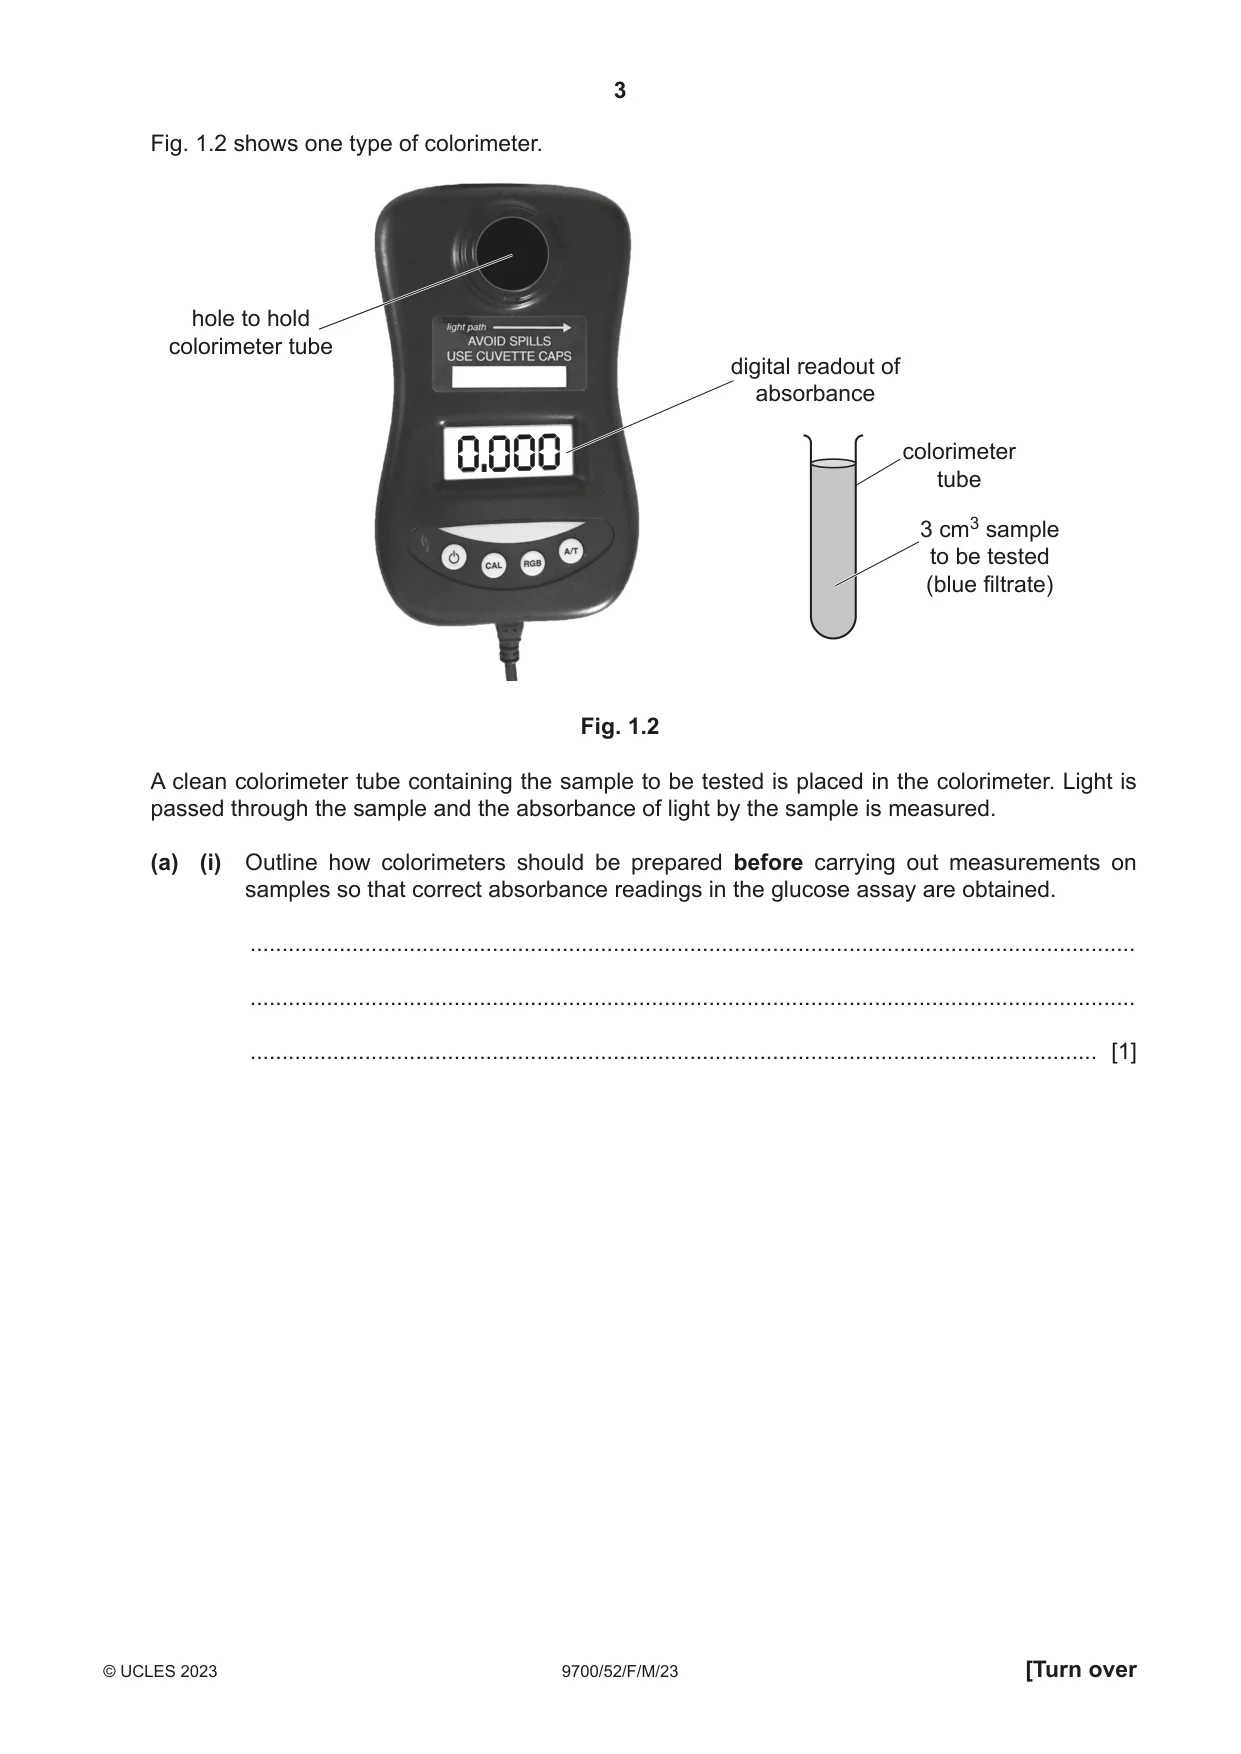
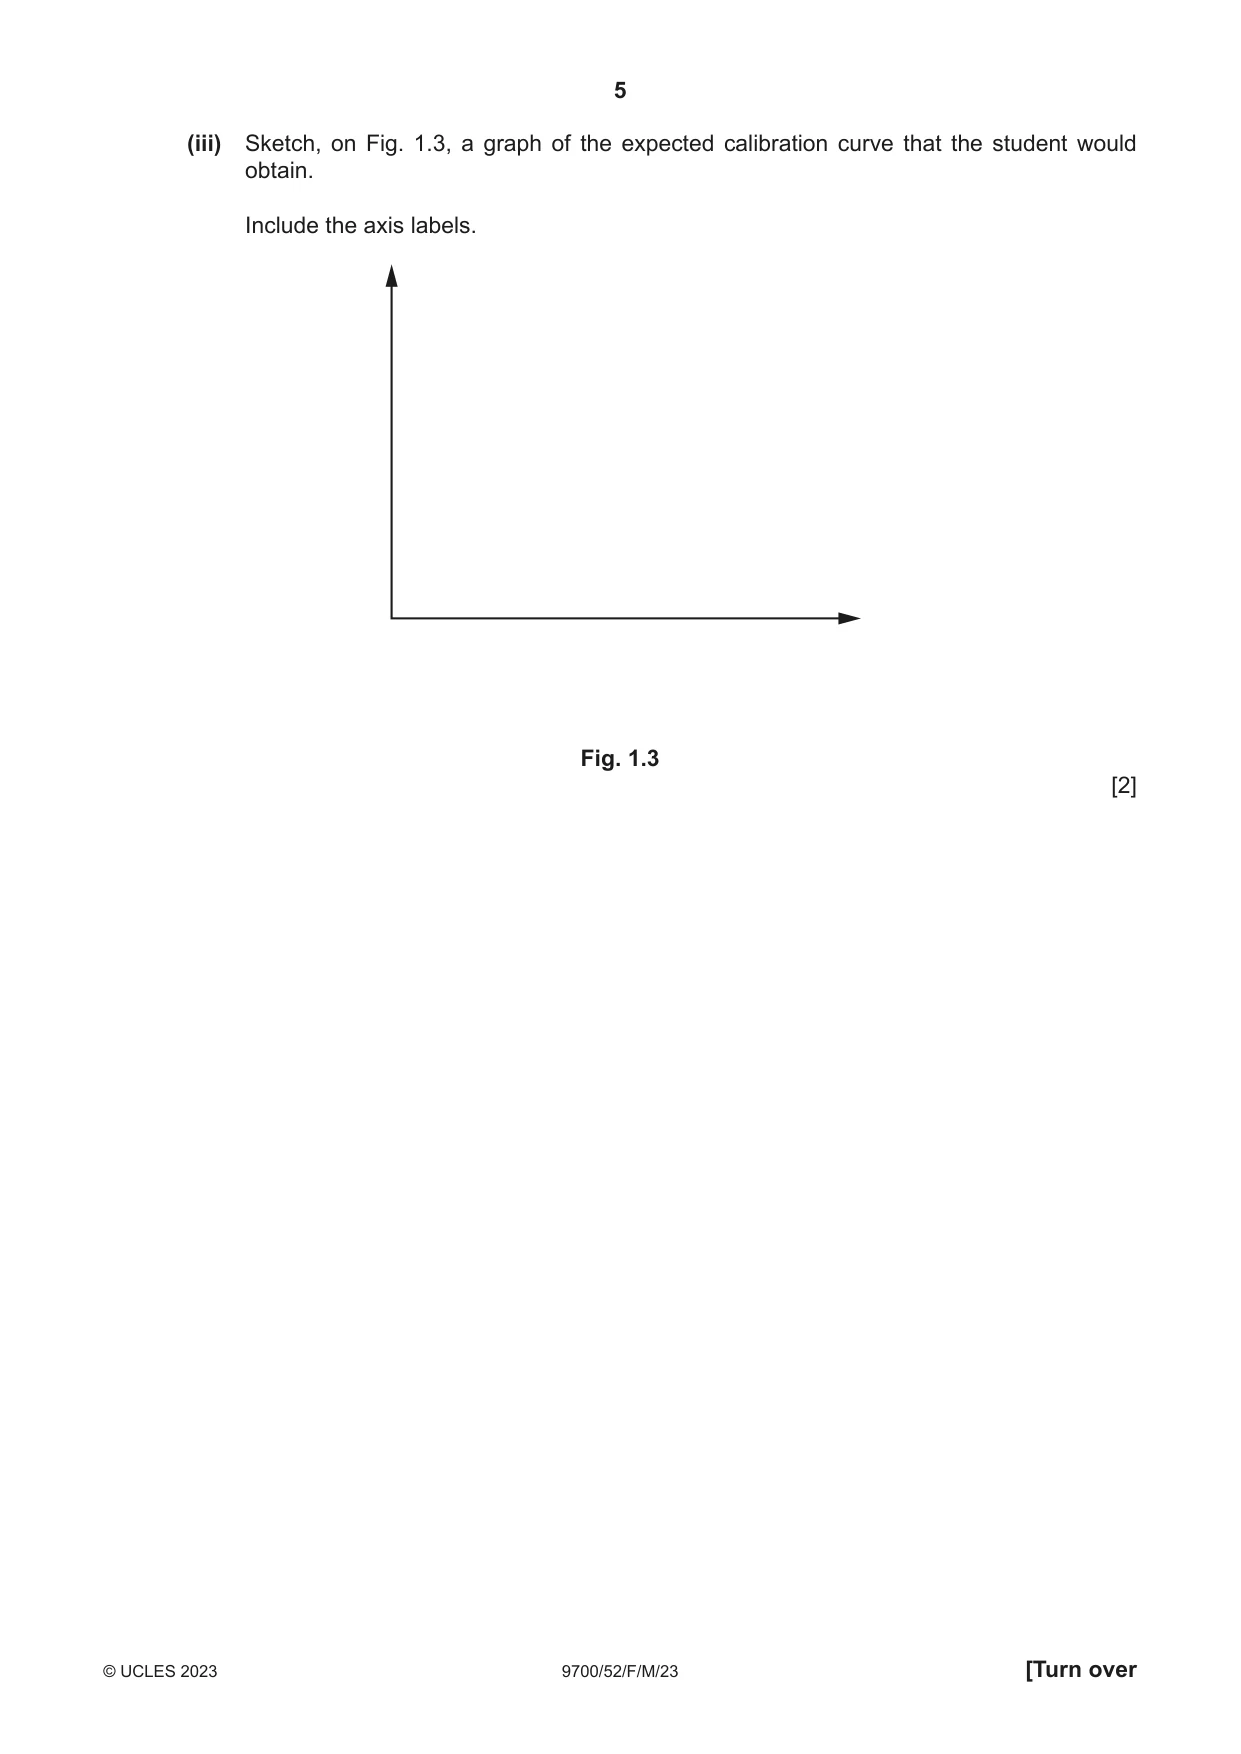
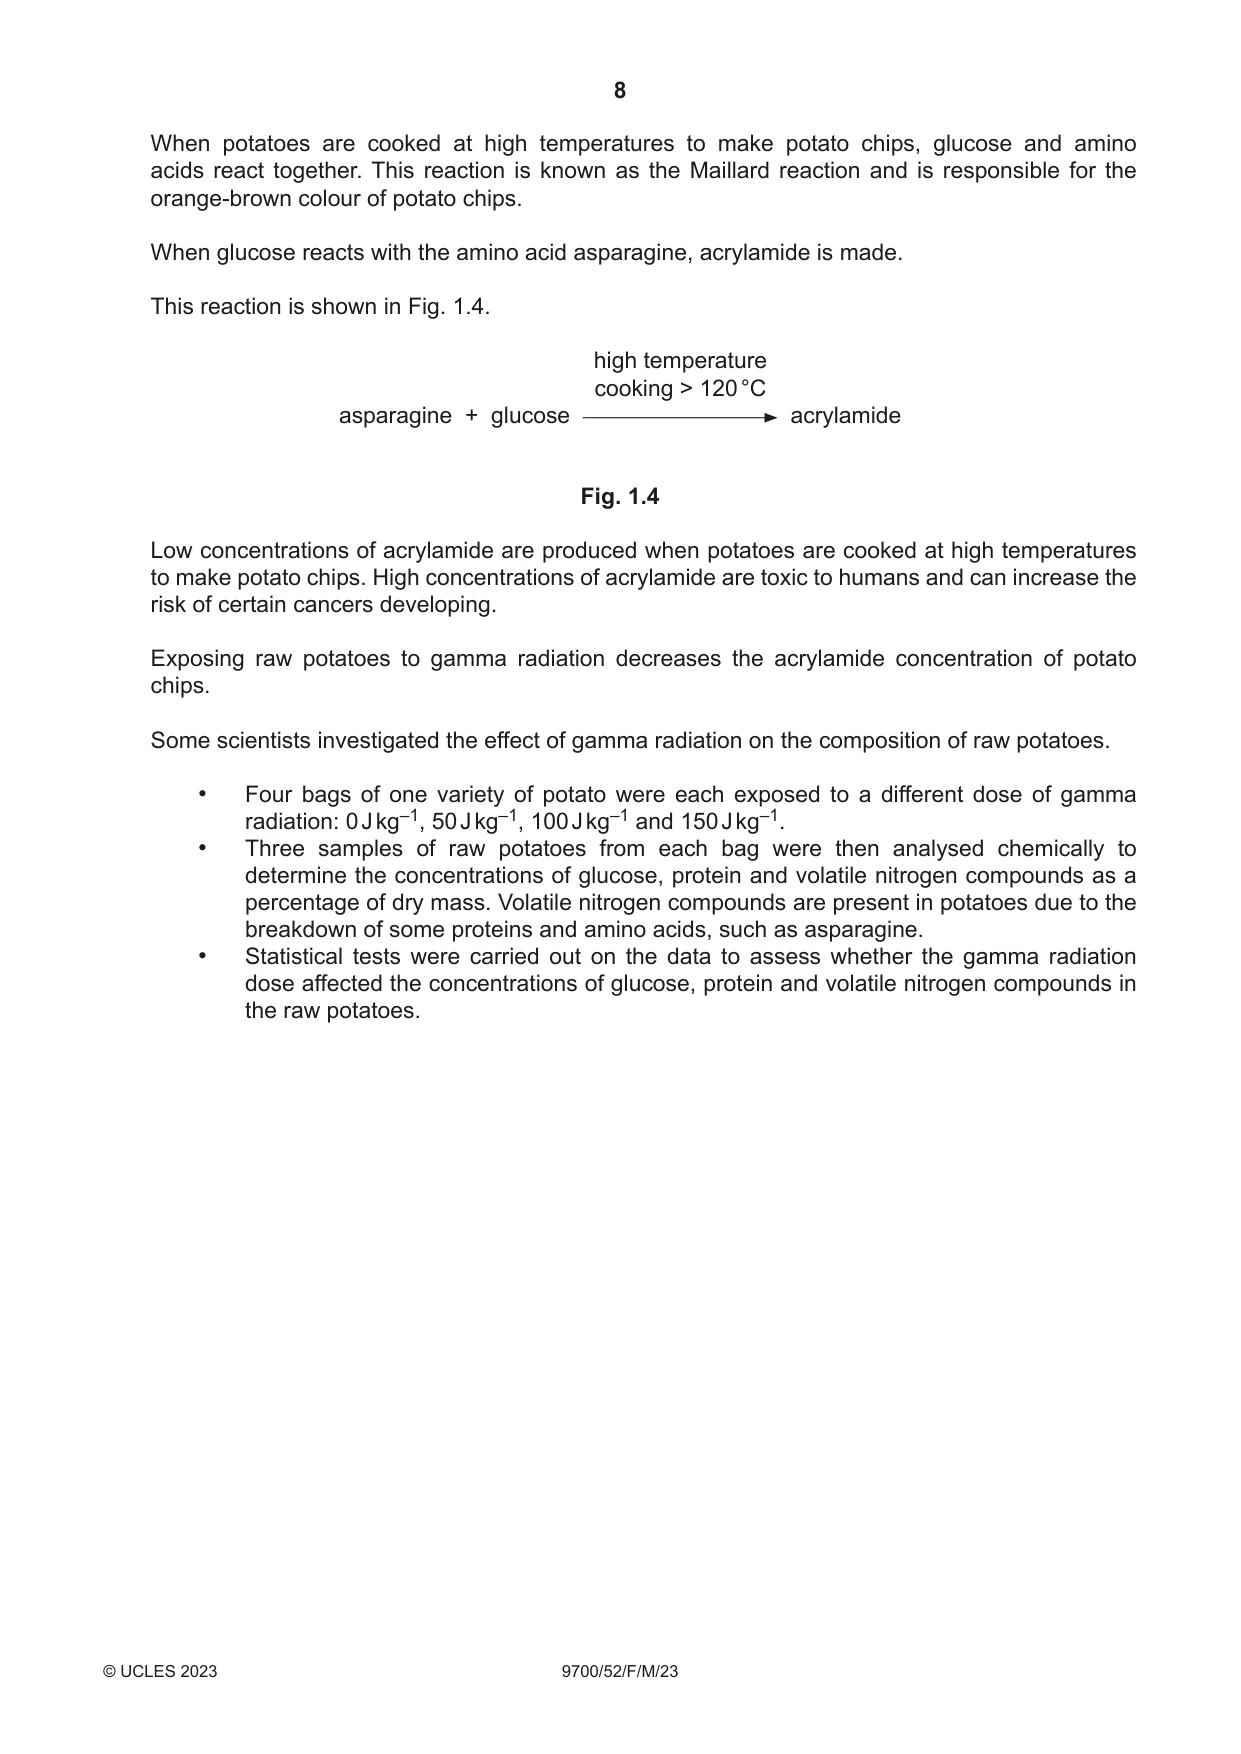
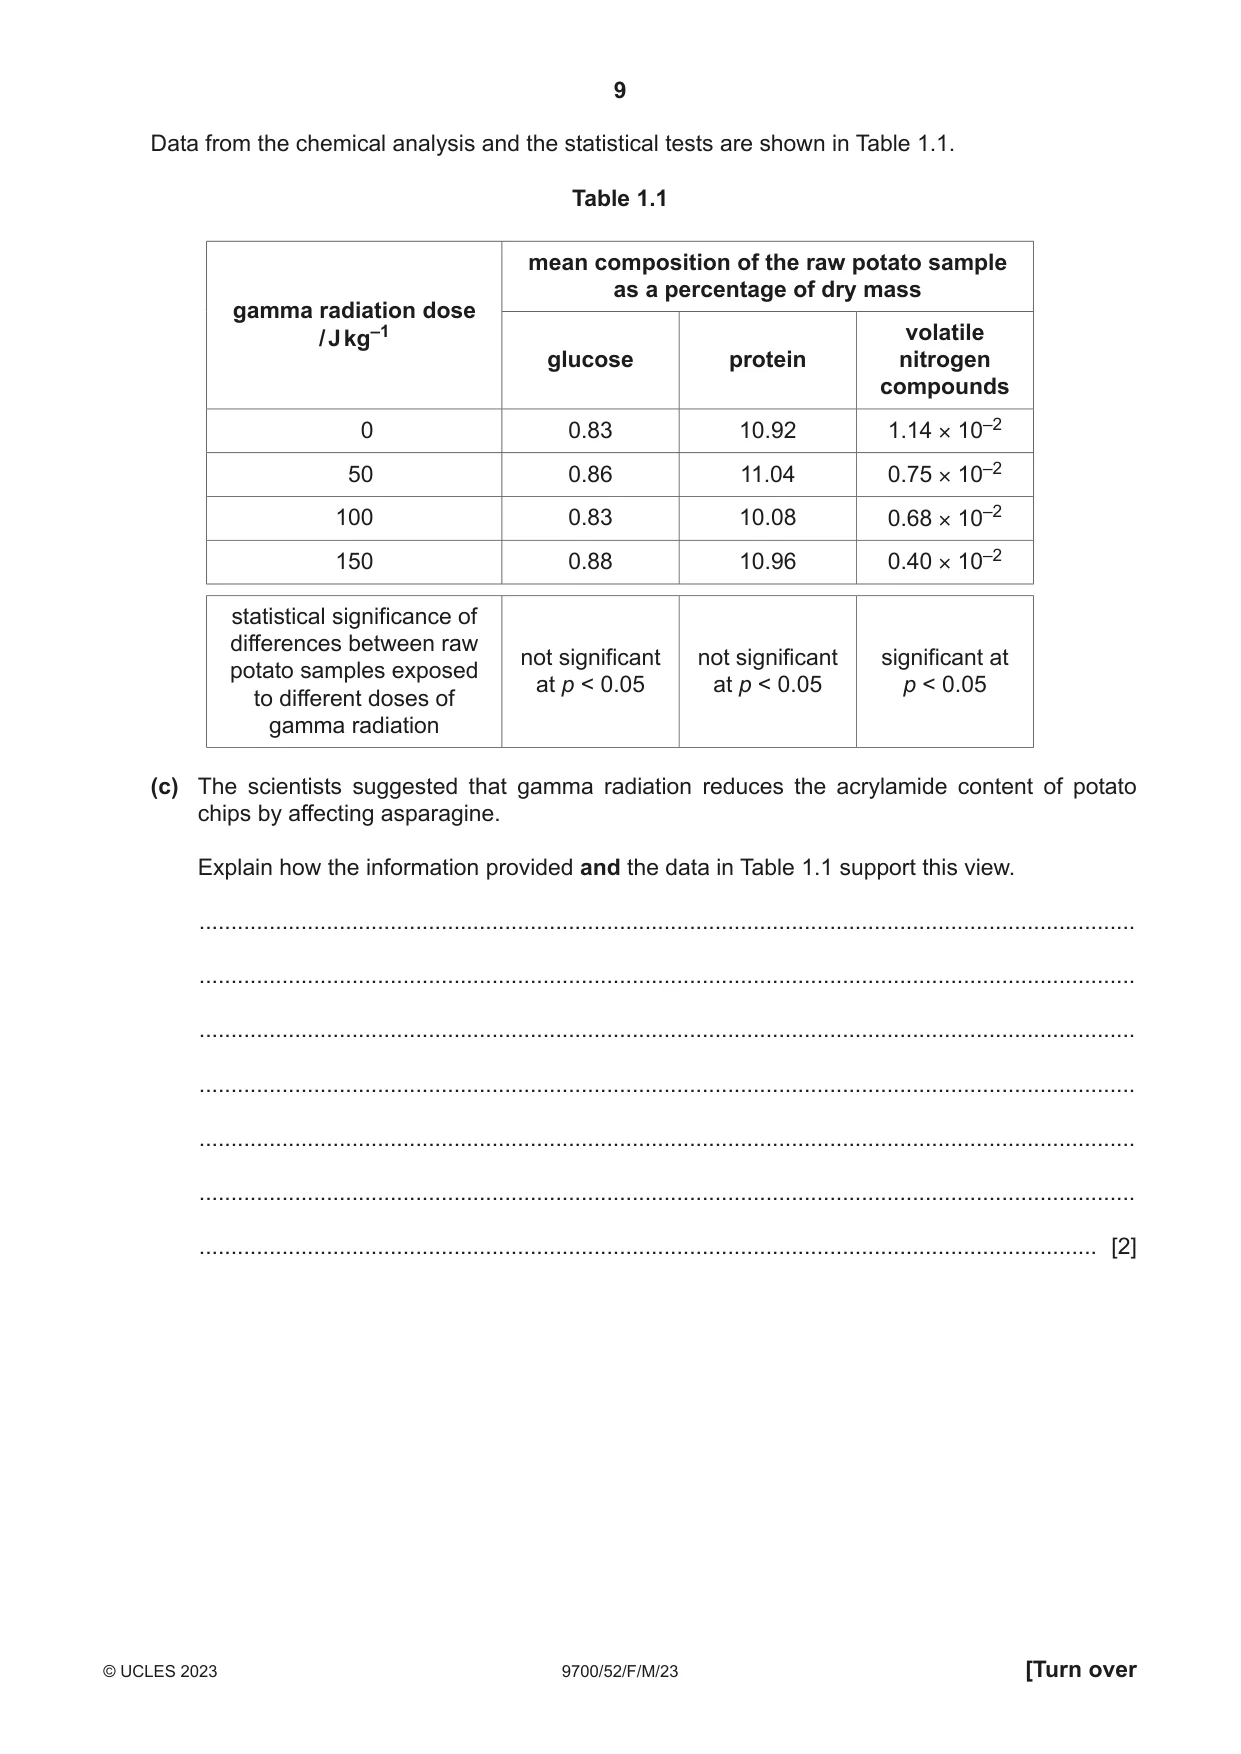
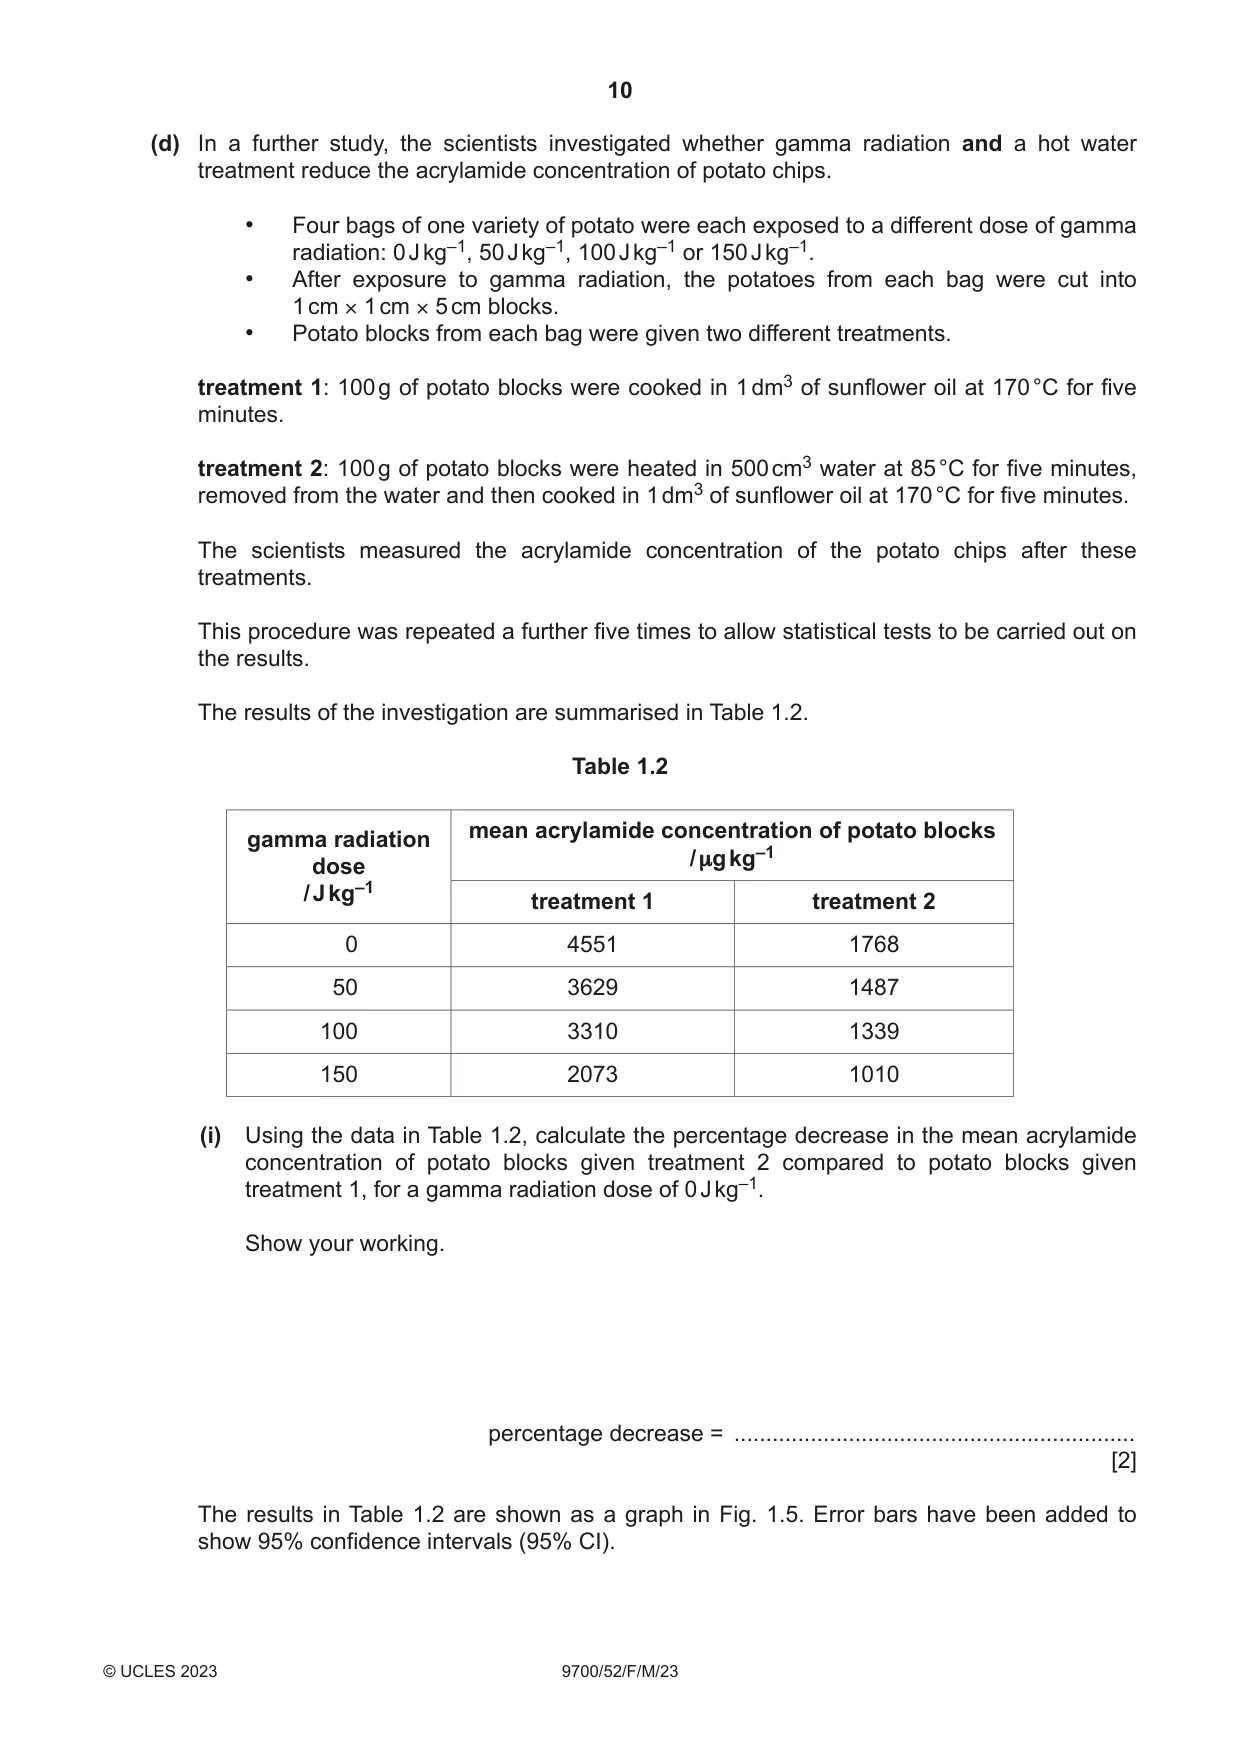
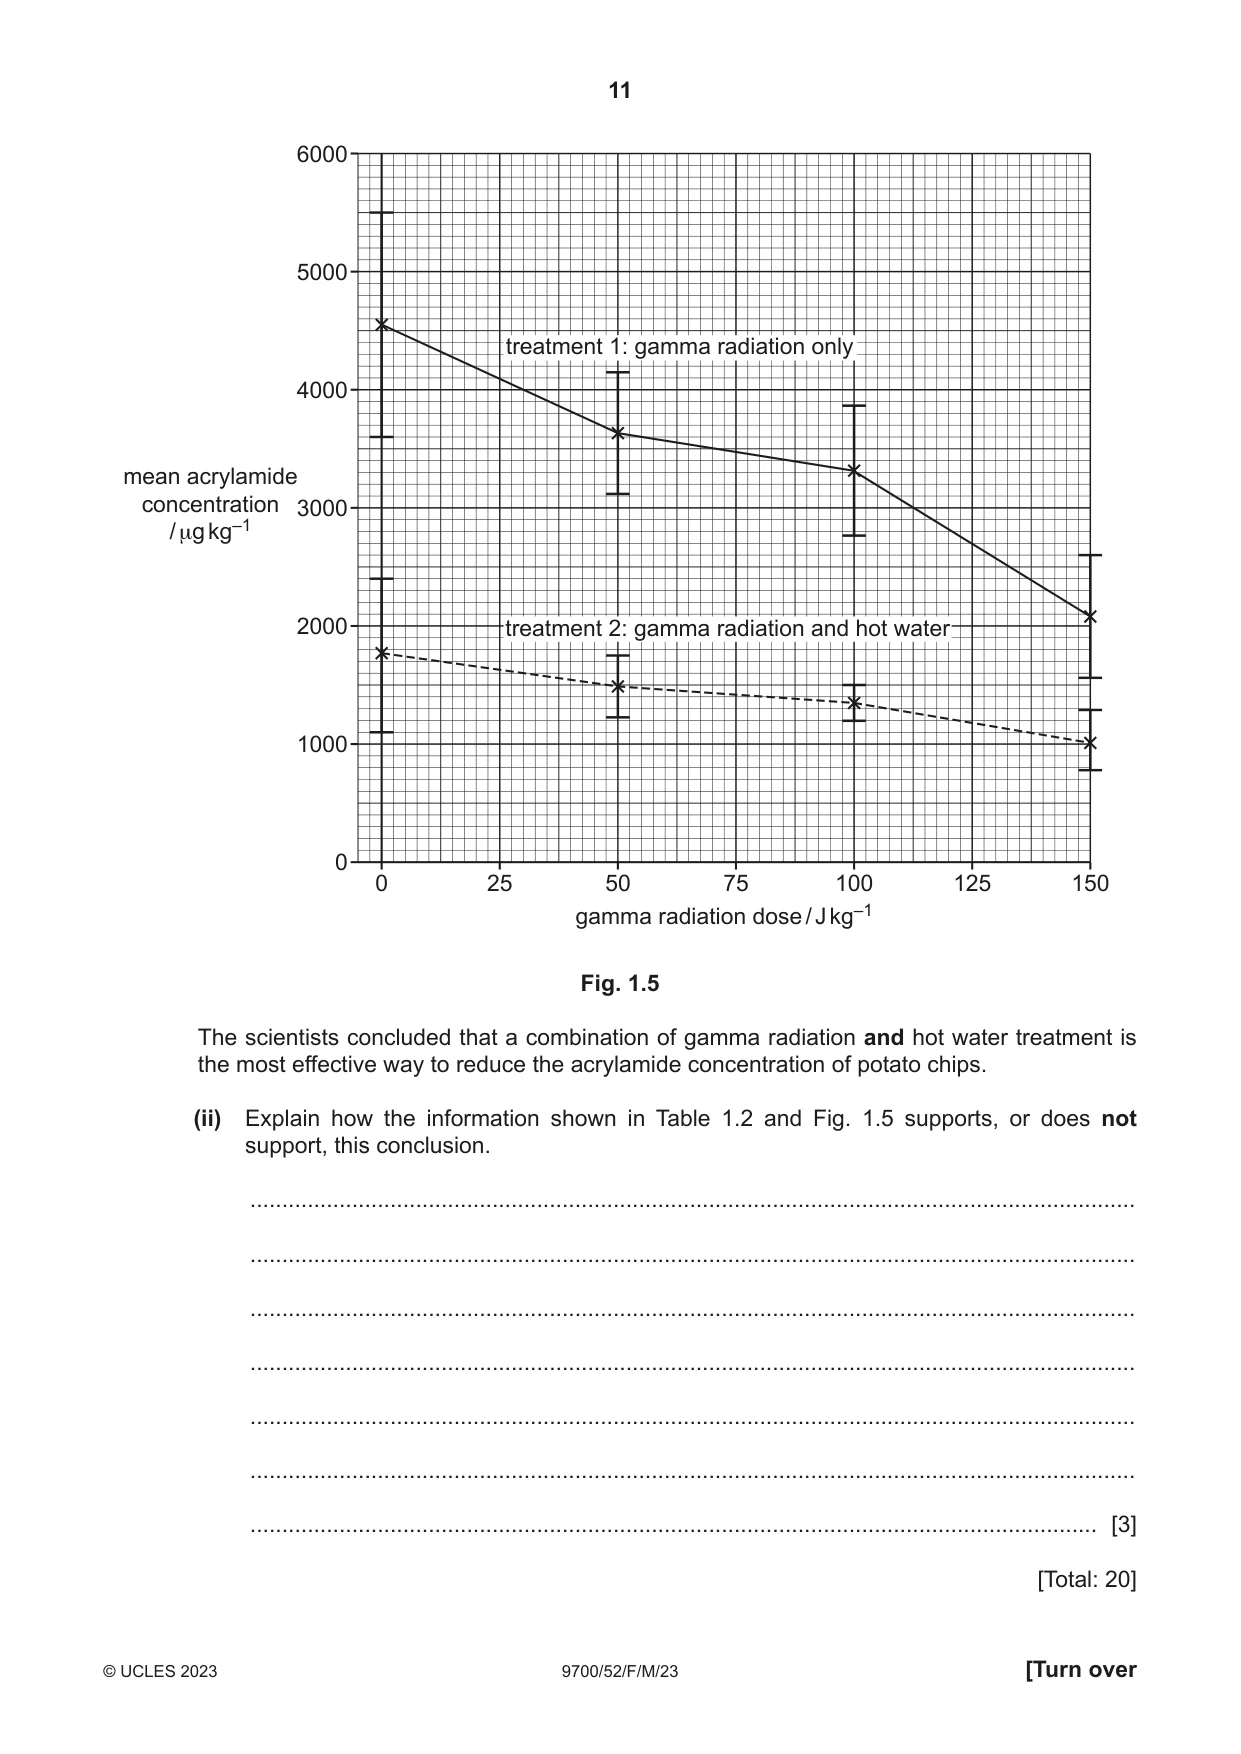
1 Potatoes are underground organs made by the potato plant, Solanum tuberosum. Fig. 1.1 shows a potato plant. soil potato Fig. 1.1 Potatoes contain high quantities of starch and are a popular food. After harvesting, potatoes are stored. During storage, the starch content of potatoes gradually decreases due to the breakdown of starch molecules into glucose. A glucose assay using a Benedict’s test and a colorimeter can be used to determine the concentration of glucose in potatoes. The glucose assay uses these steps: • The outer skin is removed from a potato. • The potato is cut into small pieces that are then ground into a pulp using a mortar and pestle. • The potato pulp is filtered to remove most of the solids and obtain potato juice. • Excess Benedict’s solution is added to the potato juice. • The mixture is heated in a water-bath at 90 °C for five minutes. During this five-minute period, copper ions (Cu2+) in the Benedict’s solution react with glucose in the potato juice to form an insoluble precipitate. • The mixture is filtered to remove the precipitate. The filtrate, which is blue, contains copper ions that did not react with the glucose in the potato juice while the mixture was being heated. • A sample of the blue filtrate is transferred to a colorimeter tube (cuvette). • A colorimeter is used to measure the absorbance of the blue filtrate. • A calibration curve is used to determine the glucose concentration of the potato juice from the measurement of absorbance. Fig. 1.2 shows one type of colorimeter. hole to hold colorimeter tube digital readout of absorbance colorimeter 0.000 tube 3 cm3 sample to be tested (blue filtrate) Fig. 1.2 A clean colorimeter tube containing the sample to be tested is placed in the colorimeter. Light is passed through the sample and the absorbance of light by the sample is measured. (a) (i) Outline how colorimeters should be prepared before carrying out measurements on samples so that correct absorbance readings in the glucose assay are obtained. ........................................................................................................................................... ........................................................................................................................................... ..................................................................................................................................... [1] To determine the concentration of glucose in potato juice using the glucose assay, a calibration curve needs to be produced. This involves using the glucose assay to obtain absorbance readings for standard glucose solutions of known concentrations. (ii) A student was given a 2.0% stock solution of glucose from which to prepare a range of standard glucose solutions of known concentrations. State the glucose concentrations the student could use to produce a calibration curve and describe how 20 cm3 of each solution should be prepared by proportional dilution of the 2.0% stock solution of glucose. You may use a table to show your answer. glucose concentrations to use: .......................................................................................... how to prepare: ........................................................................................................................................... ........................................................................................................................................... ........................................................................................................................................... ........................................................................................................................................... ........................................................................................................................................... ........................................................................................................................................... ........................................................................................................................................... [3] (iii) Sketch, on Fig. 1.3, a graph of the expected calibration curve that the student would obtain. Include the axis labels. Fig. 1.3 [2] (b) The student decided to investigate the effect of storage time on the glucose concentration of potatoes. (i) Identify the dependent variable in this investigation. ..................................................................................................................................... [1] (ii) The student was provided with freshly harvested potatoes, standard laboratory apparatus and a colorimeter. Describe a method, using the glucose assay, that the student could use to investigate the effect of storage time on the glucose concentration of potatoes. Your method should be set out in a logical order and be detailed enough to allow another person to follow it. Details of how to carry out the glucose assay and how to prepare and use the colorimeter should not be included. ........................................................................................................................................... ........................................................................................................................................... ........................................................................................................................................... ........................................................................................................................................... ........................................................................................................................................... ........................................................................................................................................... ........................................................................................................................................... ........................................................................................................................................... ........................................................................................................................................... ........................................................................................................................................... ........................................................................................................................................... ........................................................................................................................................... ........................................................................................................................................... ........................................................................................................................................... ........................................................................................................................................... ........................................................................................................................................... ........................................................................................................................................... ........................................................................................................................................... ..................................................................................................................................... [6] Question 1 continues on page 8. When potatoes are cooked at high temperatures to make potato chips, glucose and amino acids react together. This reaction is known as the Maillard reaction and is responsible for the orange-brown colour of potato chips. When glucose reacts with the amino acid asparagine, acrylamide is made. This reaction is shown in Fig. 1.4. high temperature cooking > 120 °C asparagine + glucose acrylamide Fig. 1.4 Low concentrations of acrylamide are produced when potatoes are cooked at high temperatures to make potato chips. High concentrations of acrylamide are toxic to humans and can increase the risk of certain cancers developing. Exposing raw potatoes to gamma radiation decreases the acrylamide concentration of potato chips. Some scientists investigated the effect of gamma radiation on the composition of raw potatoes. • Four bags of one variety of potato were each exposed to a different dose of gamma radiation: 0 J kg–1, 50 J kg–1, 100 J kg–1 and 150 J kg–1. • Three samples of raw potatoes from each bag were then analysed chemically to determine the concentrations of glucose, protein and volatile nitrogen compounds as a percentage of dry mass. Volatile nitrogen compounds are present in potatoes due to the breakdown of some proteins and amino acids, such as asparagine. • Statistical tests were carried out on the data to assess whether the gamma radiation dose affected the concentrations of glucose, protein and volatile nitrogen compounds in the raw potatoes. Data from the chemical analysis and the statistical tests are shown in Table 1.1. Table 1.1 mean composition of the raw potato sample as a percentage of dry mass gamma radiation dose / J kg–1 volatile glucose protein nitrogen compounds 0 0.83 10.92 1.14 × 10⁻² 50 0.86 11.04 0.75 × 10⁻² 100 0.83 10.08 0.68 × 10⁻² 150 0.88 10.96 0.40 × 10⁻² statistical significance of differences between raw not significant not significant significant at potato samples exposed at p < 0.05 at p < 0.05 p < 0.05 to different doses of gamma radiation (c) The scientists suggested that gamma radiation reduces the acrylamide content of potato chips by affecting asparagine. Explain how the information provided and the data in Table 1.1 support this view. ................................................................................................................................................... ................................................................................................................................................... ................................................................................................................................................... ................................................................................................................................................... ................................................................................................................................................... ................................................................................................................................................... ............................................................................................................................................. [2] (d) In a further study, the scientists investigated whether gamma radiation and a hot water treatment reduce the acrylamide concentration of potato chips. • Four bags of one variety of potato were each exposed to a different dose of gamma radiation: 0 J kg–1, 50 J kg–1, 100 J kg–1 or 150 J kg–1. • After exposure to gamma radiation, the potatoes from each bag were cut into 1 cm × 1 cm × 5 cm blocks. • Potato blocks from each bag were given two different treatments. treatment 1: 100 g of potato blocks were cooked in 1 dm3 of sunflower oil at 170 °C for five minutes. treatment 2: 100 g of potato blocks were heated in 500 cm3 water at 85 °C for five minutes, removed from the water and then cooked in 1 dm3 of sunflower oil at 170 °C for five minutes. The scientists measured the acrylamide concentration of the potato chips after these treatments. This procedure was repeated a further five times to allow statistical tests to be carried out on the results. The results of the investigation are summarised in Table 1.2. Table 1.2 mean acrylamide concentration of potato blocks gamma radiation / µg kg–1 dose / J kg–1 treatment 1 treatment 2 0 4551 1768 50 3629 1487 100 3310 1339 150 2073 1010 (i) Using the data in Table 1.2, calculate the percentage decrease in the mean acrylamide concentration of potato blocks given treatment 2 compared to potato blocks given treatment 1, for a gamma radiation dose of 0 J kg–1. Show your working. percentage decrease = ............................................................... [2] The results in Table 1.2 are shown as a graph in Fig. 1.5. Error bars have been added to show 95% confidence intervals (95% CI). 6000 5000 treatment 1: gamma radiation only 4000 mean acrylamide concentration 3000 / μg kg–1 2000 treatment 2: gamma radiation and hot water 1000 0 0 25 50 75 100 125 150 gamma radiation dose / J kg–1 Fig. 1.5 The scientists concluded that a combination of gamma radiation and hot water treatment is the most effective way to reduce the acrylamide concentration of potato chips. (ii) Explain how the information shown in Table 1.2 and Fig. 1.5 supports, or does not support, this conclusion. ........................................................................................................................................... ........................................................................................................................................... ........................................................................................................................................... ........................................................................................................................................... ........................................................................................................................................... ........................................................................................................................................... ..................................................................................................................................... [3] [Total: 20]
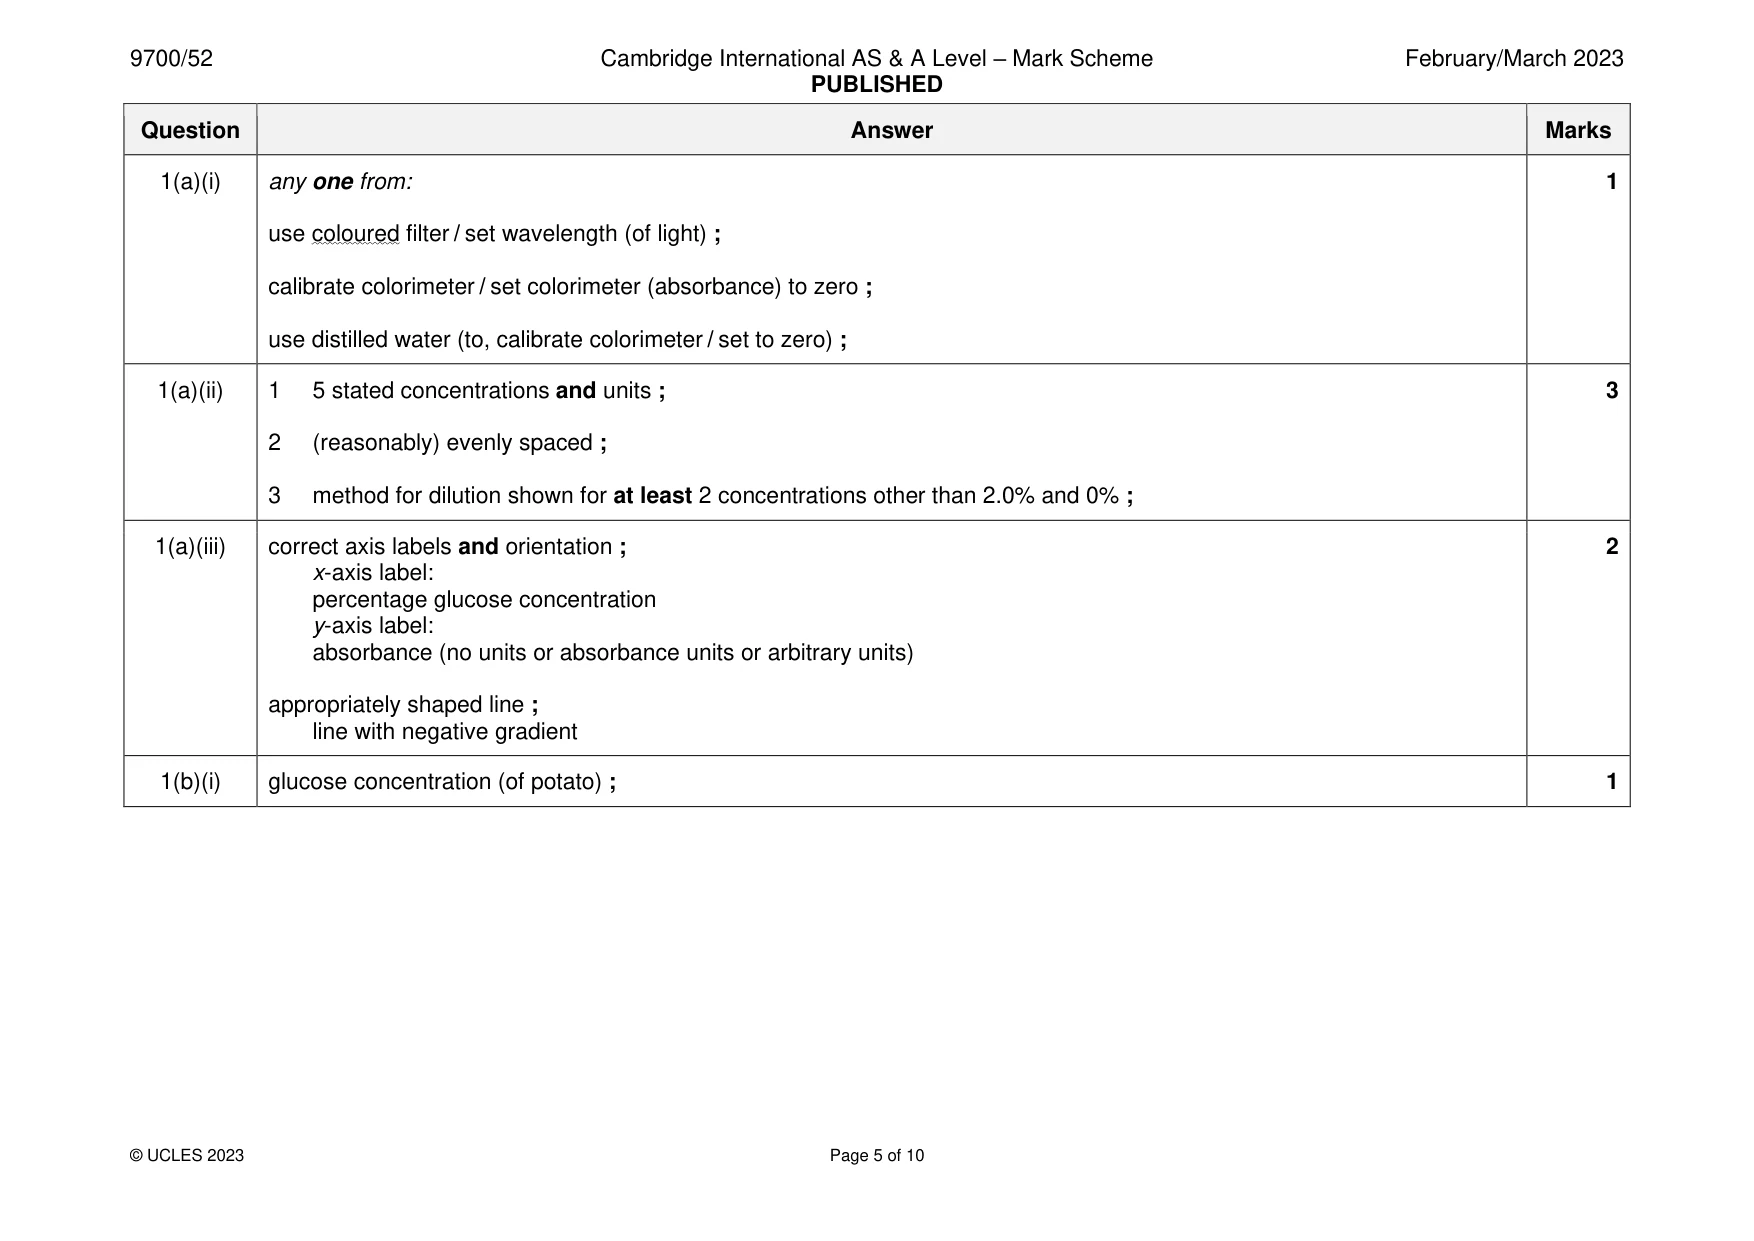
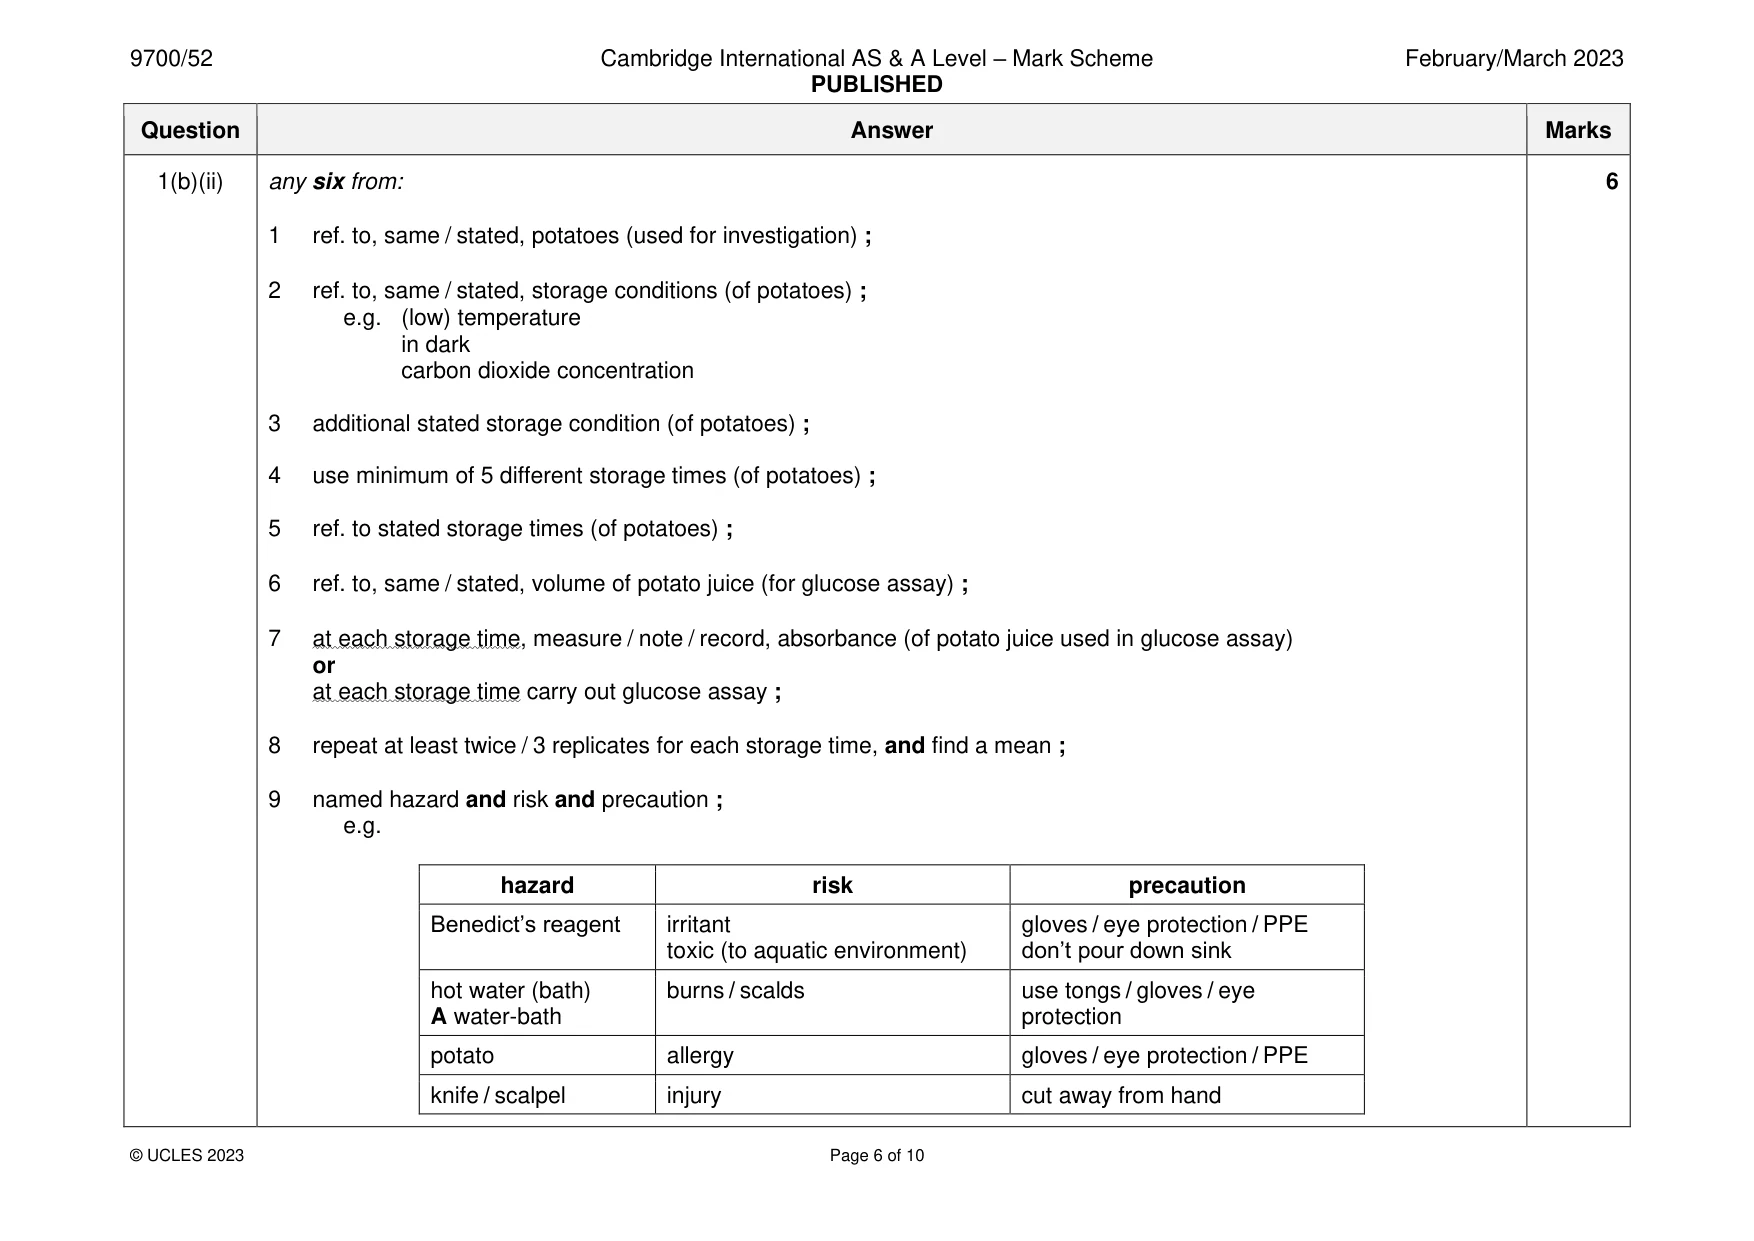
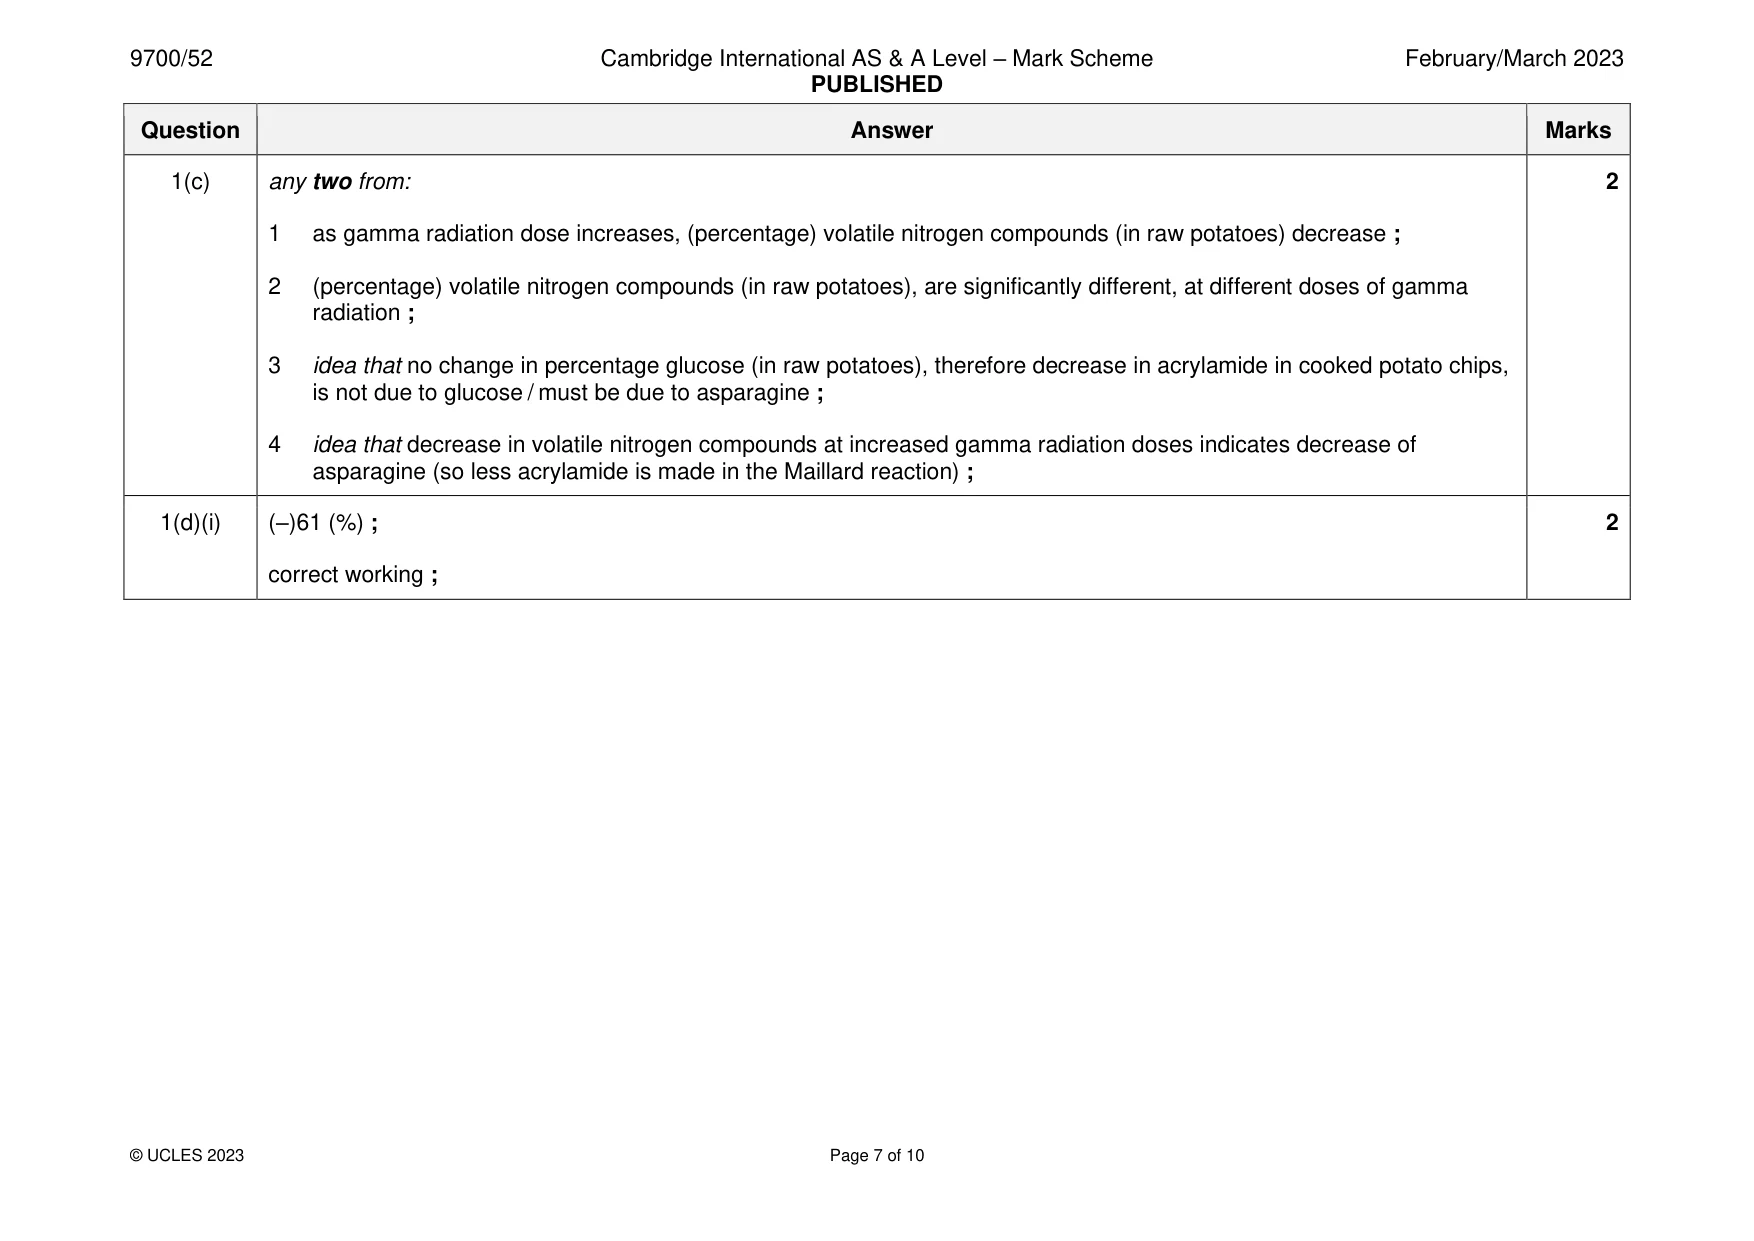
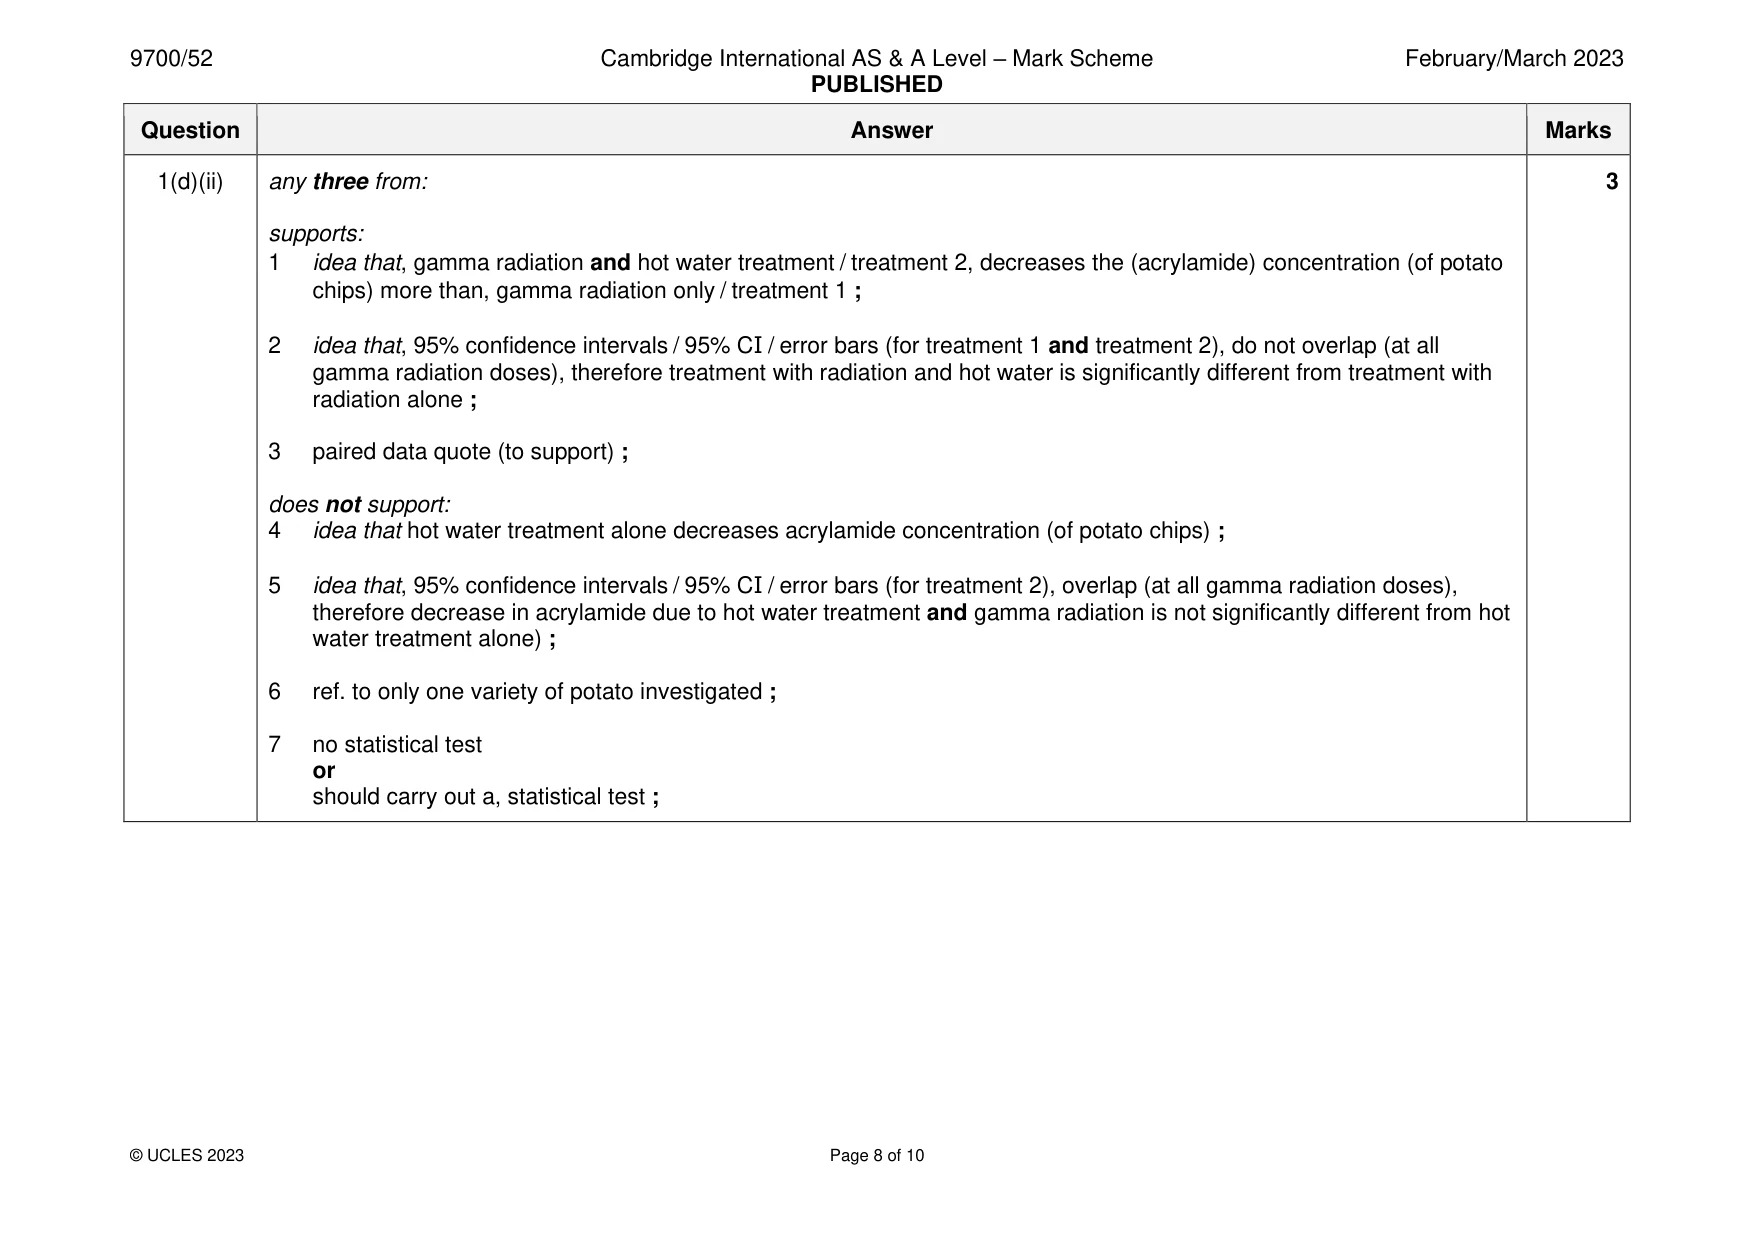
Mark scheme: Question Answer Marks 1(a)(i) any one from: 1 use coloured filter / set wavelength (of light) ; calibrate colorimeter / set colorimeter (absorbance) to zero ; use distilled water (to, calibrate colorimeter / set to zero) ; 1(a)(ii) 1 5 stated concentrations and units ; 3 2 (reasonably) evenly spaced ; 3 method for dilution shown for at least 2 concentrations other than 2.0% and 0% ; 1(a)(iii) correct axis labels and orientation ; 2 x-axis label: percentage glucose concentration y-axis label: absorbance (no units or absorbance units or arbitrary units) appropriately shaped line ; line with negative gradient 1(b)(i) glucose concentration (of potato) ; 1 1(b)(ii) any six from: 6 1 ref. to, same / stated, potatoes (used for investigation) ; 2 ref. to, same / stated, storage conditions (of potatoes) ; e.g. (low) temperature in dark carbon dioxide concentration 3 additional stated storage condition (of potatoes) ; 4 use minimum of 5 different storage times (of potatoes) ; 5 ref. to stated storage times (of potatoes) ; 6 ref. to, same / stated, volume of potato juice (for glucose assay) ; 7 at each storage time, measure / note / record, absorbance (of potato juice used in glucose assay) or at each storage time carry out glucose assay ; 8 repeat at least twice / 3 replicates for each storage time, and find a mean ; 9 named hazard and risk and precaution ; e.g. hazard risk precaution Benedict’s reagent irritant gloves / eye protection / PPE toxic (to aquatic environment) don’t pour down sink hot water (bath) burns / scalds use tongs / gloves / eye A water-bath protection potato allergy gloves / eye protection / PPE knife / scalpel injury cut away from hand 1(c) any two from: 2 1 as gamma radiation dose increases, (percentage) volatile nitrogen compounds (in raw potatoes) decrease ; 2 (percentage) volatile nitrogen compounds (in raw potatoes), are significantly different, at different doses of gamma radiation ; 3 idea that no change in percentage glucose (in raw potatoes), therefore decrease in acrylamide in cooked potato chips, is not due to glucose / must be due to asparagine ; 4 idea that decrease in volatile nitrogen compounds at increased gamma radiation doses indicates decrease of asparagine (so less acrylamide is made in the Maillard reaction) ; 1(d)(i) (–)61 (%) ; 2 correct working ; 1(d)(ii) any three from: 3 supports: 1 idea that, gamma radiation and hot water treatment / treatment 2, decreases the (acrylamide) concentration (of potato chips) more than, gamma radiation only / treatment 1 ; 2 idea that, 95% confidence intervals / 95% CI / error bars (for treatment 1 and treatment 2), do not overlap (at all gamma radiation doses), therefore treatment with radiation and hot water is significantly different from treatment with radiation alone ; 3 paired data quote (to support) ; does not support: 4 idea that hot water treatment alone decreases acrylamide concentration (of potato chips) ; 5 idea that, 95% confidence intervals / 95% CI / error bars (for treatment 2), overlap (at all gamma radiation doses), therefore decrease in acrylamide due to hot water treatment and gamma radiation is not significantly different from hot water treatment alone) ; 6 ref. to only one variety of potato investigated ; 7 no statistical test or should carry out a, statistical test ;
Q2 · Rice, Oryza sativa, is an important food crop
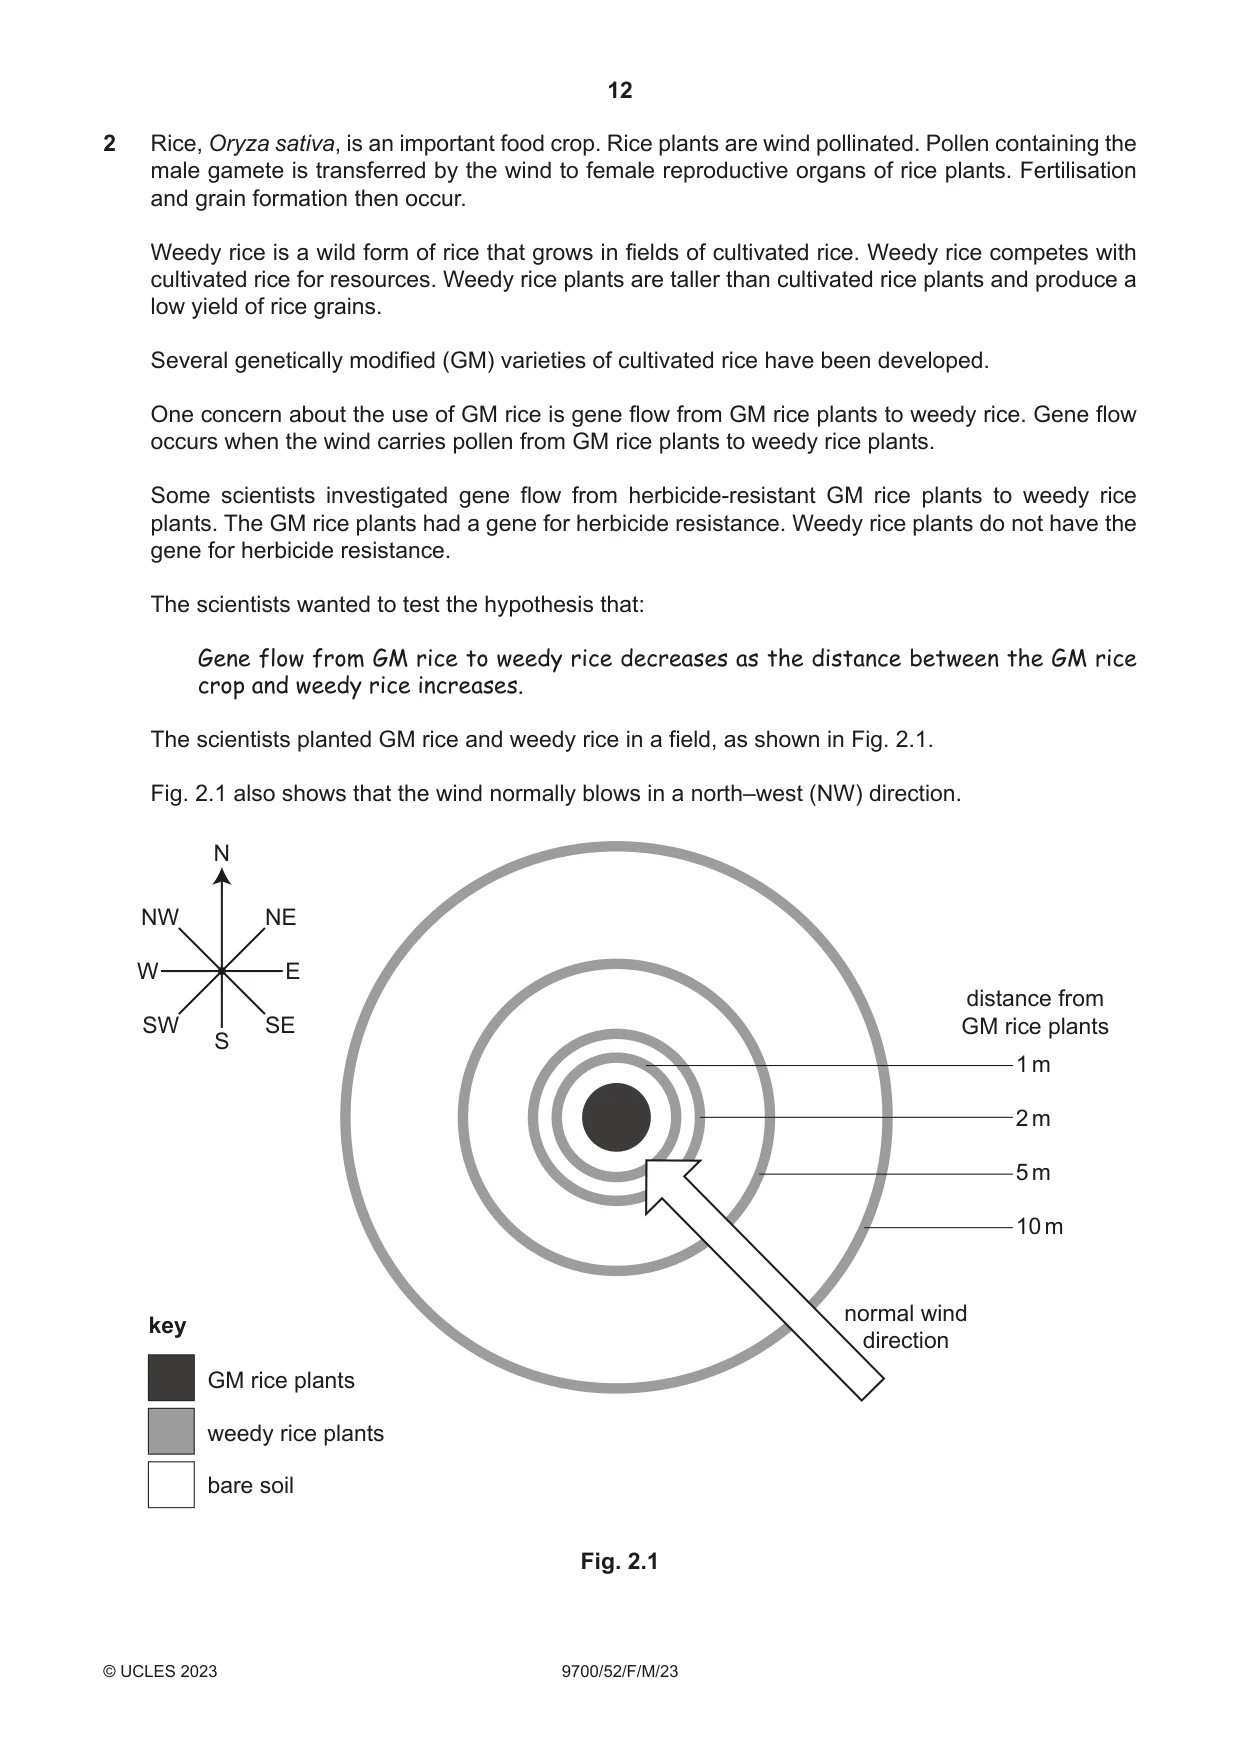
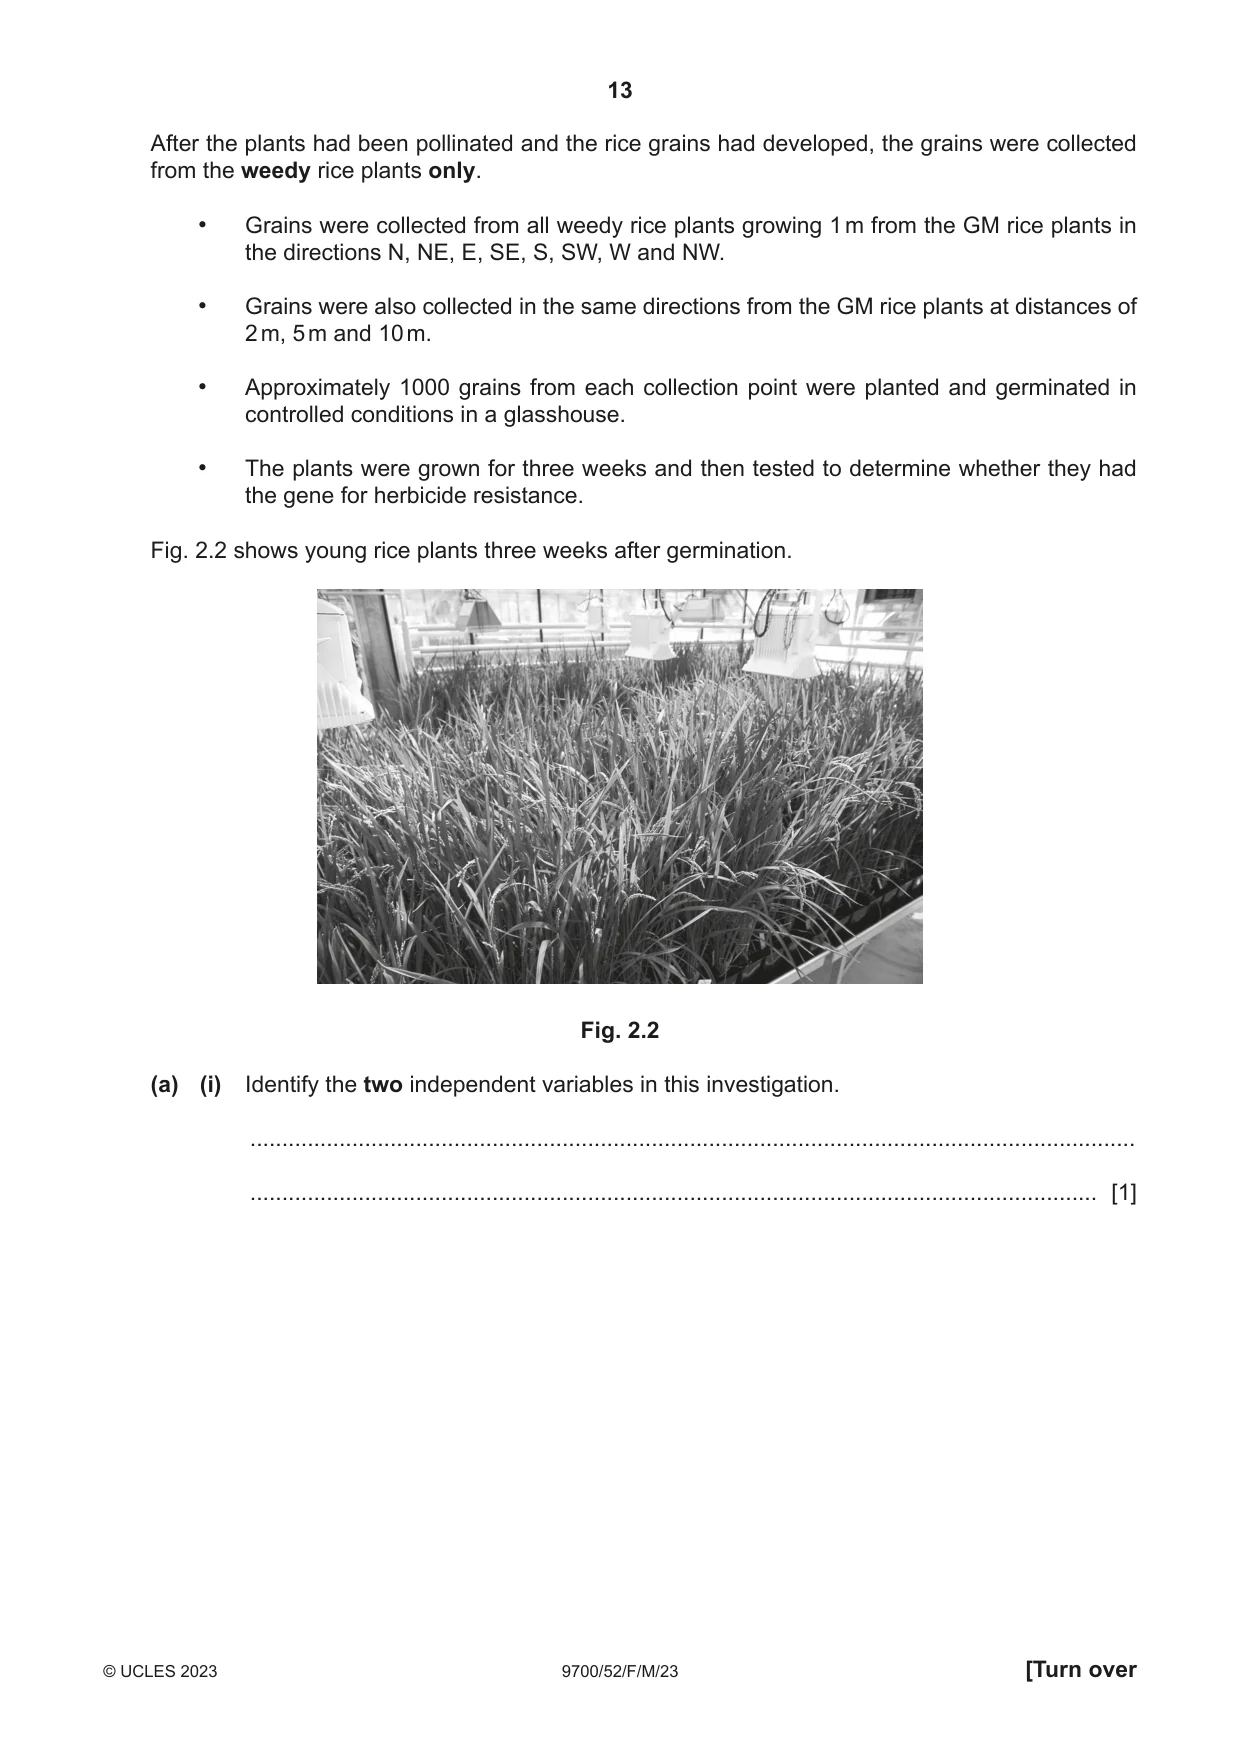
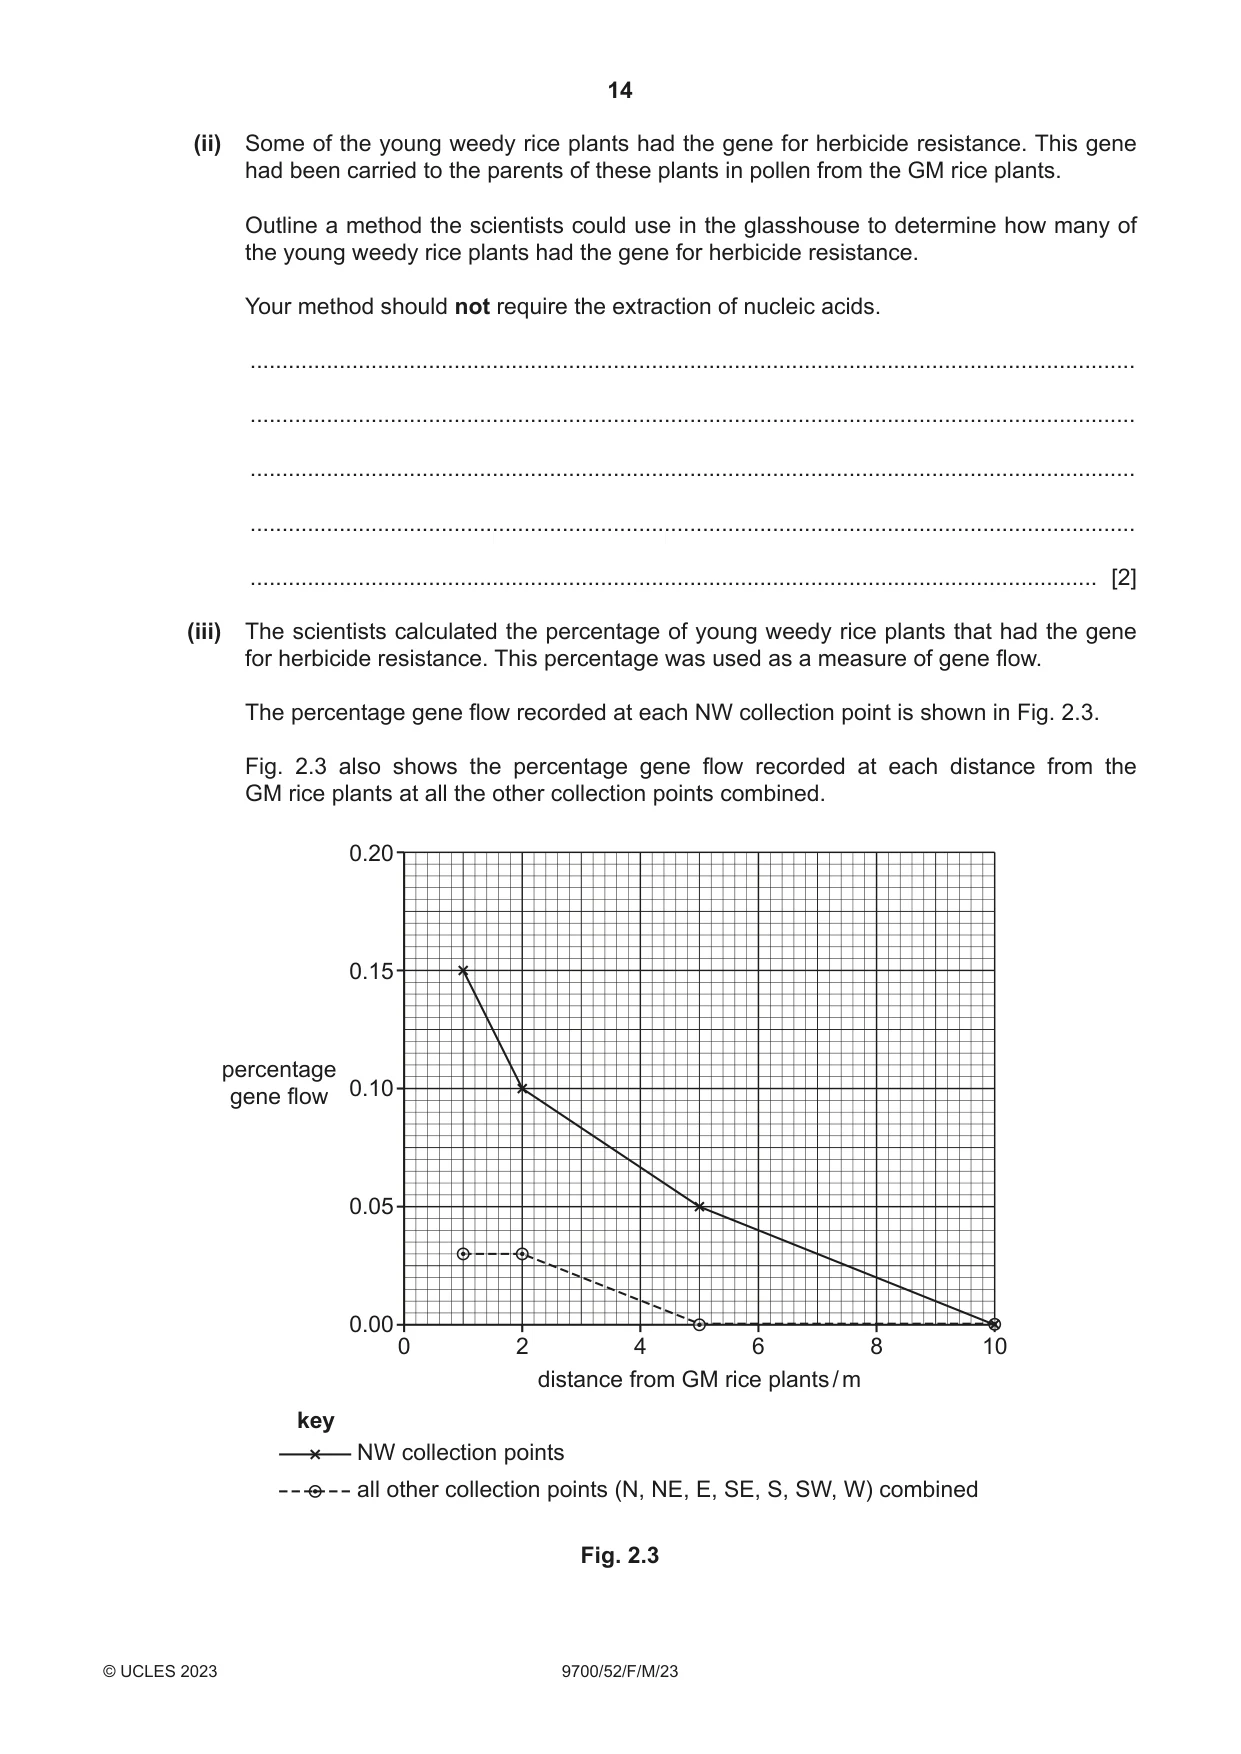
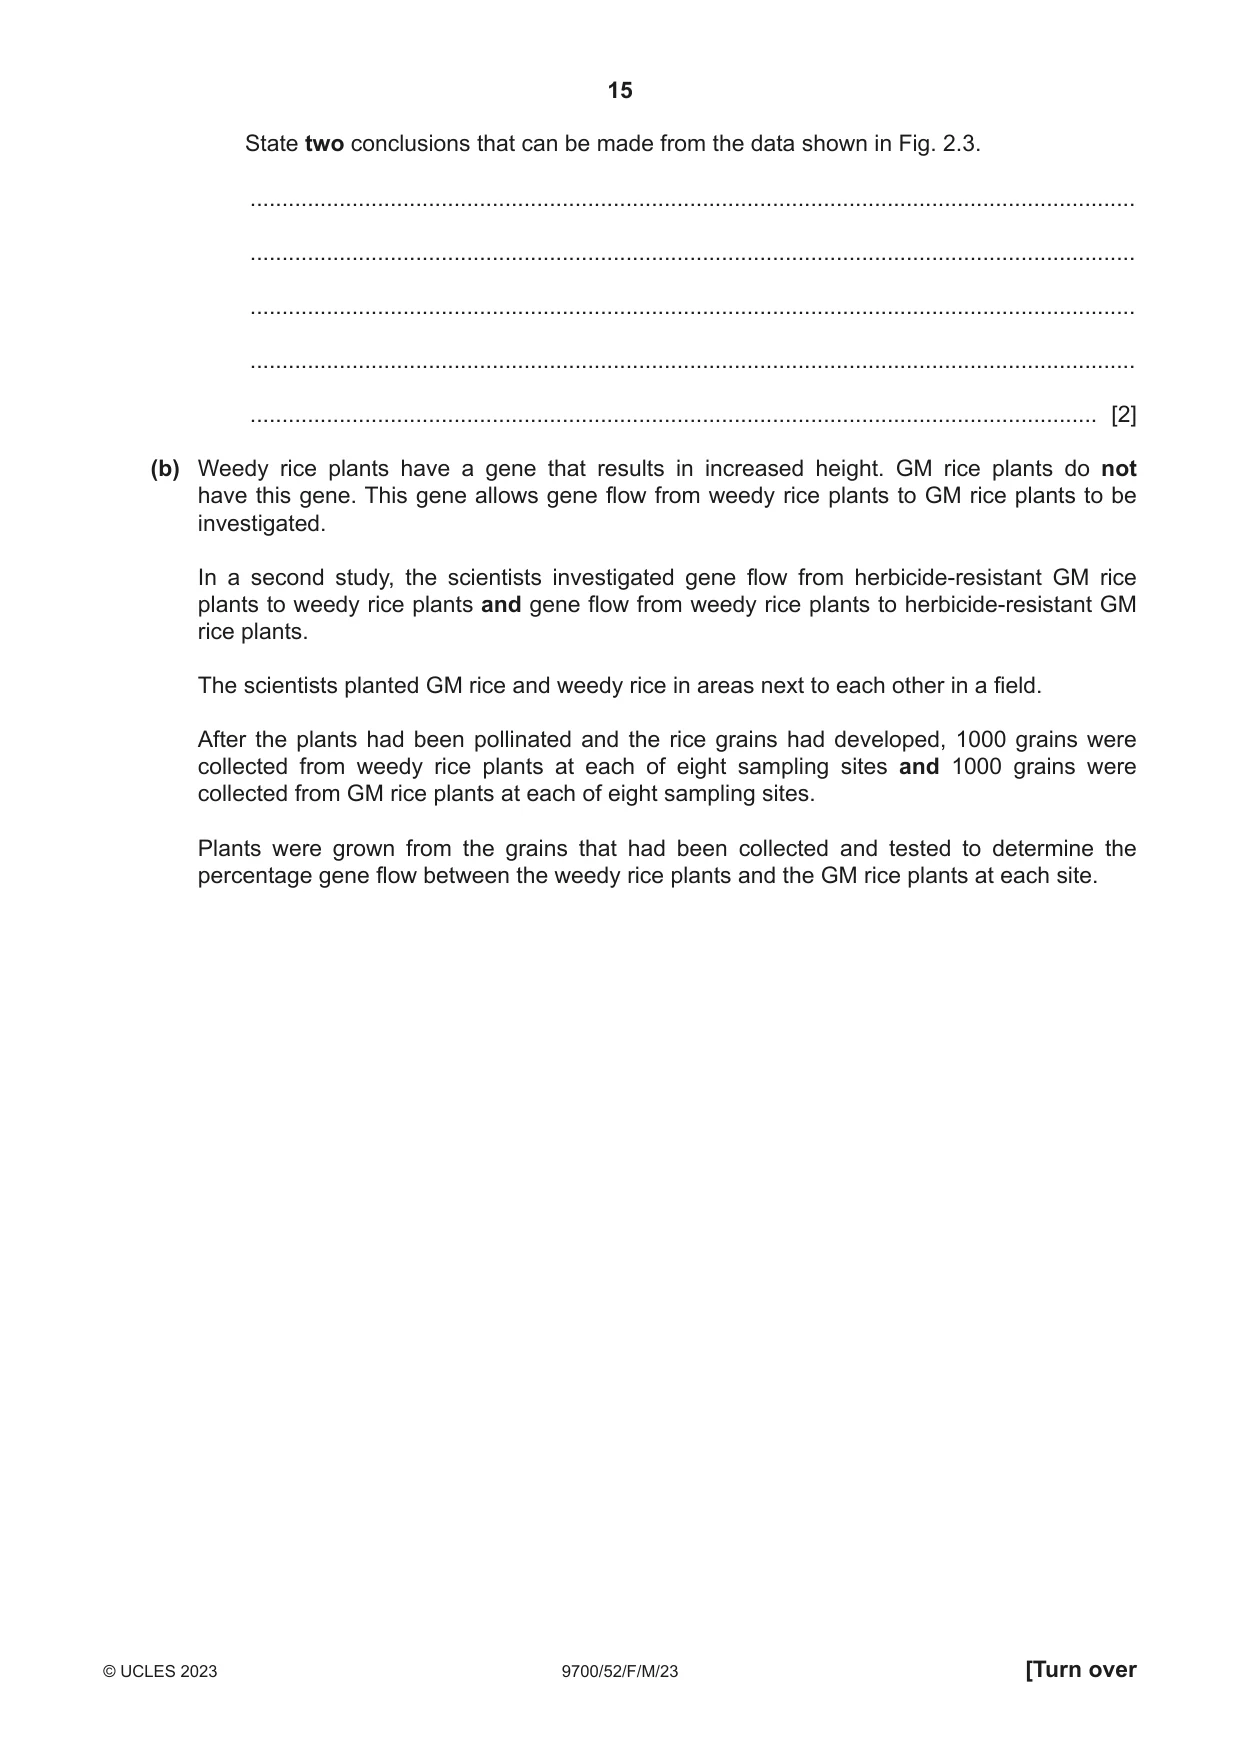
2 Rice, Oryza sativa, is an important food crop. Rice plants are wind pollinated. Pollen containing the male gamete is transferred by the wind to female reproductive organs of rice plants. Fertilisation and grain formation then occur. Weedy rice is a wild form of rice that grows in fields of cultivated rice. Weedy rice competes with cultivated rice for resources. Weedy rice plants are taller than cultivated rice plants and produce a low yield of rice grains. Several genetically modified (GM) varieties of cultivated rice have been developed. One concern about the use of GM rice is gene flow from GM rice plants to weedy rice. Gene flow occurs when the wind carries pollen from GM rice plants to weedy rice plants. Some scientists investigated gene flow from herbicide-resistant GM rice plants to weedy rice plants. The GM rice plants had a gene for herbicide resistance. Weedy rice plants do not have the gene for herbicide resistance. The scientists wanted to test the hypothesis that: Gene flow from GM rice to weedy rice decreases as the distance between the GM rice crop and weedy rice increases. The scientists planted GM rice and weedy rice in a field, as shown in Fig. 2.1. Fig. 2.1 also shows that the wind normally blows in a north–west (NW) direction. N NW NE W E distance from SW SE GM rice plants S 1 m 2 m 5 m 10 m normal wind key direction GM rice plants weedy rice plants bare soil Fig. 2.1 After the plants had been pollinated and the rice grains had developed, the grains were collected from the weedy rice plants only. • Grains were collected from all weedy rice plants growing 1 m from the GM rice plants in the directions N, NE, E, SE, S, SW, W and NW. • Grains were also collected in the same directions from the GM rice plants at distances of 2 m, 5 m and 10 m. • Approximately 1000 grains from each collection point were planted and germinated in controlled conditions in a glasshouse. • The plants were grown for three weeks and then tested to determine whether they had the gene for herbicide resistance. Fig. 2.2 shows young rice plants three weeks after germination. Fig. 2.2 (a) (i) Identify the two independent variables in this investigation. ........................................................................................................................................... ..................................................................................................................................... [1] (ii) Some of the young weedy rice plants had the gene for herbicide resistance. This gene had been carried to the parents of these plants in pollen from the GM rice plants. Outline a method the scientists could use in the glasshouse to determine how many of the young weedy rice plants had the gene for herbicide resistance. Your method should not require the extraction of nucleic acids. ........................................................................................................................................... ........................................................................................................................................... ........................................................................................................................................... ........................................................................................................................................... ..................................................................................................................................... [2] (iii) The scientists calculated the percentage of young weedy rice plants that had the gene for herbicide resistance. This percentage was used as a measure of gene flow. The percentage gene flow recorded at each NW collection point is shown in Fig. 2.3. Fig. 2.3 also shows the percentage gene flow recorded at each distance from the GM rice plants at all the other collection points combined. 0.20 0.15 percentage 0.10 gene flow 0.05 0.00 0 2 4 6 8 10 distance from GM rice plants / m key NW collection points all other collection points (N, NE, E, SE, S, SW, W) combined Fig. 2.3
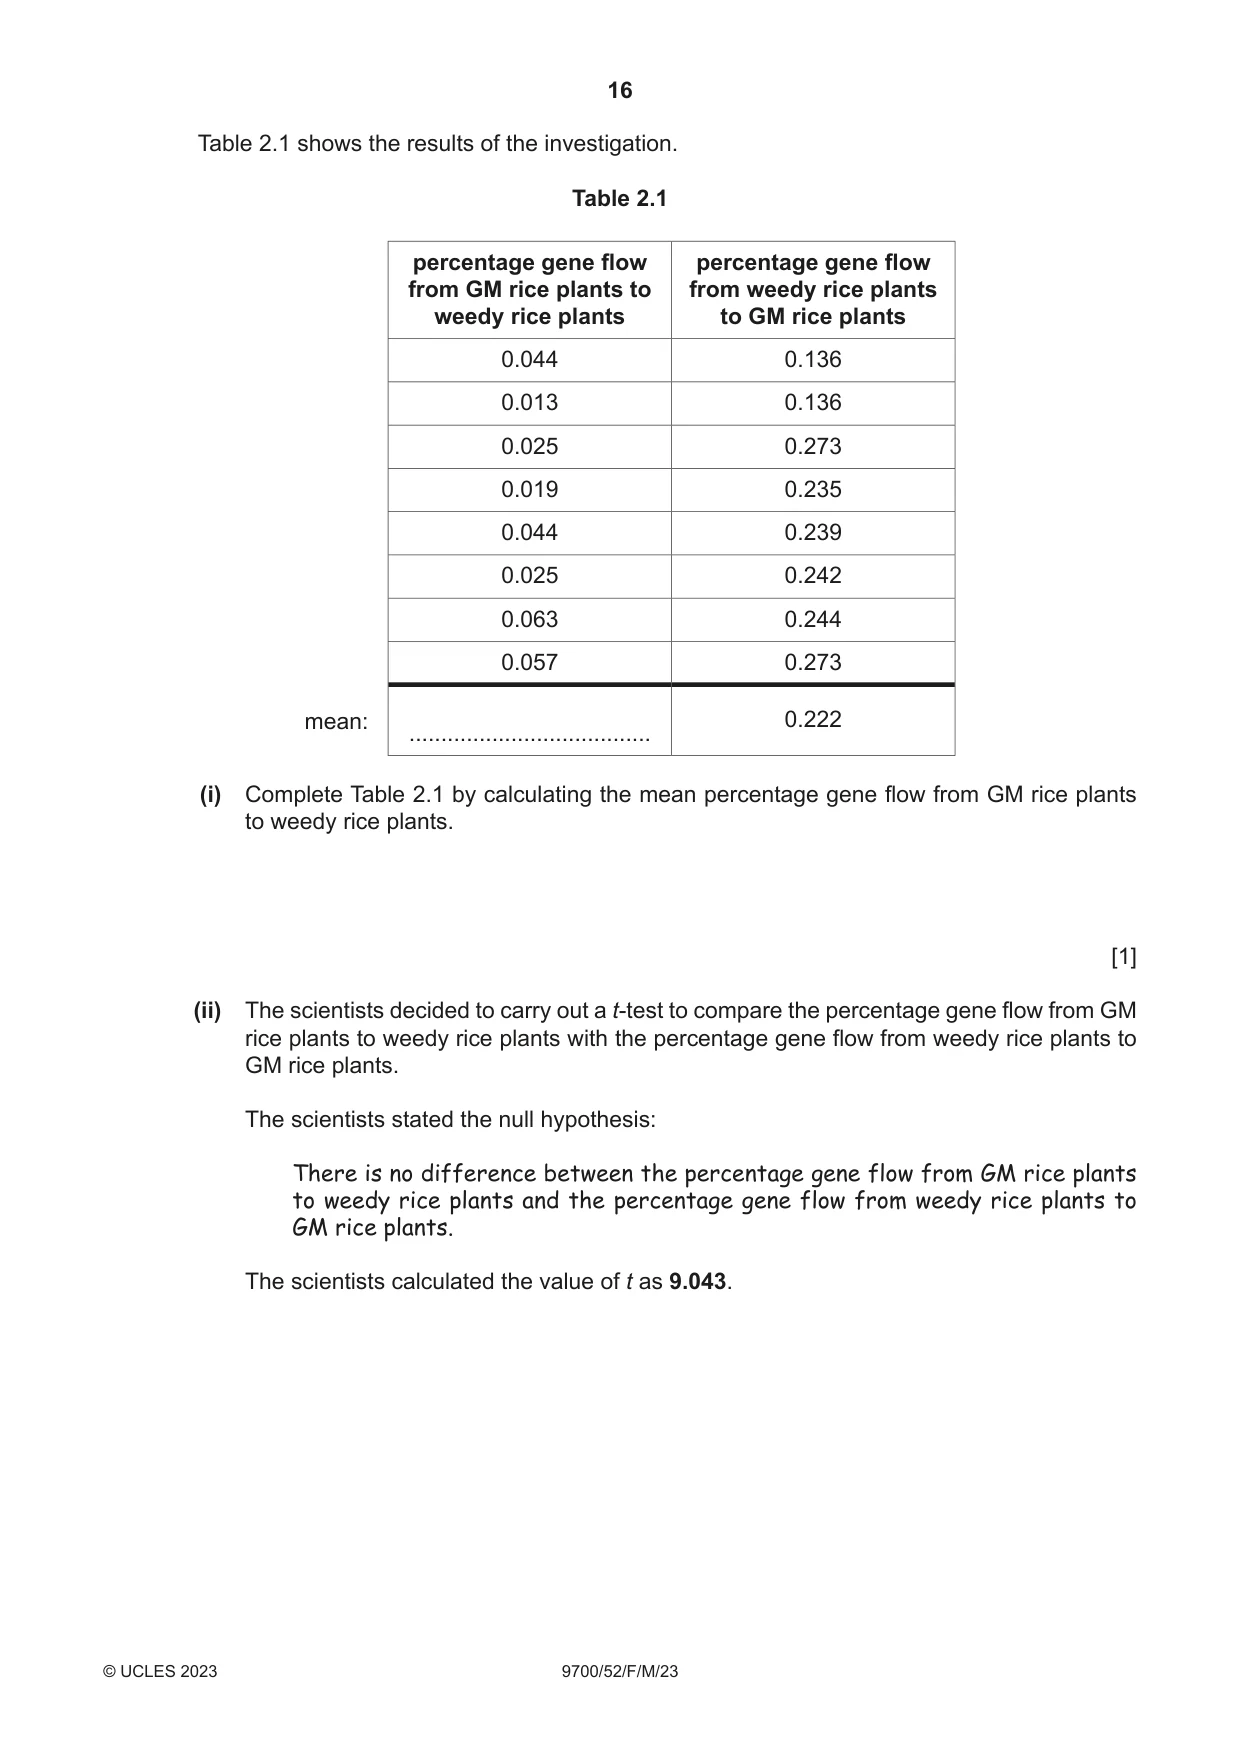
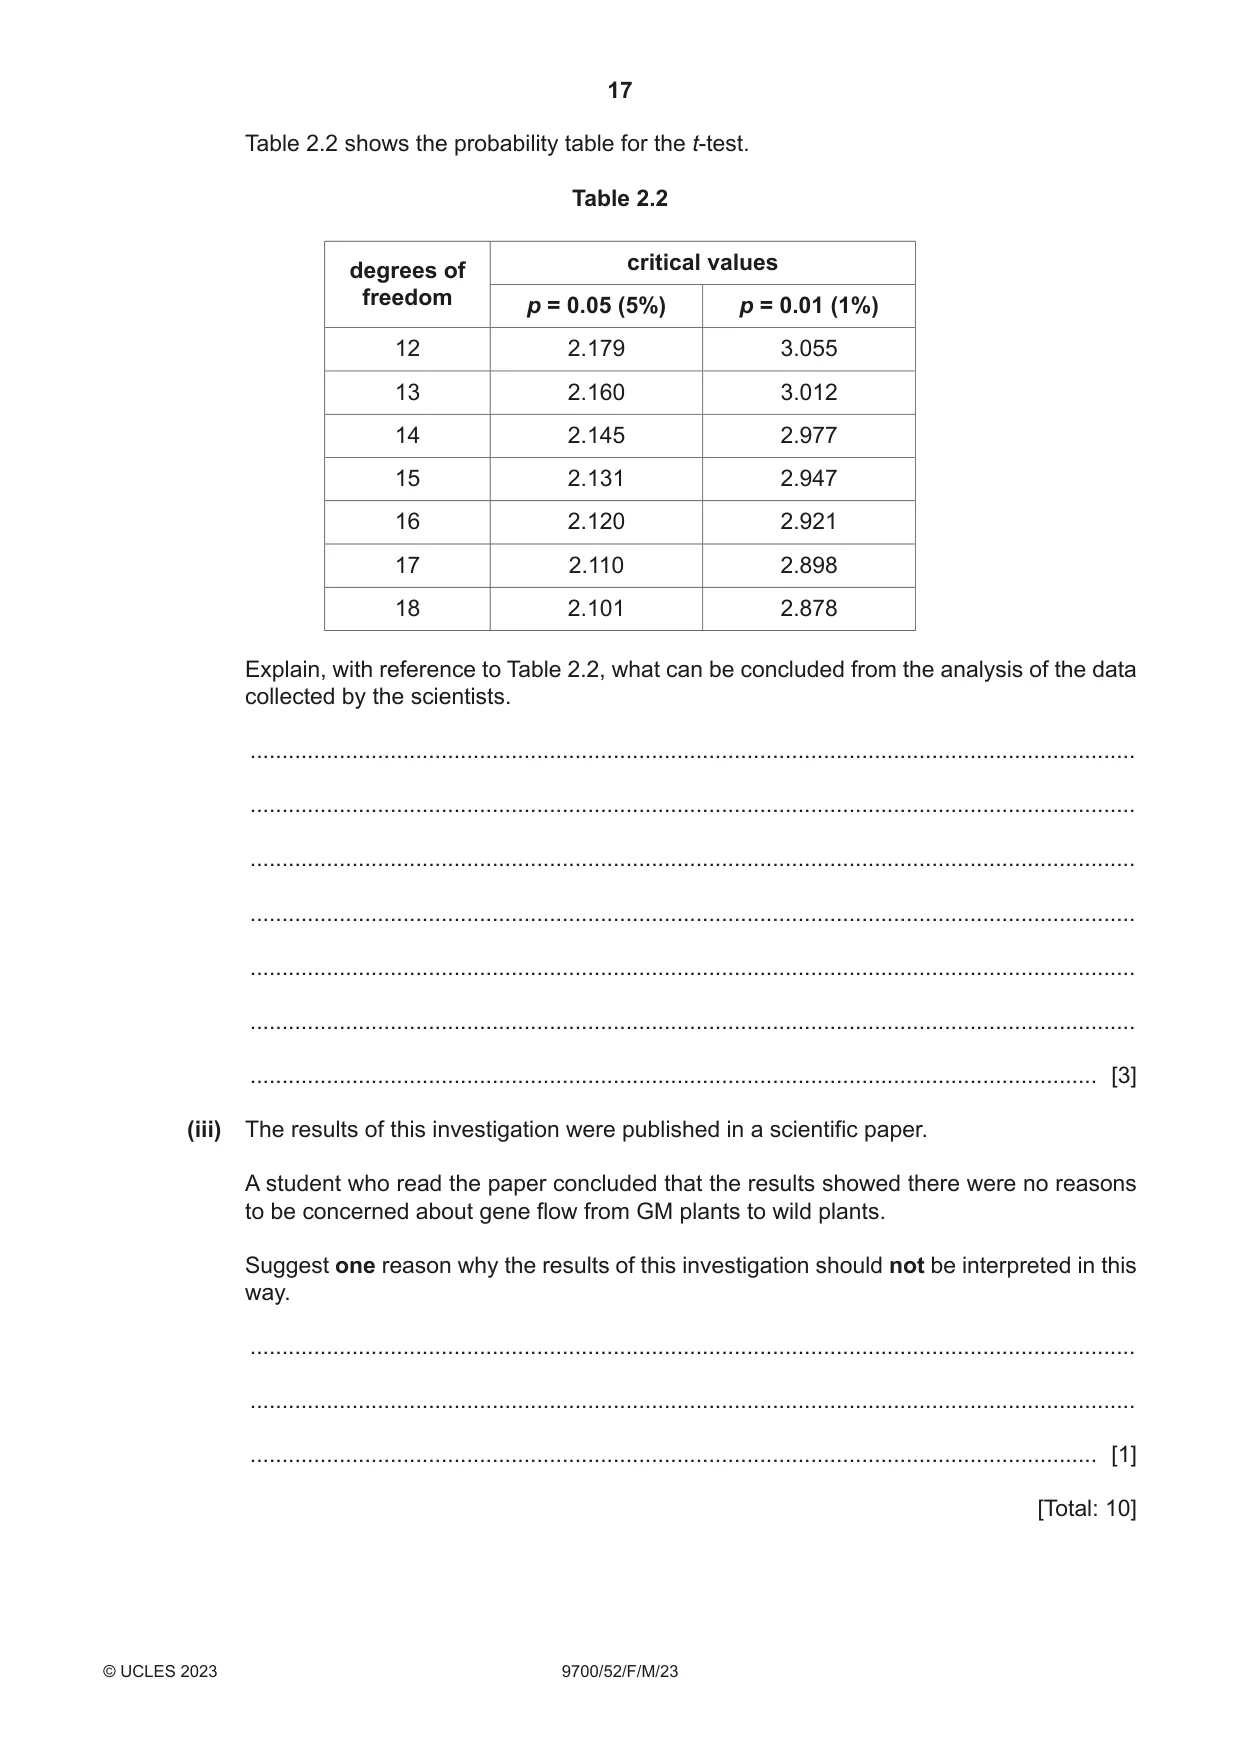
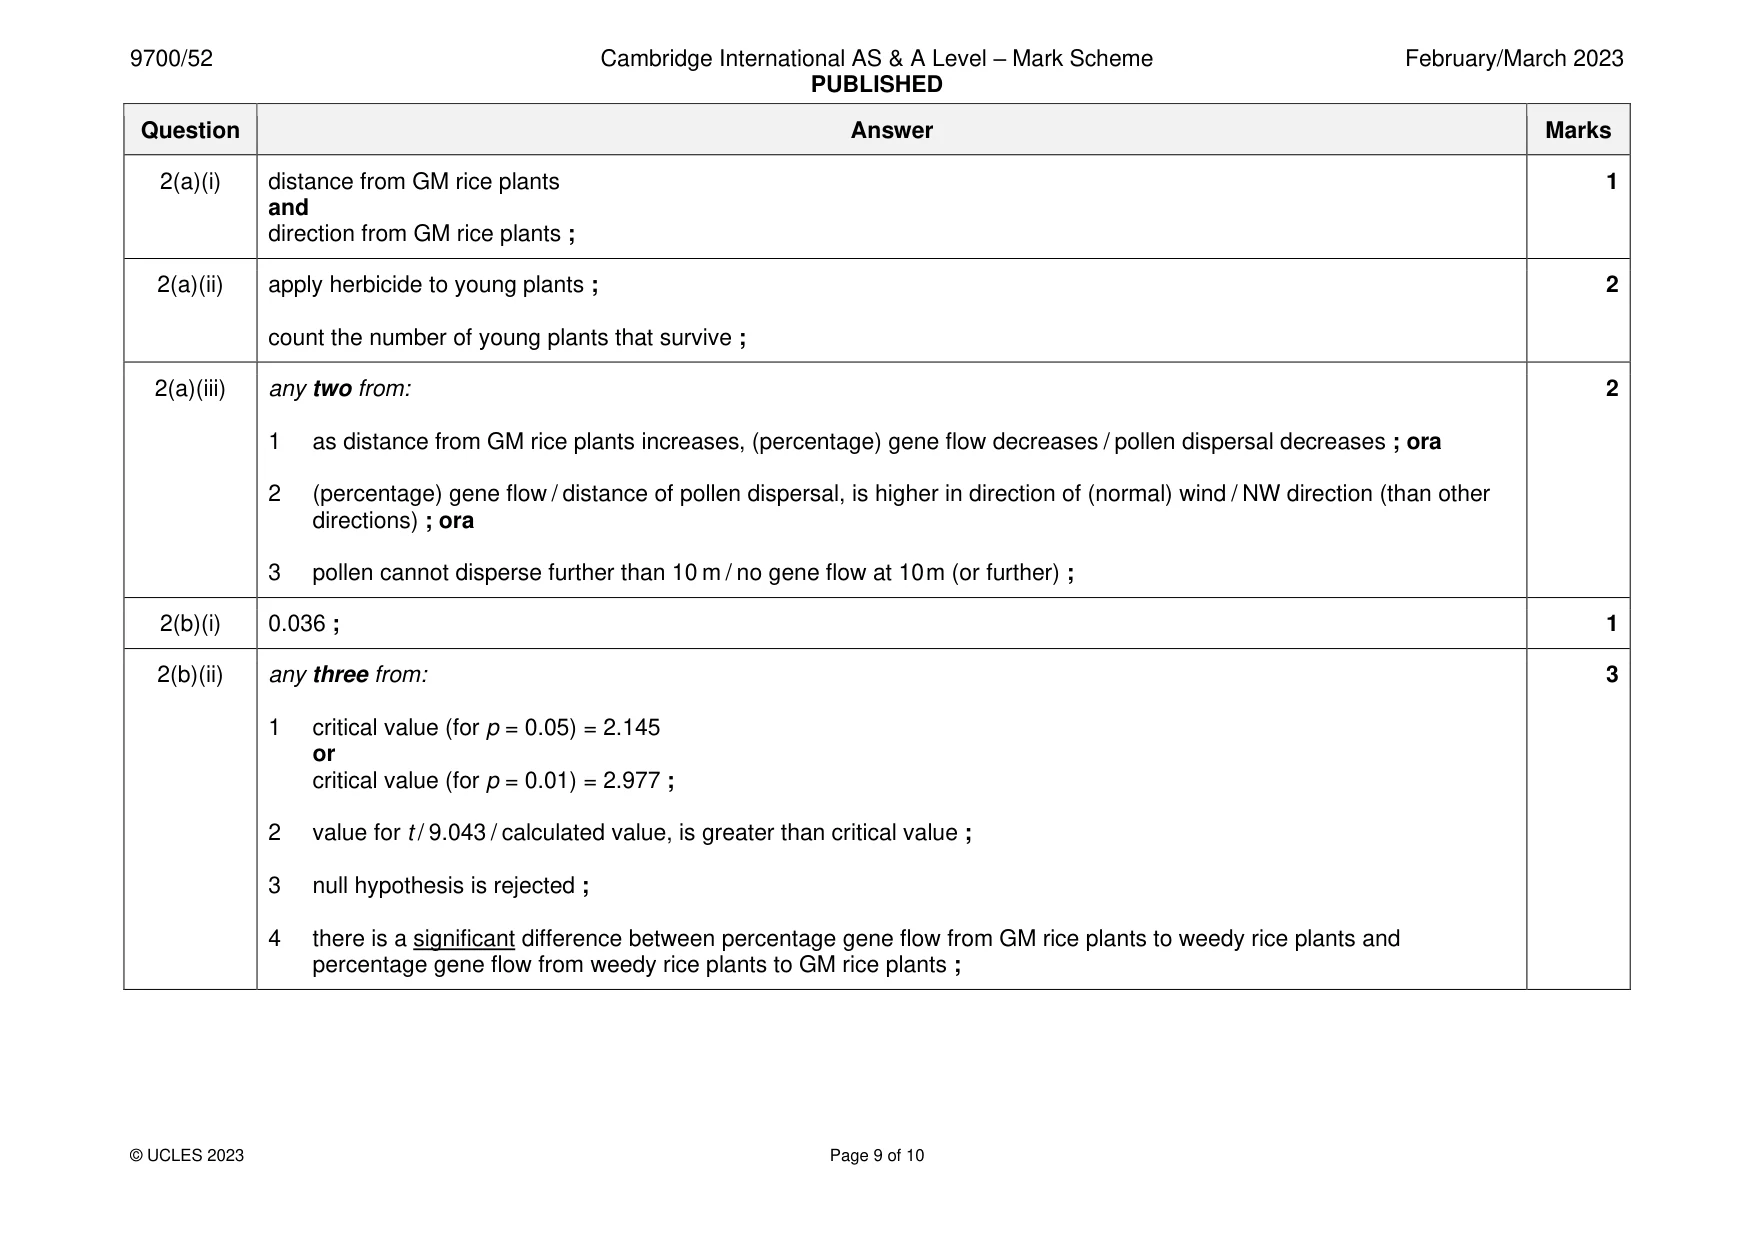
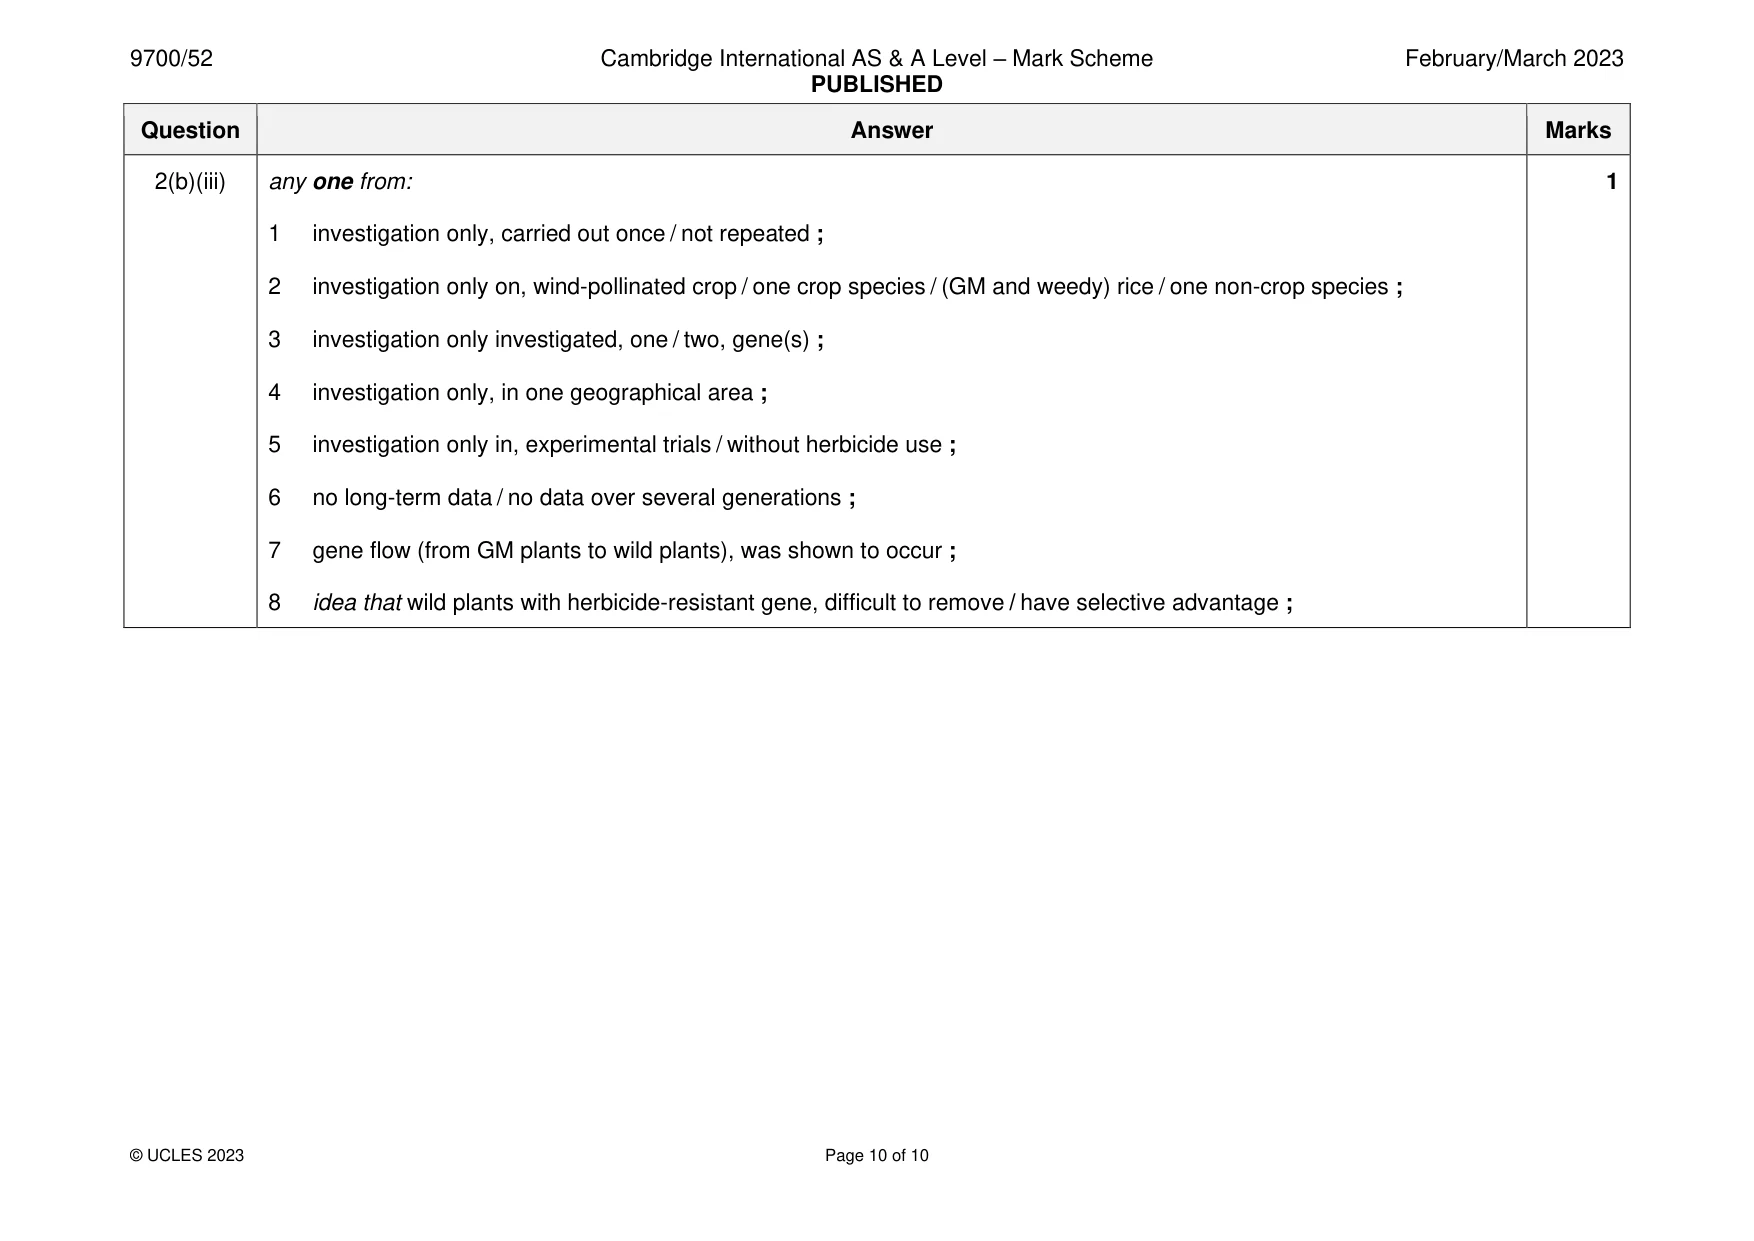
Mark scheme: 2(a)(i) distance from GM rice plants 1 and direction from GM rice plants ; 2(a)(ii) apply herbicide to young plants ; 2 count the number of young plants that survive ; 2(a)(iii) any two from: 2 1 as distance from GM rice plants increases, (percentage) gene flow decreases / pollen dispersal decreases ; ora 2 (percentage) gene flow / distance of pollen dispersal, is higher in direction of (normal) wind / NW direction (than other directions) ; ora 3 pollen cannot disperse further than 10 m / no gene flow at 10 m (or further) ; 2(b)(i) 0.036 ; 1 2(b)(ii) any three from: 3 1 critical value (for p = 0.05) = 2.145 or critical value (for p = 0.01) = 2.977 ; 2 value for t / 9.043 / calculated value, is greater than critical value ; 3 null hypothesis is rejected ; 4 there is a significant difference between percentage gene flow from GM rice plants to weedy rice plants and percentage gene flow from weedy rice plants to GM rice plants ; 2(b)(iii) any one from: 1 1 investigation only, carried out once / not repeated ; 2 investigation only on, wind-pollinated crop / one crop species / (GM and weedy) rice / one non-crop species ; 3 investigation only investigated, one / two, gene(s) ; 4 investigation only, in one geographical area ; 5 investigation only in, experimental trials / without herbicide use ; 6 no long-term data / no data over several generations ; 7 gene flow (from GM plants to wild plants), was shown to occur ; 8 idea that wild plants with herbicide-resistant gene, difficult to remove / have selective advantage ;
More questions on Genetically modified organisms in agriculture
What was in this paper
The subtopics covered by these 2 questions, and how many questions each got. Open one in a new tab to see every Cambridge question on it.
What you needed in this session
Cambridge’s own grade thresholds for 2023 Feb/March, Paper 5 · Variant 2. A higher threshold means an easier paper — the bar moves with how the cohort did.