Cambridge A Level Biology 9700 — 2024 Oct/Nov Paper 5 · Variant 2
9700/52/O/N/24 · 2 questions · 30 marks · ≈34 min
The question paper and its mark scheme, free to read here and free to download. This is Cambridge’s own paper, exactly as it was sat.
Question paper16 pages


Mark scheme10 pages
Answers below. Sit the paper first if you are practising.
Questions as text
Q1 · In the light‑dependent stage of photosynthesis, electrons and hydrogen ions are accepted…
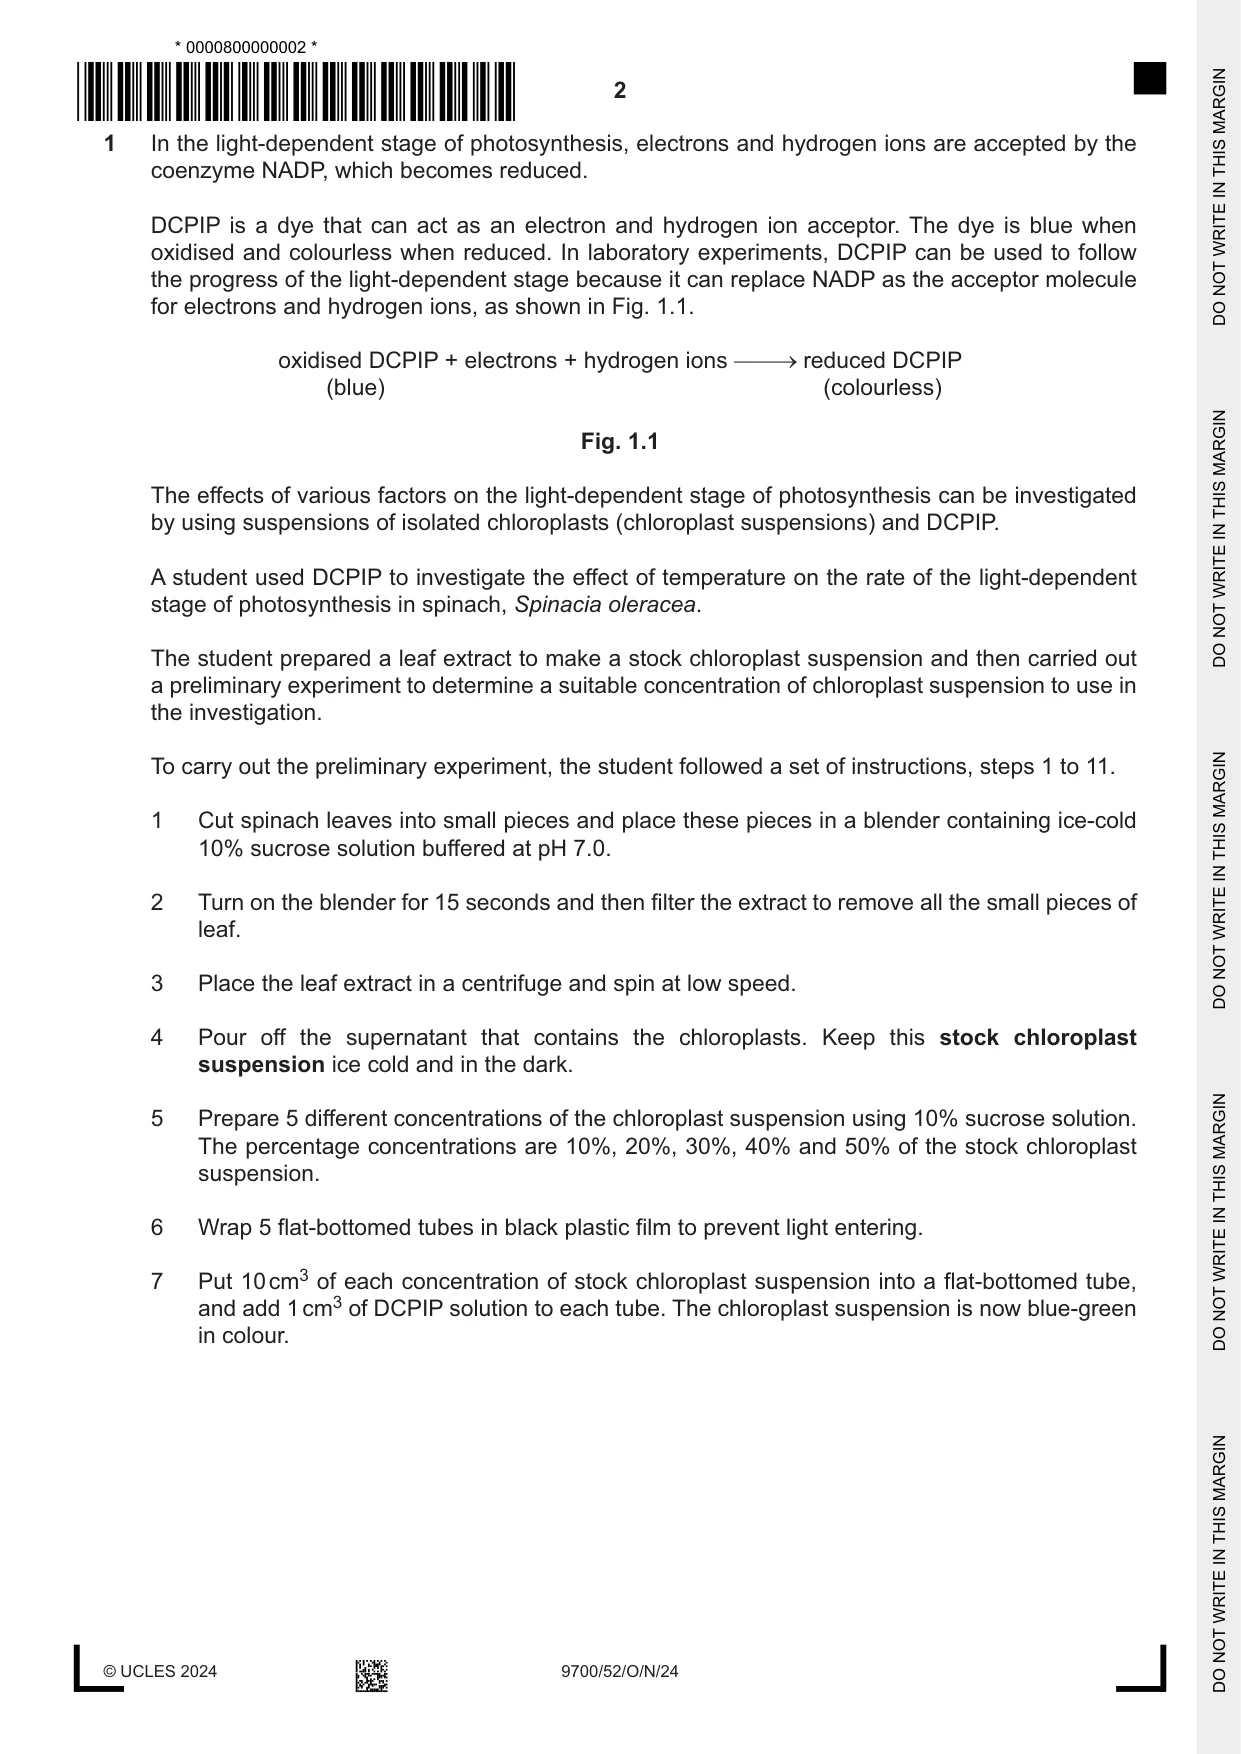
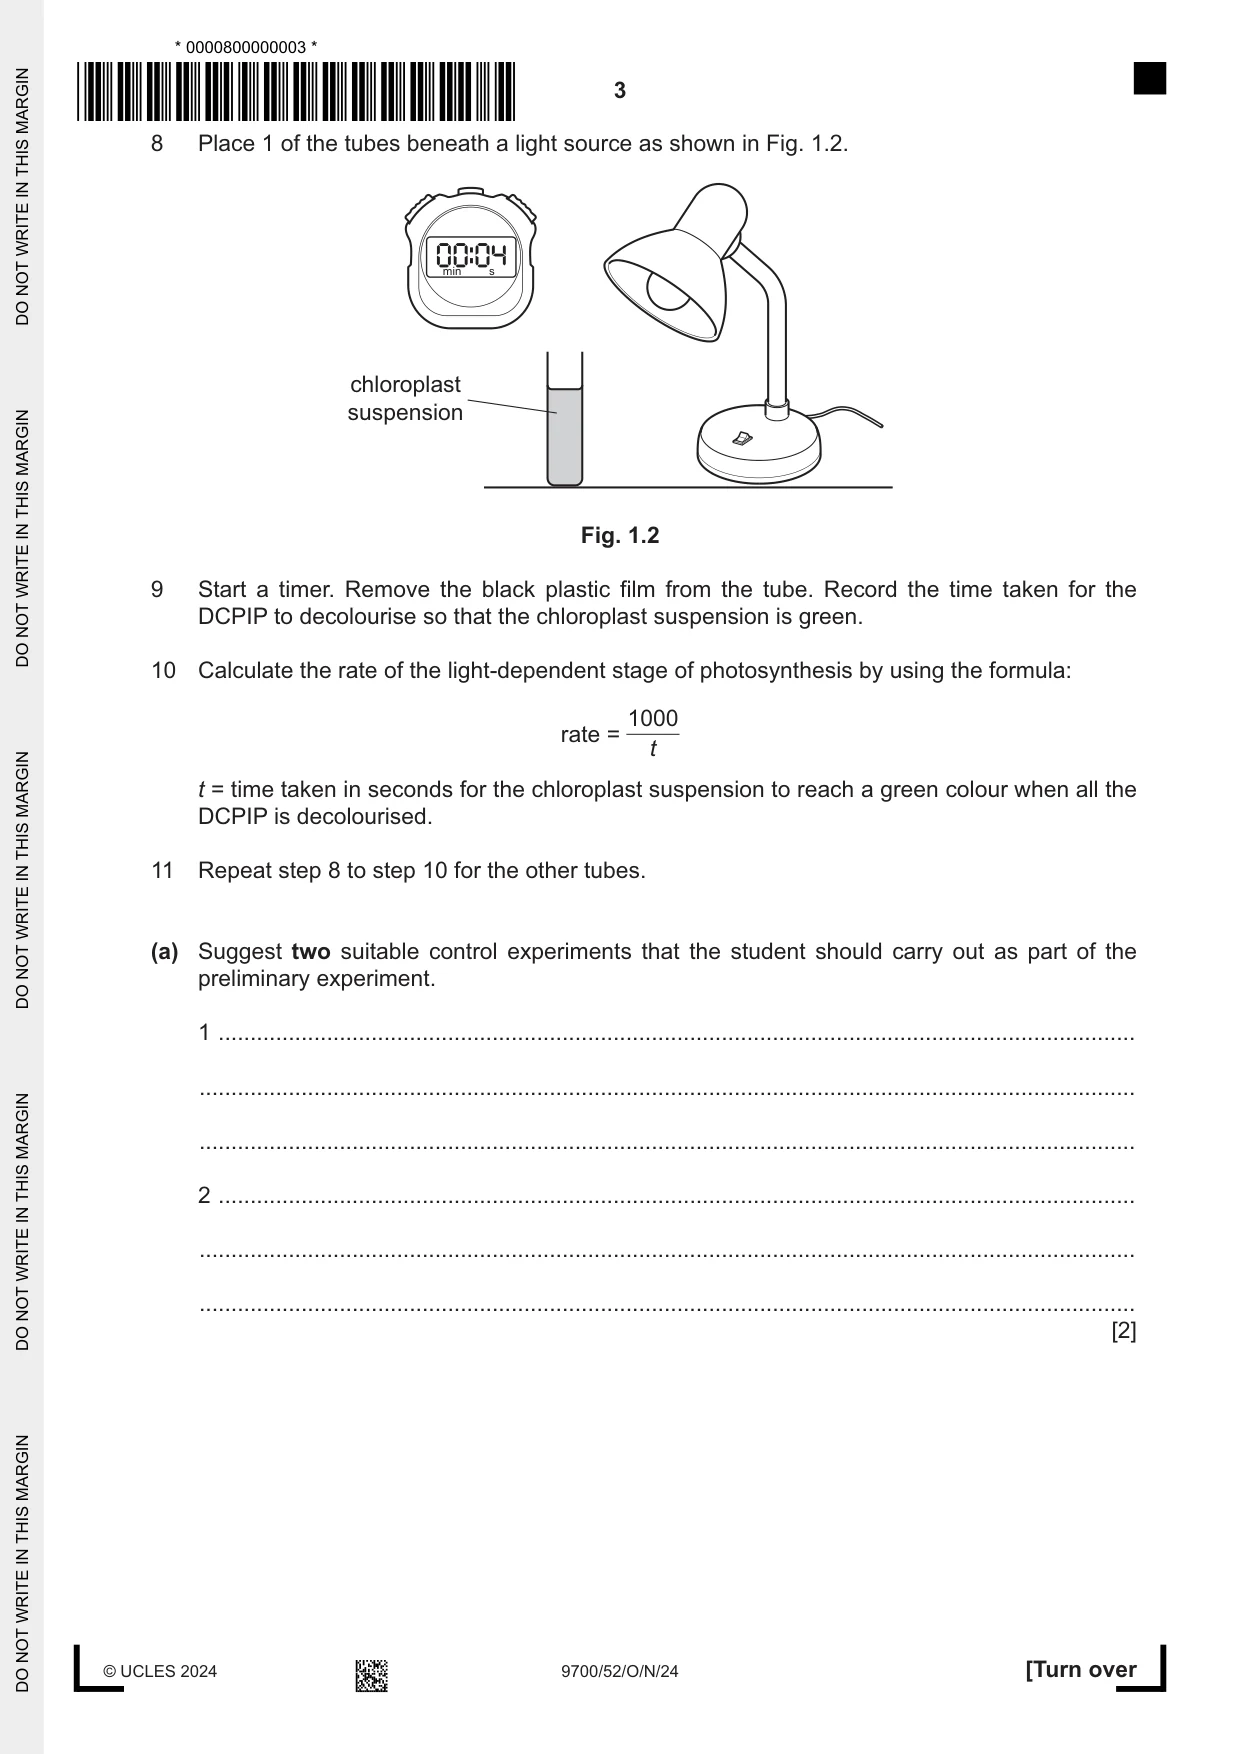
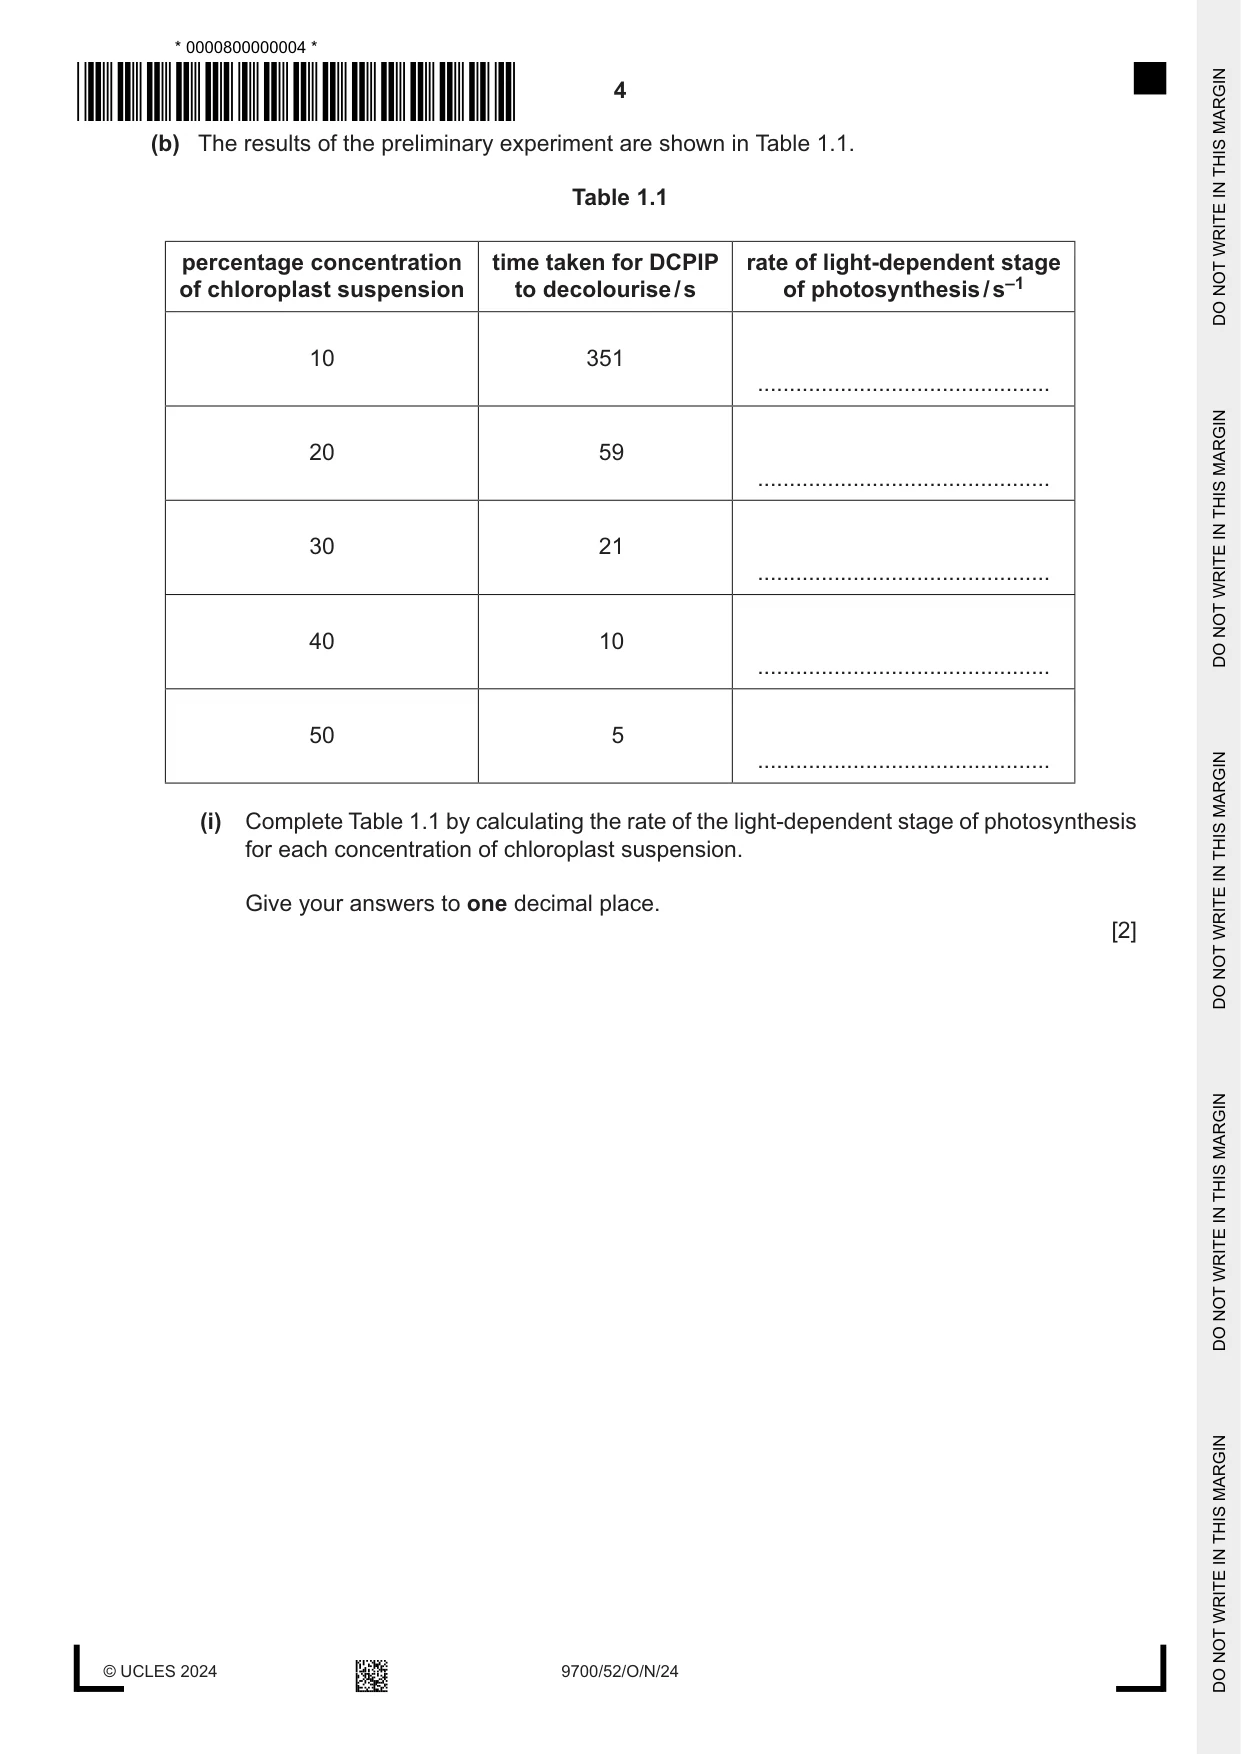
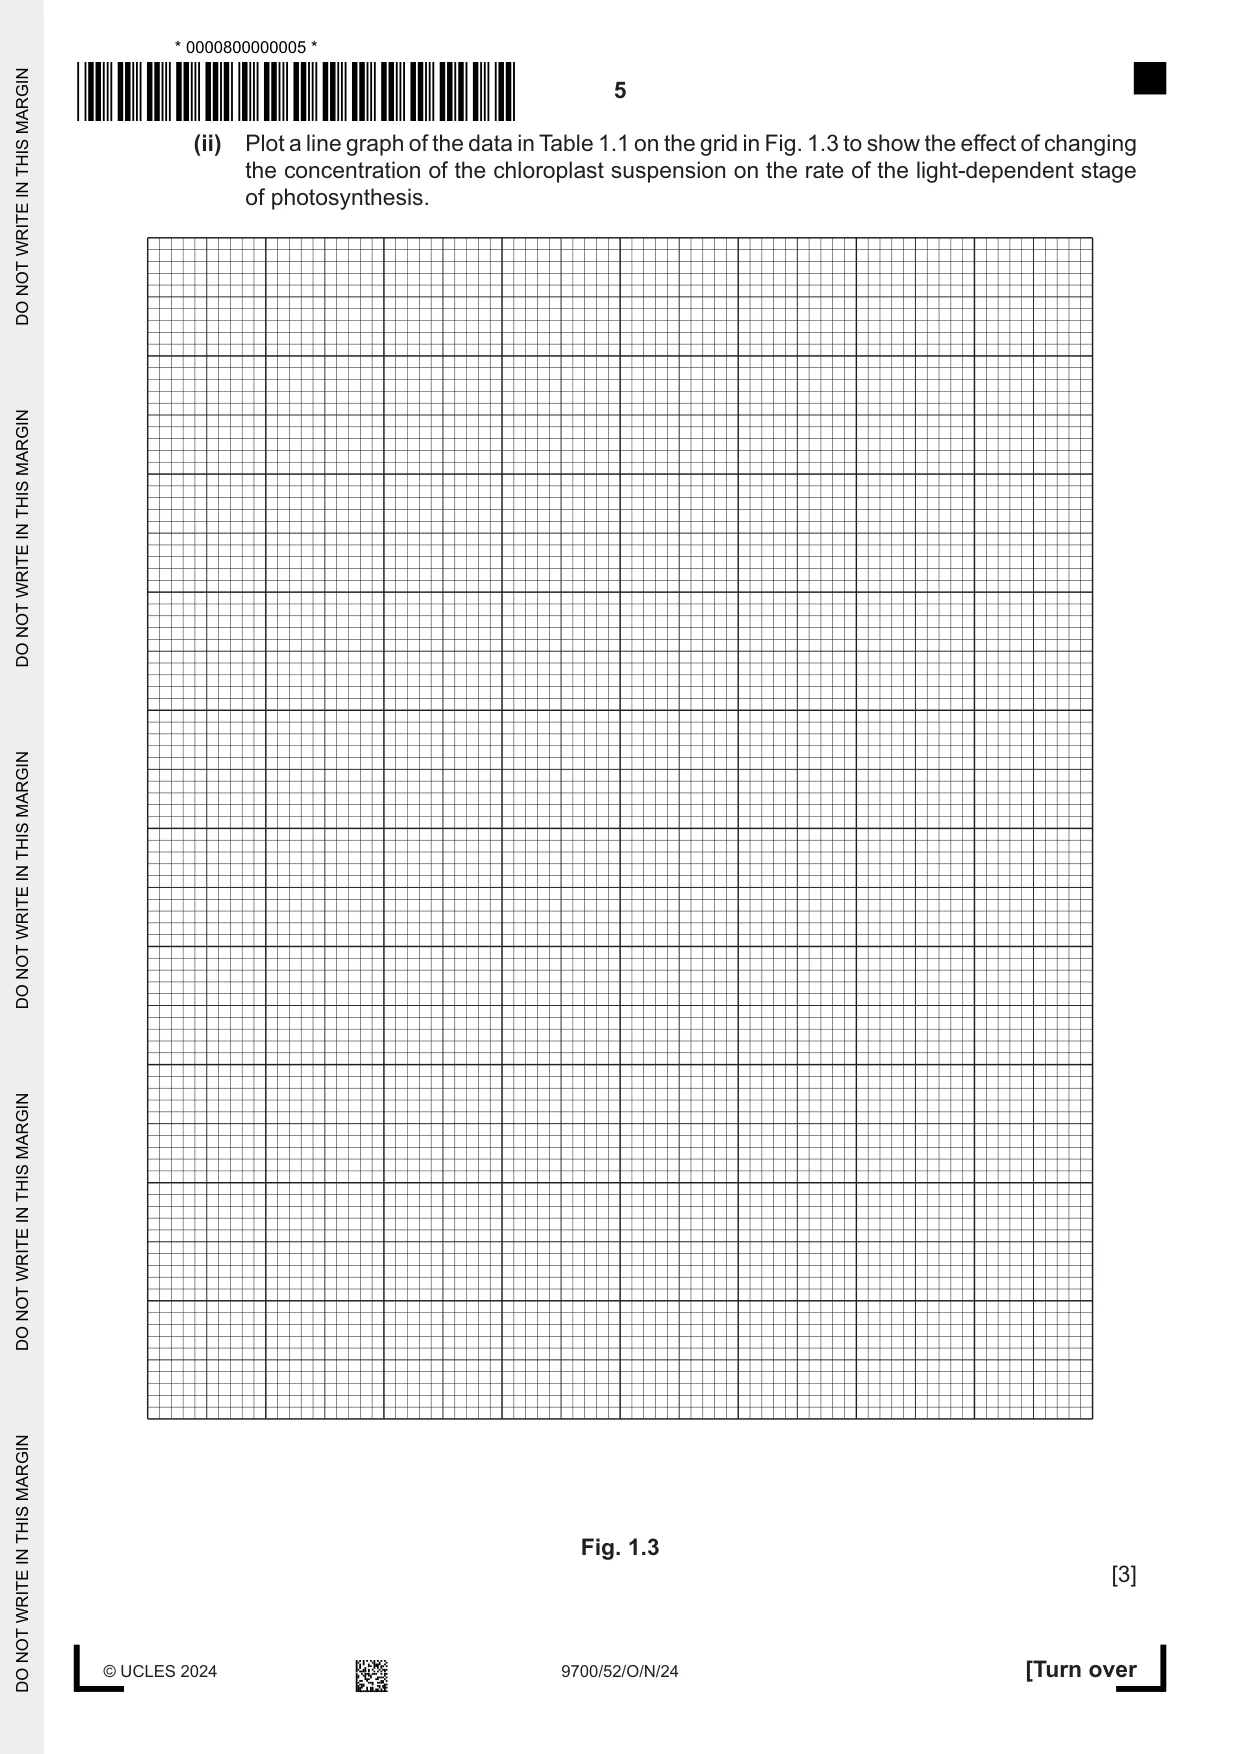
1 In the light‑dependent stage of photosynthesis, electrons and hydrogen ions are accepted by the coenzyme NADP, which becomes reduced. DCPIP is a dye that can act as an electron and hydrogen ion acceptor. The dye is blue when oxidised and colourless when reduced. In laboratory experiments, DCPIP can be used to follow the progress of the light‑dependent stage because it can replace NADP as the acceptor molecule for electrons and hydrogen ions, as shown in Fig. 1.1. oxidised DCPIP + electrons + hydrogen ions reduced DCPIP (blue) (colourless) Fig. 1.1 The effects of various factors on the light‑dependent stage of photosynthesis can be investigated by using suspensions of isolated chloroplasts (chloroplast suspensions) and DCPIP. A student used DCPIP to investigate the effect of temperature on the rate of the light‑dependent stage of photosynthesis in spinach, Spinacia oleracea. The student prepared a leaf extract to make a stock chloroplast suspension and then carried out a preliminary experiment to determine a suitable concentration of chloroplast suspension to use in the investigation. To carry out the preliminary experiment, the student followed a set of instructions, steps 1 to 11. 1 Cut spinach leaves into small pieces and place these pieces in a blender containing ice‑cold 10% sucrose solution buffered at pH 7.0. 2 Turn on the blender for 15 seconds and then filter the extract to remove all the small pieces of leaf. 3 Place the leaf extract in a centrifuge and spin at low speed. 4 Pour off the supernatant that contains the chloroplasts. Keep this stock chloroplast suspension ice cold and in the dark. 5 Prepare 5 different concentrations of the chloroplast suspension using 10% sucrose solution. The percentage concentrations are 10%, 20%, 30%, 40% and 50% of the stock chloroplast suspension. 6 Wrap 5 flat‑bottomed tubes in black plastic film to prevent light entering. 7 Put 10 cm3 of each concentration of stock chloroplast suspension into a flat‑bottomed tube, and add 1 cm3 of DCPIP solution to each tube. The chloroplast suspension is now blue‑green in colour. 8 Place 1 of the tubes beneath a light source as shown in Fig. 1.2. min s chloroplast suspension Fig. 1.2 9 Start a timer. Remove the black plastic film from the tube. Record the time taken for the DCPIP to decolourise so that the chloroplast suspension is green. 10 Calculate the rate of the light‑dependent stage of photosynthesis by using the formula: 1000 rate = t t = time taken in seconds for the chloroplast suspension to reach a green colour when all the DCPIP is decolourised. 11 Repeat step 8 to step 10 for the other tubes. (a) Suggest two suitable control experiments that the student should carry out as part of the preliminary experiment. 1 ................................................................................................................................................ ................................................................................................................................................... ................................................................................................................................................... 2 ................................................................................................................................................ ................................................................................................................................................... ................................................................................................................................................... [2] (b) The results of the preliminary experiment are shown in Table 1.1. Table 1.1 percentage concentration time taken for DCPIP rate of light‑dependent stage of chloroplast suspension to decolourise / s of photosynthesis / s–1 10 351 .............................................. 20 59 .............................................. 30 21 .............................................. 40 10 .............................................. 50 5 .............................................. (i) Complete Table 1.1 by calculating the rate of the light‑dependent stage of photosynthesis for each concentration of chloroplast suspension. Give your answers to one decimal place. [2] (c) The student initially trialled the experiment using ice‑cold distilled water instead of ice‑cold 10% sucrose to make the stock chloroplast suspension in step 1. The DCPIP did not decolourise. Suggest why the procedure worked when 10% sucrose solution was used but did not work when distilled water was used in step 1. ................................................................................................................................................... ................................................................................................................................................... ................................................................................................................................................... ................................................................................................................................................... ............................................................................................................................................. [2] (d) The preliminary experiment was carried out at 17 °C. To investigate the effect of temperature on the rate of the light‑dependent stage of photosynthesis, the student added some details to the instructions in steps 7, 8 and 9 to make sure that accurate results were recorded. Describe an investigation that the student could follow to determine the effect of temperature on the rate of the light‑dependent stage of photosynthesis. • Use the results shown in Table 1.1 to decide on a suitable chloroplast suspension for the investigation. • Include details of how you would take accurate results. • Do not include a risk assessment. Your method should be set out in a logical order and be detailed enough to allow another person to follow it. ................................................................................................................................................... ................................................................................................................................................... ................................................................................................................................................... ................................................................................................................................................... ................................................................................................................................................... ................................................................................................................................................... ................................................................................................................................................... ................................................................................................................................................... ................................................................................................................................................... ................................................................................................................................................... ................................................................................................................................................... ................................................................................................................................................... ................................................................................................................................................... ................................................................................................................................................... ................................................................................................................................................... ................................................................................................................................................... ................................................................................................................................................... ................................................................................................................................................... ................................................................................................................................................... ................................................................................................................................................... ................................................................................................................................................... ............................................................................................................................................. [6] [Total: 15]
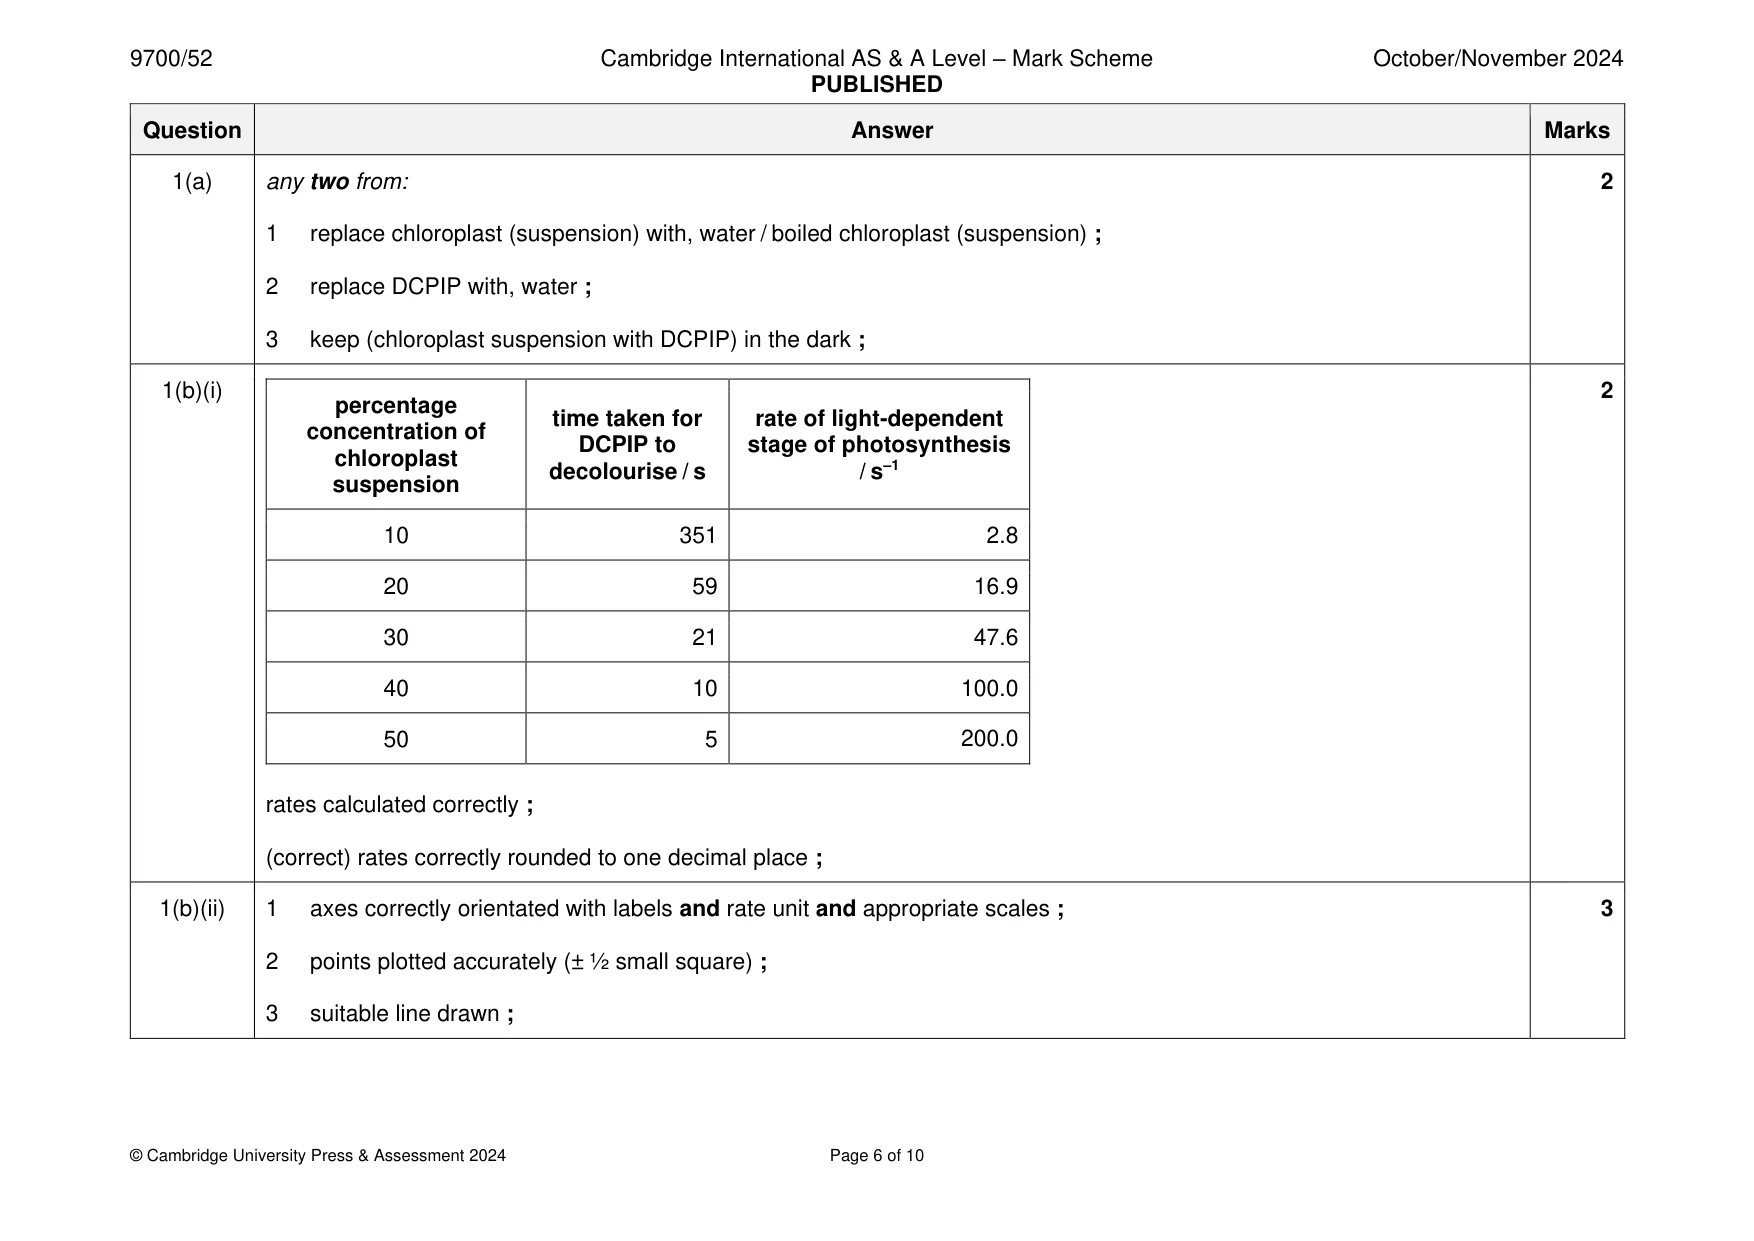
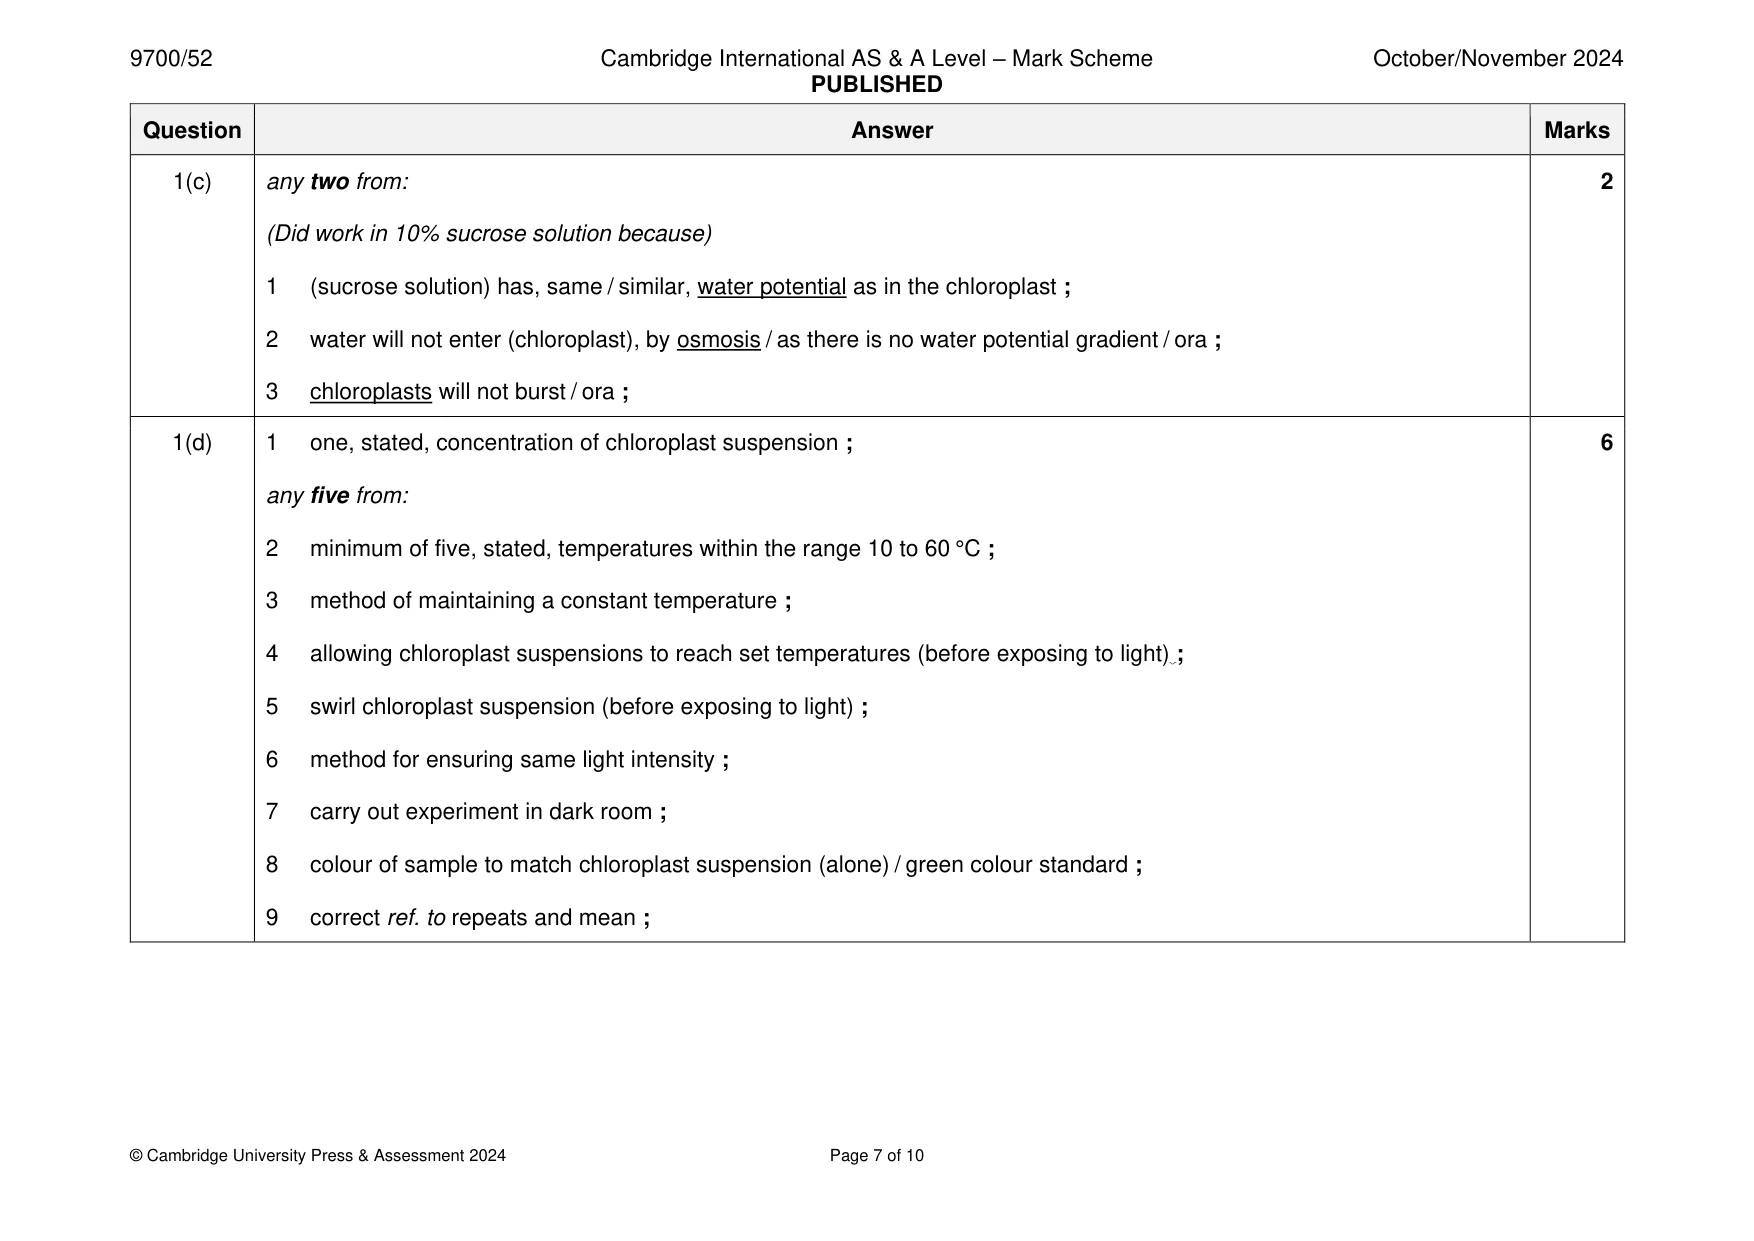
Mark scheme: Question Answer Marks 1(a) any two from: 2 1 replace chloroplast (suspension) with, water / boiled chloroplast (suspension) ; 2 replace DCPIP with, water ; 3 keep (chloroplast suspension with DCPIP) in the dark ; 1(b)(i) 2 percentage time taken for rate of light-dependent concentration of DCPIP to stage of photosynthesis chloroplast decolourise / s / s–1 suspension 10 351 2.8 20 59 16.9 30 21 47.6 40 10 100.0 50 5 200.0 rates calculated correctly ; (correct) rates correctly rounded to one decimal place ; 1(b)(ii) 1 axes correctly orientated with labels and rate unit and appropriate scales ; 3 2 points plotted accurately (± ½ small square) ; 3 suitable line drawn ; 1(c) any two from: 2 (Did work in 10% sucrose solution because) 1 (sucrose solution) has, same / similar, water potential as in the chloroplast ; 2 water will not enter (chloroplast), by osmosis / as there is no water potential gradient / ora ; 3 chloroplasts will not burst / ora ; 1(d) 1 one, stated, concentration of chloroplast suspension ; 6 any five from: 2 minimum of five, stated, temperatures within the range 10 to 60 °C ; 3 method of maintaining a constant temperature ; 4 allowing chloroplast suspensions to reach set temperatures (before exposing to light) ; 5 swirl chloroplast suspension (before exposing to light) ; 6 method for ensuring same light intensity ; 7 carry out experiment in dark room ; 8 colour of sample to match chloroplast suspension (alone) / green colour standard ; 9 correct ref. to repeats and mean ;
Q2 · The two‑spot ladybird, Adalia bipunctata, is a species of small, flying beetle that is…
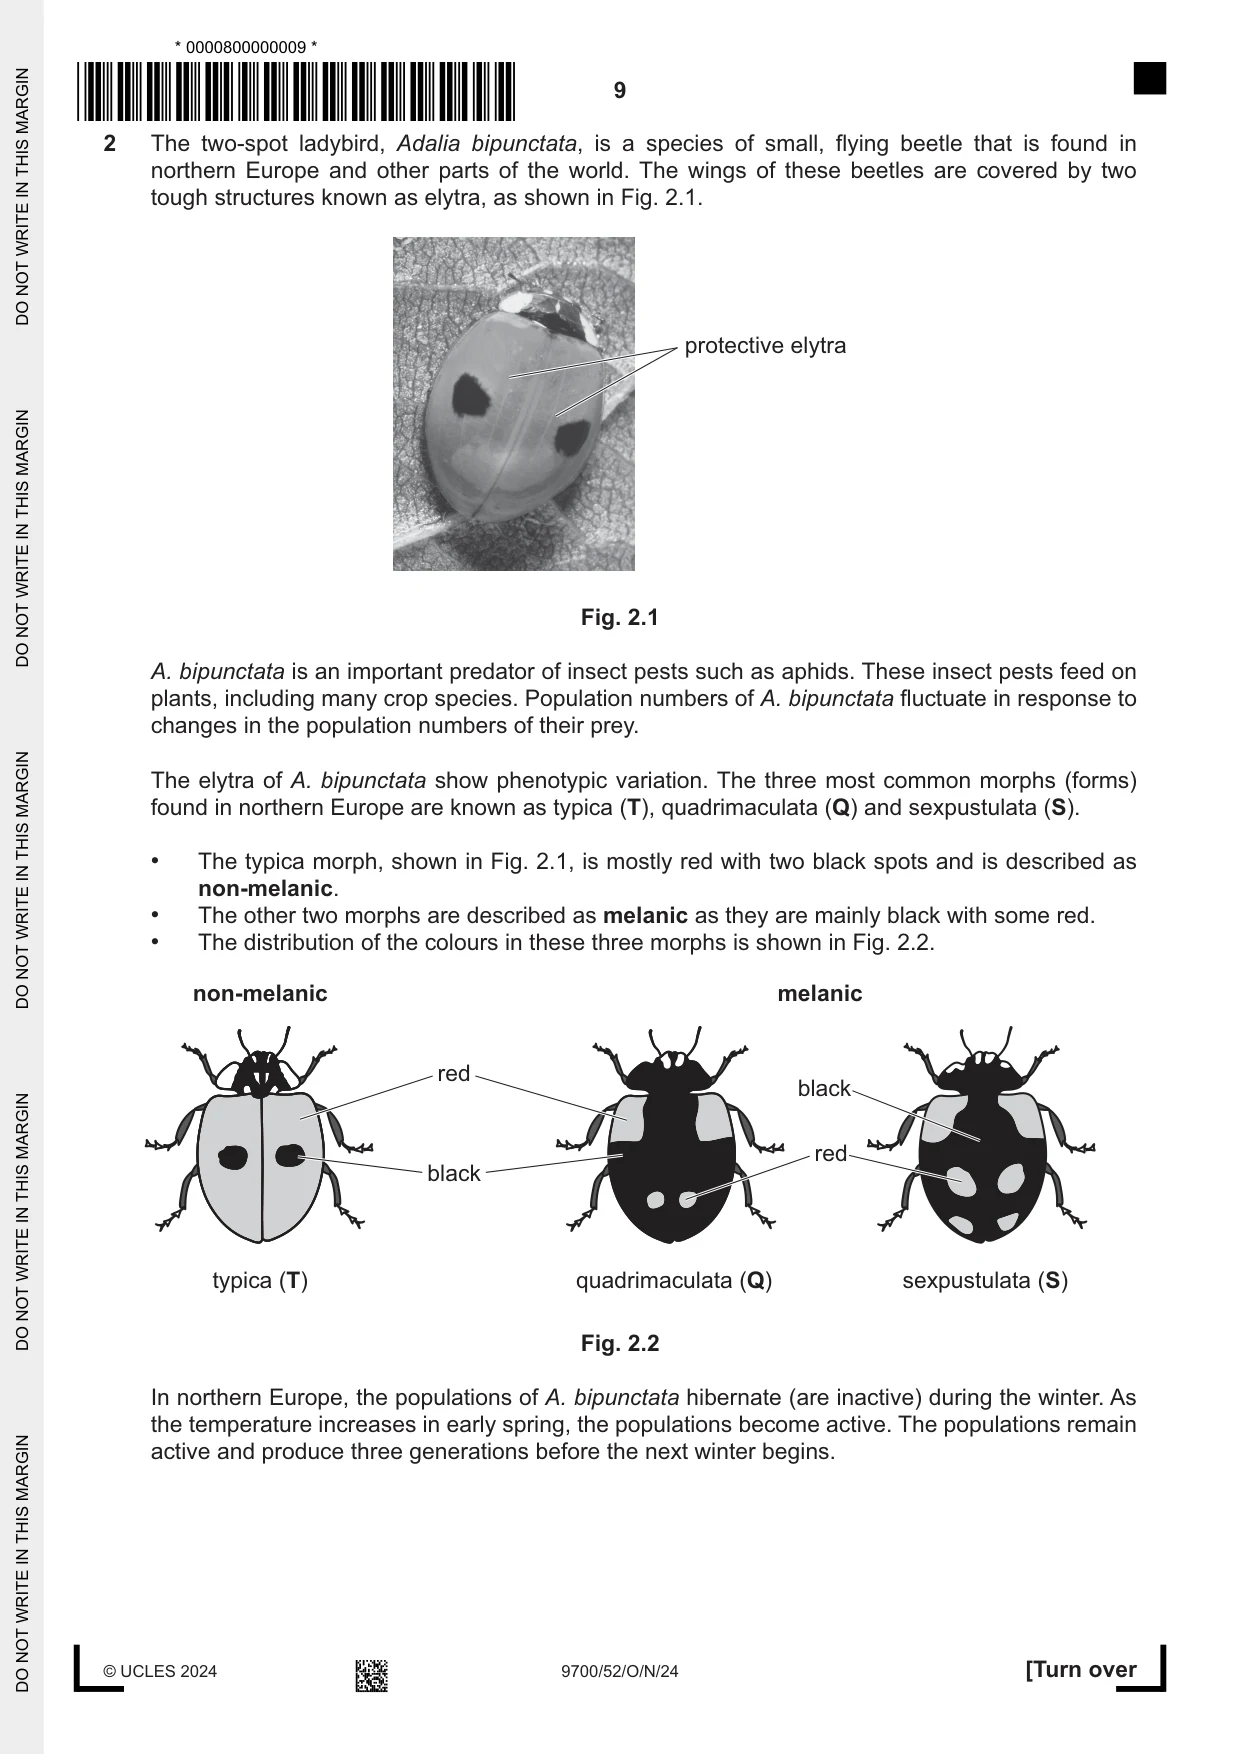
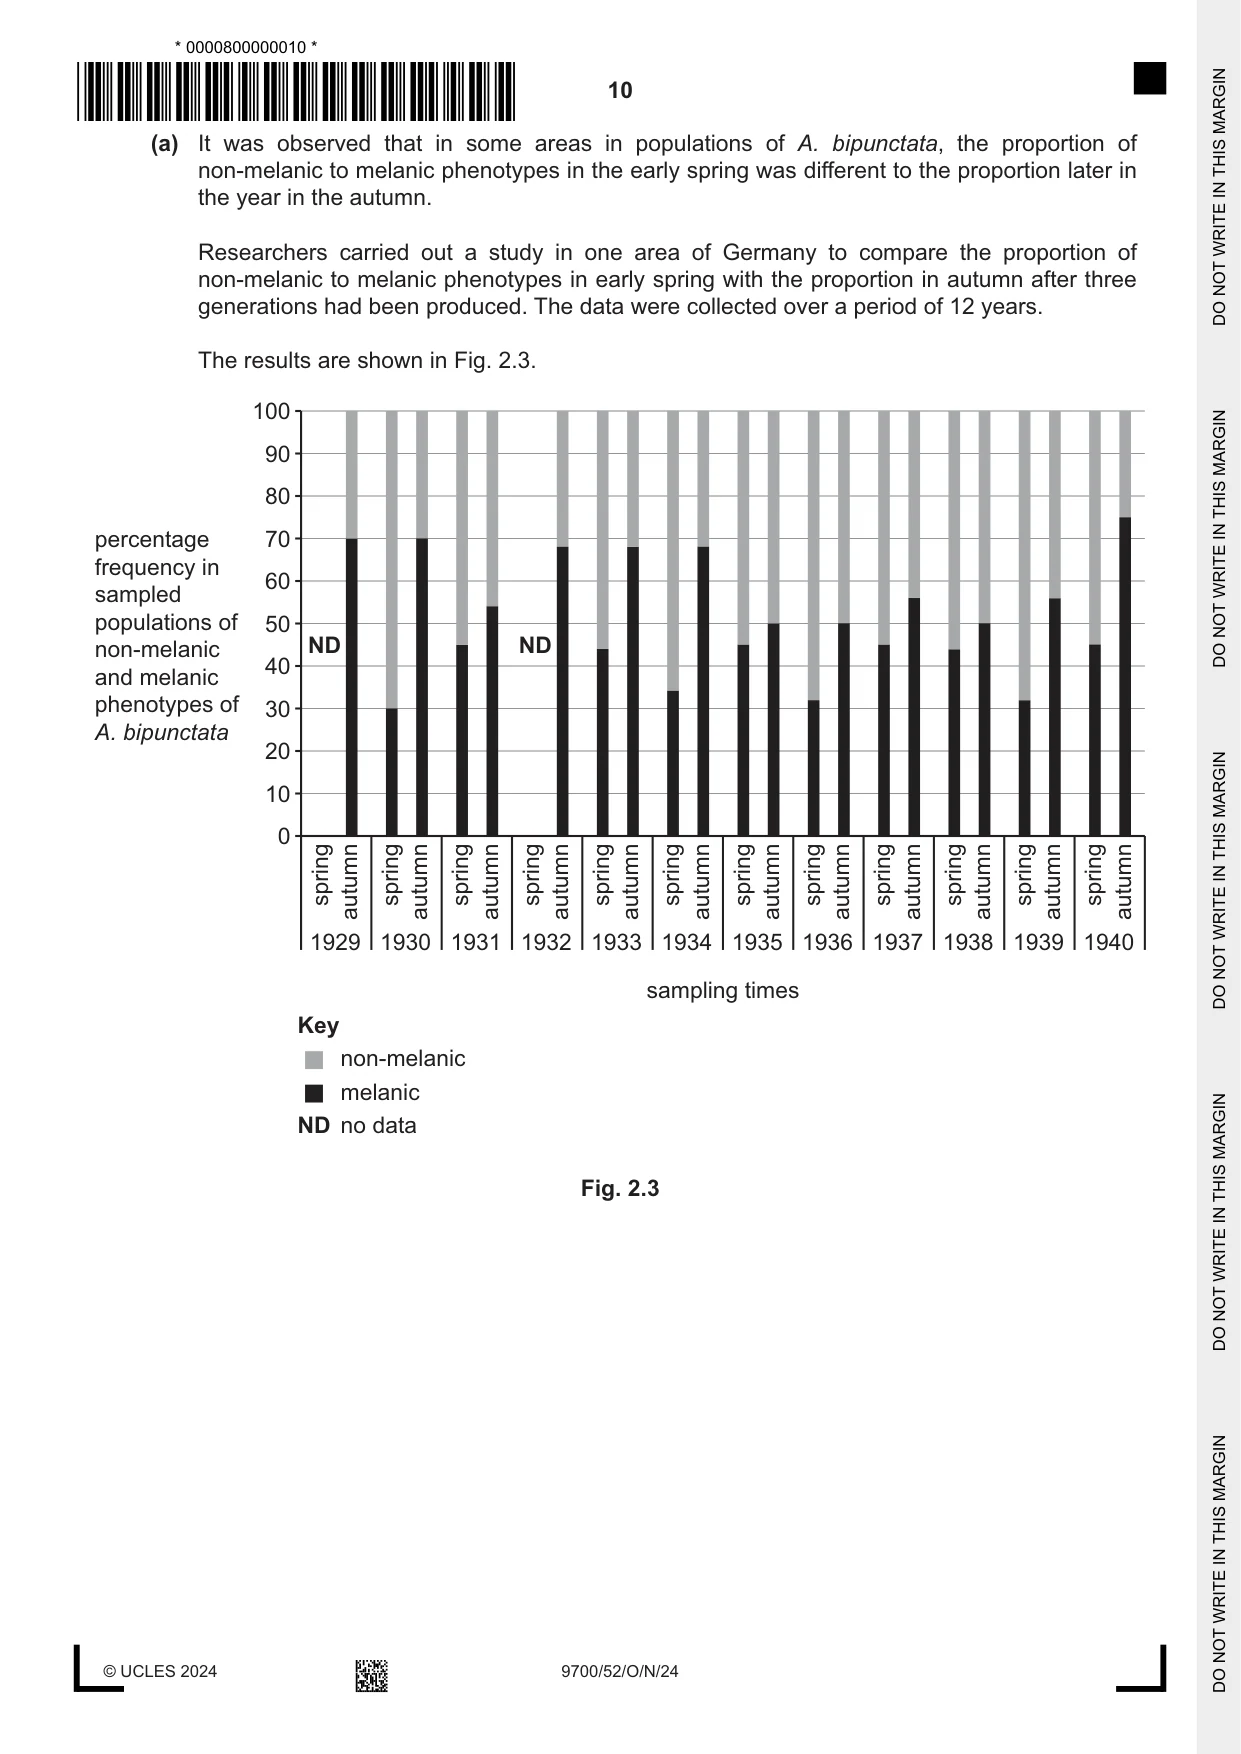
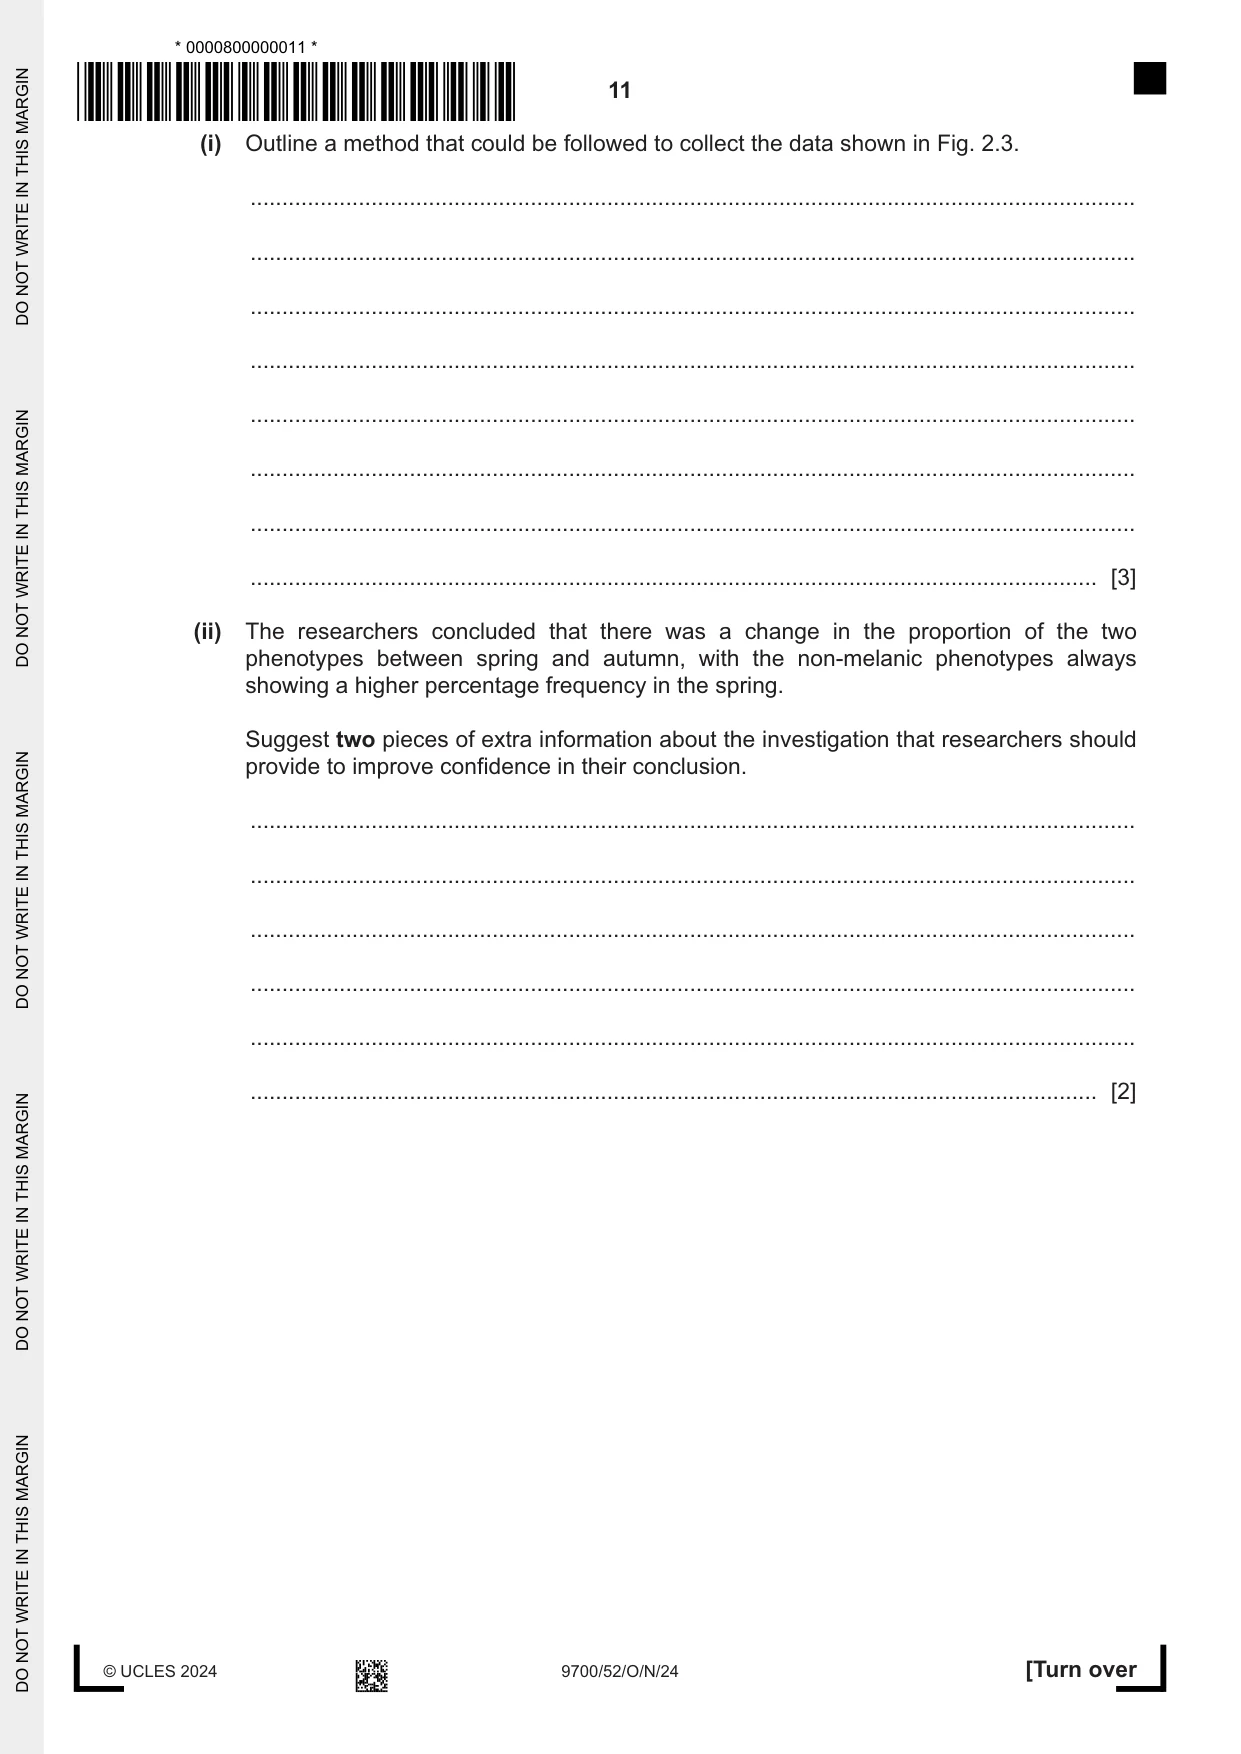
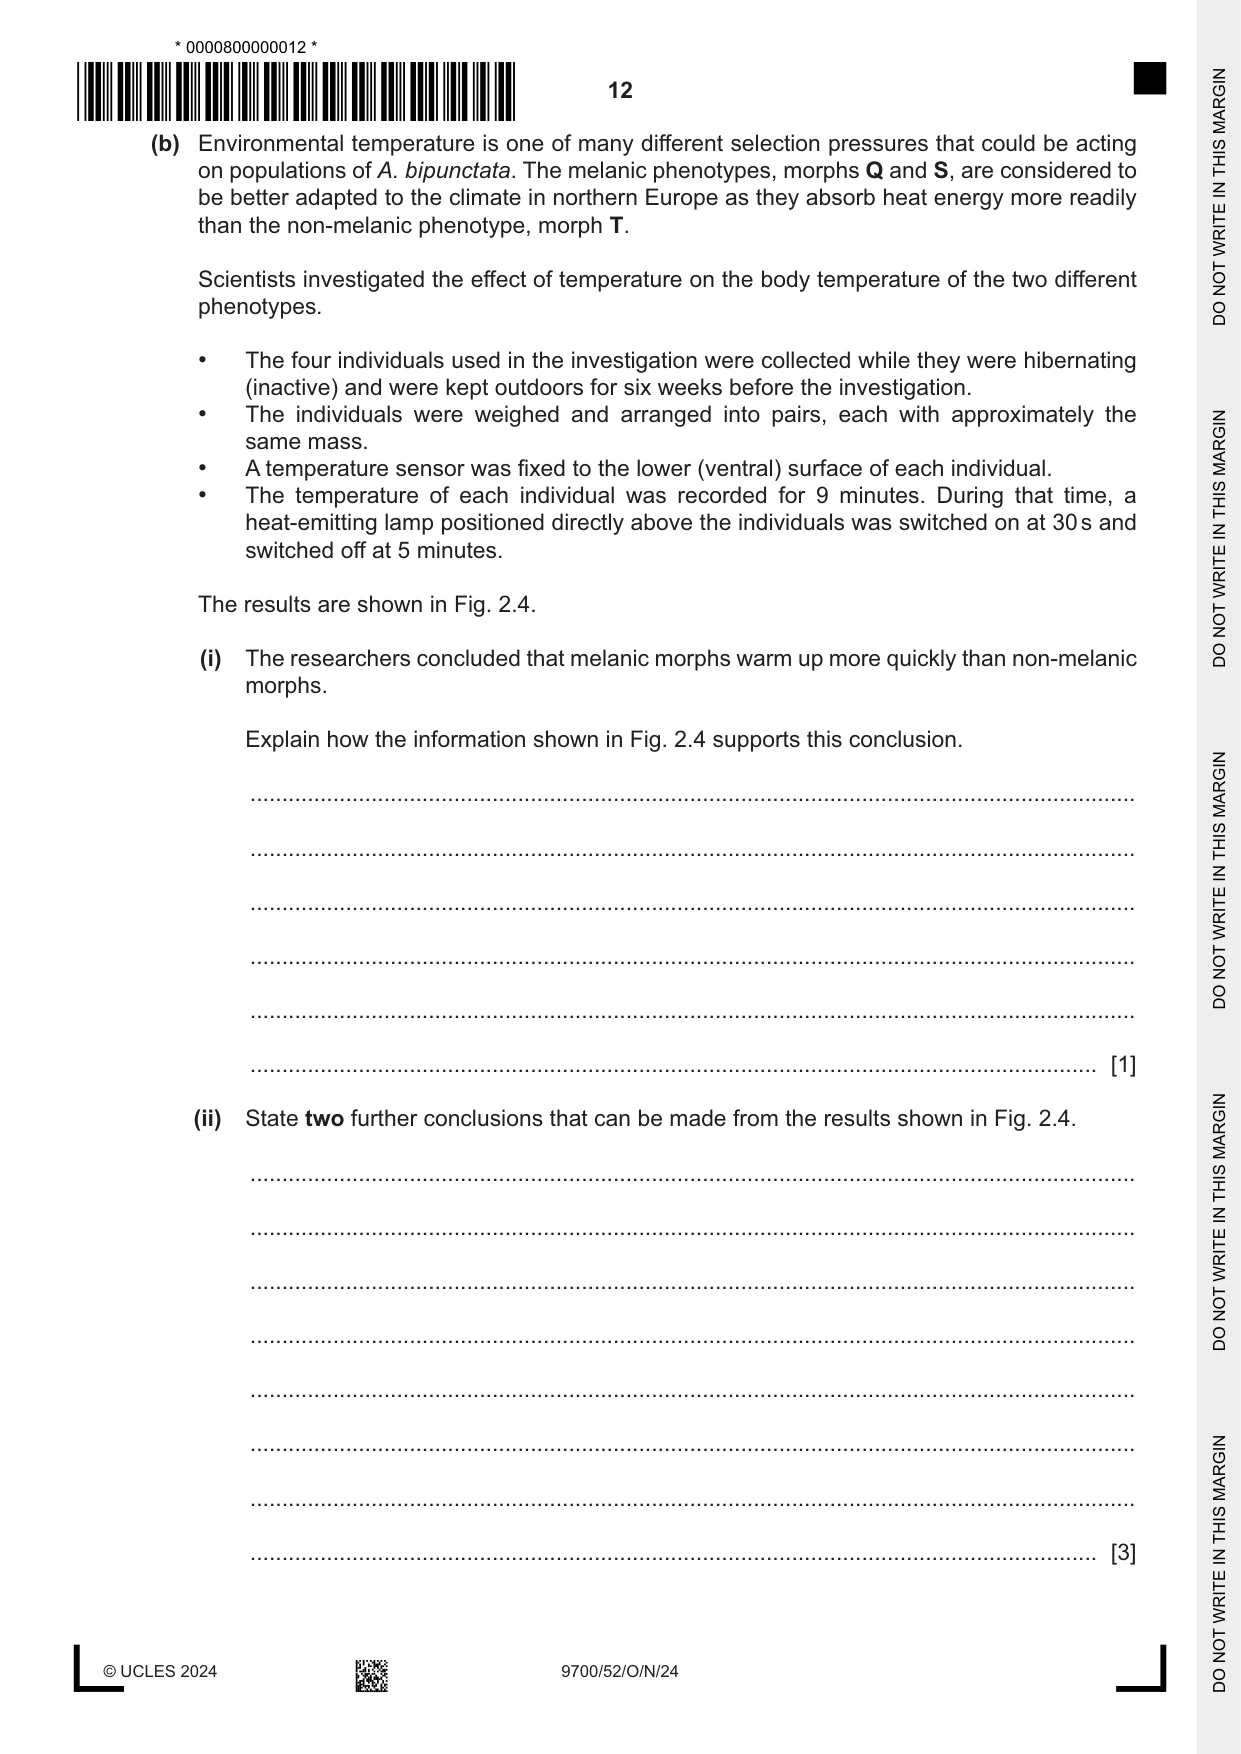
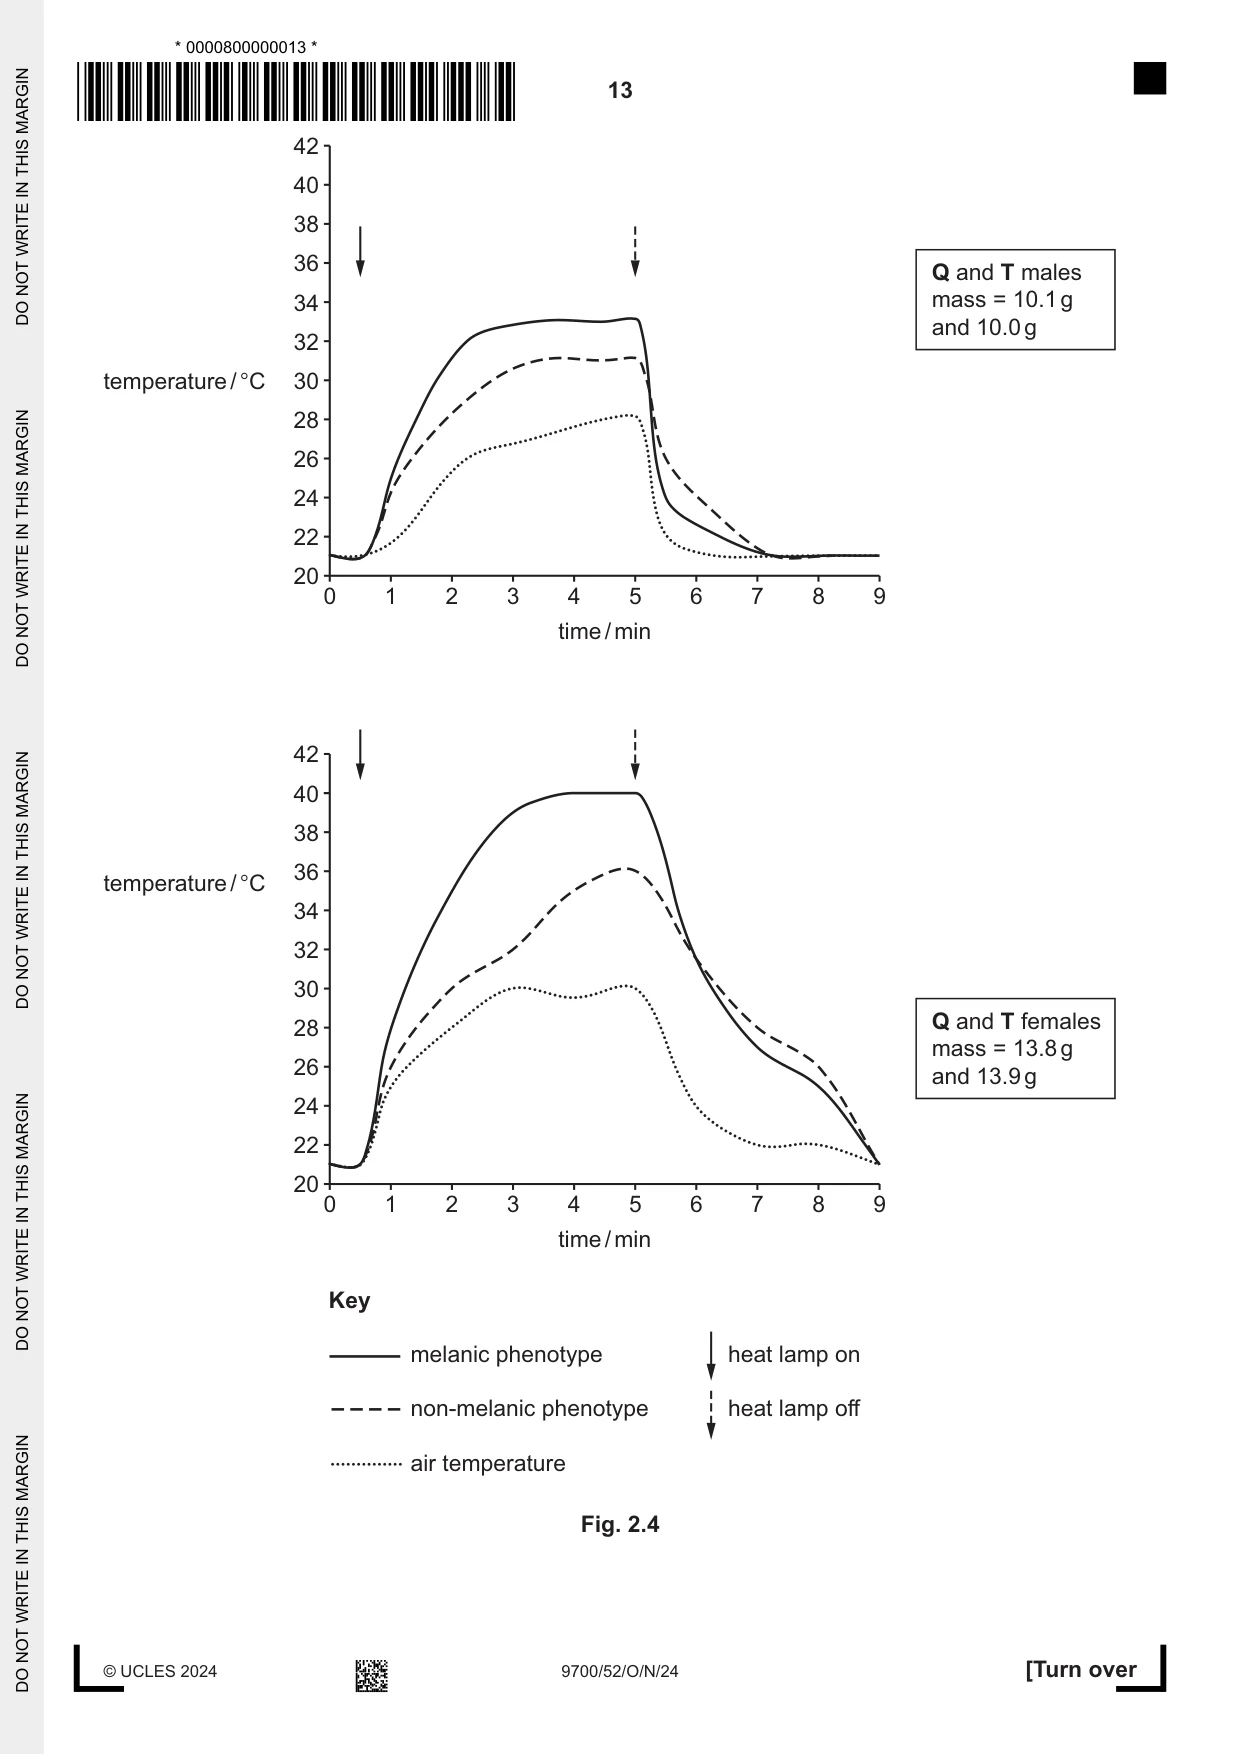
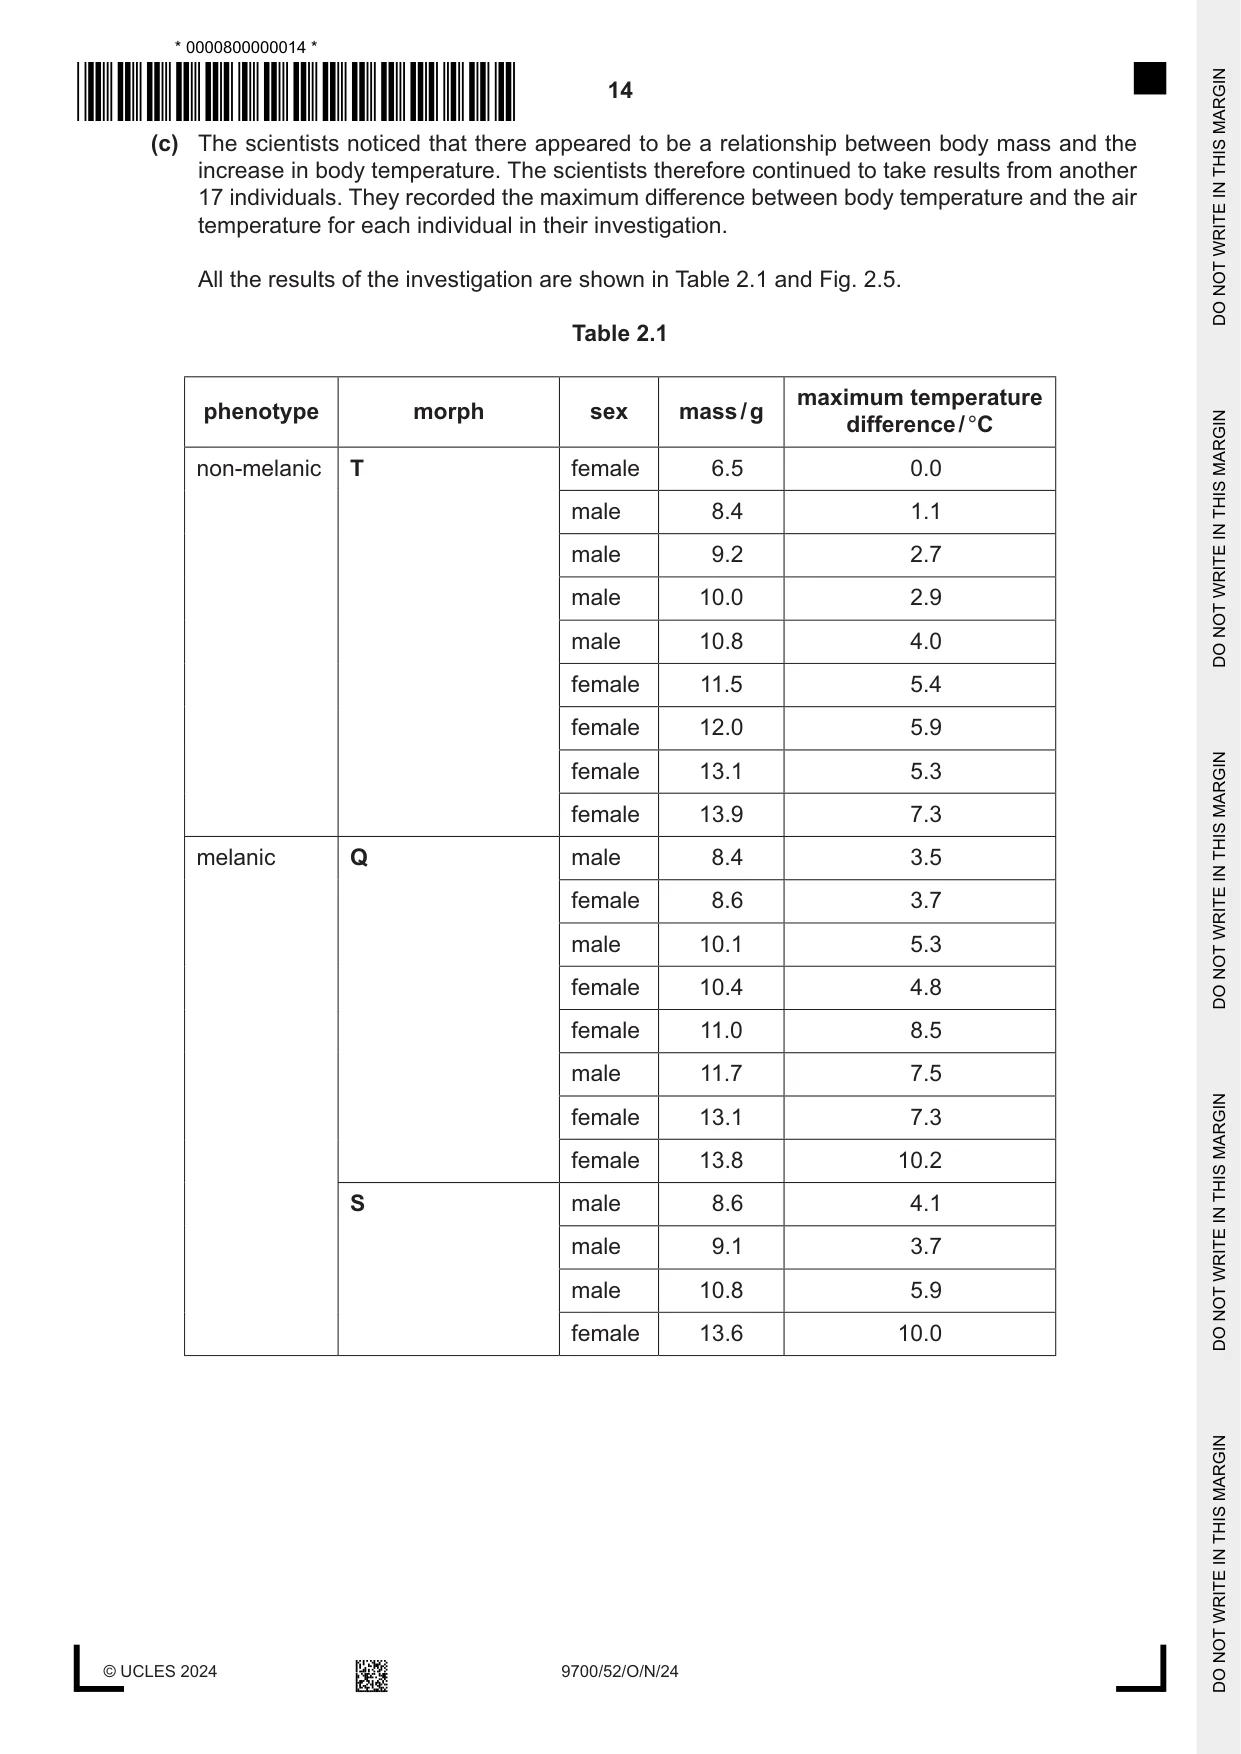
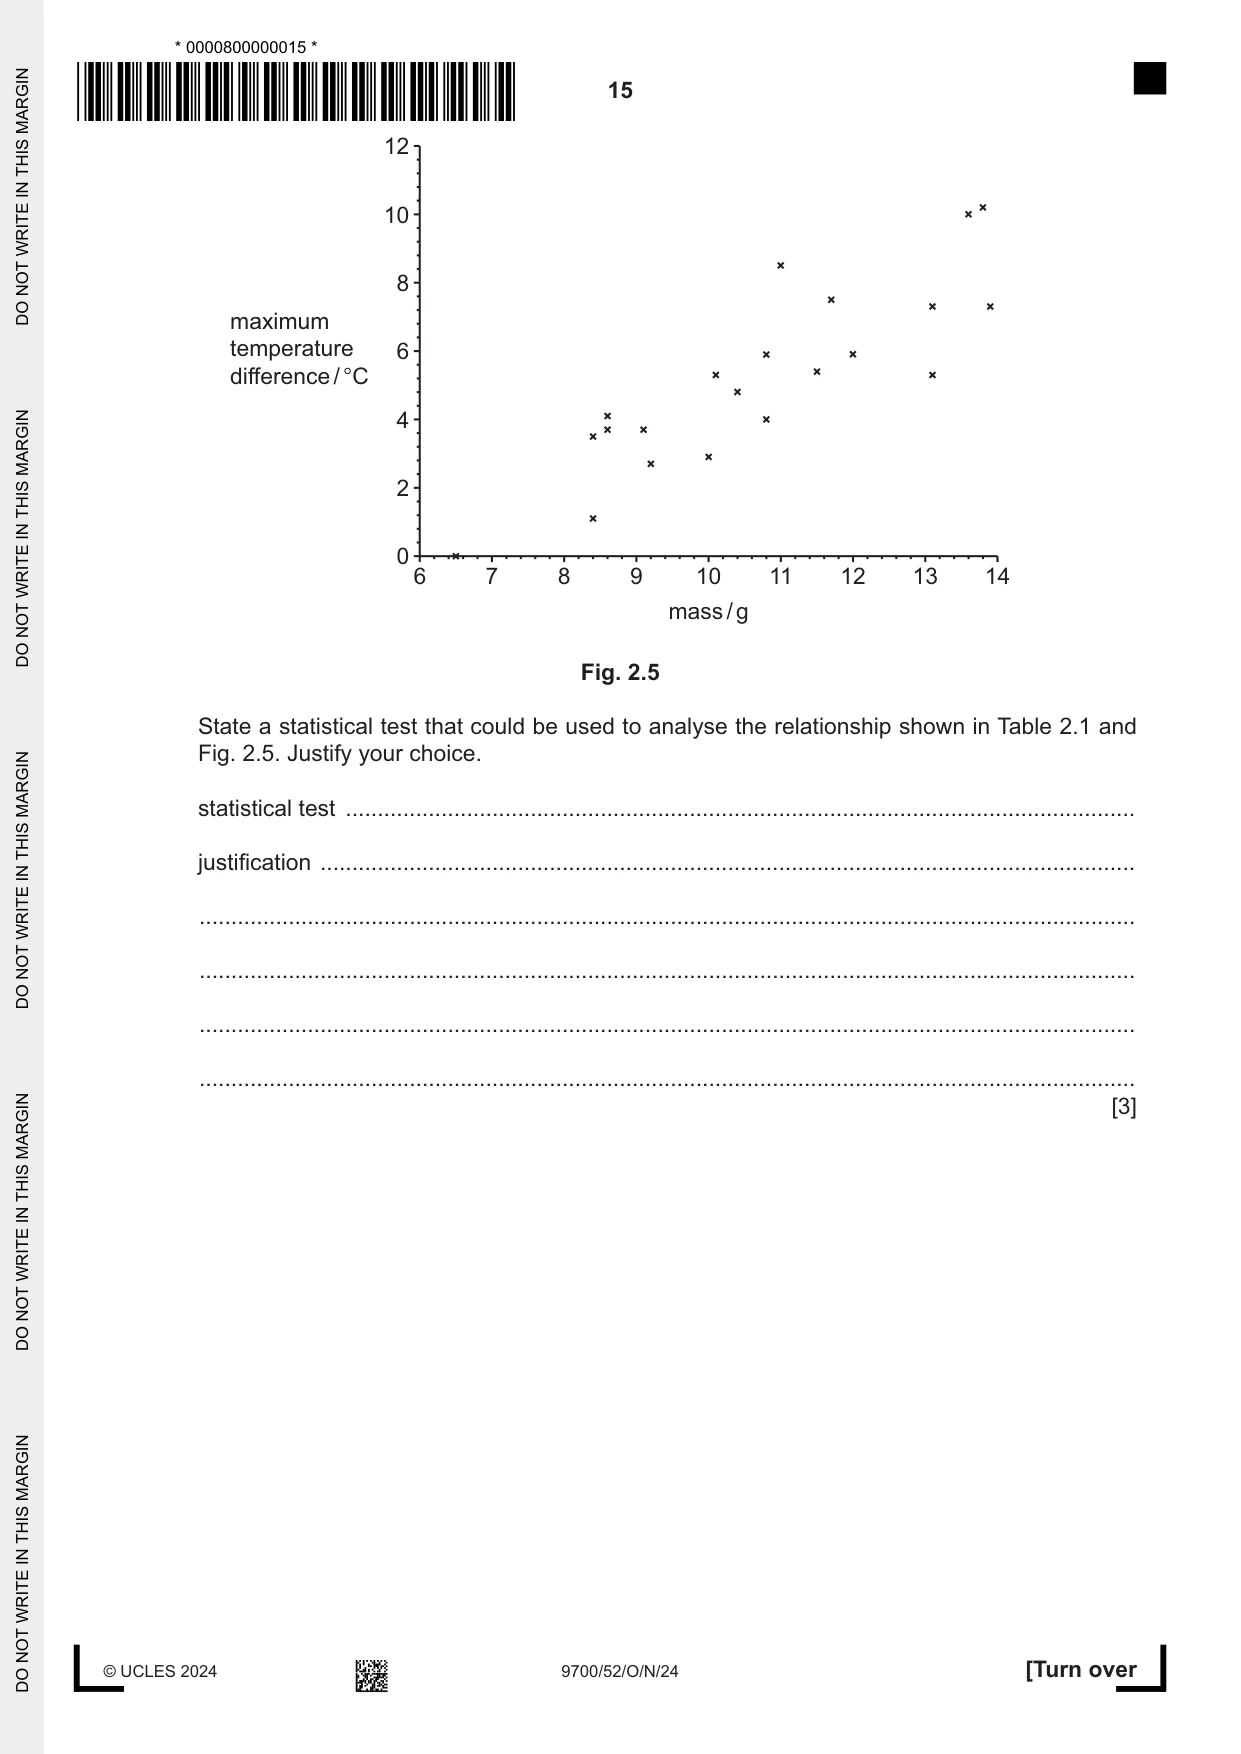
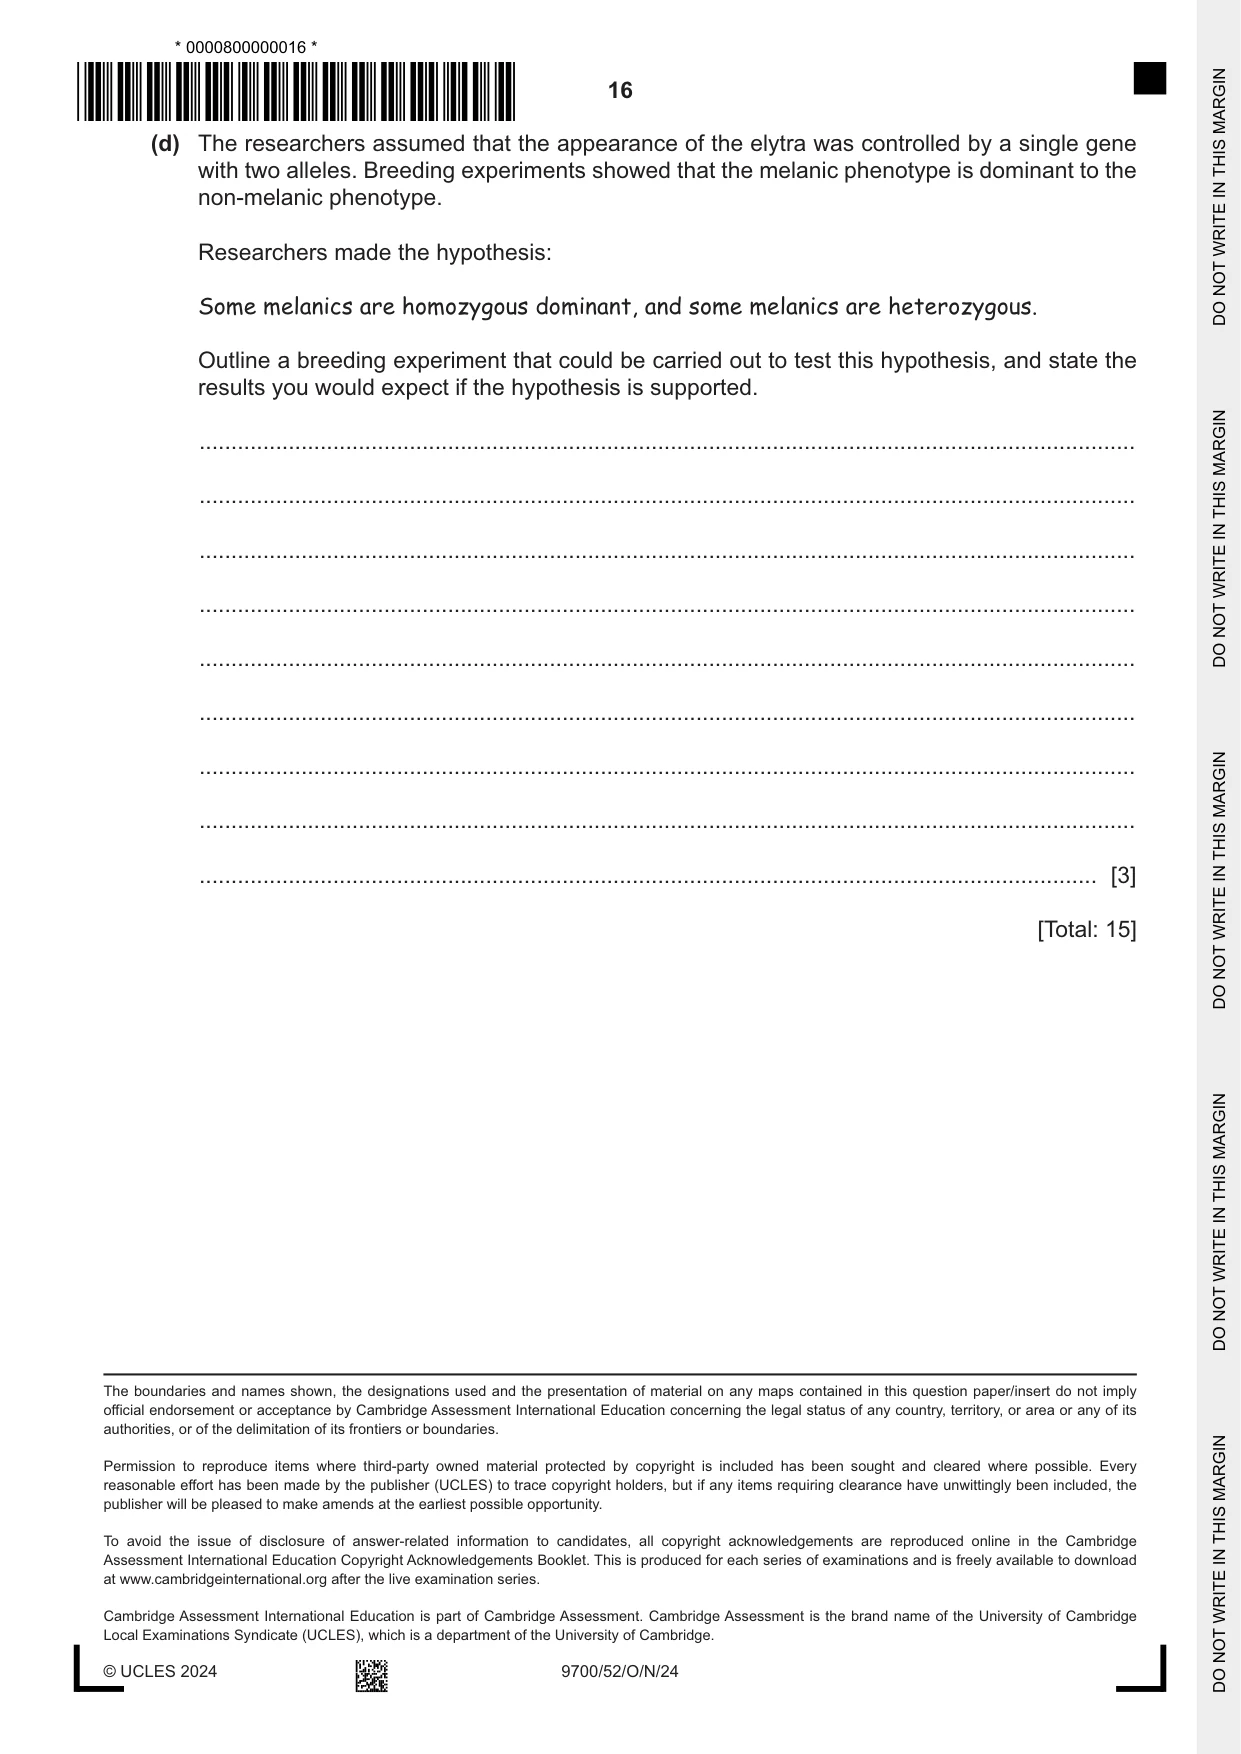
2 The two‑spot ladybird, Adalia bipunctata, is a species of small, flying beetle that is found in northern Europe and other parts of the world. The wings of these beetles are covered by two tough structures known as elytra, as shown in Fig. 2.1. protective elytra Fig. 2.1 A. bipunctata is an important predator of insect pests such as aphids. These insect pests feed on plants, including many crop species. Population numbers of A. bipunctata fluctuate in response to changes in the population numbers of their prey. The elytra of A. bipunctata show phenotypic variation. The three most common morphs (forms) found in northern Europe are known as typica (T), quadrimaculata (Q) and sexpustulata (S). • The typica morph, shown in Fig. 2.1, is mostly red with two black spots and is described as non‑melanic. • The other two morphs are described as melanic as they are mainly black with some red. • The distribution of the colours in these three morphs is shown in Fig. 2.2. non-melanic melanic red black red black typica (T) quadrimaculata (Q) sexpustulata (S) Fig. 2.2 In northern Europe, the populations of A. bipunctata hibernate (are inactive) during the winter. As the temperature increases in early spring, the populations become active. The populations remain active and produce three generations before the next winter begins. (a) It was observed that in some areas in populations of A. bipunctata, the proportion of non‑melanic to melanic phenotypes in the early spring was different to the proportion later in the year in the autumn. Researchers carried out a study in one area of Germany to compare the proportion of non‑melanic to melanic phenotypes in early spring with the proportion in autumn after three generations had been produced. The data were collected over a period of 12 years. The results are shown in Fig. 2.3. 100 90 80 percentage 70 frequency in 60 sampled populations of 50 non-melanic ND ND 40and melanic phenotypes of 30 A. bipunctata 20 10 0 spring autumn spring autumn spring autumn spring autumn spring autumn spring autumn spring autumn spring autumn spring autumn spring autumn spring autumn spring autumn 1929 1930 1931 1932 1933 1934 1935 1936 1937 1938 1939 1940 sampling times Key non-melanic melanic ND no data Fig. 2.3 (i) Outline a method that could be followed to collect the data shown in Fig. 2.3. ........................................................................................................................................... ........................................................................................................................................... ........................................................................................................................................... ........................................................................................................................................... ........................................................................................................................................... ........................................................................................................................................... ........................................................................................................................................... ..................................................................................................................................... [3] (ii) The researchers concluded that there was a change in the proportion of the two phenotypes between spring and autumn, with the non‑melanic phenotypes always showing a higher percentage frequency in the spring. Suggest two pieces of extra information about the investigation that researchers should provide to improve confidence in their conclusion. ........................................................................................................................................... ........................................................................................................................................... ........................................................................................................................................... ........................................................................................................................................... ........................................................................................................................................... ..................................................................................................................................... [2]
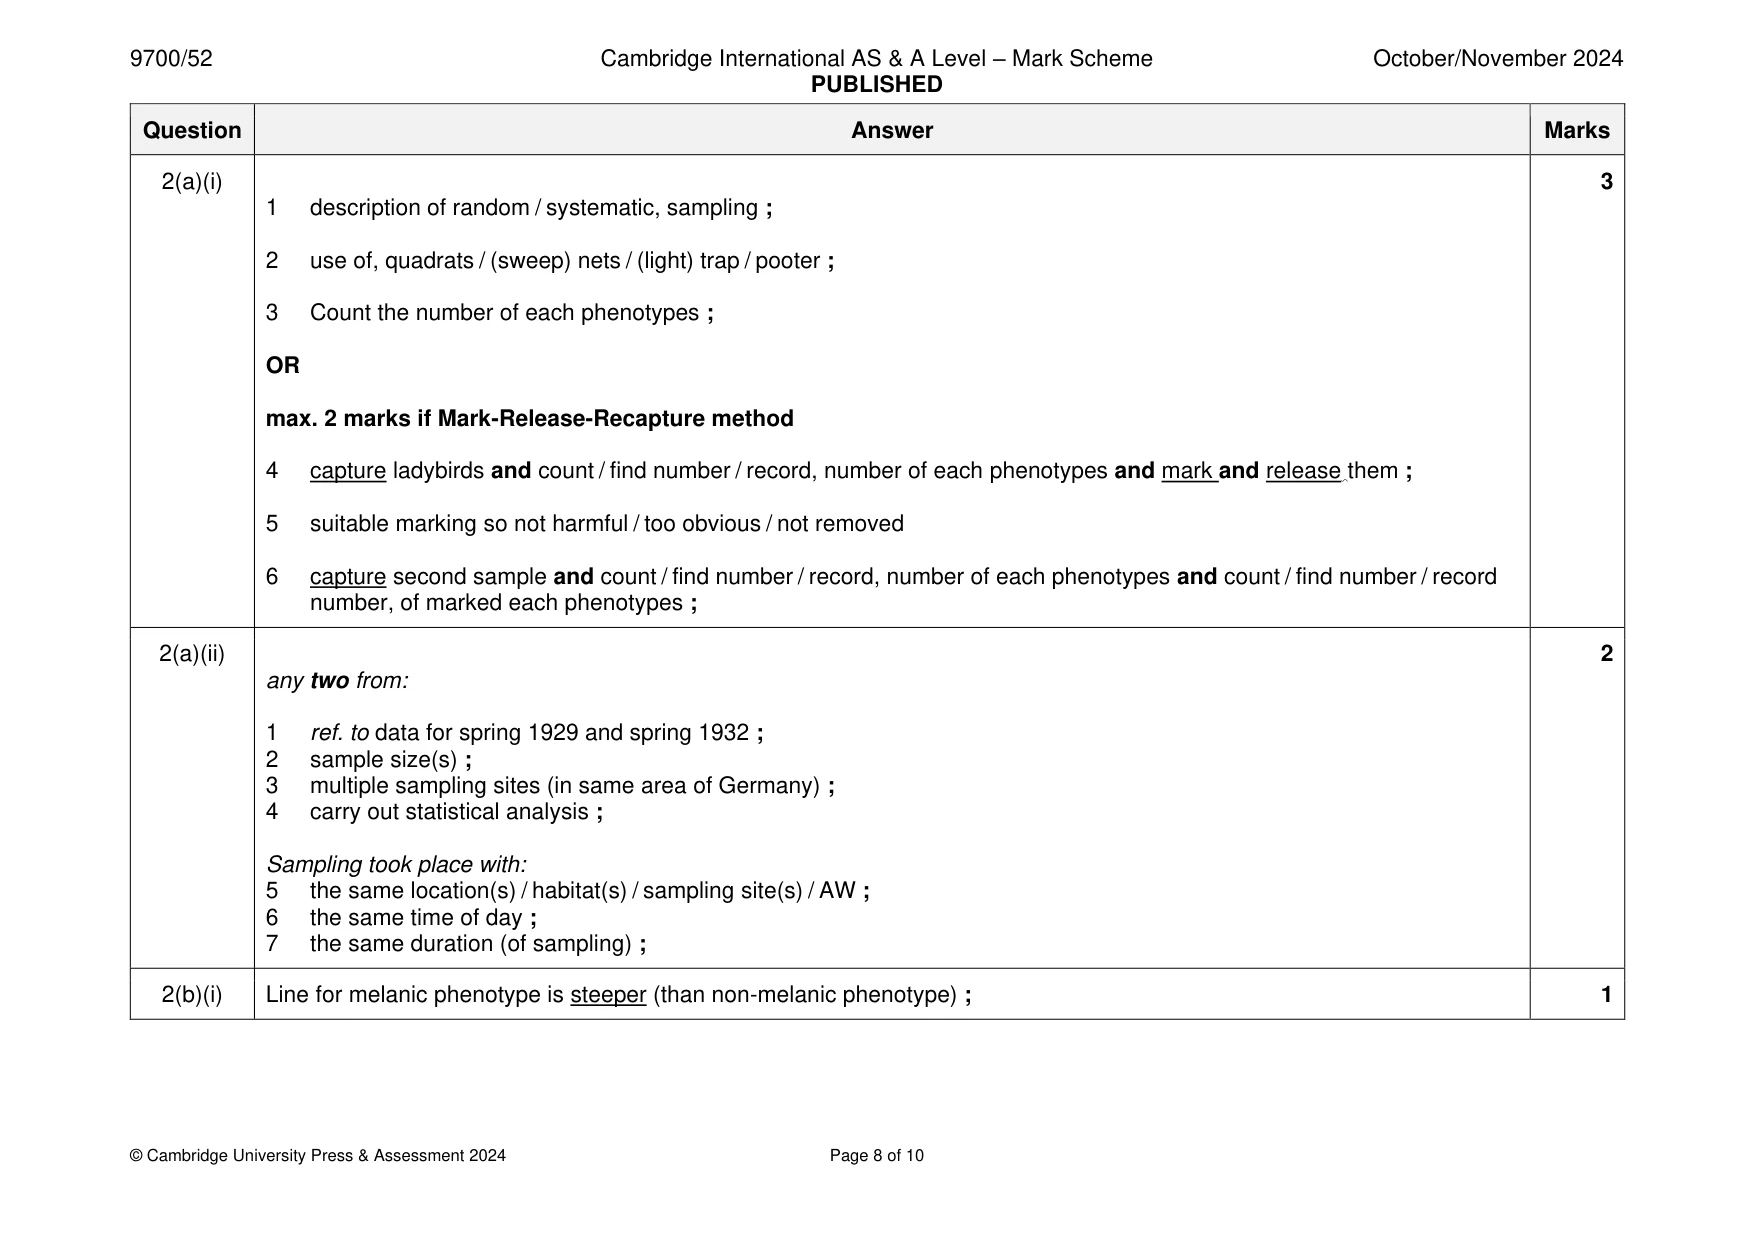
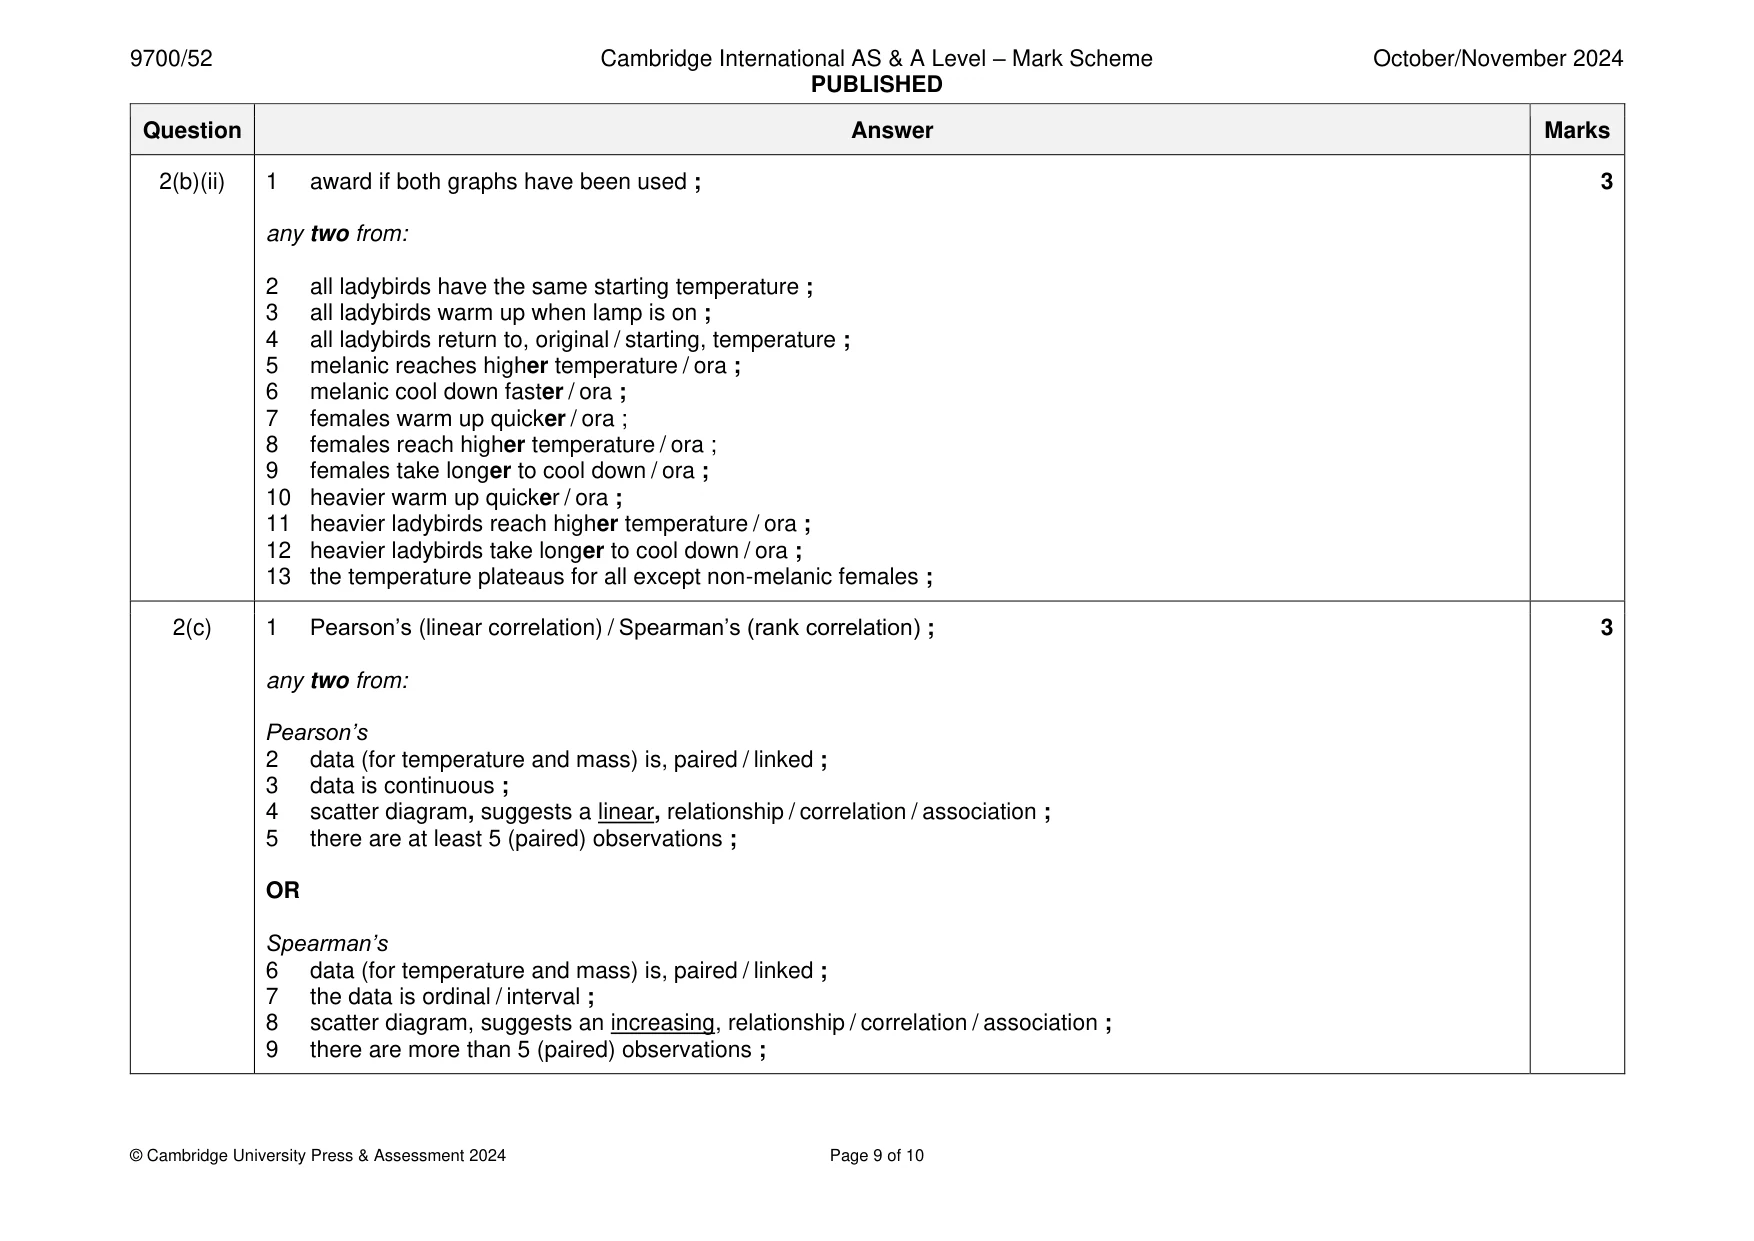
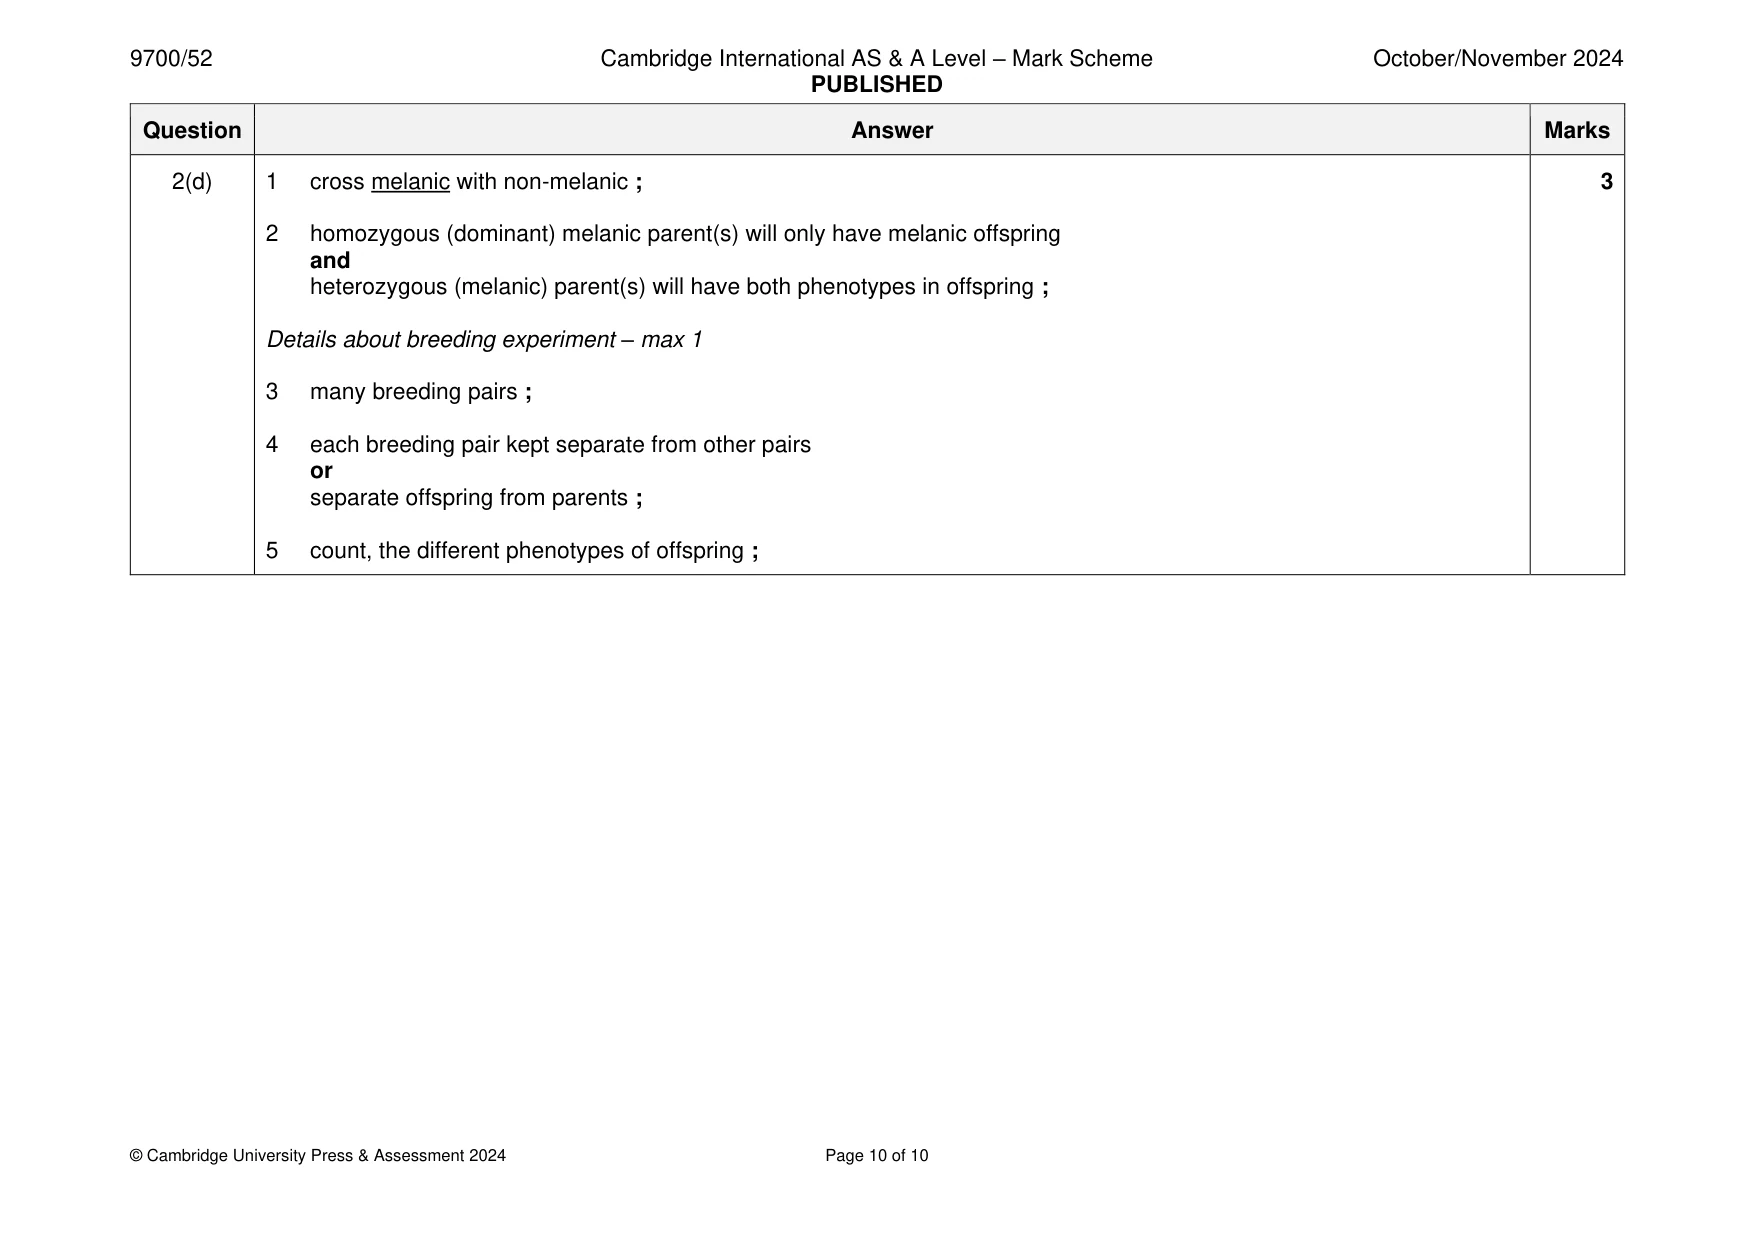
Mark scheme: 2(a)(i) 3 1 description of random / systematic, sampling ; 2 use of, quadrats / (sweep) nets / (light) trap / pooter ; 3 Count the number of each phenotypes ; OR max. 2 marks if Mark-Release-Recapture method 4 capture ladybirds and count / find number / record, number of each phenotypes and mark and release them ; 5 suitable marking so not harmful / too obvious / not removed 6 capture second sample and count / find number / record, number of each phenotypes and count / find number / record number, of marked each phenotypes ; 2(a)(ii) 2 any two from: 1 ref. to data for spring 1929 and spring 1932 ; 2 sample size(s) ; 3 multiple sampling sites (in same area of Germany) ; 4 carry out statistical analysis ; Sampling took place with: 5 the same location(s) / habitat(s) / sampling site(s) / AW ; 6 the same time of day ; 7 the same duration (of sampling) ; 2(b)(i) Line for melanic phenotype is steeper (than non-melanic phenotype) ; 1 2(b)(ii) 1 award if both graphs have been used ; 3 any two from: 2 all ladybirds have the same starting temperature ; 3 all ladybirds warm up when lamp is on ; 4 all ladybirds return to, original / starting, temperature ; 5 melanic reaches higher temperature / ora ; 6 melanic cool down faster / ora ; 7 females warm up quicker / ora ; 8 females reach higher temperature / ora ; 9 females take longer to cool down / ora ; 10 heavier warm up quicker / ora ; 11 heavier ladybirds reach higher temperature / ora ; 12 heavier ladybirds take longer to cool down / ora ; 13 the temperature plateaus for all except non-melanic females ; 2(c) 1 Pearson’s (linear correlation) / Spearman’s (rank correlation) ; 3 any two from: Pearson’s 2 data (for temperature and mass) is, paired / linked ; 3 data is continuous ; 4 scatter diagram, suggests a linear, relationship / correlation / association ; 5 there are at least 5 (paired) observations ; OR Spearman’s 6 data (for temperature and mass) is, paired / linked ; 7 the data is ordinal / interval ; 8 scatter diagram, suggests an increasing, relationship / correlation / association ; 9 there are more than 5 (paired) observations ; 2(d) 1 cross melanic with non-melanic ; 3 2 homozygous (dominant) melanic parent(s) will only have melanic offspring and heterozygous (melanic) parent(s) will have both phenotypes in offspring ; Details about breeding experiment – max 1 3 many breeding pairs ; 4 each breeding pair kept separate from other pairs or separate offspring from parents ; 5 count, the different phenotypes of offspring ;
What was in this paper
The subtopics covered by these 2 questions, and how many questions each got. Open one in a new tab to see every Cambridge question on it.
What you needed in this session
Cambridge’s own grade thresholds for 2024 Oct/Nov, Paper 5 · Variant 2. A higher threshold means an easier paper — the bar moves with how the cohort did.