Cambridge A Level Biology 9700 — 2025 May/June Paper 5 · Variant 1
9700/51/M/J/25 · 2 questions · 30 marks · 75 min
The question paper and its mark scheme, free to read here and free to download. This is Cambridge’s own paper, exactly as it was sat.
Question paper16 pages





Mark scheme14 pages
Answers below. Sit the paper first if you are practising.


Questions as text
Q1 · Pepsin is an enzyme that is present in gastric juice
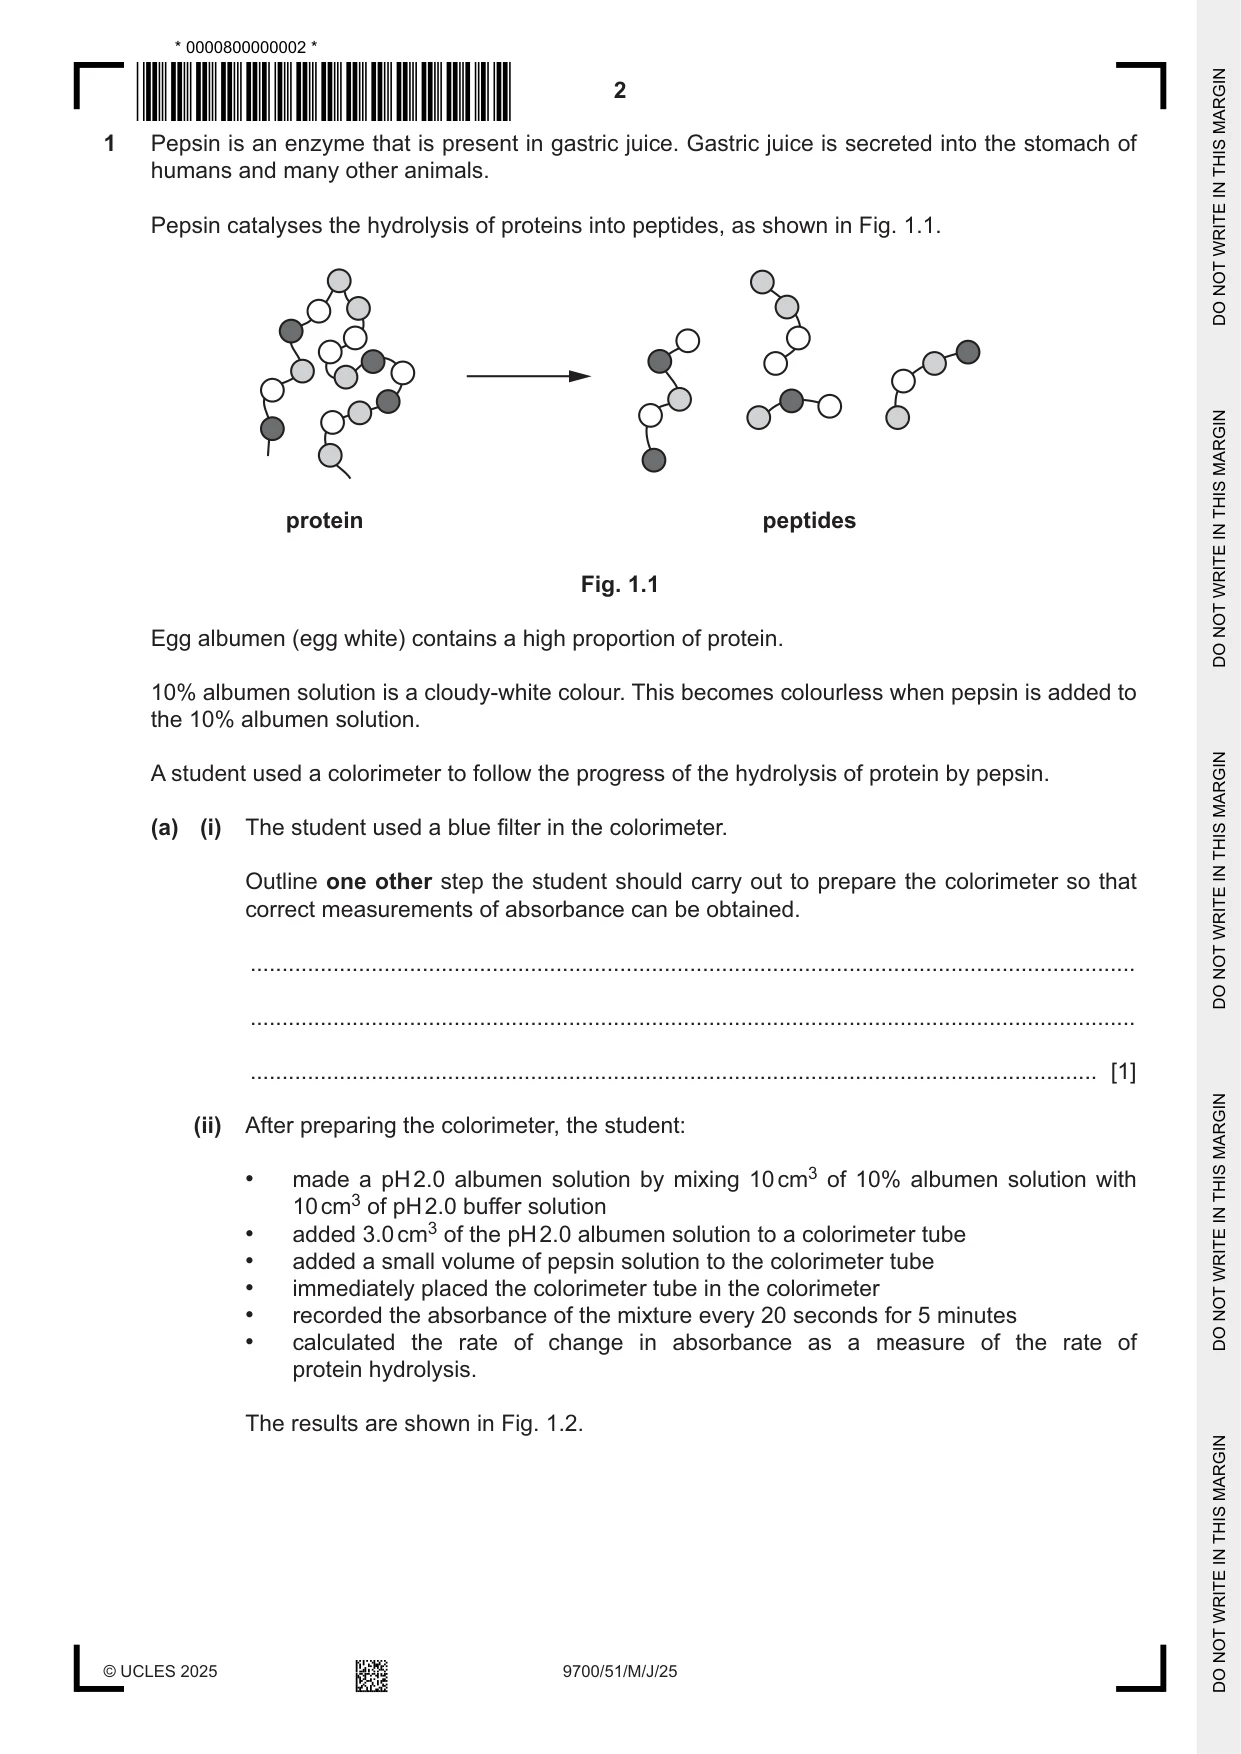
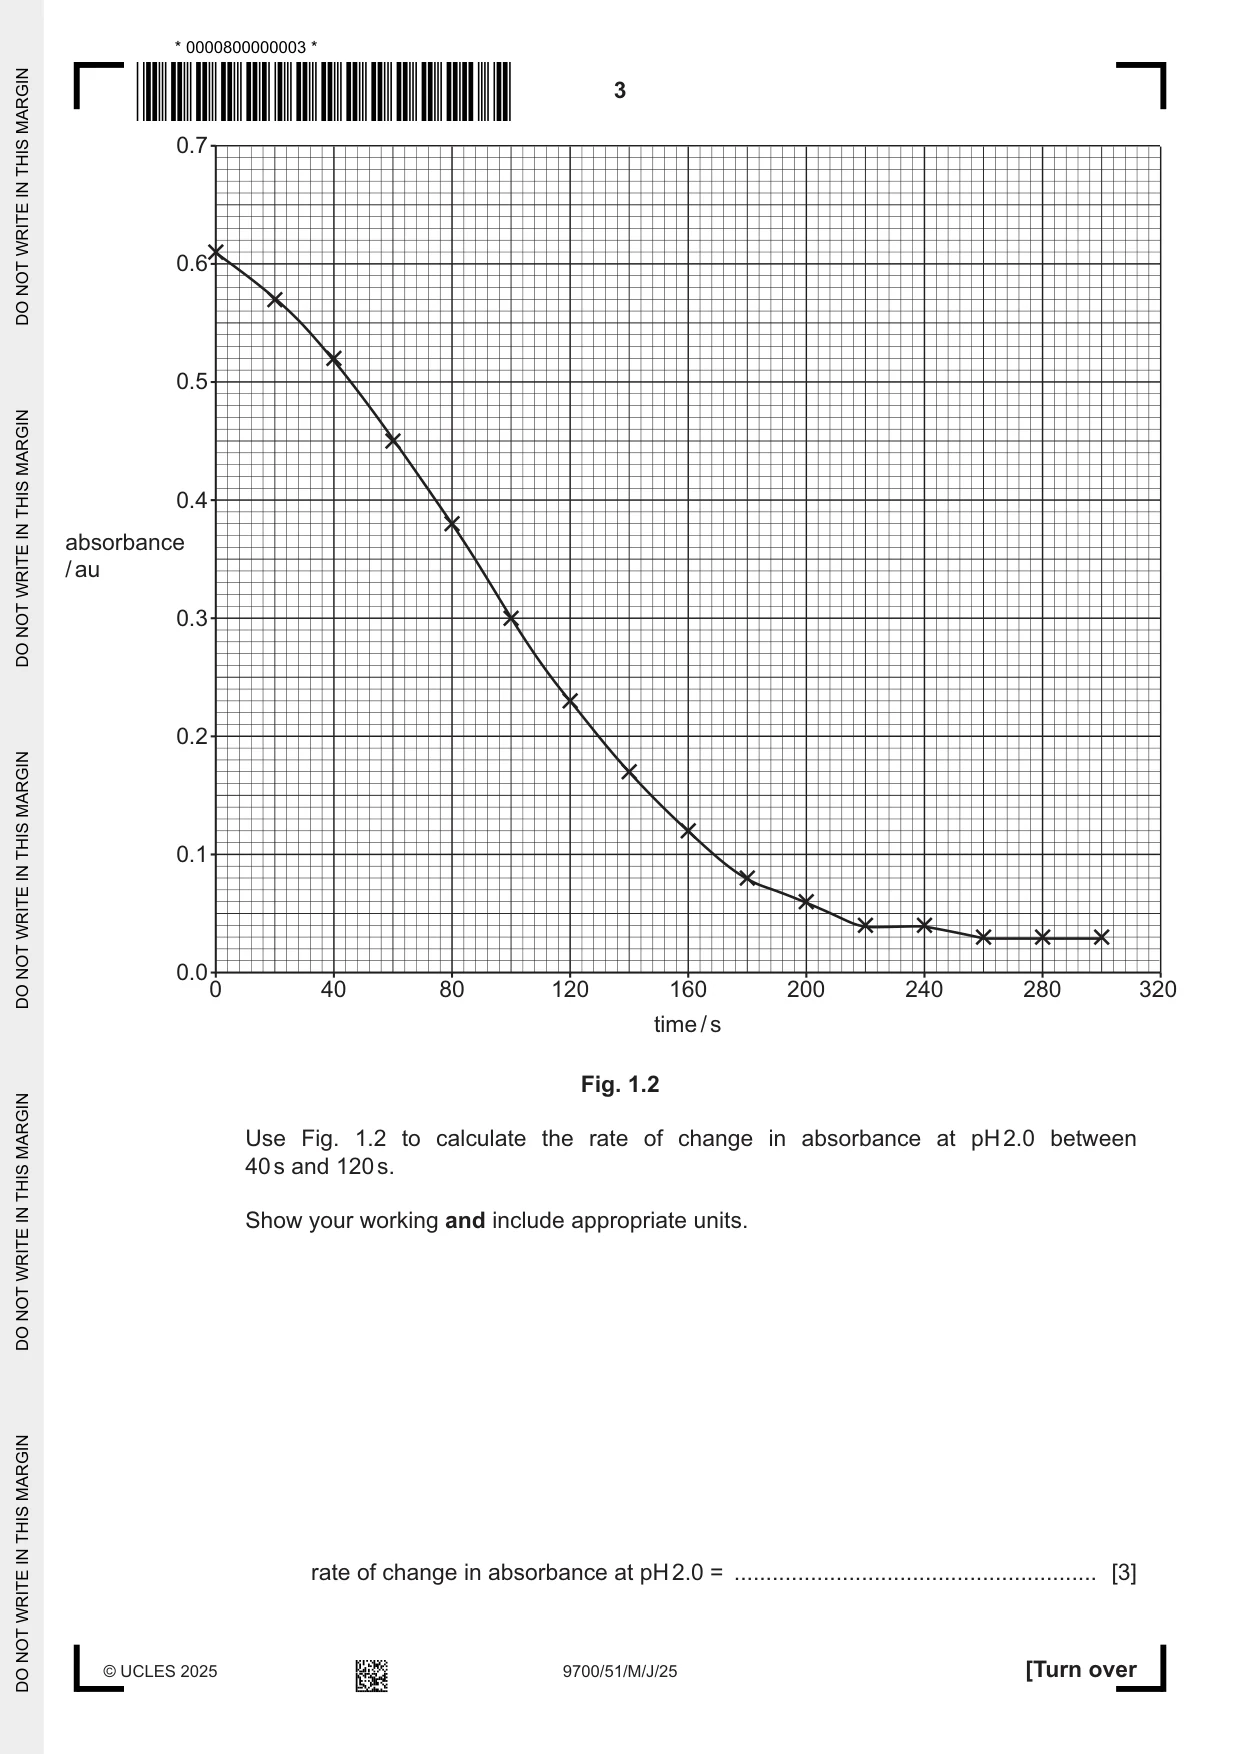
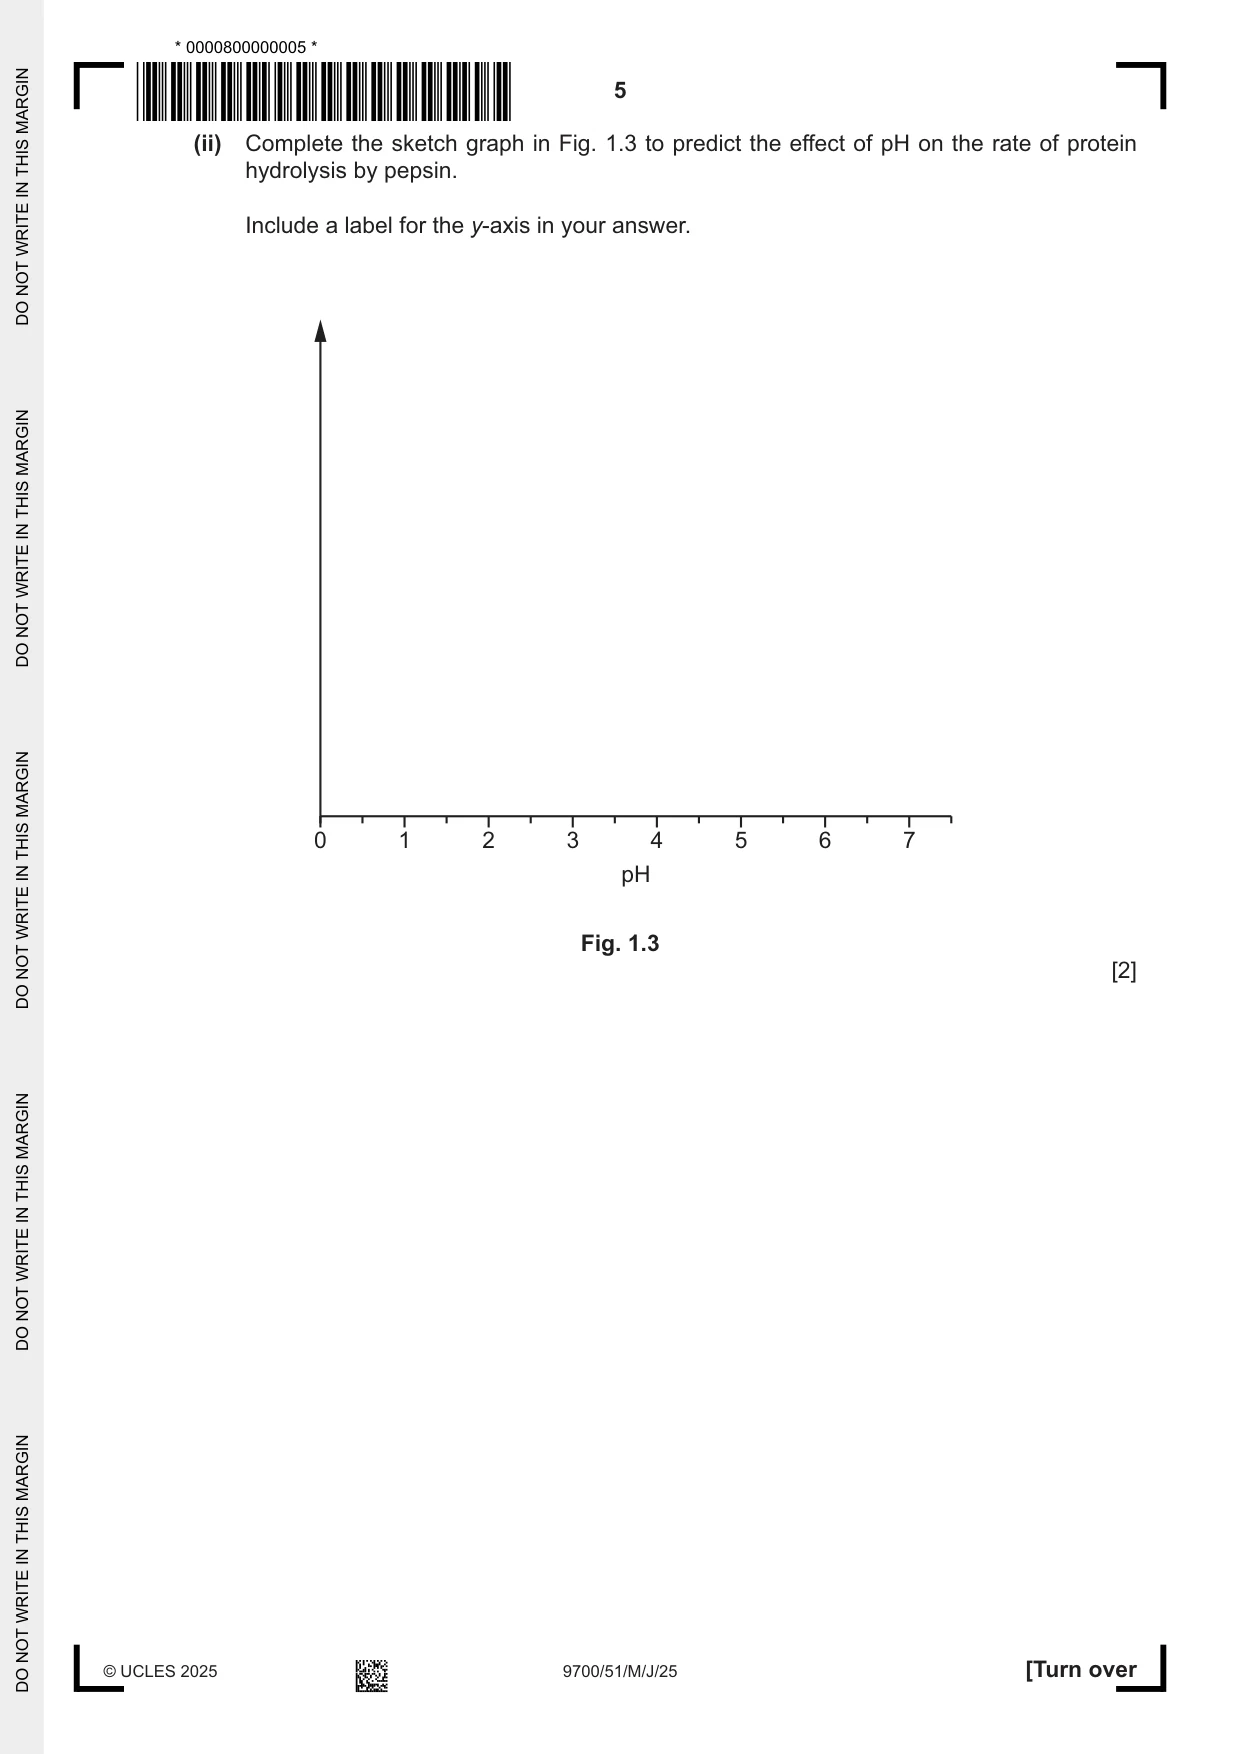
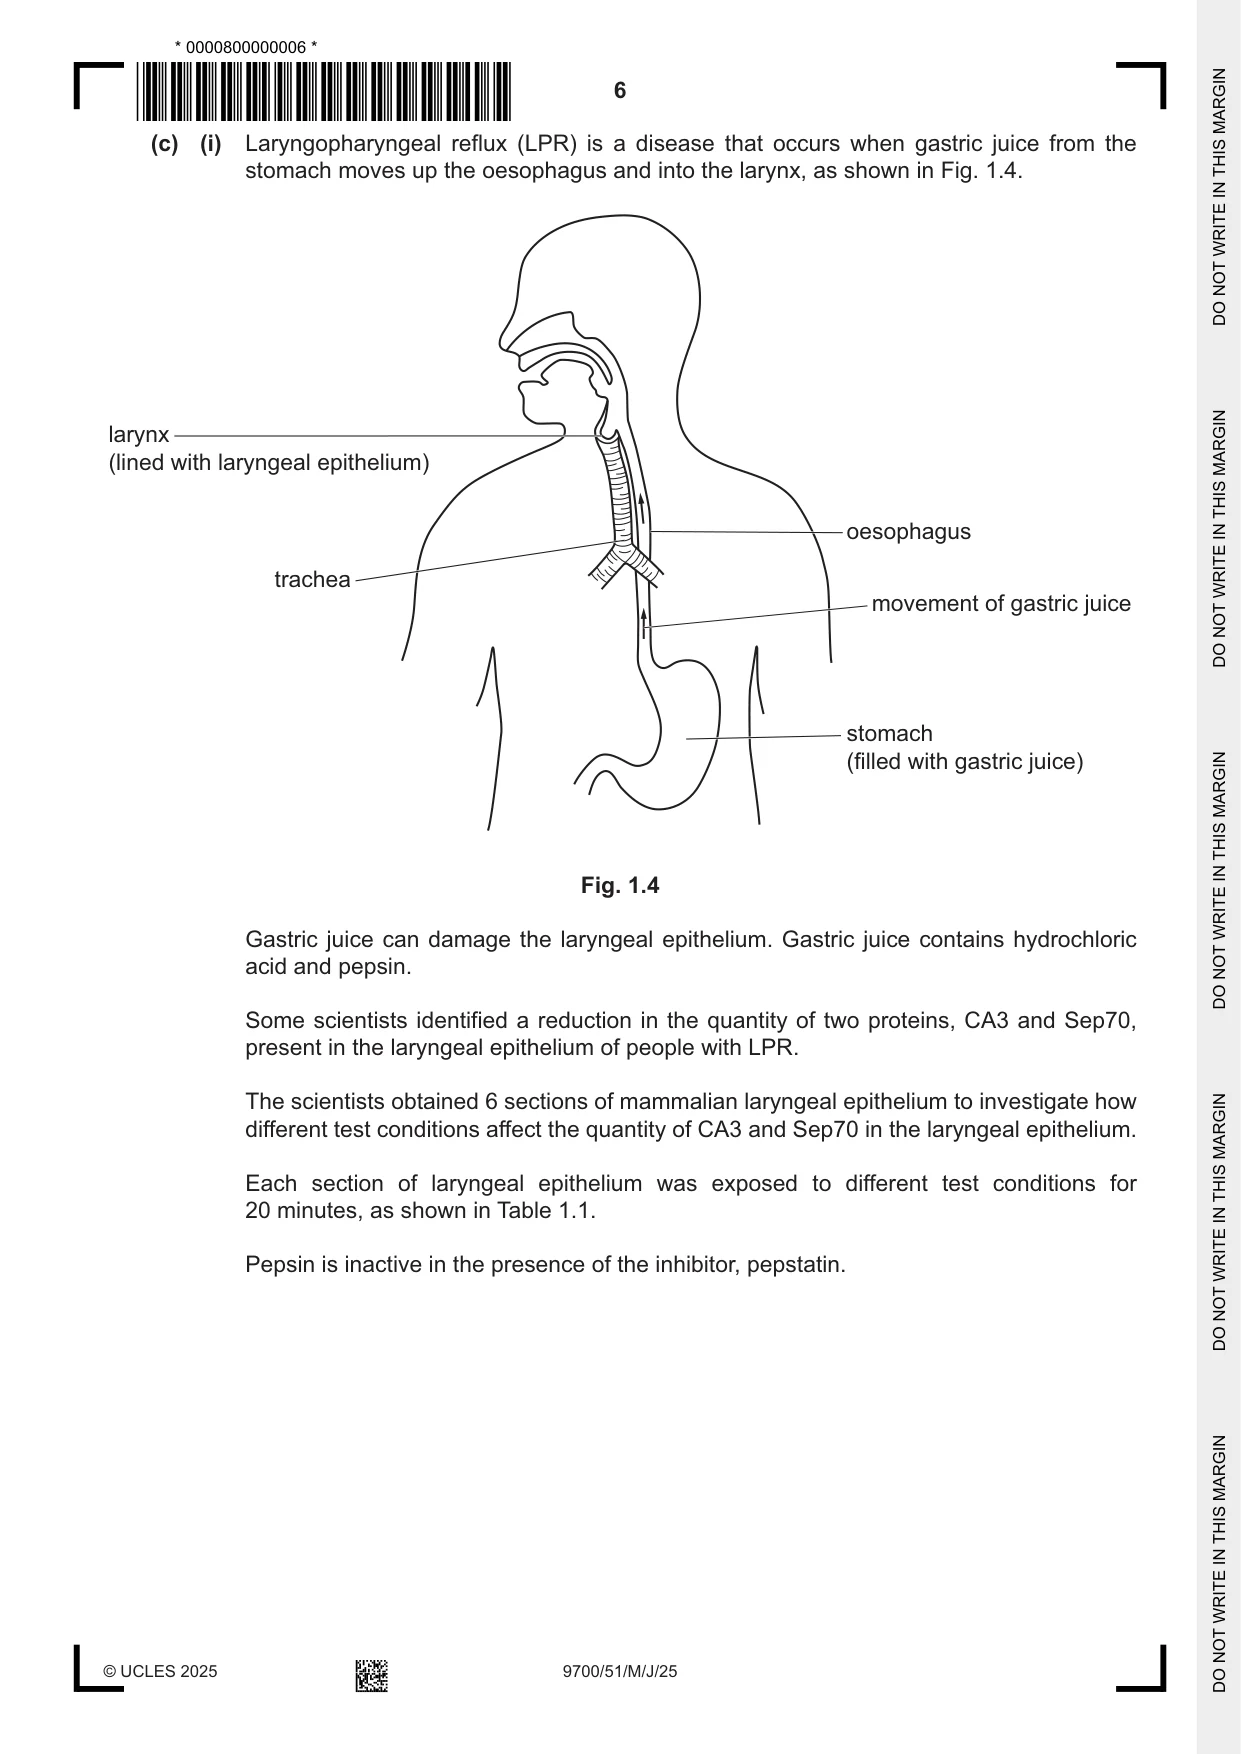
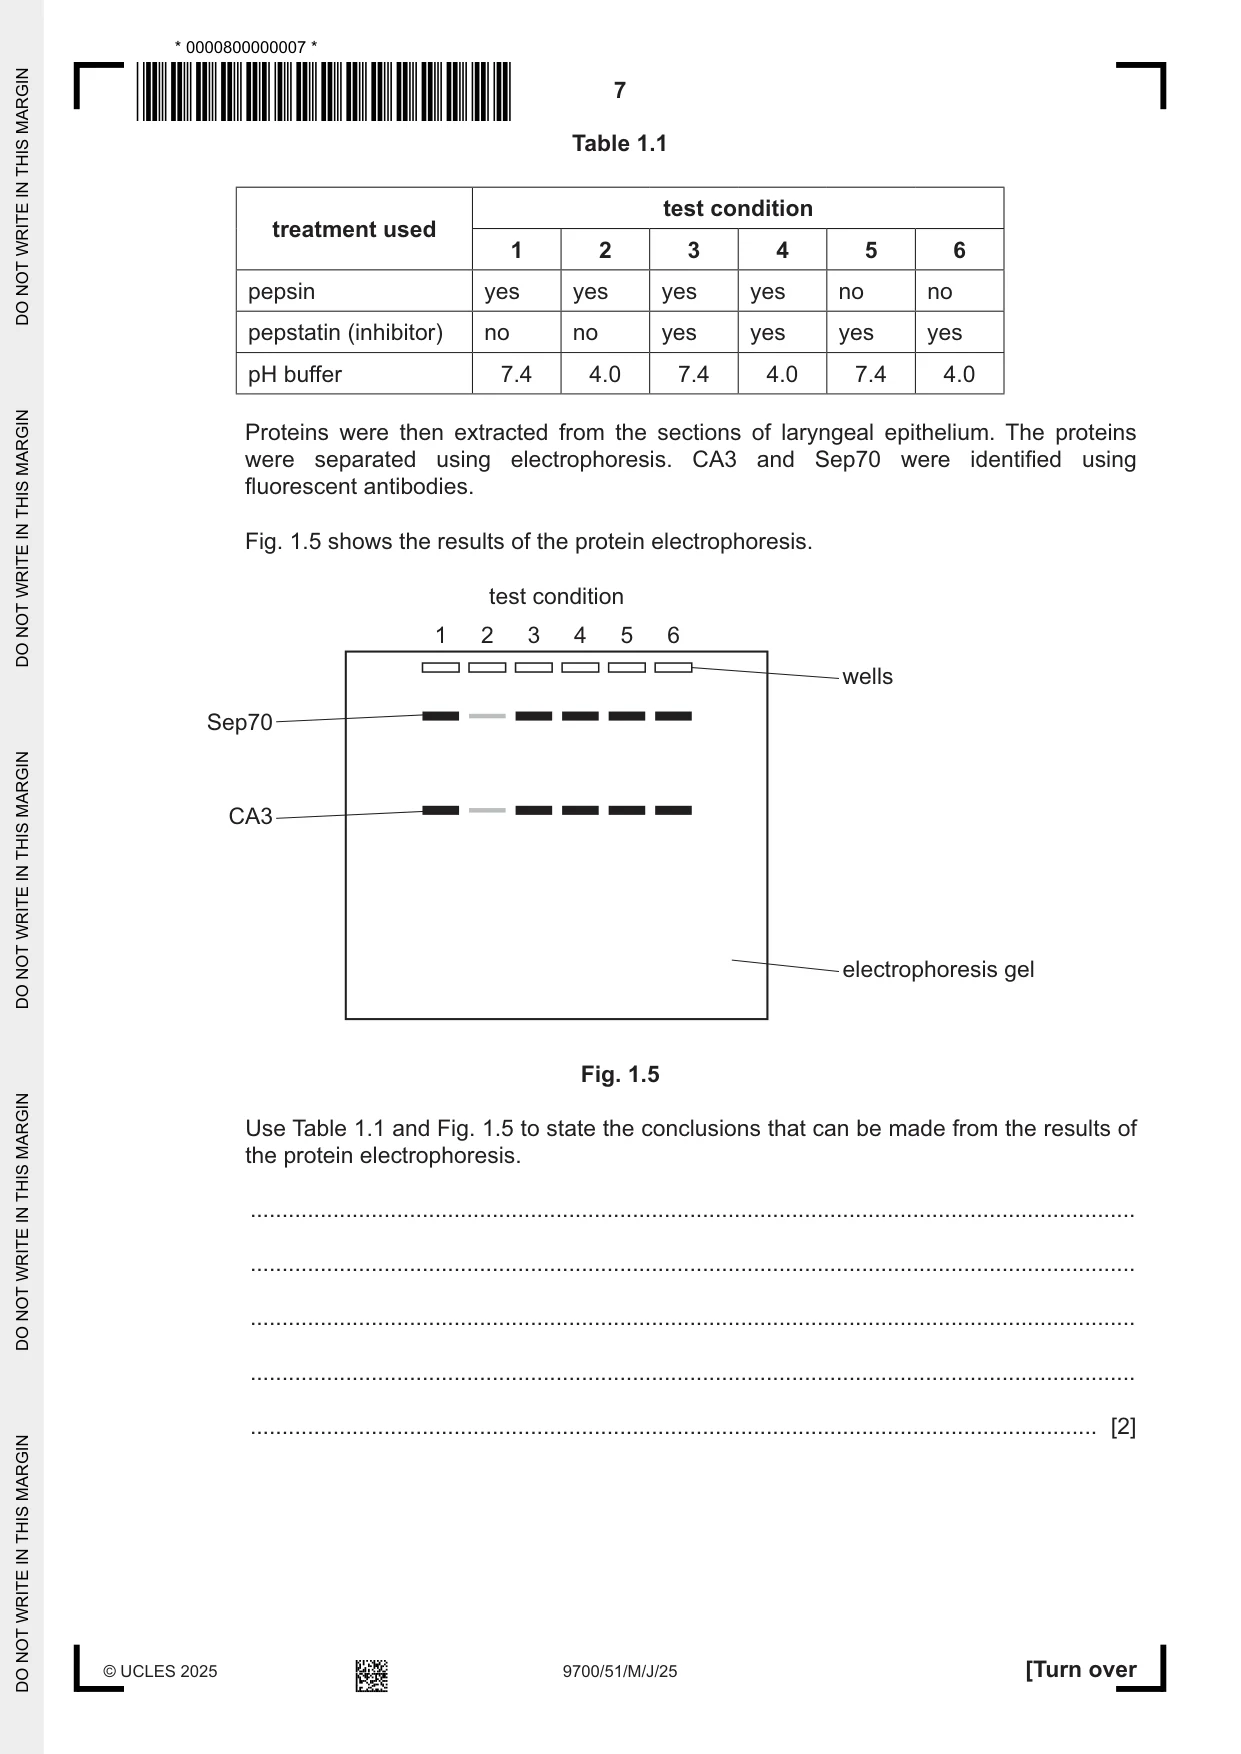
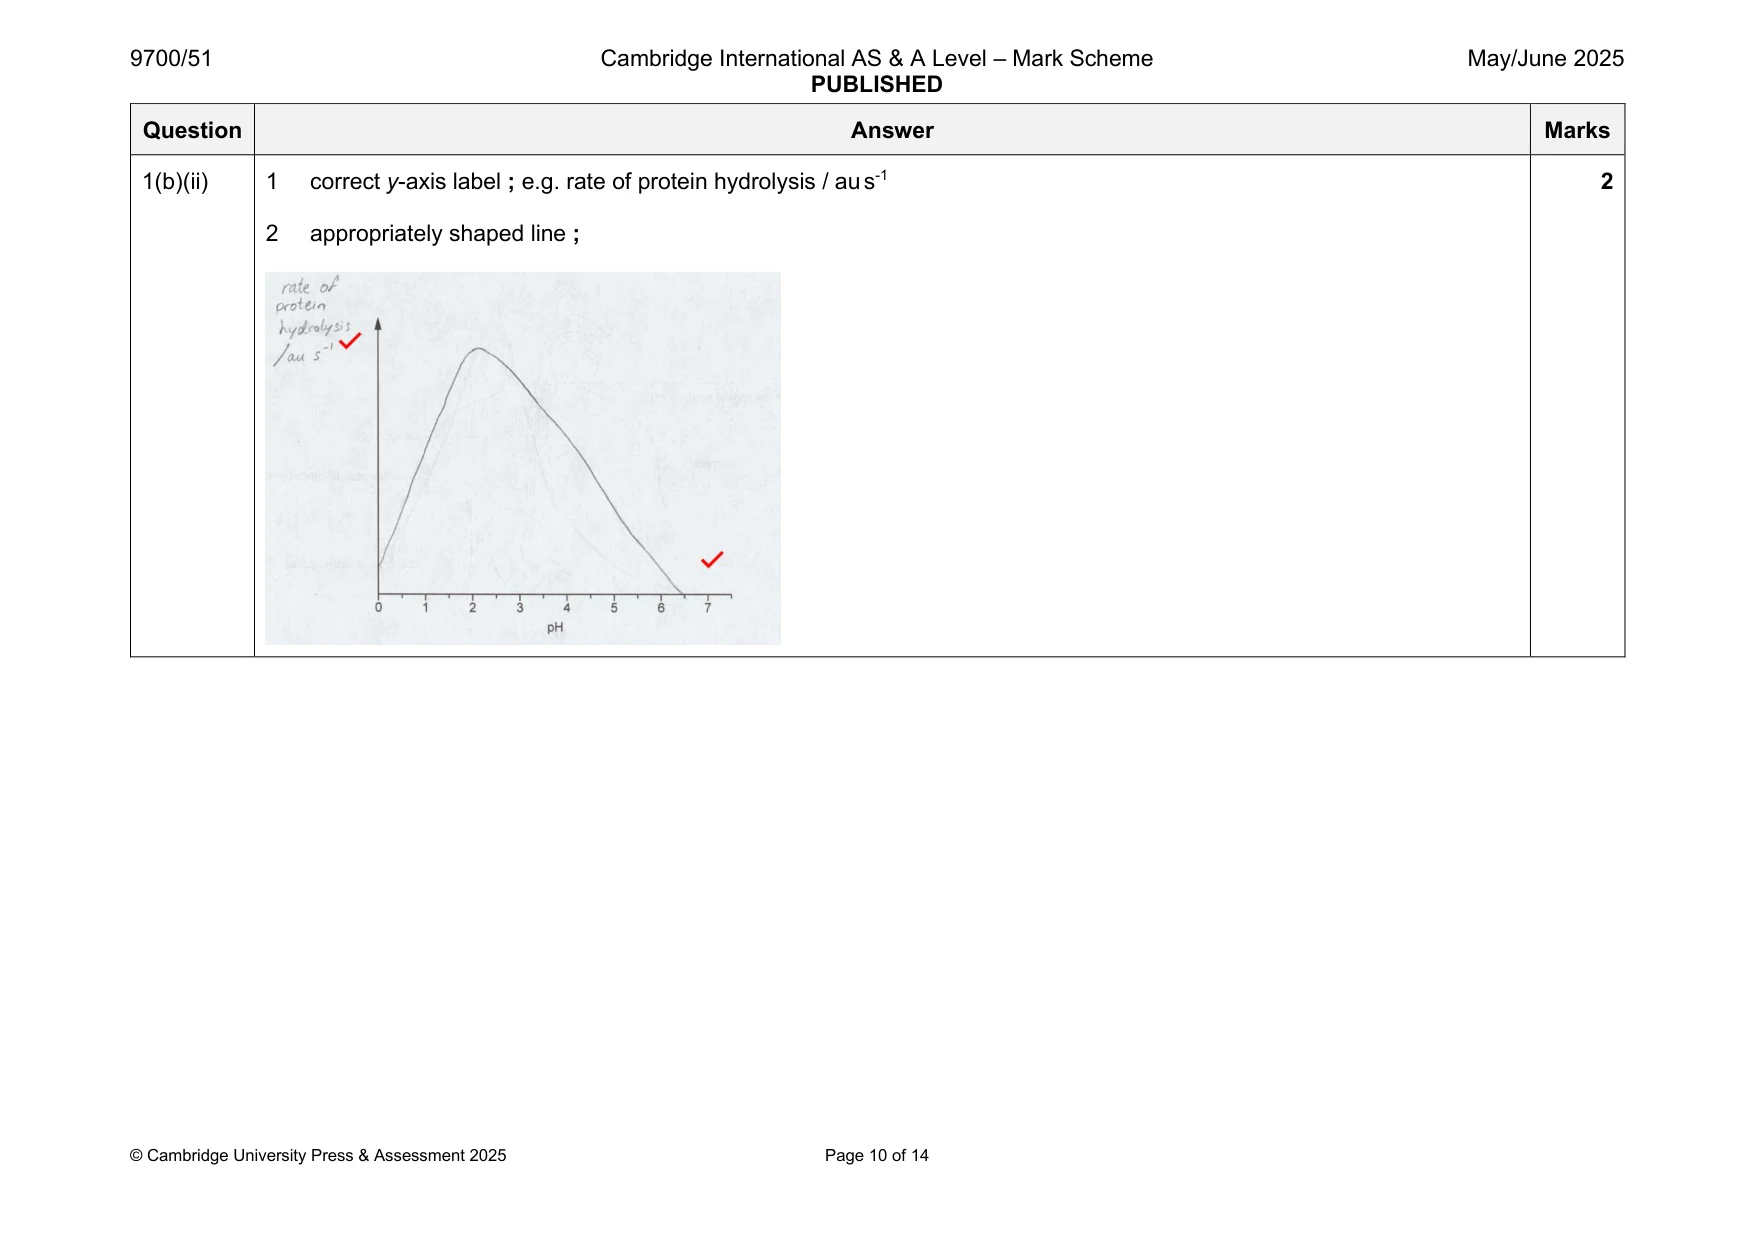
1 Pepsin is an enzyme that is present in gastric juice. Gastric juice is secreted into the stomach of humans and many other animals. Pepsin catalyses the hydrolysis of proteins into peptides, as shown in Fig. 1.1. protein peptides Fig. 1.1 Egg albumen (egg white) contains a high proportion of protein. 10% albumen solution is a cloudy‑white colour. This becomes colourless when pepsin is added to the 10% albumen solution. A student used a colorimeter to follow the progress of the hydrolysis of protein by pepsin. (a) (i) The student used a blue filter in the colorimeter. Outline one other step the student should carry out to prepare the colorimeter so that correct measurements of absorbance can be obtained. ........................................................................................................................................... ........................................................................................................................................... ..................................................................................................................................... [1] (ii) After preparing the colorimeter, the student: • made a pH 2.0 albumen solution by mixing 10 cm3 of 10% albumen solution with 10 cm3 of pH 2.0 buffer solution • added 3.0 cm3 of the pH 2.0 albumen solution to a colorimeter tube • added a small volume of pepsin solution to the colorimeter tube • immediately placed the colorimeter tube in the colorimeter • recorded the absorbance of the mixture every 20 seconds for 5 minutes • calculated the rate of change in absorbance as a measure of the rate of protein hydrolysis. The results are shown in Fig. 1.2. 0.7 0.6 0.5 0.4 absorbance / au 0.3 0.2 0.1 0.0 0 40 80 120 160 200 240 280 320 time / s Fig. 1.2 Use Fig. 1.2 to calculate the rate of change in absorbance at pH 2.0 between 40 s and 120 s. Show your working and include appropriate units. rate of change in absorbance at pH 2.0 = ......................................................... [3] (b) The student decided to investigate the effect of pH on the rate of protein hydrolysis by pepsin. From the internet the student found out that pepsin is inactive at pH 6.5 and above. (i) The student was provided with a colorimeter and standard laboratory apparatus. Describe a method that the student could use to investigate the effect of pH on the rate of protein hydrolysis by pepsin and to determine the optimum pH of pepsin. Your method should be set out in a logical order and be detailed enough to allow another person to follow it. Details of how to prepare and use the colorimeter should not be included. ........................................................................................................................................... ........................................................................................................................................... ........................................................................................................................................... ........................................................................................................................................... ........................................................................................................................................... ........................................................................................................................................... ........................................................................................................................................... ........................................................................................................................................... ........................................................................................................................................... ........................................................................................................................................... ........................................................................................................................................... ........................................................................................................................................... ........................................................................................................................................... ........................................................................................................................................... ........................................................................................................................................... ........................................................................................................................................... ........................................................................................................................................... ........................................................................................................................................... ..................................................................................................................................... [7] (ii) Complete the sketch graph in Fig. 1.3 to predict the effect of pH on the rate of protein hydrolysis by pepsin. Include a label for the y‑axis in your answer. 0 1 2 3 4 5 6 7 pH Fig. 1.3 [2] (c) (i) Laryngopharyngeal reflux (LPR) is a disease that occurs when gastric juice from the stomach moves up the oesophagus and into the larynx, as shown in Fig. 1.4. larynx (lined with laryngeal epithelium) oesophagus trachea movement of gastric juice stomach (filled with gastric juice) Fig. 1.4 Gastric juice can damage the laryngeal epithelium. Gastric juice contains hydrochloric acid and pepsin. Some scientists identified a reduction in the quantity of two proteins, CA3 and Sep70, present in the laryngeal epithelium of people with LPR. The scientists obtained 6 sections of mammalian laryngeal epithelium to investigate how different test conditions affect the quantity of CA3 and Sep70 in the laryngeal epithelium. Each section of laryngeal epithelium was exposed to different test conditions for 20 minutes, as shown in Table 1.1. Pepsin is inactive in the presence of the inhibitor, pepstatin. Table 1.1 test condition treatment used 1 2 3 4 5 6 pepsin yes yes yes yes no no pepstatin (inhibitor) no no yes yes yes yes pH buffer 7.4 4.0 7.4 4.0 7.4 4.0 Proteins were then extracted from the sections of laryngeal epithelium. The proteins were separated using electrophoresis. CA3 and Sep70 were identified using fluorescent antibodies. Fig. 1.5 shows the results of the protein electrophoresis. test condition 1 2 3 4 5 6 wells Sep70 CA3 electrophoresis gel Fig. 1.5 Use Table 1.1 and Fig. 1.5 to state the conclusions that can be made from the results of the protein electrophoresis. ........................................................................................................................................... ........................................................................................................................................... ........................................................................................................................................... ........................................................................................................................................... ..................................................................................................................................... [2] (ii) The results of this investigation were published in a scientific paper. A student who read the scientific paper concluded that pepsin causes damage to the laryngeal epithelium in people with LPR. Suggest why the results of this investigation might not support this conclusion. ........................................................................................................................................... ........................................................................................................................................... ........................................................................................................................................... ........................................................................................................................................... ..................................................................................................................................... [2] [Total: 17]
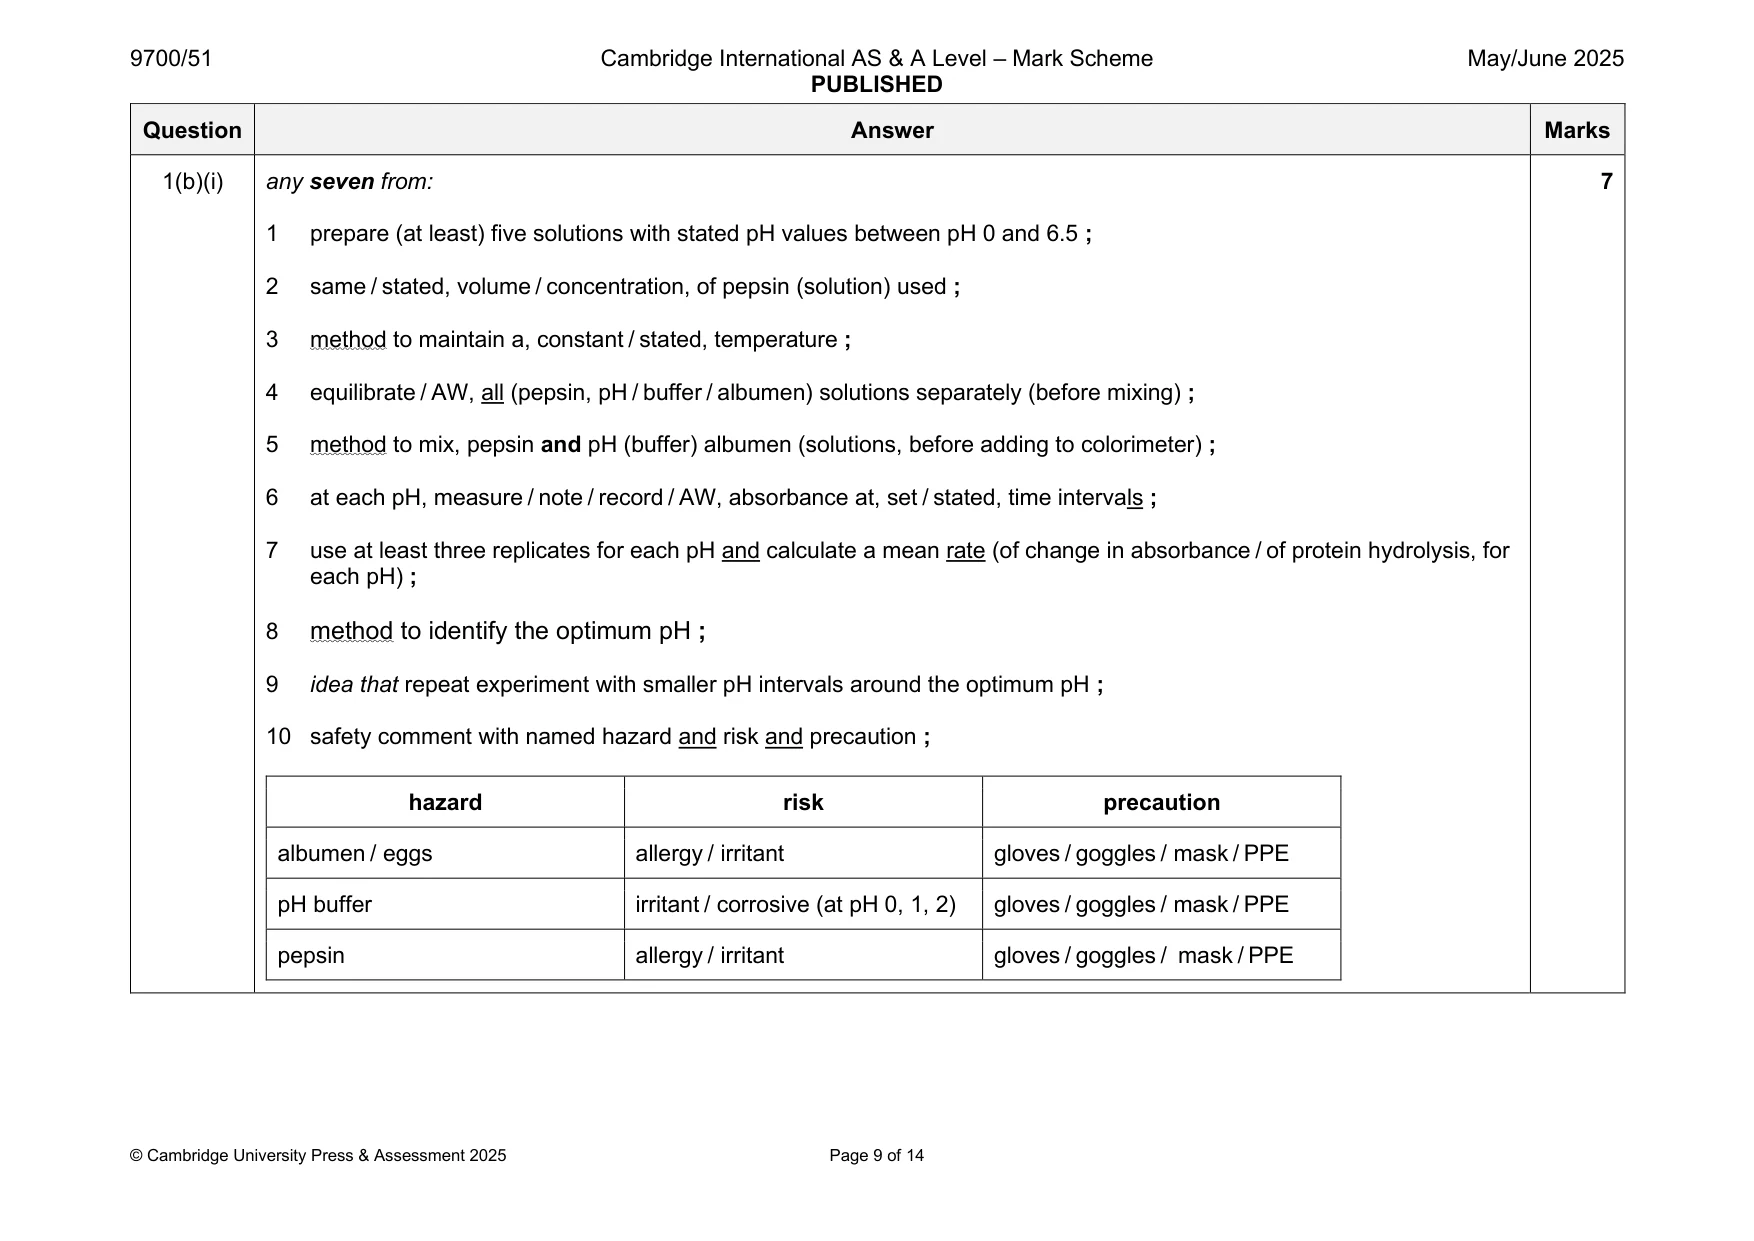
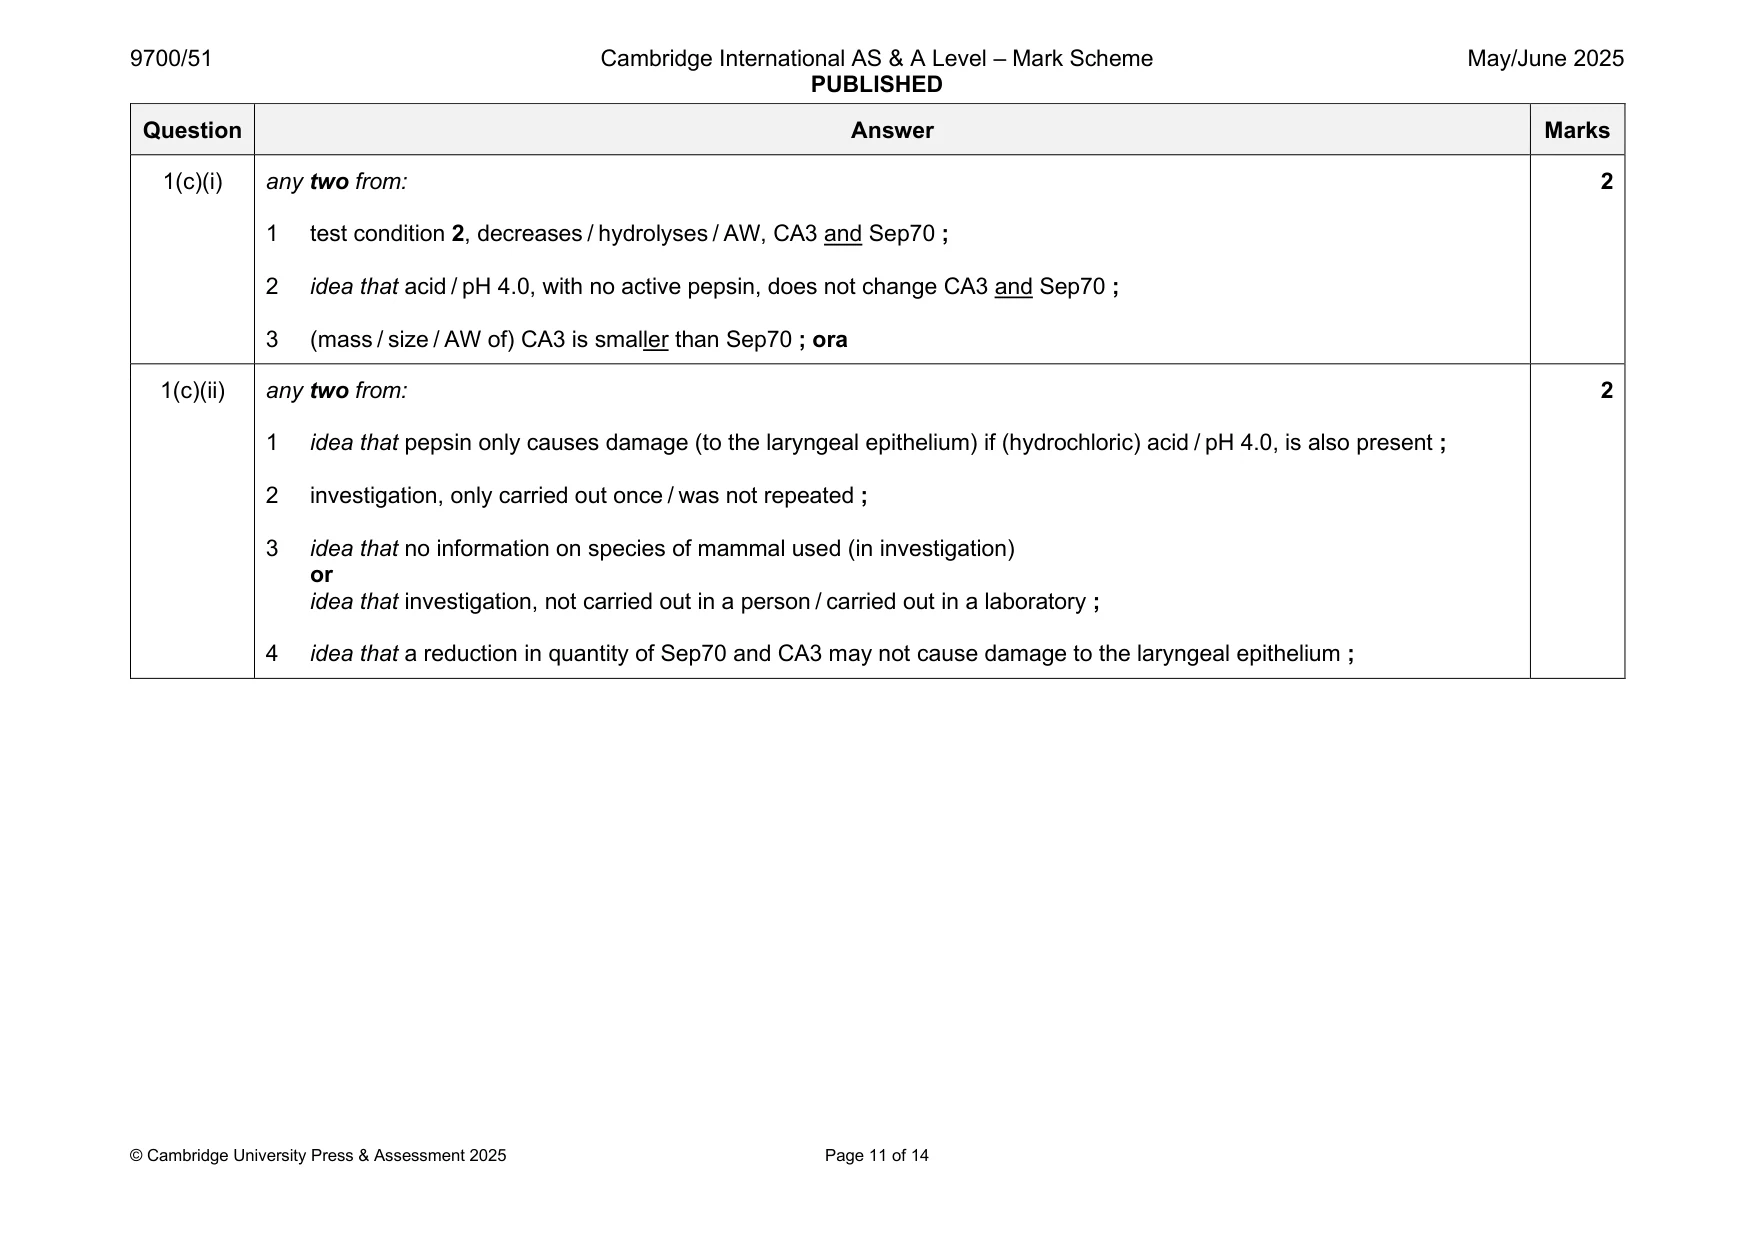
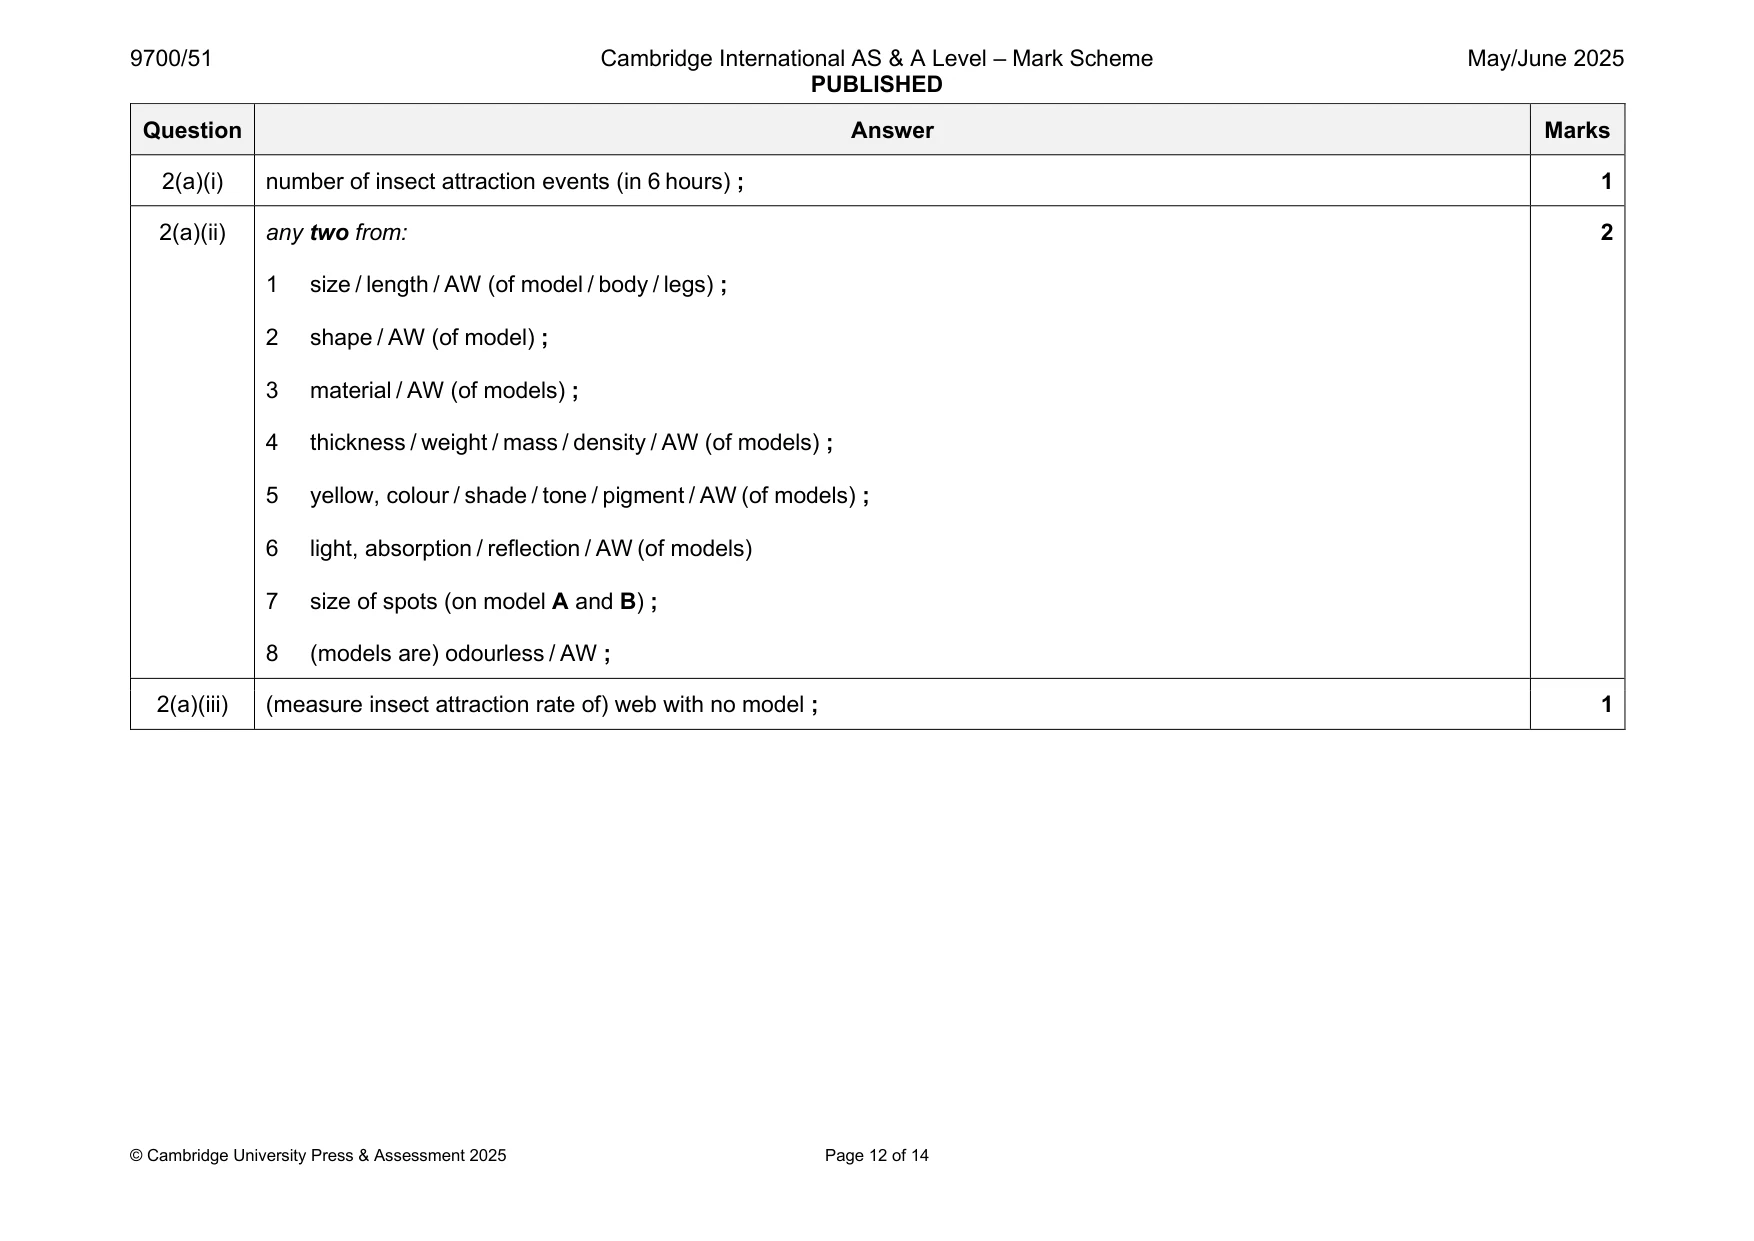
Mark scheme: Question Answer Marks 1(a)(i) any one from: 1 1 calibrate colorimeter ; 2 use, a blank / AW, to set (colorimeter absorbance) to zero ; 1(a)(ii) 1 rate of change in absorbance at pH 2.0 = 3 0.0036 / 3.6 10–3 ; 2 working: (0.52–0.23) / (120–40) or 0.29 / 80 ; 3 units: au s-1 ; 1(b)(i) any seven from: 7 1 prepare (at least) five solutions with stated pH values between pH 0 and 6.5 ; 2 same / stated, volume / concentration, of pepsin (solution) used ; 3 method to maintain a, constant / stated, temperature ; 4 equilibrate / AW, all (pepsin, pH / buffer / albumen) solutions separately (before mixing) ; 5 method to mix, pepsin and pH (buffer) albumen (solutions, before adding to colorimeter) ; 6 at each pH, measure / note / record / AW, absorbance at, set / stated, time intervals ; 7 use at least three replicates for each pH and calculate a mean rate (of change in absorbance / of protein hydrolysis, for each pH) ; 8 method to identify the optimum pH ; 9 idea that repeat experiment with smaller pH intervals around the optimum pH ; 10 safety comment with named hazard and risk and precaution ; hazard risk precaution albumen / eggs allergy / irritant gloves / goggles / mask / PPE pH buffer irritant / corrosive (at pH 0, 1, 2) gloves / goggles / mask / PPE pepsin allergy / irritant gloves / goggles / mask / PPE 1(b)(ii) 1 correct y-axis label ; e.g. rate of protein hydrolysis / au s-1 2 2 appropriately shaped line ; 1(c)(i) any two from: 2 1 test condition 2, decreases / hydrolyses / AW, CA3 and Sep70 ; 2 idea that acid / pH 4.0, with no active pepsin, does not change CA3 and Sep70 ; 3 (mass / size / AW of) CA3 is smaller than Sep70 ; ora 1(c)(ii) any two from: 2 1 idea that pepsin only causes damage (to the laryngeal epithelium) if (hydrochloric) acid / pH 4.0, is also present ; 2 investigation, only carried out once / was not repeated ; 3 idea that no information on species of mammal used (in investigation) or idea that investigation, not carried out in a person / carried out in a laboratory ; 4 idea that a reduction in quantity of Sep70 and CA3 may not cause damage to the laryngeal epithelium ;
Q2 · Golden orb weaver spiders, Nephila pilipes, are found in East Asia, South‑east Asia and…
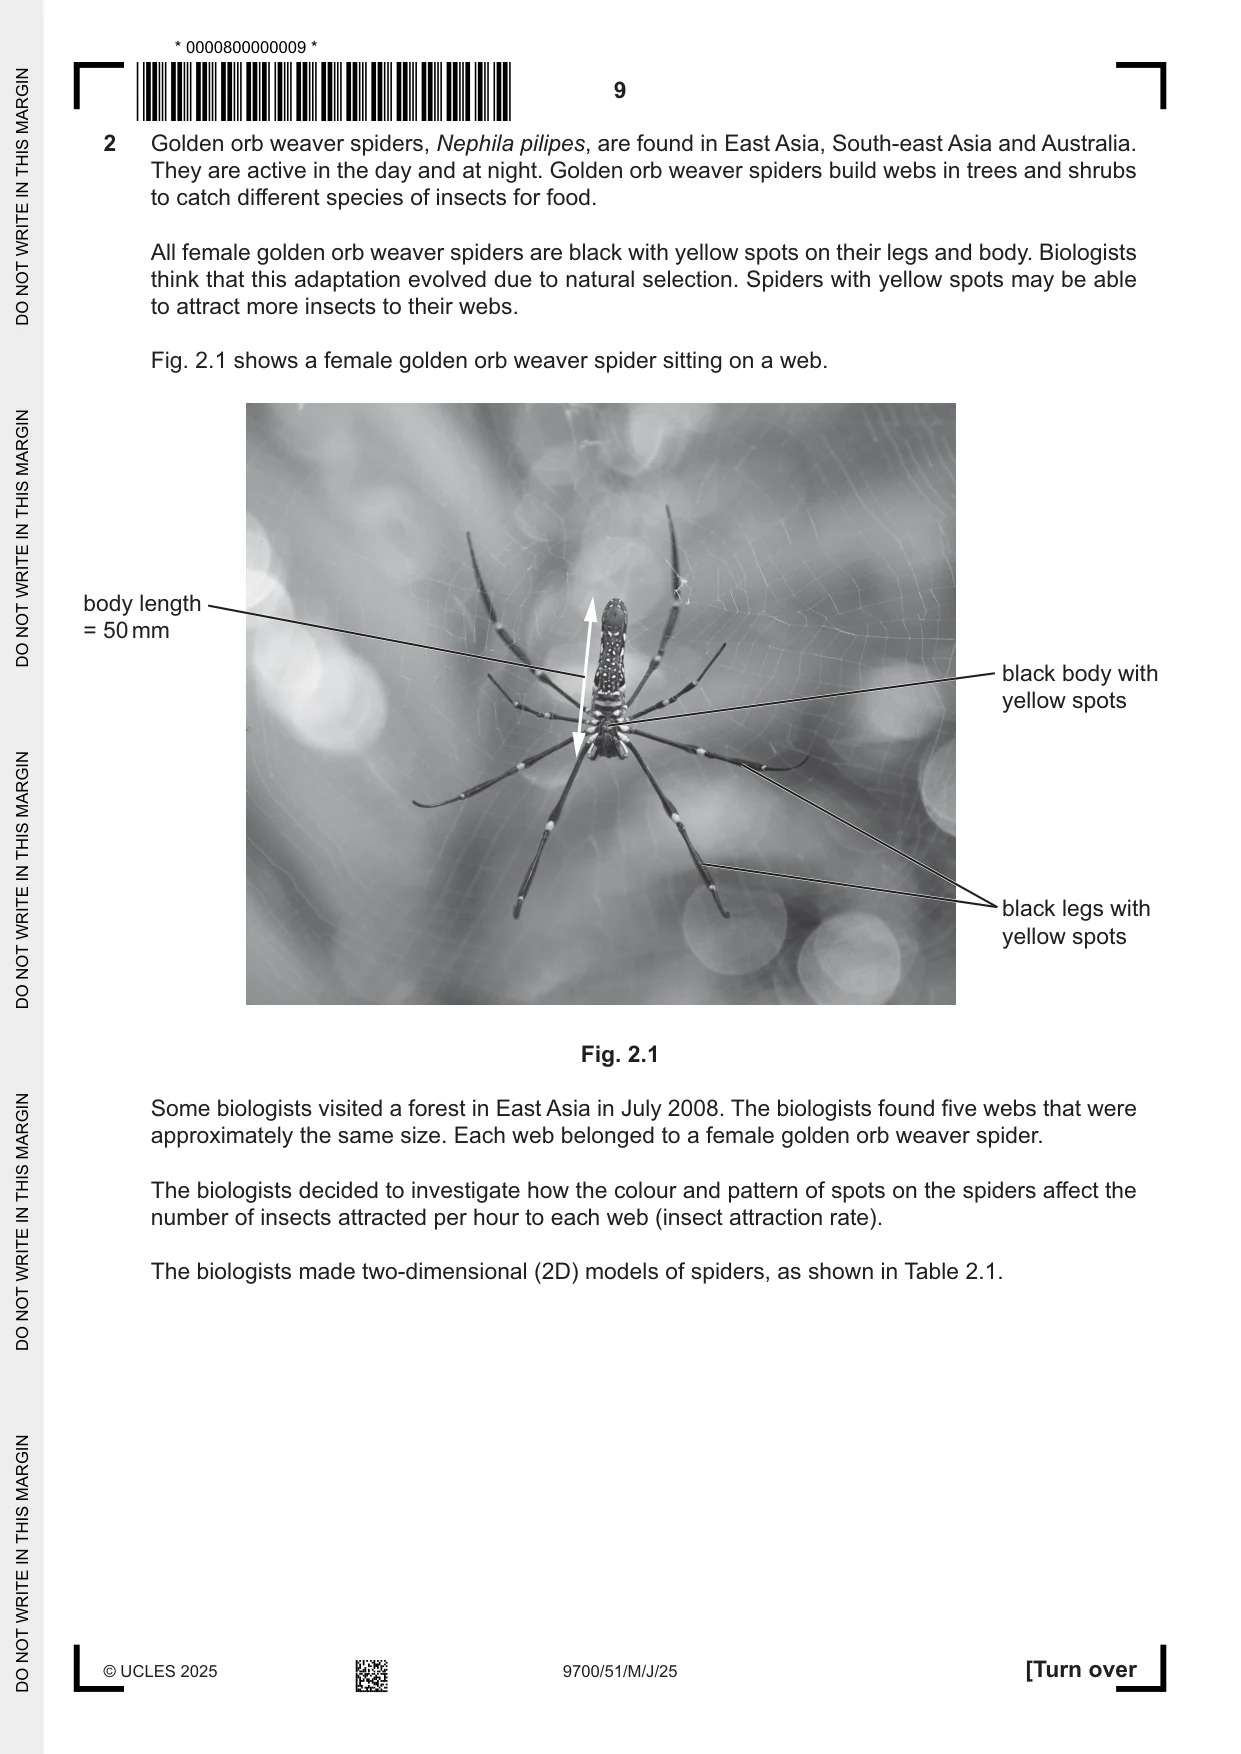
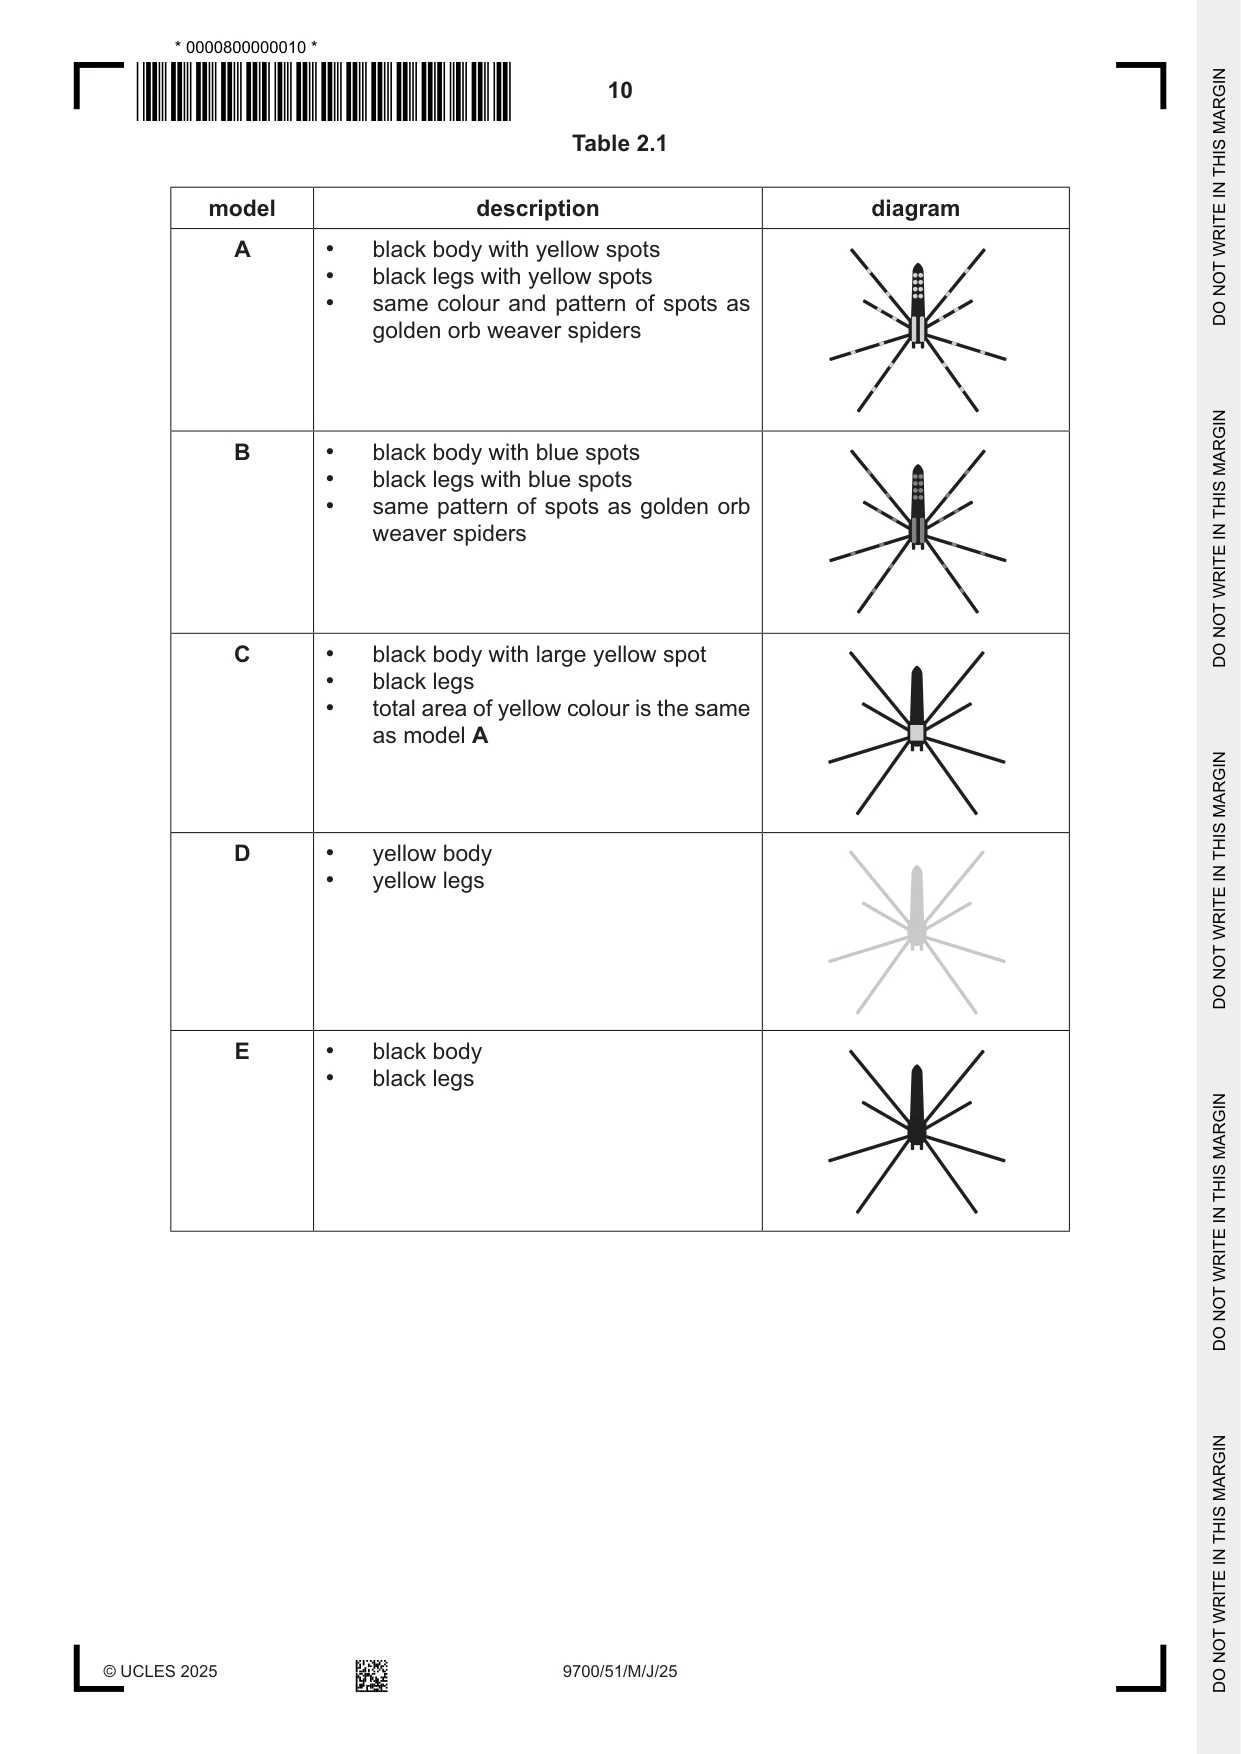
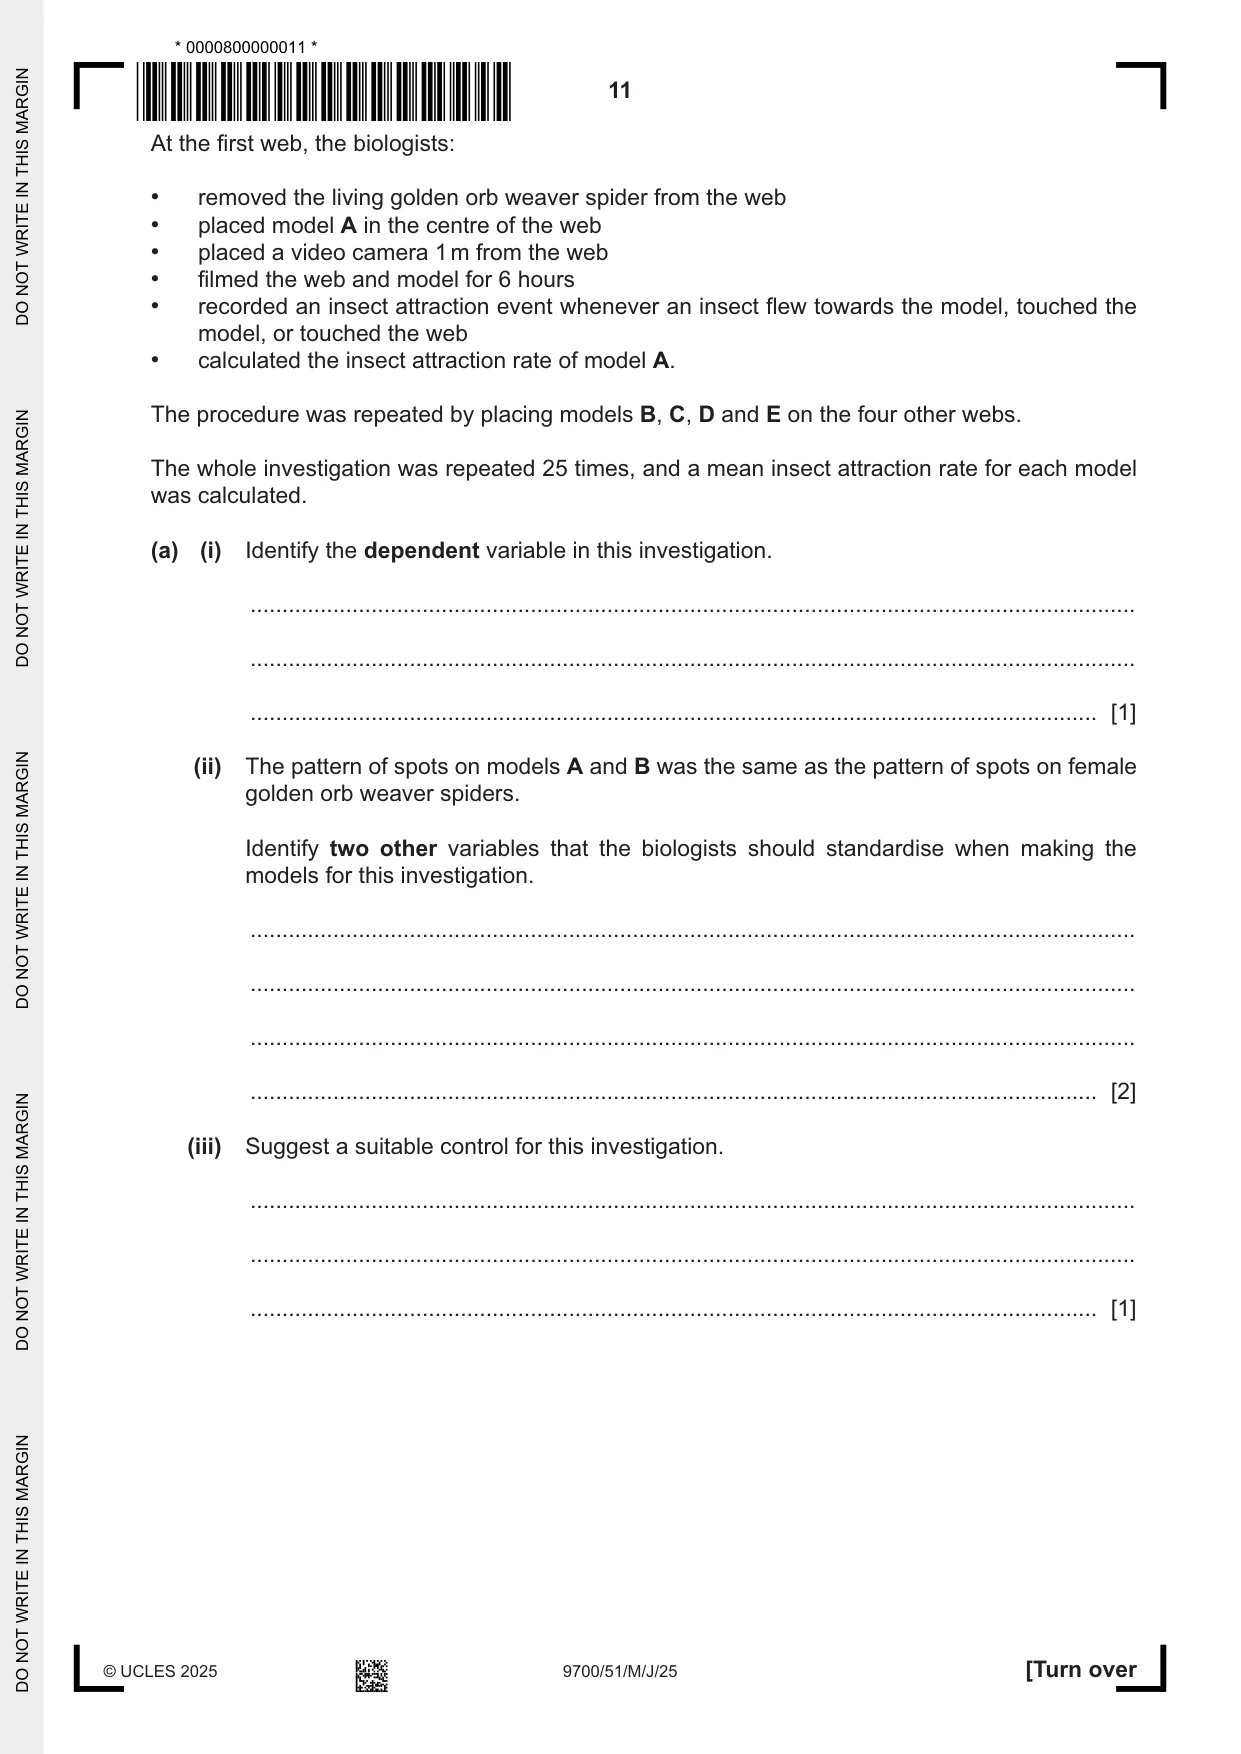
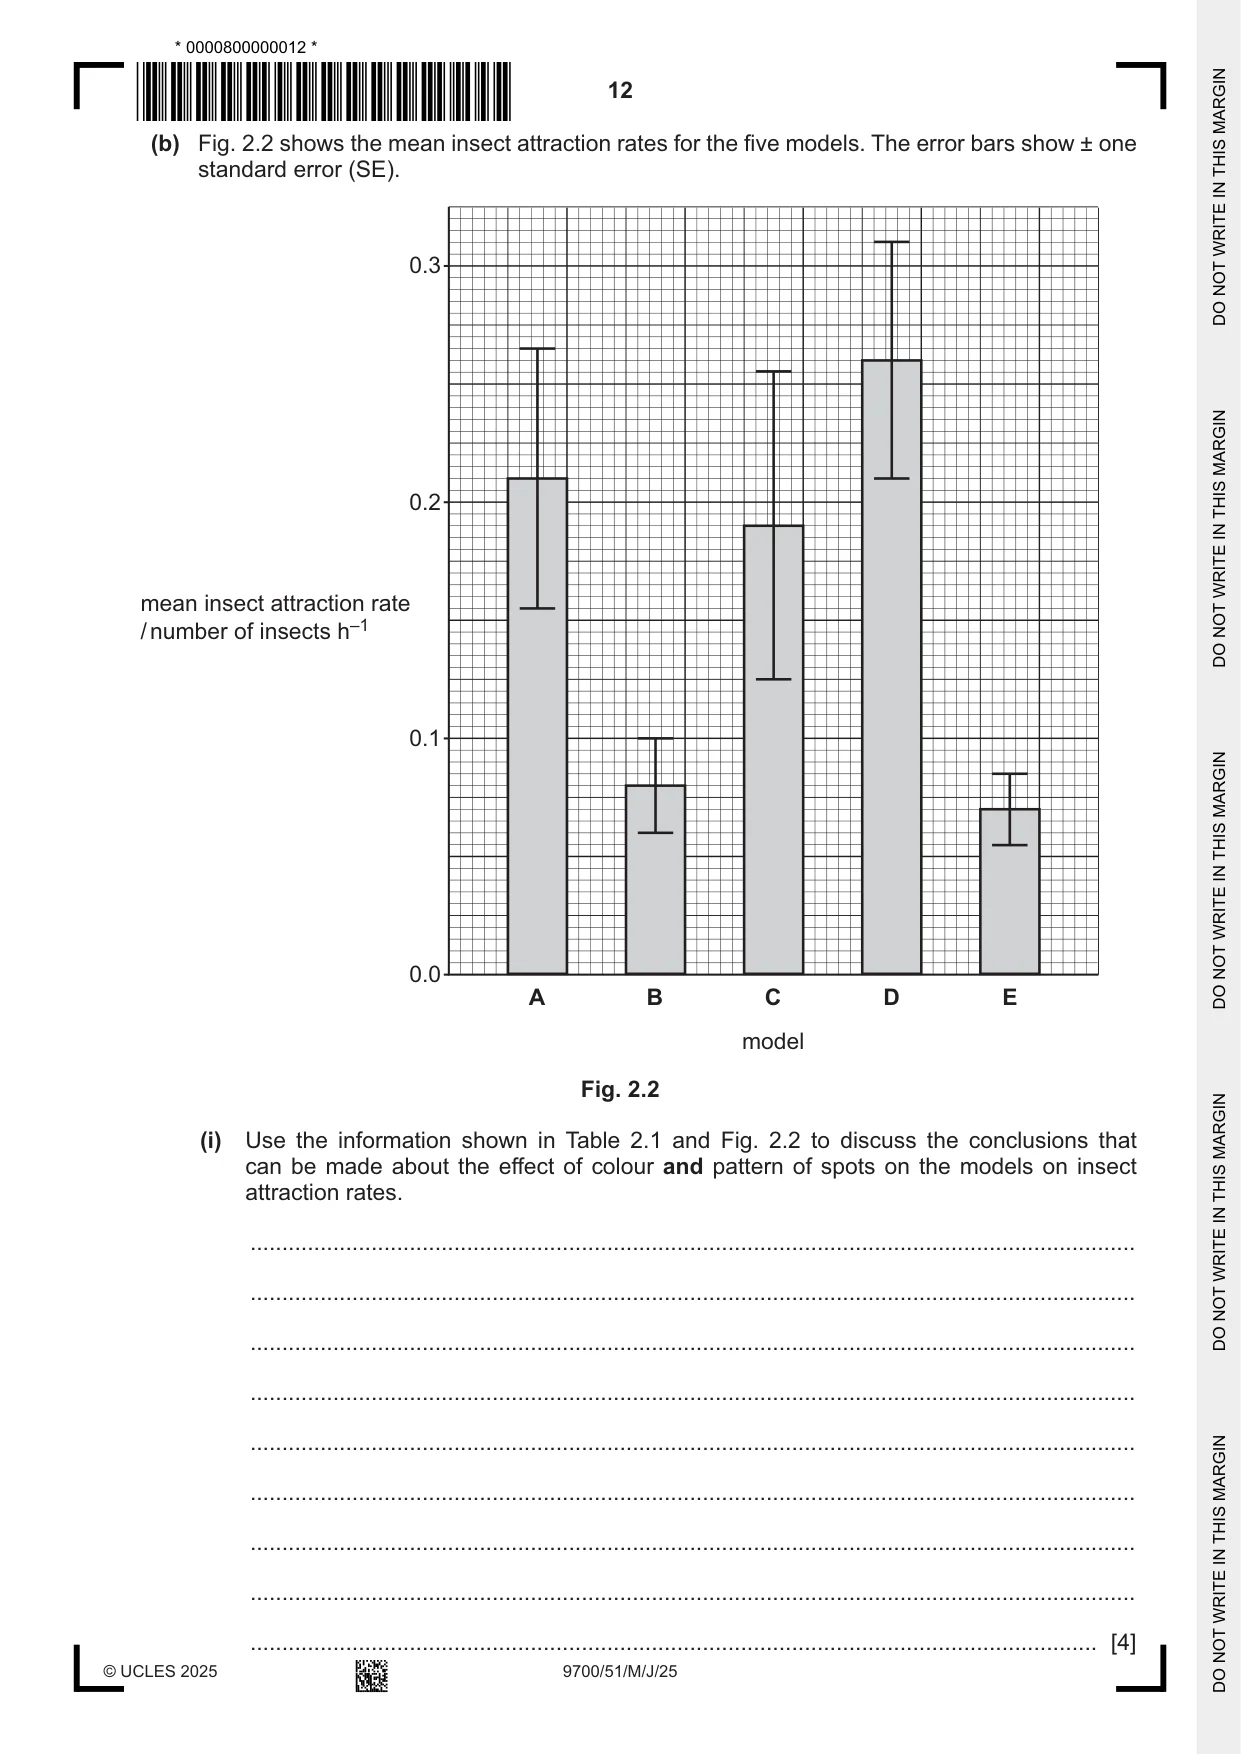
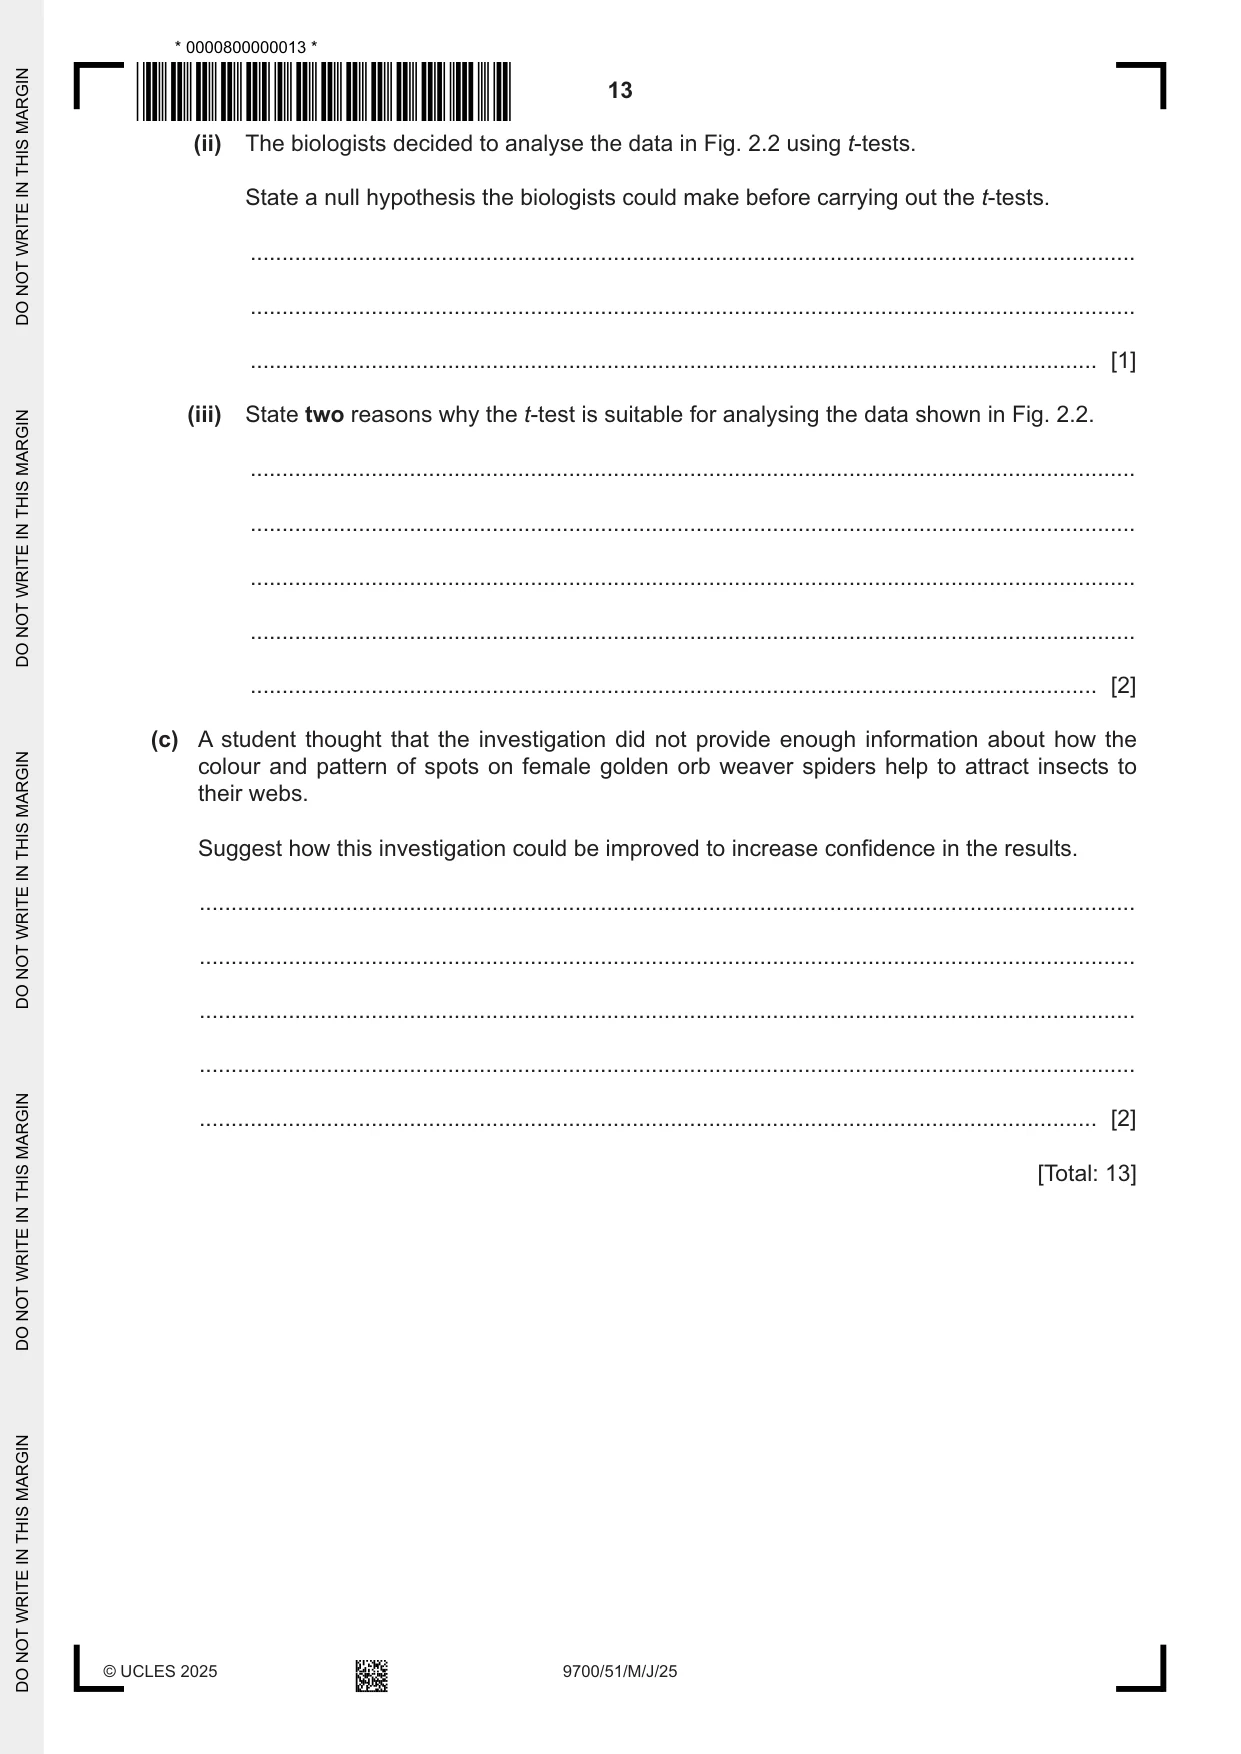
2 Golden orb weaver spiders, Nephila pilipes, are found in East Asia, South‑east Asia and Australia. They are active in the day and at night. Golden orb weaver spiders build webs in trees and shrubs to catch different species of insects for food. All female golden orb weaver spiders are black with yellow spots on their legs and body. Biologists think that this adaptation evolved due to natural selection. Spiders with yellow spots may be able to attract more insects to their webs. Fig. 2.1 shows a female golden orb weaver spider sitting on a web. body length = 50 mm black body with yellow spots black legs with yellow spots Fig. 2.1 Some biologists visited a forest in East Asia in July 2008. The biologists found five webs that were approximately the same size. Each web belonged to a female golden orb weaver spider. The biologists decided to investigate how the colour and pattern of spots on the spiders affect the number of insects attracted per hour to each web (insect attraction rate). The biologists made two‑dimensional (2D) models of spiders, as shown in Table 2.1. Table 2.1 model description diagram A • black body with yellow spots • black legs with yellow spots • same colour and pattern of spots as golden orb weaver spiders B • black body with blue spots • black legs with blue spots • same pattern of spots as golden orb weaver spiders C • black body with large yellow spot • black legs • total area of yellow colour is the same as model A D • yellow body • yellow legs E • black body • black legs At the first web, the biologists: • removed the living golden orb weaver spider from the web • placed model A in the centre of the web • placed a video camera 1 m from the web • filmed the web and model for 6 hours • recorded an insect attraction event whenever an insect flew towards the model, touched the model, or touched the web • calculated the insect attraction rate of model A. The procedure was repeated by placing models B, C, D and E on the four other webs. The whole investigation was repeated 25 times, and a mean insect attraction rate for each model was calculated. (a) (i) Identify the dependent variable in this investigation. ........................................................................................................................................... ........................................................................................................................................... ..................................................................................................................................... [1] (ii) The pattern of spots on models A and B was the same as the pattern of spots on female golden orb weaver spiders. Identify two other variables that the biologists should standardise when making the models for this investigation. ........................................................................................................................................... ........................................................................................................................................... ........................................................................................................................................... ..................................................................................................................................... [2] (iii) Suggest a suitable control for this investigation. ........................................................................................................................................... ........................................................................................................................................... ..................................................................................................................................... [1]
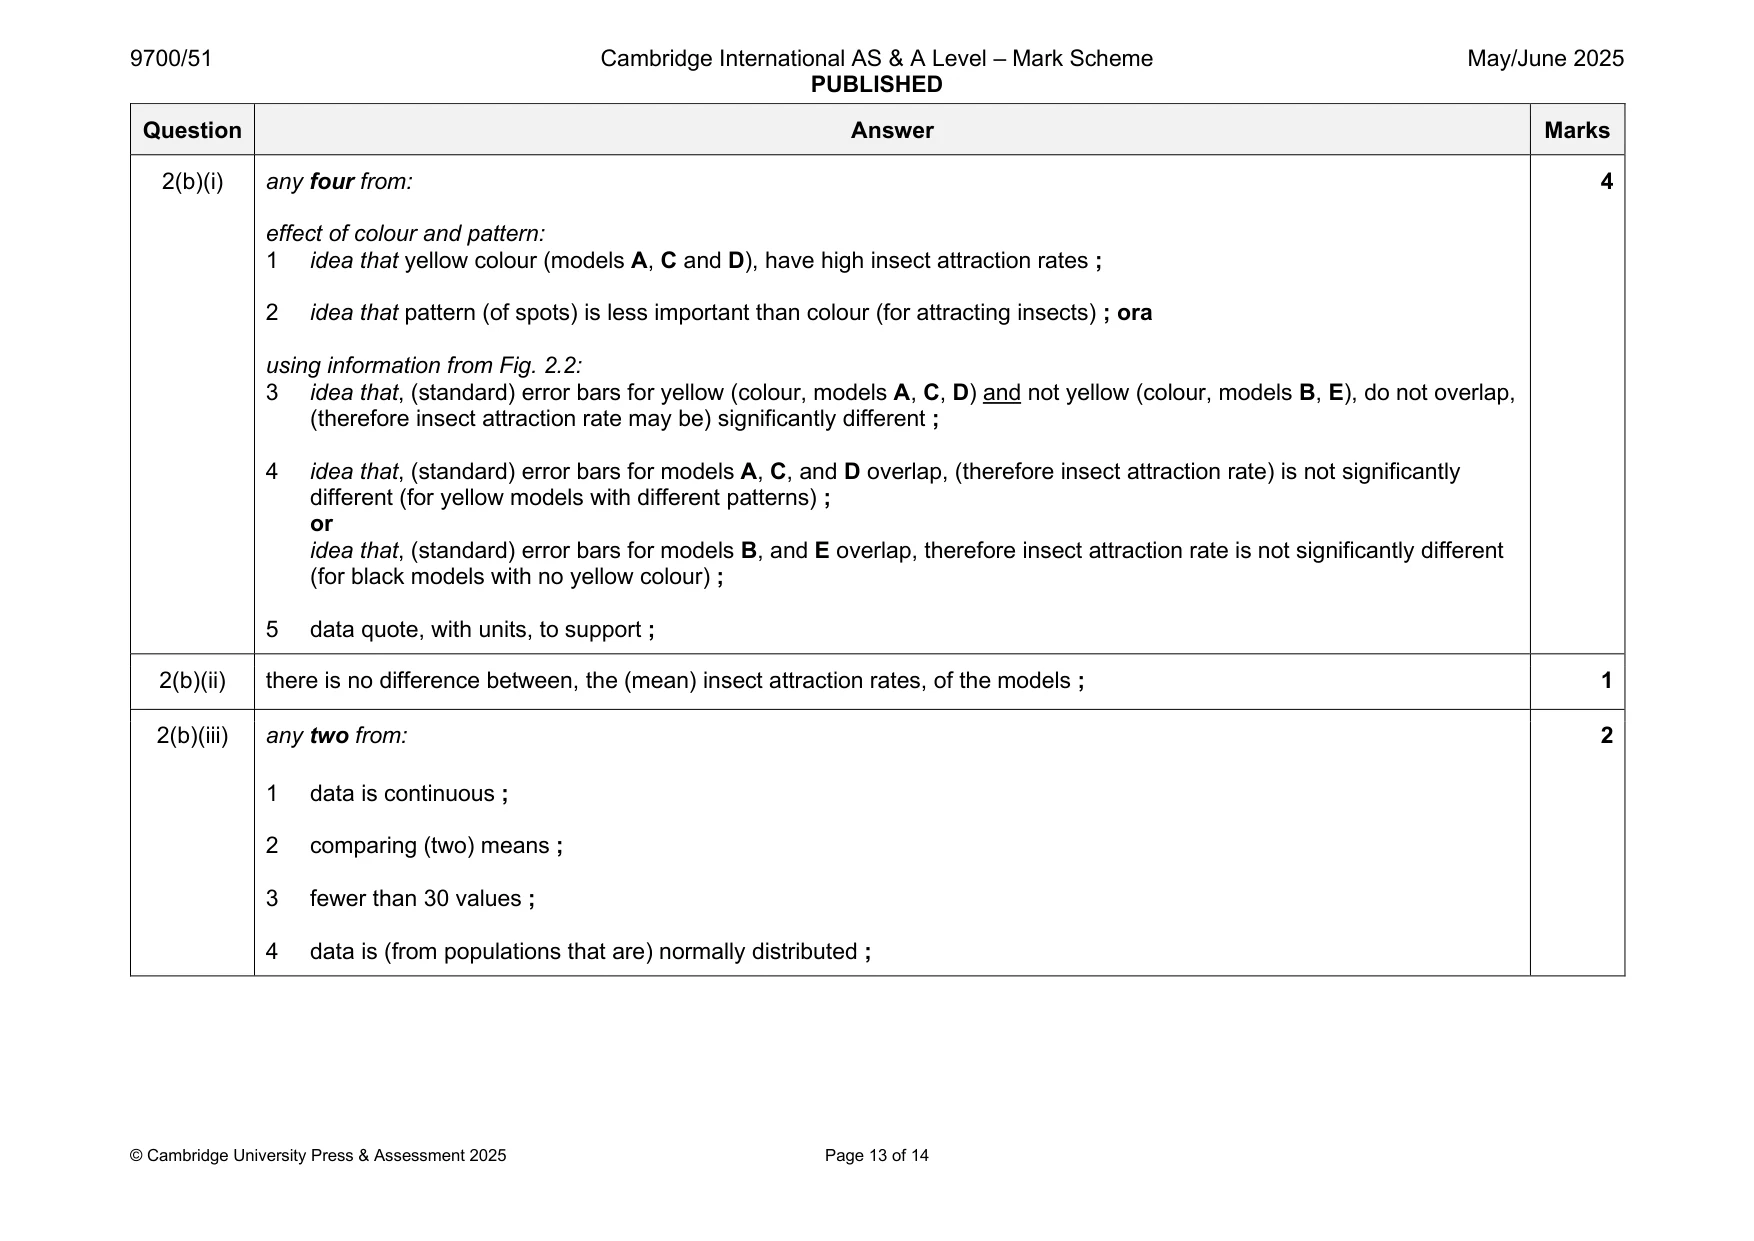
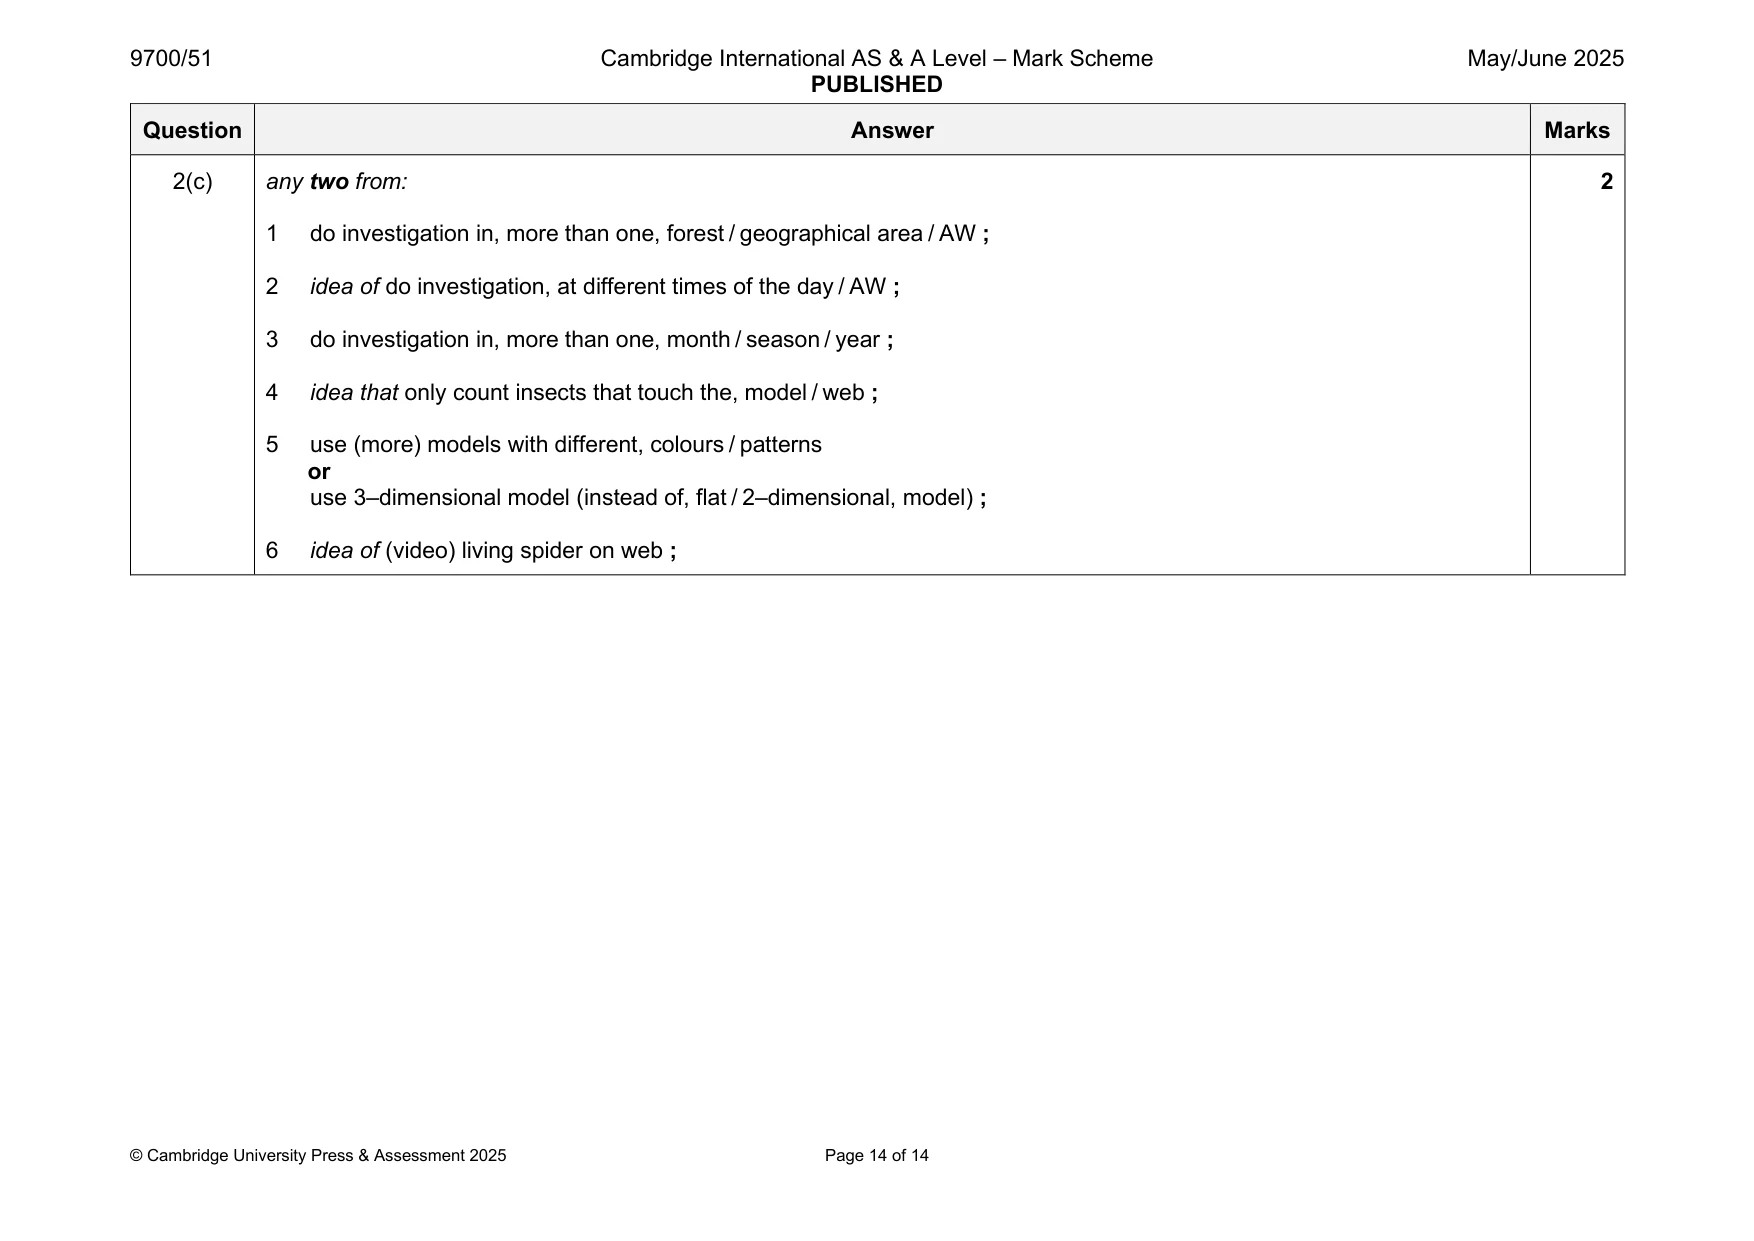
Mark scheme: 2(a)(i) number of insect attraction events (in 6 hours) ; 1 2(a)(ii) any two from: 2 1 size / length / AW (of model / body / legs) ; 2 shape / AW (of model) ; 3 material / AW (of models) ; 4 thickness / weight / mass / density / AW (of models) ; 5 yellow, colour / shade / tone / pigment / AW (of models) ; 6 light, absorption / reflection / AW (of models) 7 size of spots (on model A and B) ; 8 (models are) odourless / AW ; 2(a)(iii) (measure insect attraction rate of) web with no model ; 1 2(b)(i) any four from: 4 effect of colour and pattern: 1 idea that yellow colour (models A, C and D), have high insect attraction rates ; 2 idea that pattern (of spots) is less important than colour (for attracting insects) ; ora using information from Fig. 2.2: 3 idea that, (standard) error bars for yellow (colour, models A, C, D) and not yellow (colour, models B, E), do not overlap, (therefore insect attraction rate may be) significantly different ; 4 idea that, (standard) error bars for models A, C, and D overlap, (therefore insect attraction rate) is not significantly different (for yellow models with different patterns) ; or idea that, (standard) error bars for models B, and E overlap, therefore insect attraction rate is not significantly different (for black models with no yellow colour) ; 5 data quote, with units, to support ; 2(b)(ii) there is no difference between, the (mean) insect attraction rates, of the models ; 1 2(b)(iii) any two from: 2 1 data is continuous ; 2 comparing (two) means ; 3 fewer than 30 values ; 4 data is (from populations that are) normally distributed ; 2(c) any two from: 2 1 do investigation in, more than one, forest / geographical area / AW ; 2 idea of do investigation, at different times of the day / AW ; 3 do investigation in, more than one, month / season / year ; 4 idea that only count insects that touch the, model / web ; 5 use (more) models with different, colours / patterns or use 3–dimensional model (instead of, flat / 2–dimensional, model) ; 6 idea of (video) living spider on web ;
What was in this paper
The subtopics covered by these 2 questions, and how many questions each got. Open one in a new tab to see every Cambridge question on it.
What you needed in this session
Cambridge’s own grade thresholds for 2025 May/June, Paper 5 · Variant 1. A higher threshold means an easier paper — the bar moves with how the cohort did.