Cambridge A Level Biology 9700 — 2025 Feb/March Paper 5 · Variant 2
9700/52/F/M/25 · 3 questions · 30 marks · 75 min
The question paper and its mark scheme, free to read here and free to download. This is Cambridge’s own paper, exactly as it was sat.
Question paper16 pages









Mark scheme10 pages
Answers below. Sit the paper first if you are practising.




Questions as text
Q1 · Sand dunes are important ecosystems that are found in many regions of the world
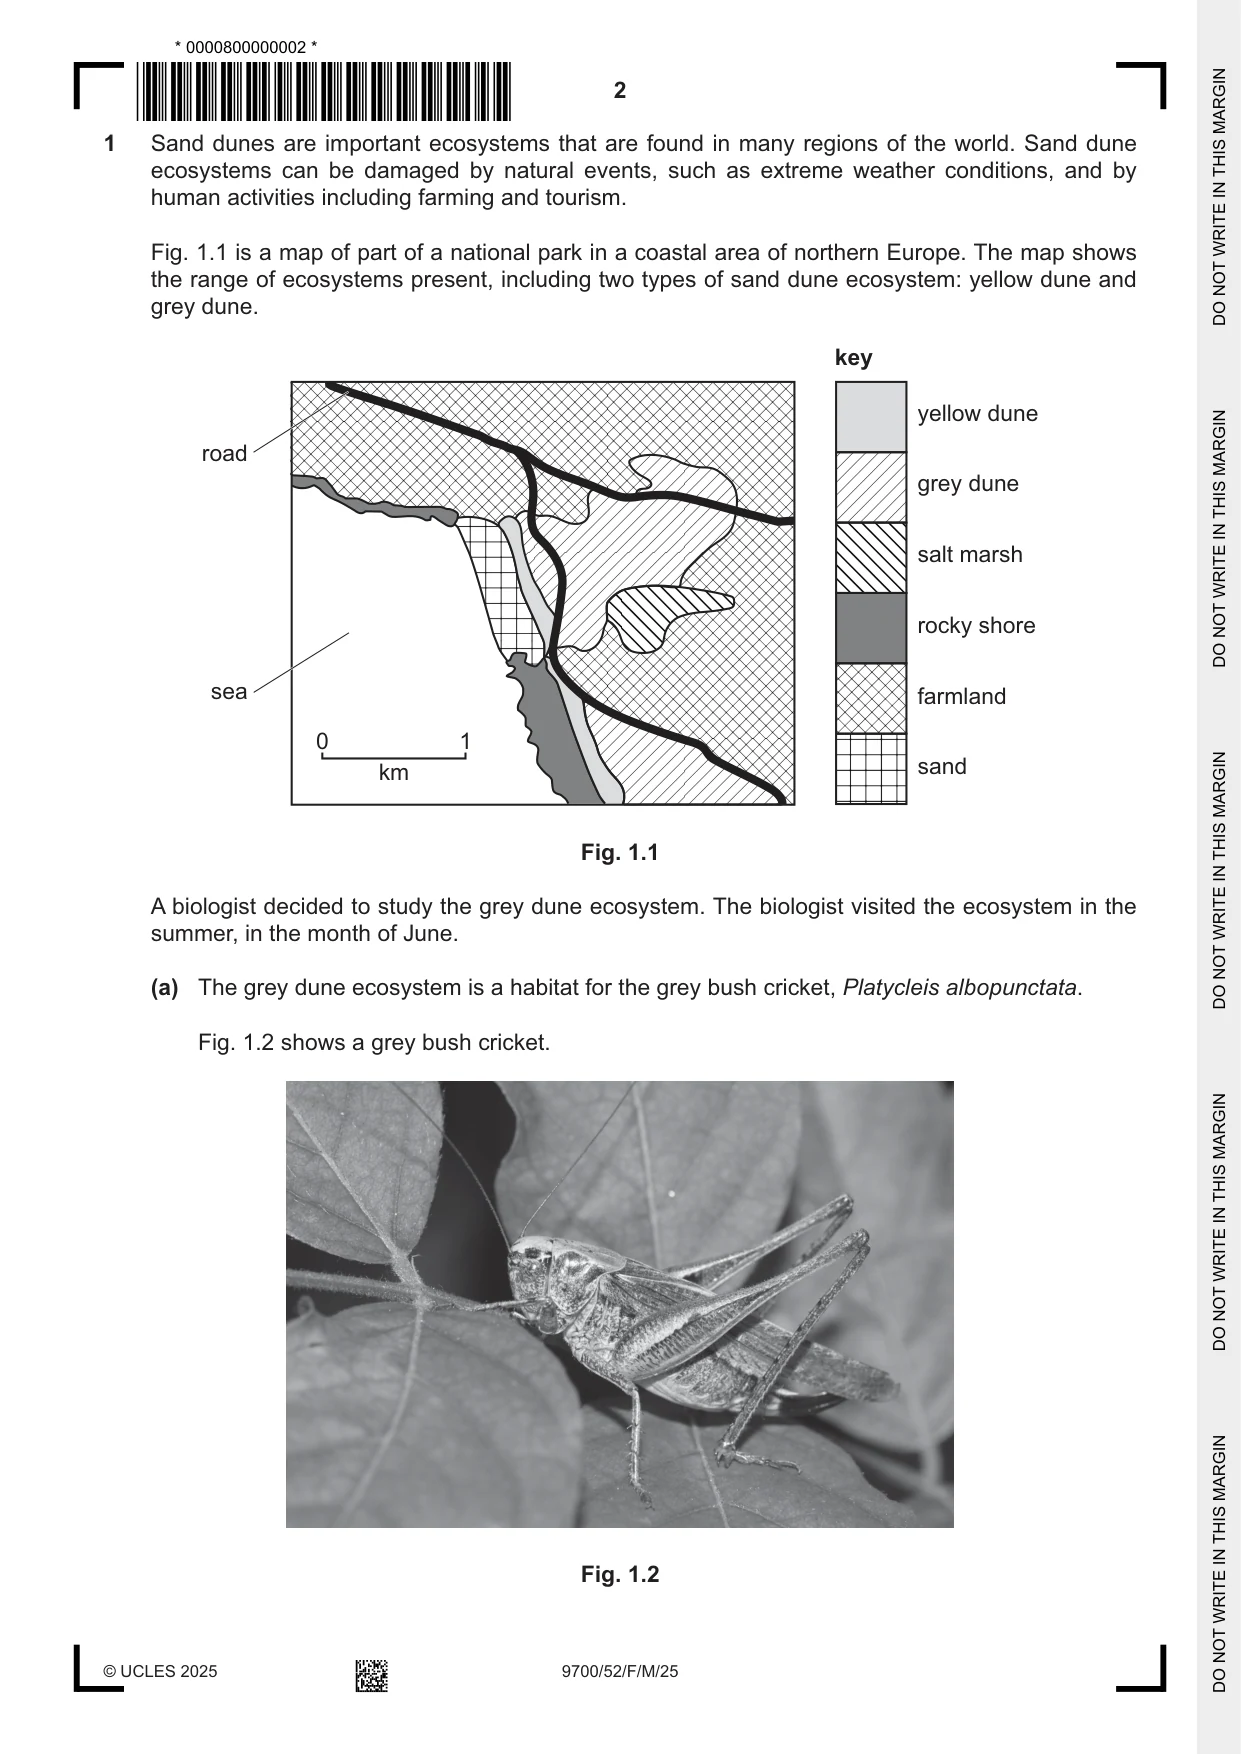
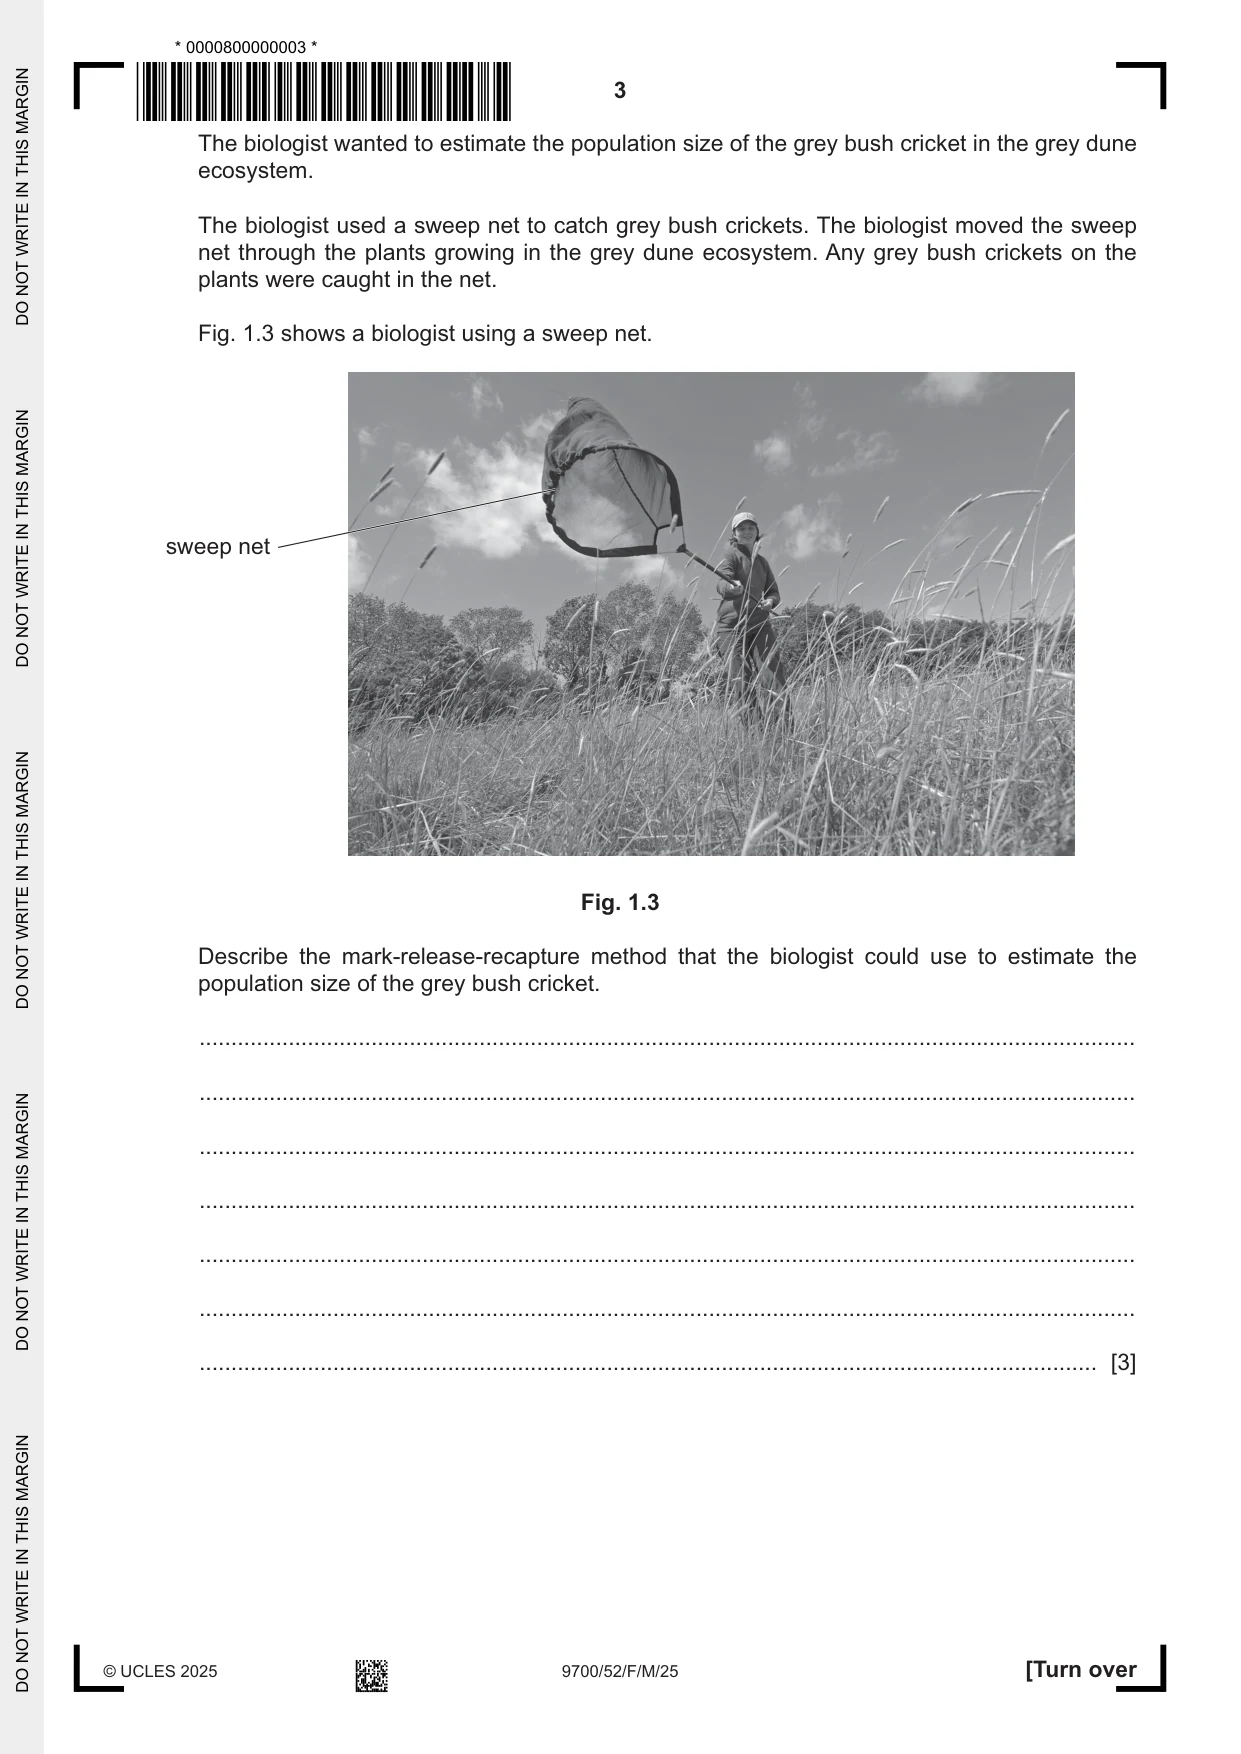
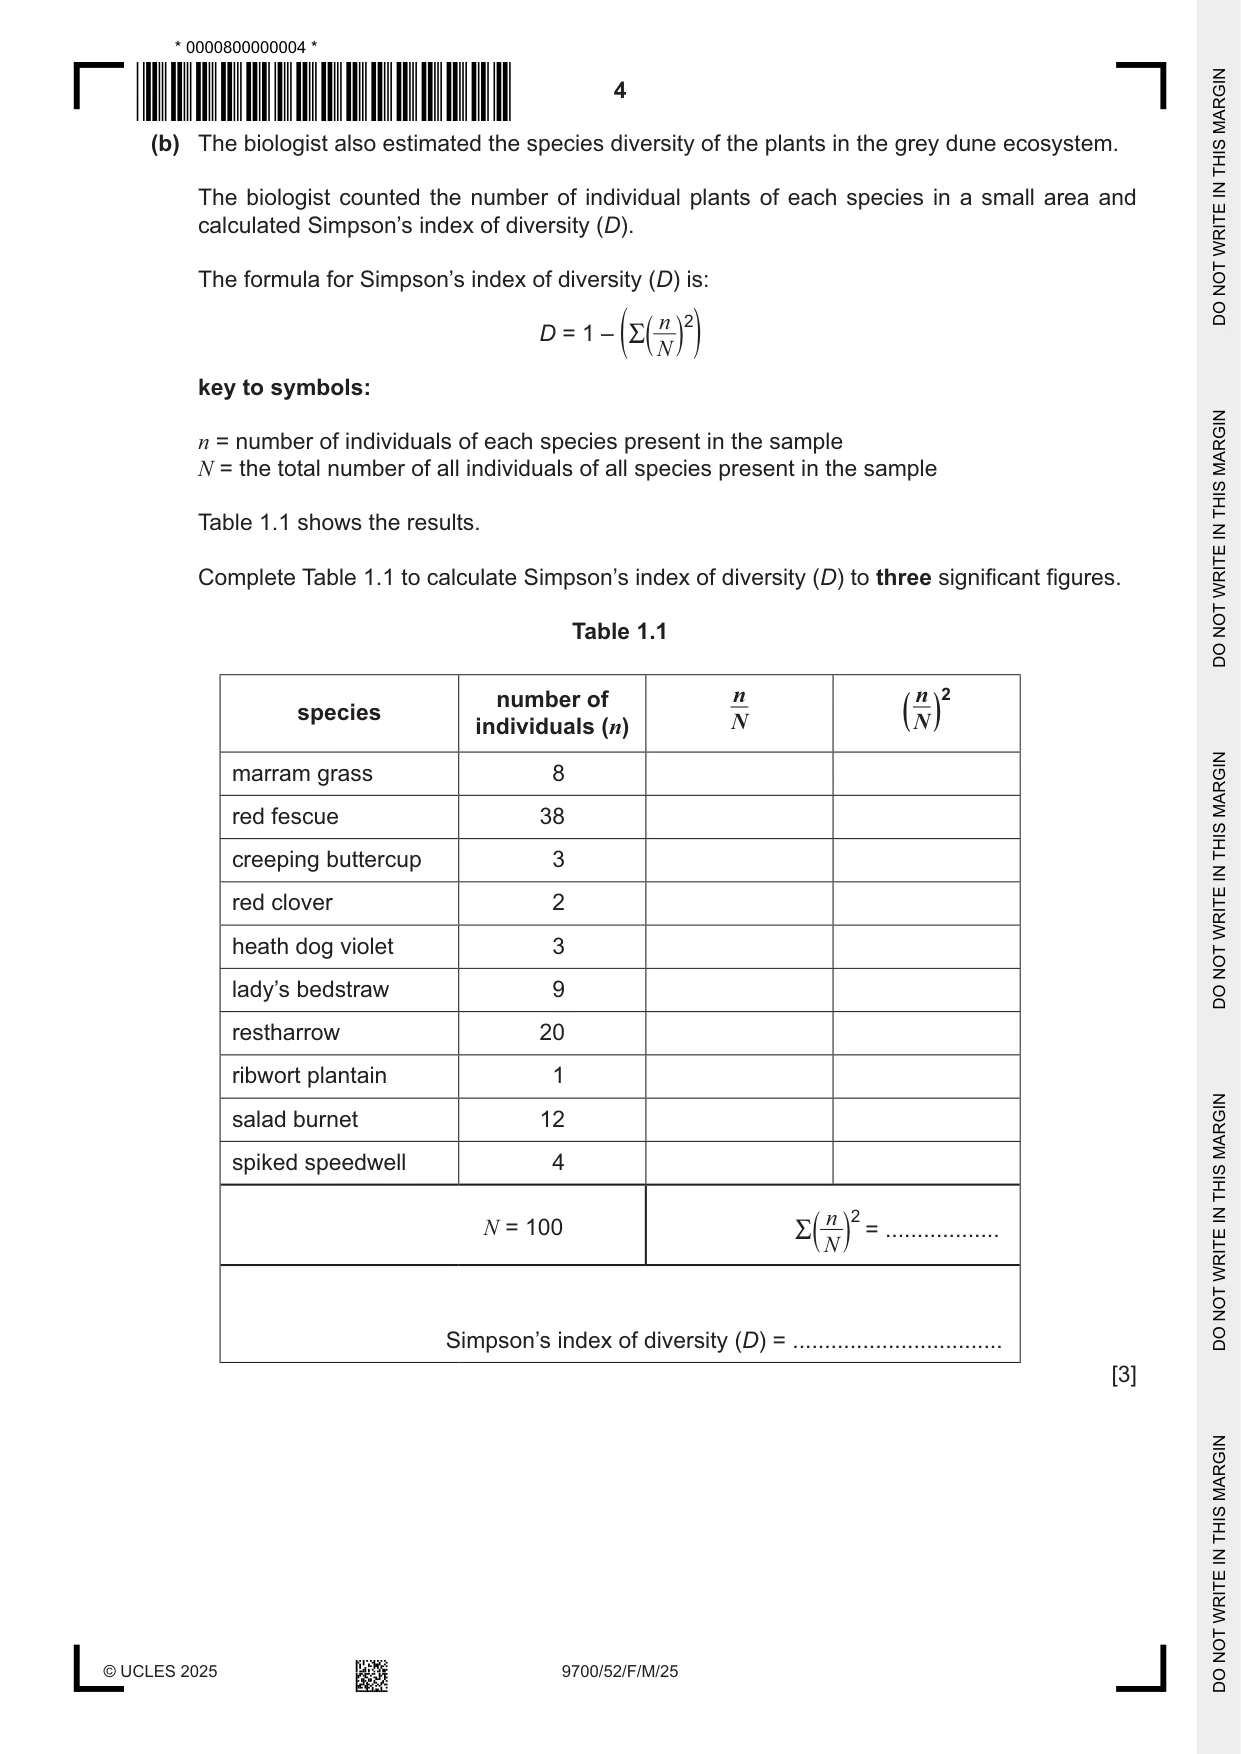
1 Sand dunes are important ecosystems that are found in many regions of the world. Sand dune ecosystems can be damaged by natural events, such as extreme weather conditions, and by human activities including farming and tourism. Fig. 1.1 is a map of part of a national park in a coastal area of northern Europe. The map shows the range of ecosystems present, including two types of sand dune ecosystem: yellow dune and grey dune. key yellow dune road grey dune salt marsh rocky shore sea farmland 0 1 km sand Fig. 1.1 A biologist decided to study the grey dune ecosystem. The biologist visited the ecosystem in the summer, in the month of June. (a) The grey dune ecosystem is a habitat for the grey bush cricket, Platycleis albopunctata. Fig. 1.2 shows a grey bush cricket. Fig. 1.2 The biologist wanted to estimate the population size of the grey bush cricket in the grey dune ecosystem. The biologist used a sweep net to catch grey bush crickets. The biologist moved the sweep net through the plants growing in the grey dune ecosystem. Any grey bush crickets on the plants were caught in the net. Fig. 1.3 shows a biologist using a sweep net. sweep net Fig. 1.3 Describe the mark-release-recapture method that the biologist could use to estimate the population size of the grey bush cricket. ................................................................................................................................................... ................................................................................................................................................... ................................................................................................................................................... ................................................................................................................................................... ................................................................................................................................................... ................................................................................................................................................... ............................................................................................................................................. [3] (b) The biologist also estimated the species diversity of the plants in the grey dune ecosystem. The biologist counted the number of individual plants of each species in a small area and calculated Simpson’s index of diversity (D). The formula for Simpson’s index of diversity (D) is: n D = 1 – (R( N)2) key to symbols: n = number of individuals of each species present in the sample N = the total number of all individuals of all species present in the sample Table 1.1 shows the results. Complete Table 1.1 to calculate Simpson’s index of diversity (D) to three significant figures. Table 1.1 number of n n 2 species ( N ) individuals (n) N marram grass 8 red fescue 38 creeping buttercup 3 red clover 2 heath dog violet 3 lady’s bedstraw 9 restharrow 20 ribwort plantain 1 salad burnet 12 spiked speedwell 4 n 2 N = 100 = .................. R( N) Simpson’s index of diversity (D) = ................................. [3] (c) The national park managers introduced some conservation practices to protect the grey sand dune ecosystem and maintain biodiversity. The biologist decided to investigate changes to the ecosystem during the ten-year period after the conservation practices were introduced. (i) The biologist monitored the light intensity and temperature in the grey dune ecosystem. Suggest two other abiotic factors the biologist could monitor during the ten-year period. ........................................................................................................................................... ..................................................................................................................................... [2] (ii) Describe a method the biologist could use to investigate changes in the species diversity of the plants in the grey dune ecosystem during the ten-year period after the conservation practices were introduced. Your method should be set out in a logical order and be detailed enough to allow another person to follow it. Details of how to calculate Simpson’s index of diversity should not be included. ........................................................................................................................................... ........................................................................................................................................... ........................................................................................................................................... ........................................................................................................................................... ........................................................................................................................................... ........................................................................................................................................... ........................................................................................................................................... ........................................................................................................................................... ........................................................................................................................................... ........................................................................................................................................... ........................................................................................................................................... ........................................................................................................................................... ........................................................................................................................................... ........................................................................................................................................... ........................................................................................................................................... ..................................................................................................................................... [7] [Total: 15]
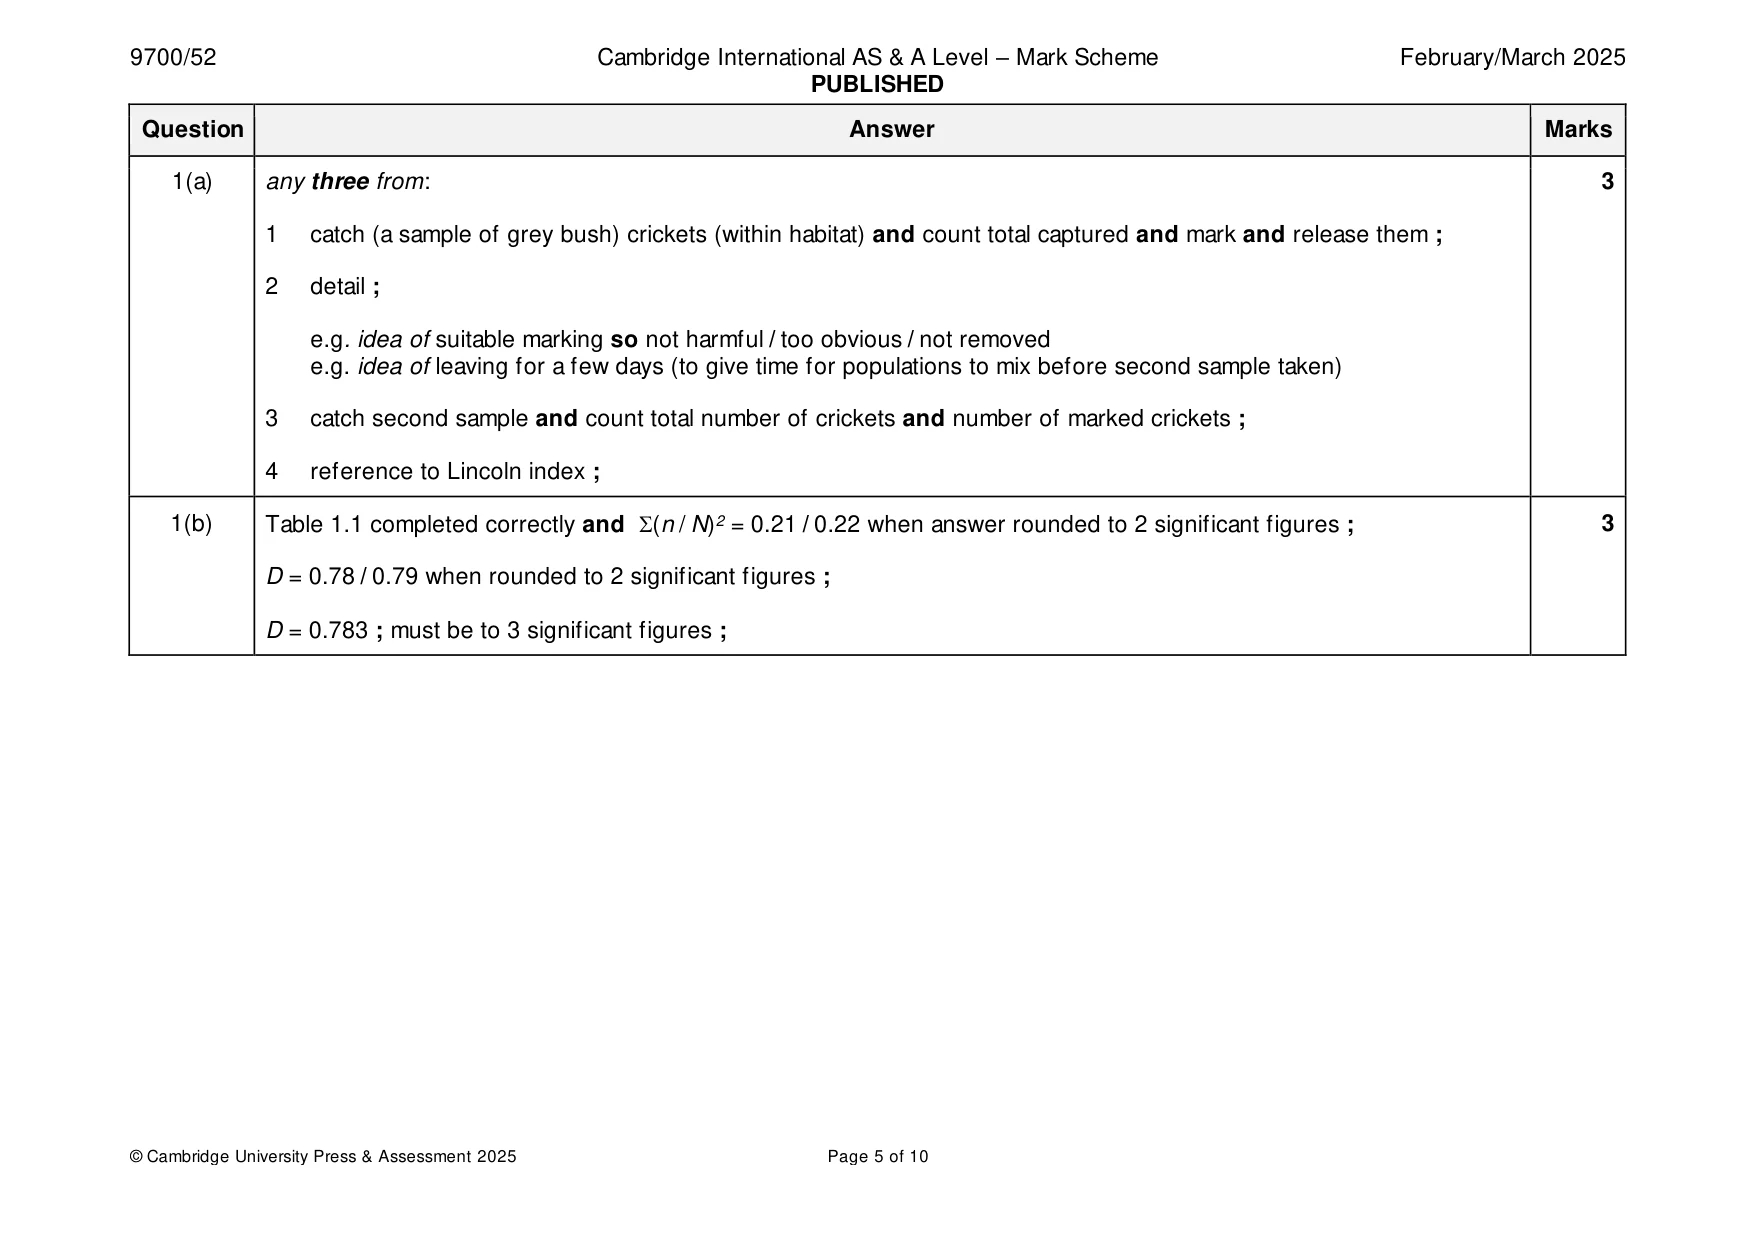
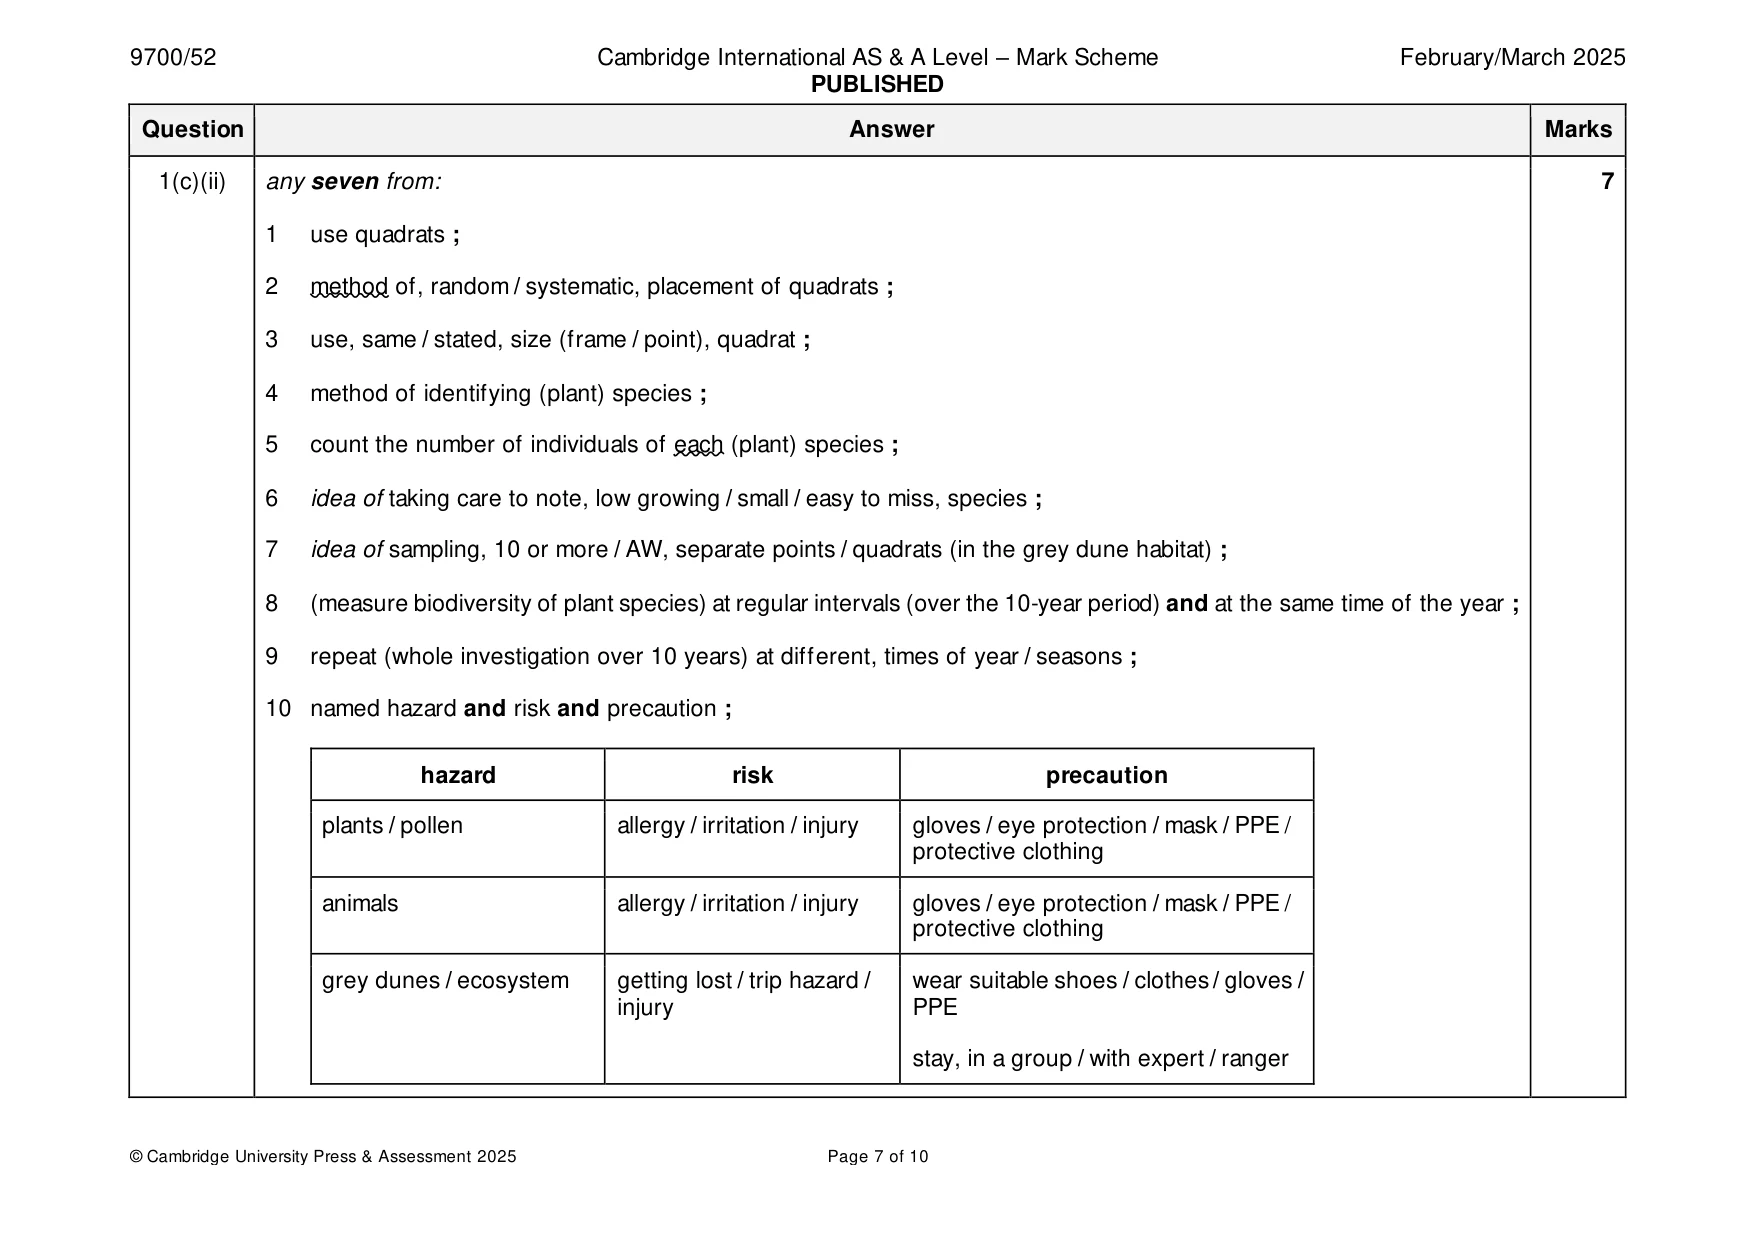
Mark scheme: Question Answer Marks 1(a) any three from: 3 1 catch (a sample of grey bush) crickets (within habitat) and count total captured and mark and release them ; 2 detail ; e.g. idea of suitable marking so not harmful / too obvious / not removed e.g. idea of leaving for a few days (to give time for populations to mix before second sample taken) 3 catch second sample and count total number of crickets and number of marked crickets ; 4 reference to Lincoln index ; 1(b) Table 1.1 completed correctly and (n / N)2 = 0.21 / 0.22 when answer rounded to 2 significant figures ; 3 D = 0.78 / 0.79 when rounded to 2 significant figures ; D = 0.783 ; must be to 3 significant figures ; 1(c)(i) any two from: 2 1 wind, speed / direction ; 2 (atmospheric) humidity ; 3 rainfall / soil water content ; 4 soil type ; 5 soil pH ; 6 salinity (of soil) ; 7 mineral / ion, concentration (of soil) ; 8 (atmospheric) carbon dioxide concentration ; 1(c)(ii) any seven from: 7 1 use quadrats ; 2 method of, random / systematic, placement of quadrats ; 3 use, same / stated, size (frame / point), quadrat ; 4 method of identifying (plant) species ; 5 count the number of individuals of each (plant) species ; 6 idea of taking care to note, low growing / small / easy to miss, species ; 7 idea of sampling, 10 or more / AW, separate points / quadrats (in the grey dune habitat) ; 8 (measure biodiversity of plant species) at regular intervals (over the 10-year period) and at the same time of the year ; 9 repeat (whole investigation over 10 years) at different, times of year / seasons ; 10 named hazard and risk and precaution ; hazard risk precaution plants / pollen allergy / irritation / injury gloves / eye protection / mask / PPE / protective clothing animals allergy / irritation / injury gloves / eye protection / mask / PPE / protective clothing grey dunes / ecosystem getting lost / trip hazard / wear suitable shoes / clothes / gloves / injury PPE stay, in a group / with expert / ranger
Q2 · Nagarahole National Park in southern India is a forest ecosystem that is important for…
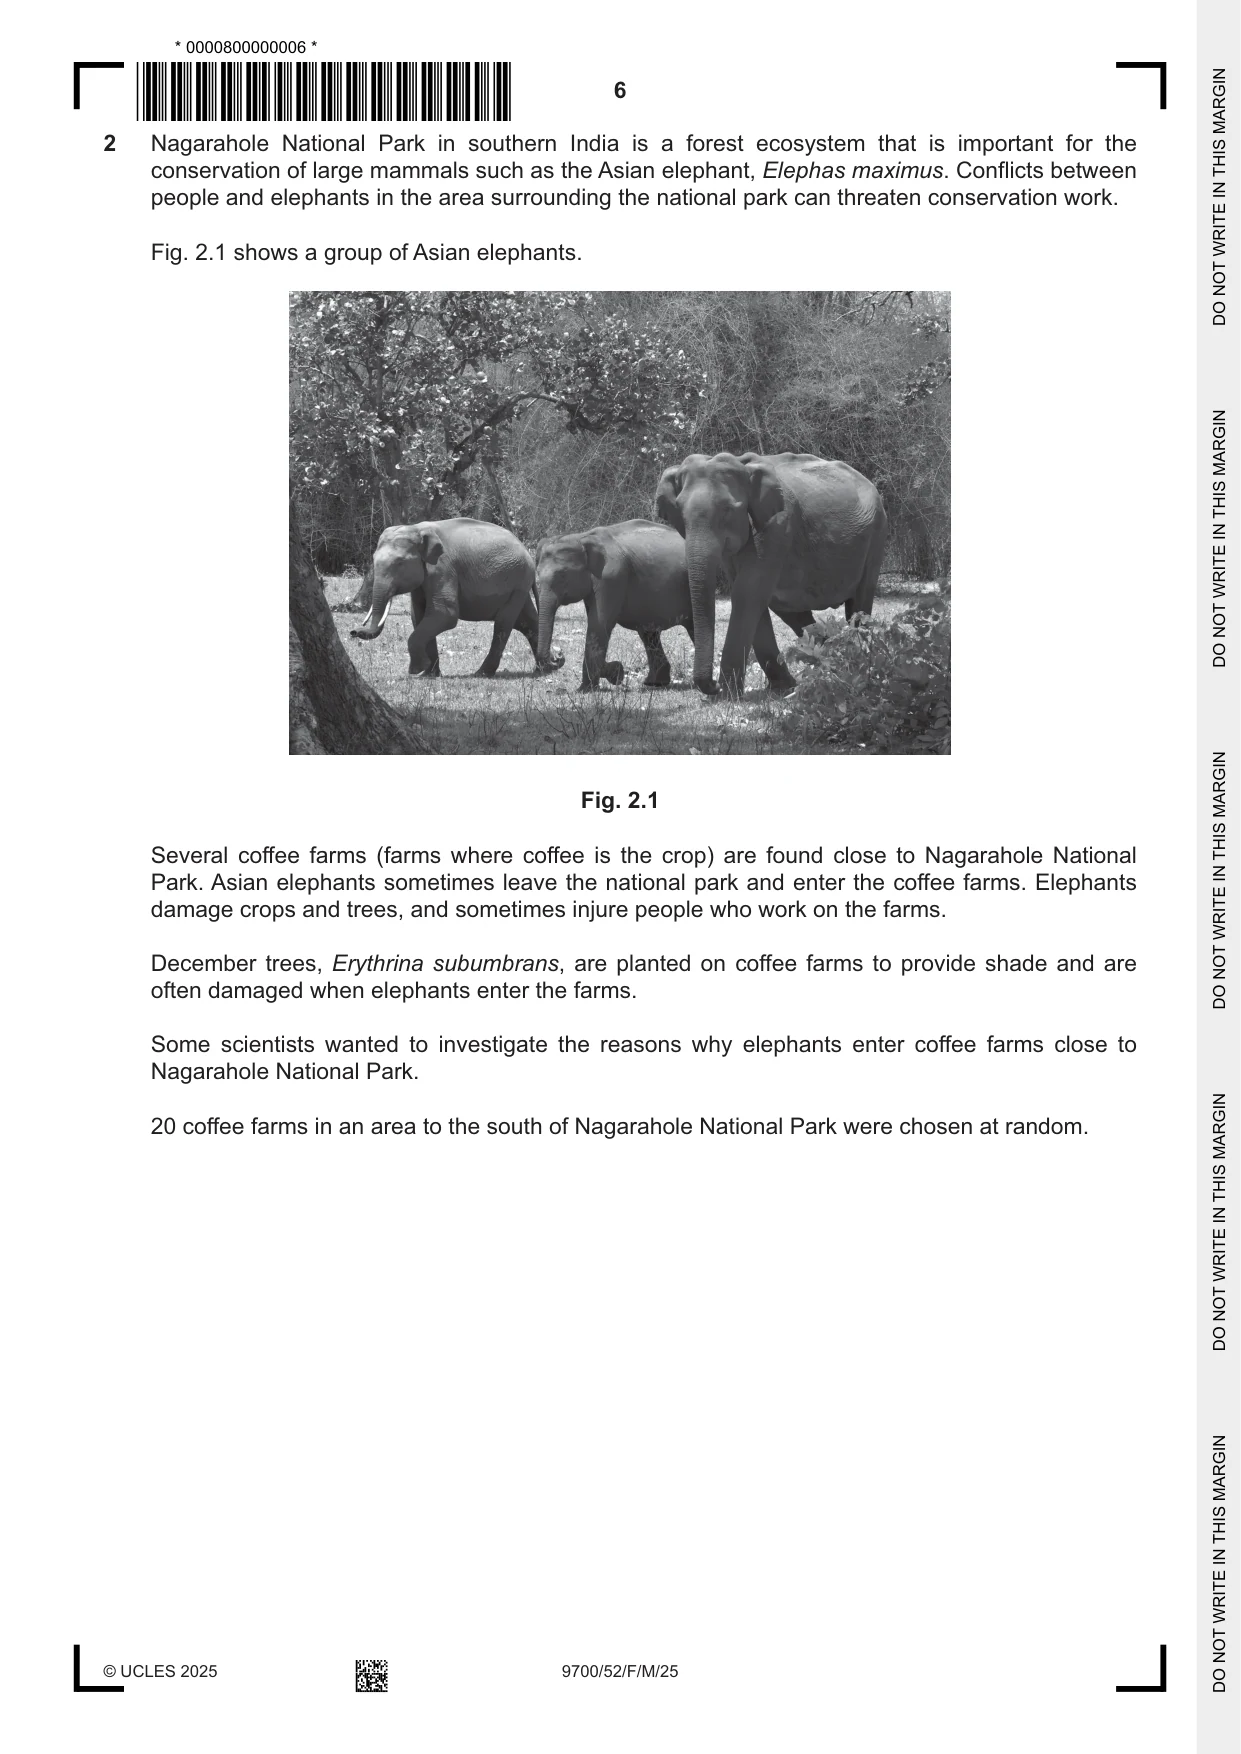
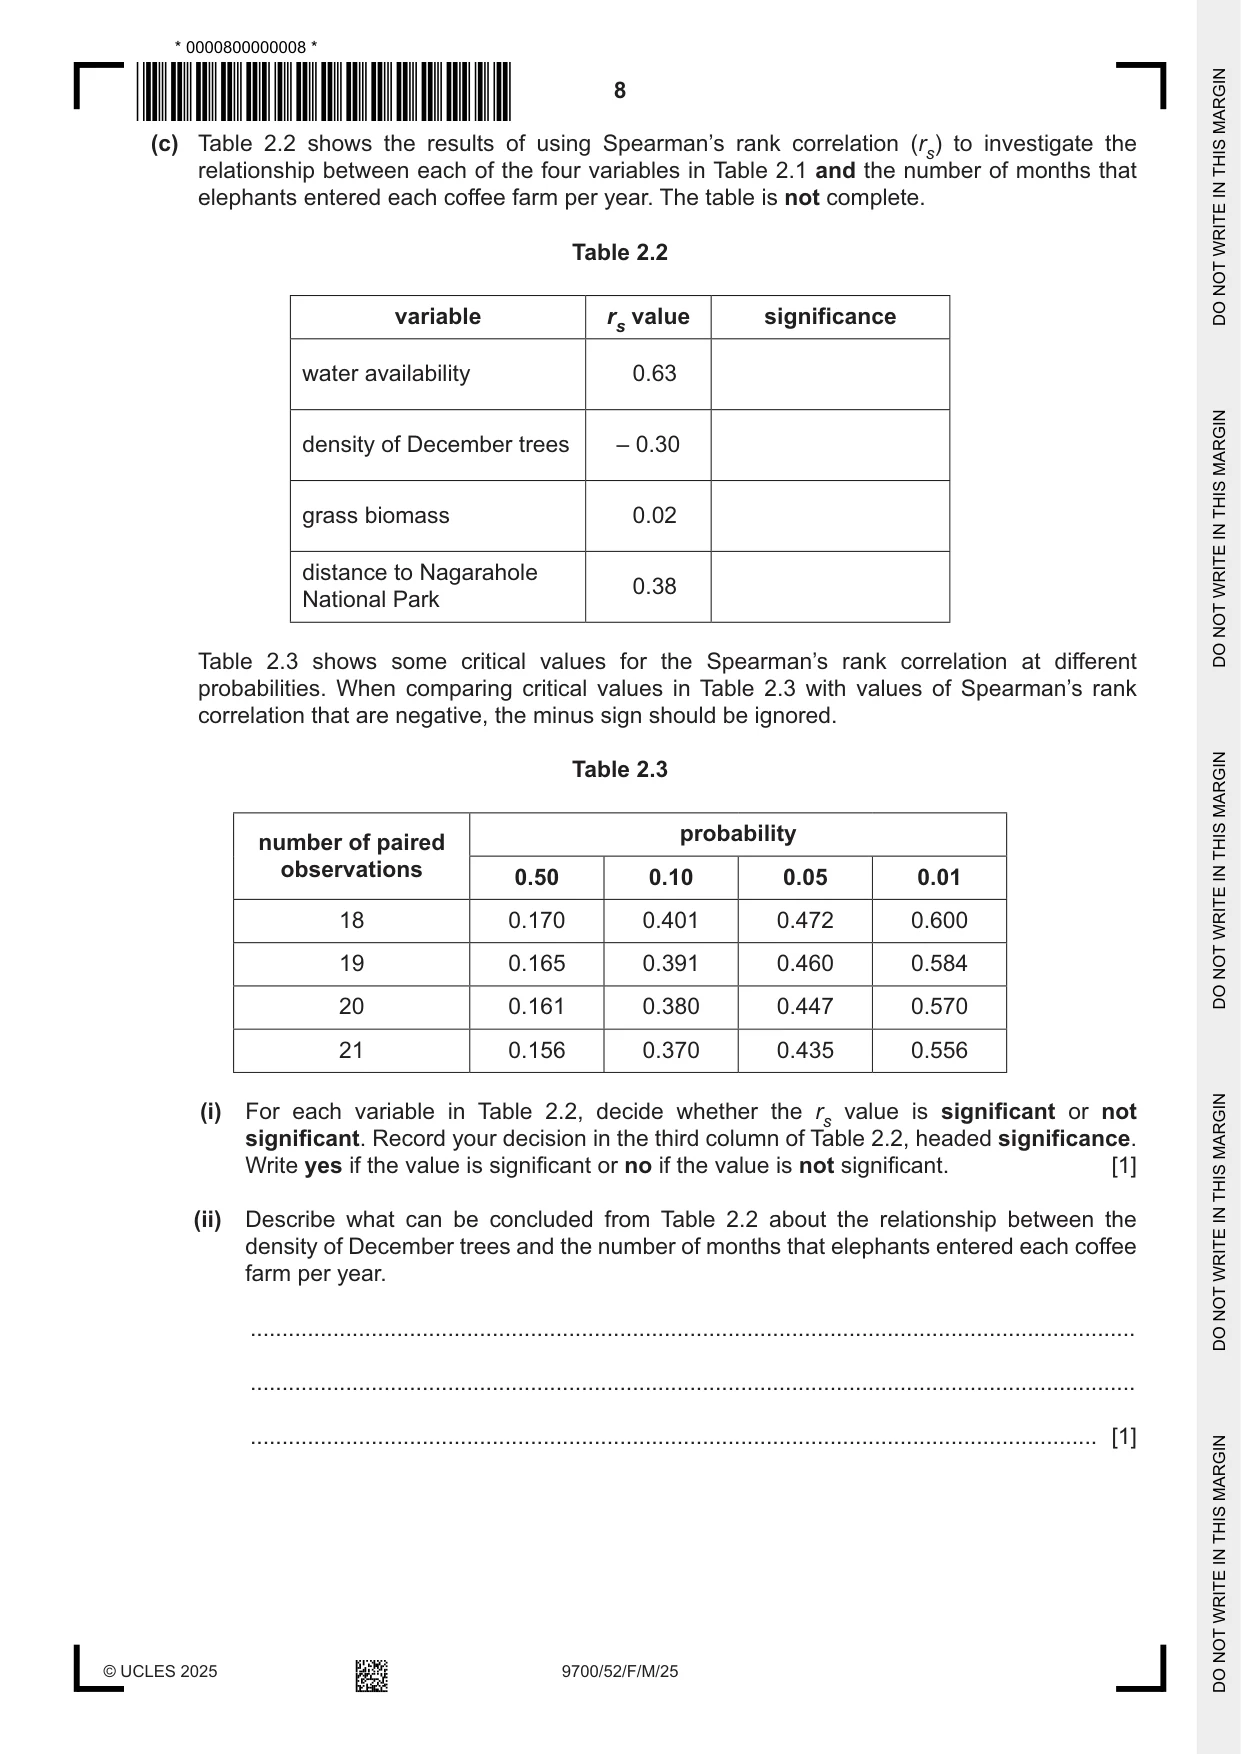
2 Nagarahole National Park in southern India is a forest ecosystem that is important for the conservation of large mammals such as the Asian elephant, Elephas maximus. Conflicts between people and elephants in the area surrounding the national park can threaten conservation work. Fig. 2.1 shows a group of Asian elephants. Fig. 2.1 Several coffee farms (farms where coffee is the crop) are found close to Nagarahole National Park. Asian elephants sometimes leave the national park and enter the coffee farms. Elephants damage crops and trees, and sometimes injure people who work on the farms. December trees, Erythrina subumbrans, are planted on coffee farms to provide shade and are often damaged when elephants enter the farms. Some scientists wanted to investigate the reasons why elephants enter coffee farms close to Nagarahole National Park. 20 coffee farms in an area to the south of Nagarahole National Park were chosen at random. In March 2008, the scientists measured four variables at each coffee farm, as shown in Table 2.1. Table 2.1 how the variable was determined for each variable coffee farm water availability counting the number of ponds, lakes and water holes visible in satellite images density of December trees counting the number of December trees in ten circular areas, each with a radius of 10 m grass biomass drying and measuring the dry mass of all the grass leaves collected in 50 randomly selected areas of 0.25 m2 distance from Nagarahole using GPS to measure the distance between National Park the boundary of Nagarahole National Park and the boundary of the farm Farmers from each coffee farm completed a questionnaire to record when elephants entered the farm. The scientists decided to use Spearman’s rank correlation to investigate the relationship between each of the four variables in Table 2.1 and the number of months that elephants entered each coffee farm per year. (a) State two conditions that allow Spearman’s rank correlation to be used in this investigation. ................................................................................................................................................... ................................................................................................................................................... ................................................................................................................................................... ................................................................................................................................................... ............................................................................................................................................. [2] (b) State a null hypothesis for testing whether there is a correlation between water availability and the number of months that elephants entered each coffee farm per year. ................................................................................................................................................... ................................................................................................................................................... ............................................................................................................................................. [1] (c) Table 2.2 shows the results of using Spearman’s rank correlation (rs) to investigate the relationship between each of the four variables in Table 2.1 and the number of months that elephants entered each coffee farm per year. The table is not complete. Table 2.2 variable rs value significance water availability 0.63 density of December trees – 0.30 grass biomass 0.02 distance to Nagarahole 0.38 National Park Table 2.3 shows some critical values for the Spearman’s rank correlation at different probabilities. When comparing critical values in Table 2.3 with values of Spearman’s rank correlation that are negative, the minus sign should be ignored. Table 2.3 probability number of paired observations 0.50 0.10 0.05 0.01 18 0.170 0.401 0.472 0.600 19 0.165 0.391 0.460 0.584 20 0.161 0.380 0.447 0.570 21 0.156 0.370 0.435 0.556 (i) For each variable in Table 2.2, decide whether the rs value is significant or not significant. Record your decision in the third column of Table 2.2, headed significance. Write yes if the value is significant or no if the value is not significant. [1] (ii) Describe what can be concluded from Table 2.2 about the relationship between the density of December trees and the number of months that elephants entered each coffee farm per year. ........................................................................................................................................... ........................................................................................................................................... ..................................................................................................................................... [1] (d) A coffee farmer living close to a different national park in India wanted to reduce the number of times that elephants entered the farm. The farmer analysed data from the investigation and concluded that reducing the number of ponds, lakes and water holes on the farm would reduce the number of times that elephants entered the farm. Explain how the information provided and the data in Table 2.2 support and do not support this conclusion. support ...................................................................................................................................... ................................................................................................................................................... ................................................................................................................................................... ................................................................................................................................................... ................................................................................................................................................... do not support .......................................................................................................................... ................................................................................................................................................... ................................................................................................................................................... ................................................................................................................................................... ................................................................................................................................................... [3] [Total: 8]
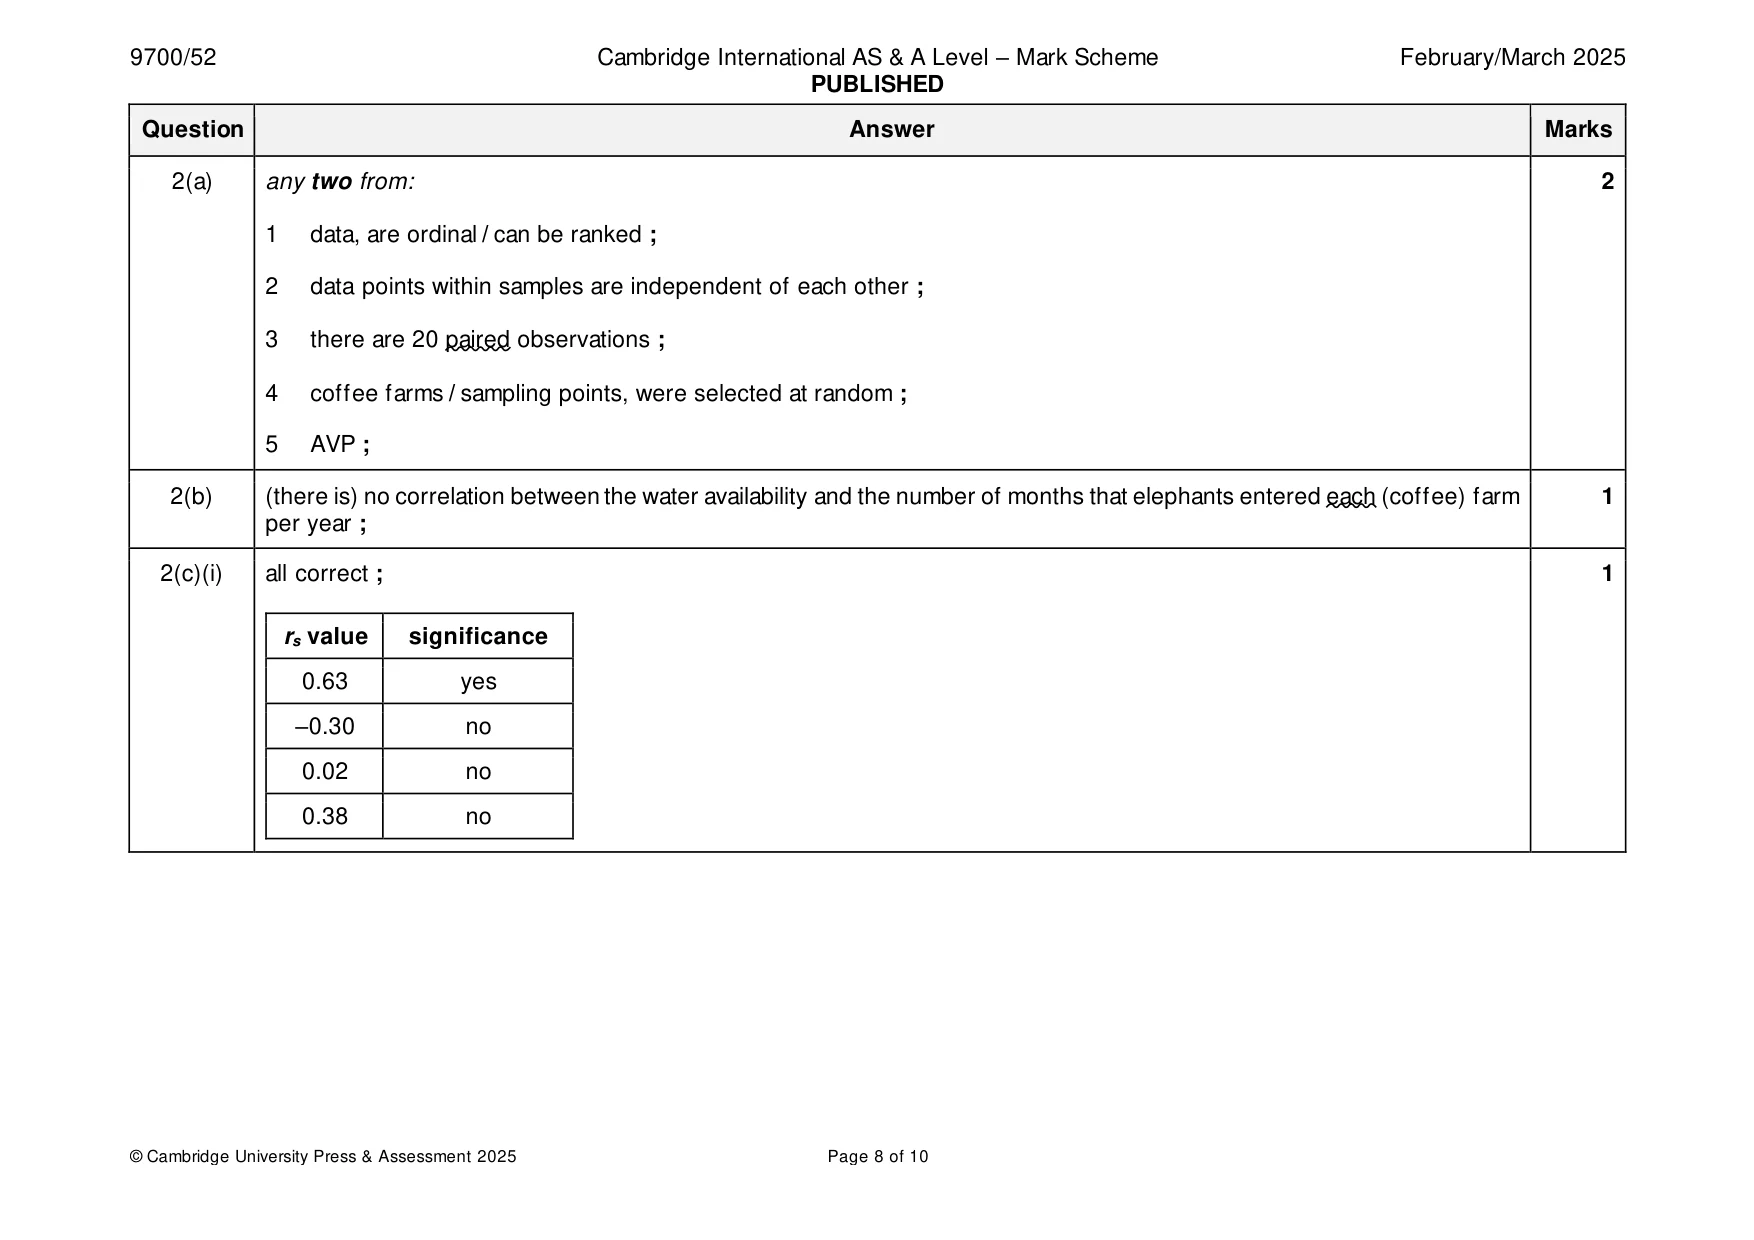
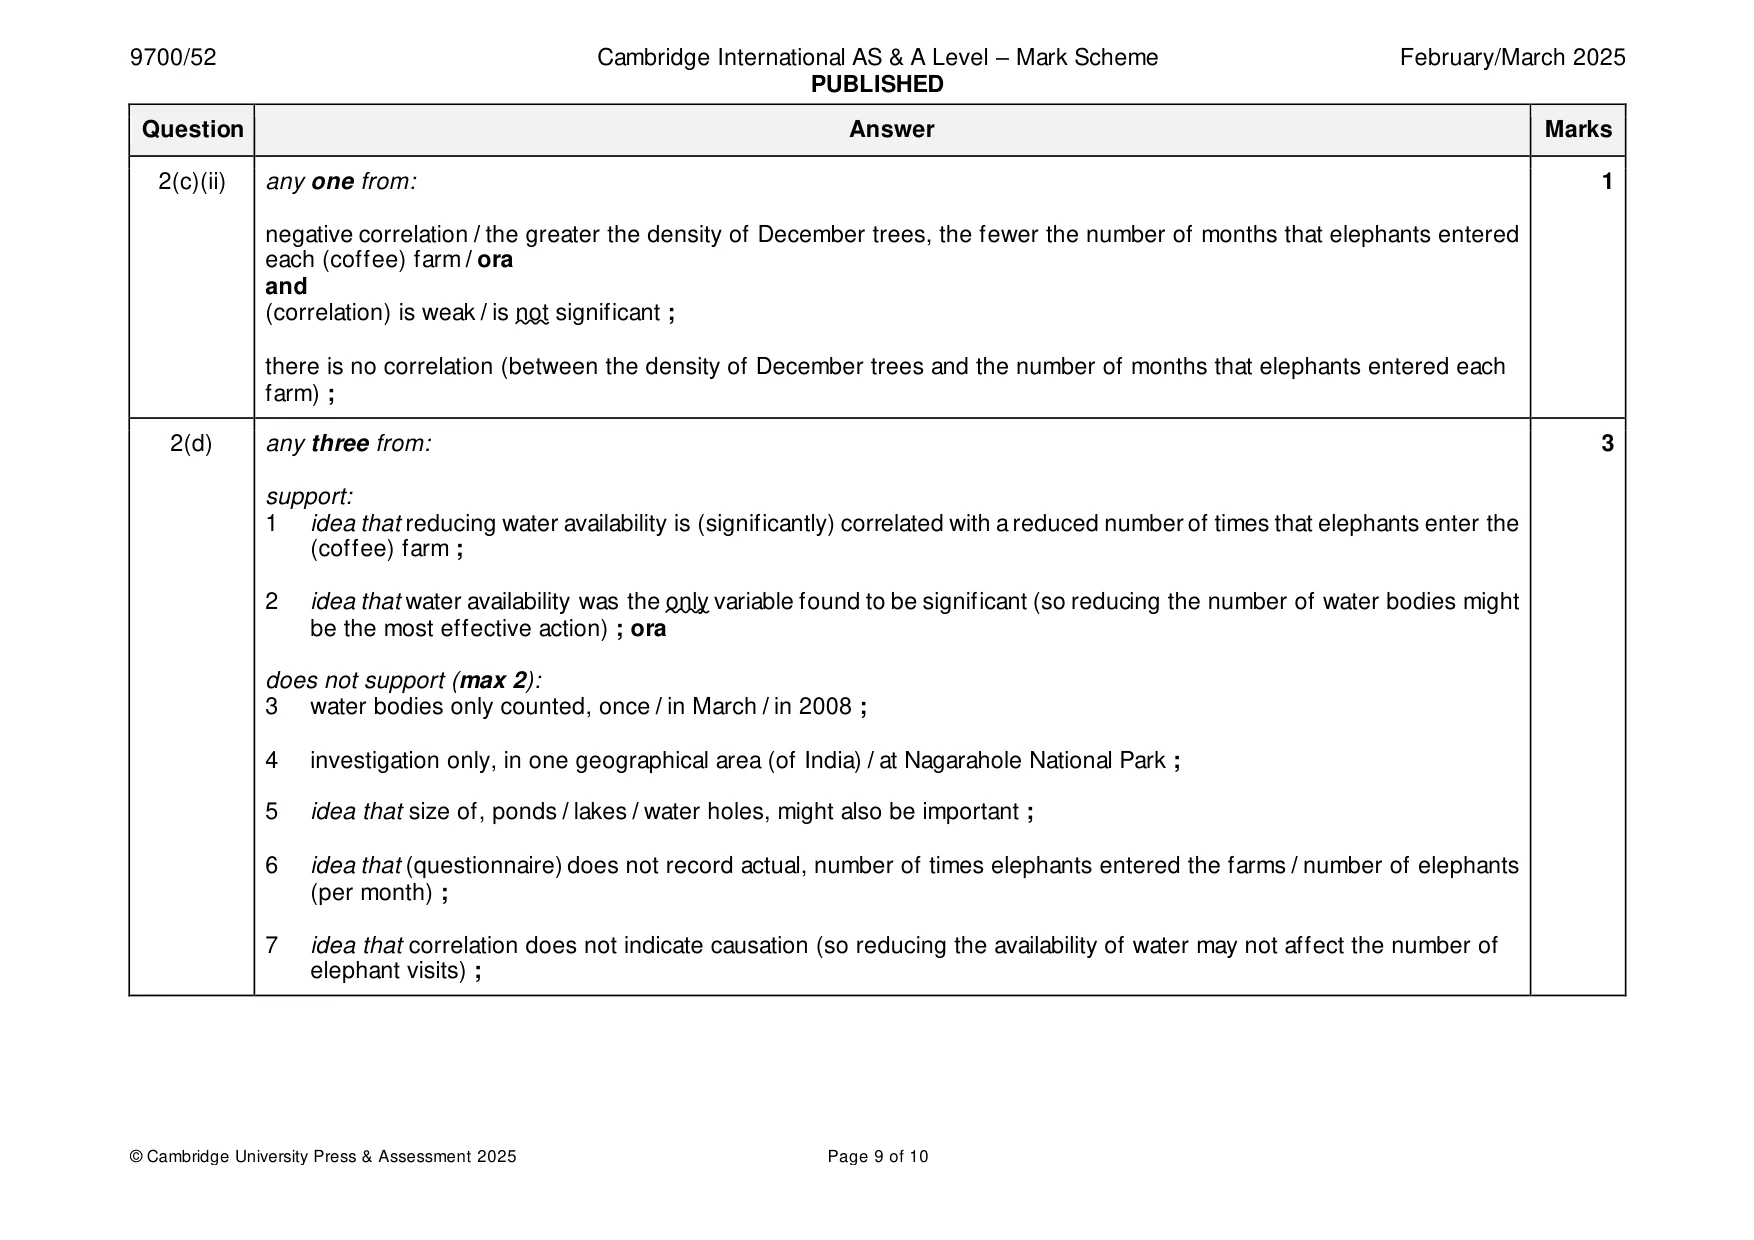
Mark scheme: 2(a) any two from: 2 1 data, are ordinal / can be ranked ; 2 data points within samples are independent of each other ; 3 there are 20 paired observations ; 4 coffee farms / sampling points, were selected at random ; 5 AVP ; 2(b) (there is) no correlation between the water availability and the number of months that elephants entered each (coffee) farm 1 per year ; 2(c)(i) all correct ; 1 rs value significance 0.63 yes –0.30 no 0.02 no 0.38 no 2(c)(ii) any one from: 1 negative correlation / the greater the density of December trees, the fewer the number of months that elephants entered each (coffee) farm / ora and (correlation) is weak / is not significant ; there is no correlation (between the density of December trees and the number of months that elephants entered each farm) ; 2(d) any three from: 3 support: 1 idea that reducing water availability is (significantly) correlated with a reduced number of times that elephants enter the (coffee) farm ; 2 idea that water availability was the only variable found to be significant (so reducing the number of water bodies might be the most effective action) ; ora does not support (max 2): 3 water bodies only counted, once / in March / in 2008 ; 4 investigation only, in one geographical area (of India) / at Nagarahole National Park ; 5 idea that size of, ponds / lakes / water holes, might also be important ; 6 idea that (questionnaire) does not record actual, number of times elephants entered the farms / number of elephants (per month) ; 7 idea that correlation does not indicate causation (so reducing the availability of water may not affect the number of elephant visits) ;
Q3 · Type 1 diabetes is a disease that occurs when the pancreas stops producing insulin
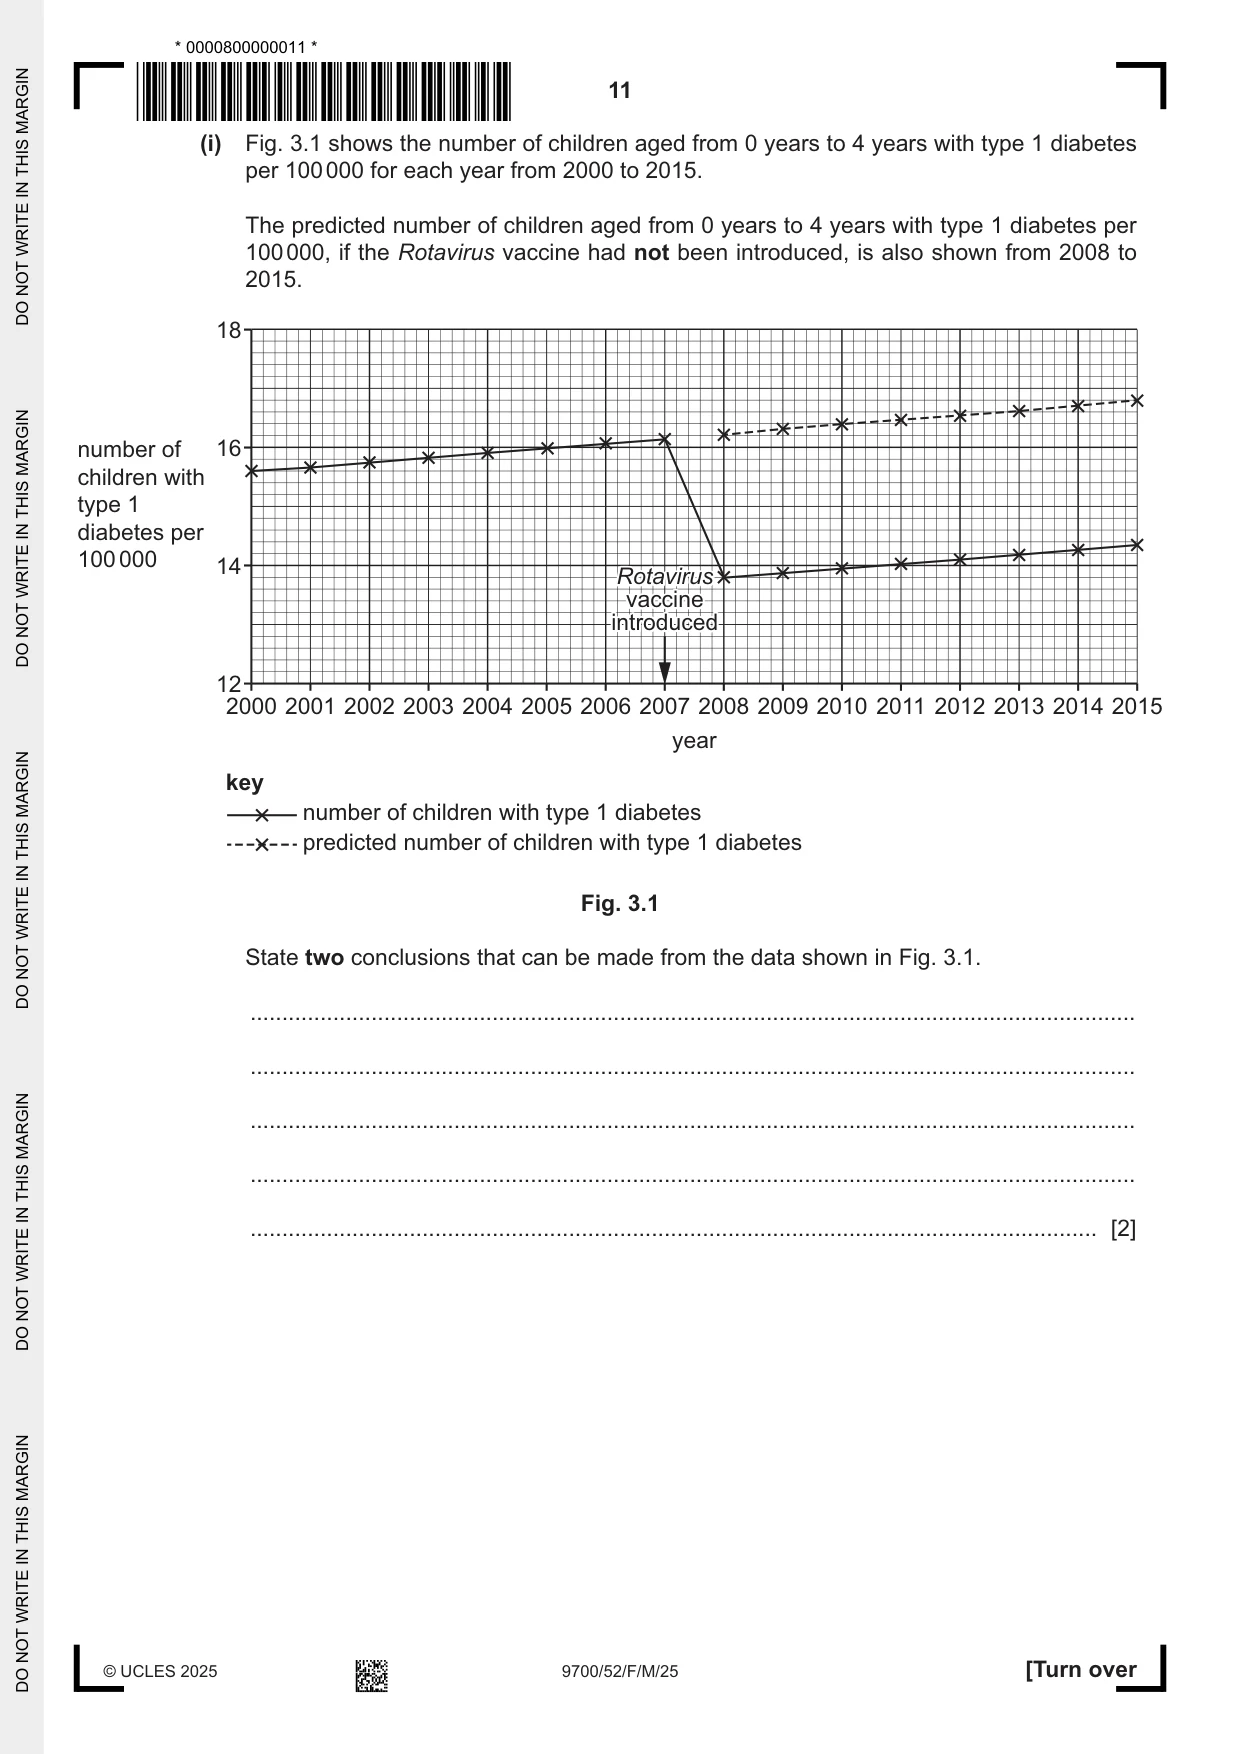
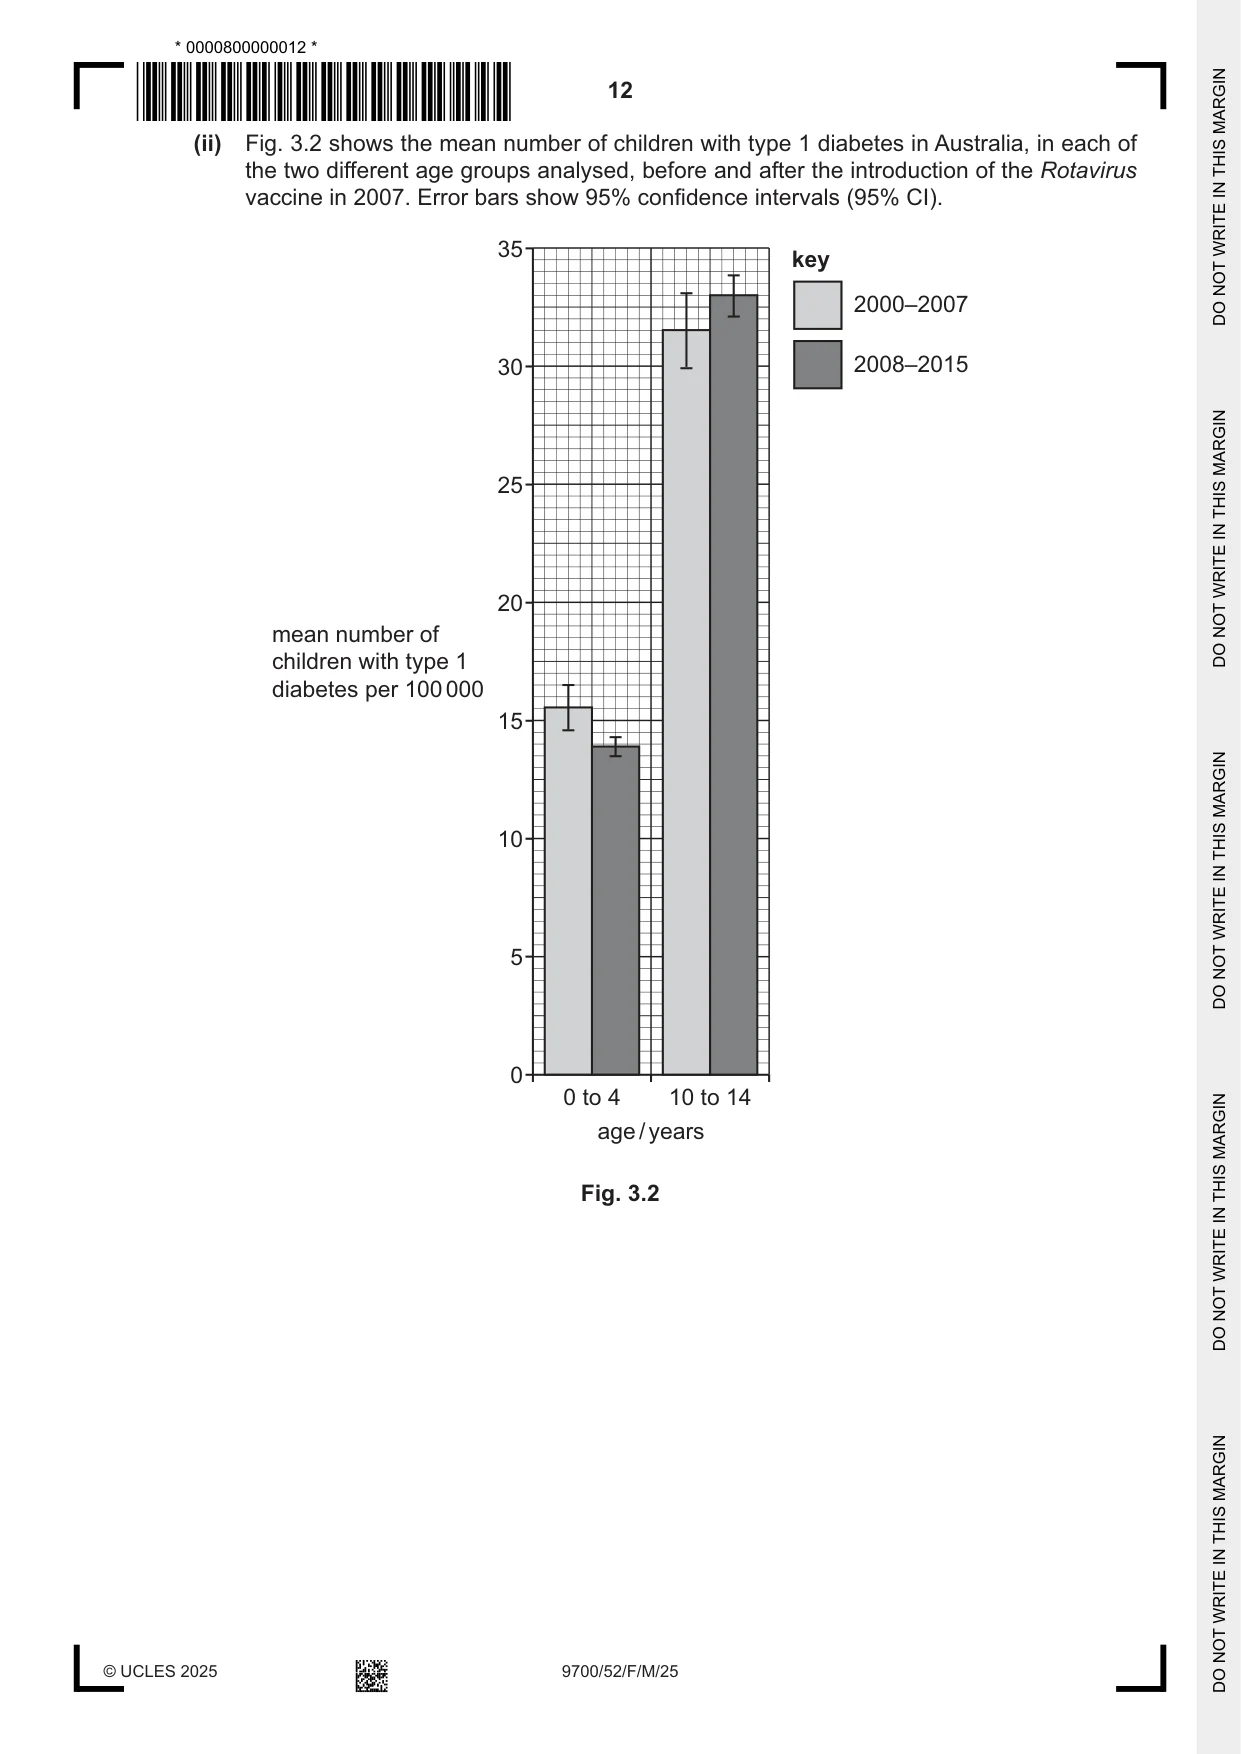
3 Type 1 diabetes is a disease that occurs when the pancreas stops producing insulin. Type 1 diabetes occurs most commonly in children and is often the result of the immune system destroying beta cells in the pancreas. Beta cells are the cells in the pancreas that make insulin. Rotavirus is a genus of RNA viruses that can cause infections in people throughout most of the world. Infection by Rotavirus causes sickness and diarrhoea in babies and young children, and may damage the pancreas. Rotavirus infections are also associated with the development of type 1 diabetes in children. In May 2007, a vaccination against Rotavirus was introduced in Australia. All babies aged from 2 months to 4 months were offered the Rotavirus vaccine. Some scientists decided to investigate whether vaccination against Rotavirus had reduced the number of children with type 1 diabetes in Australia. (a) Identify the independent variable and the dependent variable in this investigation. independent variable ................................................................................................................ dependent variable ................................................................................................................... [2] (b) The scientists used data that had been collected from 2000 to 2015. For each year from 2000 to 2015, the scientists used the data to: • find the number of children aged from 0 years to 4 years • find the number of children aged from 0 years to 4 years with type 1 diabetes • calculate the number of children aged from 0 years to 4 years with type 1 diabetes per 100 000 children that were aged from 0 to 4 years. The scientists repeated this analysis for children aged from 10 years to 14 years. (i) Fig. 3.1 shows the number of children aged from 0 years to 4 years with type 1 diabetes per 100 000 for each year from 2000 to 2015. The predicted number of children aged from 0 years to 4 years with type 1 diabetes per 100 000, if the Rotavirus vaccine had not been introduced, is also shown from 2008 to 2015. 18 number of 16 children with type 1 diabetes per 100 000 14 RotavirusRotavirus vaccinevaccine introducedintroduced 12 2000 2001 2002 2003 2004 2005 2006 2007 2008 2009 2010 2011 2012 2013 2014 2015 year key number of children with type 1 diabetes predicted number of children with type 1 diabetes Fig. 3.1 State two conclusions that can be made from the data shown in Fig. 3.1. ........................................................................................................................................... ........................................................................................................................................... ........................................................................................................................................... ........................................................................................................................................... ..................................................................................................................................... [2] (ii) Fig. 3.2 shows the mean number of children with type 1 diabetes in Australia, in each of the two different age groups analysed, before and after the introduction of the Rotavirus vaccine in 2007. Error bars show 95% confidence intervals (95% CI). 35 key 2000–2007 30 2008–2015 25 20 mean number of children with type 1 diabetes per 100 000 15 10 5 0 0 to 4 10 to 14 age / years Fig. 3.2
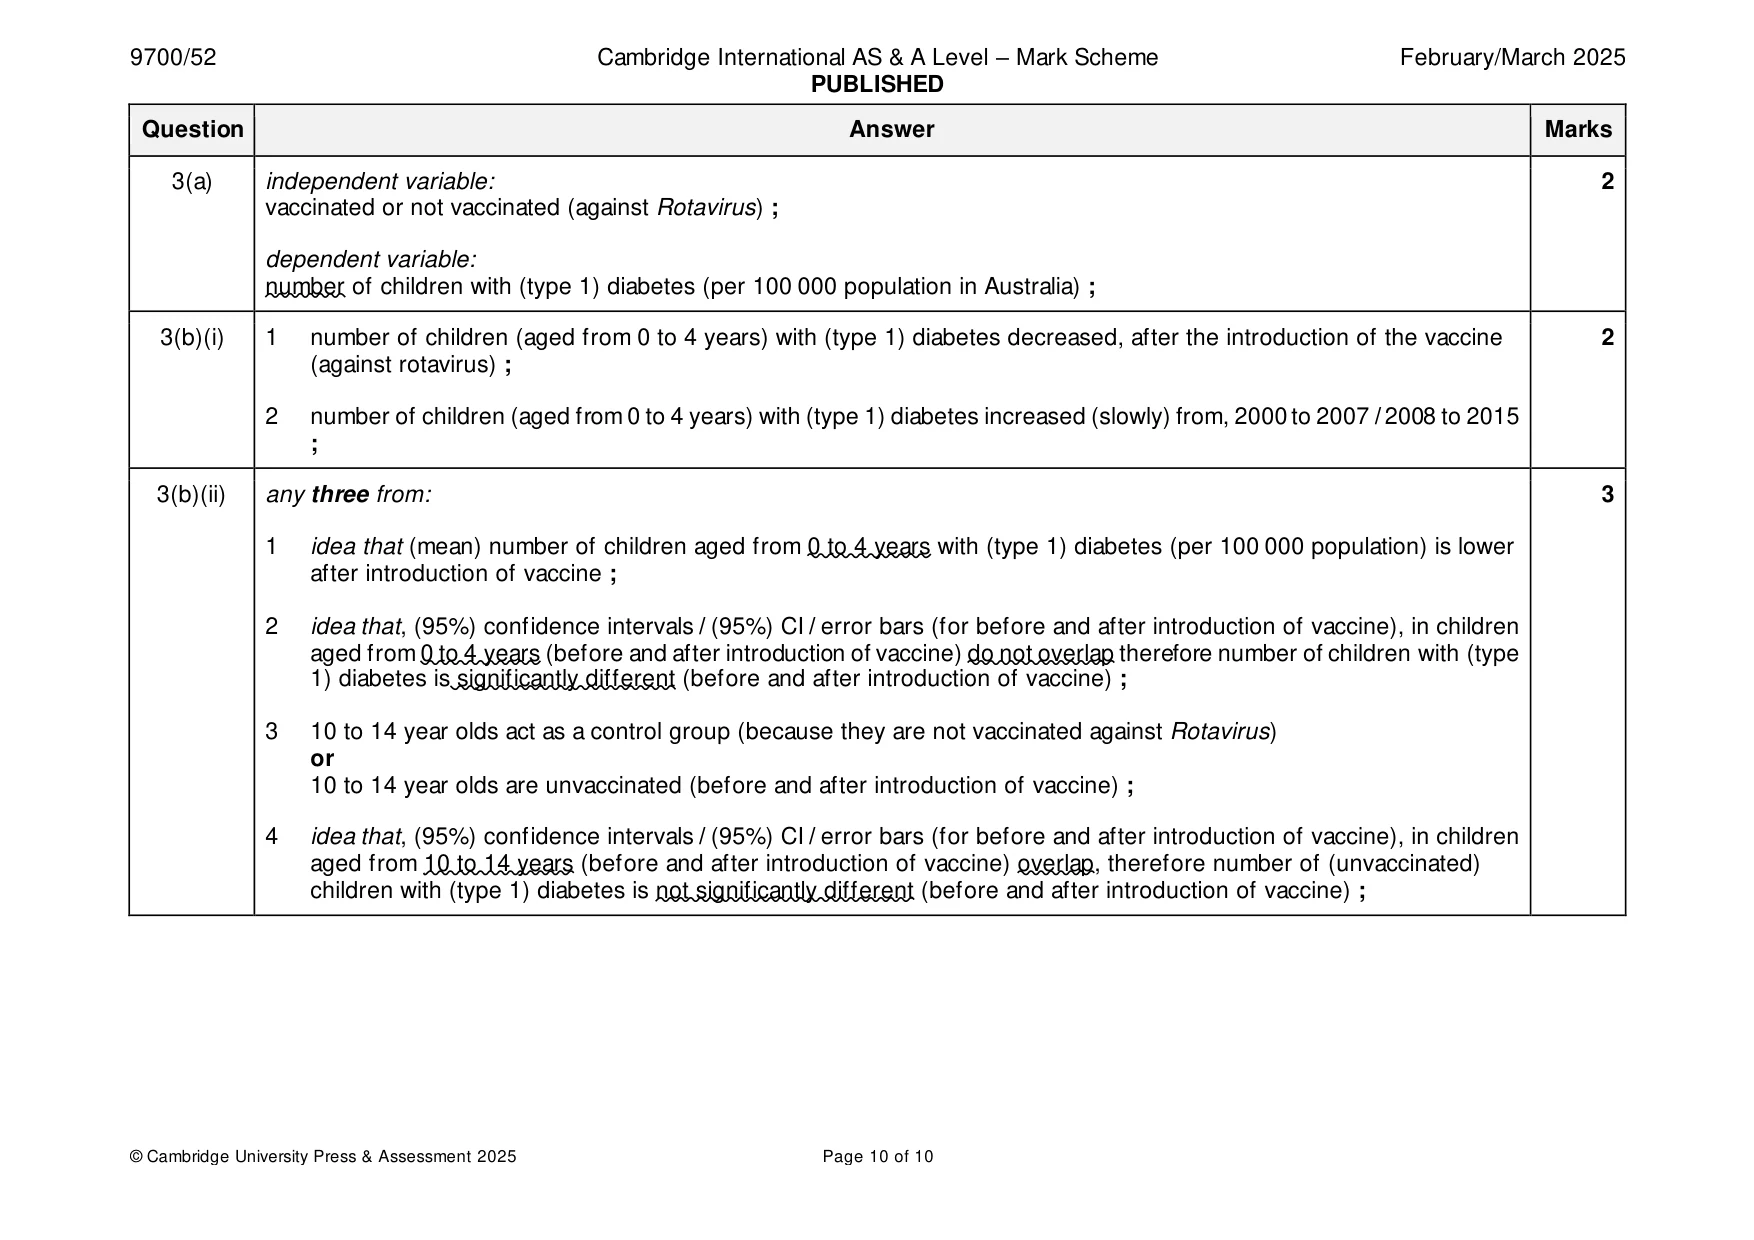
Mark scheme: 3(a) independent variable: 2 vaccinated or not vaccinated (against Rotavirus) ; dependent variable: number of children with (type 1) diabetes (per 100 000 population in Australia) ; 3(b)(i) 1 number of children (aged from 0 to 4 years) with (type 1) diabetes decreased, after the introduction of the vaccine 2 (against rotavirus) ; 2 number of children (aged from 0 to 4 years) with (type 1) diabetes increased (slowly) from, 2000 to 2007 / 2008 to 2015 ; 3(b)(ii) any three from: 3 1 idea that (mean) number of children aged from 0 to 4 years with (type 1) diabetes (per 100 000 population) is lower after introduction of vaccine ; 2 idea that, (95%) confidence intervals / (95%) CI / error bars (for before and after introduction of vaccine), in children aged from 0 to 4 years (before and after introduction of vaccine) do not overlap therefore number of children with (type 1) diabetes is significantly different (before and after introduction of vaccine) ; 3 10 to 14 year olds act as a control group (because they are not vaccinated against Rotavirus) or 10 to 14 year olds are unvaccinated (before and after introduction of vaccine) ; 4 idea that, (95%) confidence intervals / (95%) CI / error bars (for before and after introduction of vaccine), in children aged from 10 to 14 years (before and after introduction of vaccine) overlap, therefore number of (unvaccinated) children with (type 1) diabetes is not significantly different (before and after introduction of vaccine) ;
What was in this paper
The subtopics covered by these 3 questions, and how many questions each got. Open one in a new tab to see every Cambridge question on it.
What you needed in this session
Cambridge’s own grade thresholds for 2025 Feb/March, Paper 5 · Variant 2. A higher threshold means an easier paper — the bar moves with how the cohort did.