Cambridge A Level Biology 9700 — 2025 Oct/Nov Paper 5 · Variant 2
9700/52/O/N/25 · 3 questions · 30 marks · 75 min
The question paper and its mark scheme, free to read here and free to download. This is Cambridge’s own paper, exactly as it was sat.
Question paper12 pages
Mark scheme12 pages
Answers below. Sit the paper first if you are practising.
Questions as text
Q1 · The plantain lily, Hosta plantaginea, as shown in Fig
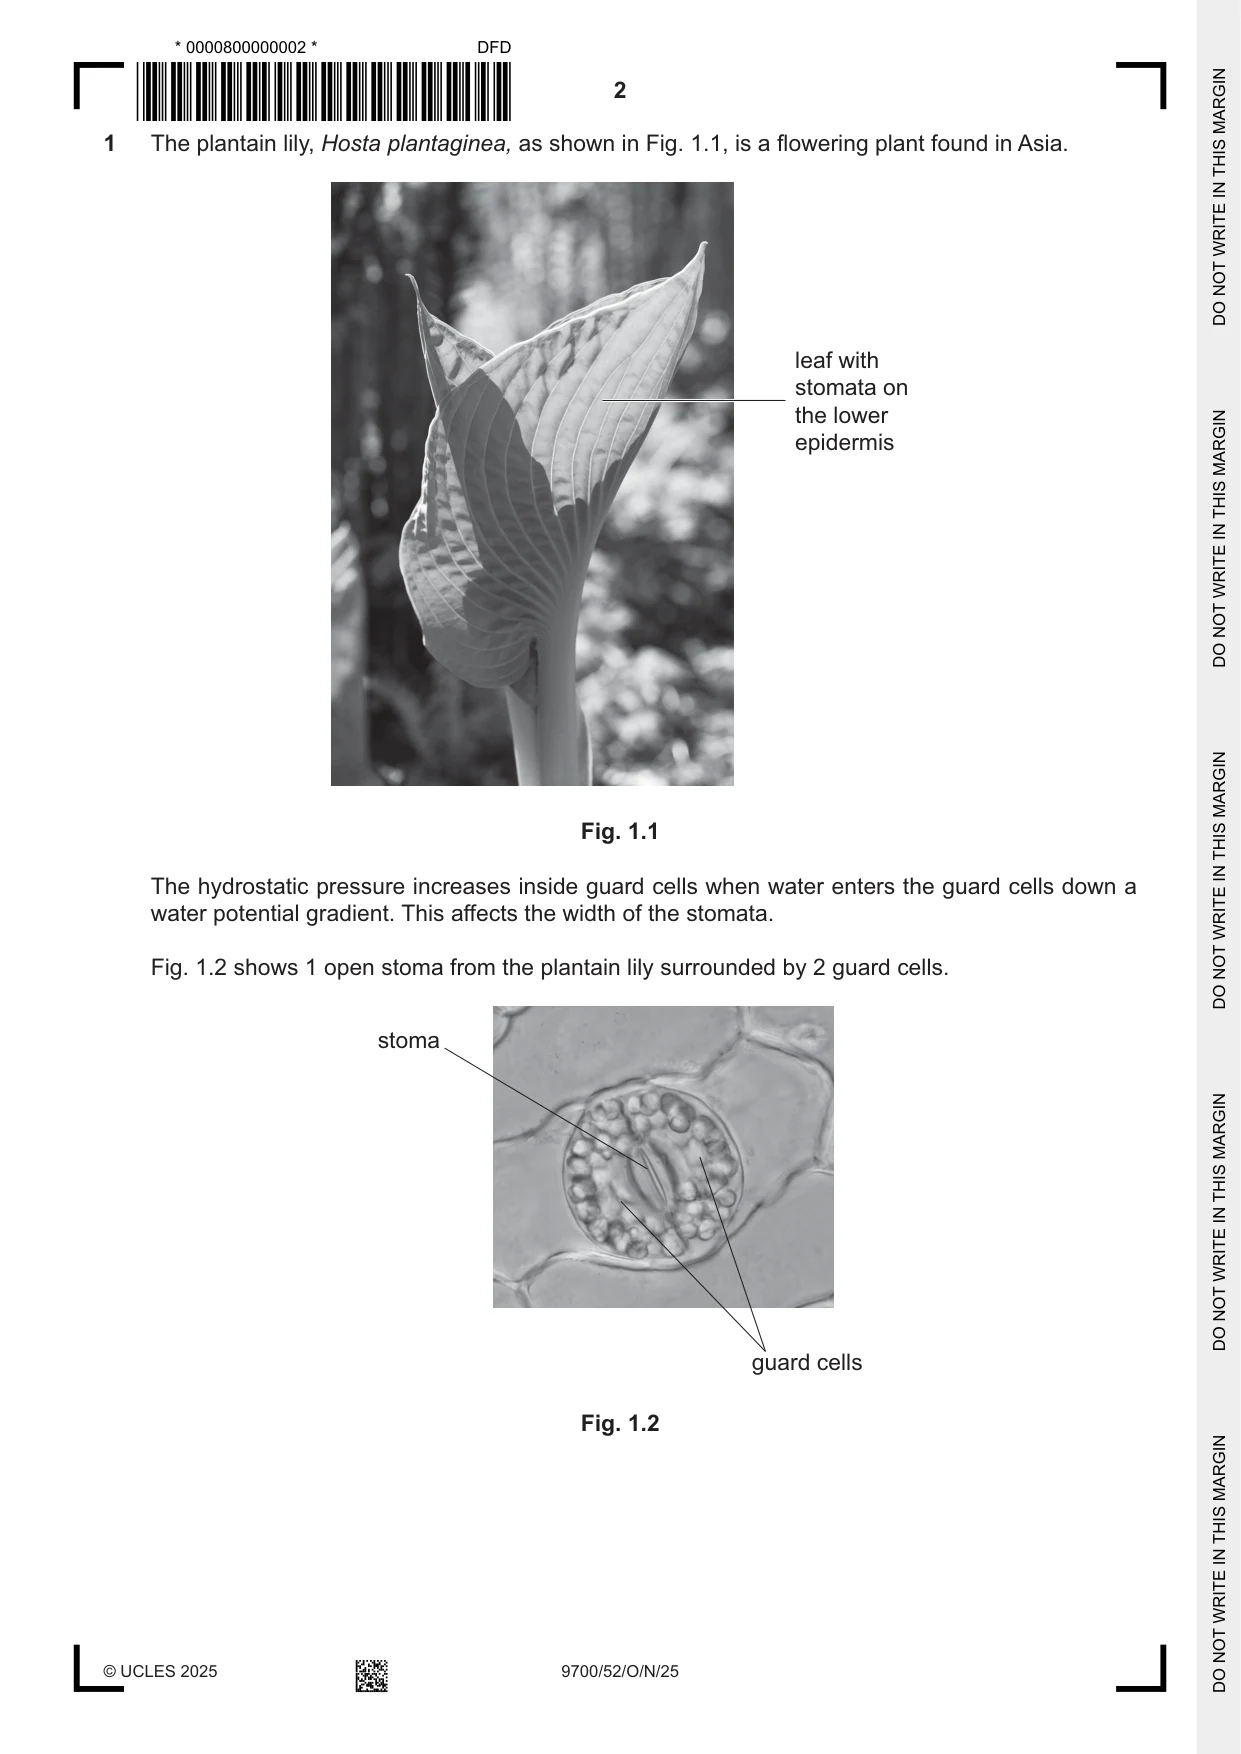
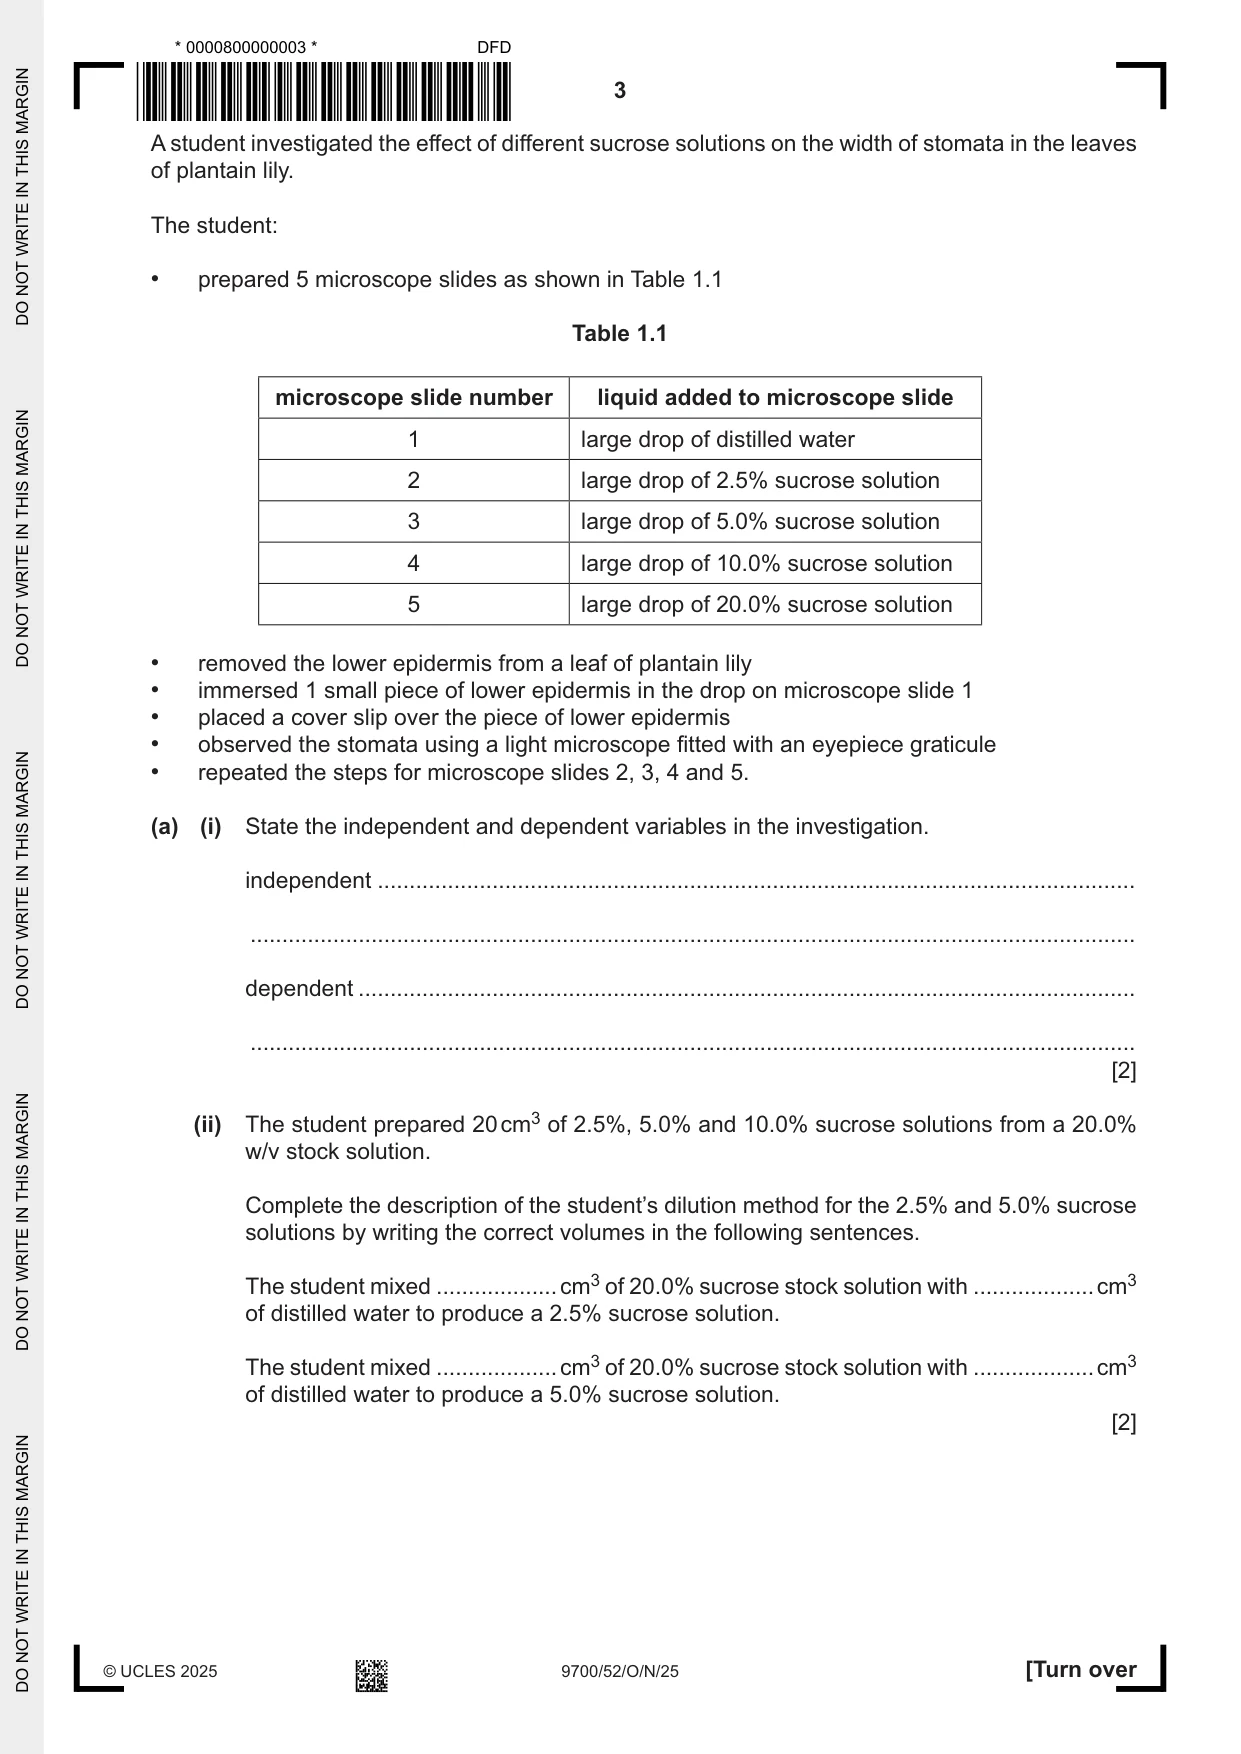
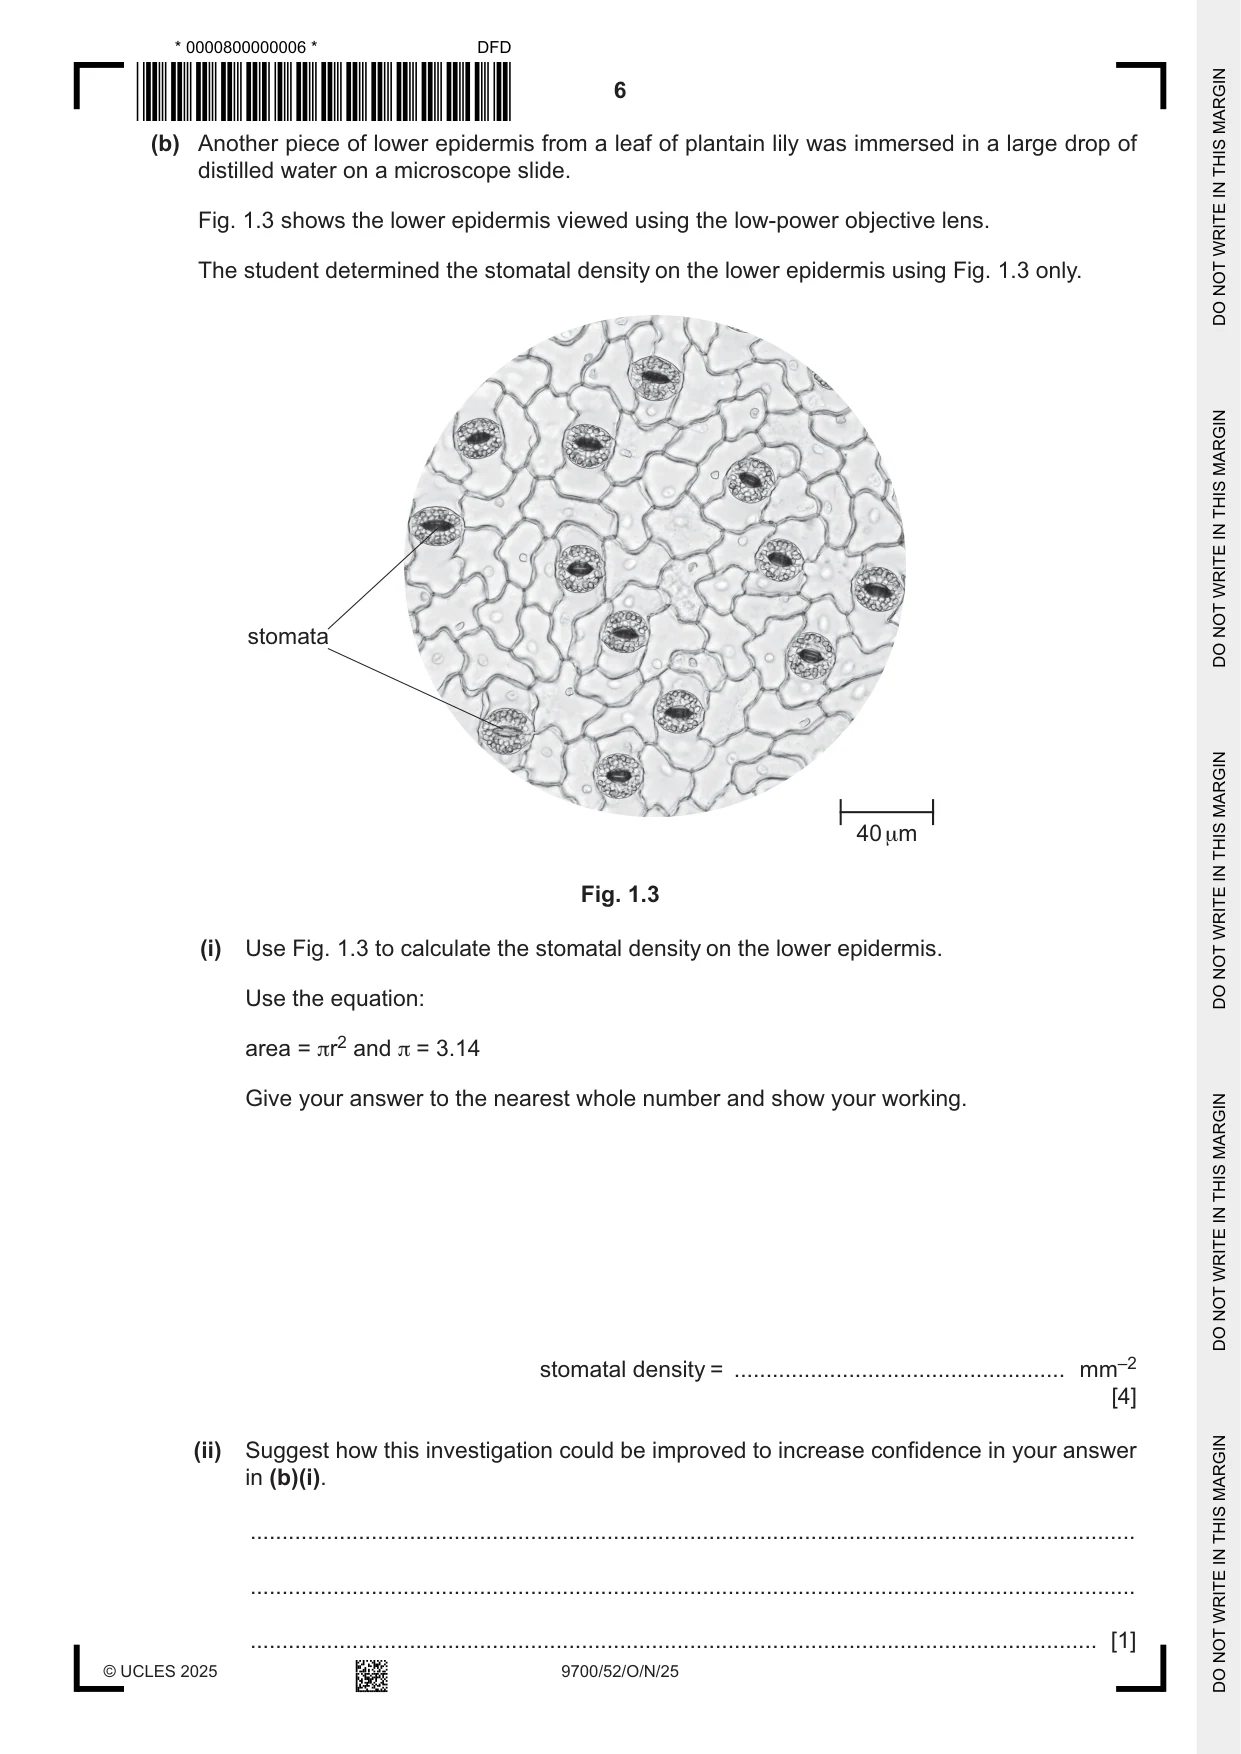
1 The plantain lily, Hosta plantaginea, as shown in Fig. 1.1, is a flowering plant found in Asia. leaf with stomata on the lower epidermis Fig. 1.1 The hydrostatic pressure increases inside guard cells when water enters the guard cells down a water potential gradient. This affects the width of the stomata. Fig. 1.2 shows 1 open stoma from the plantain lily surrounded by 2 guard cells. stoma guard cells Fig. 1.2 A student investigated the effect of different sucrose solutions on the width of stomata in the leaves of plantain lily. The student: • prepared 5 microscope slides as shown in Table 1.1 Table 1.1 microscope slide number liquid added to microscope slide 1 large drop of distilled water 2 large drop of 2.5% sucrose solution 3 large drop of 5.0% sucrose solution 4 large drop of 10.0% sucrose solution 5 large drop of 20.0% sucrose solution • removed the lower epidermis from a leaf of plantain lily • immersed 1 small piece of lower epidermis in the drop on microscope slide 1 • placed a cover slip over the piece of lower epidermis • observed the stomata using a light microscope fitted with an eyepiece graticule • repeated the steps for microscope slides 2, 3, 4 and 5. (a) (i) State the independent and dependent variables in the investigation. independent ....................................................................................................................... ........................................................................................................................................... dependent .......................................................................................................................... ........................................................................................................................................... [2] (ii) The student prepared 20 cm3 of 2.5%, 5.0% and 10.0% sucrose solutions from a 20.0% w/v stock solution. Complete the description of the student’s dilution method for the 2.5% and 5.0% sucrose solutions by writing the correct volumes in the following sentences. The student mixed ................... cm3 of 20.0% sucrose stock solution with ................... cm3 of distilled water to produce a 2.5% sucrose solution. The student mixed ................... cm3 of 20.0% sucrose stock solution with ................... cm3 of distilled water to produce a 5.0% sucrose solution. [2] (iii) The student observed stomata on the microscope slides using the high‑power objective lens. Outline a method the student could use to investigate the effect of the sucrose solutions in Table 1.1 on the width of stomata in the leaves of plantain lily. Your method should be set out in a logical order and be detailed enough to allow another person to follow it. Details of how to prepare the microscope slides should not be included. ........................................................................................................................................... ........................................................................................................................................... ........................................................................................................................................... ........................................................................................................................................... ........................................................................................................................................... ........................................................................................................................................... ........................................................................................................................................... ........................................................................................................................................... ........................................................................................................................................... ........................................................................................................................................... ........................................................................................................................................... ........................................................................................................................................... ........................................................................................................................................... ........................................................................................................................................... ........................................................................................................................................... ........................................................................................................................................... ........................................................................................................................................... ........................................................................................................................................... ........................................................................................................................................... ..................................................................................................................................... [5] (iv) Predict the effect of increasing the sucrose concentration from 0.0% to 20.0% on the width of stomata in the leaves of plantain lily. Explain your prediction. prediction ........................................................................................................................... ........................................................................................................................................... ........................................................................................................................................... explanation ........................................................................................................................ ........................................................................................................................................... ........................................................................................................................................... [2] (b) Another piece of lower epidermis from a leaf of plantain lily was immersed in a large drop of distilled water on a microscope slide. Fig. 1.3 shows the lower epidermis viewed using the low‑power objective lens. The student determined the stomatal density on the lower epidermis using Fig. 1.3 only. stomata 40 μm Fig. 1.3 (i) Use Fig. 1.3 to calculate the stomatal density on the lower epidermis. Use the equation: area = πr2 and π = 3.14 Give your answer to the nearest whole number and show your working. stomatal density = .................................................... mm–2 [4] (ii) Suggest how this investigation could be improved to increase confidence in your answer in (b)(i). ........................................................................................................................................... ........................................................................................................................................... ..................................................................................................................................... [1] (iii) A different plant species had a lower stomatal density than the value calculated for plantain lily in (b)(i). Suggest how the environmental conditions of the different plant species may vary from those of the plantain lily. Explain your answer. ........................................................................................................................................... ........................................................................................................................................... ........................................................................................................................................... ........................................................................................................................................... ........................................................................................................................................... ..................................................................................................................................... [2] [Total: 18]
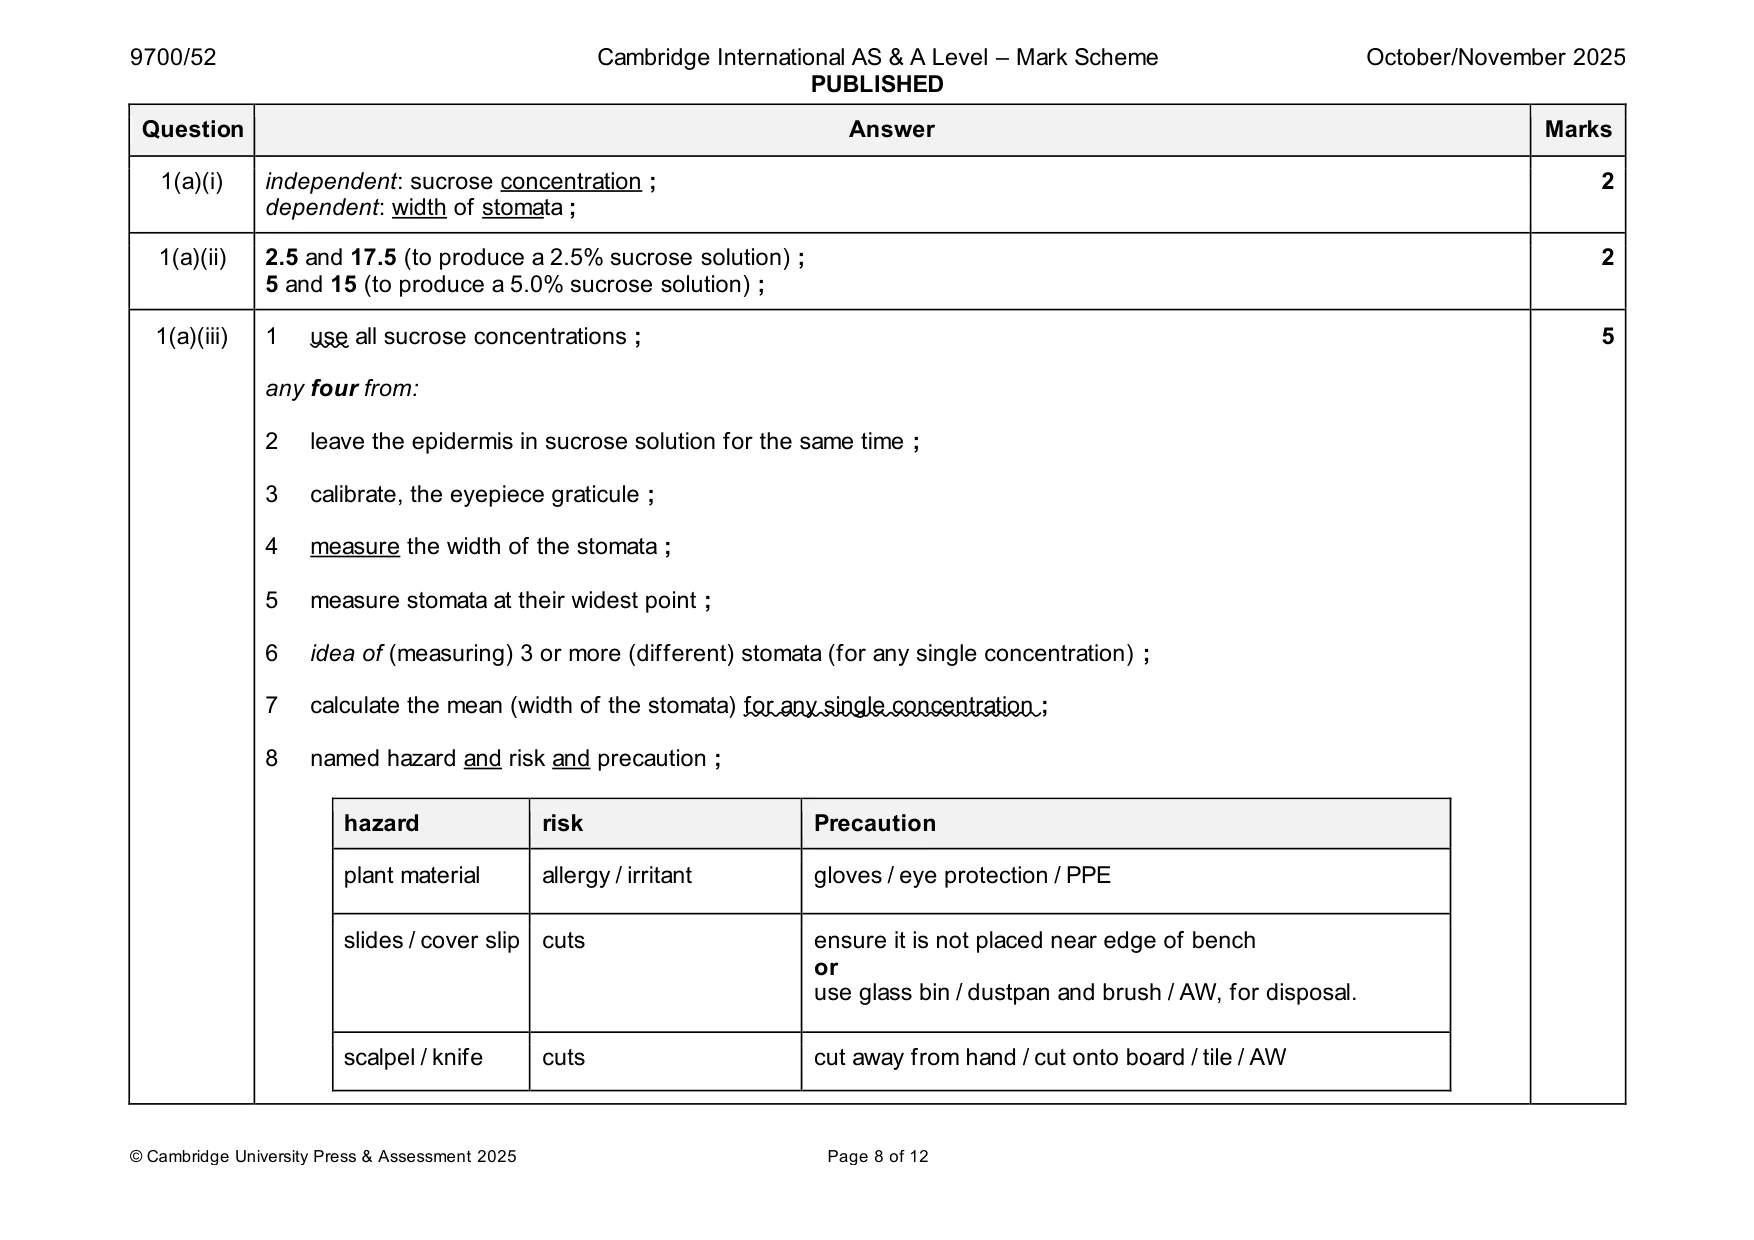
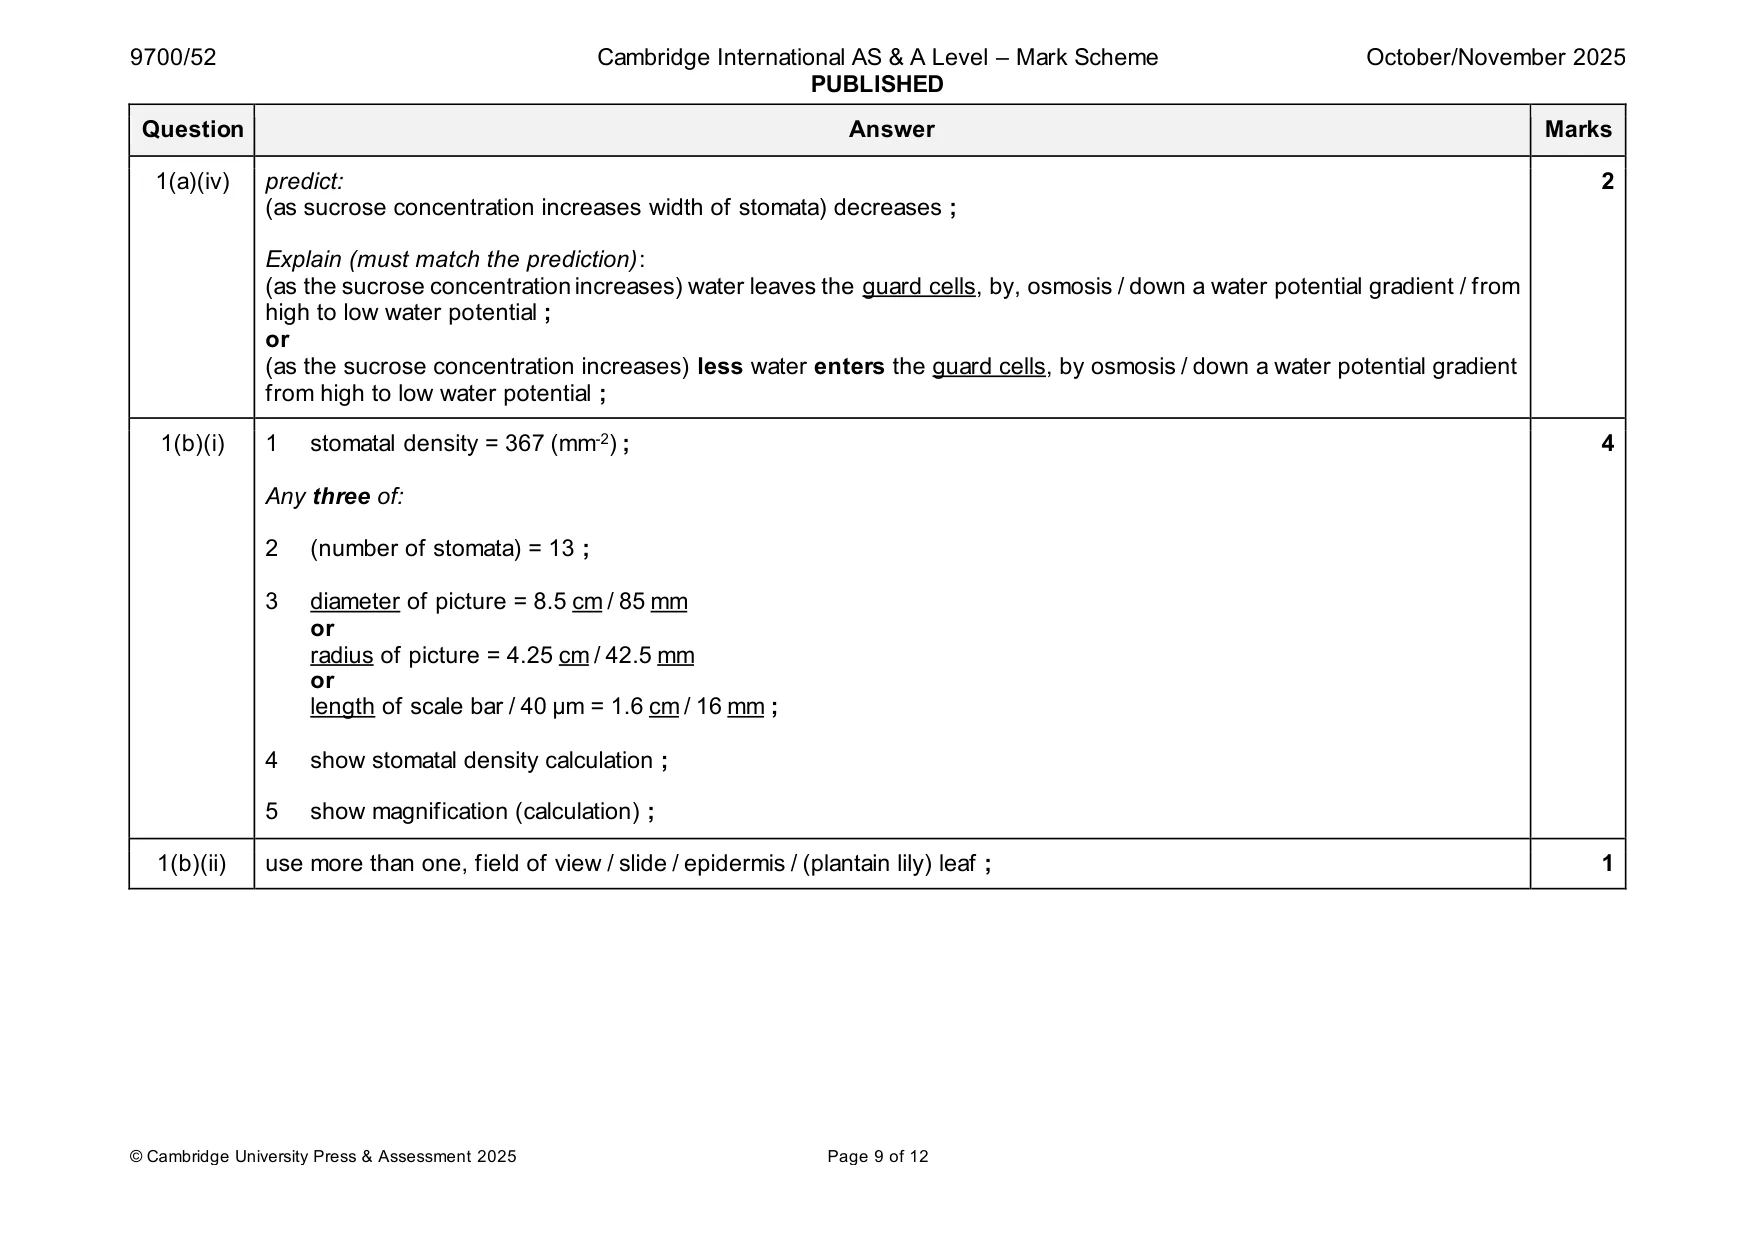
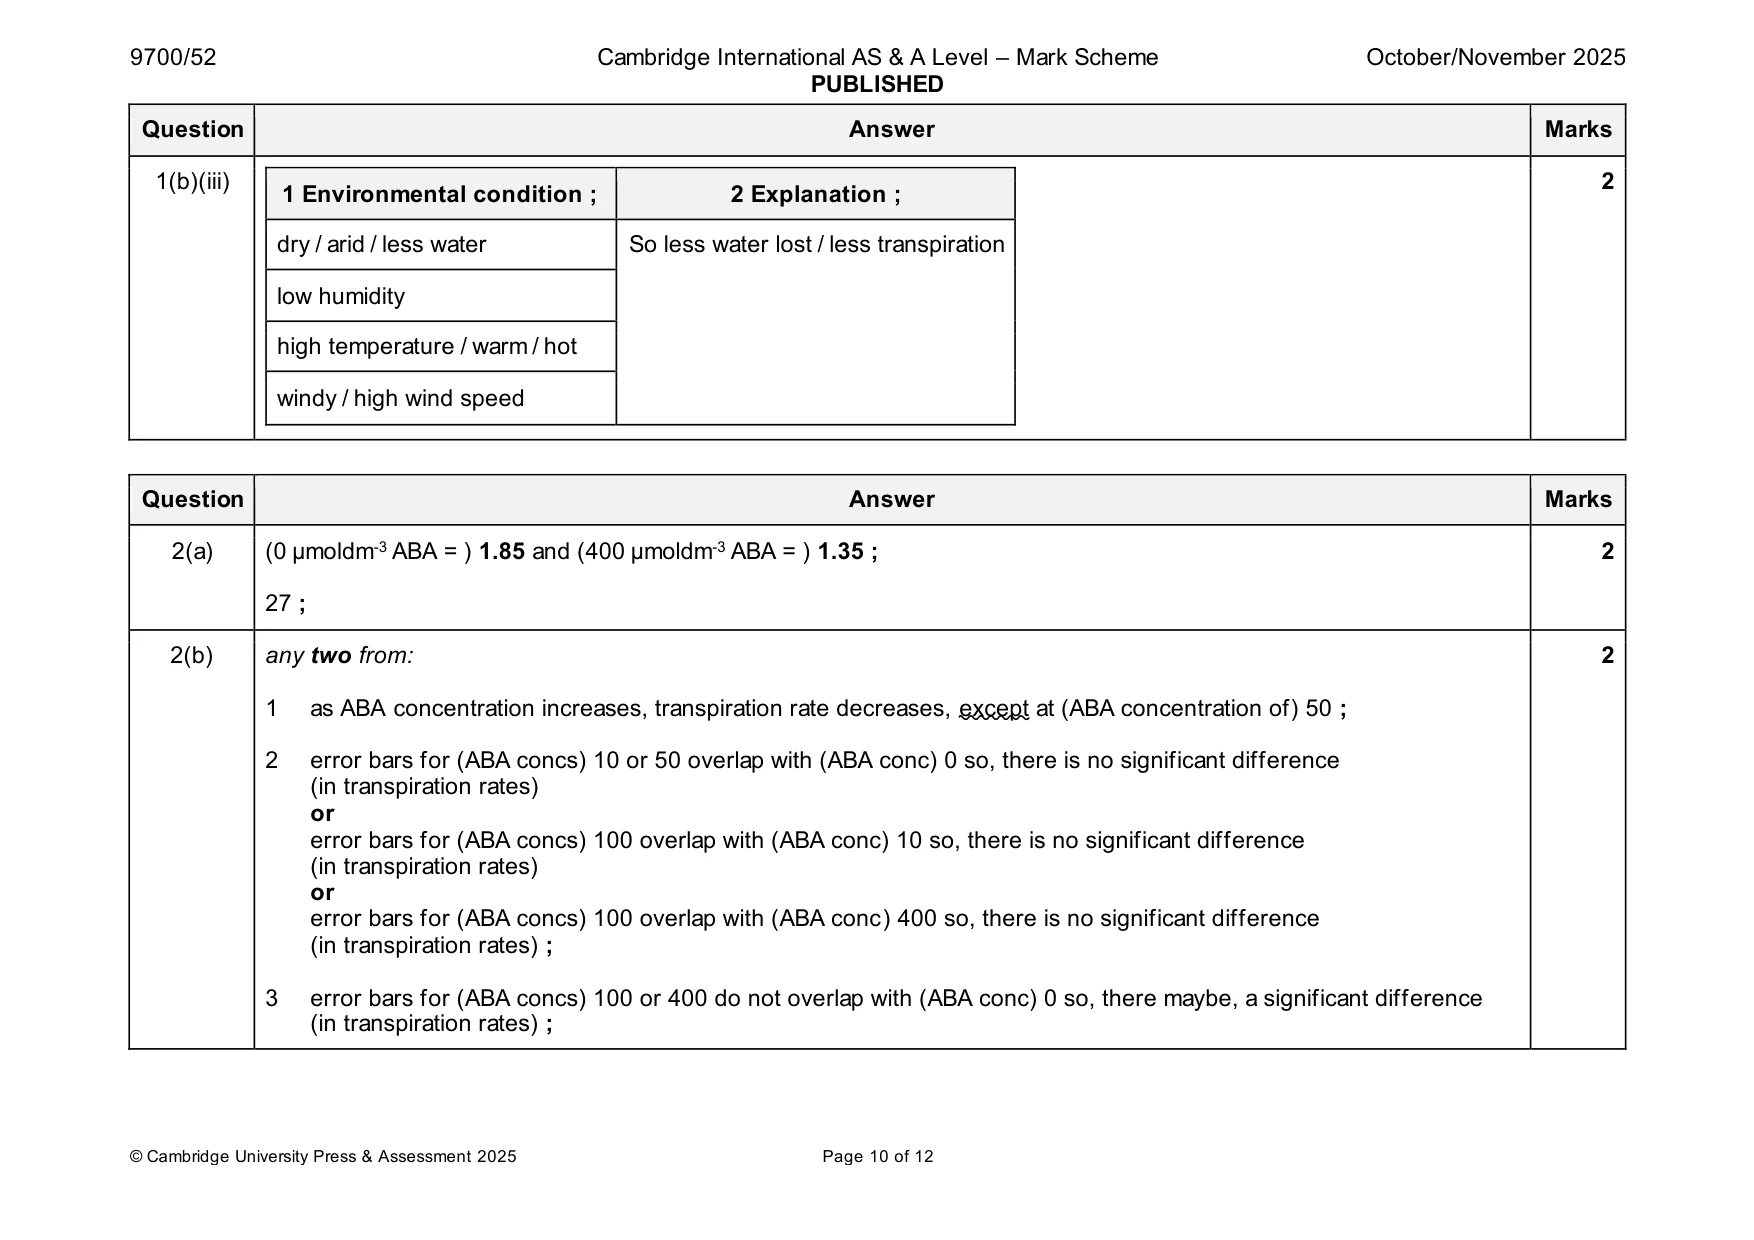
Mark scheme: Question Answer Marks 1(a)(i) independent: sucrose concentration ; 2 dependent: width of stomata ; 1(a)(ii) 2.5 and 17.5 (to produce a 2.5% sucrose solution) ; 2 5 and 15 (to produce a 5.0% sucrose solution) ; 1(a)(iii) 1 use all sucrose concentrations ; 5 any four from: 2 leave the epidermis in sucrose solution for the same time ; 3 calibrate, the eyepiece graticule ; 4 measure the width of the stomata ; 5 measure stomata at their widest point ; 6 idea of (measuring) 3 or more (different) stomata (for any single concentration) ; 7 calculate the mean (width of the stomata) for any single concentration ; 8 named hazard and risk and precaution ; hazard risk Precaution plant material allergy / irritant gloves / eye protection / PPE slides / cover slip cuts ensure it is not placed near edge of bench or use glass bin / dustpan and brush / AW, for disposal. scalpel / knife cuts cut away from hand / cut onto board / tile / AW 1(a)(iv) predict: 2 (as sucrose concentration increases width of stomata) decreases ; Explain (must match the prediction): (as the sucrose concentration increases) water leaves the guard cells, by, osmosis / down a water potential gradient / from high to low water potential ; or (as the sucrose concentration increases) less water enters the guard cells, by osmosis / down a water potential gradient from high to low water potential ; 1(b)(i) 1 stomatal density = 367 (mm-2) ; 4 Any three of: 2 (number of stomata) = 13 ; 3 diameter of picture = 8.5 cm / 85 mm or radius of picture = 4.25 cm / 42.5 mm or length of scale bar / 40 µm = 1.6 cm / 16 mm ; 4 show stomatal density calculation ; 5 show magnification (calculation) ; 1(b)(ii) use more than one, field of view / slide / epidermis / (plantain lily) leaf ; 1 1(b)(iii) 2 1 Environmental condition ; 2 Explanation ; dry / arid / less water So less water lost / less transpiration low humidity high temperature / warm / hot windy / high wind speed
Q2 · Scientists investigated the effect of abscisic acid (ABA) on reducing water loss in plants
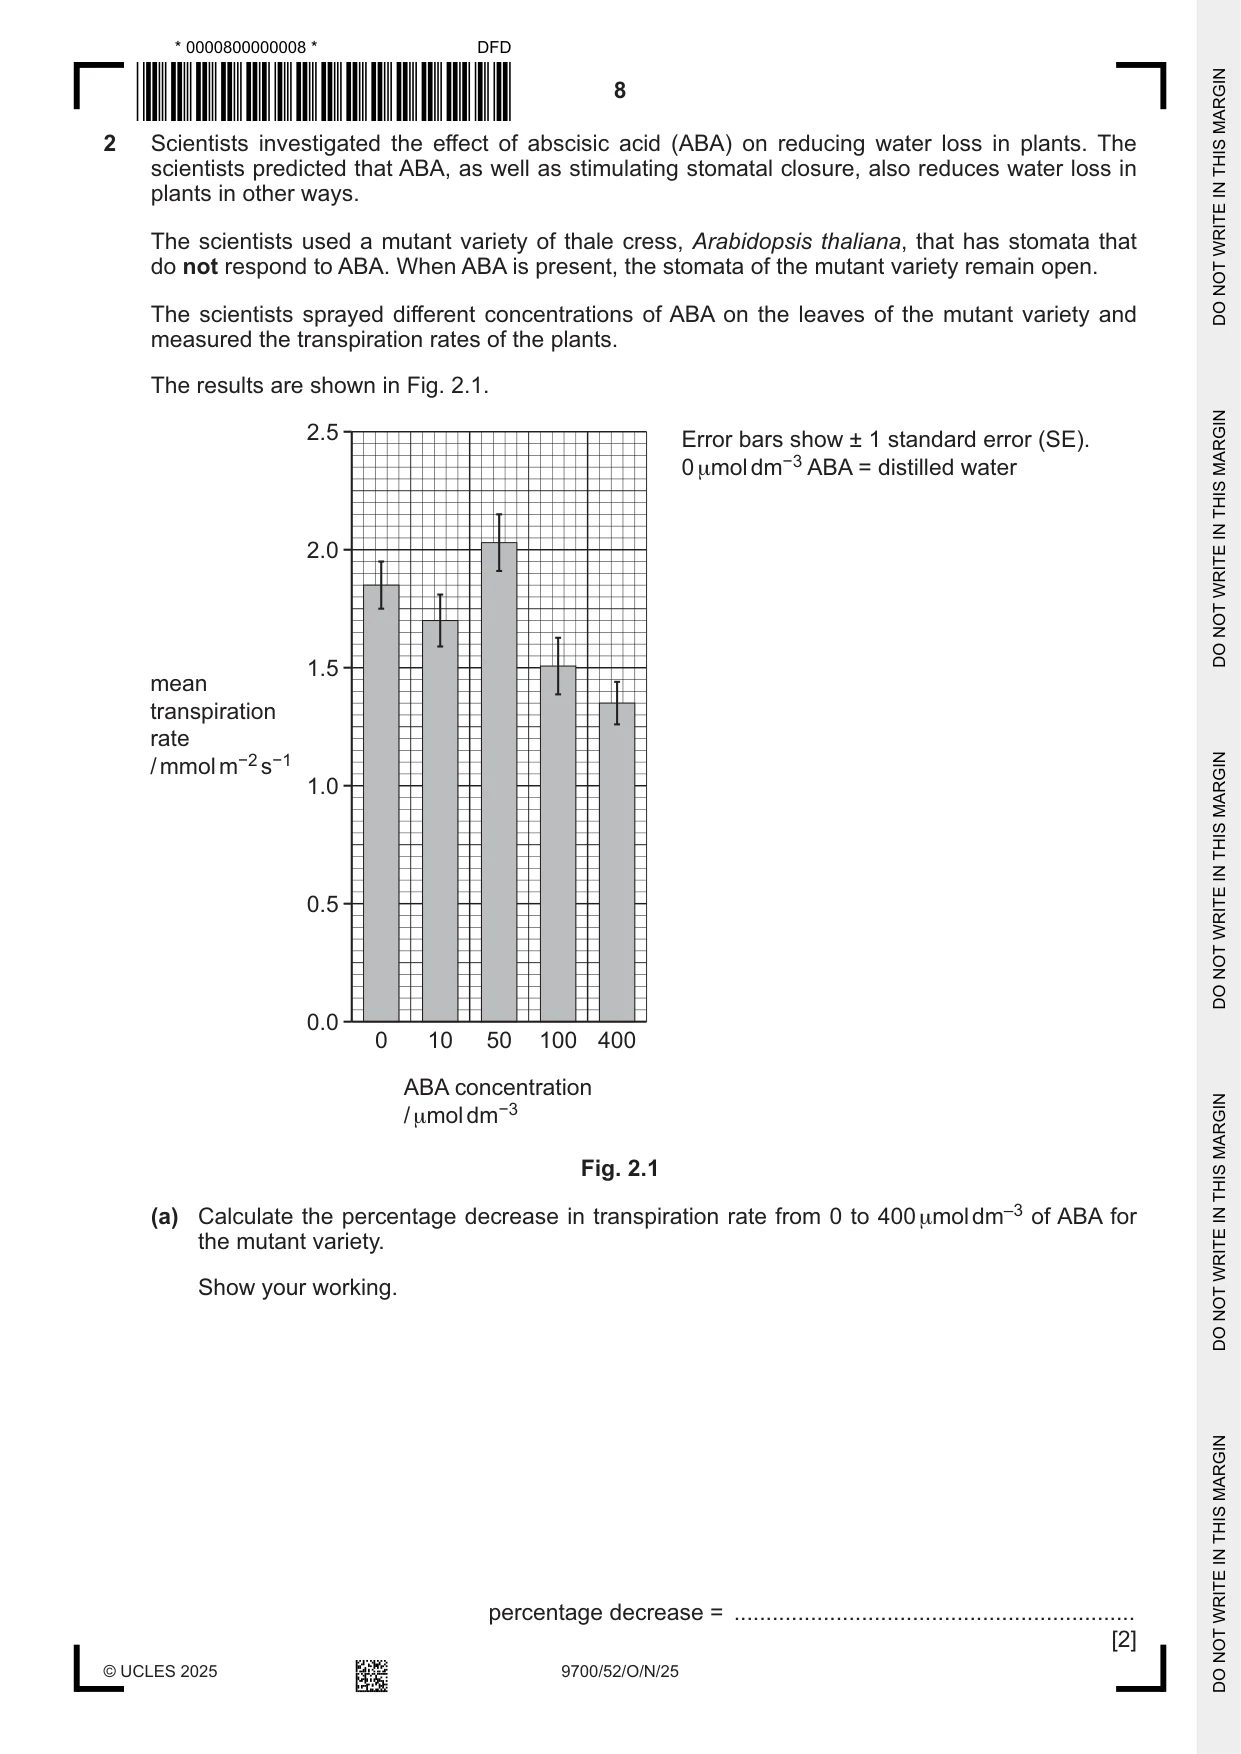
2 Scientists investigated the effect of abscisic acid (ABA) on reducing water loss in plants. The scientists predicted that ABA, as well as stimulating stomatal closure, also reduces water loss in plants in other ways. The scientists used a mutant variety of thale cress, Arabidopsis thaliana, that has stomata that do not respond to ABA. When ABA is present, the stomata of the mutant variety remain open. The scientists sprayed different concentrations of ABA on the leaves of the mutant variety and measured the transpiration rates of the plants. The results are shown in Fig. 2.1. 2.5 Error bars show ± 1 standard error (SE). 0 μmol dm−3 ABA = distilled water 2.0 1.5 mean transpiration rate / mmol m−2 s−1 1.0 0.5 0.0 0 10 50 100 400 ABA concentration / μmol dm−3 Fig. 2.1 (a) Calculate the percentage decrease in transpiration rate from 0 to 400 µmol dm–3 of ABA for the mutant variety. Show your working. percentage decrease = ............................................................... [2] (b) With reference to Fig. 2.1, suggest conclusions that can be made about the effect of different concentrations of ABA on the transpiration rates of the mutant variety. State the evidence that supports your conclusions. ................................................................................................................................................... ................................................................................................................................................... ................................................................................................................................................... ................................................................................................................................................... ................................................................................................................................................... ............................................................................................................................................. [2] (c) The scientists used a mutant variety of thale cress that has stomata that do not respond to ABA. The scientists concluded that ABA reduces water loss in thale cress by ways other than stomatal closure. Suggest additional information that is required to increase the confidence in this conclusion. ................................................................................................................................................... ................................................................................................................................................... ................................................................................................................................................... ................................................................................................................................................... ................................................................................................................................................... ................................................................................................................................................... ............................................................................................................................................. [3] [Total: 7]
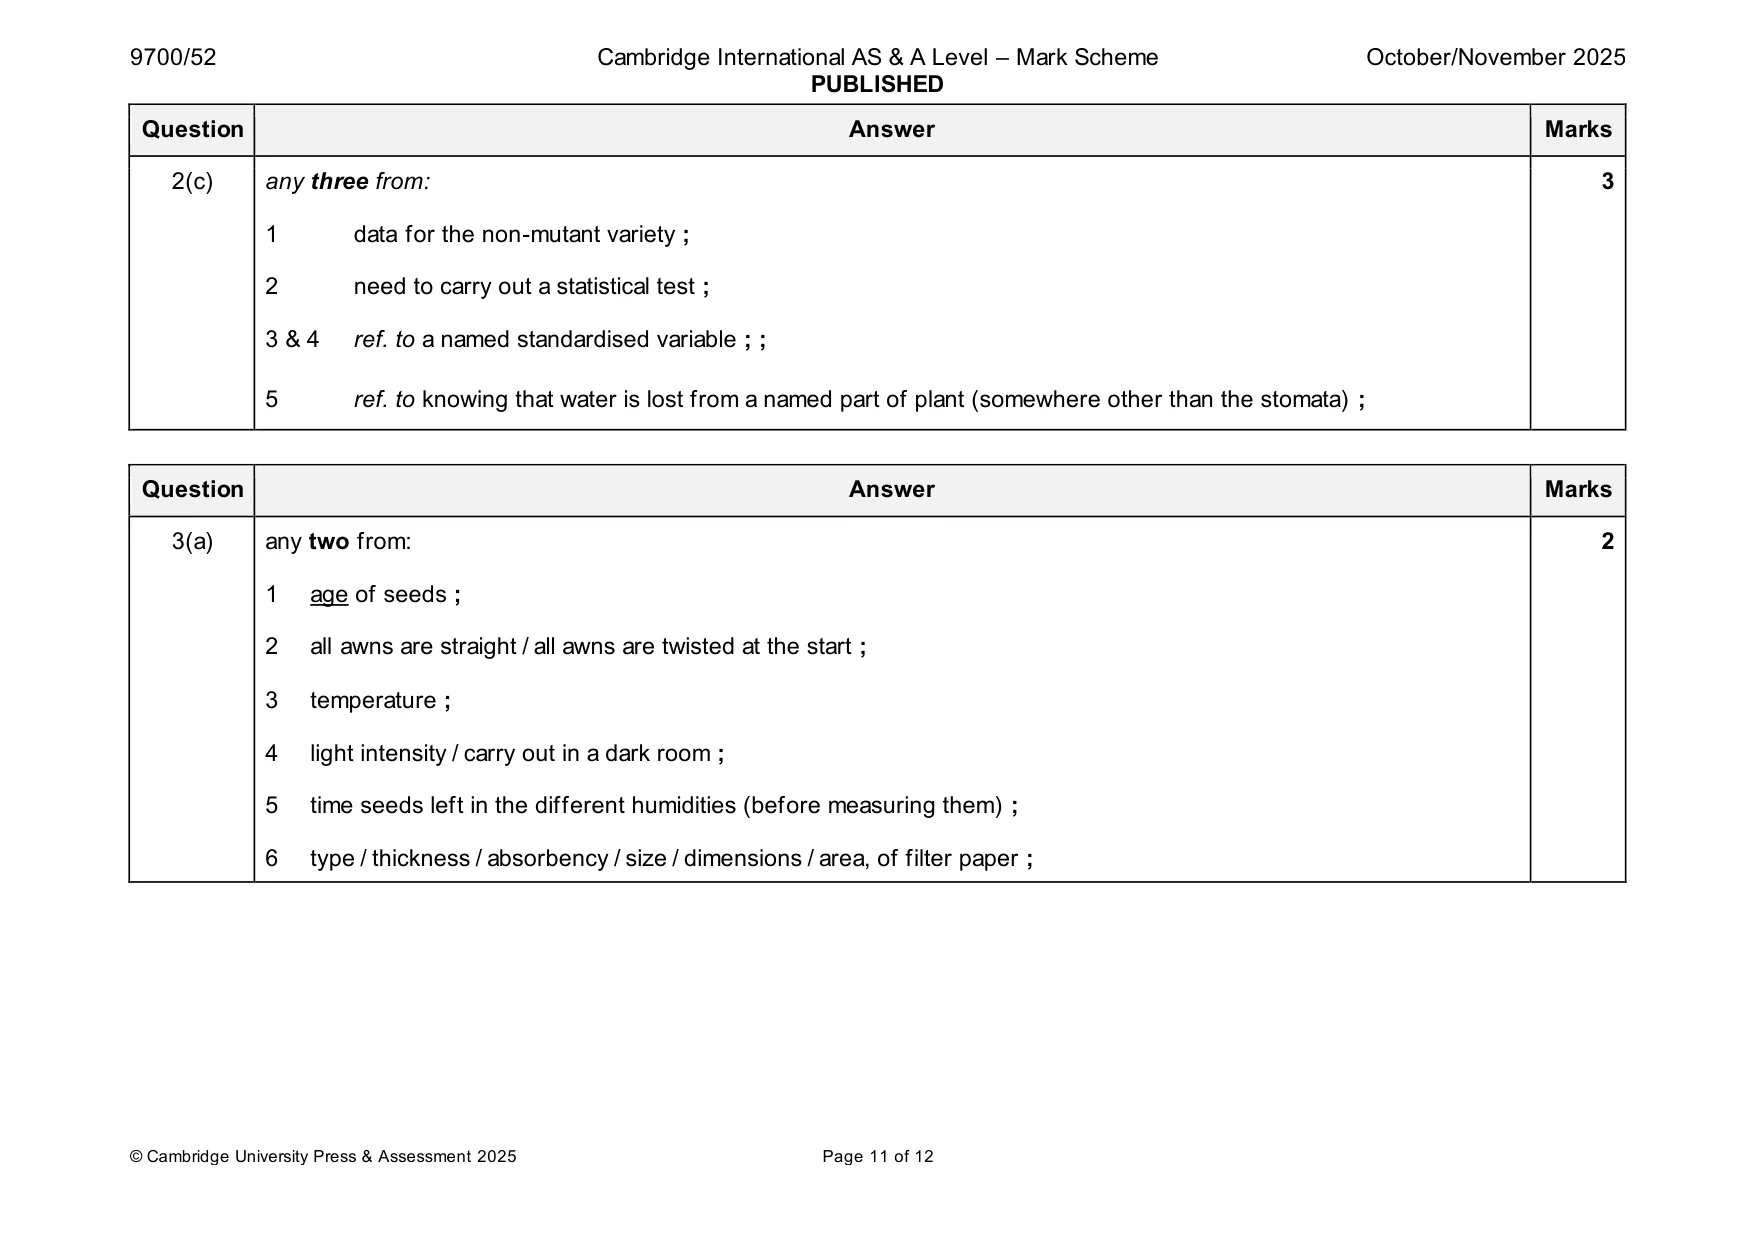
Mark scheme: 2(a) (0 µmoldm-3 ABA = ) 1.85 and (400 µmoldm-3 ABA = ) 1.35 ; 2 27 ; 2(b) any two from: 2 1 as ABA concentration increases, transpiration rate decreases, except at (ABA concentration of) 50 ; 2 error bars for (ABA concs) 10 or 50 overlap with (ABA conc) 0 so, there is no significant difference (in transpiration rates) or error bars for (ABA concs) 100 overlap with (ABA conc) 10 so, there is no significant difference (in transpiration rates) or error bars for (ABA concs) 100 overlap with (ABA conc) 400 so, there is no significant difference (in transpiration rates) ; 3 error bars for (ABA concs) 100 or 400 do not overlap with (ABA conc) 0 so, there maybe, a significant difference (in transpiration rates) ; 2(c) any three from: 3 1 data for the non-mutant variety ; 2 need to carry out a statistical test ; 3 & 4 ref. to a named standardised variable ; ; 5 ref. to knowing that water is lost from a named part of plant (somewhere other than the stomata) ;
Q3 · Seeds of the common stork’s‑bill, Erodium cicutarium, are shown in Fig
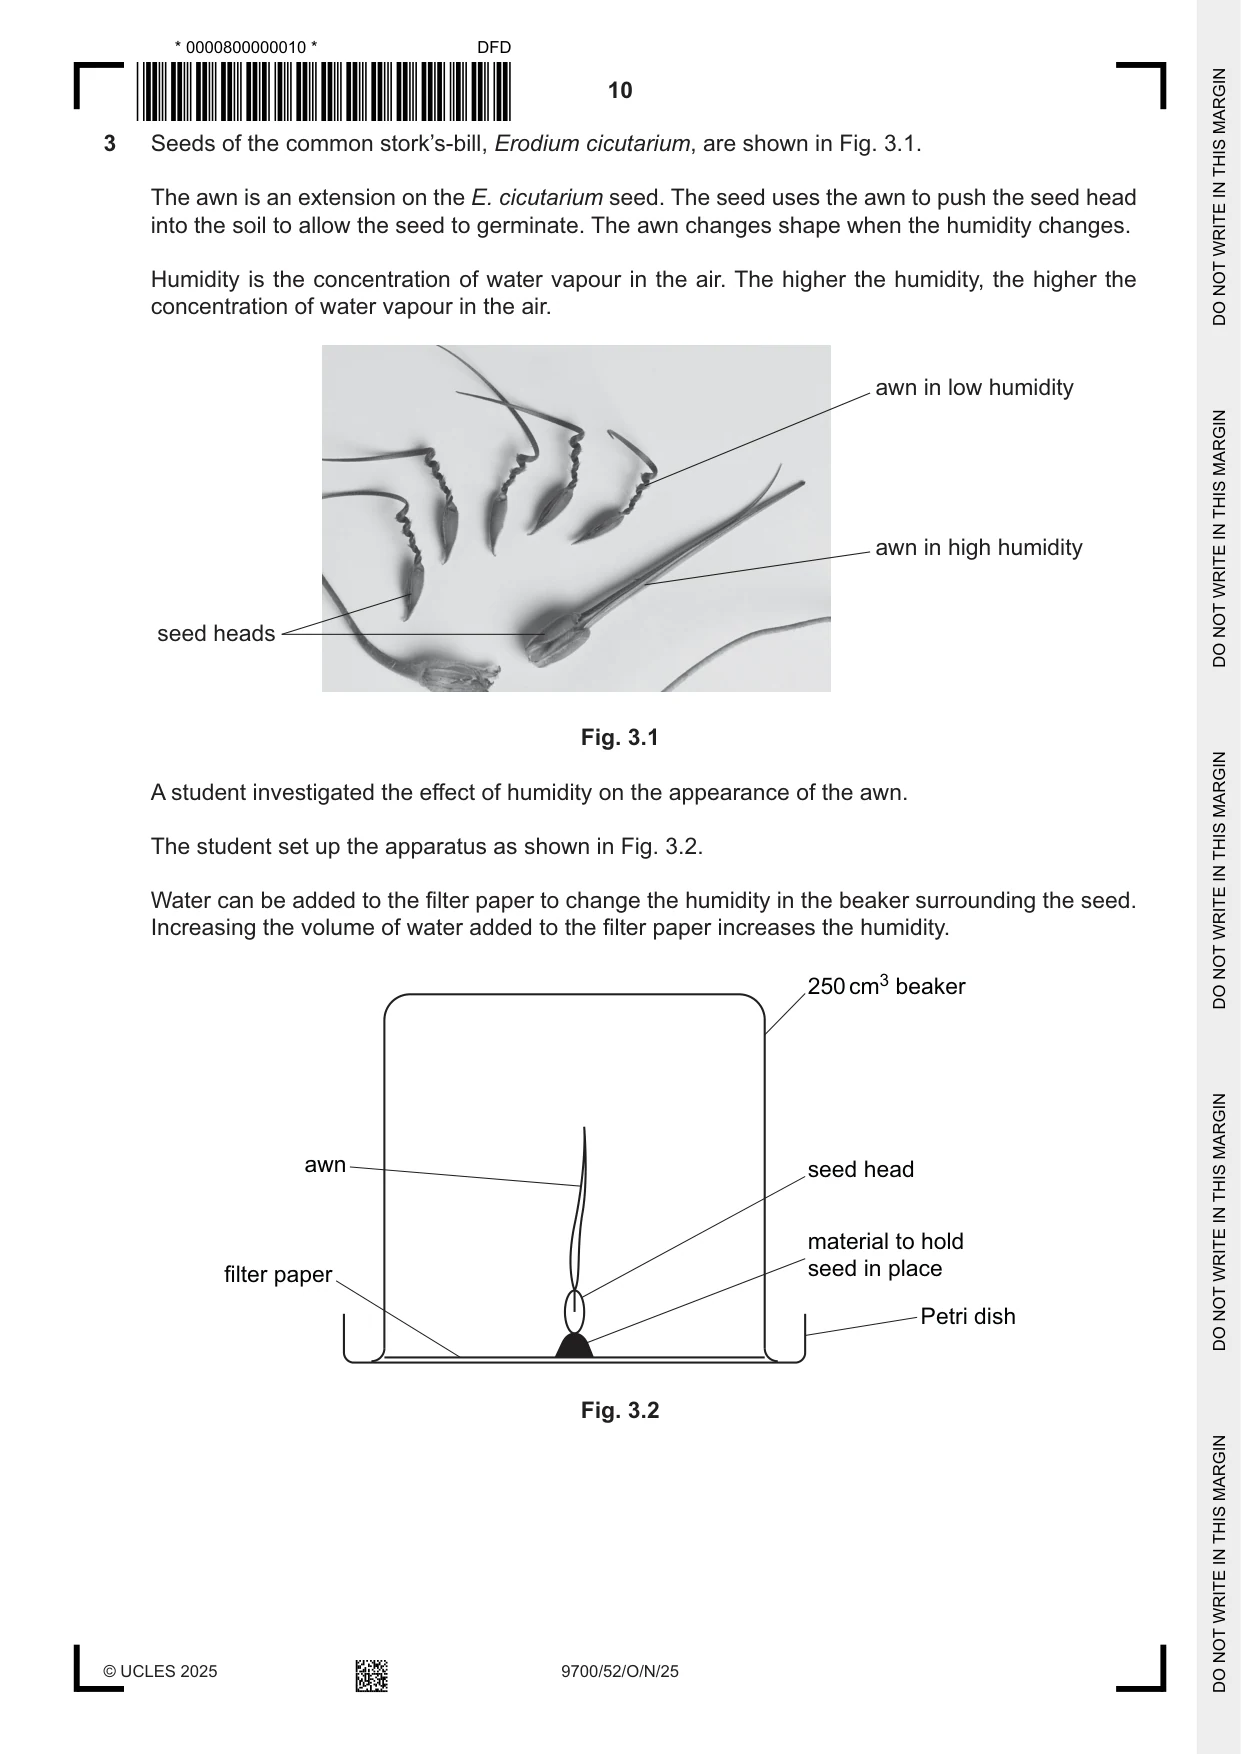
3 Seeds of the common stork’s‑bill, Erodium cicutarium, are shown in Fig. 3.1. The awn is an extension on the E. cicutarium seed. The seed uses the awn to push the seed head into the soil to allow the seed to germinate. The awn changes shape when the humidity changes. Humidity is the concentration of water vapour in the air. The higher the humidity, the higher the concentration of water vapour in the air. awn in low humidity awn in high humidity seed heads Fig. 3.1 A student investigated the effect of humidity on the appearance of the awn. The student set up the apparatus as shown in Fig. 3.2. Water can be added to the filter paper to change the humidity in the beaker surrounding the seed. Increasing the volume of water added to the filter paper increases the humidity. 250 cm3 beaker awn seed head material to hold seed in place filter paper Petri dish Fig. 3.2 (a) State two variables the student would need to standardise for the investigation using the apparatus shown in Fig. 3.2. ................................................................................................................................................... ................................................................................................................................................... ................................................................................................................................................... ................................................................................................................................................... ............................................................................................................................................. [2] (b) Outline a method the student could use to measure the effect of different levels of humidity on the appearance of the awn, using the apparatus in Fig. 3.2. Do not include standardised variables from (a) or a risk assessment. ................................................................................................................................................... ................................................................................................................................................... ................................................................................................................................................... ................................................................................................................................................... ................................................................................................................................................... ................................................................................................................................................... ............................................................................................................................................. [3] [Total: 5]
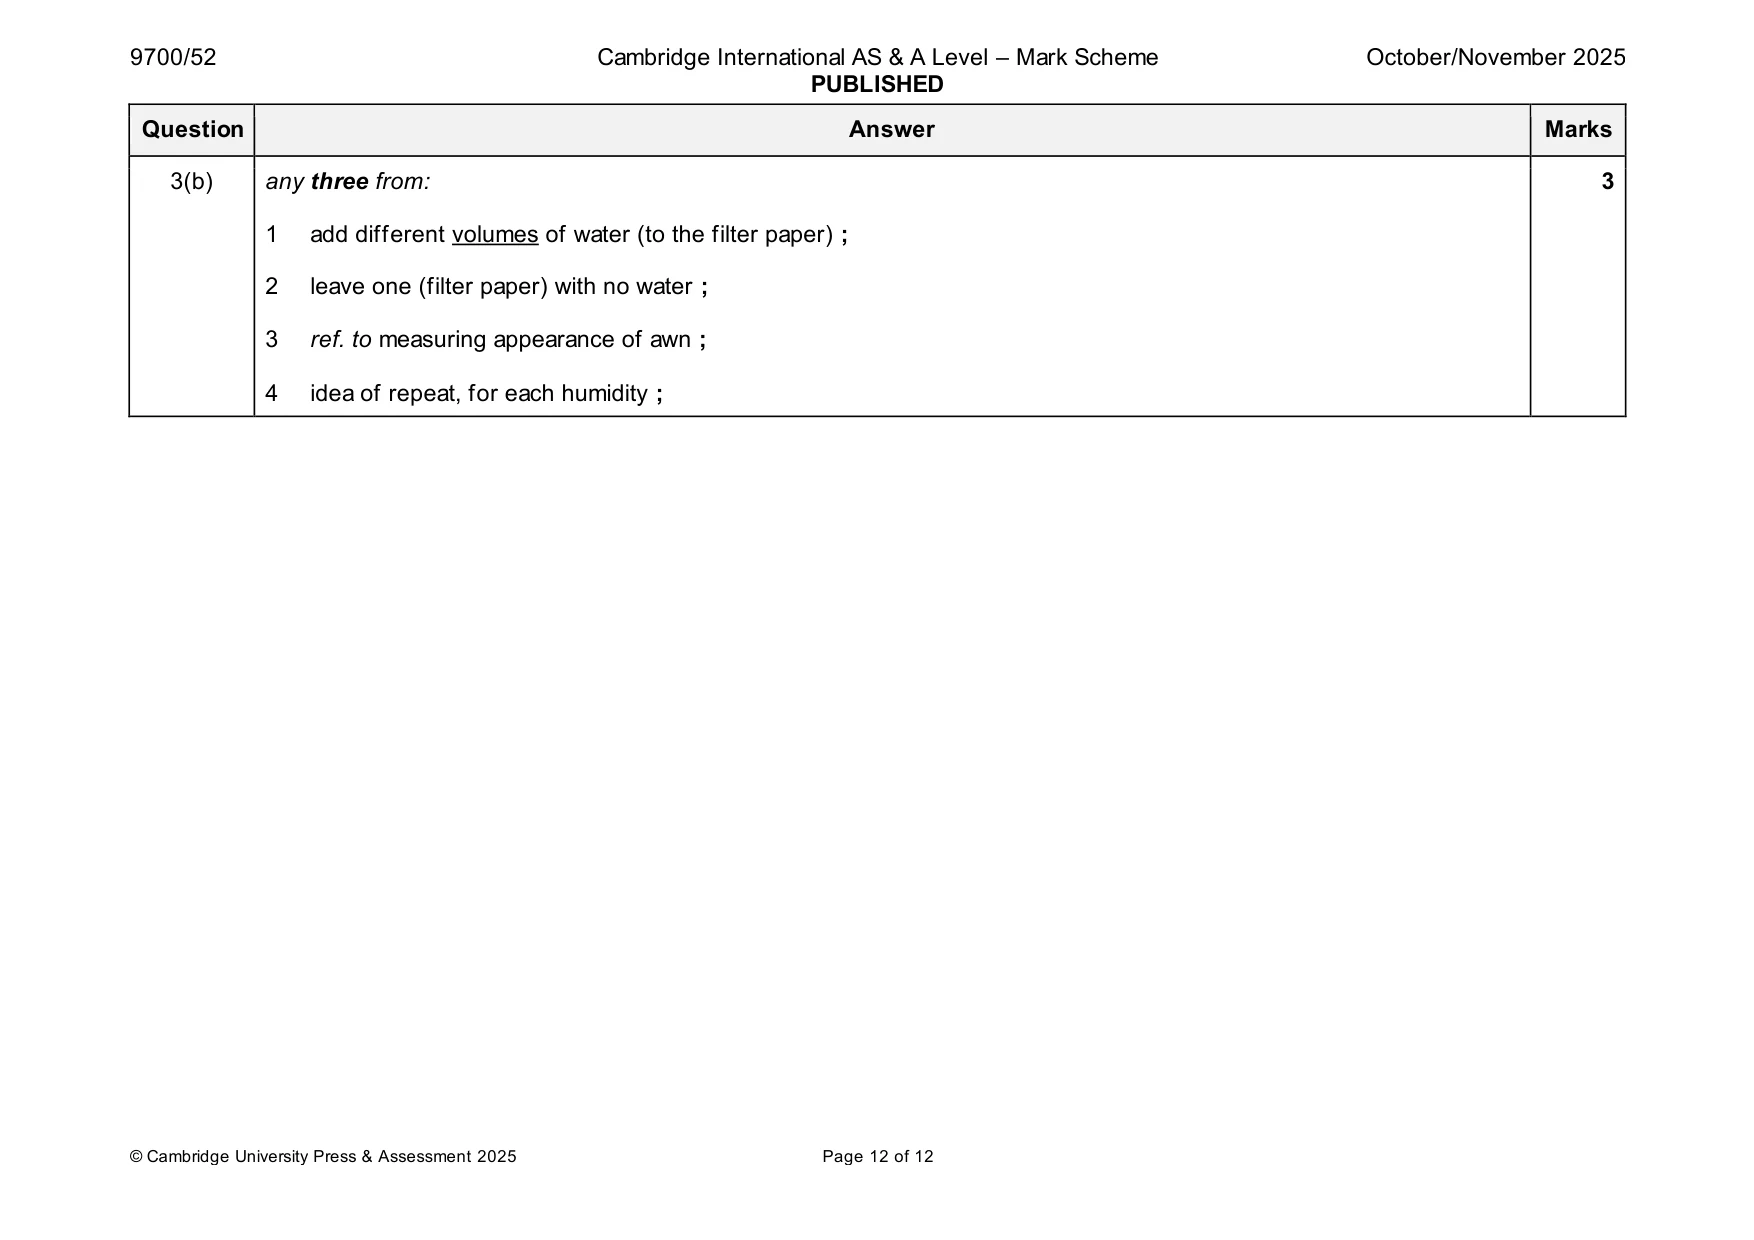
Mark scheme: 3(a) any two from: 2 1 age of seeds ; 2 all awns are straight / all awns are twisted at the start ; 3 temperature ; 4 light intensity / carry out in a dark room ; 5 time seeds left in the different humidities (before measuring them) ; 6 type / thickness / absorbency / size / dimensions / area, of filter paper ; 3(b) any three from: 3 1 add different volumes of water (to the filter paper) ; 2 leave one (filter paper) with no water ; 3 ref. to measuring appearance of awn ; 4 idea of repeat, for each humidity ;
What was in this paper
The subtopics covered by these 3 questions, and how many questions each got. Open one in a new tab to see every Cambridge question on it.
What you needed in this session
Cambridge’s own grade thresholds for 2025 Oct/Nov, Paper 5 · Variant 2. A higher threshold means an easier paper — the bar moves with how the cohort did.