Cambridge A Level Biology 9700 — 2025 May/June Paper 5 · Variant 4
9700/54/M/J/25 · 2 questions · 30 marks · 75 min
The question paper and its mark scheme, free to read here and free to download. This is Cambridge’s own paper, exactly as it was sat.
Question paper8 pages
Mark scheme14 pages
Answers below. Sit the paper first if you are practising.
Questions as text
Q1 · A student investigated the effect of gibberellin (GA) and abscisic acid (ABA) on the…
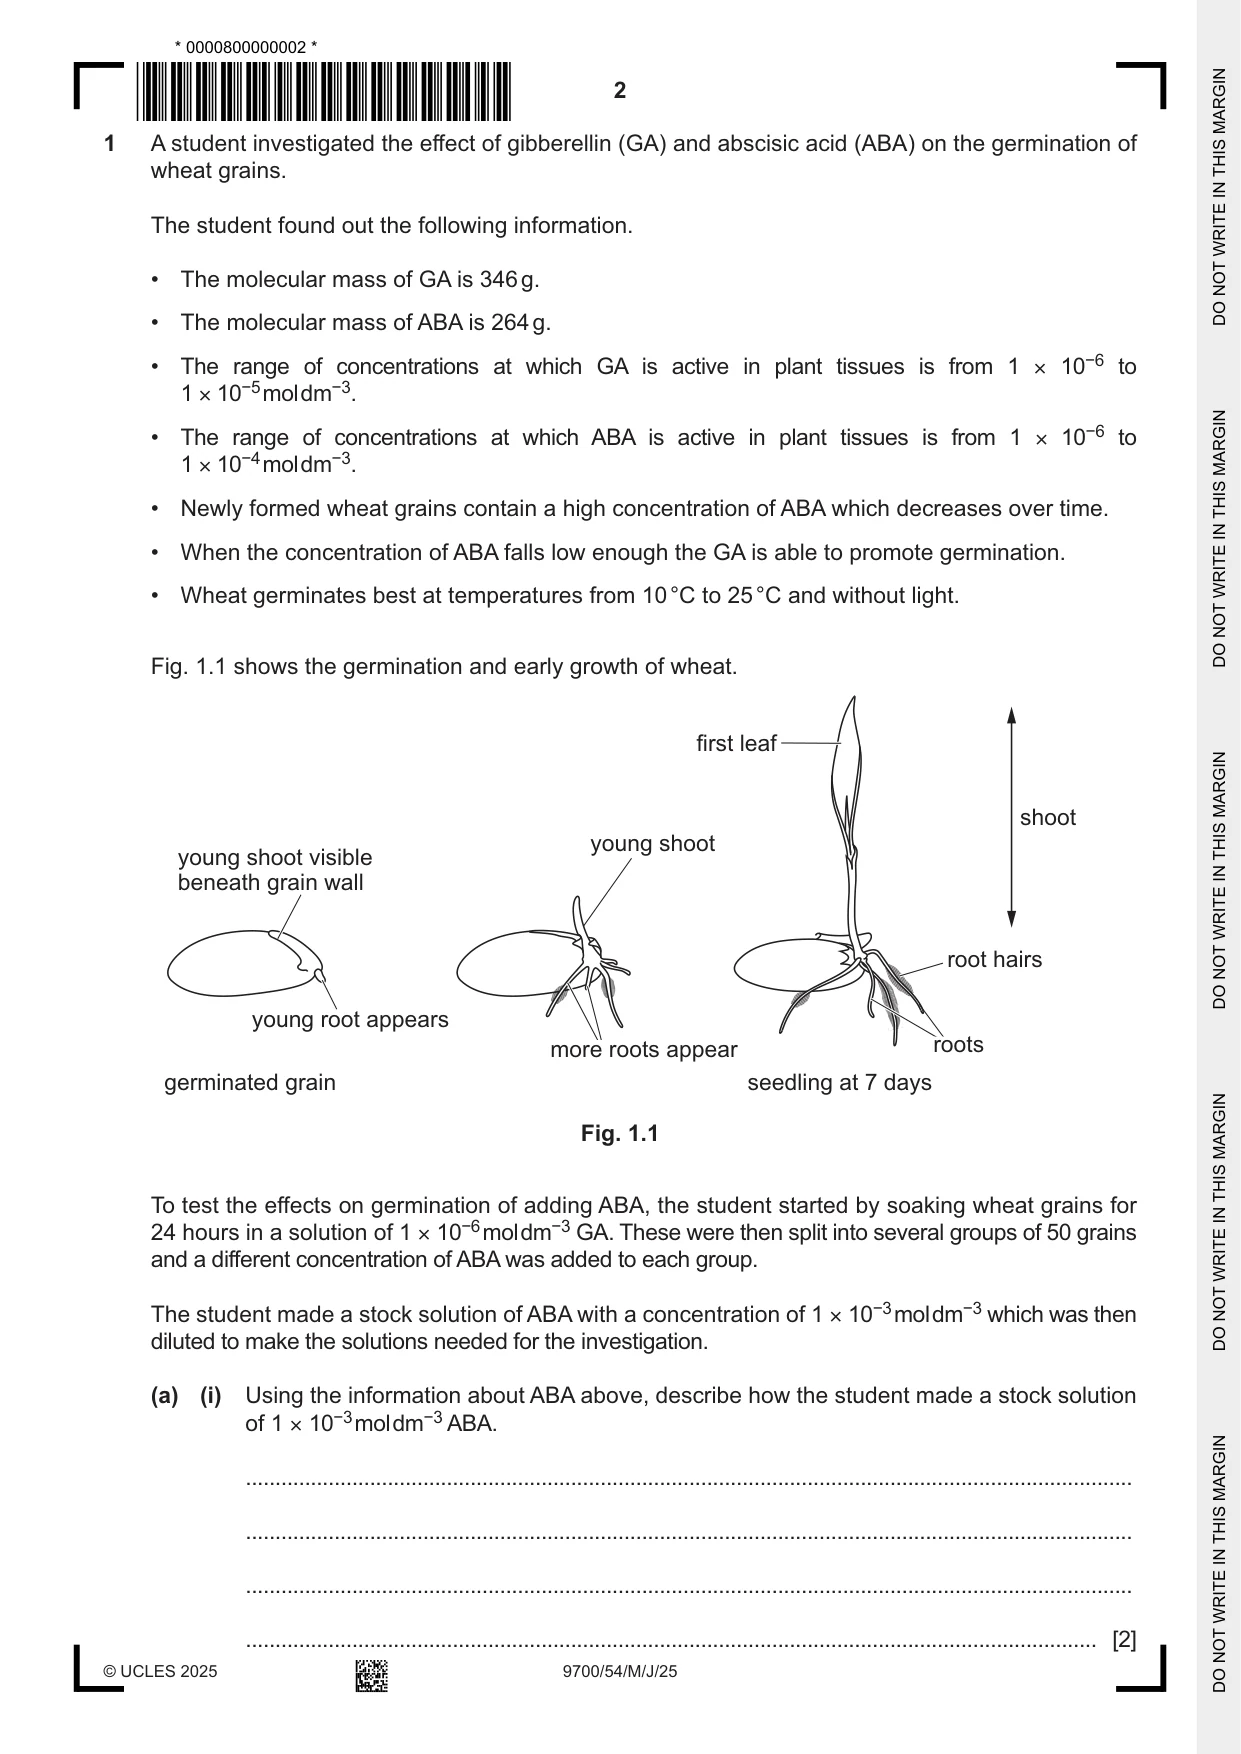
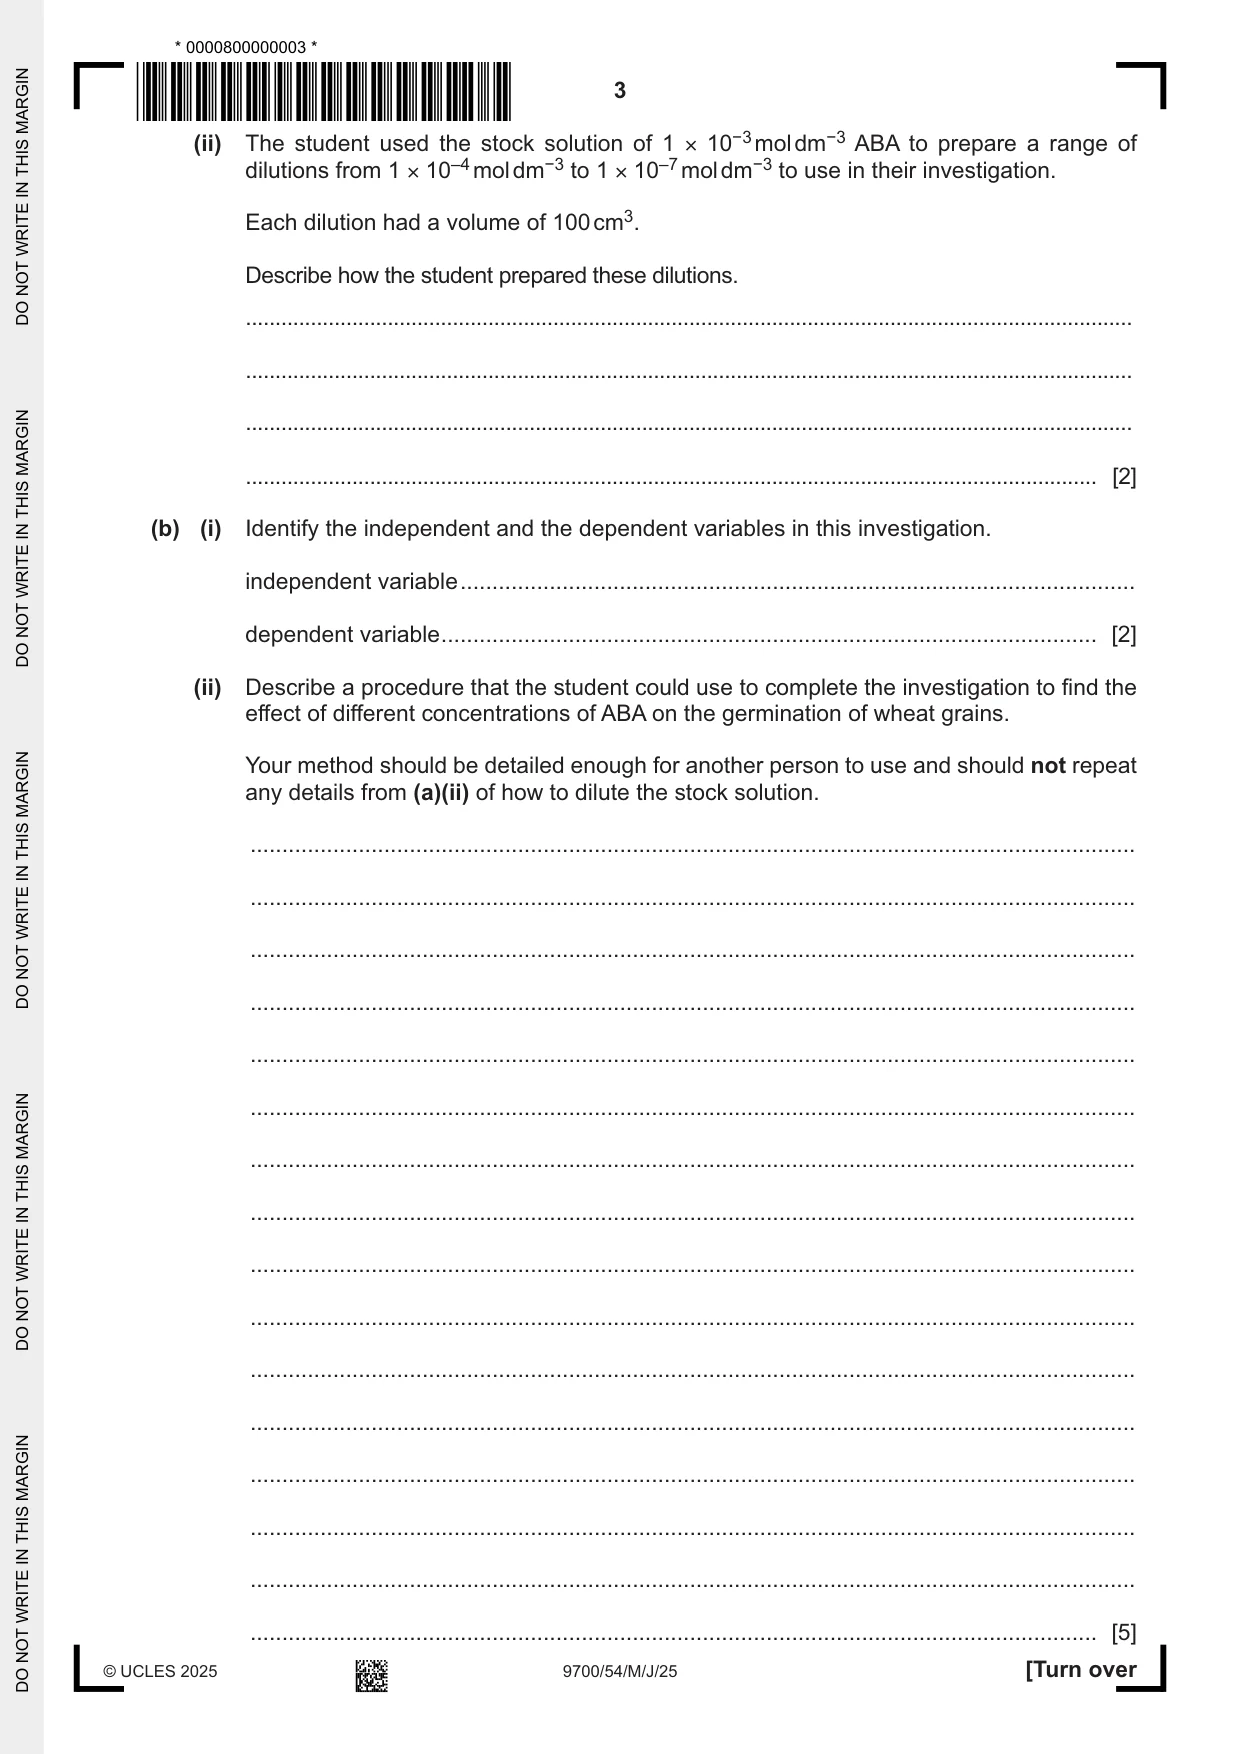
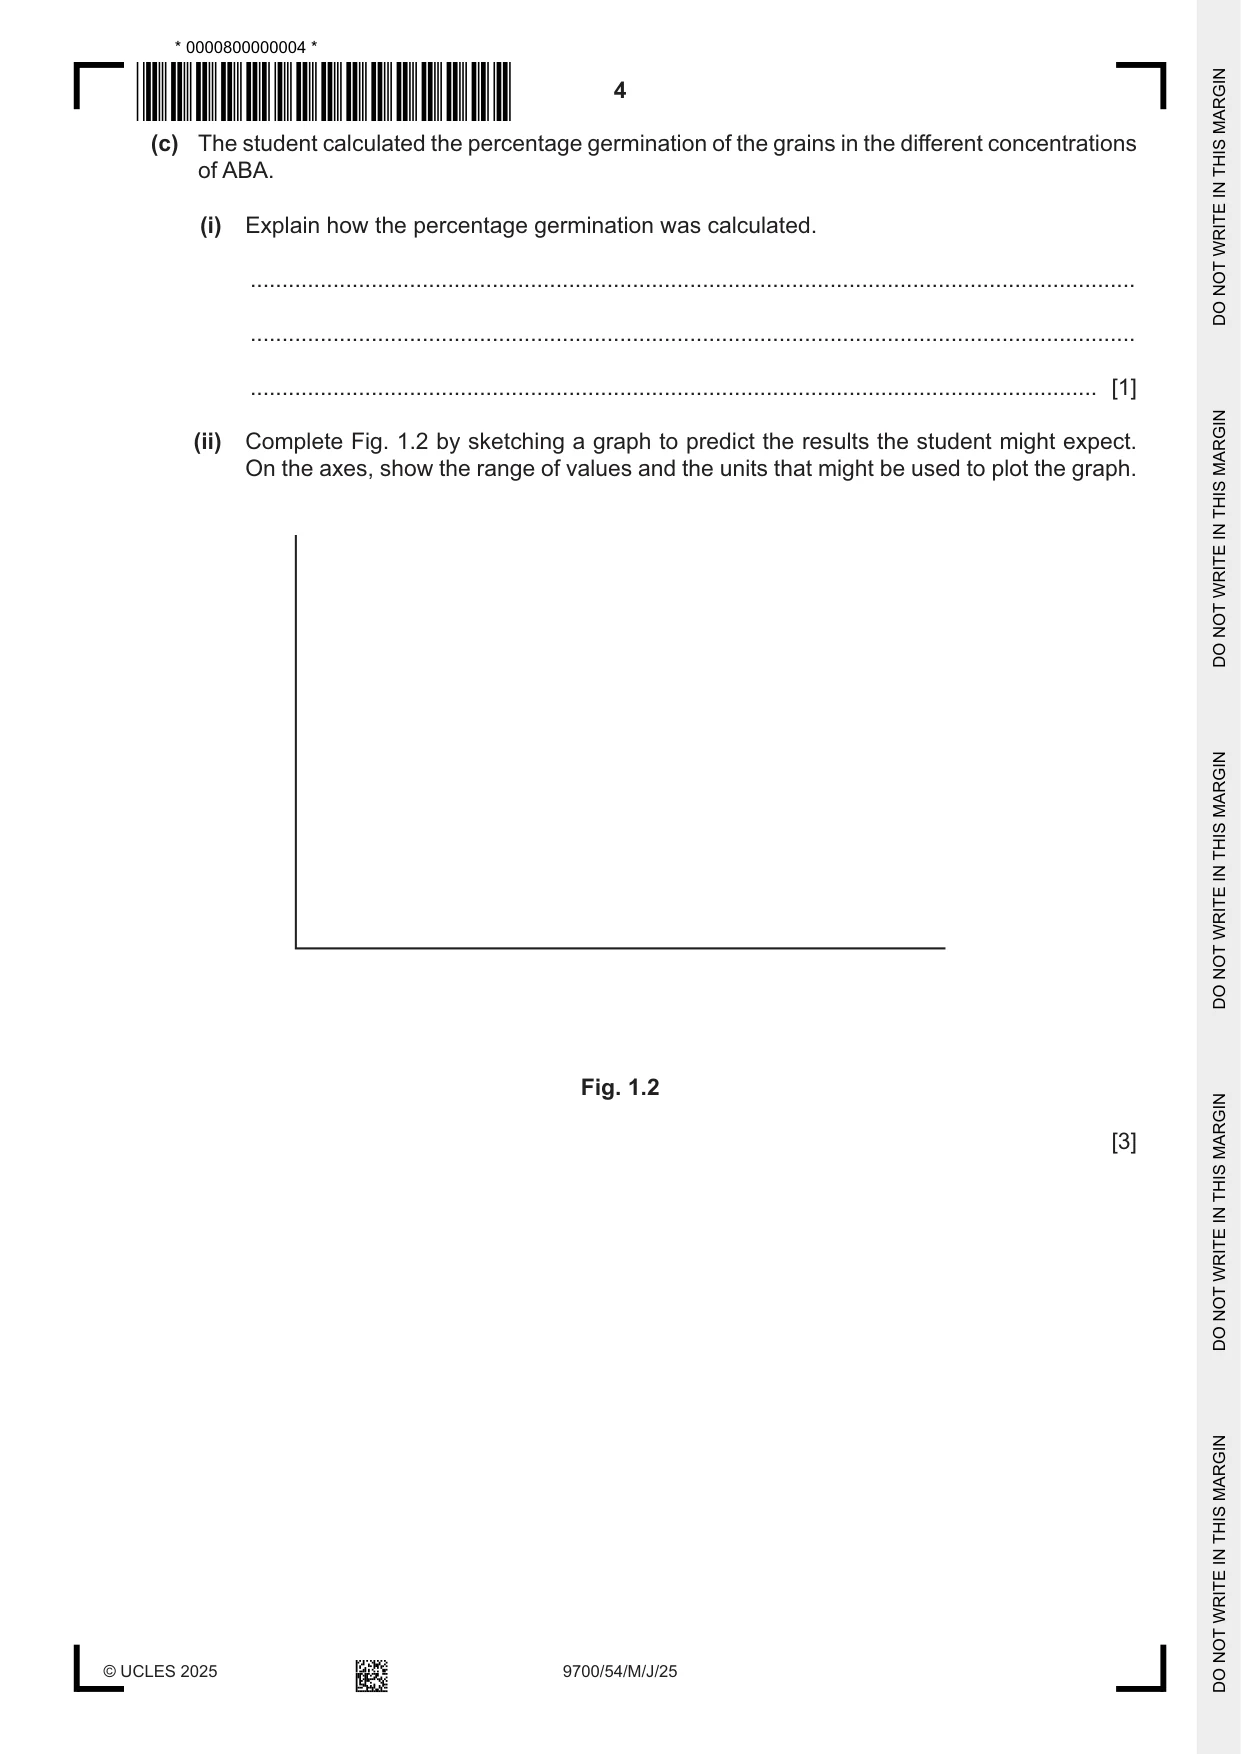
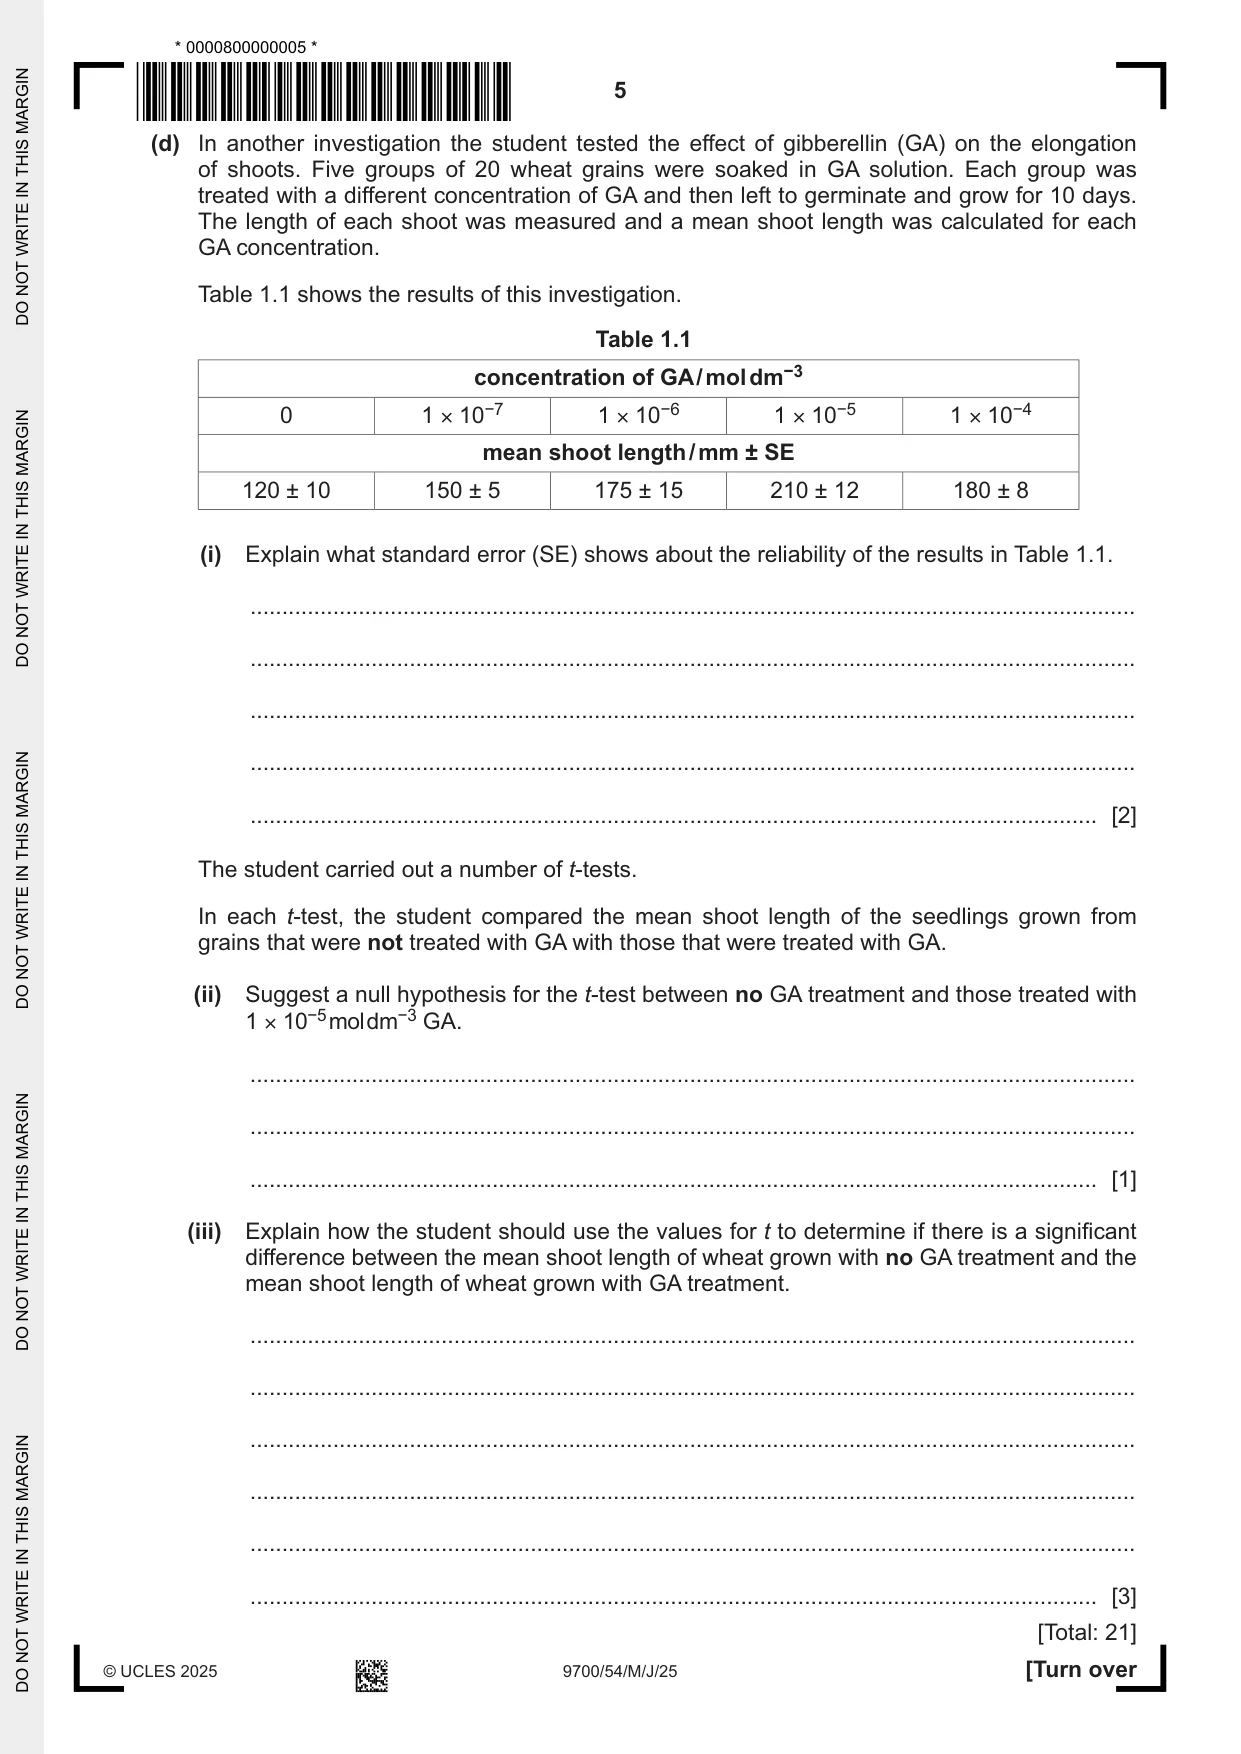
1 A student investigated the effect of gibberellin (GA) and abscisic acid (ABA) on the germination of wheat grains. The student found out the following information. • The molecular mass of GA is 346 g. • The molecular mass of ABA is 264 g. • The range of concentrations at which GA is active in plant tissues is from 1 × 10⁻⁶ to 1 × 10⁻⁵ mol dm−3. • The range of concentrations at which ABA is active in plant tissues is from 1 × 10⁻⁶ to 1 × 10⁻⁴ mol dm−3. • Newly formed wheat grains contain a high concentration of ABA which decreases over time. • When the concentration of ABA falls low enough the GA is able to promote germination. • Wheat germinates best at temperatures from 10 °C to 25 °C and without light. Fig. 1.1 shows the germination and early growth of wheat. first leaf shoot young shoot young shoot visible beneath grain wall root hairs young root appears more roots appear roots germinated grain seedling at 7 days Fig. 1.1 To test the effects on germination of adding ABA, the student started by soaking wheat grains for 24 hours in a solution of 1 × 10⁻⁶ mol dm−3 GA. These were then split into several groups of 50 grains and a different concentration of ABA was added to each group. The student made a stock solution of ABA with a concentration of 1 × 10⁻³ mol dm−3 which was then diluted to make the solutions needed for the investigation. (a) (i) Using the information about ABA above, describe how the student made a stock solution of 1 × 10⁻³ mol dm−3 ABA. ...................................................................................................................................................... ...................................................................................................................................................... ...................................................................................................................................................... ................................................................................................................................................ [2] (ii) The student used the stock solution of 1 × 10⁻³ mol dm−3 ABA to prepare a range of dilutions from 1 × 10⁻⁴ mol dm−3 to 1 × 10⁻⁷ mol dm−3 to use in their investigation. Each dilution had a volume of 100 cm3. Describe how the student prepared these dilutions. ...................................................................................................................................................... ...................................................................................................................................................... ...................................................................................................................................................... ................................................................................................................................................ [2] (b) (i) Identify the independent and the dependent variables in this investigation. independent variable .......................................................................................................... dependent variable ....................................................................................................... [2] (ii) Describe a procedure that the student could use to complete the investigation to find the effect of different concentrations of ABA on the germination of wheat grains. Your method should be detailed enough for another person to use and should not repeat any details from (a)(ii) of how to dilute the stock solution. ........................................................................................................................................... ........................................................................................................................................... ........................................................................................................................................... ........................................................................................................................................... ........................................................................................................................................... ........................................................................................................................................... ........................................................................................................................................... ........................................................................................................................................... ........................................................................................................................................... ........................................................................................................................................... ........................................................................................................................................... ........................................................................................................................................... ........................................................................................................................................... ........................................................................................................................................... ........................................................................................................................................... ..................................................................................................................................... [5] (c) The student calculated the percentage germination of the grains in the different concentrations of ABA. (i) Explain how the percentage germination was calculated. ........................................................................................................................................... ........................................................................................................................................... ..................................................................................................................................... [1] (ii) Complete Fig. 1.2 by sketching a graph to predict the results the student might expect. On the axes, show the range of values and the units that might be used to plot the graph. Fig. 1.2 [3] (d) In another investigation the student tested the effect of gibberellin (GA) on the elongation of shoots. Five groups of 20 wheat grains were soaked in GA solution. Each group was treated with a different concentration of GA and then left to germinate and grow for 10 days. The length of each shoot was measured and a mean shoot length was calculated for each GA concentration. Table 1.1 shows the results of this investigation. Table 1.1 concentration of GA / mol dm−3 0 1 × 10⁻⁷ 1 × 10⁻⁶ 1 × 10⁻⁵ 1 × 10⁻⁴ mean shoot length / mm ± SE 120 ± 10 150 ± 5 175 ± 15 210 ± 12 180 ± 8 (i) Explain what standard error (SE) shows about the reliability of the results in Table 1.1. ........................................................................................................................................... ........................................................................................................................................... ........................................................................................................................................... ........................................................................................................................................... ..................................................................................................................................... [2] The student carried out a number of t-tests. In each t-test, the student compared the mean shoot length of the seedlings grown from grains that were not treated with GA with those that were treated with GA. (ii) Suggest a null hypothesis for the t-test between no GA treatment and those treated with 1 × 10⁻⁵ mol dm−3 GA. ........................................................................................................................................... ........................................................................................................................................... ..................................................................................................................................... [1] (iii) Explain how the student should use the values for t to determine if there is a significant difference between the mean shoot length of wheat grown with no GA treatment and the mean shoot length of wheat grown with GA treatment. ........................................................................................................................................... ........................................................................................................................................... ........................................................................................................................................... ........................................................................................................................................... ........................................................................................................................................... ..................................................................................................................................... [3] [Total: 21]
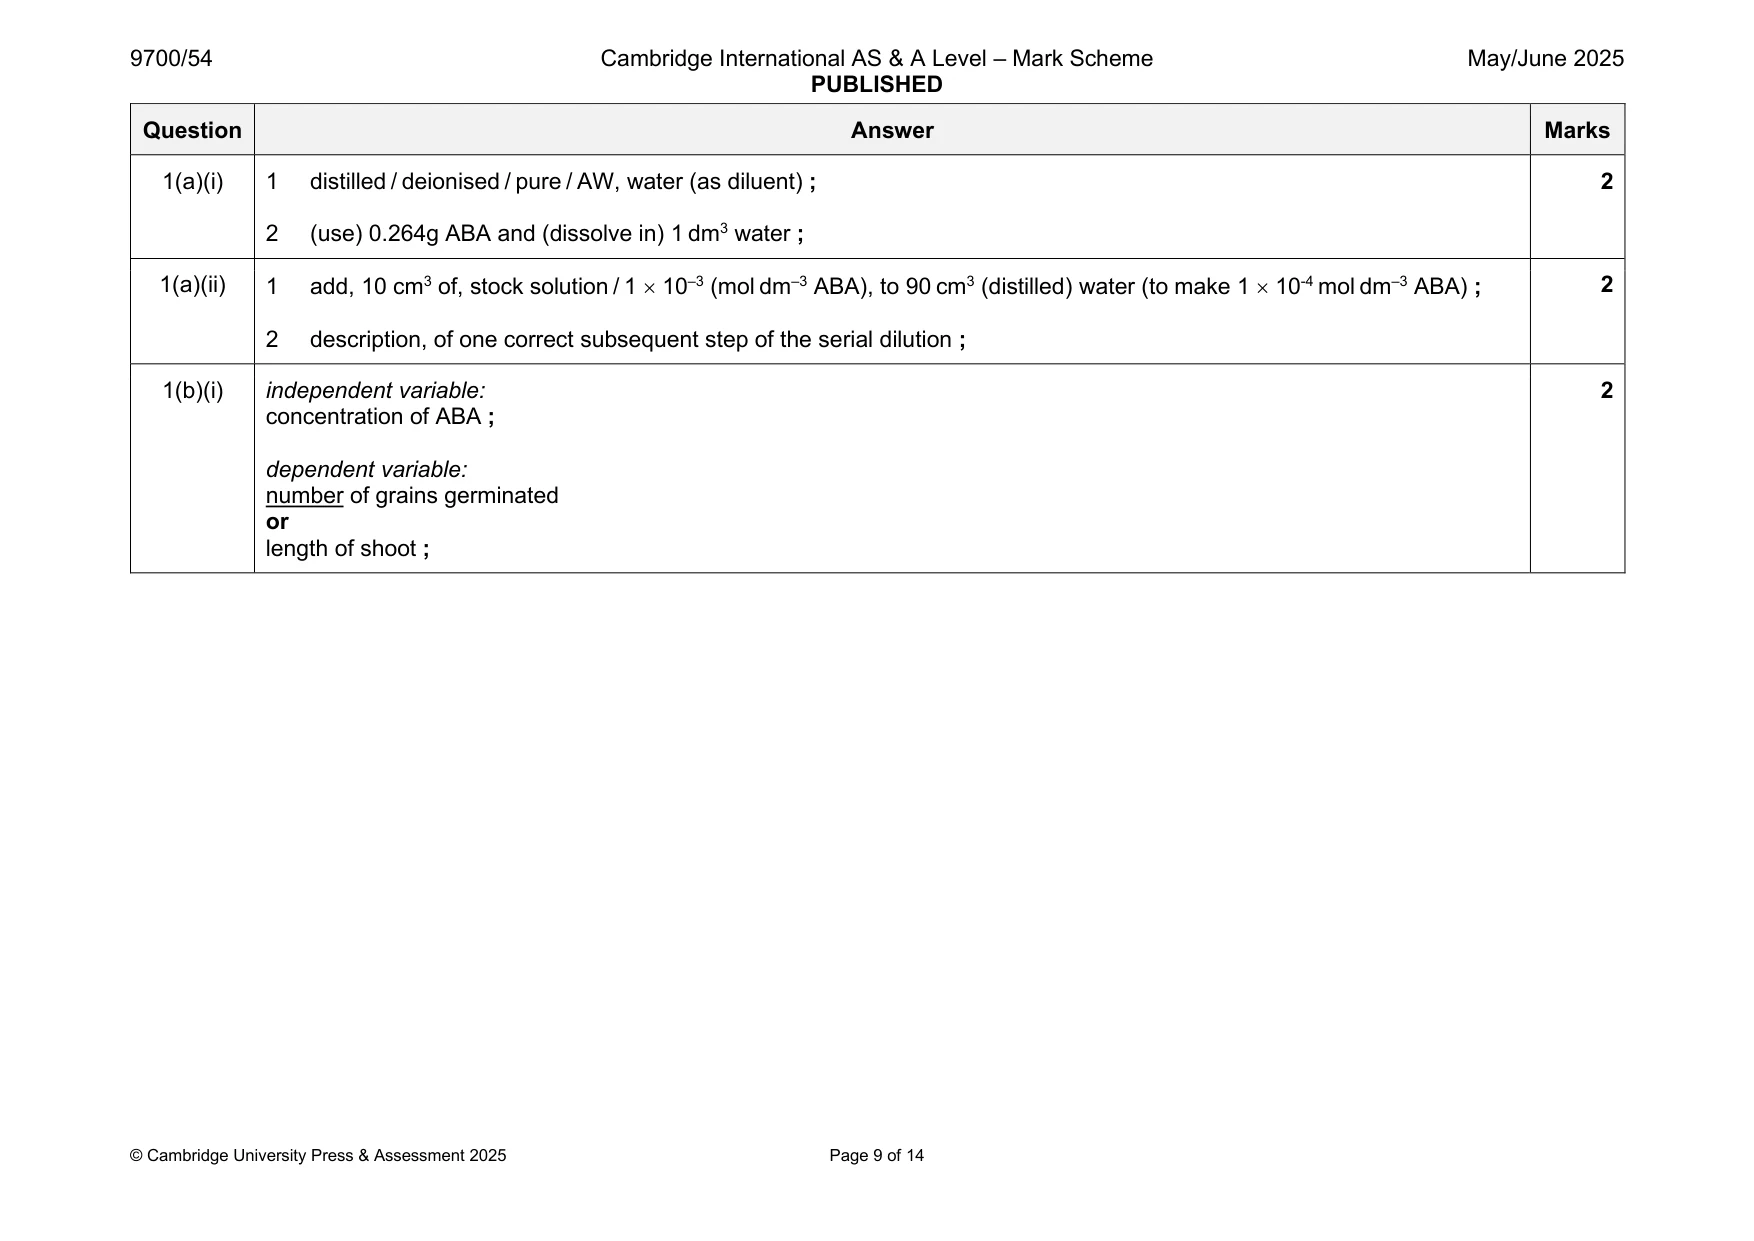
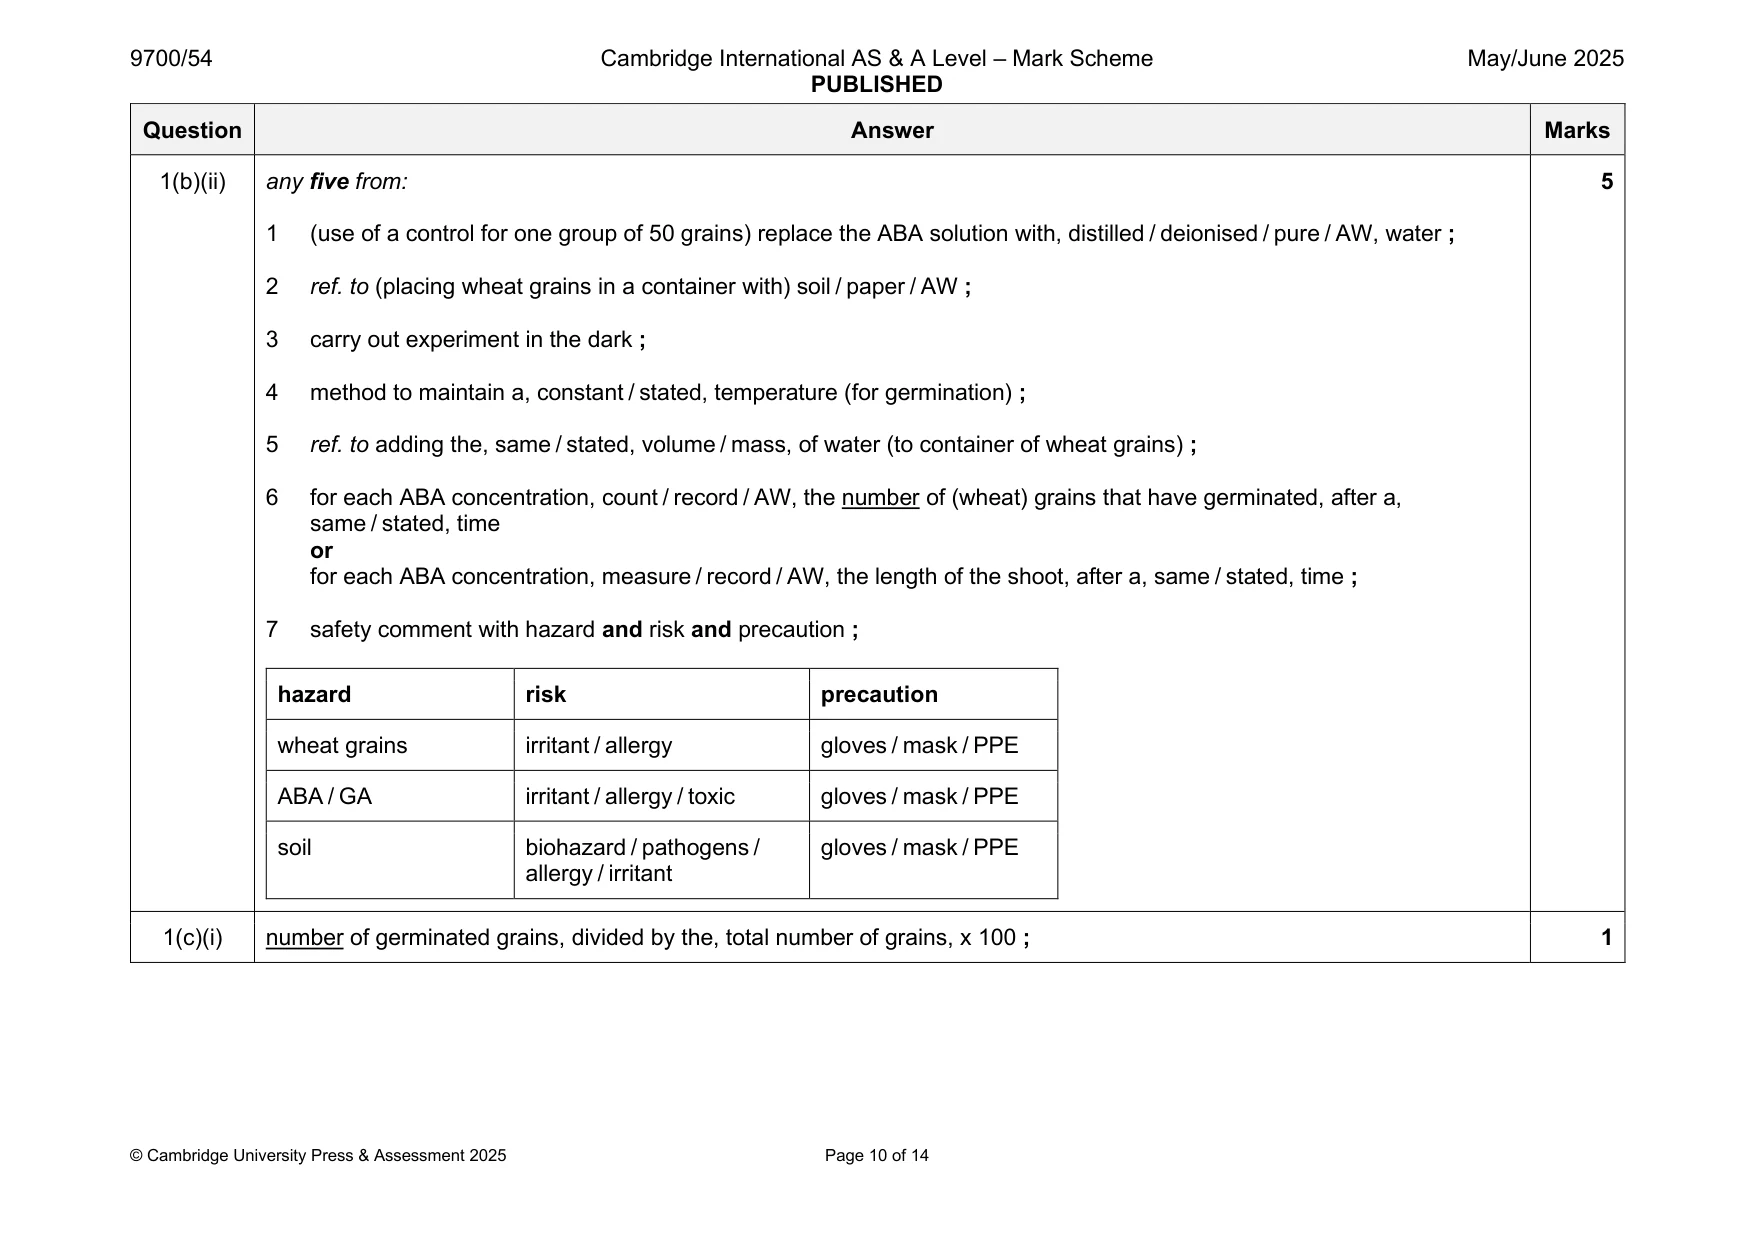
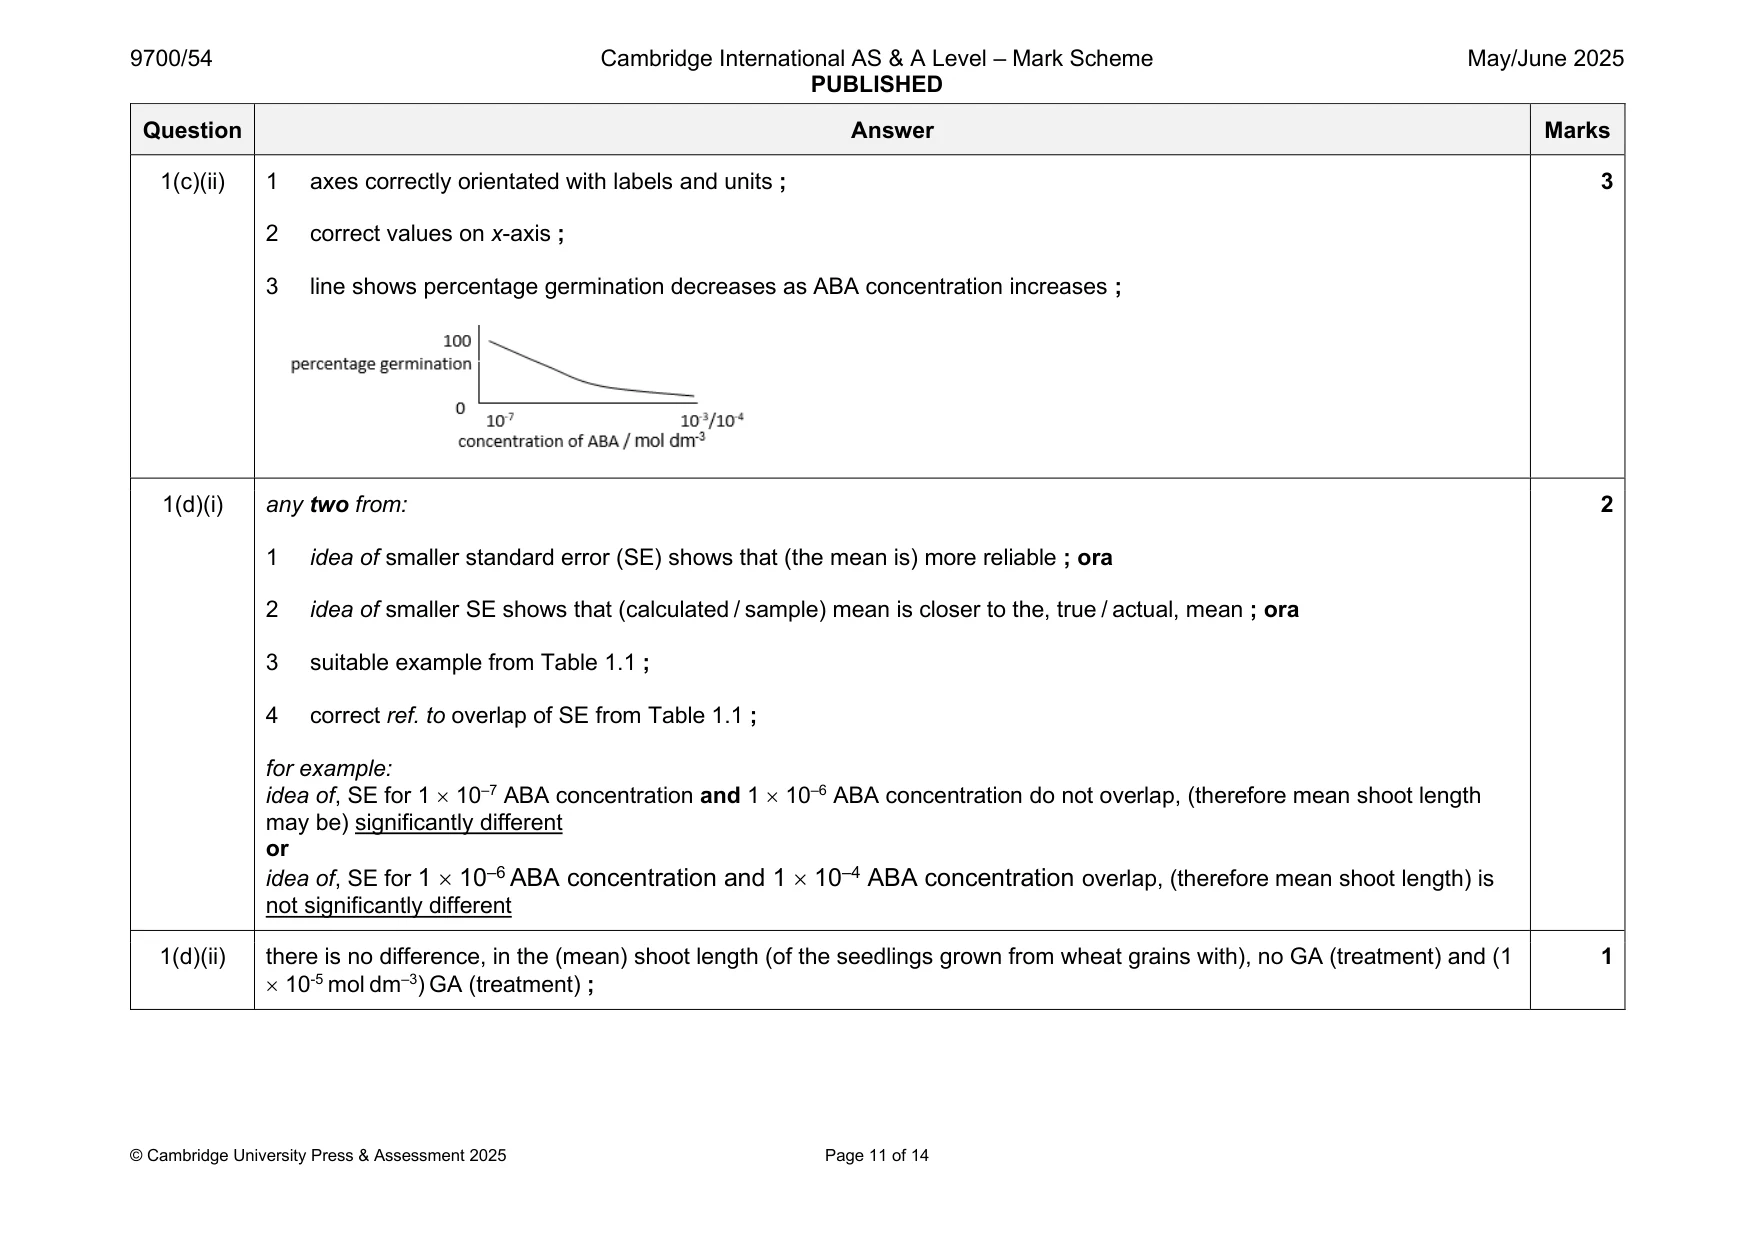
Mark scheme: Question Answer Marks 1(a)(i) 1 distilled / deionised / pure / AW, water (as diluent) ; 2 2 (use) 0.264g ABA and (dissolve in) 1 dm3 water ; 1(a)(ii) 1 add, 10 cm3 of, stock solution / 1 10–3 (mol dm–3 ABA), to 90 cm3 (distilled) water (to make 1 10-4 mol dm–3 ABA) ; 2 2 description, of one correct subsequent step of the serial dilution ; 1(b)(i) independent variable: 2 concentration of ABA ; dependent variable: number of grains germinated or length of shoot ; 1(b)(ii) any five from: 5 1 (use of a control for one group of 50 grains) replace the ABA solution with, distilled / deionised / pure / AW, water ; 2 ref. to (placing wheat grains in a container with) soil / paper / AW ; 3 carry out experiment in the dark ; 4 method to maintain a, constant / stated, temperature (for germination) ; 5 ref. to adding the, same / stated, volume / mass, of water (to container of wheat grains) ; 6 for each ABA concentration, count / record / AW, the number of (wheat) grains that have germinated, after a, same / stated, time or for each ABA concentration, measure / record / AW, the length of the shoot, after a, same / stated, time ; 7 safety comment with hazard and risk and precaution ; hazard risk precaution wheat grains irritant / allergy gloves / mask / PPE ABA / GA irritant / allergy / toxic gloves / mask / PPE soil biohazard / pathogens / gloves / mask / PPE allergy / irritant 1(c)(i) number of germinated grains, divided by the, total number of grains, x 100 ; 1 1(c)(ii) 1 axes correctly orientated with labels and units ; 3 2 correct values on x-axis ; 3 line shows percentage germination decreases as ABA concentration increases ; 1(d)(i) any two from: 2 1 idea of smaller standard error (SE) shows that (the mean is) more reliable ; ora 2 idea of smaller SE shows that (calculated / sample) mean is closer to the, true / actual, mean ; ora 3 suitable example from Table 1.1 ; 4 correct ref. to overlap of SE from Table 1.1 ; for example: idea of, SE for 1 10–7 ABA concentration and 1 10–6 ABA concentration do not overlap, (therefore mean shoot length may be) significantly different or idea of, SE for 1 10–6 ABA concentration and 1 10–4 ABA concentration overlap, (therefore mean shoot length) is not significantly different 1(d)(ii) there is no difference, in the (mean) shoot length (of the seedlings grown from wheat grains with), no GA (treatment) and (1 1 10-5 mol dm–3) GA (treatment) ; 1(d)(iii) 1 use 38 degrees of freedom ; 3 2 compare (calculated) t-value with, critical (t-) value at, (p) = 0.05 / 5% ; 3 (if calculated) t-value is higher (than the critical t-value then) and reject null hypothesis / there is a significant difference ; ora
Q2 · A student investigated the oxygen consumption of isolated mitochondria under different…
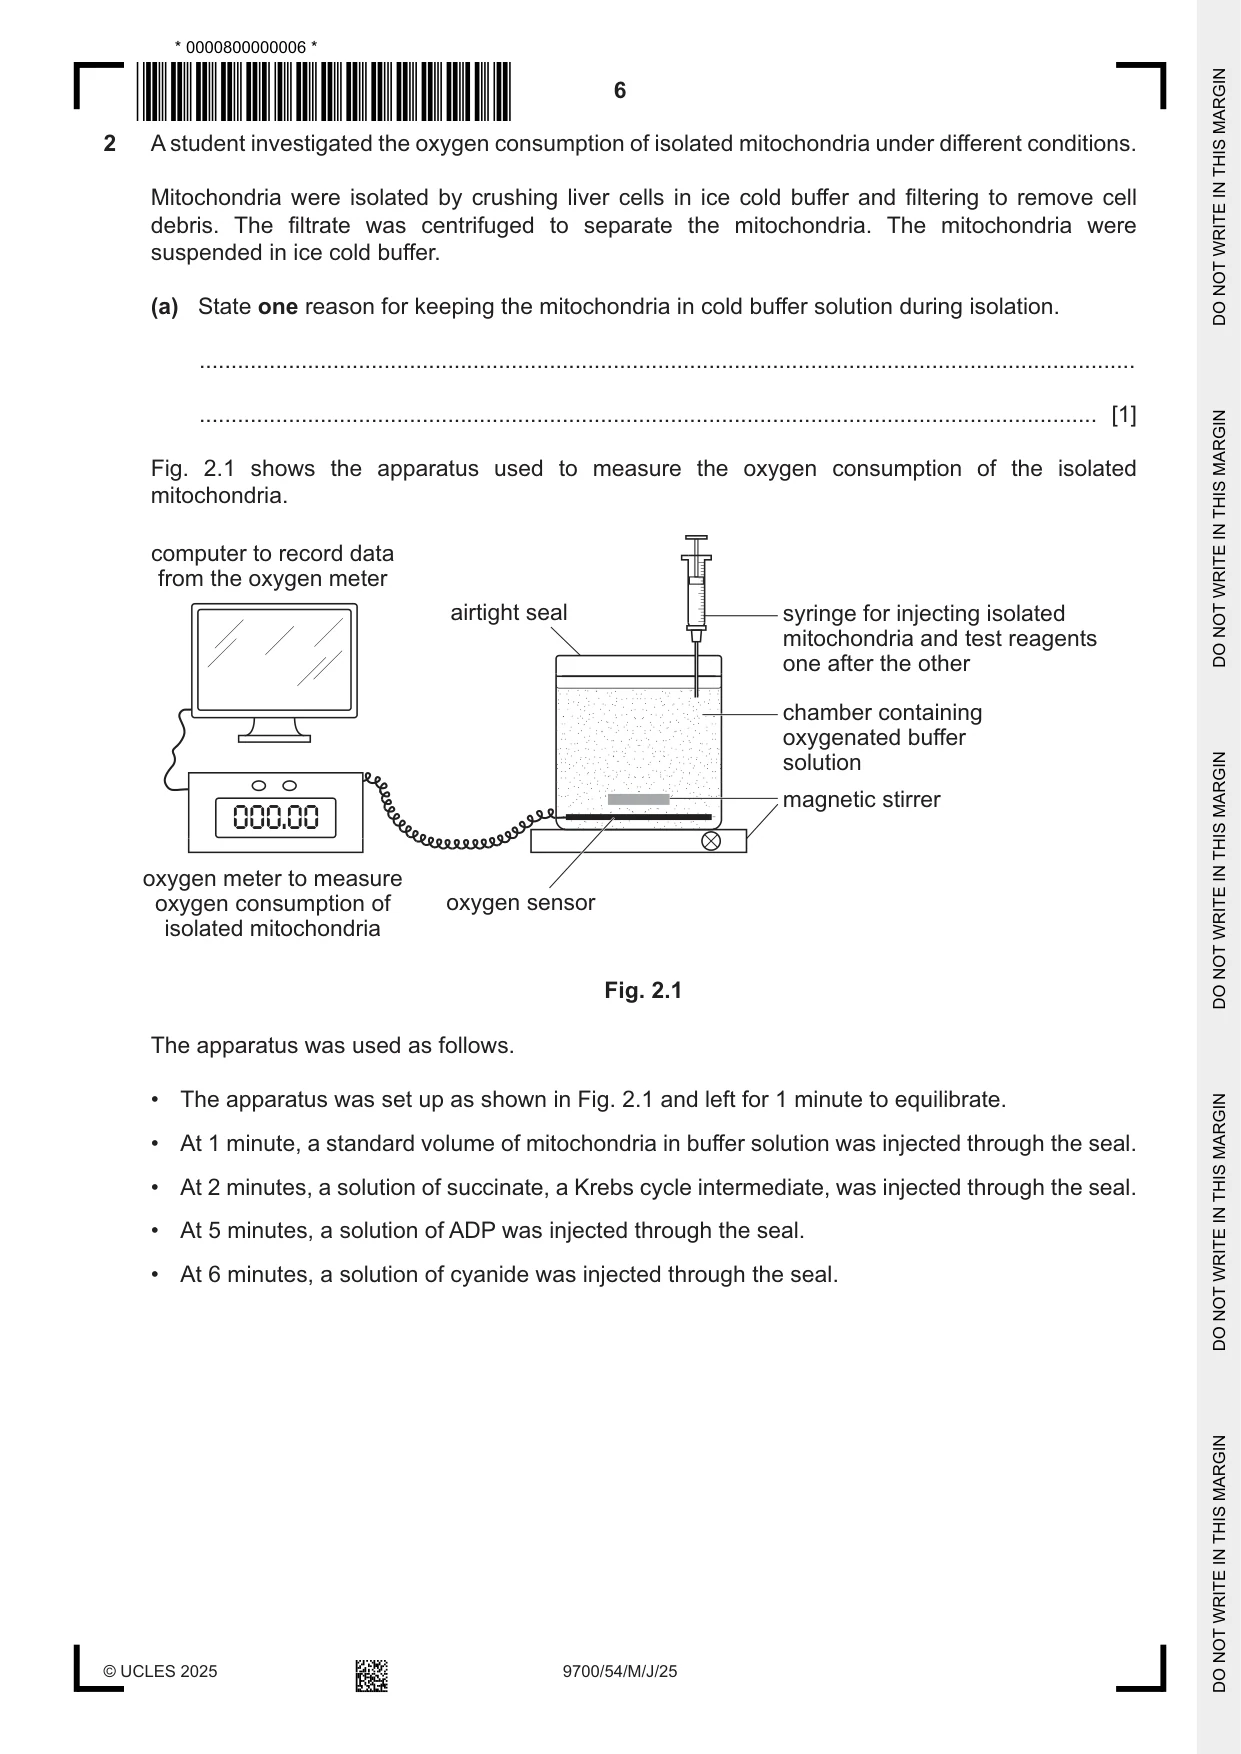
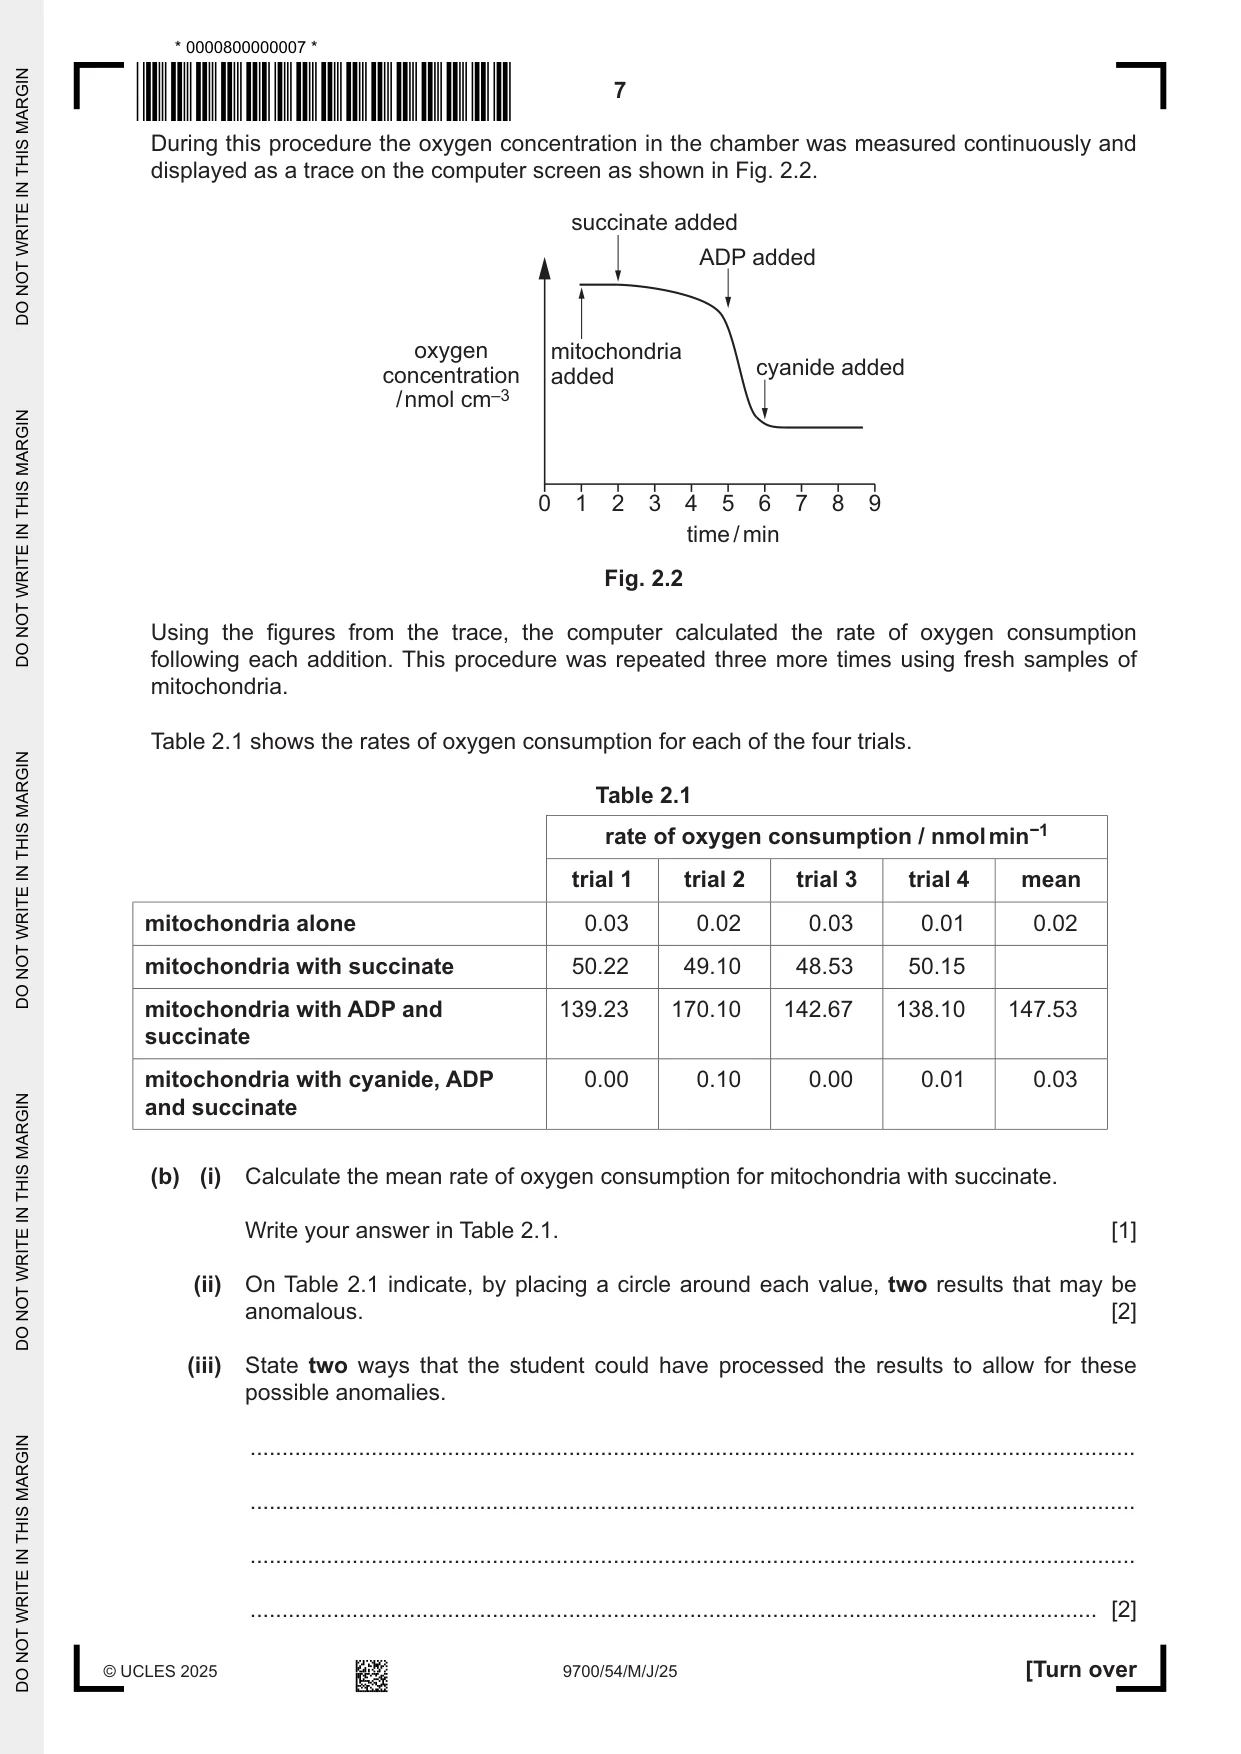
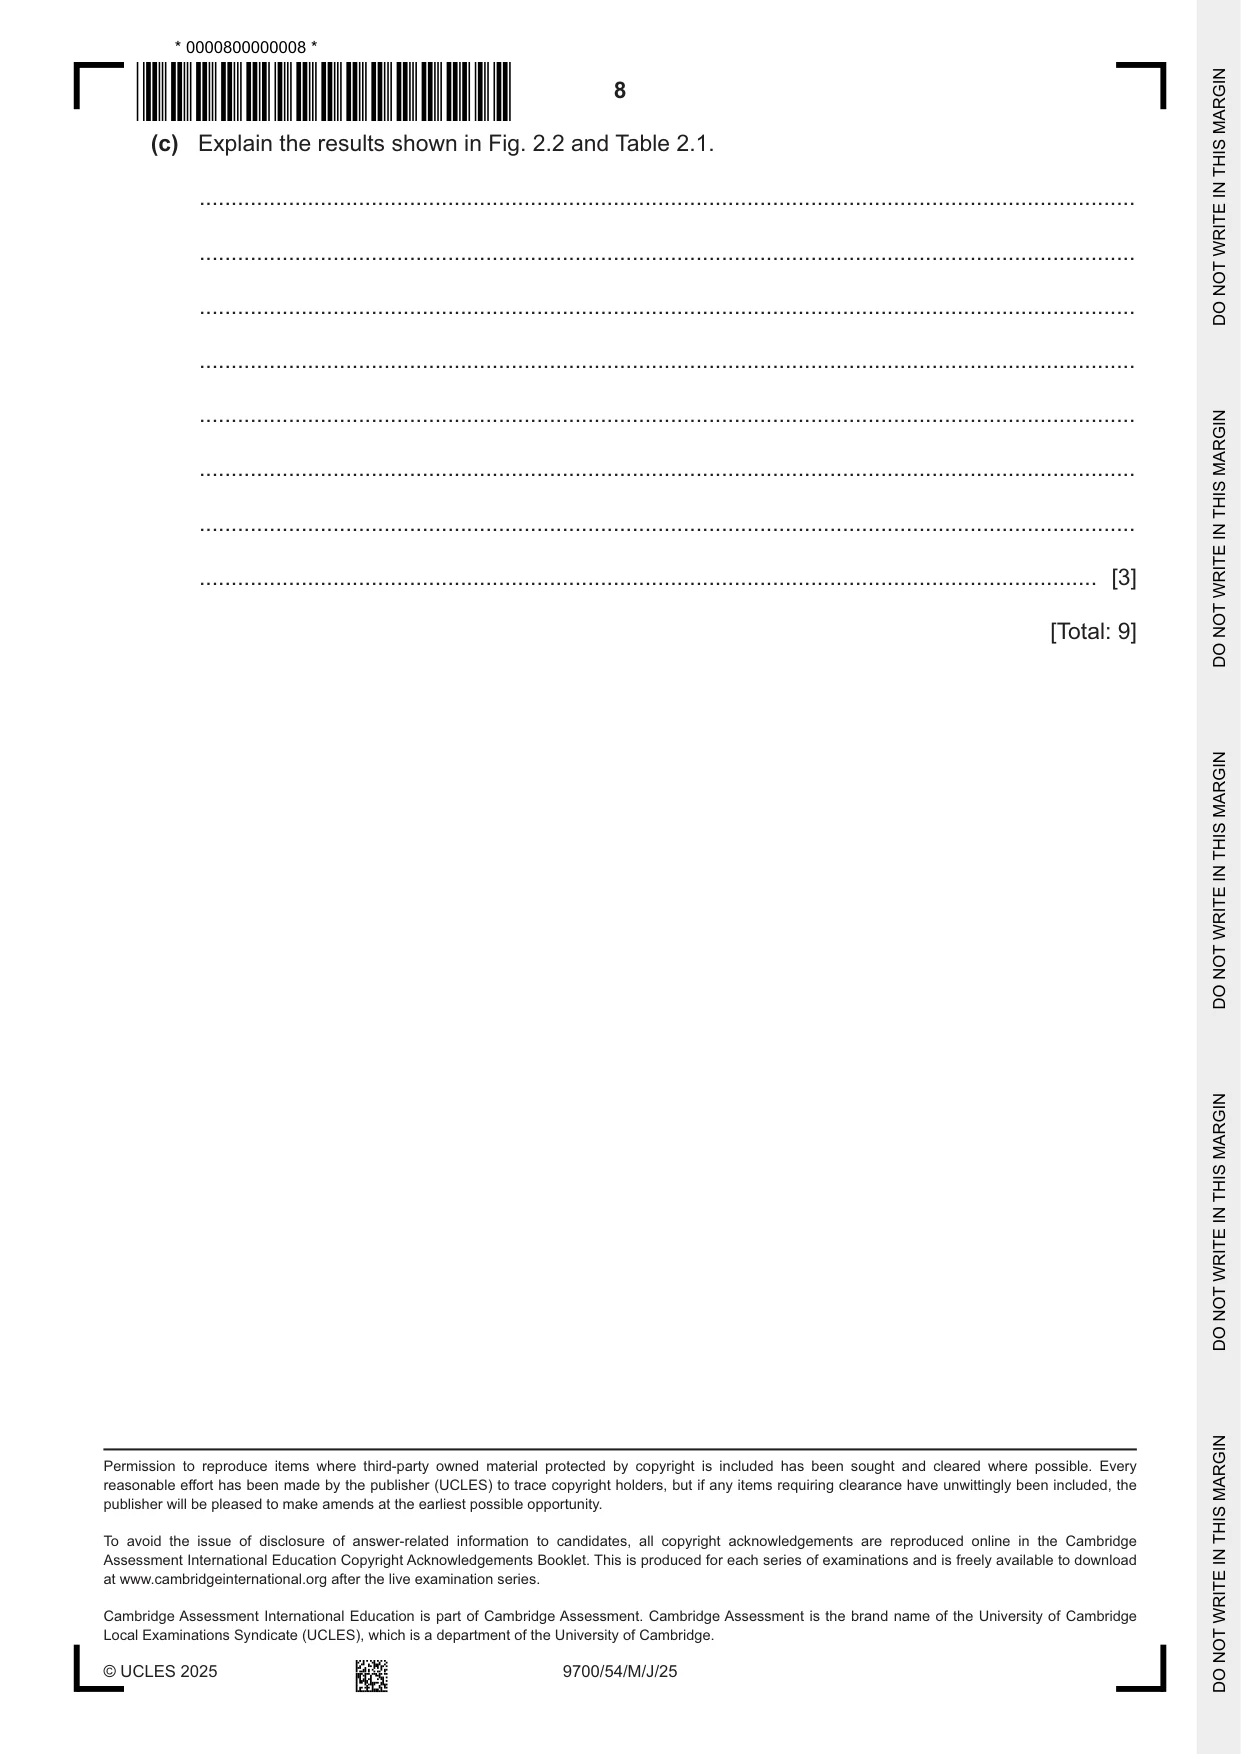
2 A student investigated the oxygen consumption of isolated mitochondria under different conditions. Mitochondria were isolated by crushing liver cells in ice cold buffer and filtering to remove cell debris. The filtrate was centrifuged to separate the mitochondria. The mitochondria were suspended in ice cold buffer. (a) State one reason for keeping the mitochondria in cold buffer solution during isolation. ................................................................................................................................................... ............................................................................................................................................. [1] Fig. 2.1 shows the apparatus used to measure the oxygen consumption of the isolated mitochondria. computer to record data from the oxygen meter airtight seal syringe for injecting isolated mitochondria and test reagents one after the other chamber containing oxygenated buffer solution magnetic stirrer 000.00 oxygen meter to measure oxygen consumption of oxygen sensor isolated mitochondria Fig. 2.1 The apparatus was used as follows. • The apparatus was set up as shown in Fig. 2.1 and left for 1 minute to equilibrate. • At 1 minute, a standard volume of mitochondria in buffer solution was injected through the seal. • At 2 minutes, a solution of succinate, a Krebs cycle intermediate, was injected through the seal. • At 5 minutes, a solution of ADP was injected through the seal. • At 6 minutes, a solution of cyanide was injected through the seal. During this procedure the oxygen concentration in the chamber was measured continuously and displayed as a trace on the computer screen as shown in Fig. 2.2. succinate added ADP added oxygen mitochondria cyanide added concentration added / nmol cm–3 0 1 2 3 4 5 6 7 8 9 time / min Fig. 2.2 Using the figures from the trace, the computer calculated the rate of oxygen consumption following each addition. This procedure was repeated three more times using fresh samples of mitochondria. Table 2.1 shows the rates of oxygen consumption for each of the four trials. Table 2.1 rate of oxygen consumption / nmol min−1 trial 1 trial 2 trial 3 trial 4 mean mitochondria alone 0.03 0.02 0.03 0.01 0.02 mitochondria with succinate 50.22 49.10 48.53 50.15 mitochondria with ADP and 139.23 170.10 142.67 138.10 147.53 succinate mitochondria with cyanide, ADP 0.00 0.10 0.00 0.01 0.03 and succinate (b) (i) Calculate the mean rate of oxygen consumption for mitochondria with succinate. Write your answer in Table 2.1. [1] (ii) On Table 2.1 indicate, by placing a circle around each value, two results that may be anomalous. [2] (iii) State two ways that the student could have processed the results to allow for these possible anomalies. ........................................................................................................................................... ........................................................................................................................................... ........................................................................................................................................... ..................................................................................................................................... [2] (c) Explain the results shown in Fig. 2.2 and Table 2.1. ................................................................................................................................................... ................................................................................................................................................... ................................................................................................................................................... ................................................................................................................................................... ................................................................................................................................................... ................................................................................................................................................... ................................................................................................................................................... ............................................................................................................................................. [3] [Total: 9]
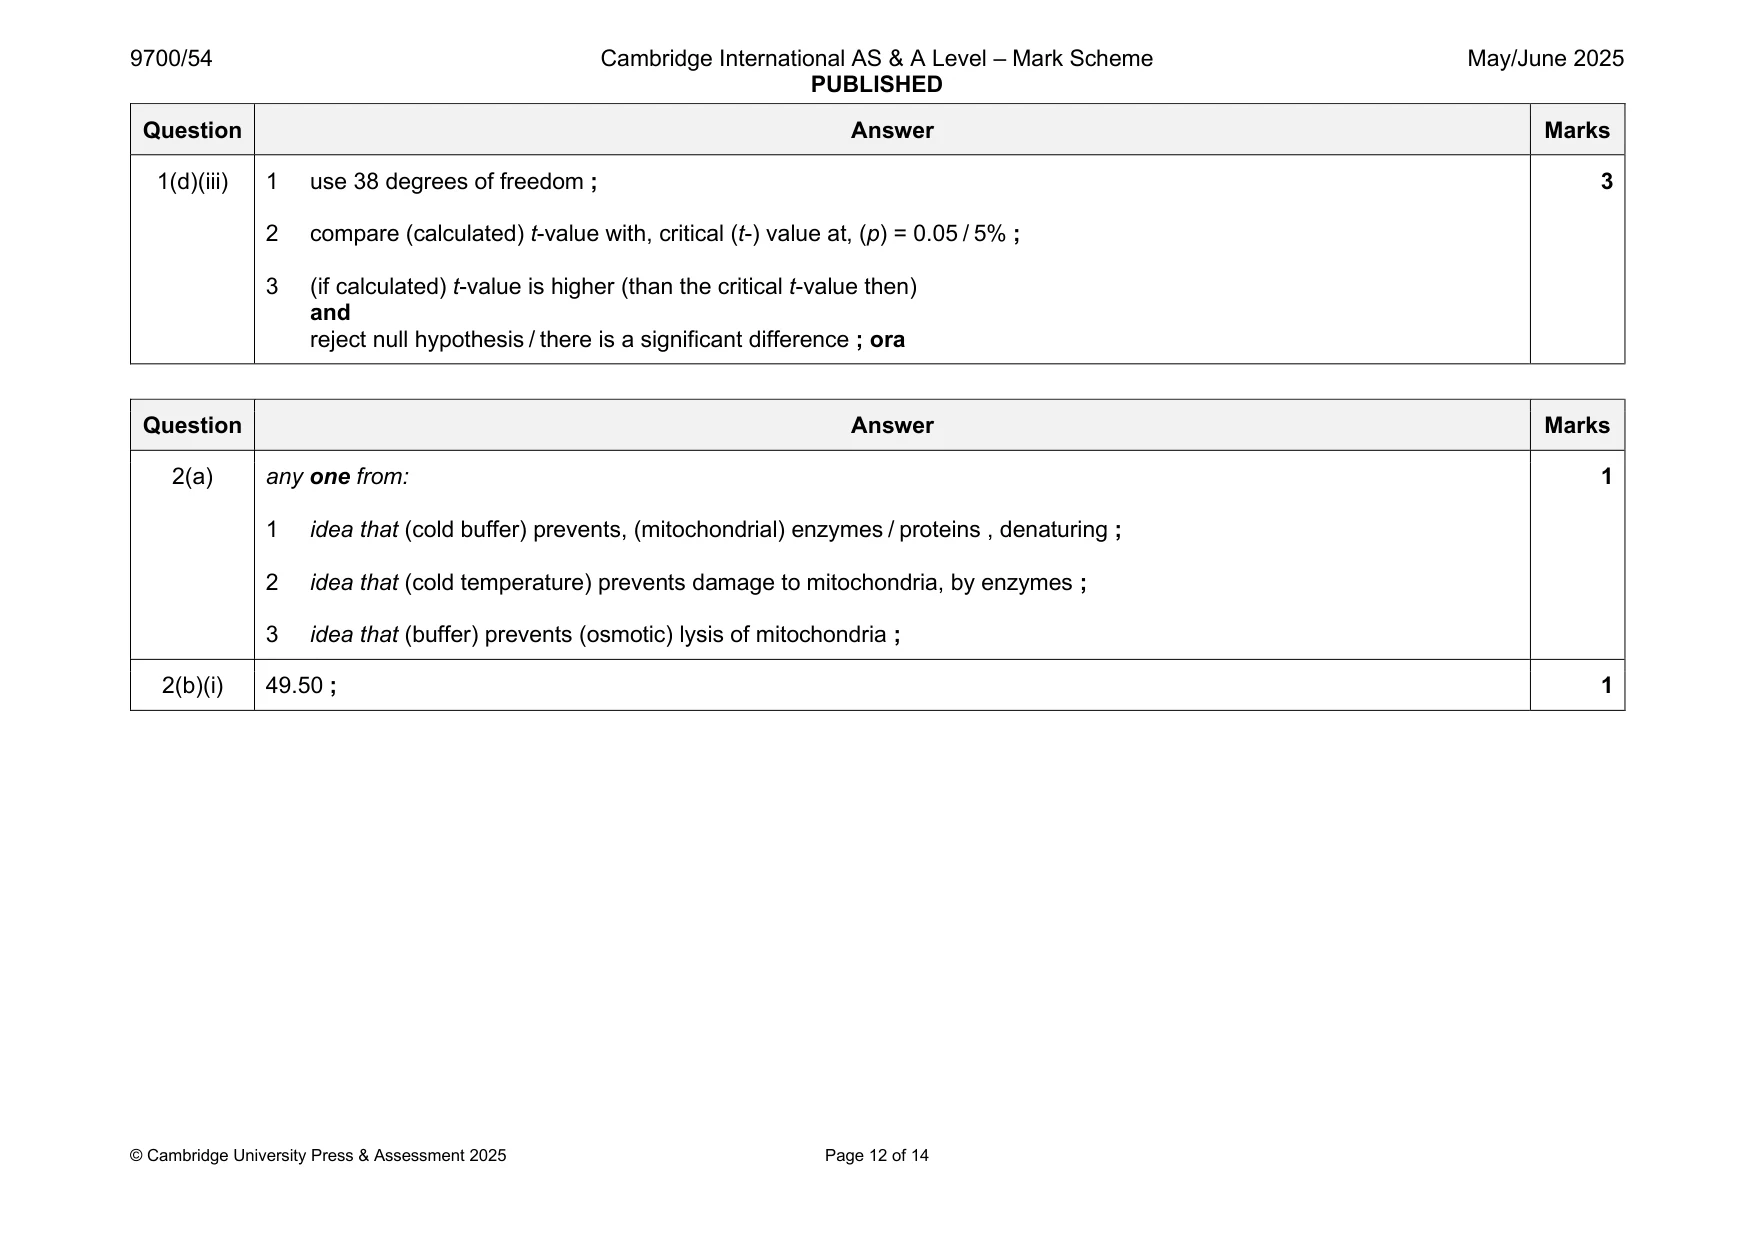
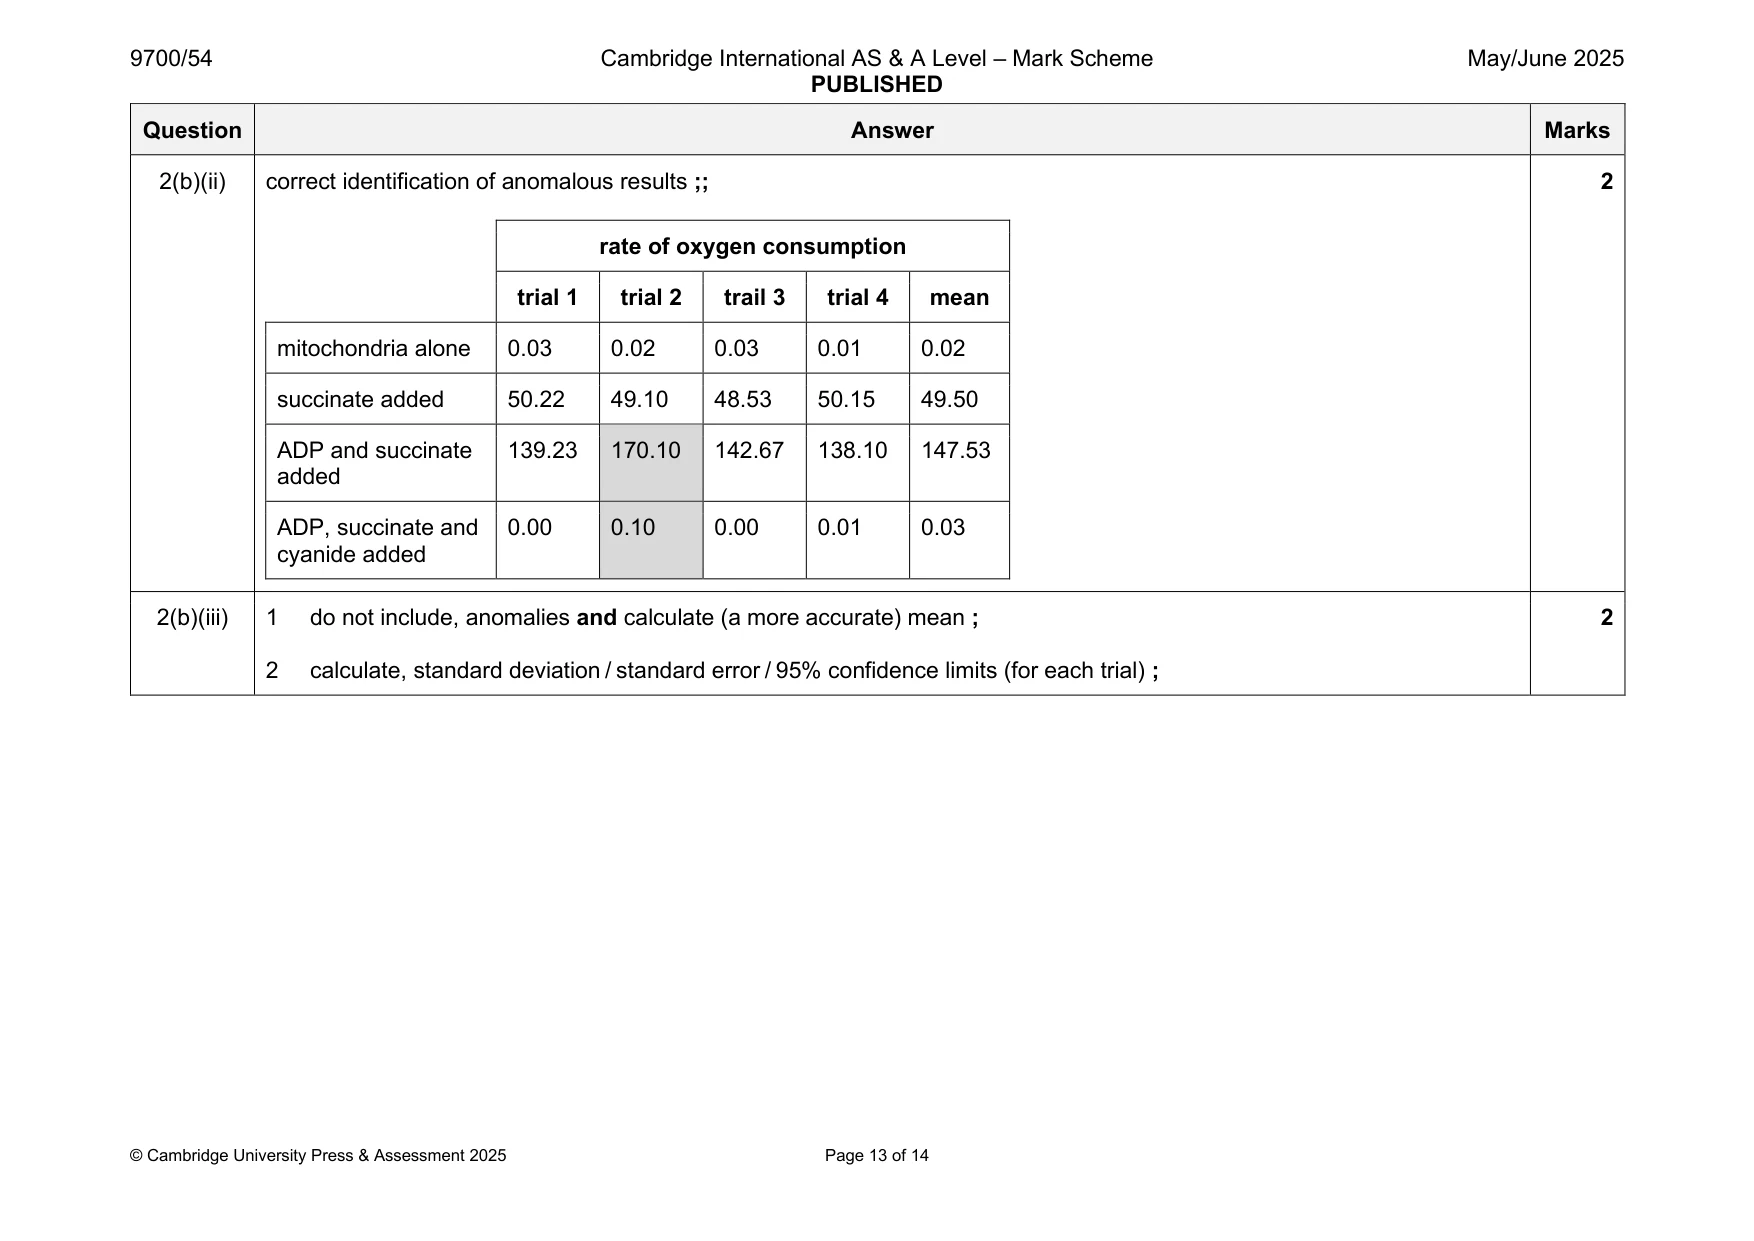
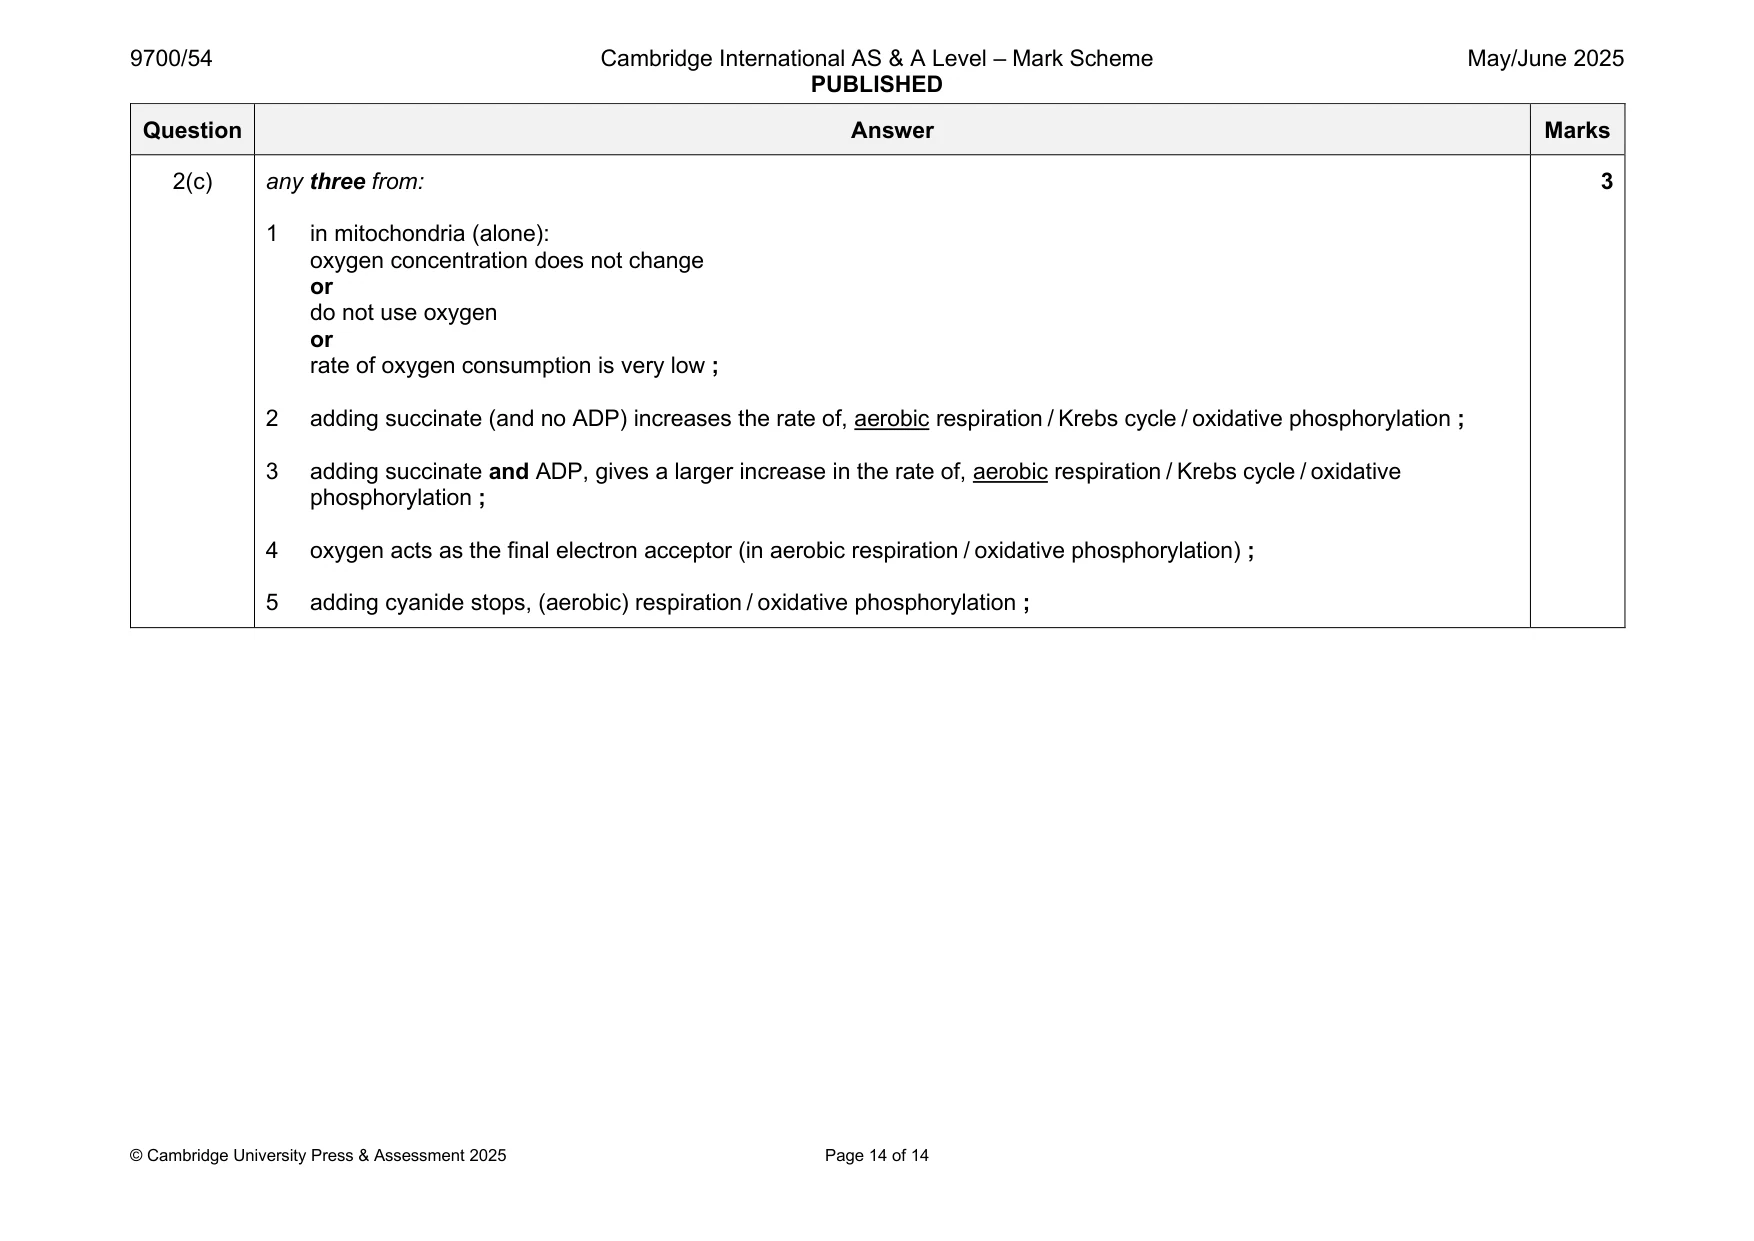
Mark scheme: 2(a) any one from: 1 1 idea that (cold buffer) prevents, (mitochondrial) enzymes / proteins , denaturing ; 2 idea that (cold temperature) prevents damage to mitochondria, by enzymes ; 3 idea that (buffer) prevents (osmotic) lysis of mitochondria ; 2(b)(i) 49.50 ; 1 2(b)(ii) correct identification of anomalous results ;; 2 rate of oxygen consumption trial 1 trial 2 trail 3 trial 4 mean mitochondria alone 0.03 0.02 0.03 0.01 0.02 succinate added 50.22 49.10 48.53 50.15 49.50 ADP and succinate 139.23 170.10 142.67 138.10 147.53 added ADP, succinate and 0.00 0.10 0.00 0.01 0.03 cyanide added 2(b)(iii) 1 do not include, anomalies and calculate (a more accurate) mean ; 2 2 calculate, standard deviation / standard error / 95% confidence limits (for each trial) ; 2(c) any three from: 3 1 in mitochondria (alone): oxygen concentration does not change or do not use oxygen or rate of oxygen consumption is very low ; 2 adding succinate (and no ADP) increases the rate of, aerobic respiration / Krebs cycle / oxidative phosphorylation ; 3 adding succinate and ADP, gives a larger increase in the rate of, aerobic respiration / Krebs cycle / oxidative phosphorylation ; 4 oxygen acts as the final electron acceptor (in aerobic respiration / oxidative phosphorylation) ; 5 adding cyanide stops, (aerobic) respiration / oxidative phosphorylation ;
What was in this paper
The subtopics covered by these 2 questions, and how many questions each got. Open one in a new tab to see every Cambridge question on it.
What you needed in this session
Cambridge’s own grade thresholds for 2025 May/June, Paper 5 · Variant 4. A higher threshold means an easier paper — the bar moves with how the cohort did.