Cambridge A Level Biology 9700 — 2024 Oct/Nov Paper 5 · Variant 1
9700/51/O/N/24 · 2 questions · 30 marks · ≈34 min
The question paper and its mark scheme, free to read here and free to download. This is Cambridge’s own paper, exactly as it was sat.
Question paper16 pages





Mark scheme10 pages
Answers below. Sit the paper first if you are practising.
Questions as text
Q1 · Algae are a diverse group of photosynthetic eukaryotes in the kingdom Protoctista
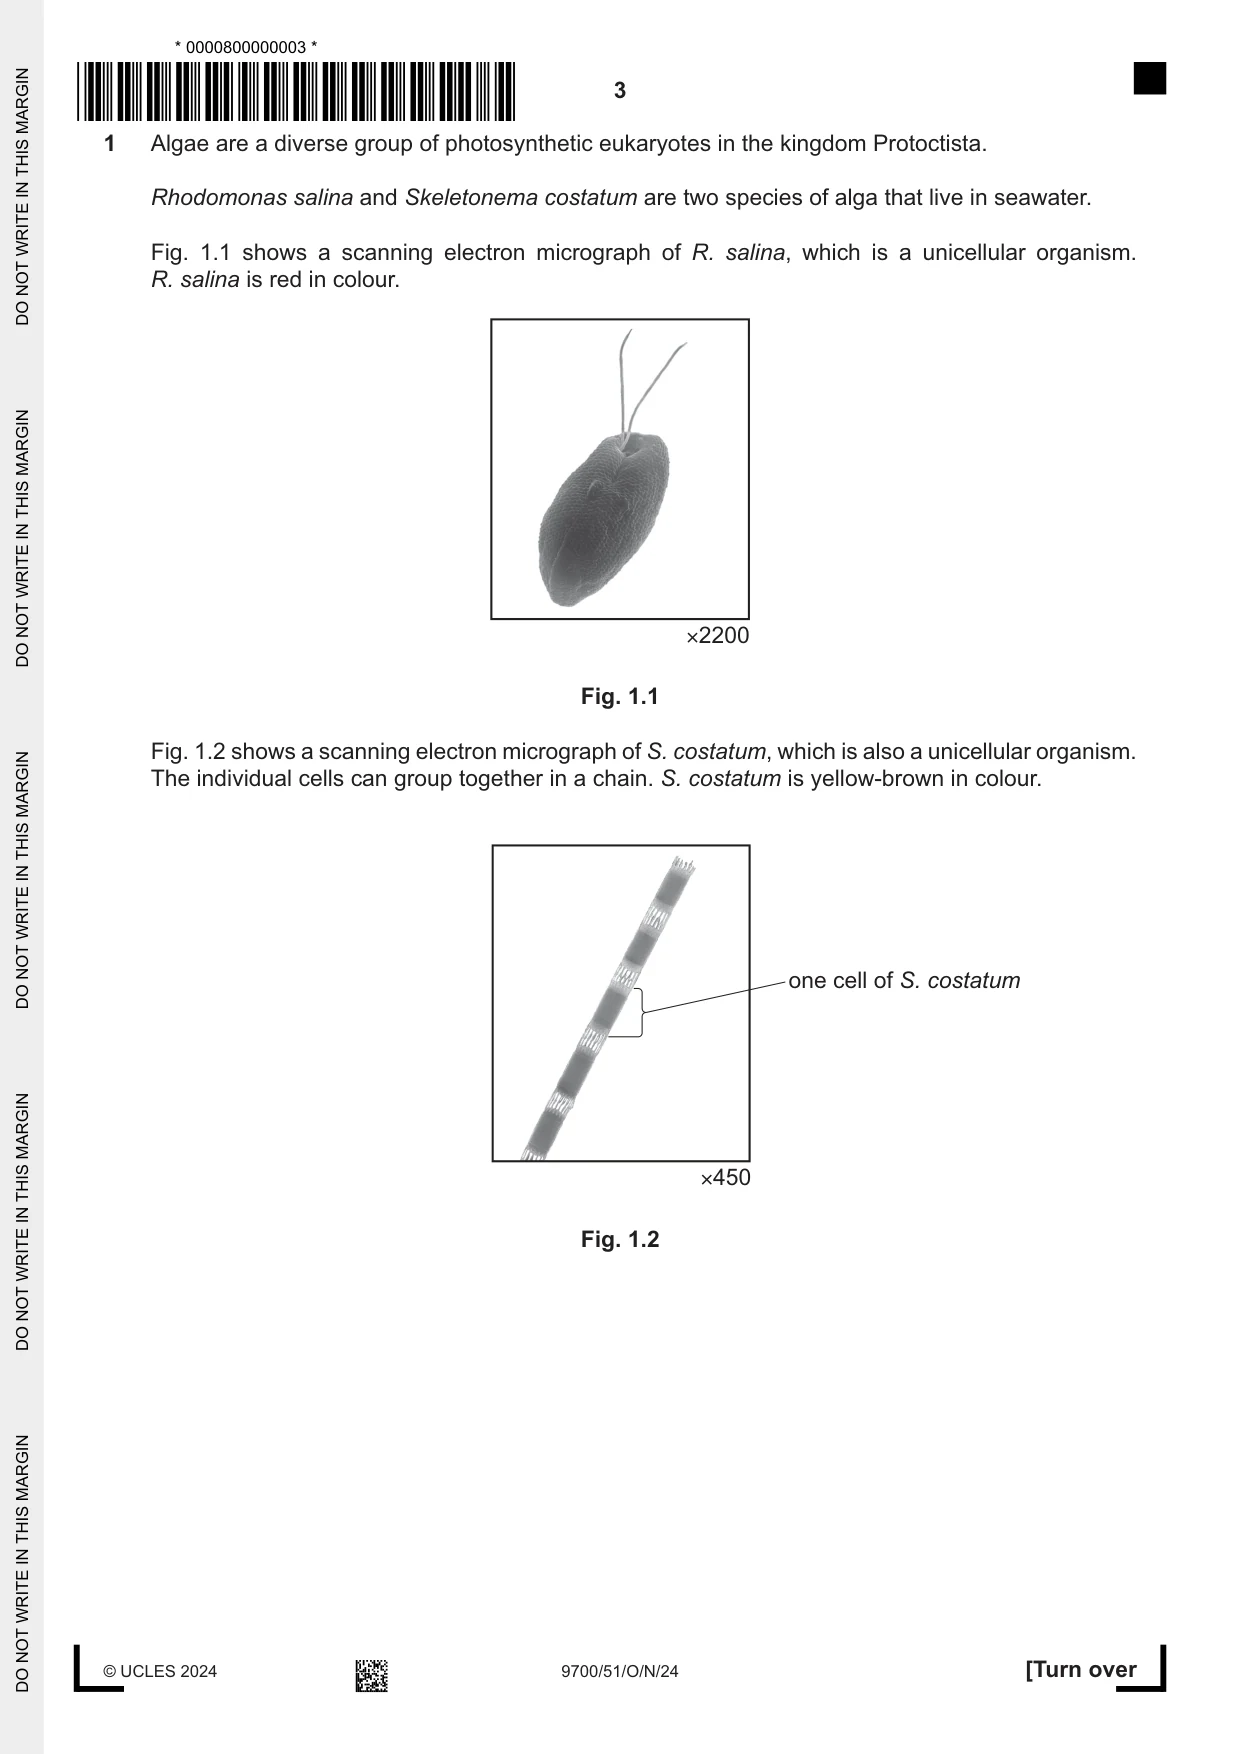
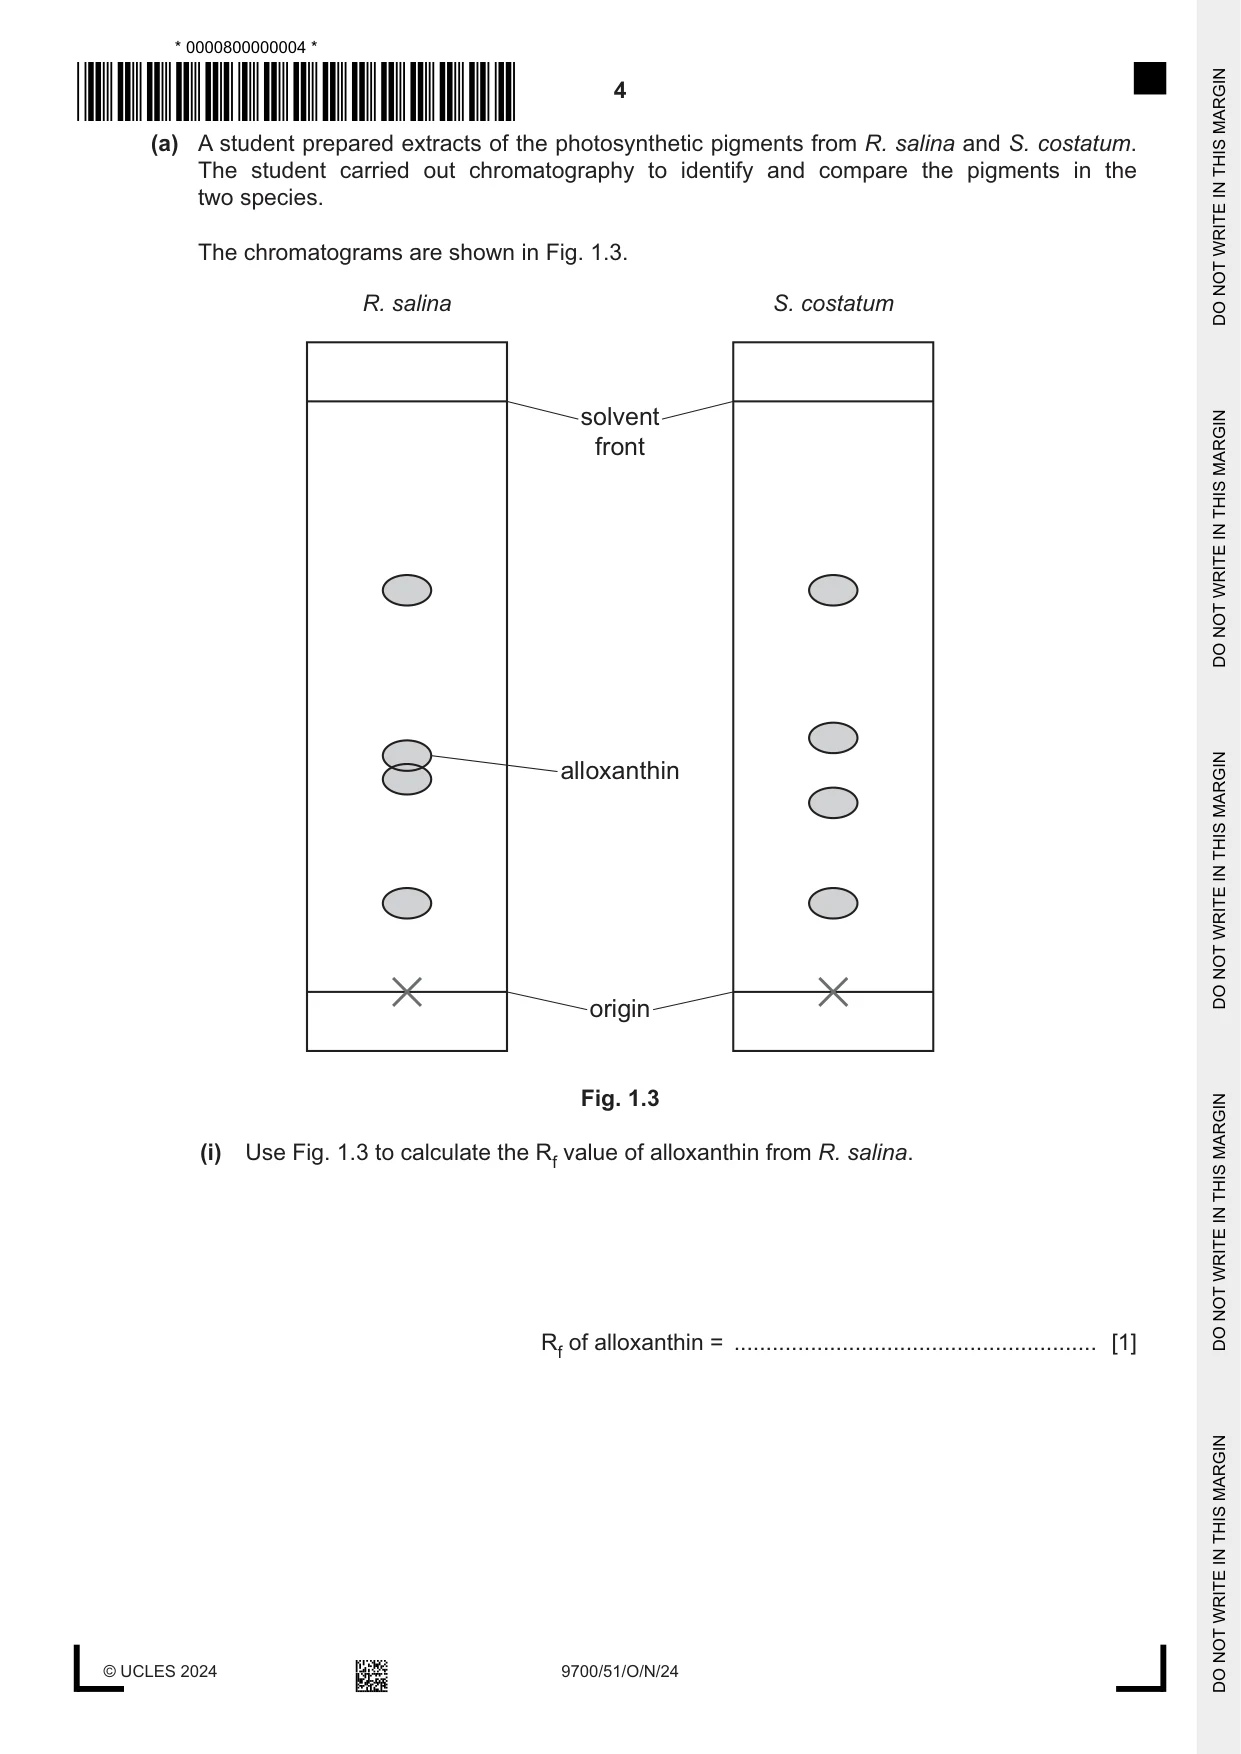
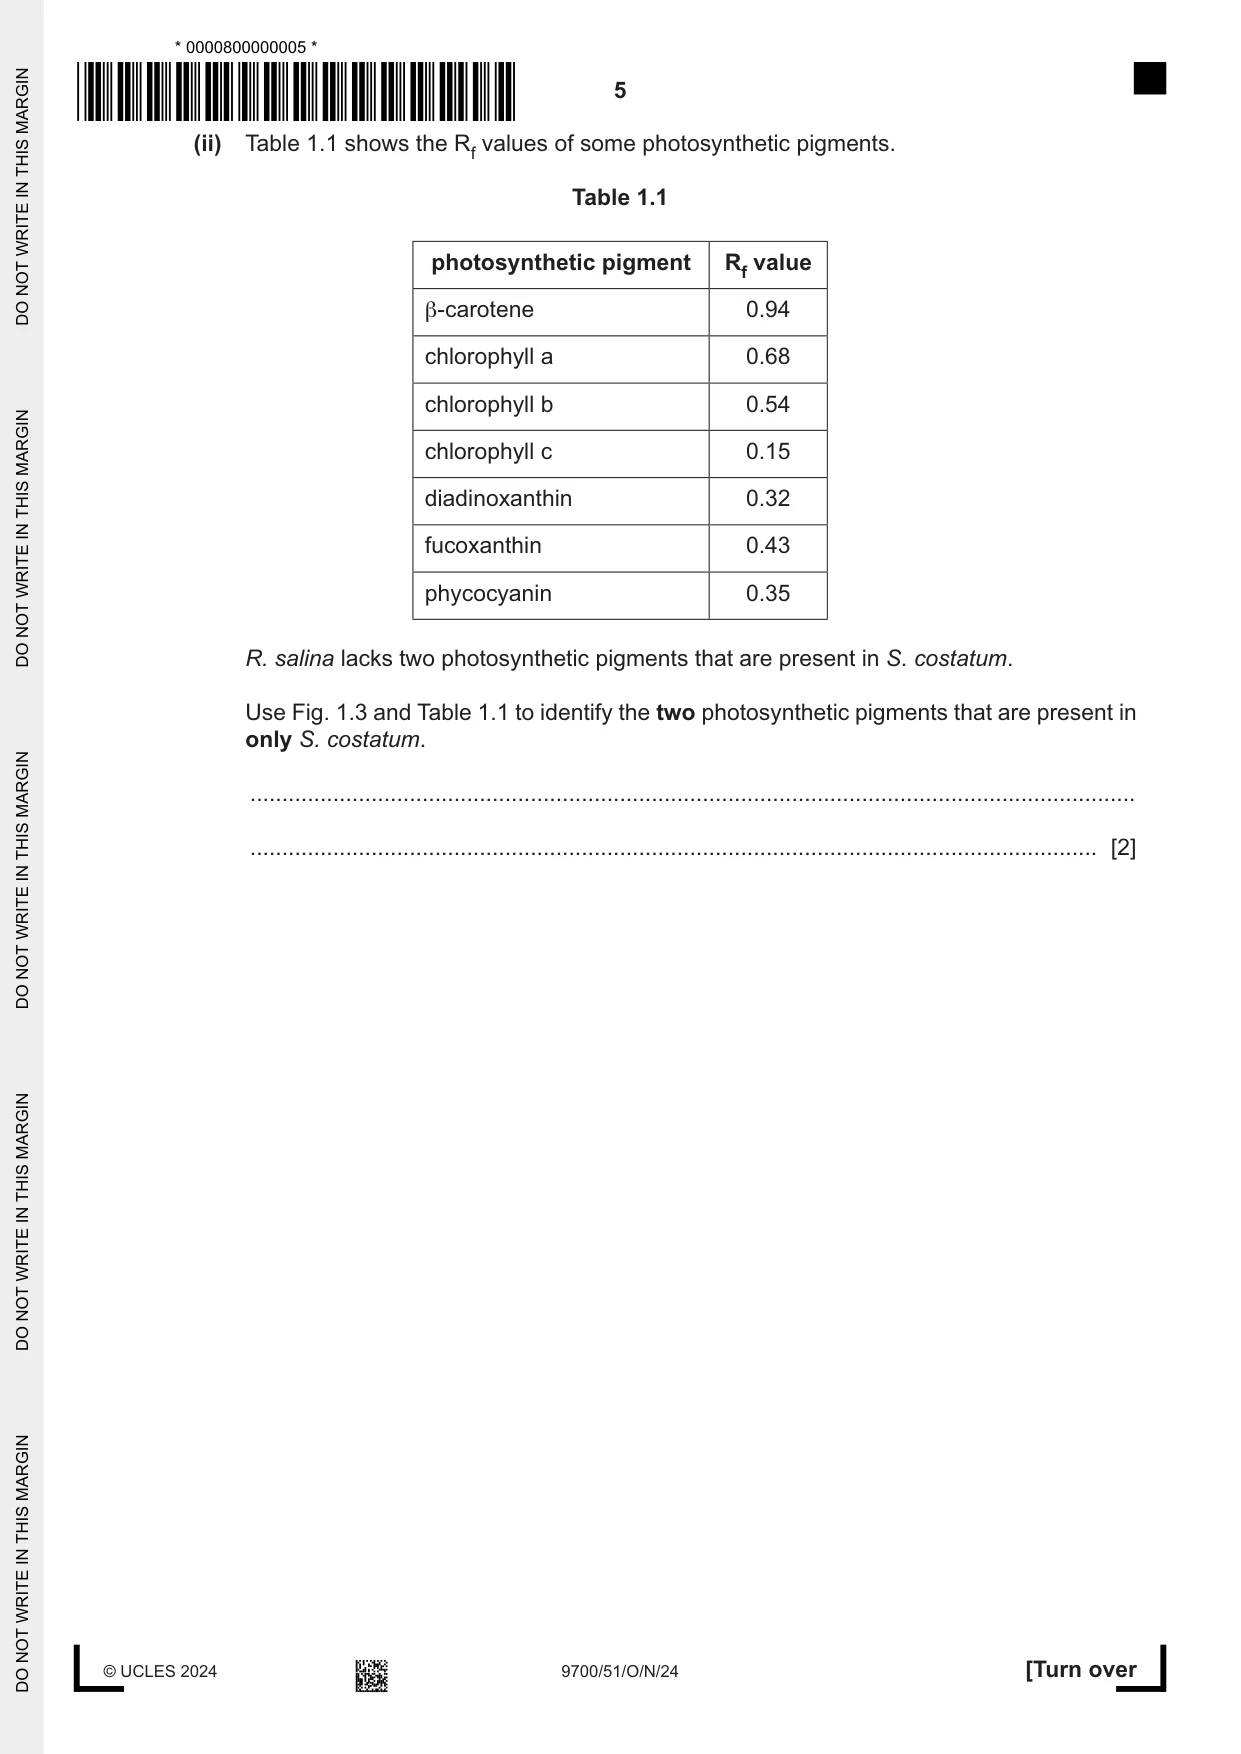
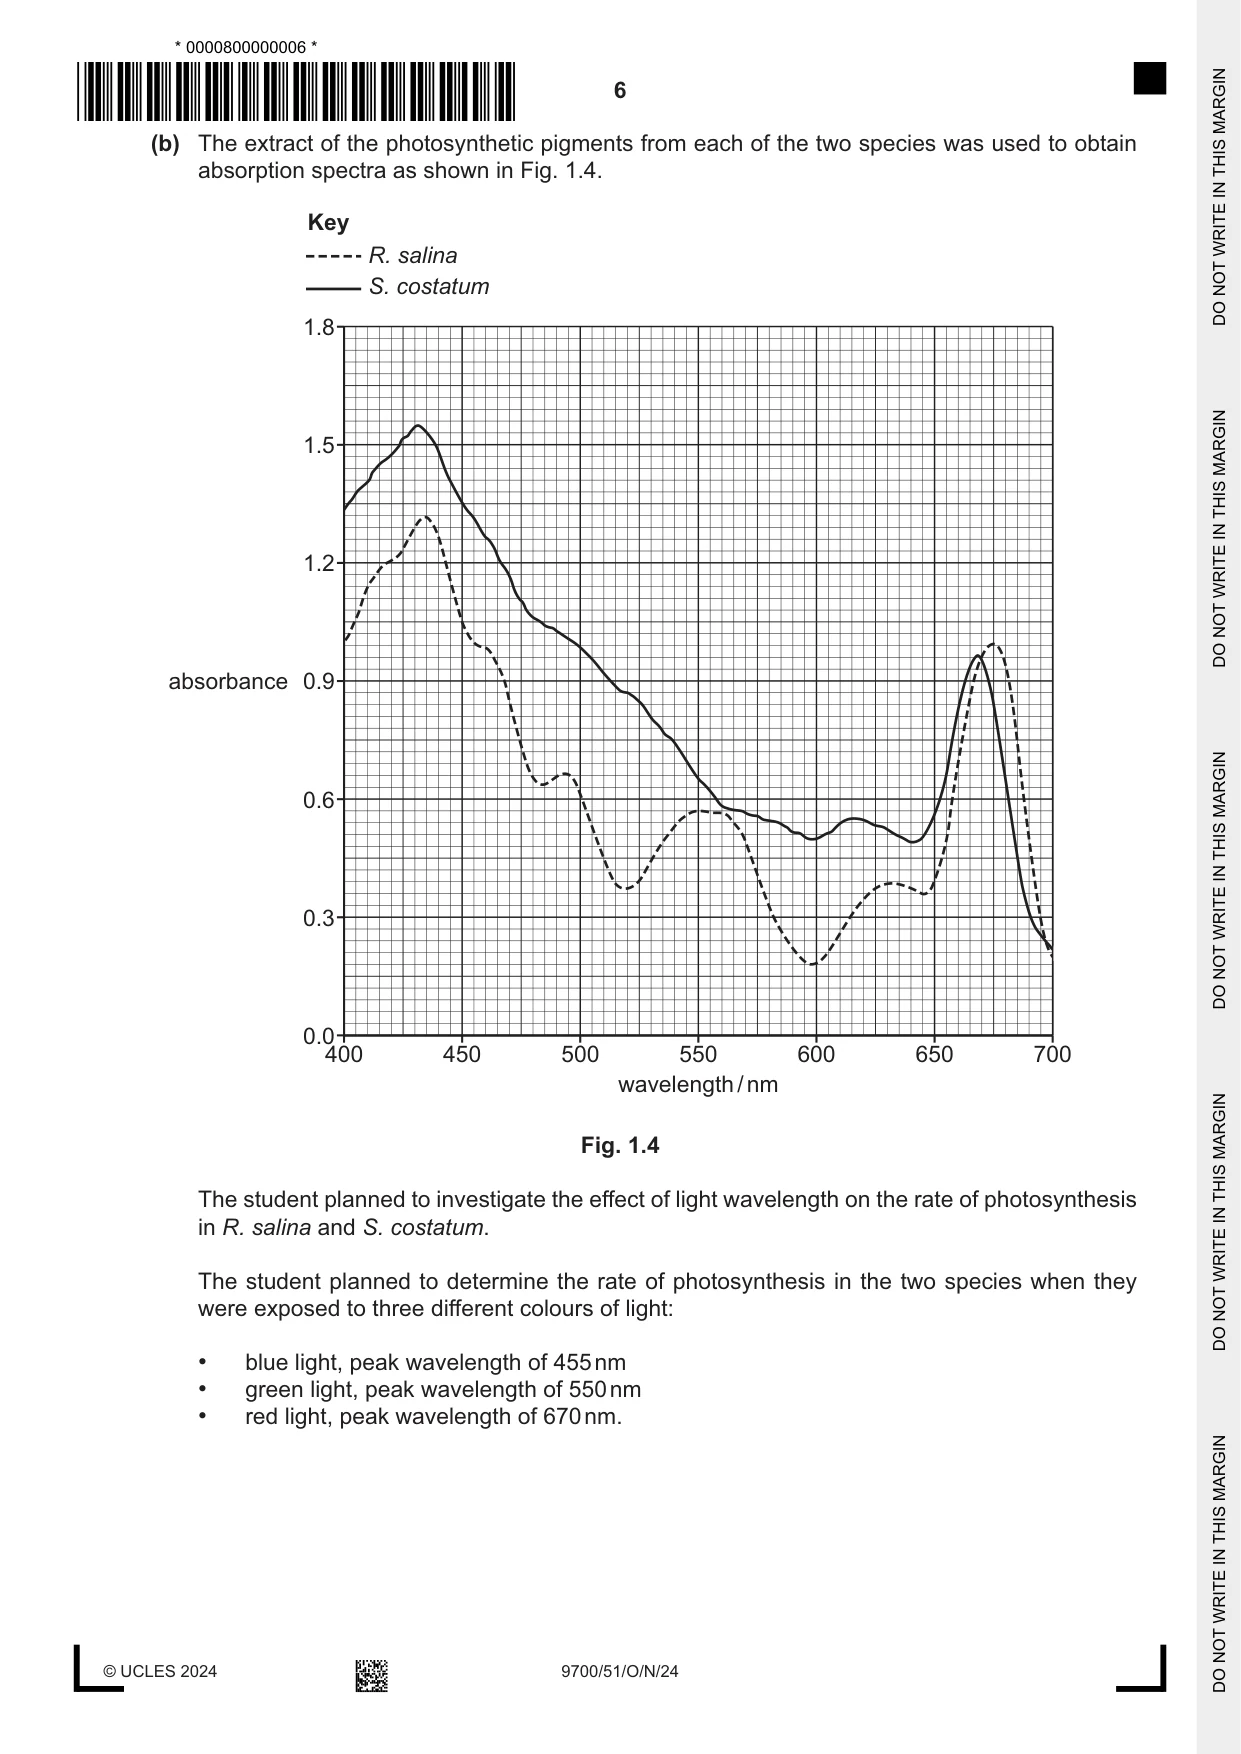
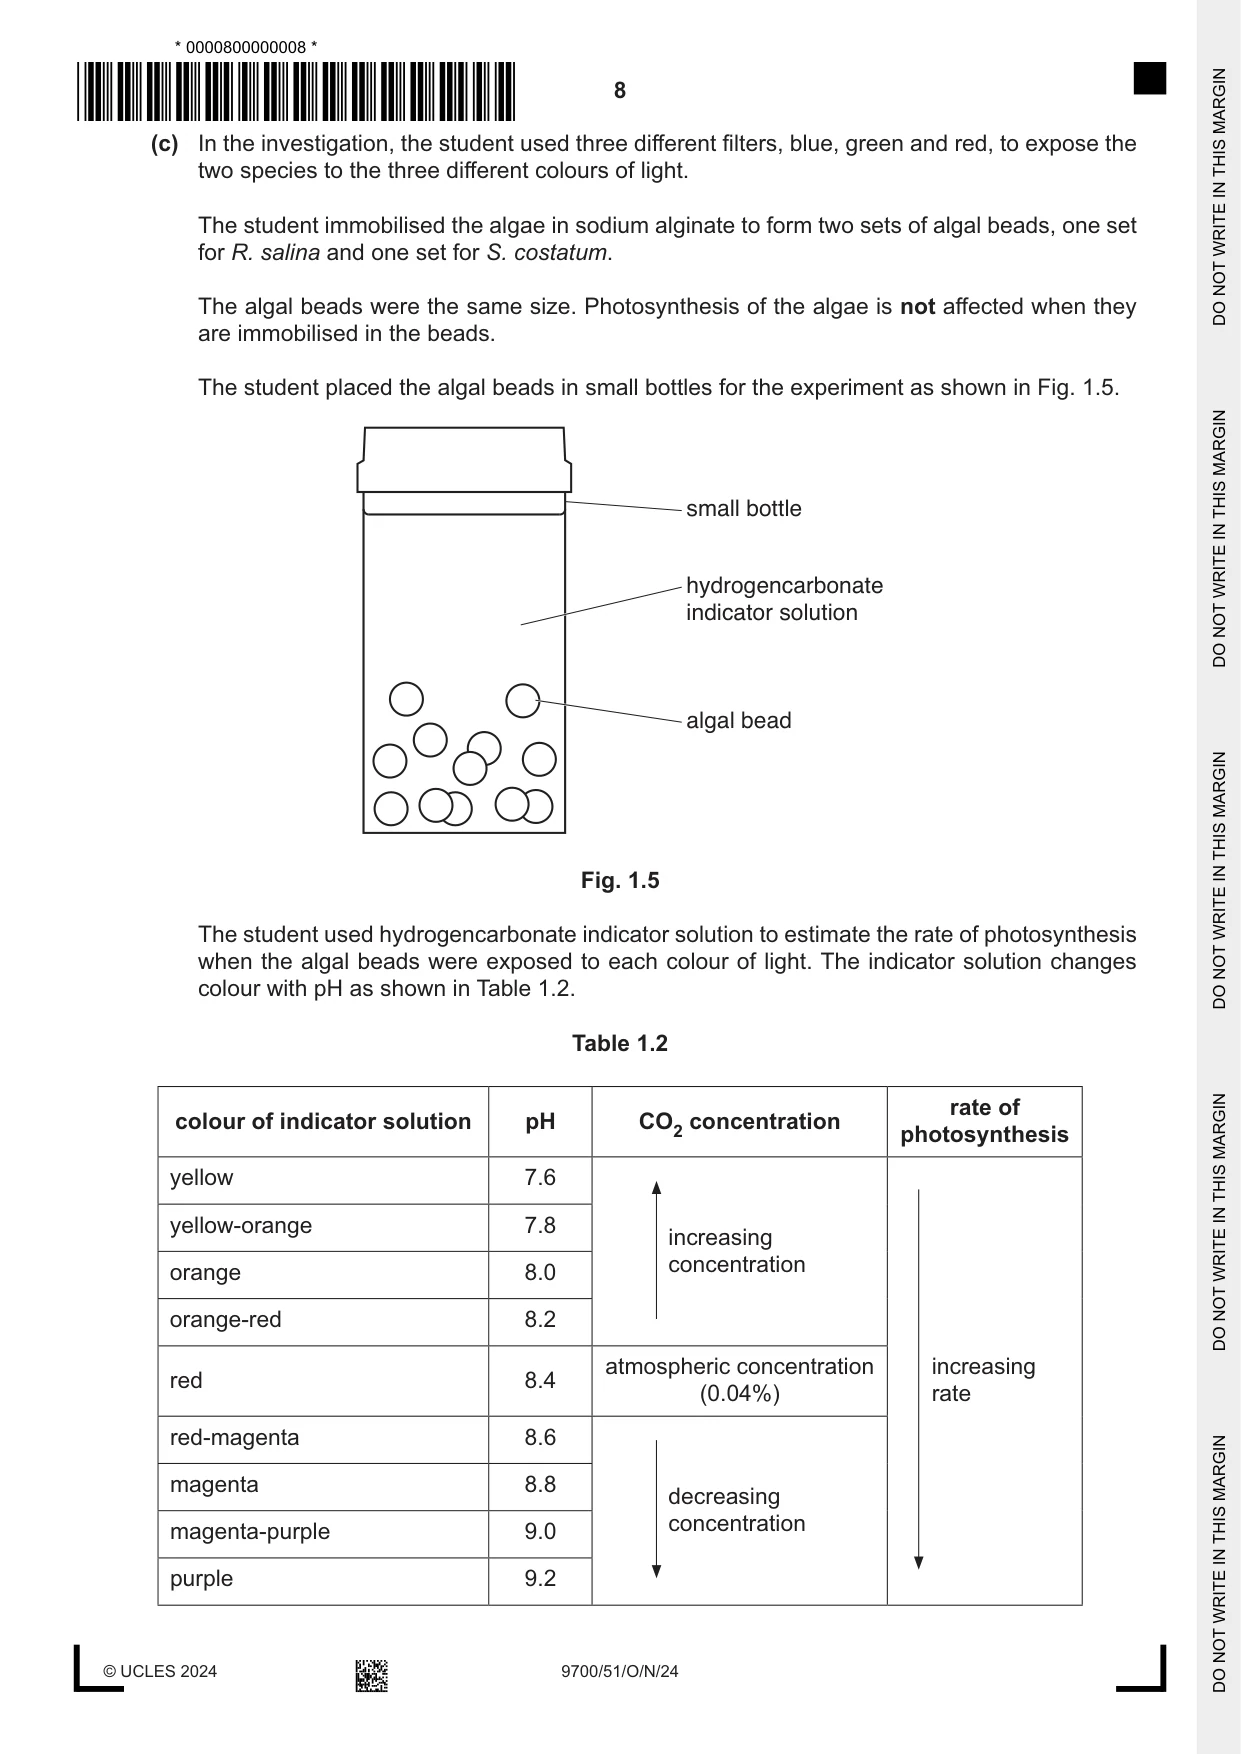
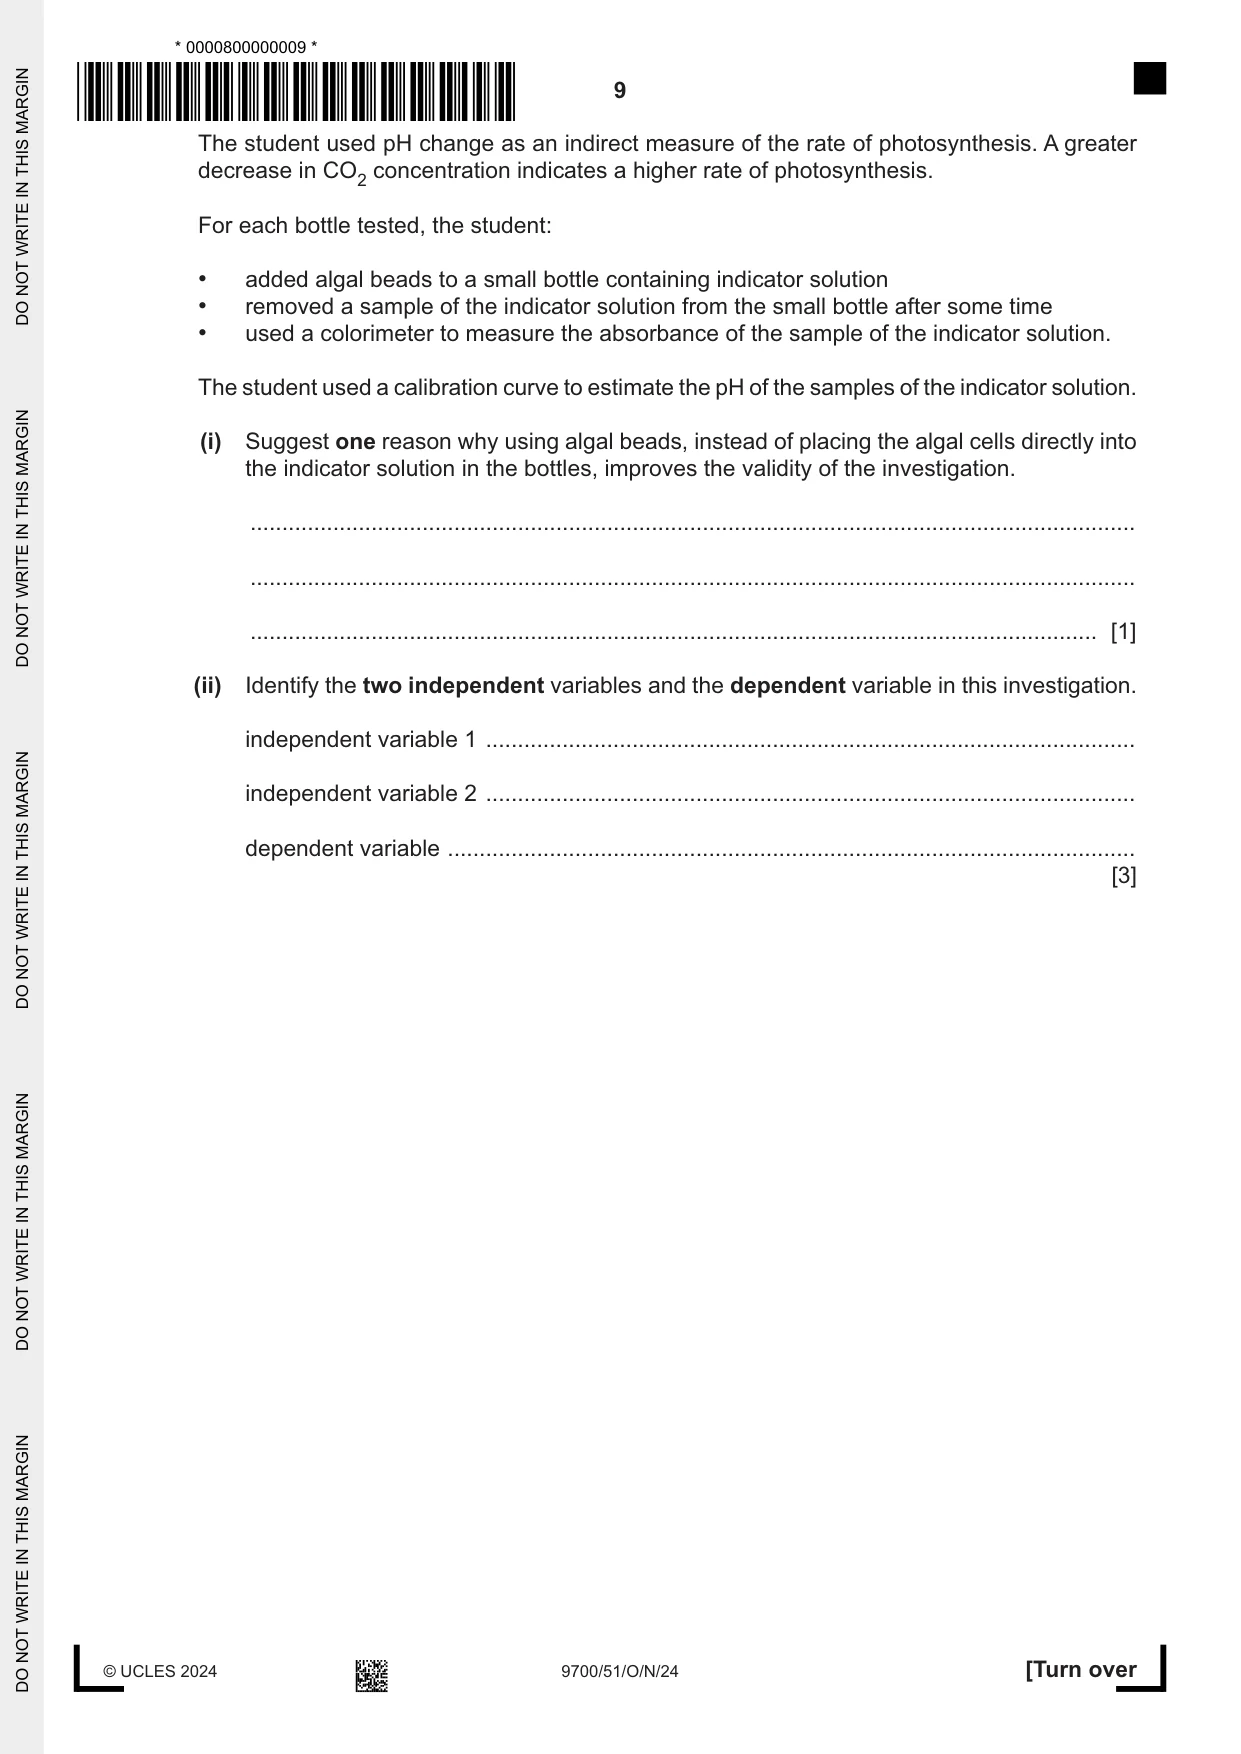
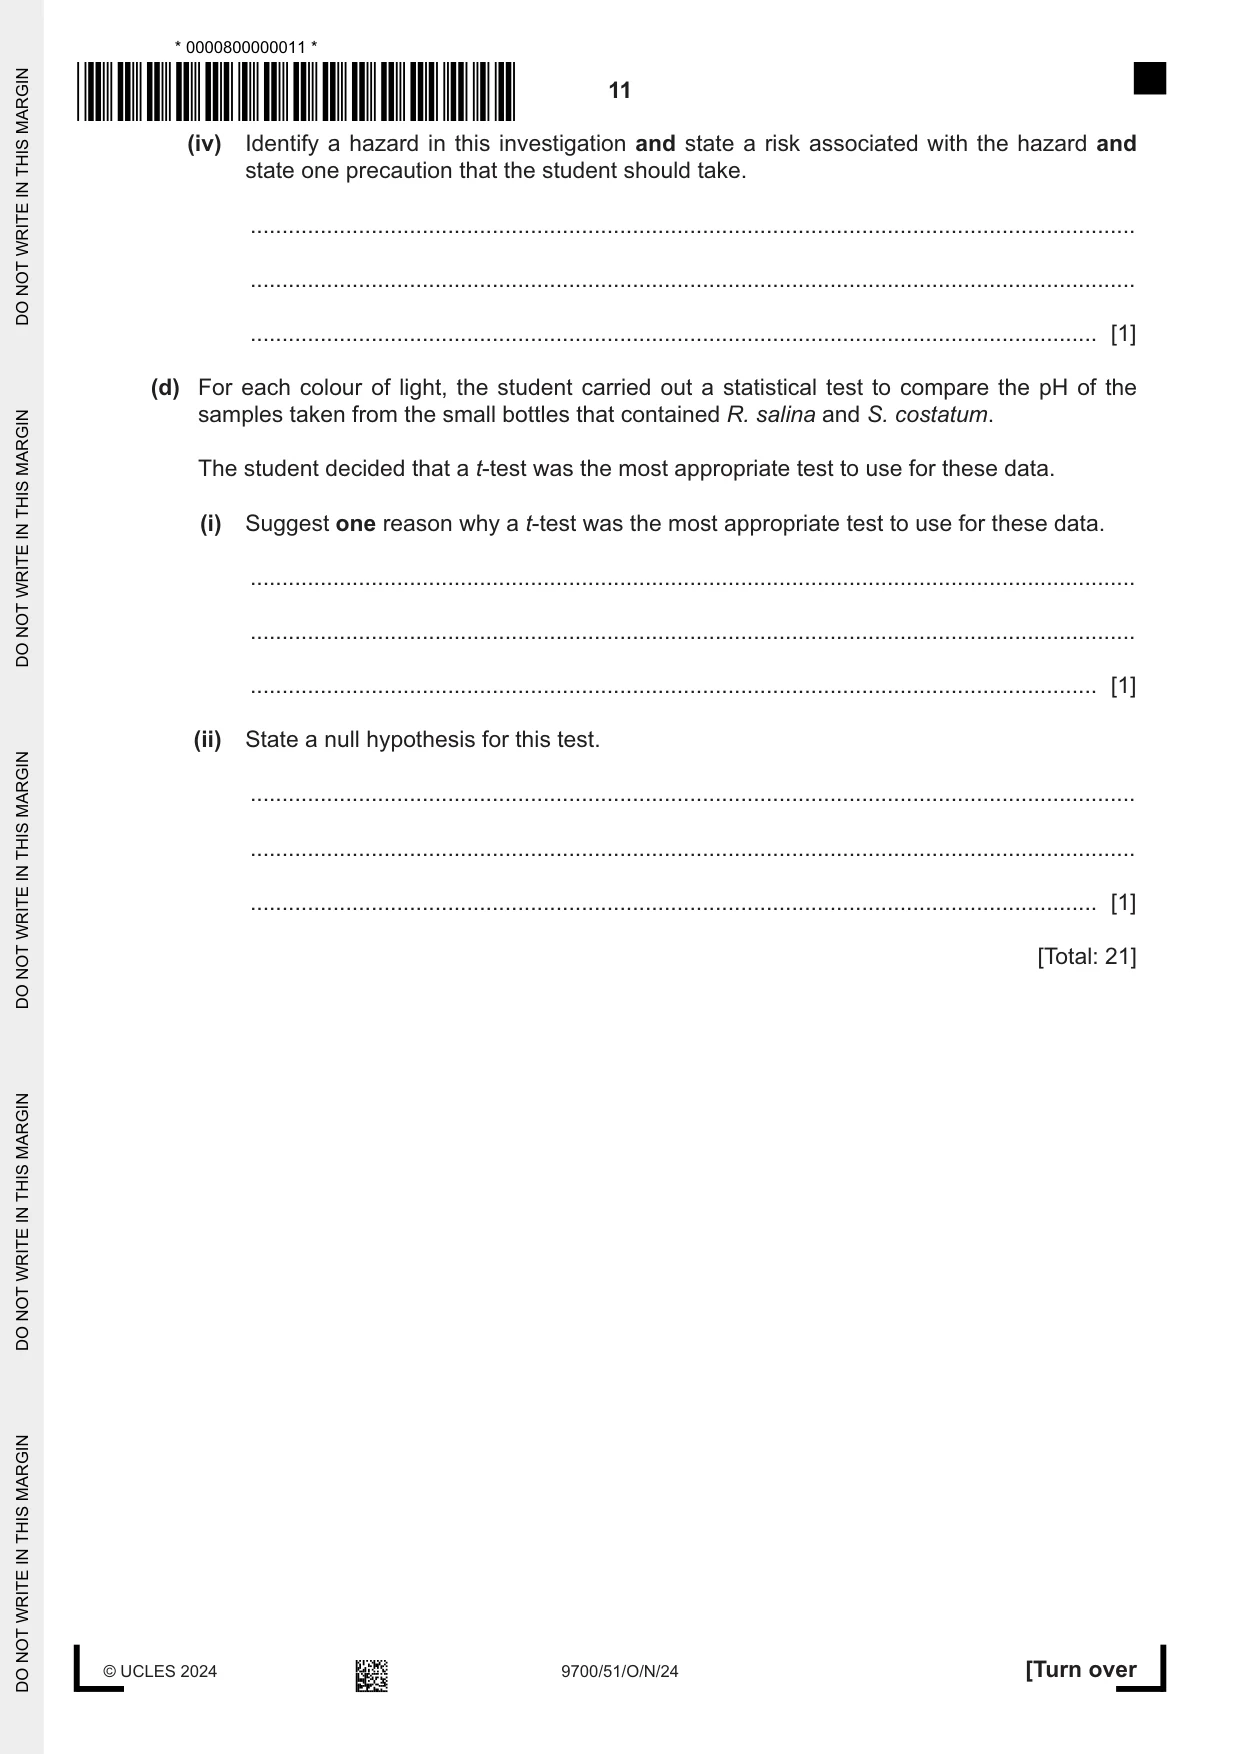
1 Algae are a diverse group of photosynthetic eukaryotes in the kingdom Protoctista. Rhodomonas salina and Skeletonema costatum are two species of alga that live in seawater. Fig. 1.1 shows a scanning electron micrograph of R. salina, which is a unicellular organism. R. salina is red in colour. ×2200 Fig. 1.1 Fig. 1.2 shows a scanning electron micrograph of S. costatum, which is also a unicellular organism. The individual cells can group together in a chain. S. costatum is yellow‑brown in colour. one cell of S. costatum ×450 Fig. 1.2 (a) A student prepared extracts of the photosynthetic pigments from R. salina and S. costatum. The student carried out chromatography to identify and compare the pigments in the two species. The chromatograms are shown in Fig. 1.3. R. salina S. costatum solvent front alloxanthin origin Fig. 1.3 (i) Use Fig. 1.3 to calculate the Rf value of alloxanthin from R. salina. Rf of alloxanthin = ......................................................... [1] (ii) Table 1.1 shows the Rf values of some photosynthetic pigments. Table 1.1 photosynthetic pigment Rf value β‑carotene 0.94 chlorophyll a 0.68 chlorophyll b 0.54 chlorophyll c 0.15 diadinoxanthin 0.32 fucoxanthin 0.43 phycocyanin 0.35 R. salina lacks two photosynthetic pigments that are present in S. costatum. Use Fig. 1.3 and Table 1.1 to identify the two photosynthetic pigments that are present in only S. costatum. ........................................................................................................................................... ..................................................................................................................................... [2] (b) The extract of the photosynthetic pigments from each of the two species was used to obtain absorption spectra as shown in Fig. 1.4. Key R. salina S. costatum 1.8 1.5 1.2 absorbance 0.9 0.6 0.3 0.0 400 450 500 550 600 650 700 wavelength / nm Fig. 1.4 The student planned to investigate the effect of light wavelength on the rate of photosynthesis in R. salina and S. costatum. The student planned to determine the rate of photosynthesis in the two species when they were exposed to three different colours of light: • blue light, peak wavelength of 455 nm • green light, peak wavelength of 550 nm • red light, peak wavelength of 670 nm. Use Fig. 1.4 to compare the expected rates of photosynthesis for the two species in blue, green and red light. blue light .................................................................................................................................... ................................................................................................................................................... ................................................................................................................................................... green light ................................................................................................................................. ................................................................................................................................................... ................................................................................................................................................... red light ..................................................................................................................................... ................................................................................................................................................... ................................................................................................................................................... [3] (c) In the investigation, the student used three different filters, blue, green and red, to expose the two species to the three different colours of light. The student immobilised the algae in sodium alginate to form two sets of algal beads, one set for R. salina and one set for S. costatum. The algal beads were the same size. Photosynthesis of the algae is not affected when they are immobilised in the beads. The student placed the algal beads in small bottles for the experiment as shown in Fig. 1.5. small bottle hydrogencarbonate indicator solution algal bead Fig. 1.5 The student used hydrogencarbonate indicator solution to estimate the rate of photosynthesis when the algal beads were exposed to each colour of light. The indicator solution changes colour with pH as shown in Table 1.2. Table 1.2 rate of colour of indicator solution pH CO2 concentration photosynthesis yellow 7.6 yellow‑orange 7.8 increasing concentration orange 8.0 orange‑red 8.2 atmospheric concentration increasing red 8.4 (0.04%) rate red‑magenta 8.6 magenta 8.8 decreasing concentration magenta‑purple 9.0 purple 9.2 The student used pH change as an indirect measure of the rate of photosynthesis. A greater decrease in CO2 concentration indicates a higher rate of photosynthesis. For each bottle tested, the student: • added algal beads to a small bottle containing indicator solution • removed a sample of the indicator solution from the small bottle after some time • used a colorimeter to measure the absorbance of the sample of the indicator solution. The student used a calibration curve to estimate the pH of the samples of the indicator solution. (i) Suggest one reason why using algal beads, instead of placing the algal cells directly into the indicator solution in the bottles, improves the validity of the investigation. ........................................................................................................................................... ........................................................................................................................................... ..................................................................................................................................... [1] (ii) Identify the two independent variables and the dependent variable in this investigation. independent variable 1 ...................................................................................................... independent variable 2 ...................................................................................................... dependent variable ............................................................................................................ [3] (iii) In addition to the colour filters, algal beads, small bottles, indicator solution and a colorimeter, the student had access to standard laboratory equipment. The student carried out the investigation in a temperature‑controlled room. Describe a method the student could use to collect sufficient data so that the rates of photosynthesis of both species of alga in the three colours of light can be compared. The description of your method should be set out in a logical way and be detailed enough for another person to follow. You should not include a risk assessment or details of how to prepare the algal beads. ........................................................................................................................................... ........................................................................................................................................... ........................................................................................................................................... ........................................................................................................................................... ........................................................................................................................................... ........................................................................................................................................... ........................................................................................................................................... ........................................................................................................................................... ........................................................................................................................................... ........................................................................................................................................... ........................................................................................................................................... ........................................................................................................................................... ........................................................................................................................................... ........................................................................................................................................... ........................................................................................................................................... ........................................................................................................................................... ........................................................................................................................................... ........................................................................................................................................... ........................................................................................................................................... ........................................................................................................................................... ........................................................................................................................................... ..................................................................................................................................... [8] (iv) Identify a hazard in this investigation and state a risk associated with the hazard and state one precaution that the student should take. ........................................................................................................................................... ........................................................................................................................................... ..................................................................................................................................... [1] (d) For each colour of light, the student carried out a statistical test to compare the pH of the samples taken from the small bottles that contained R. salina and S. costatum. The student decided that a t‑test was the most appropriate test to use for these data. (i) Suggest one reason why a t‑test was the most appropriate test to use for these data. ........................................................................................................................................... ........................................................................................................................................... ..................................................................................................................................... [1] (ii) State a null hypothesis for this test. ........................................................................................................................................... ........................................................................................................................................... ..................................................................................................................................... [1] [Total: 21]
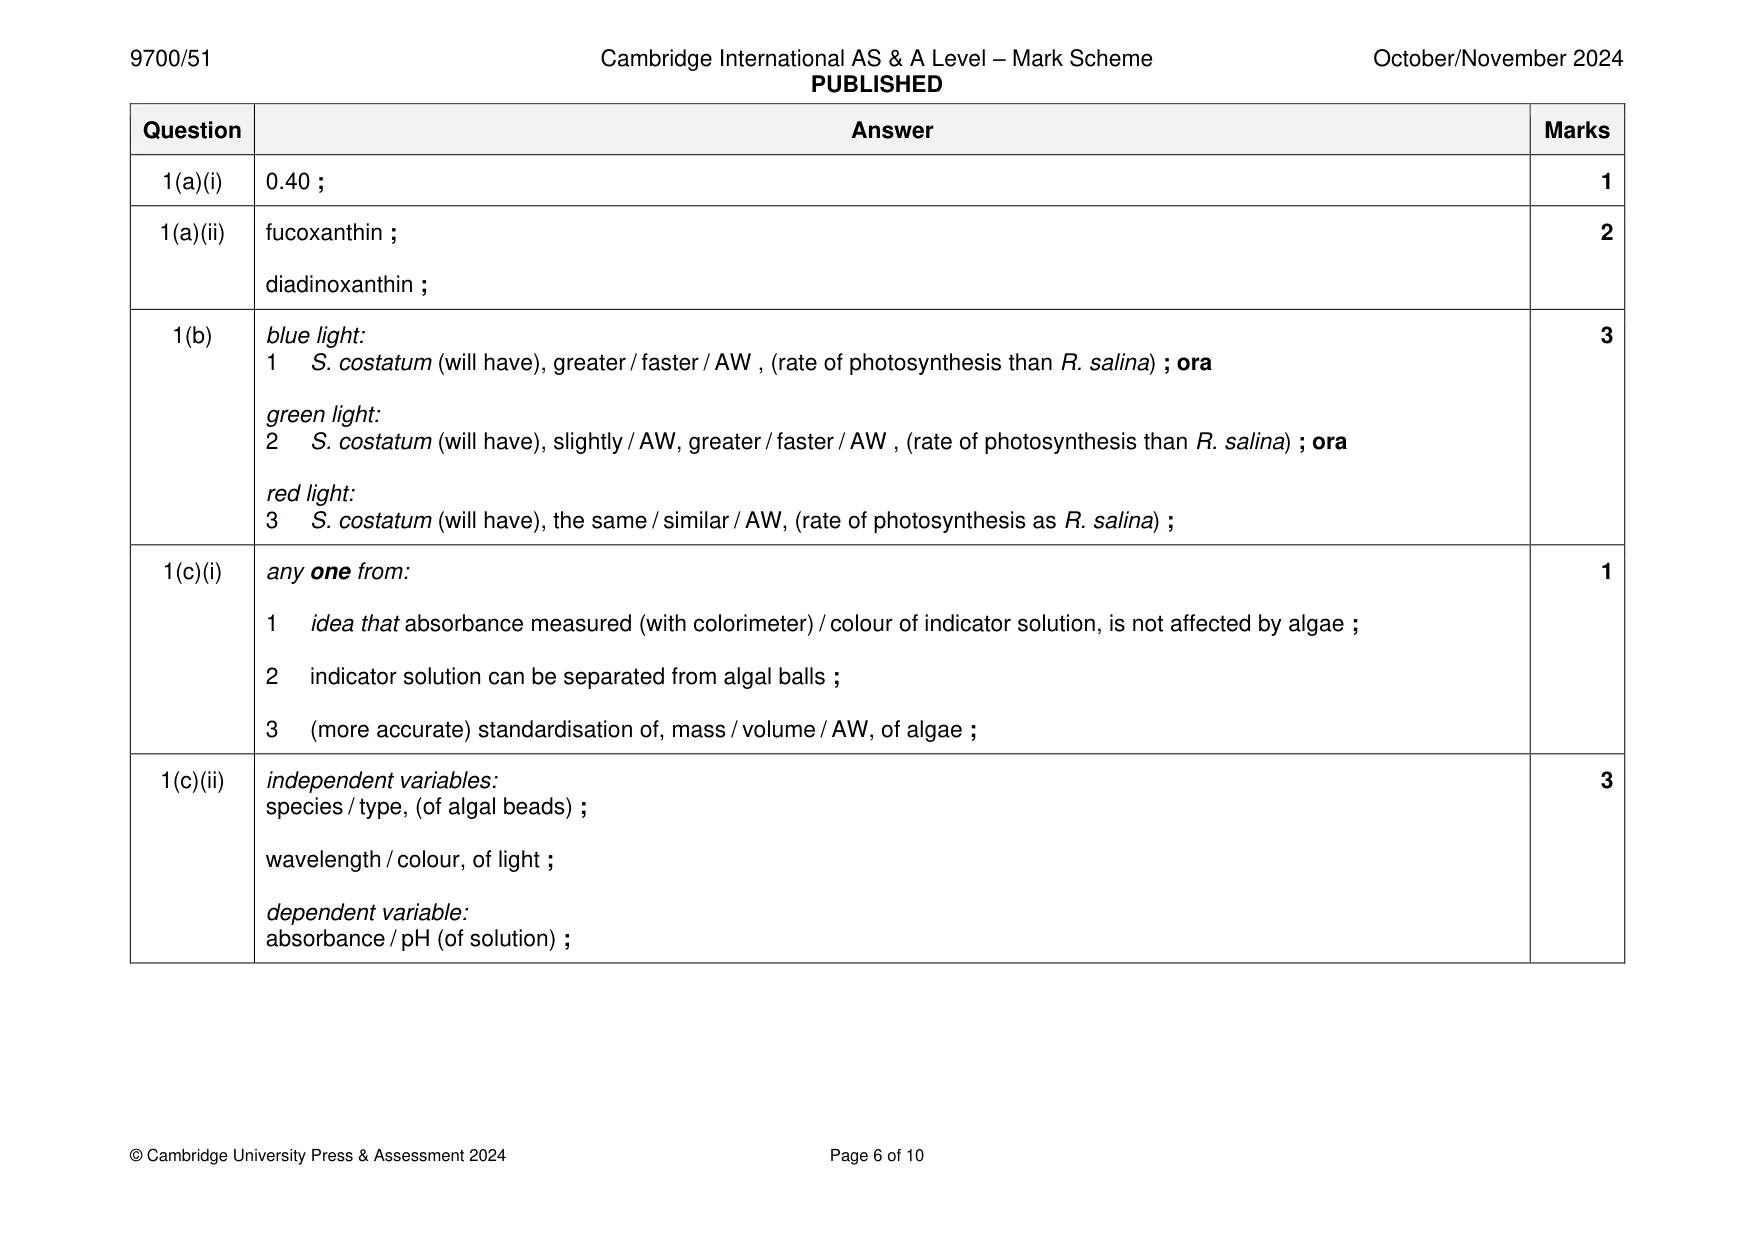
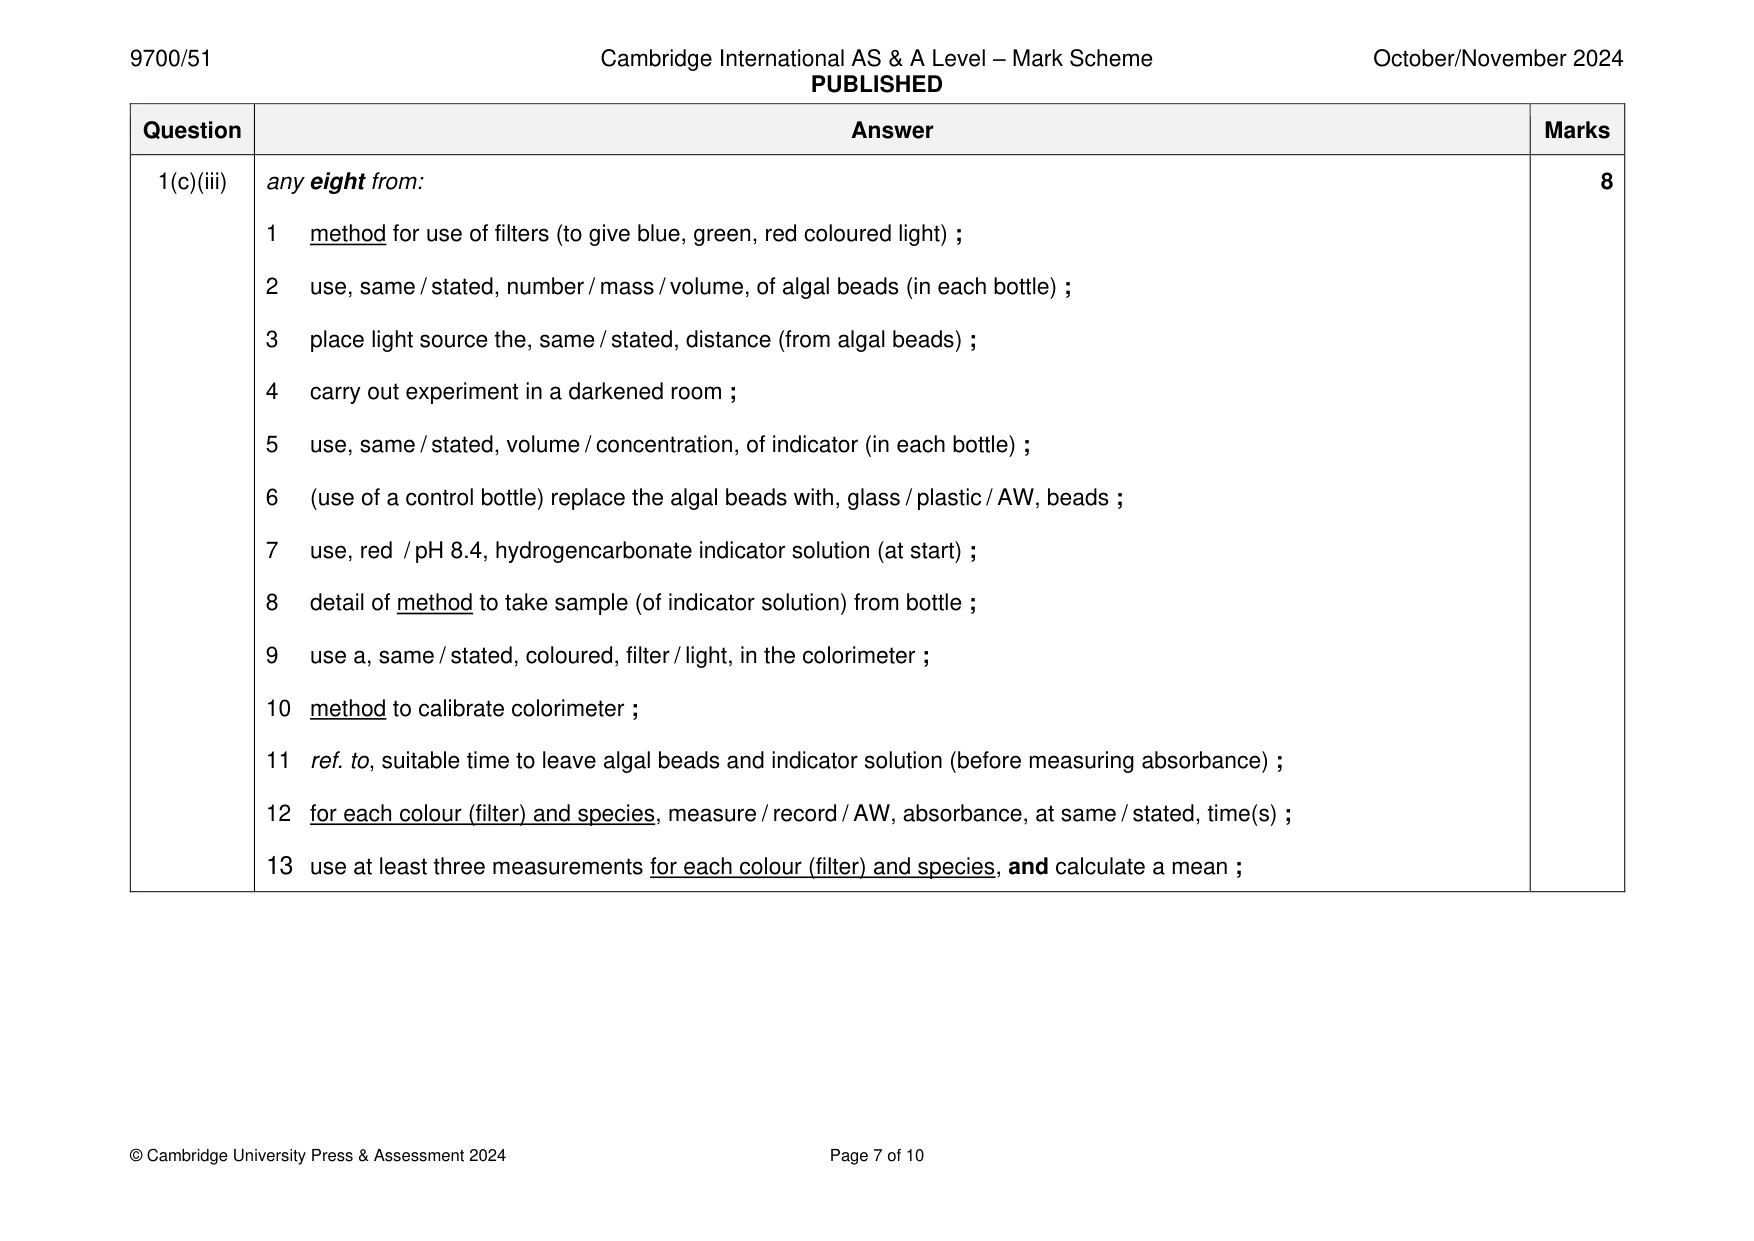
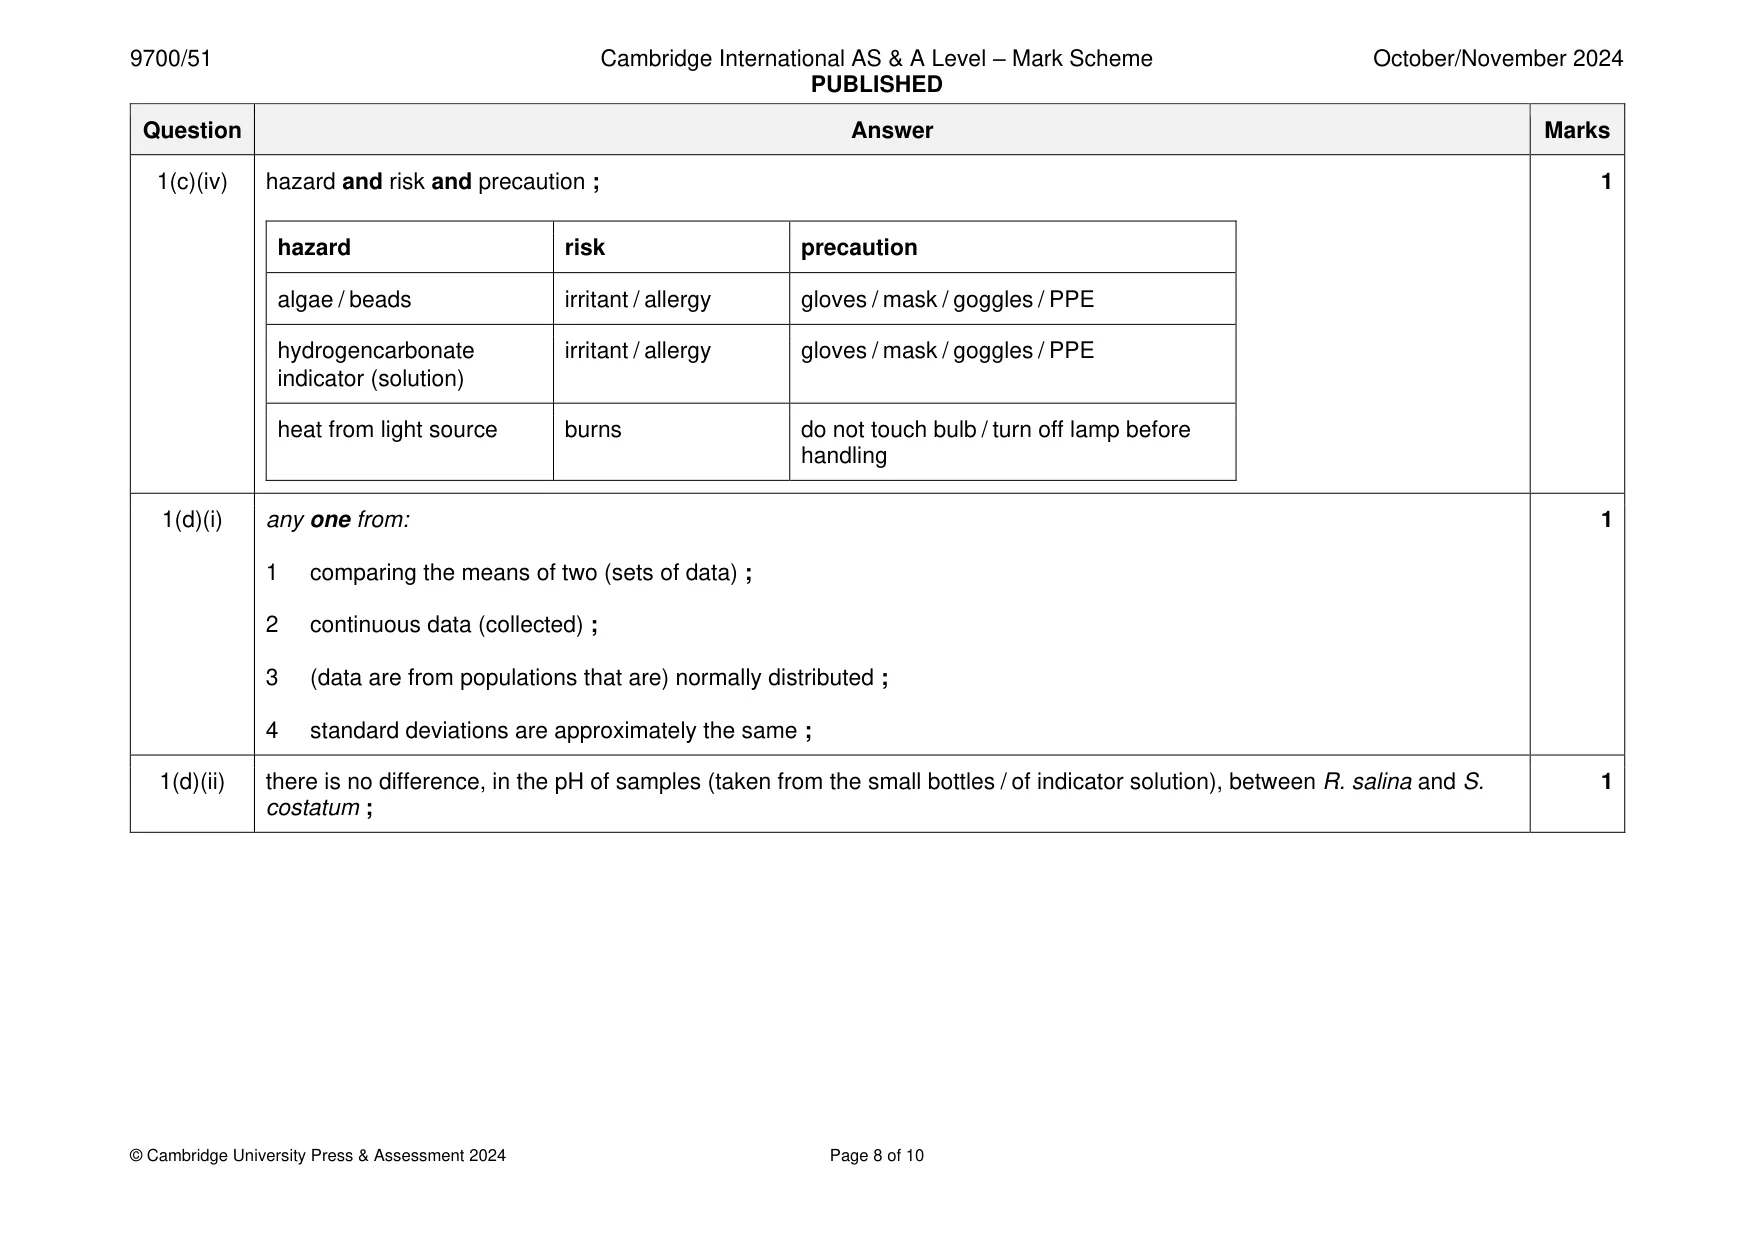
Mark scheme: Question Answer Marks 1(a)(i) 0.40 ; 1 1(a)(ii) fucoxanthin ; 2 diadinoxanthin ; 1(b) blue light: 3 1 S. costatum (will have), greater / faster / AW , (rate of photosynthesis than R. salina) ; ora green light: 2 S. costatum (will have), slightly / AW, greater / faster / AW , (rate of photosynthesis than R. salina) ; ora red light: 3 S. costatum (will have), the same / similar / AW, (rate of photosynthesis as R. salina) ; 1(c)(i) any one from: 1 1 idea that absorbance measured (with colorimeter) / colour of indicator solution, is not affected by algae ; 2 indicator solution can be separated from algal balls ; 3 (more accurate) standardisation of, mass / volume / AW, of algae ; 1(c)(ii) independent variables: 3 species / type, (of algal beads) ; wavelength / colour, of light ; dependent variable: absorbance / pH (of solution) ; 1(c)(iii) any eight from: 8 1 method for use of filters (to give blue, green, red coloured light) ; 2 use, same / stated, number / mass / volume, of algal beads (in each bottle) ; 3 place light source the, same / stated, distance (from algal beads) ; 4 carry out experiment in a darkened room ; 5 use, same / stated, volume / concentration, of indicator (in each bottle) ; 6 (use of a control bottle) replace the algal beads with, glass / plastic / AW, beads ; 7 use, red / pH 8.4, hydrogencarbonate indicator solution (at start) ; 8 detail of method to take sample (of indicator solution) from bottle ; 9 use a, same / stated, coloured, filter / light, in the colorimeter ; 10 method to calibrate colorimeter ; 11 ref. to, suitable time to leave algal beads and indicator solution (before measuring absorbance) ; 12 for each colour (filter) and species, measure / record / AW, absorbance, at same / stated, time(s) ; 13 use at least three measurements for each colour (filter) and species, and calculate a mean ; 1(c)(iv) hazard and risk and precaution ; 1 hazard risk precaution algae / beads irritant / allergy gloves / mask / goggles / PPE hydrogencarbonate irritant / allergy gloves / mask / goggles / PPE indicator (solution) heat from light source burns do not touch bulb / turn off lamp before handling 1(d)(i) any one from: 1 1 comparing the means of two (sets of data) ; 2 continuous data (collected) ; 3 (data are from populations that are) normally distributed ; 4 standard deviations are approximately the same ; 1(d)(ii) there is no difference, in the pH of samples (taken from the small bottles / of indicator solution), between R. salina and S. 1 costatum ;
Q2 · A group of ecologists investigated the biodiversity of two peat bog ecosystems, A and B
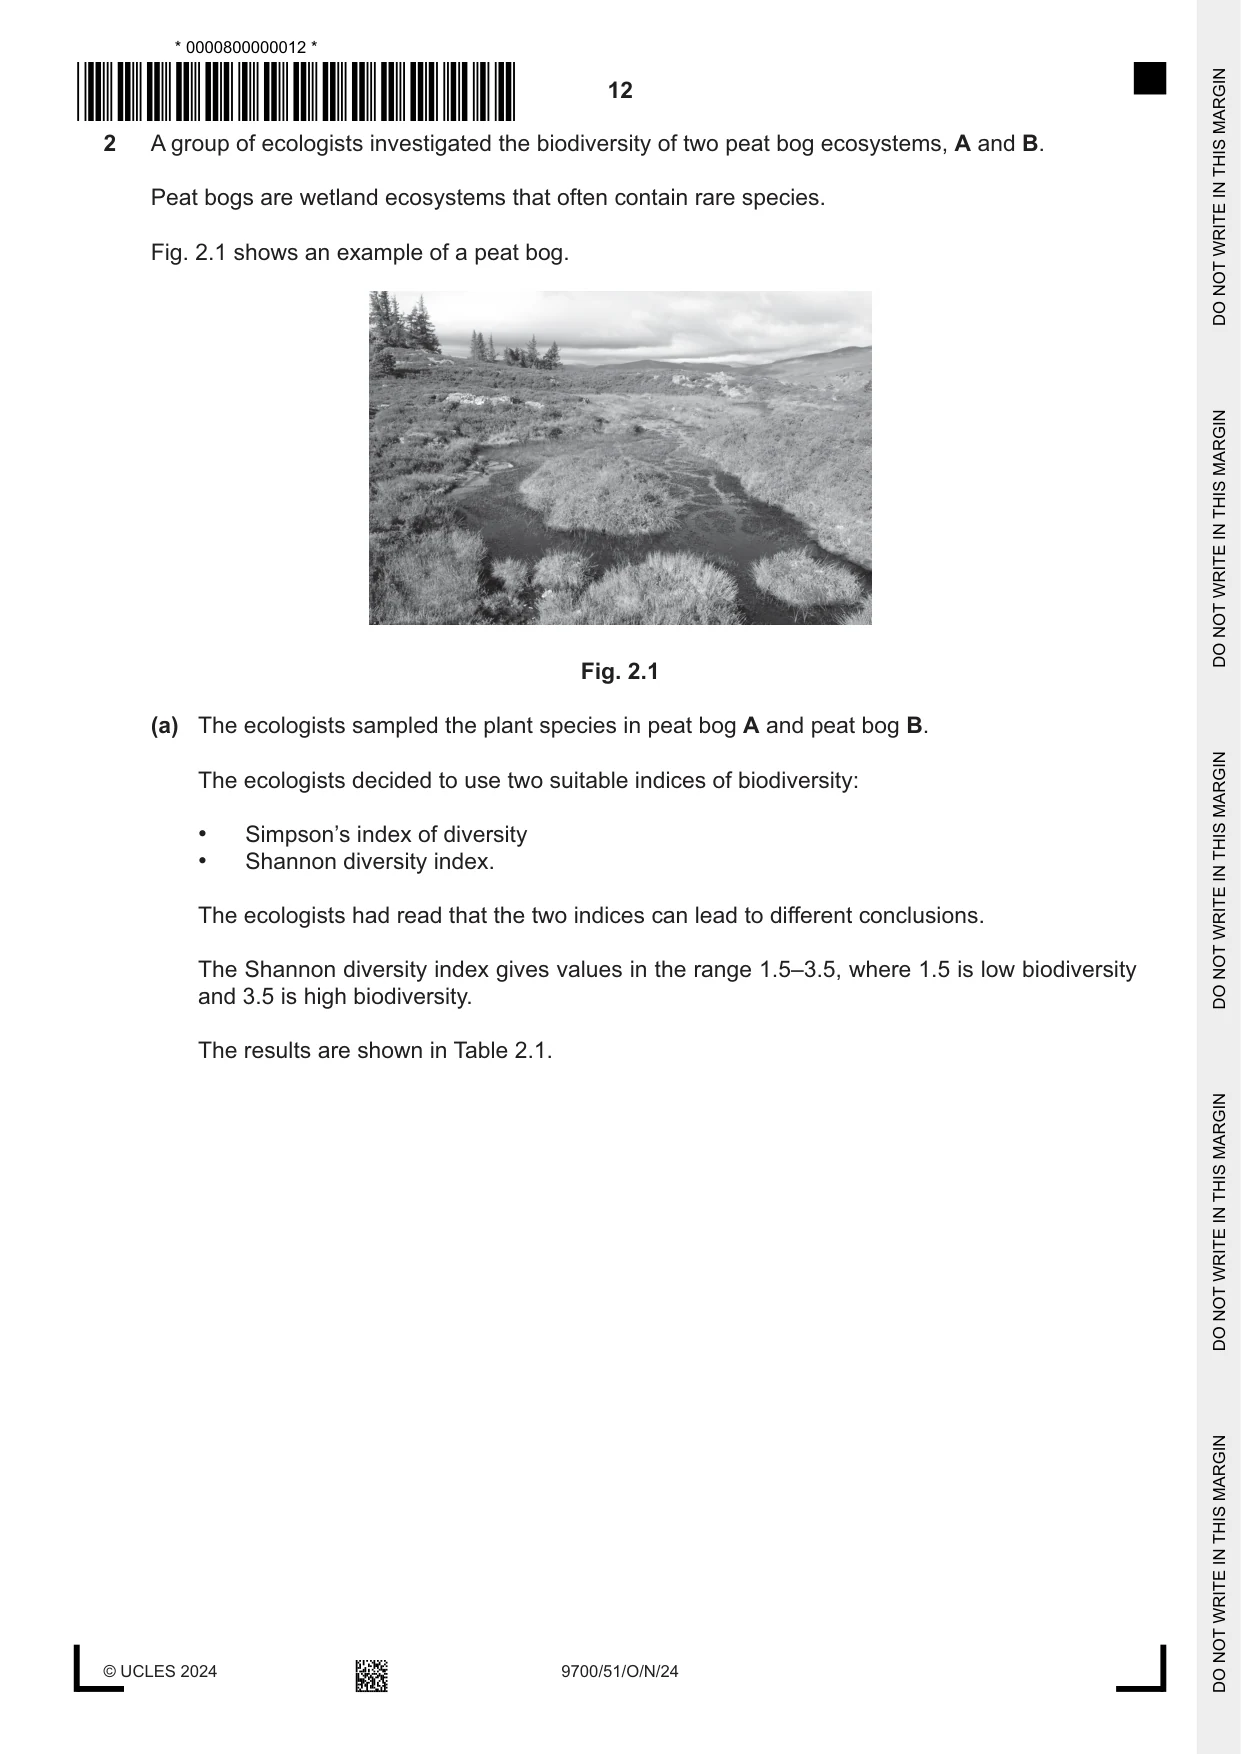
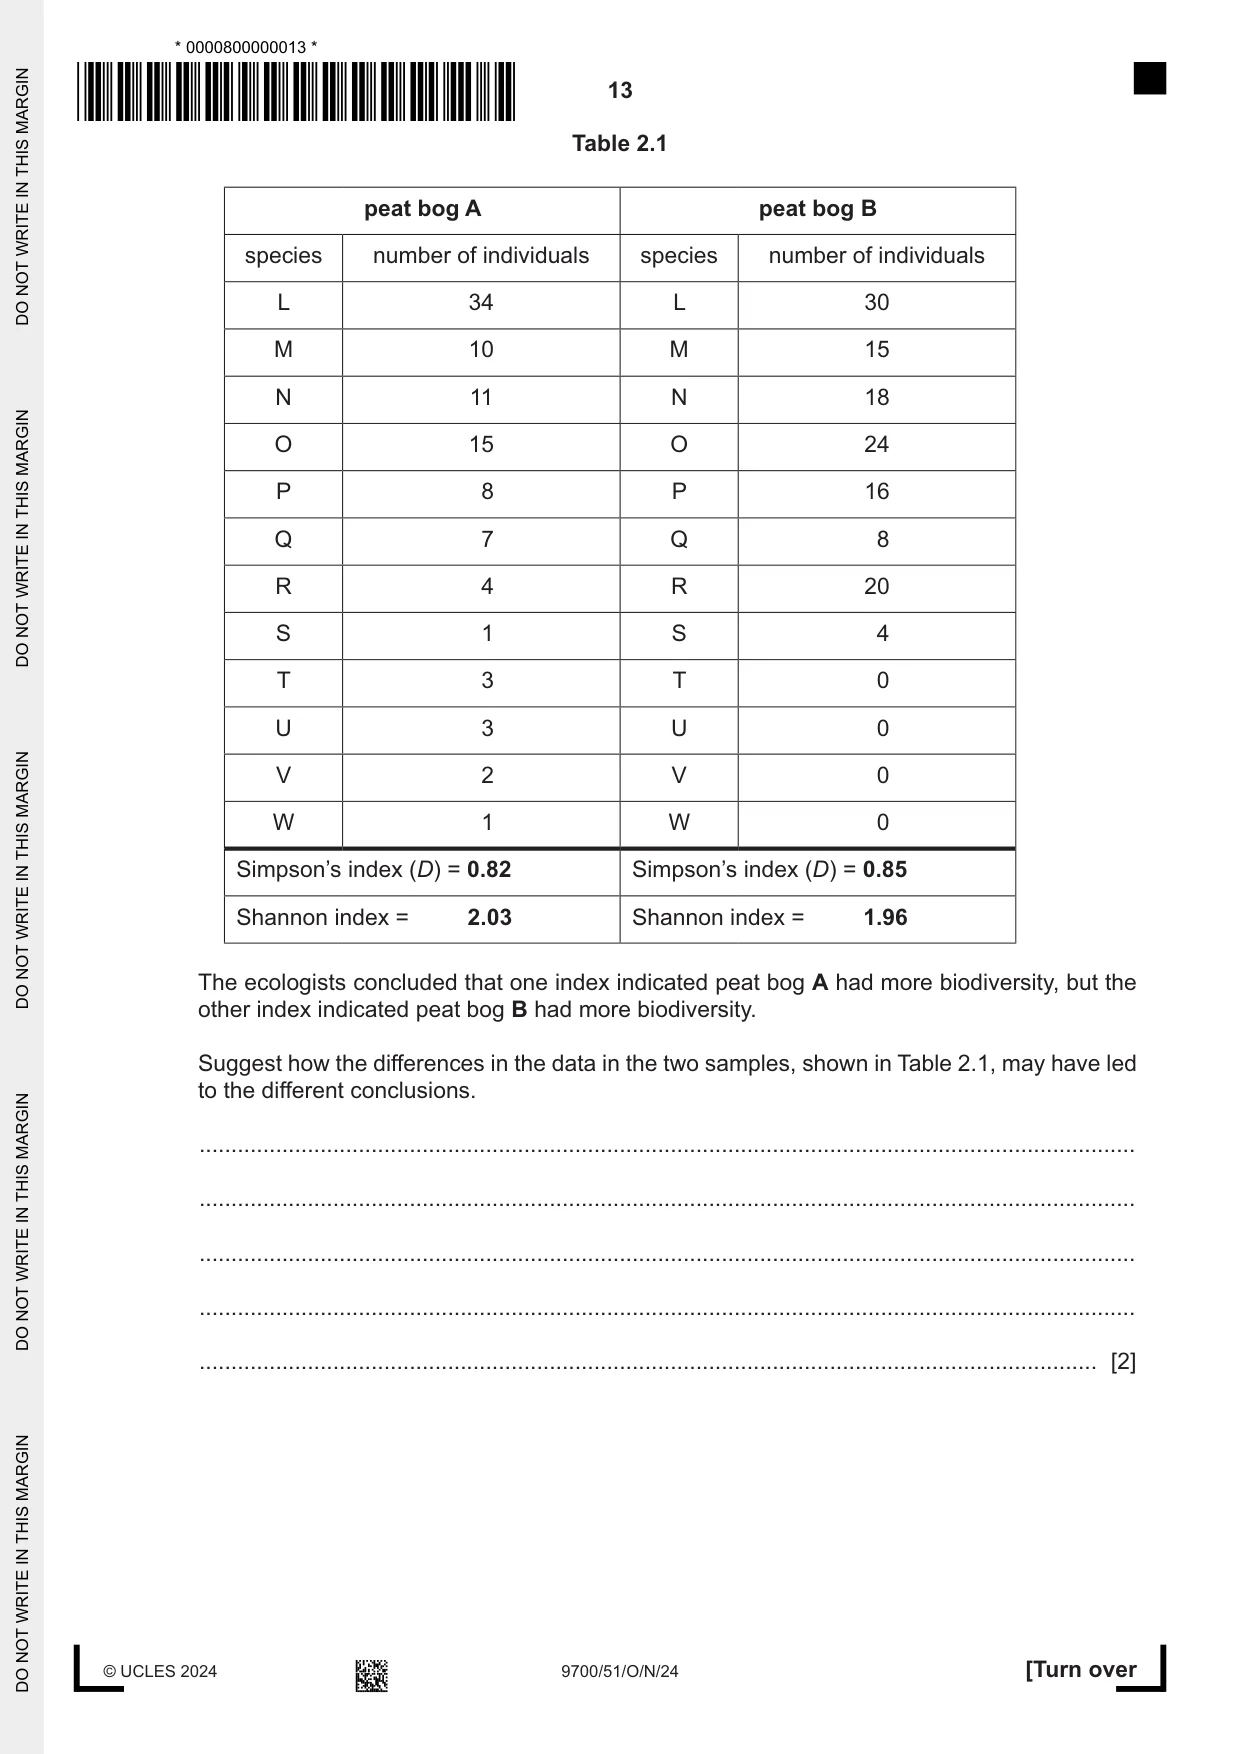
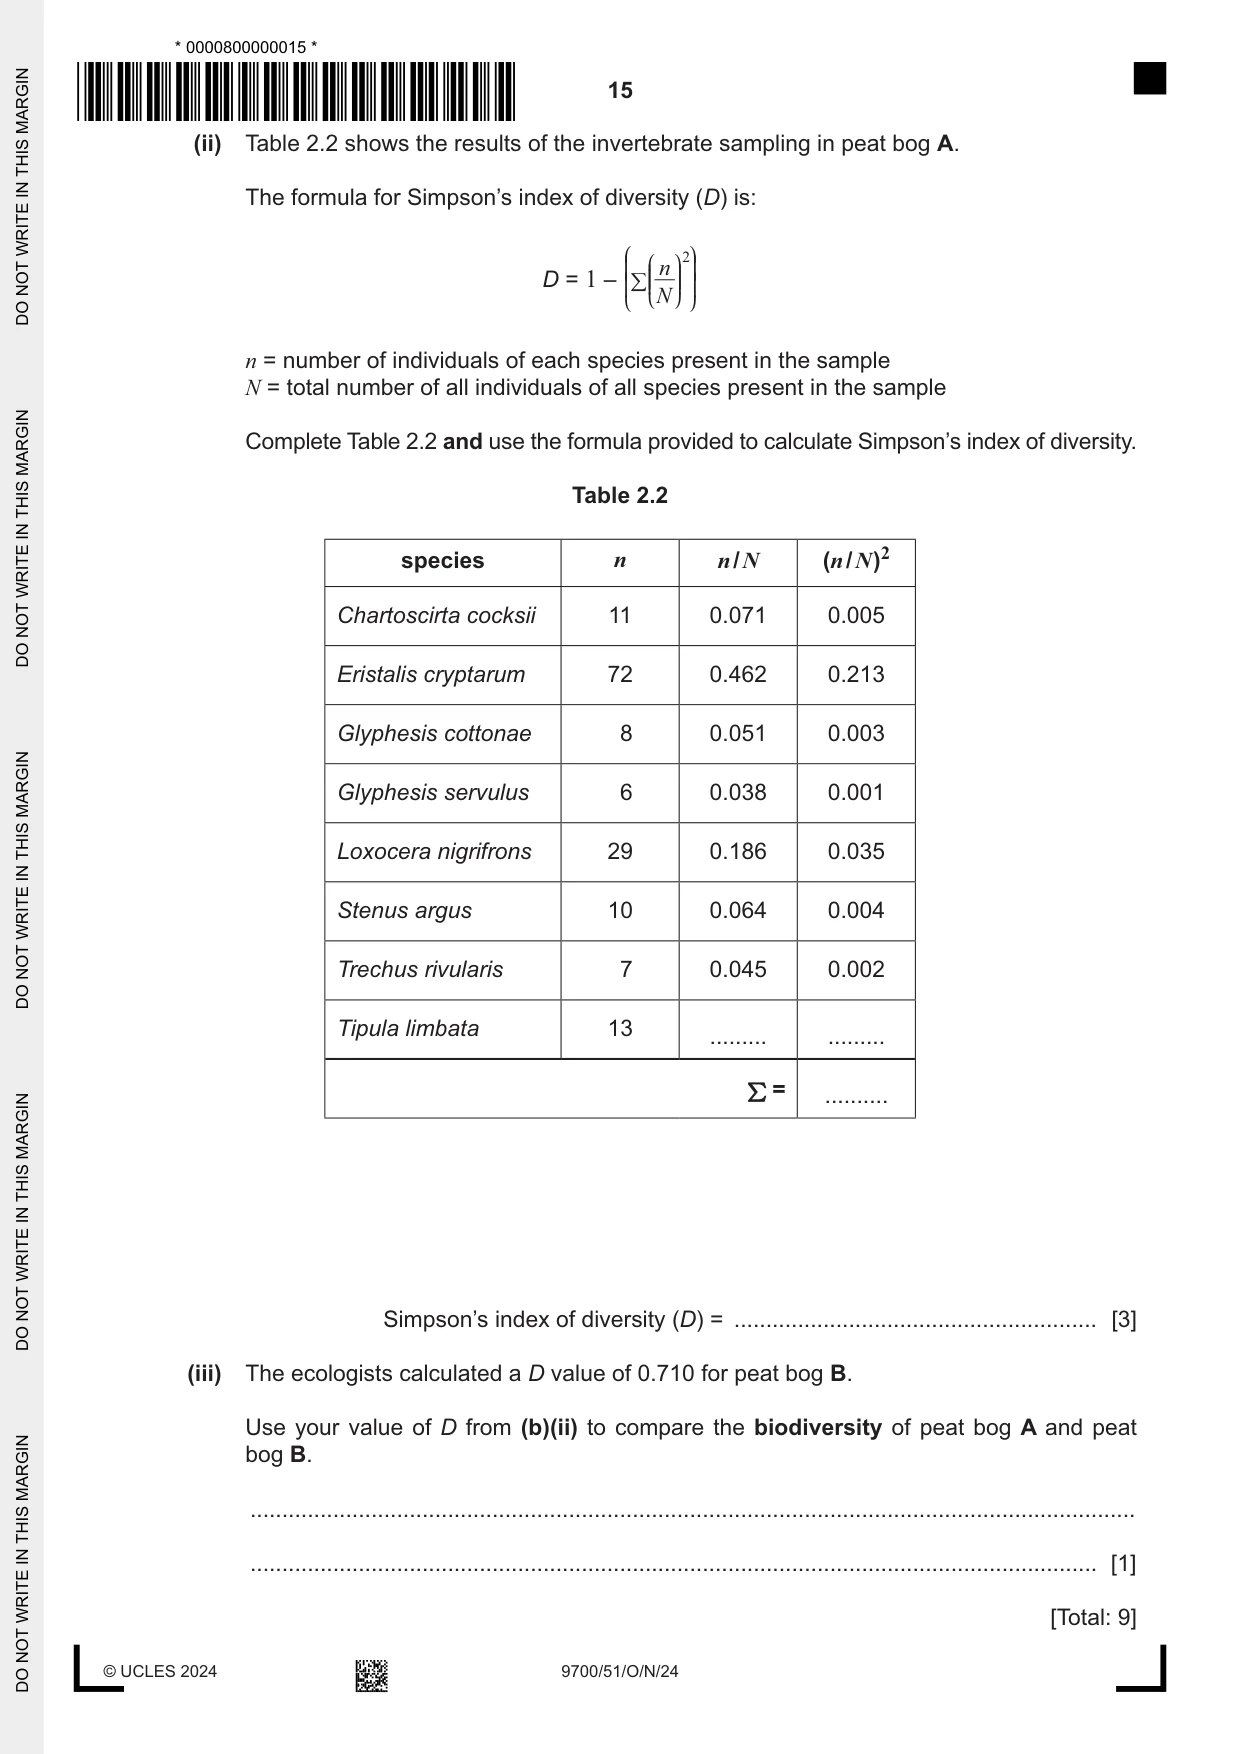
2 A group of ecologists investigated the biodiversity of two peat bog ecosystems, A and B. Peat bogs are wetland ecosystems that often contain rare species. Fig. 2.1 shows an example of a peat bog. Fig. 2.1 (a) The ecologists sampled the plant species in peat bog A and peat bog B. The ecologists decided to use two suitable indices of biodiversity: • Simpson’s index of diversity • Shannon diversity index. The ecologists had read that the two indices can lead to different conclusions. The Shannon diversity index gives values in the range 1.5–3.5, where 1.5 is low biodiversity and 3.5 is high biodiversity. The results are shown in Table 2.1. Table 2.1 peat bog A peat bog B species number of individuals species number of individuals L 34 L 30 M 10 M 15 N 11 N 18 O 15 O 24 P 8 P 16 Q 7 Q 8 R 4 R 20 S 1 S 4 T 3 T 0 U 3 U 0 V 2 V 0 W 1 W 0 Simpson’s index (D) = 0.82 Simpson’s index (D) = 0.85 Shannon index = 2.03 Shannon index = 1.96 The ecologists concluded that one index indicated peat bog A had more biodiversity, but the other index indicated peat bog B had more biodiversity. Suggest how the differences in the data in the two samples, shown in Table 2.1, may have led to the different conclusions. ................................................................................................................................................... ................................................................................................................................................... ................................................................................................................................................... ................................................................................................................................................... ............................................................................................................................................. [2] (b) The ecologists sampled the invertebrate species in peat bogs A and B and calculated invertebrate biodiversity using Simpson’s index of diversity. (i) The ecologists sampled invertebrate species in peat bog A: • between 13:00 and 16:00 on three different days within a 30‑day period • at 10 random sites along the edge of a path in the peat bog • by sampling the invertebrates within a 1 m2 quadrat placed at each site • by using an identification key to identify the species • by counting the number of individuals of each species. Describe how this sampling method could be improved to make sure the results are more representative of all invertebrates in the whole of peat bog A. ........................................................................................................................................... ........................................................................................................................................... ........................................................................................................................................... ........................................................................................................................................... ........................................................................................................................................... ........................................................................................................................................... ..................................................................................................................................... [3]
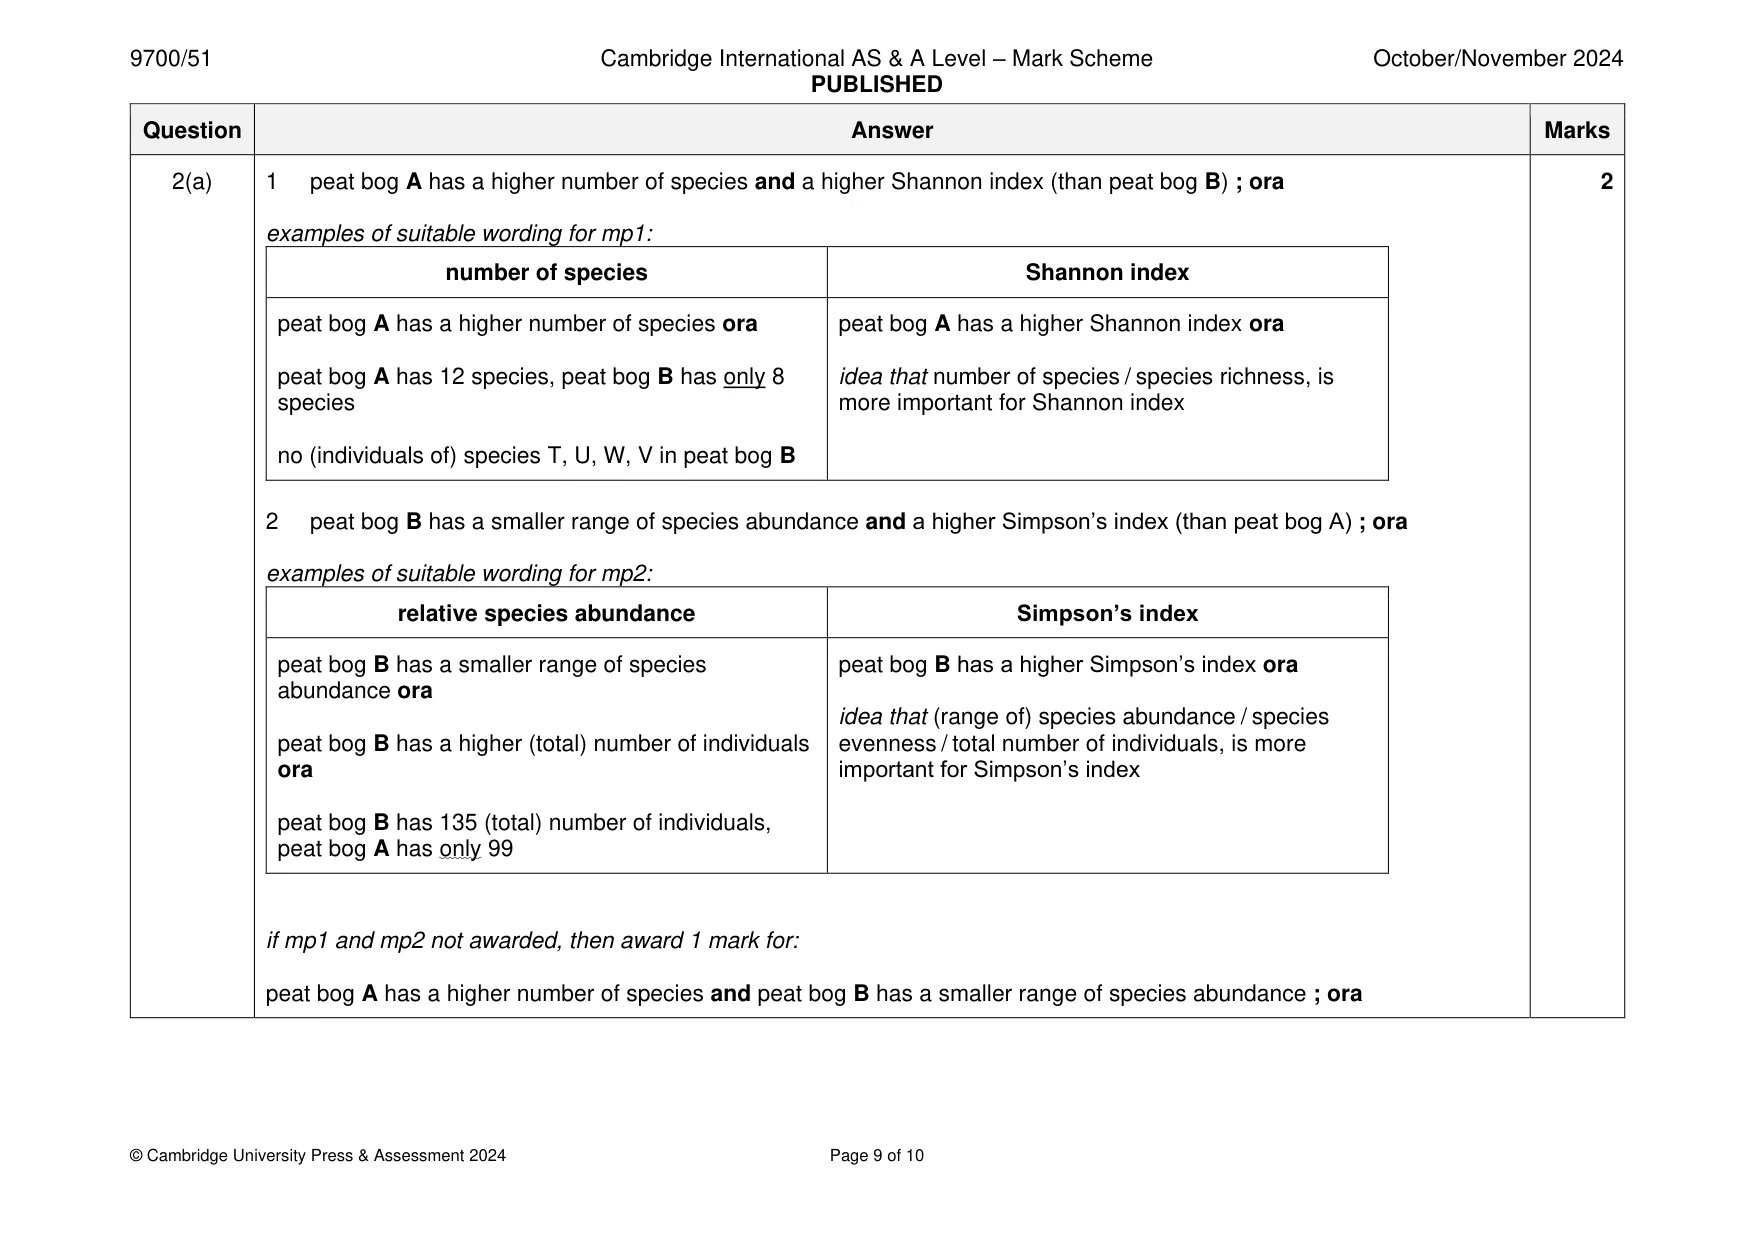
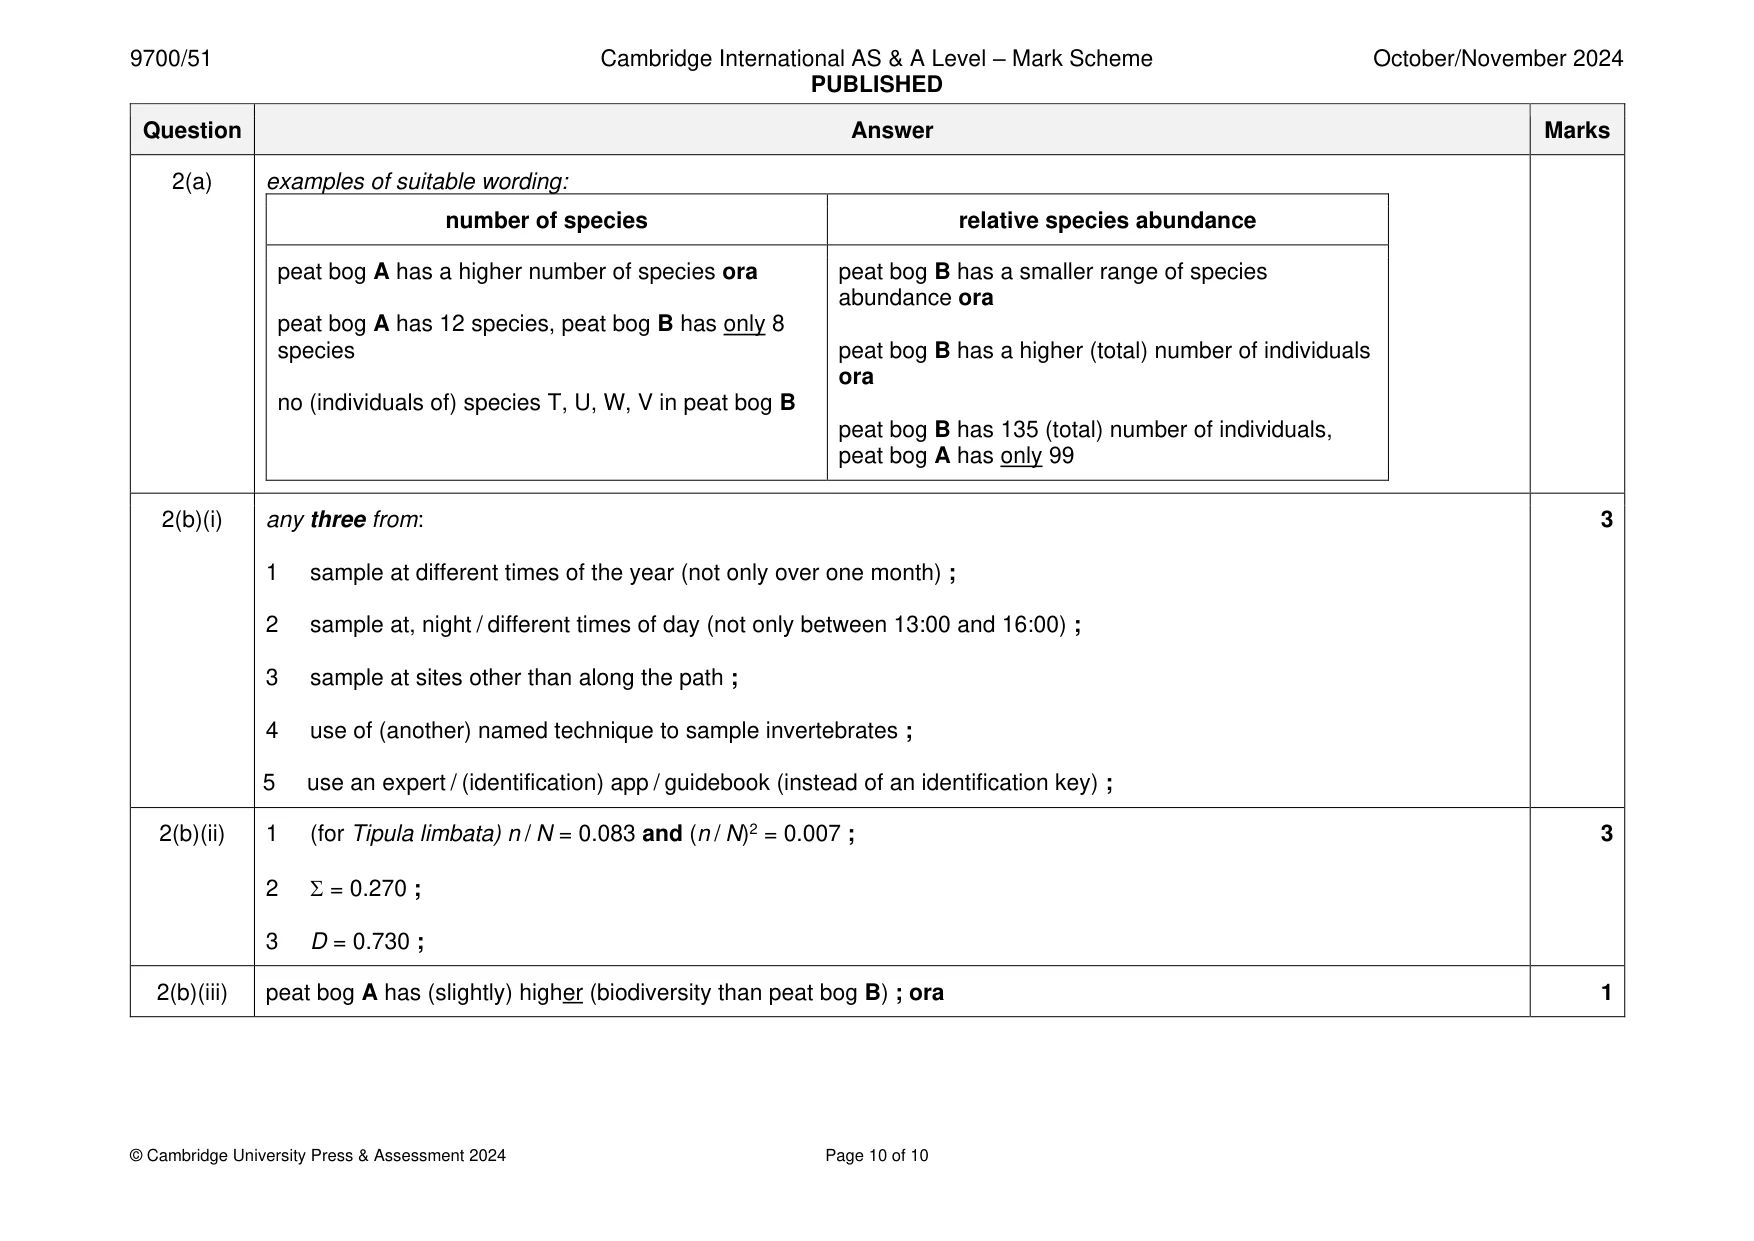
Mark scheme: 2(a) 1 peat bog A has a higher number of species and a higher Shannon index (than peat bog B) ; ora 2 examples of suitable wording for mp1: number of species Shannon index peat bog A has a higher number of species ora peat bog A has a higher Shannon index ora peat bog A has 12 species, peat bog B has only 8 idea that number of species / species richness, is species more important for Shannon index no (individuals of) species T, U, W, V in peat bog B 2 peat bog B has a smaller range of species abundance and a higher Simpson’s index (than peat bog A) ; ora examples of suitable wording for mp2: relative species abundance Simpson’s index peat bog B has a smaller range of species peat bog B has a higher Simpson’s index ora abundance ora idea that (range of) species abundance / species peat bog B has a higher (total) number of individuals evenness / total number of individuals, is more ora important for Simpson’s index peat bog B has 135 (total) number of individuals, peat bog A has only 99 if mp1 and mp2 not awarded, then award 1 mark for: peat bog A has a higher number of species and peat bog B has a smaller range of species abundance ; ora 2(a) examples of suitable wording: number of species relative species abundance peat bog A has a higher number of species ora peat bog B has a smaller range of species abundance ora peat bog A has 12 species, peat bog B has only 8 species peat bog B has a higher (total) number of individuals ora no (individuals of) species T, U, W, V in peat bog B peat bog B has 135 (total) number of individuals, peat bog A has only 99 2(b)(i) any three from: 3 1 sample at different times of the year (not only over one month) ; 2 sample at, night / different times of day (not only between 13:00 and 16:00) ; 3 sample at sites other than along the path ; 4 use of (another) named technique to sample invertebrates ; 5 use an expert / (identification) app / guidebook (instead of an identification key) ; 2(b)(ii) 1 (for Tipula limbata) n / N = 0.083 and (n / N)2 = 0.007 ; 3 2 = 0.270 ; 3 D = 0.730 ; 2(b)(iii) peat bog A has (slightly) higher (biodiversity than peat bog B) ; ora 1
What was in this paper
The subtopics covered by these 2 questions, and how many questions each got. Open one in a new tab to see every Cambridge question on it.
What you needed in this session
Cambridge’s own grade thresholds for 2024 Oct/Nov, Paper 5 · Variant 1. A higher threshold means an easier paper — the bar moves with how the cohort did.