Cambridge A Level Biology 9700 — 2024 May/June Paper 5 · Variant 1
9700/51/M/J/24 · 4 questions · 30 marks · ≈34 min
The question paper and its mark scheme, free to read here and free to download. This is Cambridge’s own paper, exactly as it was sat.
Question paper16 pages



Mark scheme11 pages
Answers below. Sit the paper first if you are practising.
Questions as text
Q1 · A student investigated the effect of wind speed on the rate of transpiration
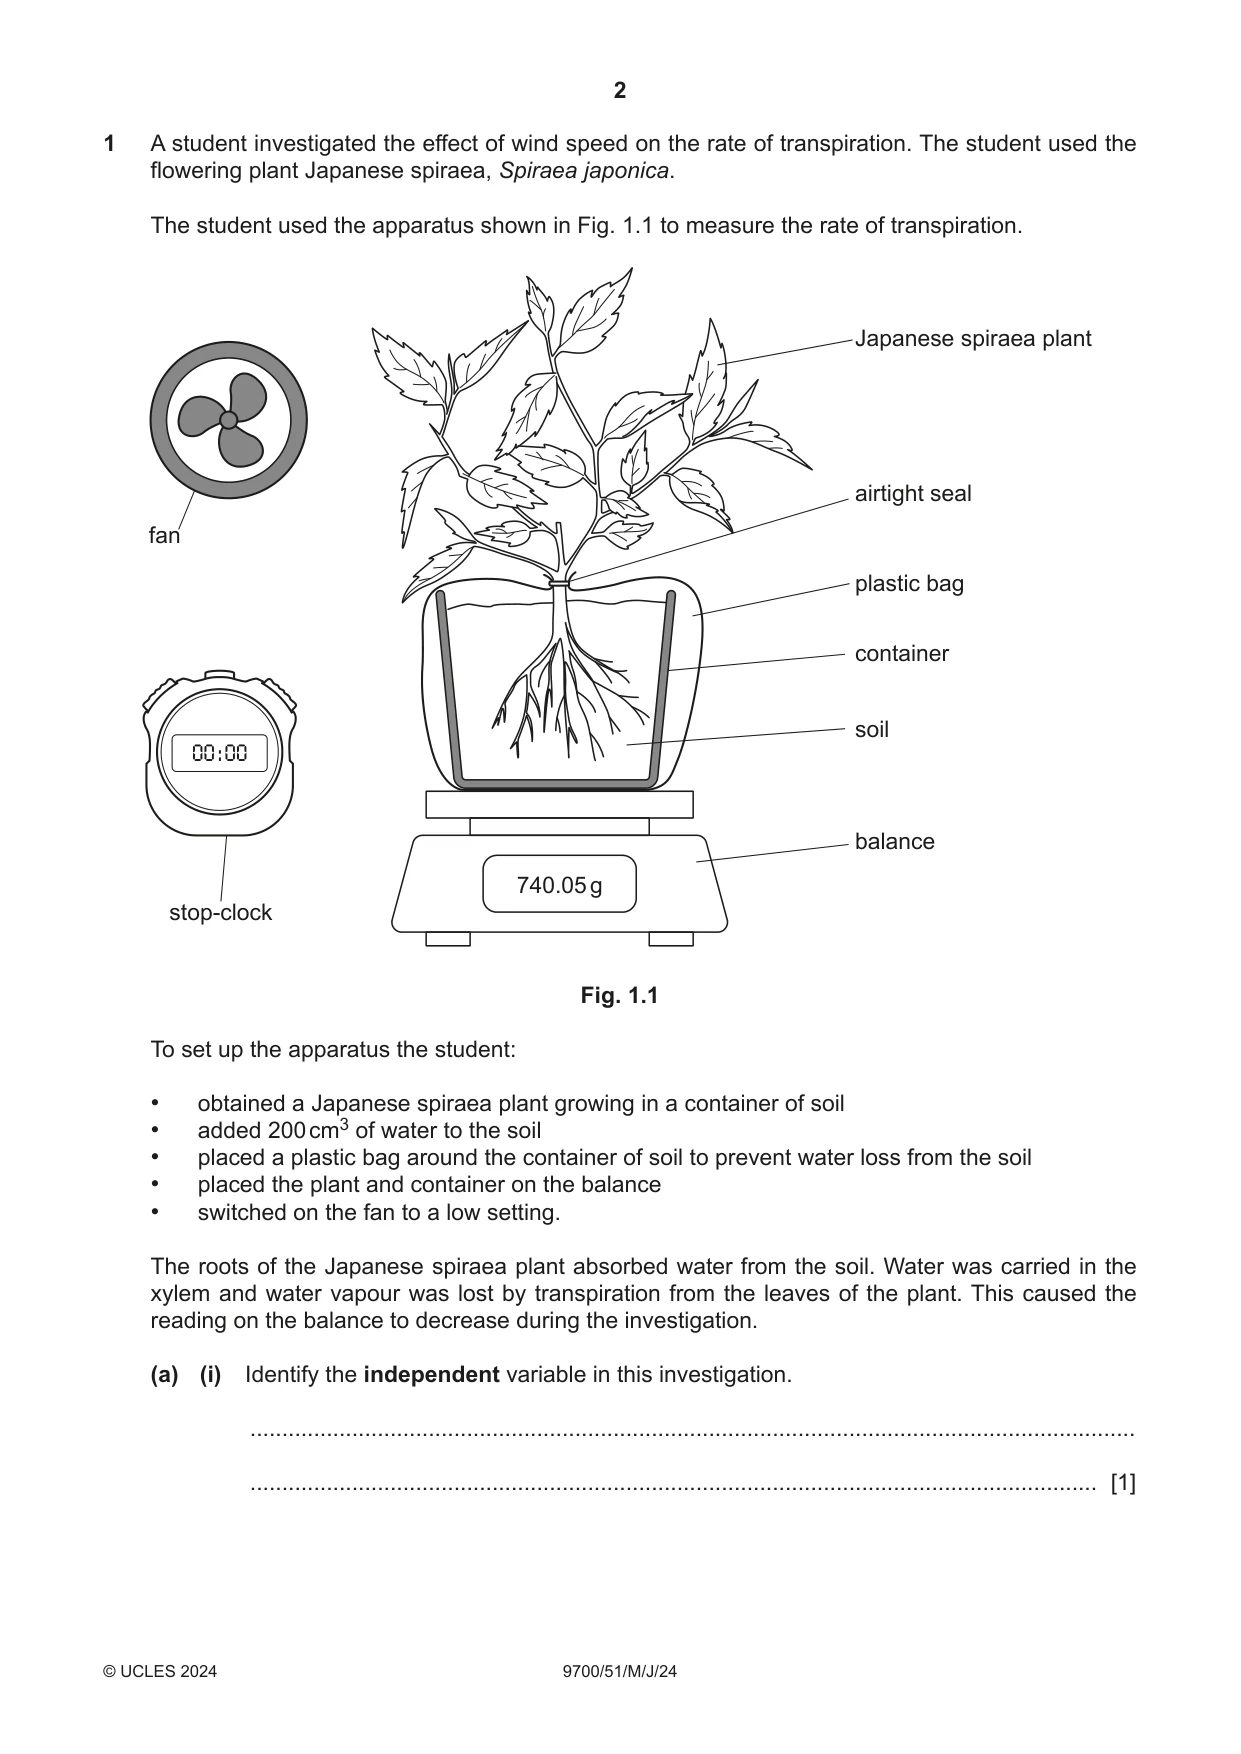
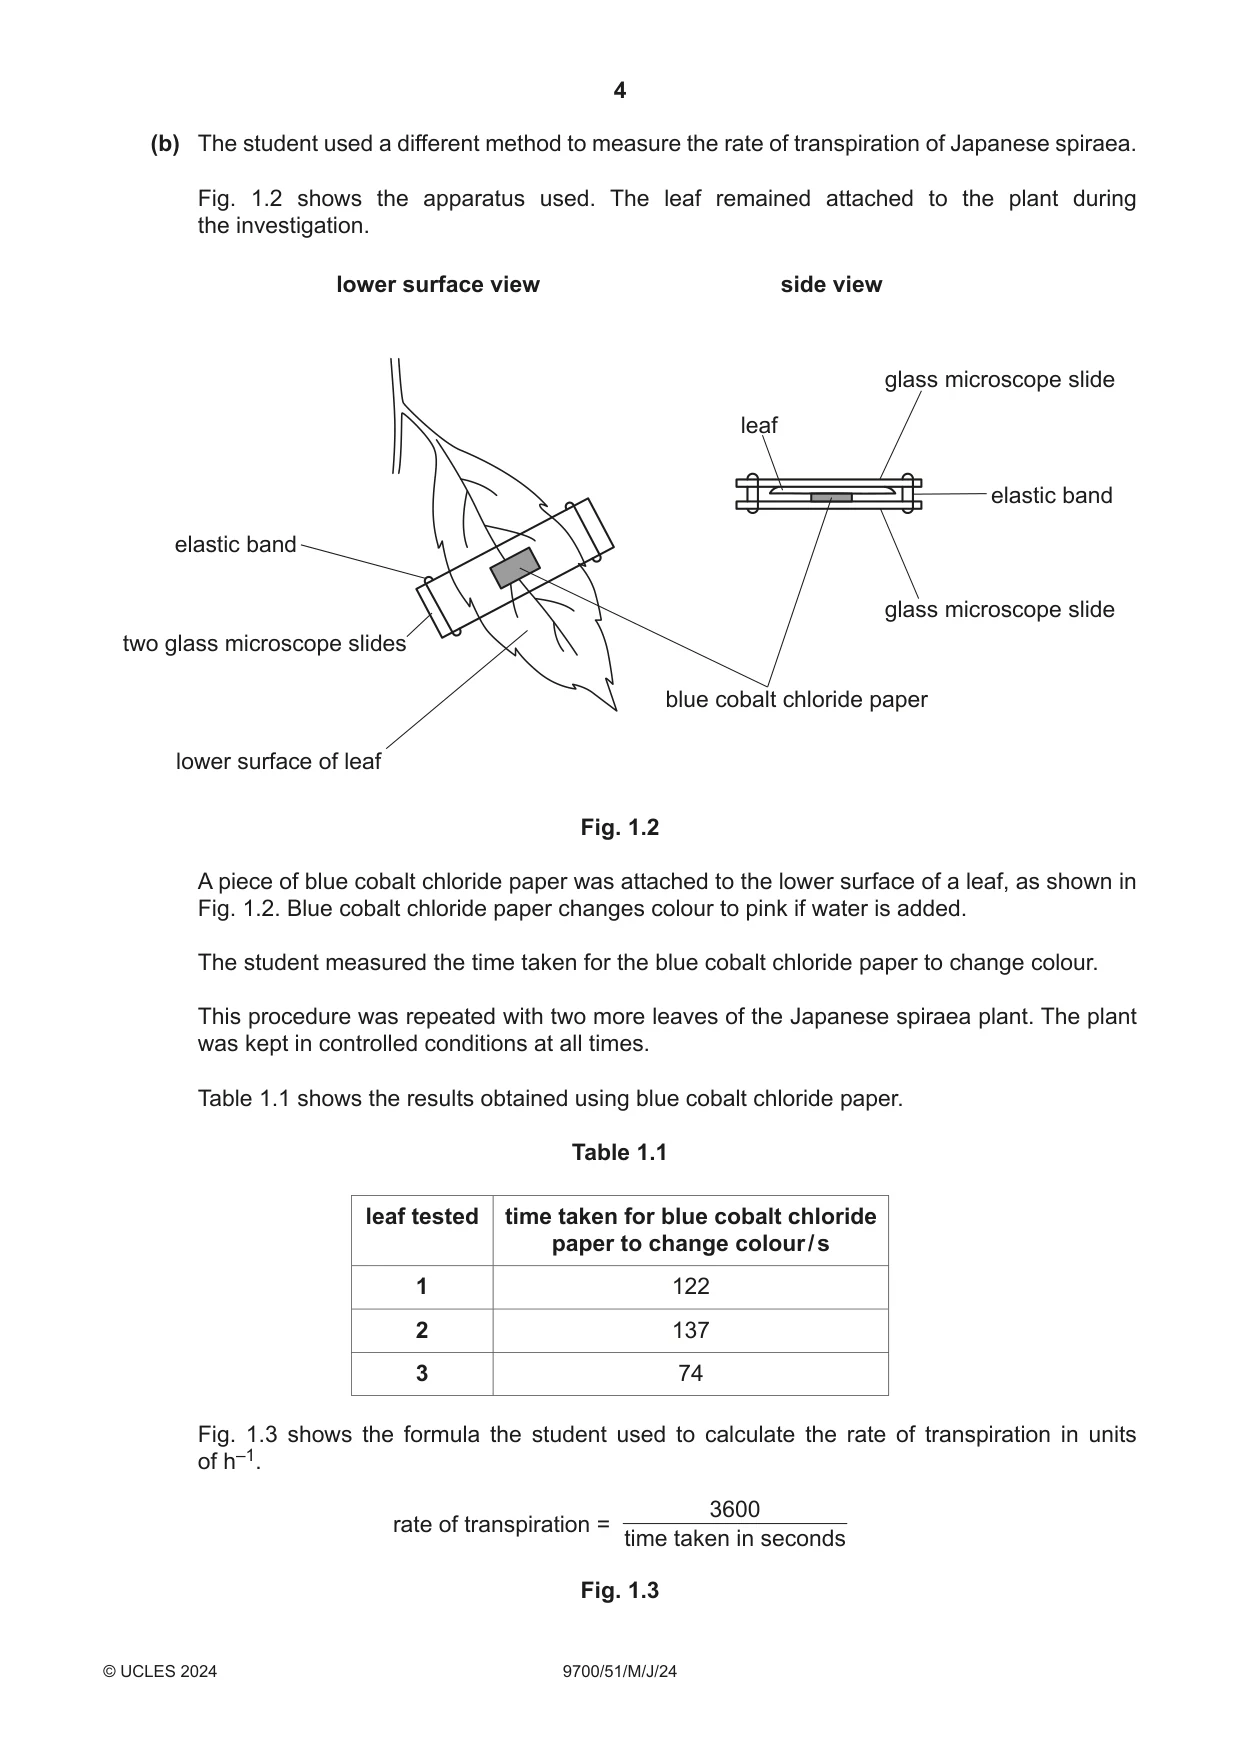
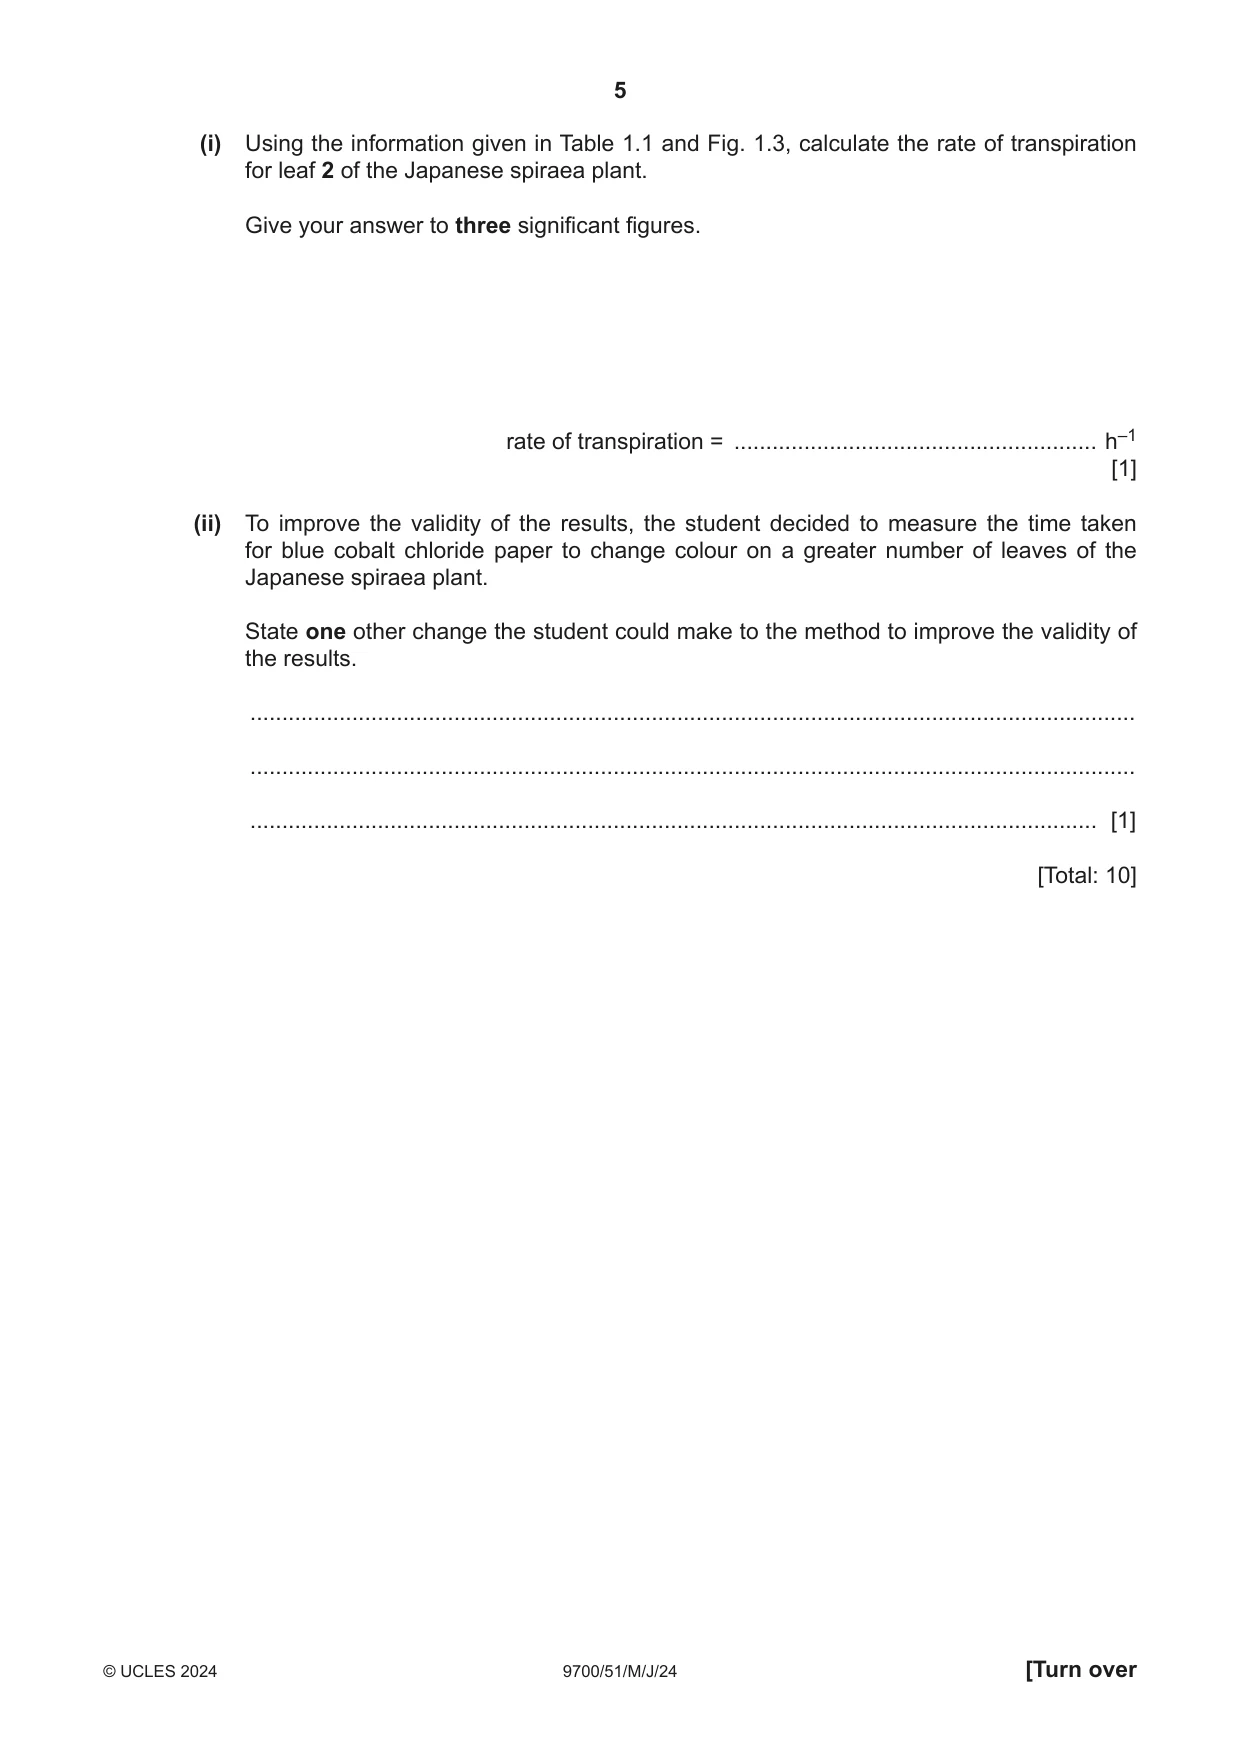
1 A student investigated the effect of wind speed on the rate of transpiration. The student used the flowering plant Japanese spiraea, Spiraea japonica. The student used the apparatus shown in Fig. 1.1 to measure the rate of transpiration. Japanese spiraea plant airtight seal fan plastic bag container soil 00 : 00 balance 740.05 g stop-clock Fig. 1.1 To set up the apparatus the student: • obtained a Japanese spiraea plant growing in a container of soil • added 200 cm3 of water to the soil • placed a plastic bag around the container of soil to prevent water loss from the soil • placed the plant and container on the balance • switched on the fan to a low setting. The roots of the Japanese spiraea plant absorbed water from the soil. Water was carried in the xylem and water vapour was lost by transpiration from the leaves of the plant. This caused the reading on the balance to decrease during the investigation. (a) (i) Identify the independent variable in this investigation. ........................................................................................................................................... ..................................................................................................................................... [1] (ii) The student carried out the investigation in a laboratory with standard laboratory apparatus. Describe a method, using the apparatus shown in Fig. 1.1, that the student could use to investigate the effect of wind speed on the rate of transpiration by Japanese spiraea. Your method should be set out in a logical order and be detailed enough to allow another person to follow it. Details of how to set up the apparatus shown in Fig. 1.1 should not be included. ........................................................................................................................................... ........................................................................................................................................... ........................................................................................................................................... ........................................................................................................................................... ........................................................................................................................................... ........................................................................................................................................... ........................................................................................................................................... ........................................................................................................................................... ........................................................................................................................................... ........................................................................................................................................... ........................................................................................................................................... ........................................................................................................................................... ........................................................................................................................................... ........................................................................................................................................... ........................................................................................................................................... ........................................................................................................................................... ..................................................................................................................................... [6] (iii) Predict the effect of wind speed on the results of the investigation using the method you have given in (a)(ii). ........................................................................................................................................... ........................................................................................................................................... ..................................................................................................................................... [1] (b) The student used a different method to measure the rate of transpiration of Japanese spiraea. Fig. 1.2 shows the apparatus used. The leaf remained attached to the plant during the investigation. lower surface view side view glass microscope slide leaf elastic band elastic band glass microscope slide two glass microscope slides blue cobalt chloride paper lower surface of leaf Fig. 1.2 A piece of blue cobalt chloride paper was attached to the lower surface of a leaf, as shown in Fig. 1.2. Blue cobalt chloride paper changes colour to pink if water is added. The student measured the time taken for the blue cobalt chloride paper to change colour. This procedure was repeated with two more leaves of the Japanese spiraea plant. The plant was kept in controlled conditions at all times. Table 1.1 shows the results obtained using blue cobalt chloride paper. Table 1.1 leaf tested time taken for blue cobalt chloride paper to change colour / s 1 122 2 137 3 74 Fig. 1.3 shows the formula the student used to calculate the rate of transpiration in units of h–1. 3600 rate of transpiration = time taken in seconds Fig. 1.3 (i) Using the information given in Table 1.1 and Fig. 1.3, calculate the rate of transpiration for leaf 2 of the Japanese spiraea plant. Give your answer to three significant figures. rate of transpiration = ......................................................... h–1 [1] (ii) To improve the validity of the results, the student decided to measure the time taken for blue cobalt chloride paper to change colour on a greater number of leaves of the Japanese spiraea plant. State one other change the student could make to the method to improve the validity of the results. ........................................................................................................................................... ........................................................................................................................................... ..................................................................................................................................... [1] [Total: 10]
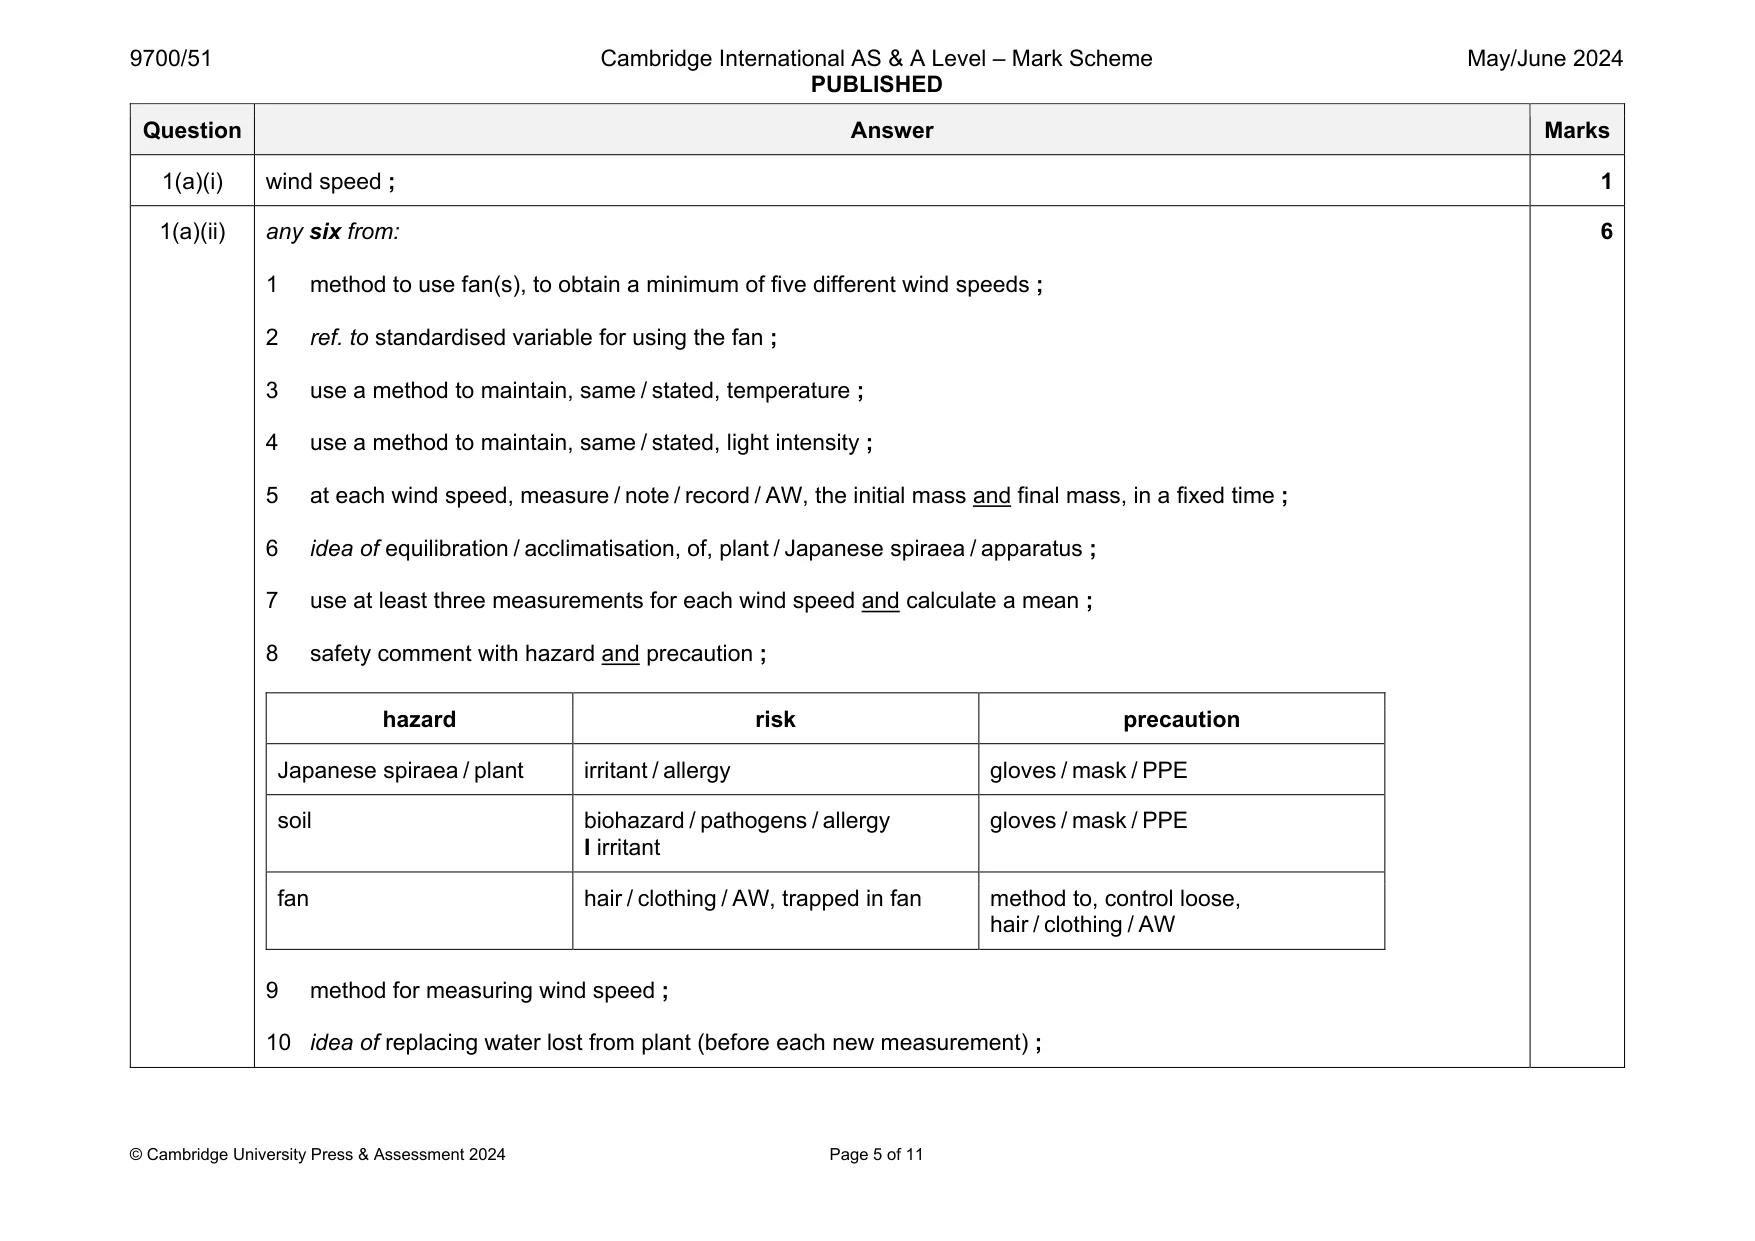
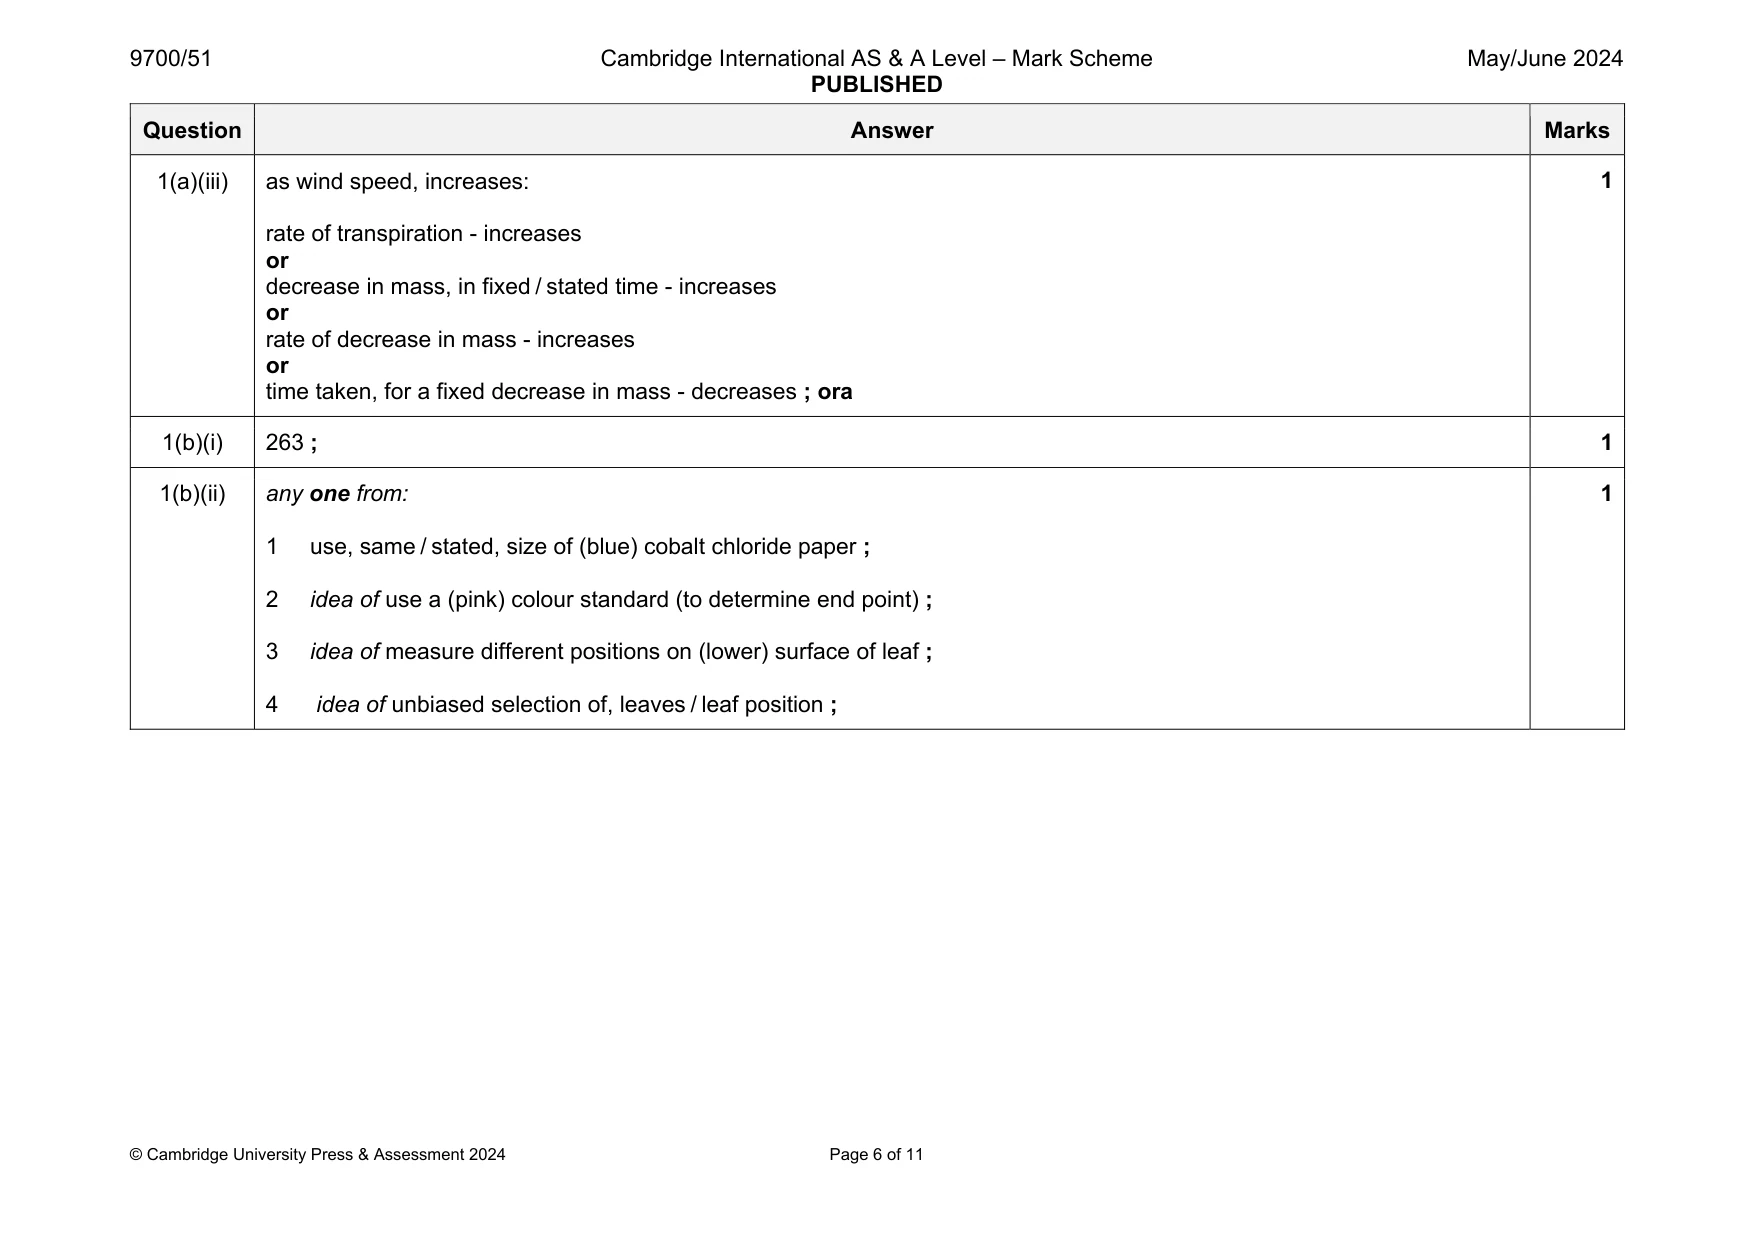
Mark scheme: 1(a)(i) wind speed ; 1 1(a)(ii) any six from: 1 method to use fan(s), to obtain a minimum of five different wind speeds ; 2 ref. to standardised variable for using the fan ; 3 use a method to maintain, same / stated, temperature ; 4 use a method to maintain, same / stated, light intensity ; 5 at each wind speed, measure / note / record / AW, the initial mass and final mass, in a fixed time ; 6 idea of equilibration / acclimatisation, of, plant / Japanese spiraea / apparatus ; 7 use at least three measurements for each wind speed and calculate a mean ; 8 safety comment with hazard and precaution ; hazard risk precaution Japanese spiraea / plant irritant / allergy gloves / mask / PPE soil biohazard / pathogens / allergy I irritant gloves / mask / PPE fan hair / clothing / AW, trapped in fan method to, control loose, hair / clothing / AW 9 method for measuring wind speed ; 10 idea of replacing water lost from plant (before each new measurement) ; 6 Question Answer Marks 1(a)(iii) as wind speed, increases: rate of transpiration - increases or decrease in mass, in fixed / stated time - increases or rate of decrease in mass - increases or time taken, for a fixed decrease in mass - decreases ; ora 1 1(b)(i) 263 ; 1 1(b)(ii) any one from: 1 use, same / stated, size of (blue) cobalt chloride paper ; 2 idea of use a (pink) colour standard (to determine end point) ; 3 idea of measure different positions on (lower) surface of leaf ; 4 idea of unbiased selection of, leaves / leaf position ; 1
Q2 · The responses of plant species to water stress can be classified as either isohydric or…
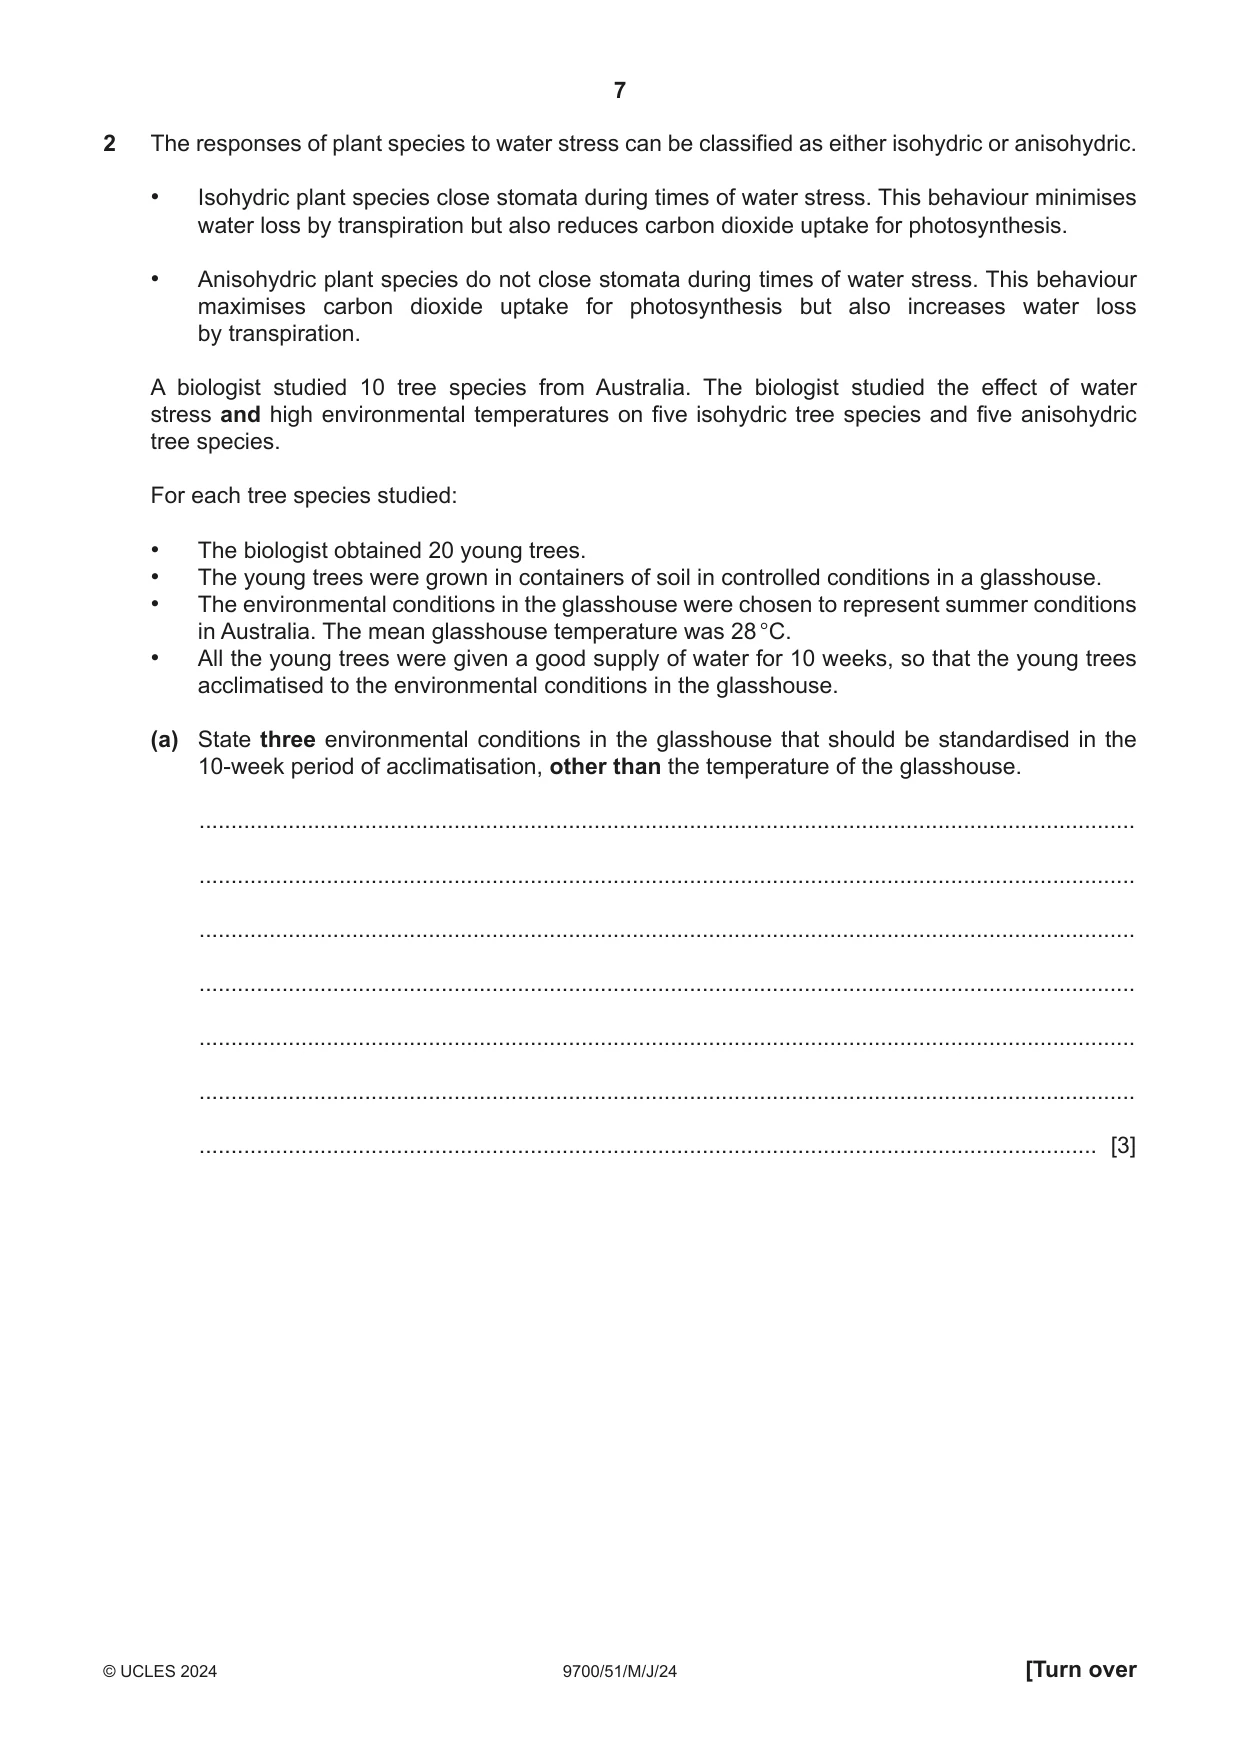
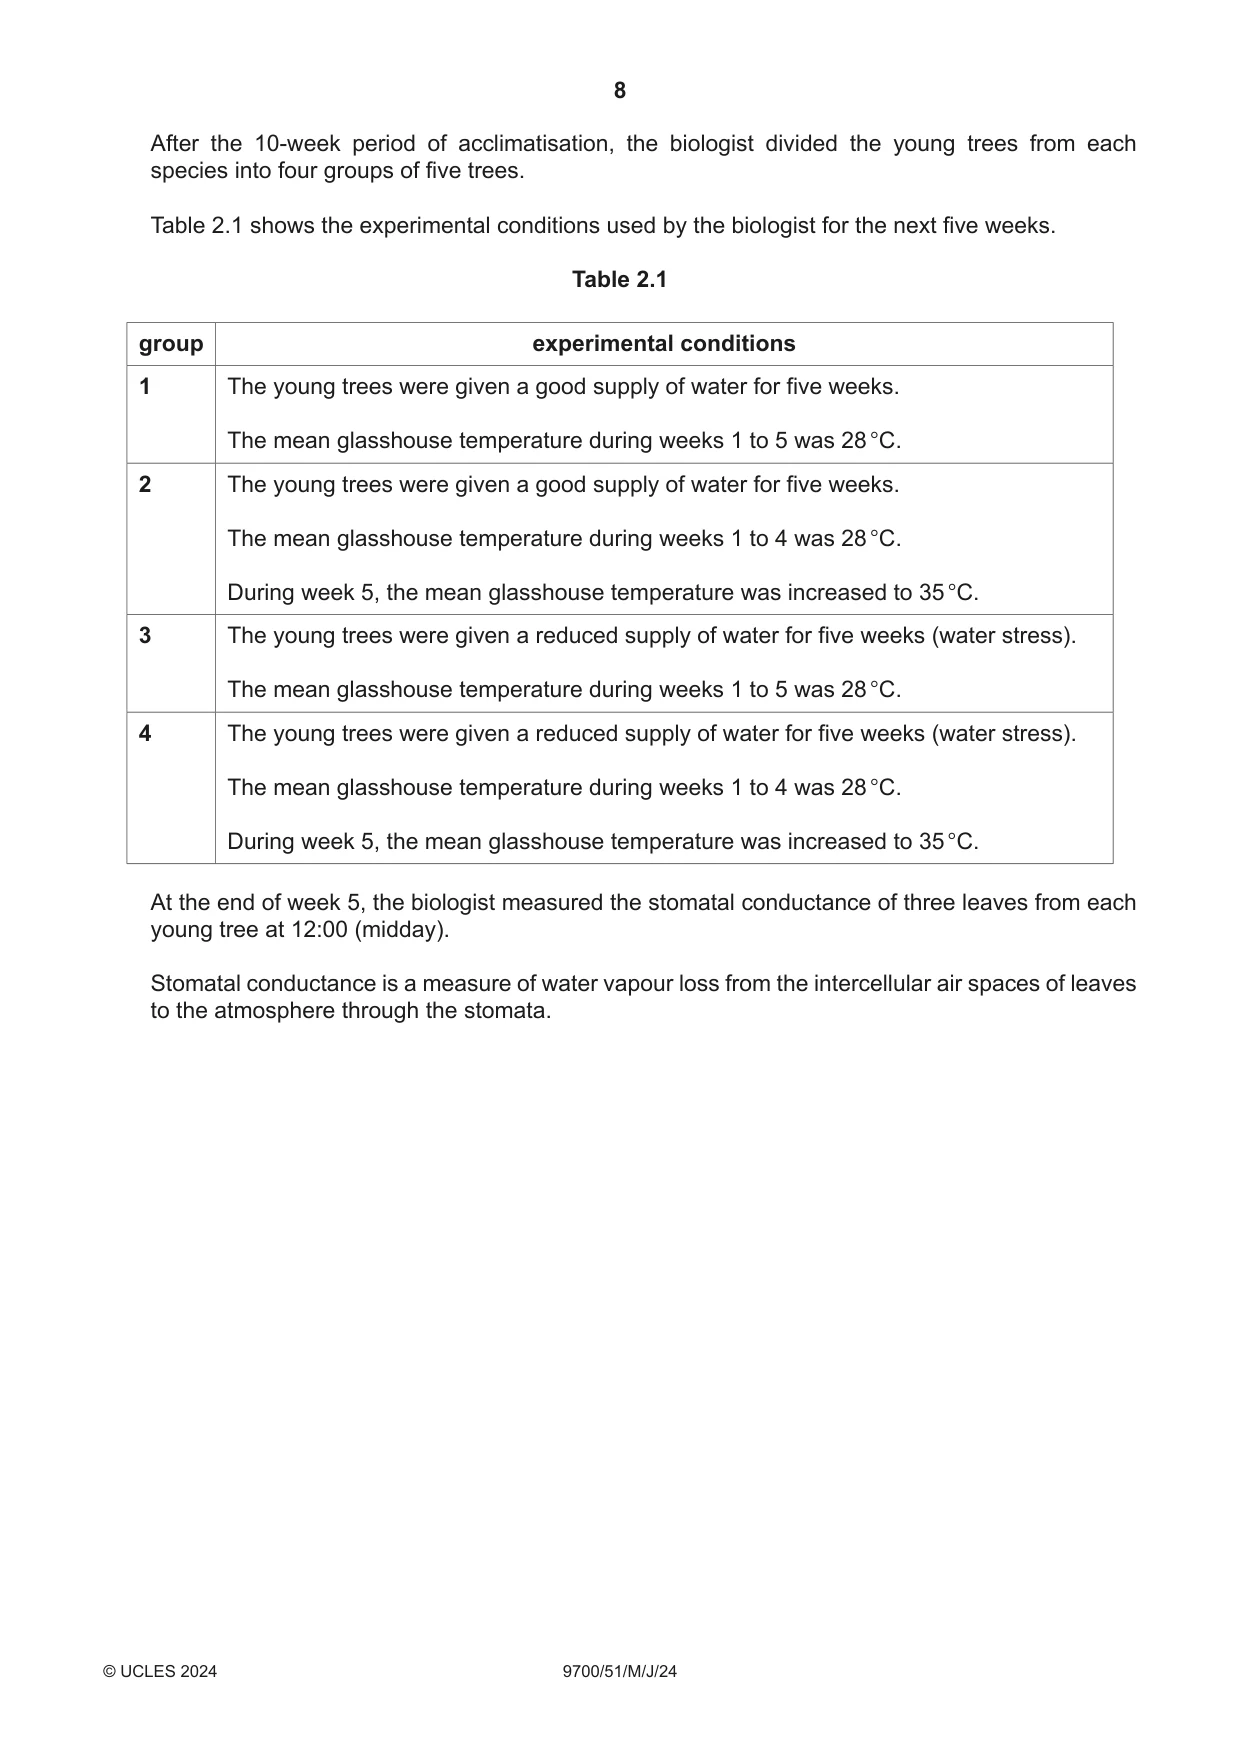
2 The responses of plant species to water stress can be classified as either isohydric or anisohydric. • Isohydric plant species close stomata during times of water stress. This behaviour minimises water loss by transpiration but also reduces carbon dioxide uptake for photosynthesis. • Anisohydric plant species do not close stomata during times of water stress. This behaviour maximises carbon dioxide uptake for photosynthesis but also increases water loss by transpiration. A biologist studied 10 tree species from Australia. The biologist studied the effect of water stress and high environmental temperatures on five isohydric tree species and five anisohydric tree species. For each tree species studied: • The biologist obtained 20 young trees. • The young trees were grown in containers of soil in controlled conditions in a glasshouse. • The environmental conditions in the glasshouse were chosen to represent summer conditions in Australia. The mean glasshouse temperature was 28 °C. • All the young trees were given a good supply of water for 10 weeks, so that the young trees acclimatised to the environmental conditions in the glasshouse. (a) State three environmental conditions in the glasshouse that should be standardised in the 10-week period of acclimatisation, other than the temperature of the glasshouse. ................................................................................................................................................... ................................................................................................................................................... ................................................................................................................................................... ................................................................................................................................................... ................................................................................................................................................... ................................................................................................................................................... ............................................................................................................................................. [3] After the 10-week period of acclimatisation, the biologist divided the young trees from each species into four groups of five trees. Table 2.1 shows the experimental conditions used by the biologist for the next five weeks. Table 2.1 group experimental conditions 1 The young trees were given a good supply of water for five weeks. The mean glasshouse temperature during weeks 1 to 5 was 28 °C. 2 The young trees were given a good supply of water for five weeks. The mean glasshouse temperature during weeks 1 to 4 was 28 °C. During week 5, the mean glasshouse temperature was increased to 35 °C.
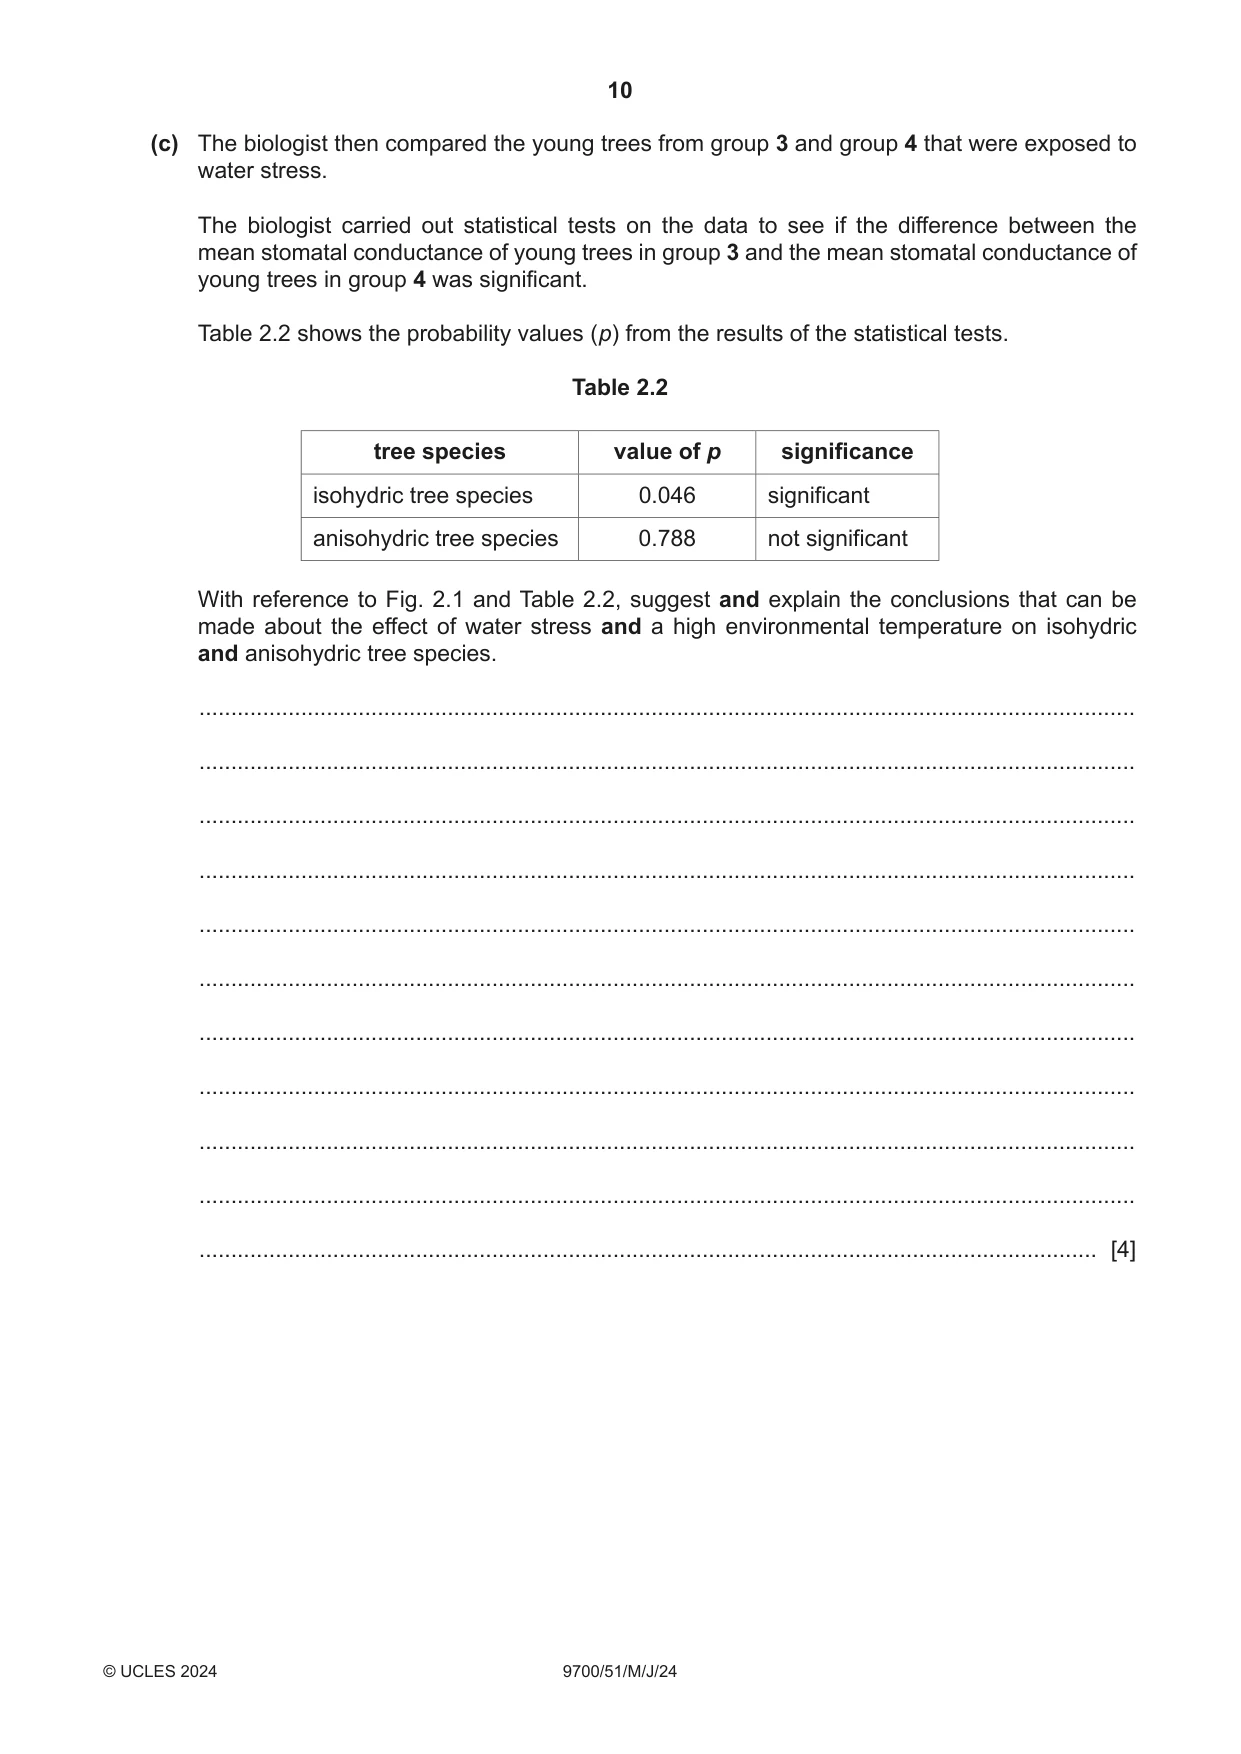
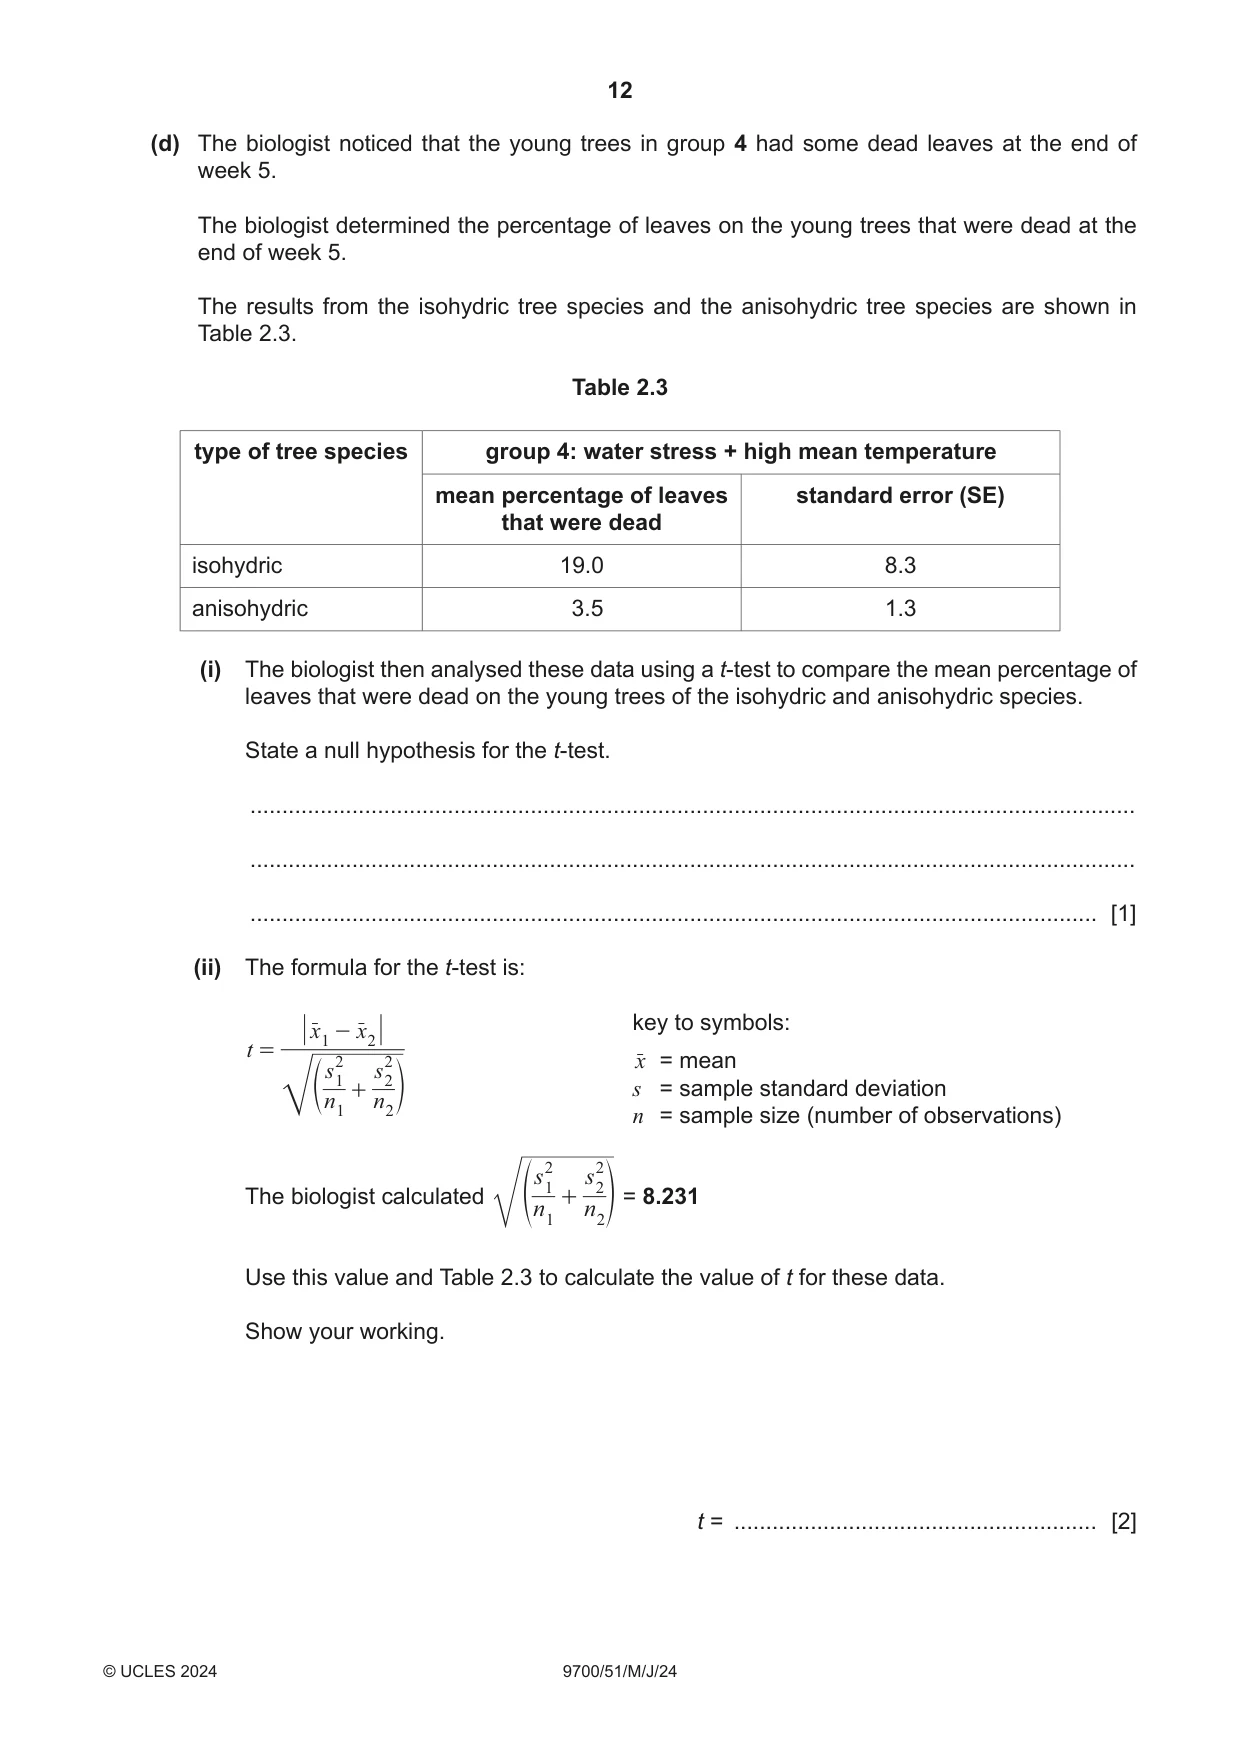
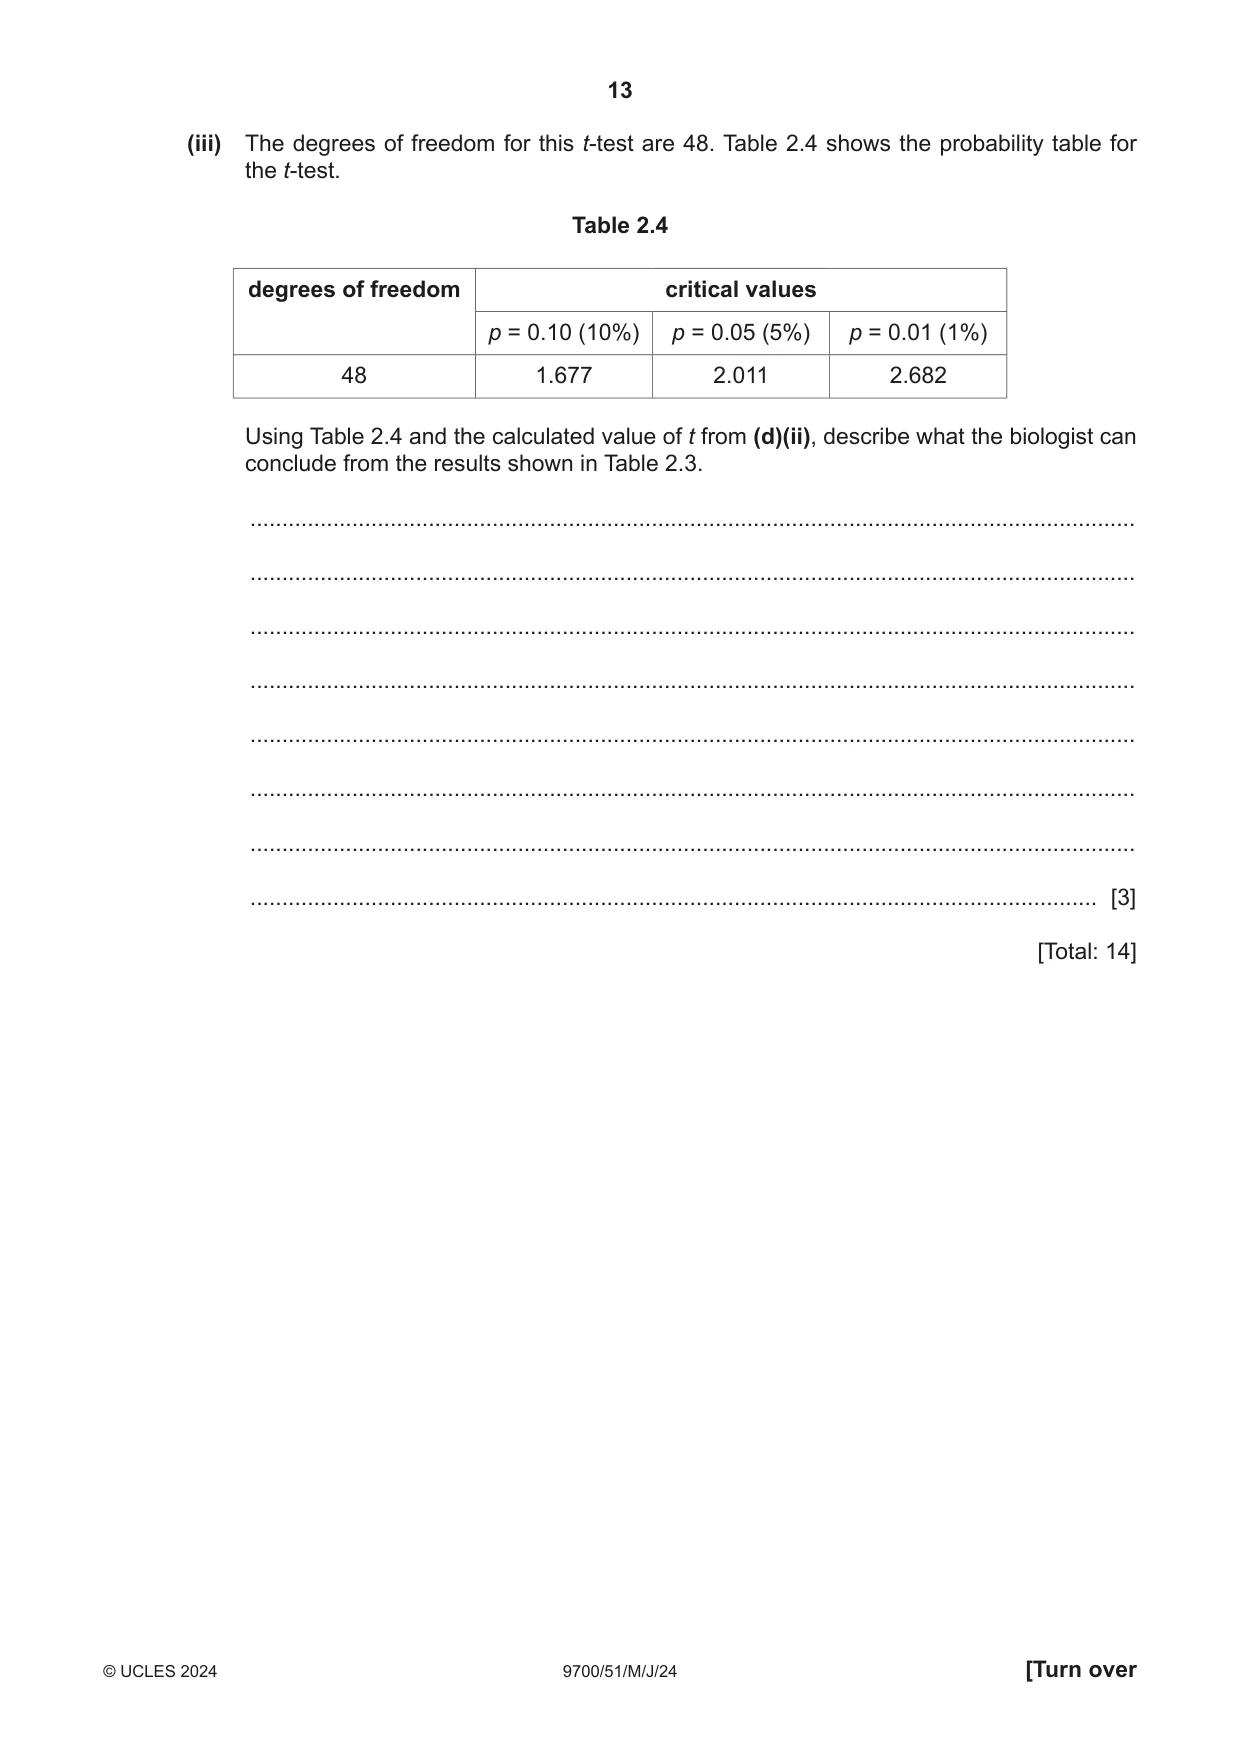
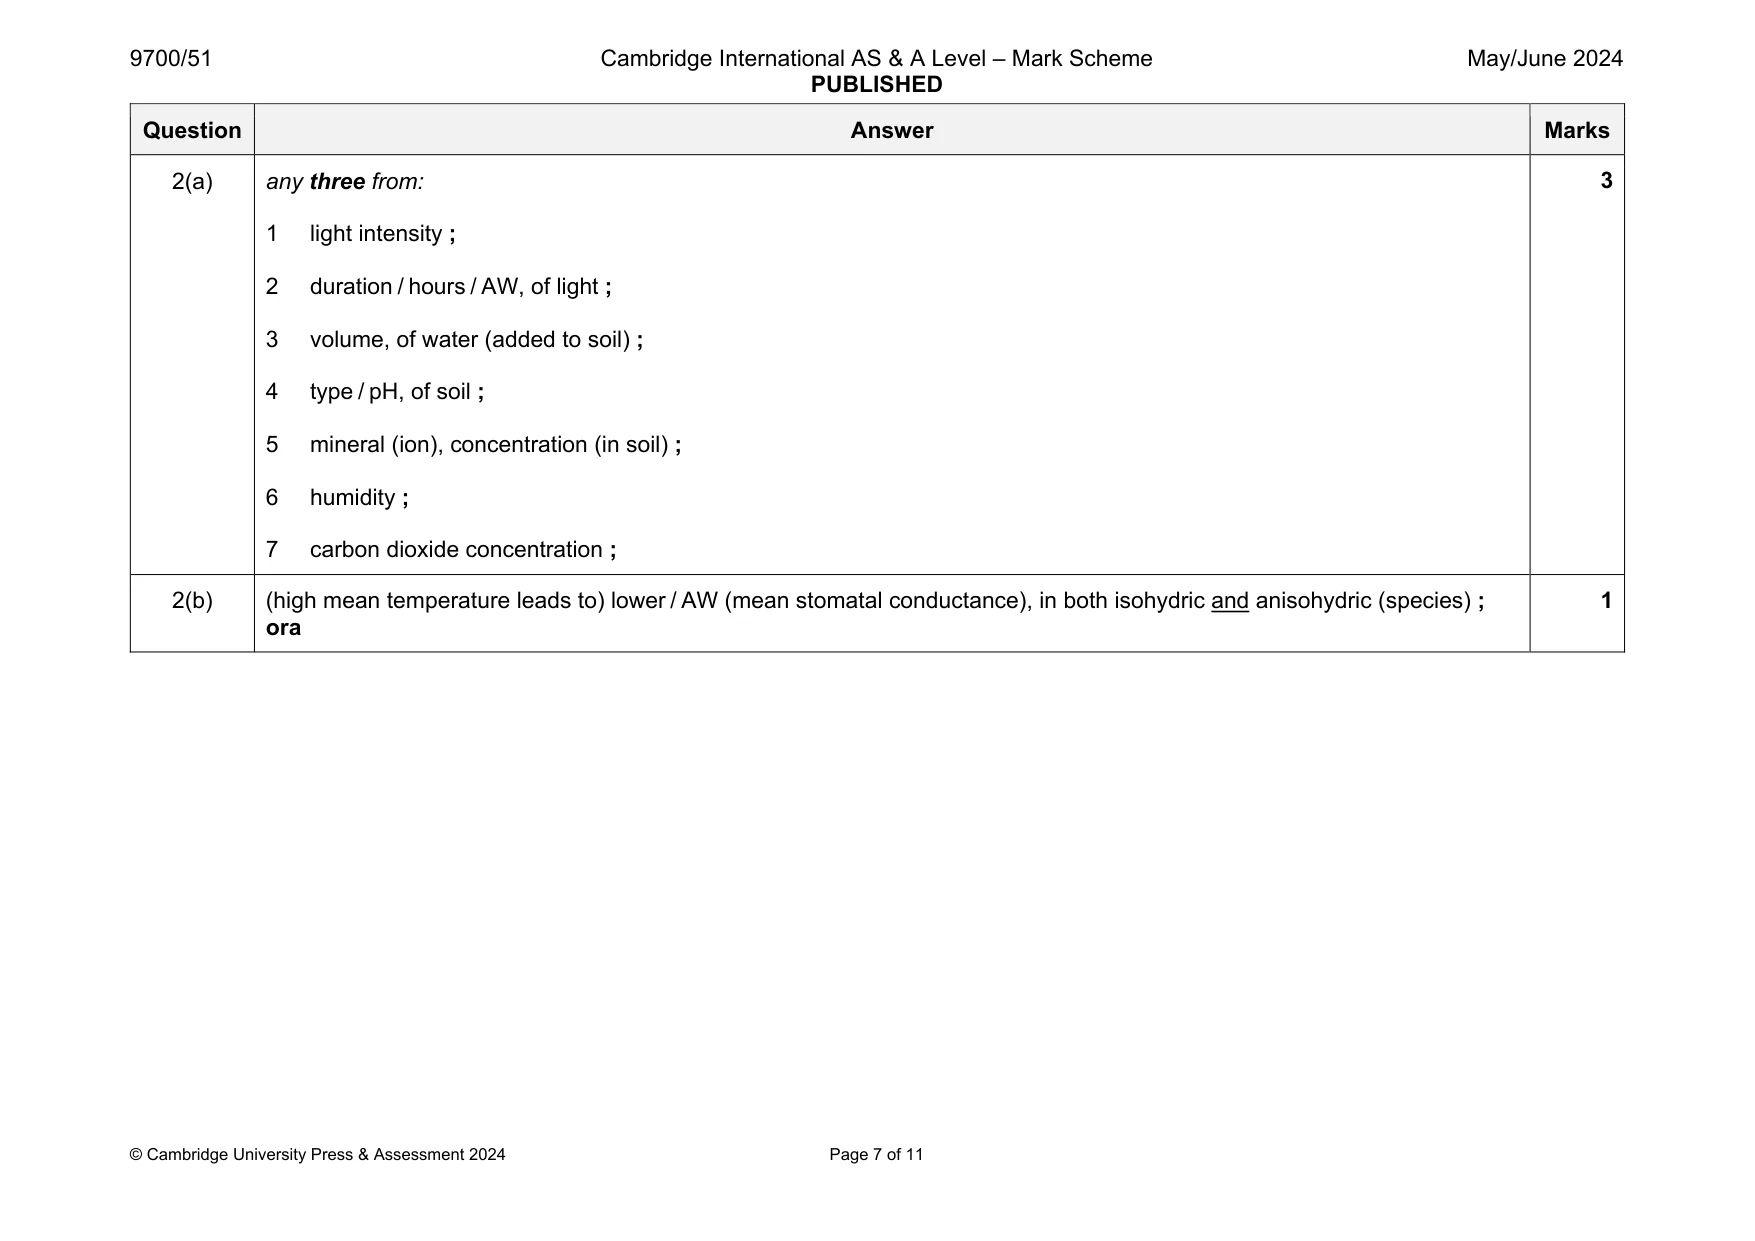
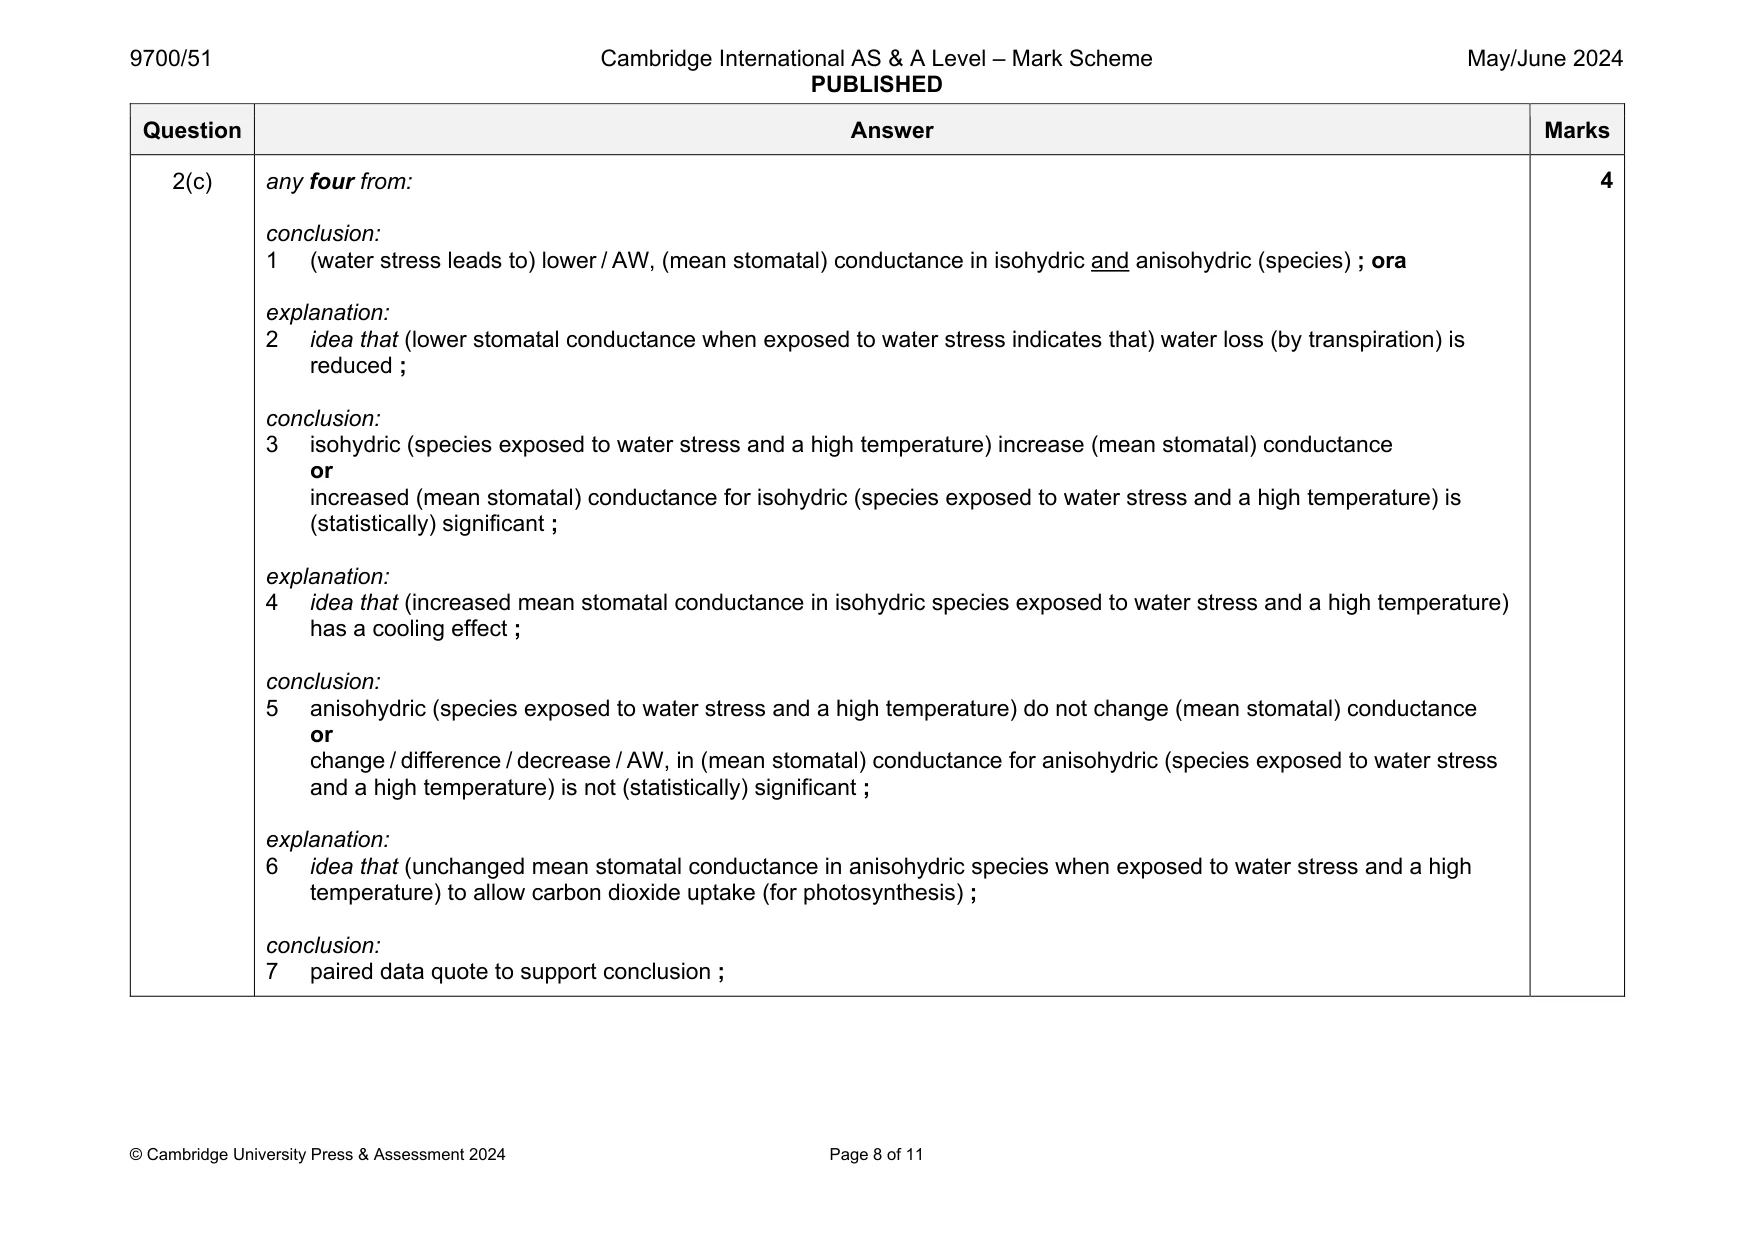
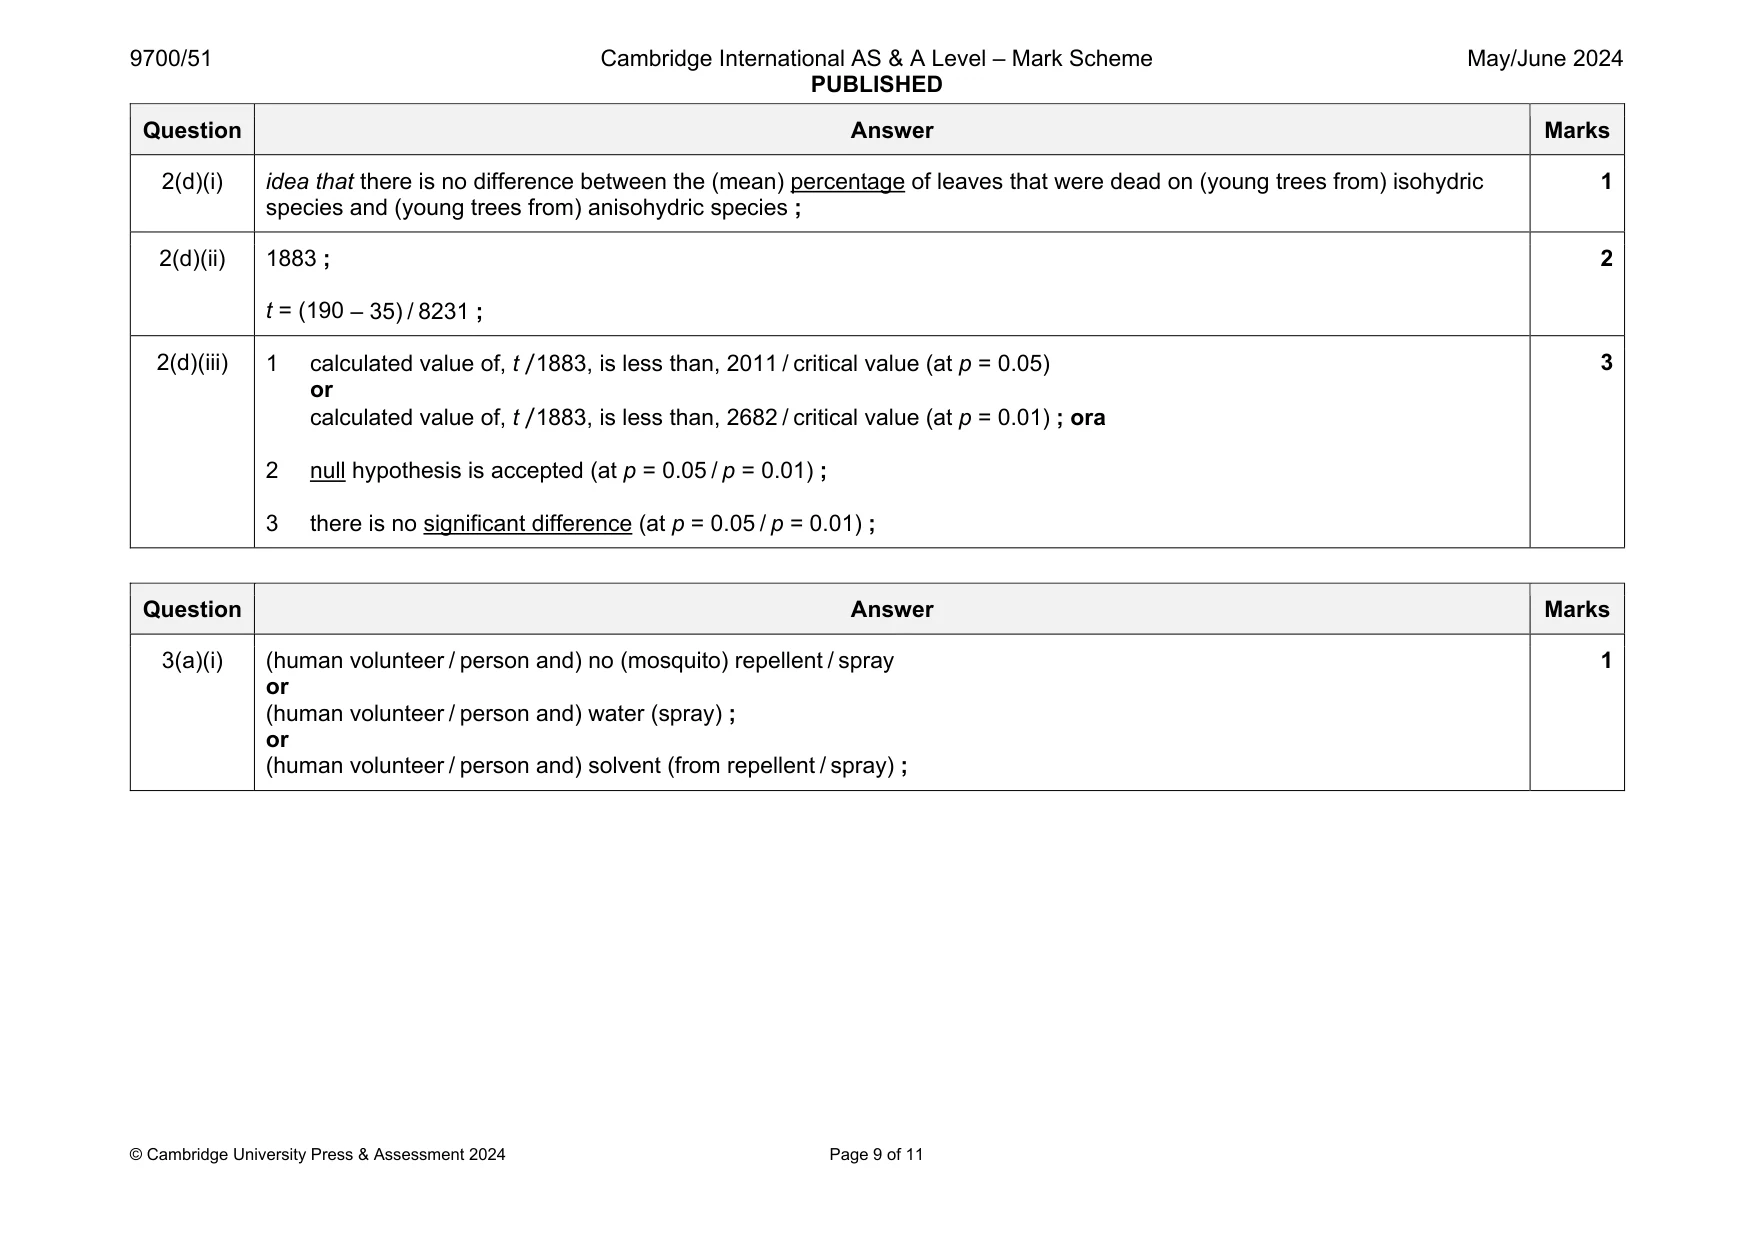
Mark scheme: 2(a) any three from: 1 light intensity ; 2 duration / hours / AW, of light ; 3 volume, of water (added to soil) ; 4 type / pH, of soil ; 5 mineral (ion), concentration (in soil) ; 6 humidity ; 7 carbon dioxide concentration ; 2(b) (high mean temperature leads to) lower / AW (mean stomatal conductance), in both isohydric and anisohydric (species) ; ora 1 Question Answer Marks 2(c) any four from: conclusion: 1 (water stress leads to) lower / AW, (mean stomatal) conductance in isohydric and anisohydric (species) ; ora explanation: 2 idea that (lower stomatal conductance when exposed to water stress indicates that) water loss (by transpiration) is reduced ; conclusion: 3 isohydric (species exposed to water stress and a high temperature) increase (mean stomatal) conductance or increased (mean stomatal) conductance for isohydric (species exposed to water stress and a high temperature) is (statistically) significant ; explanation: 4 idea that (increased mean stomatal conductance in isohydric species exposed to water stress and a high temperature) has a cooling effect ; conclusion: 5 anisohydric (species exposed to water stress and a high temperature) do not change (mean stomatal) conductance or change / difference / decrease / AW, in (mean stomatal) conductance for anisohydric (species exposed to water stress and a high temperature) is not (statistically) significant ; explanation: 6 idea that (unchanged mean stomatal conductance in anisohydric species when exposed to water stress and a high temperature) to allow carbon dioxide uptake (for photosynthesis) ; conclusion: 7 paired data quote to support conclusion ; 4 Question Answer Marks 2(d)(i) idea that there is no difference between the (mean) percentage of leaves that were dead on (young trees from) isohydric species and (young trees from) anisohydric species ; 1 2(d)(ii) 1883 ; t = (190 – 35) / 8231 ; 2 2(d)(iii) 1 calculated value of, t /1883, is less than, 2011 / critical value (at p = 0.05) or calculated value of, t /1883, is less than, 2682 / critical value (at p = 0.01) ; ora 2 null hypothesis is accepted (at p = 0.05 / p = 0.01) ; 3 there is no significant difference (at p = 0.05 / p = 0.01) ; 3
Q3 · The young trees were given a reduced supply of water for five weeks (water stress)
3 The young trees were given a reduced supply of water for five weeks (water stress). The mean glasshouse temperature during weeks 1 to 5 was 28 °C.
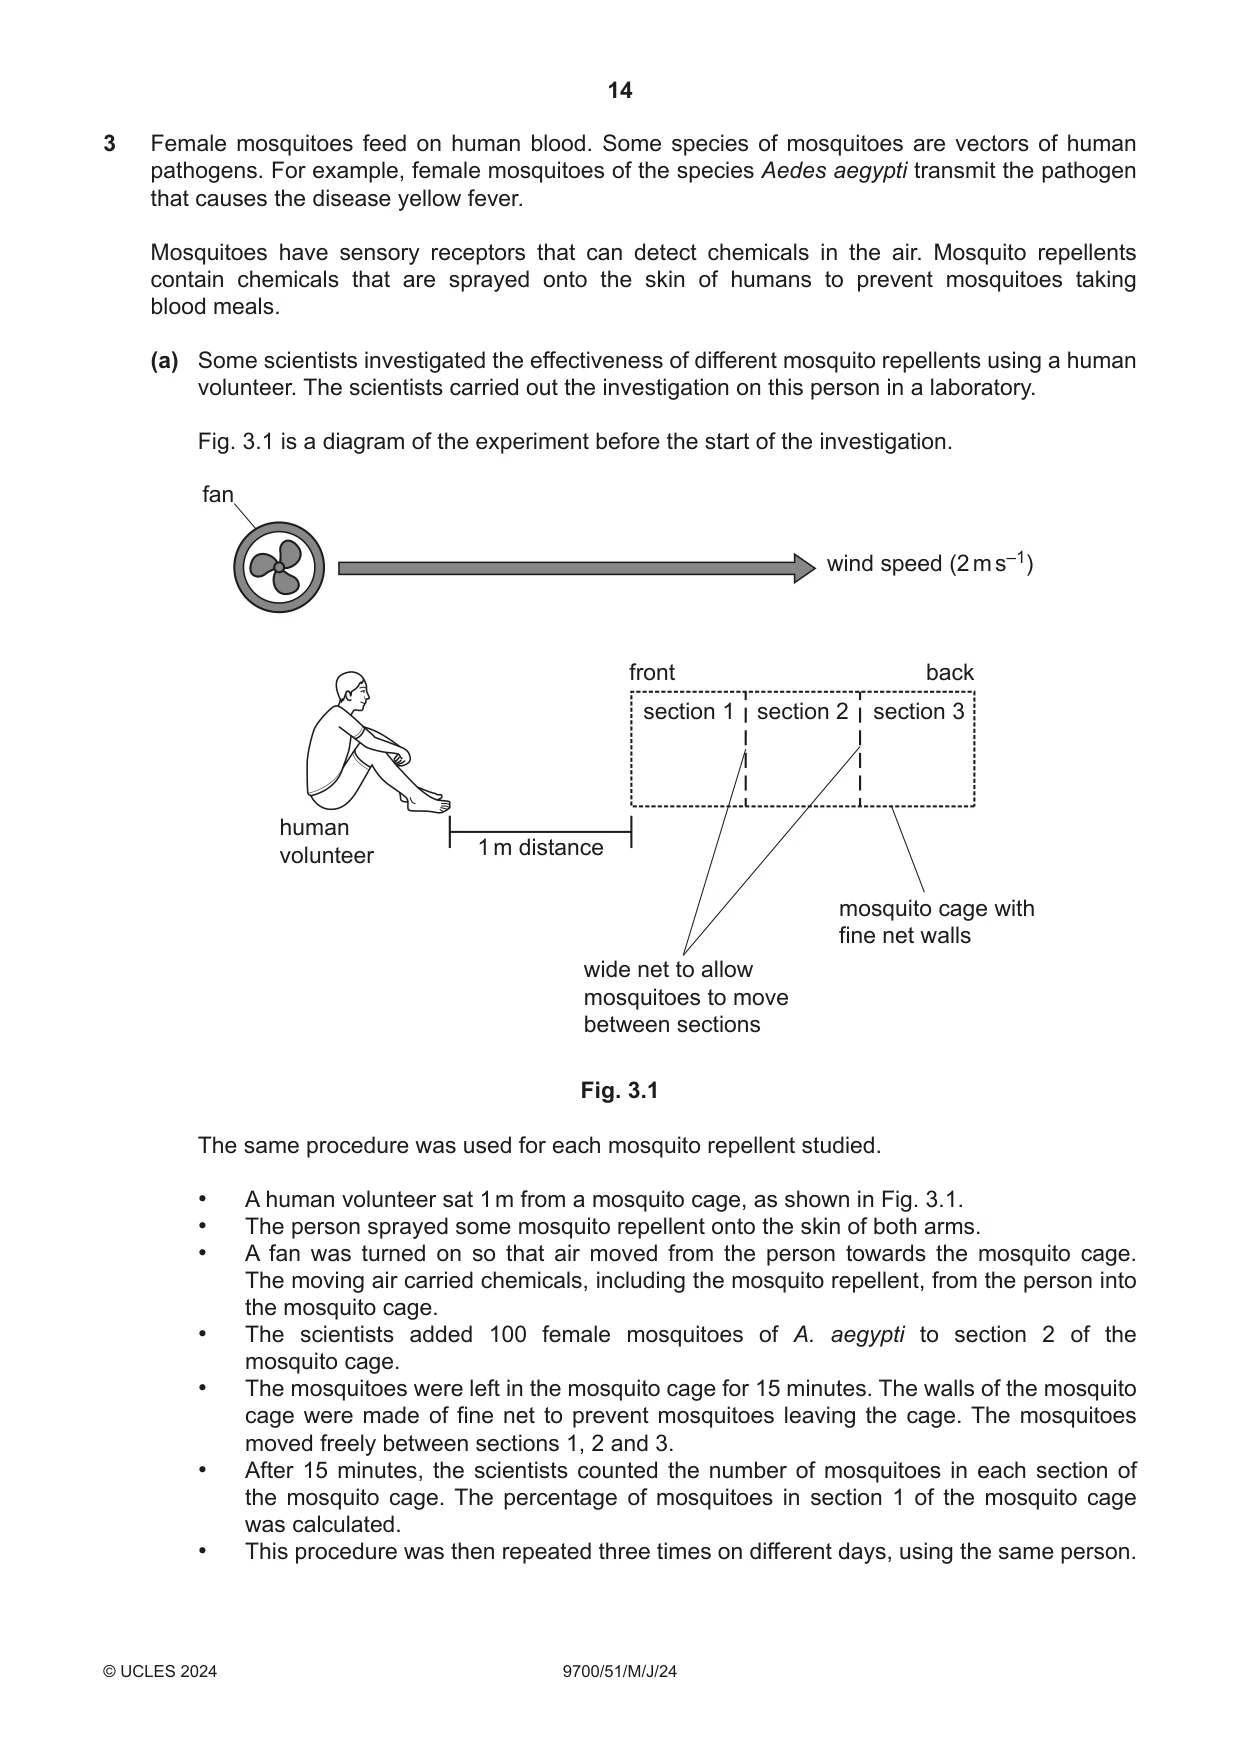
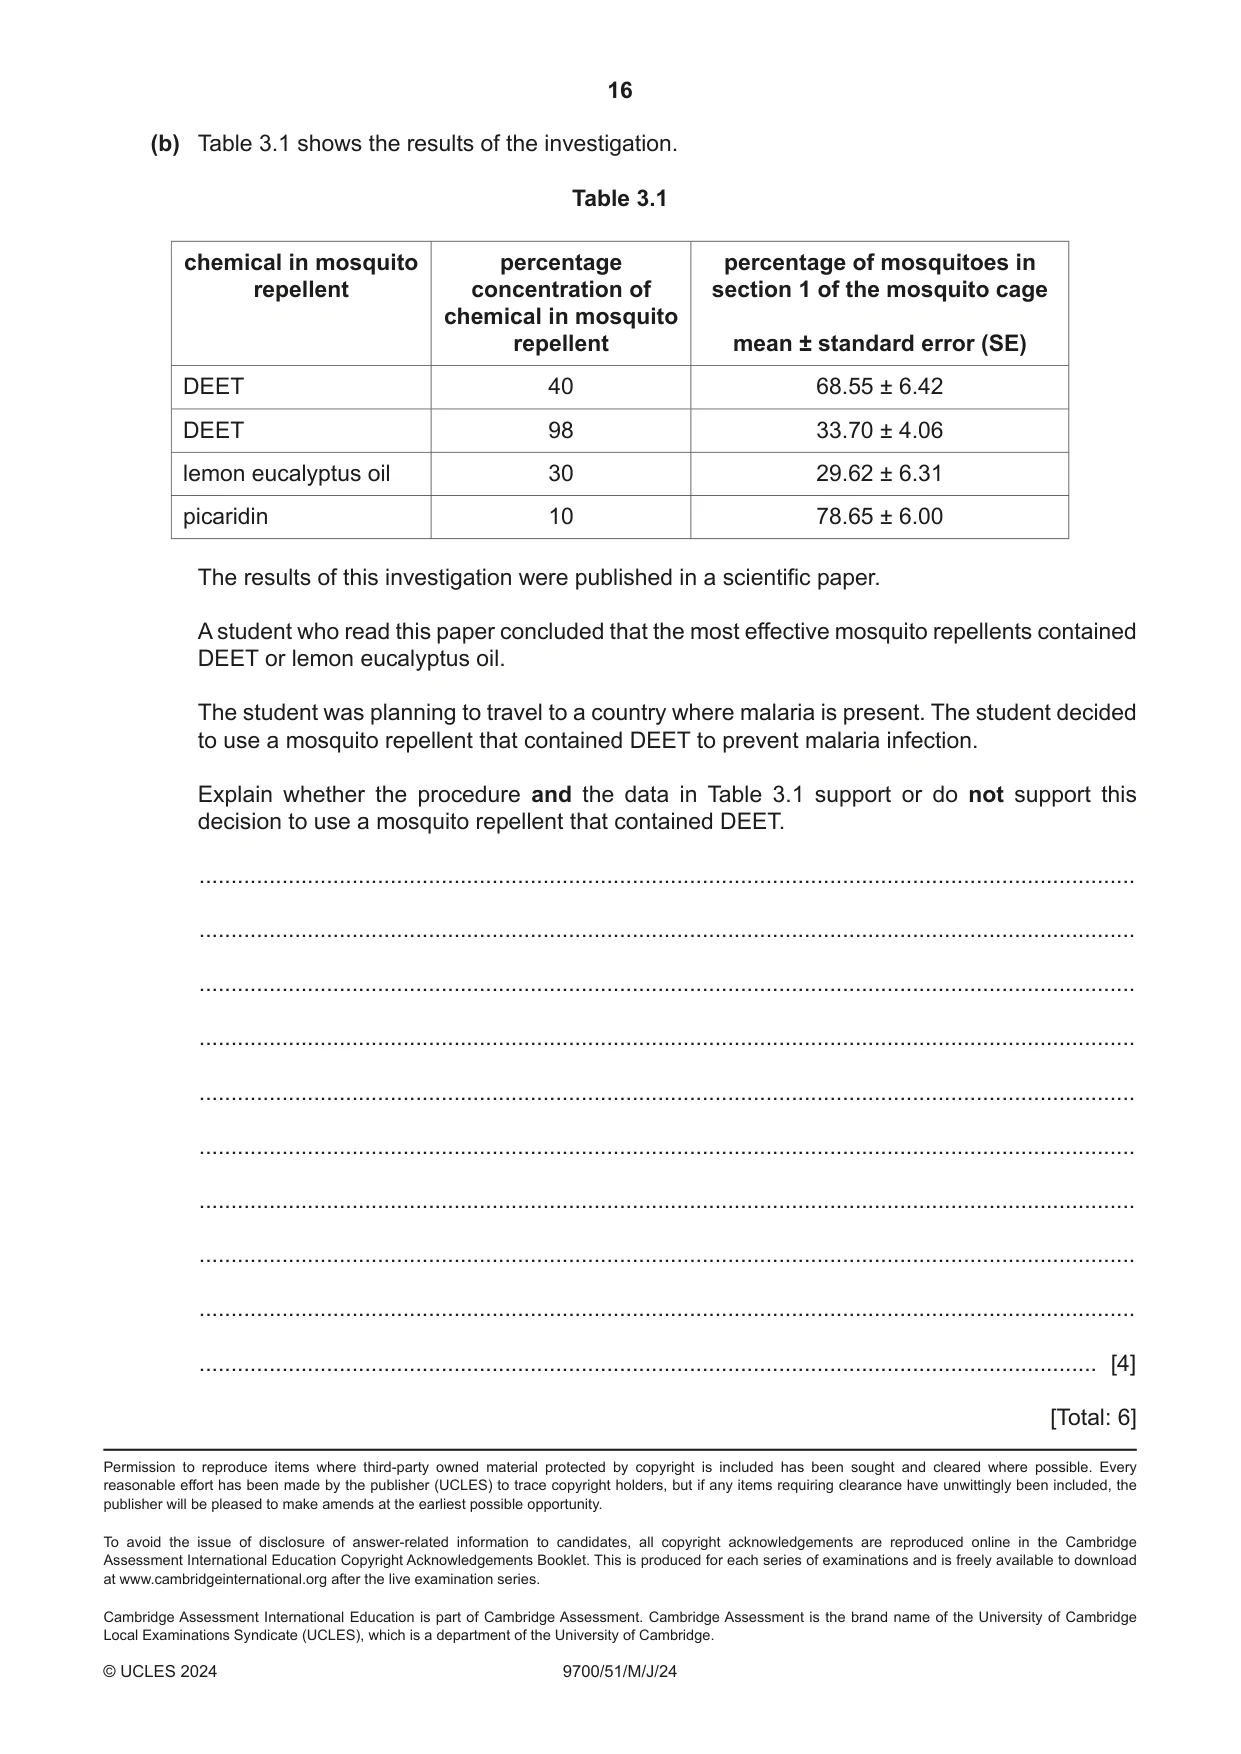
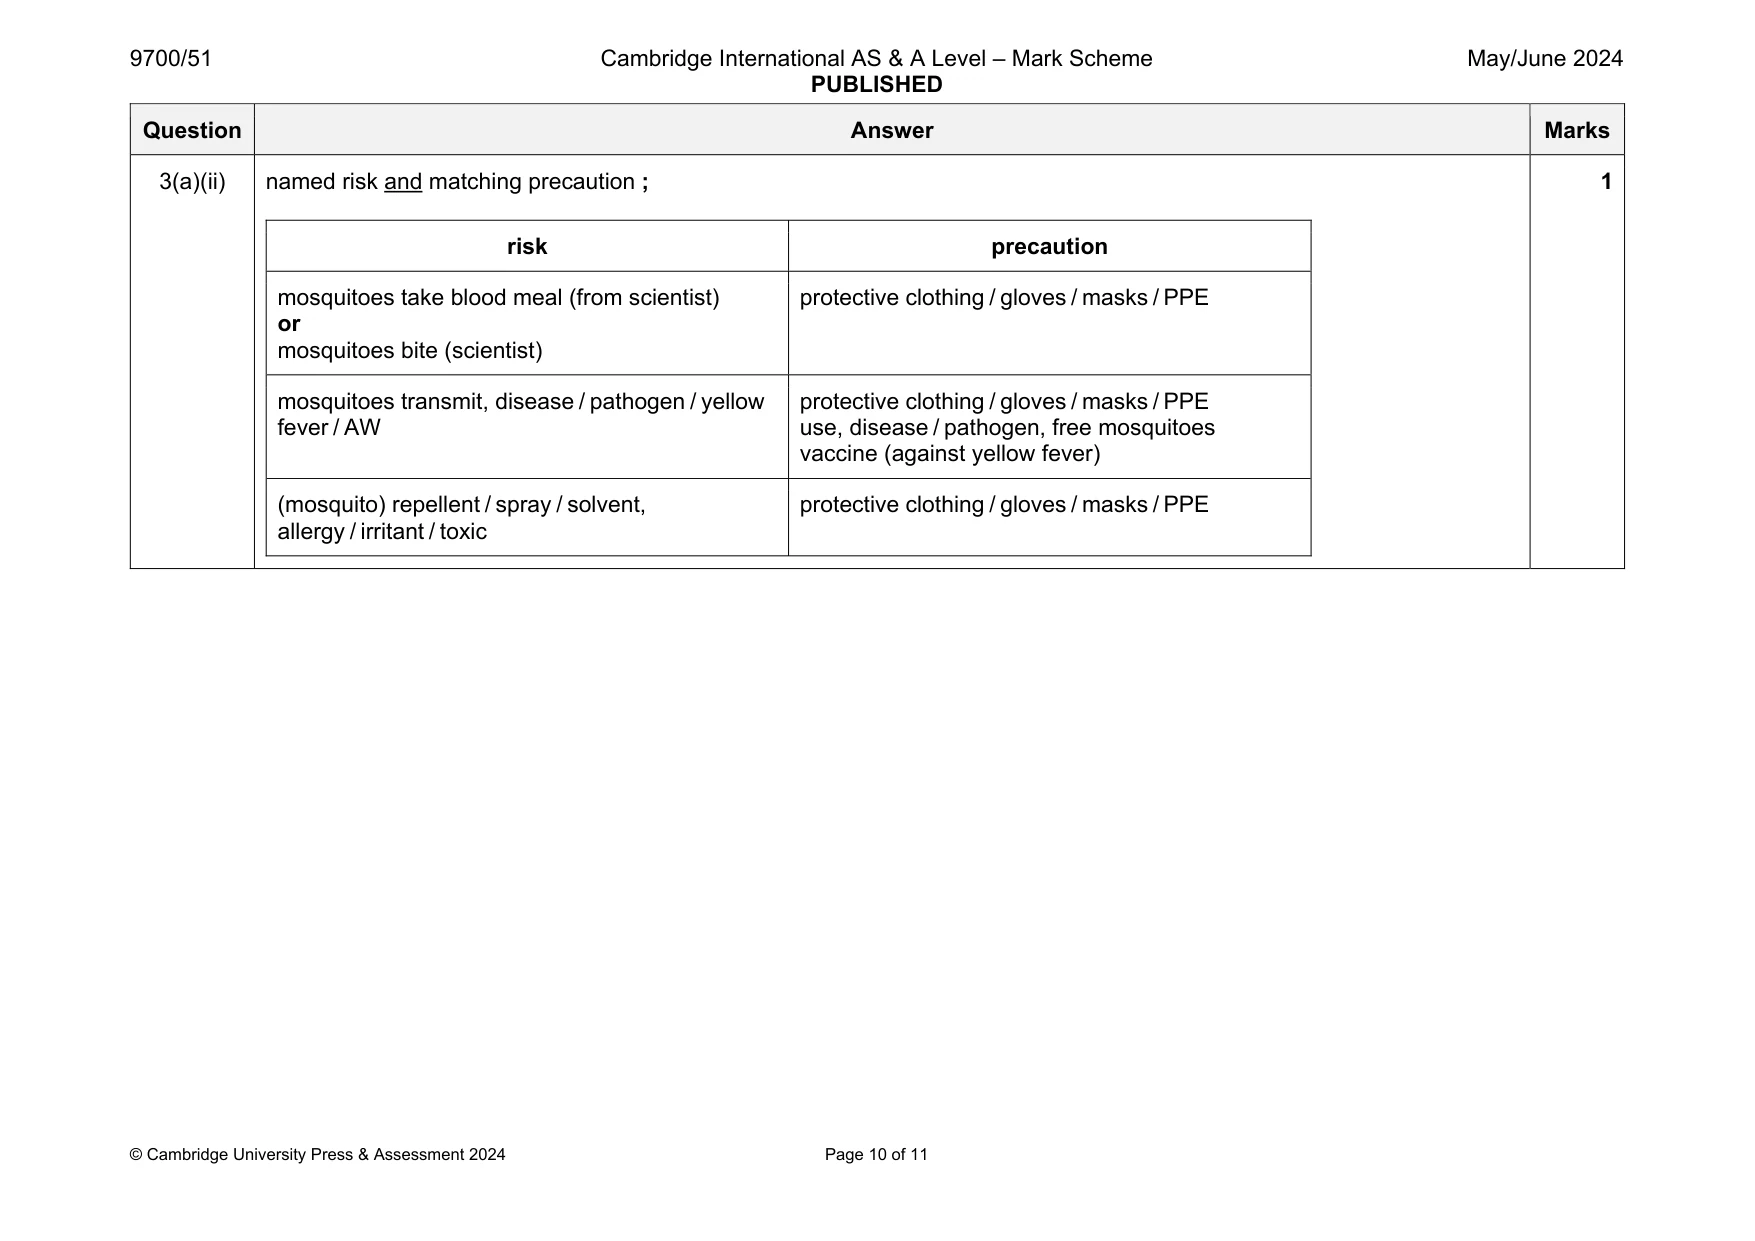
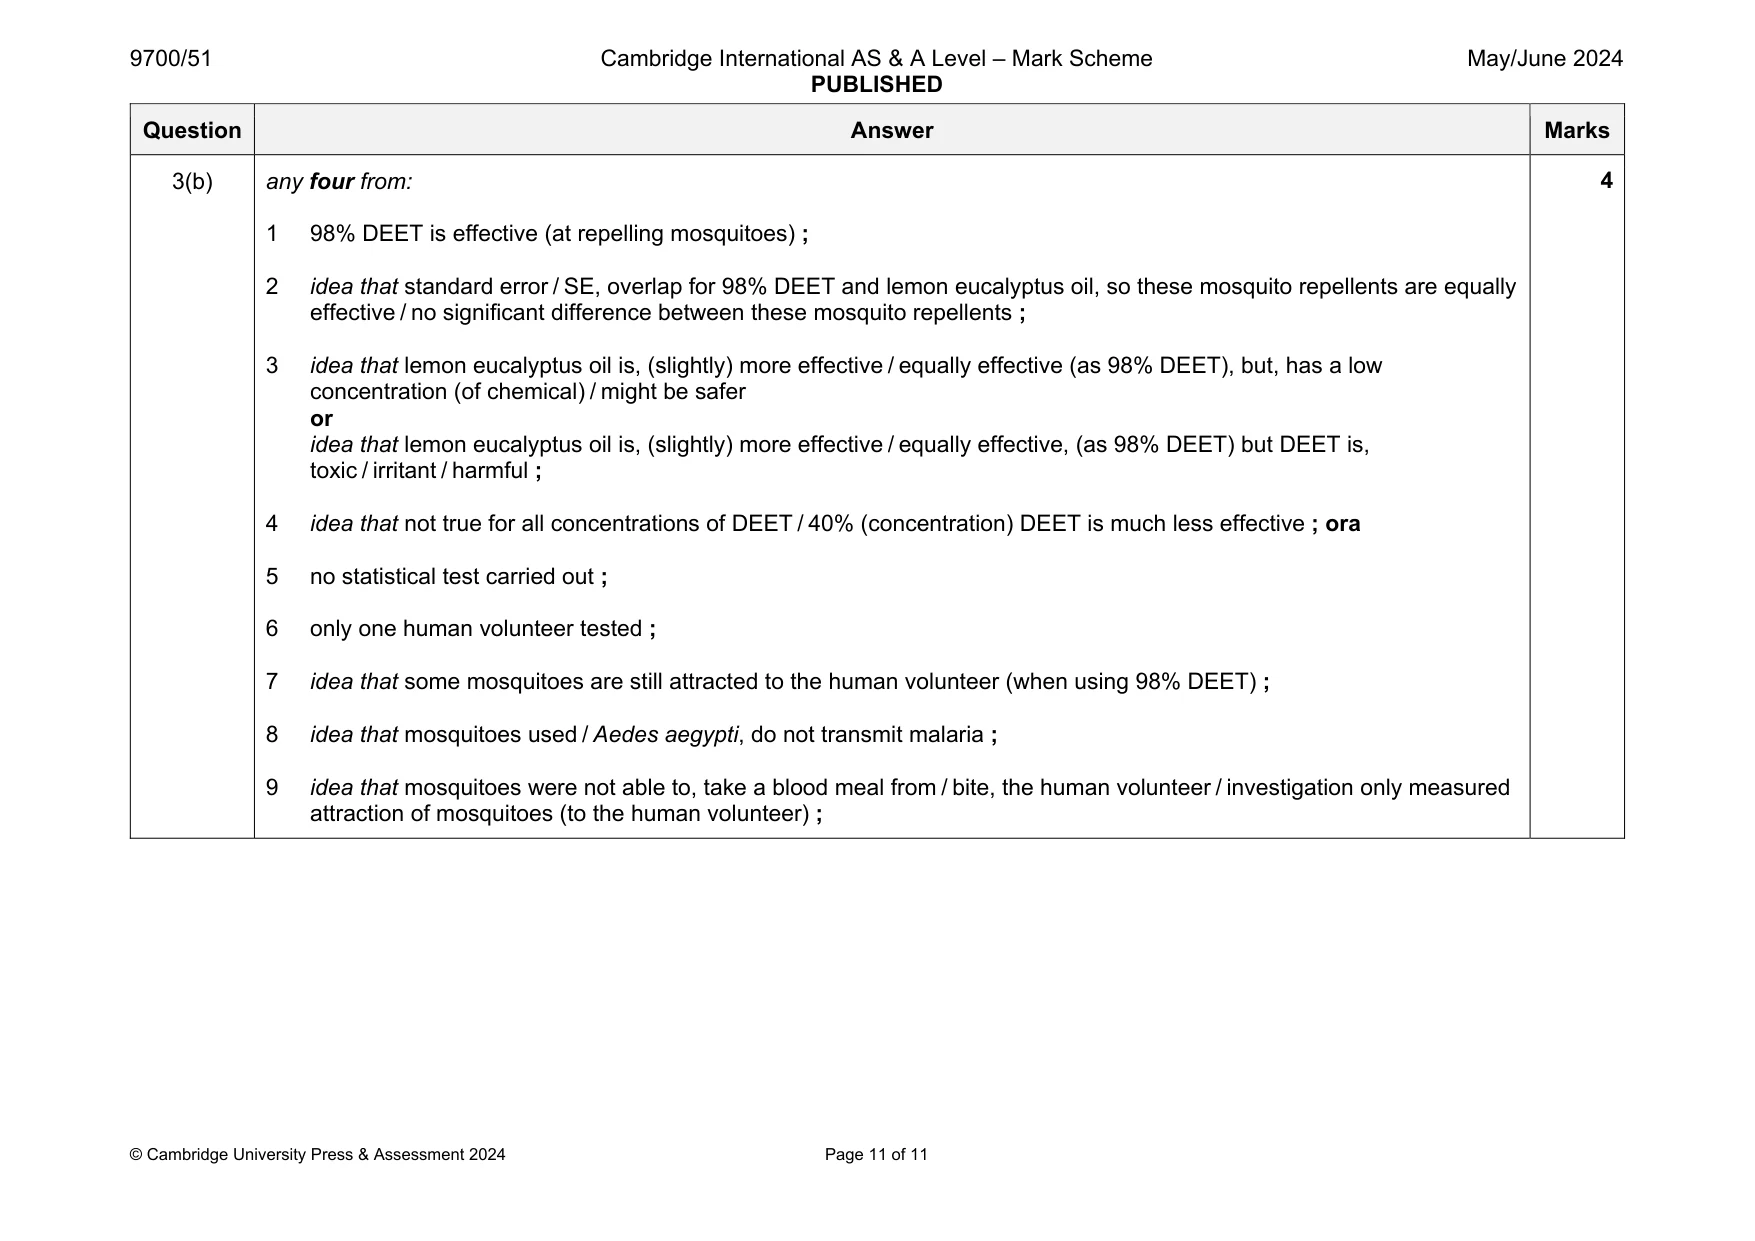
Mark scheme: 3(a)(i) (human volunteer / person and) no (mosquito) repellent / spray or (human volunteer / person and) water (spray) ; or (human volunteer / person and) solvent (from repellent / spray) ; Question Answer Marks 3(a)(ii) named risk and matching precaution ; risk precaution mosquitoes take blood meal (from scientist) or mosquitoes bite (scientist) protective clothing / gloves / masks / PPE mosquitoes transmit, disease / pathogen / yellow fever / AW protective clothing / gloves / masks / PPE use, disease / pathogen, free mosquitoes vaccine (against yellow fever) (mosquito) repellent / spray / solvent, allergy / irritant / toxic protective clothing / gloves / masks / PPE 1 Question Answer Marks 3(b) any four from: 1 98% DEET is effective (at repelling mosquitoes) ; 2 idea that standard error / SE, overlap for 98% DEET and lemon eucalyptus oil, so these mosquito repellents are equally effective / no significant difference between these mosquito repellents ; 3 idea that lemon eucalyptus oil is, (slightly) more effective / equally effective (as 98% DEET), but, has a low concentration (of chemical) / might be safer or idea that lemon eucalyptus oil is, (slightly) more effective / equally effective, (as 98% DEET) but DEET is, toxic / irritant / harmful ; 4 idea that not true for all concentrations of DEET / 40% (concentration) DEET is much less effective ; ora 5 no statistical test carried out ; 6 only one human volunteer tested ; 7 idea that some mosquitoes are still attracted to the human volunteer (when using 98% DEET) ; 8 idea that mosquitoes used / Aedes aegypti, do not transmit malaria ; 9 idea that mosquitoes were not able to, take a blood meal from / bite, the human volunteer / investigation only measured attraction of mosquitoes (to the human volunteer) ; 4
Q4 · The young trees were given a reduced supply of water for five weeks (water stress)
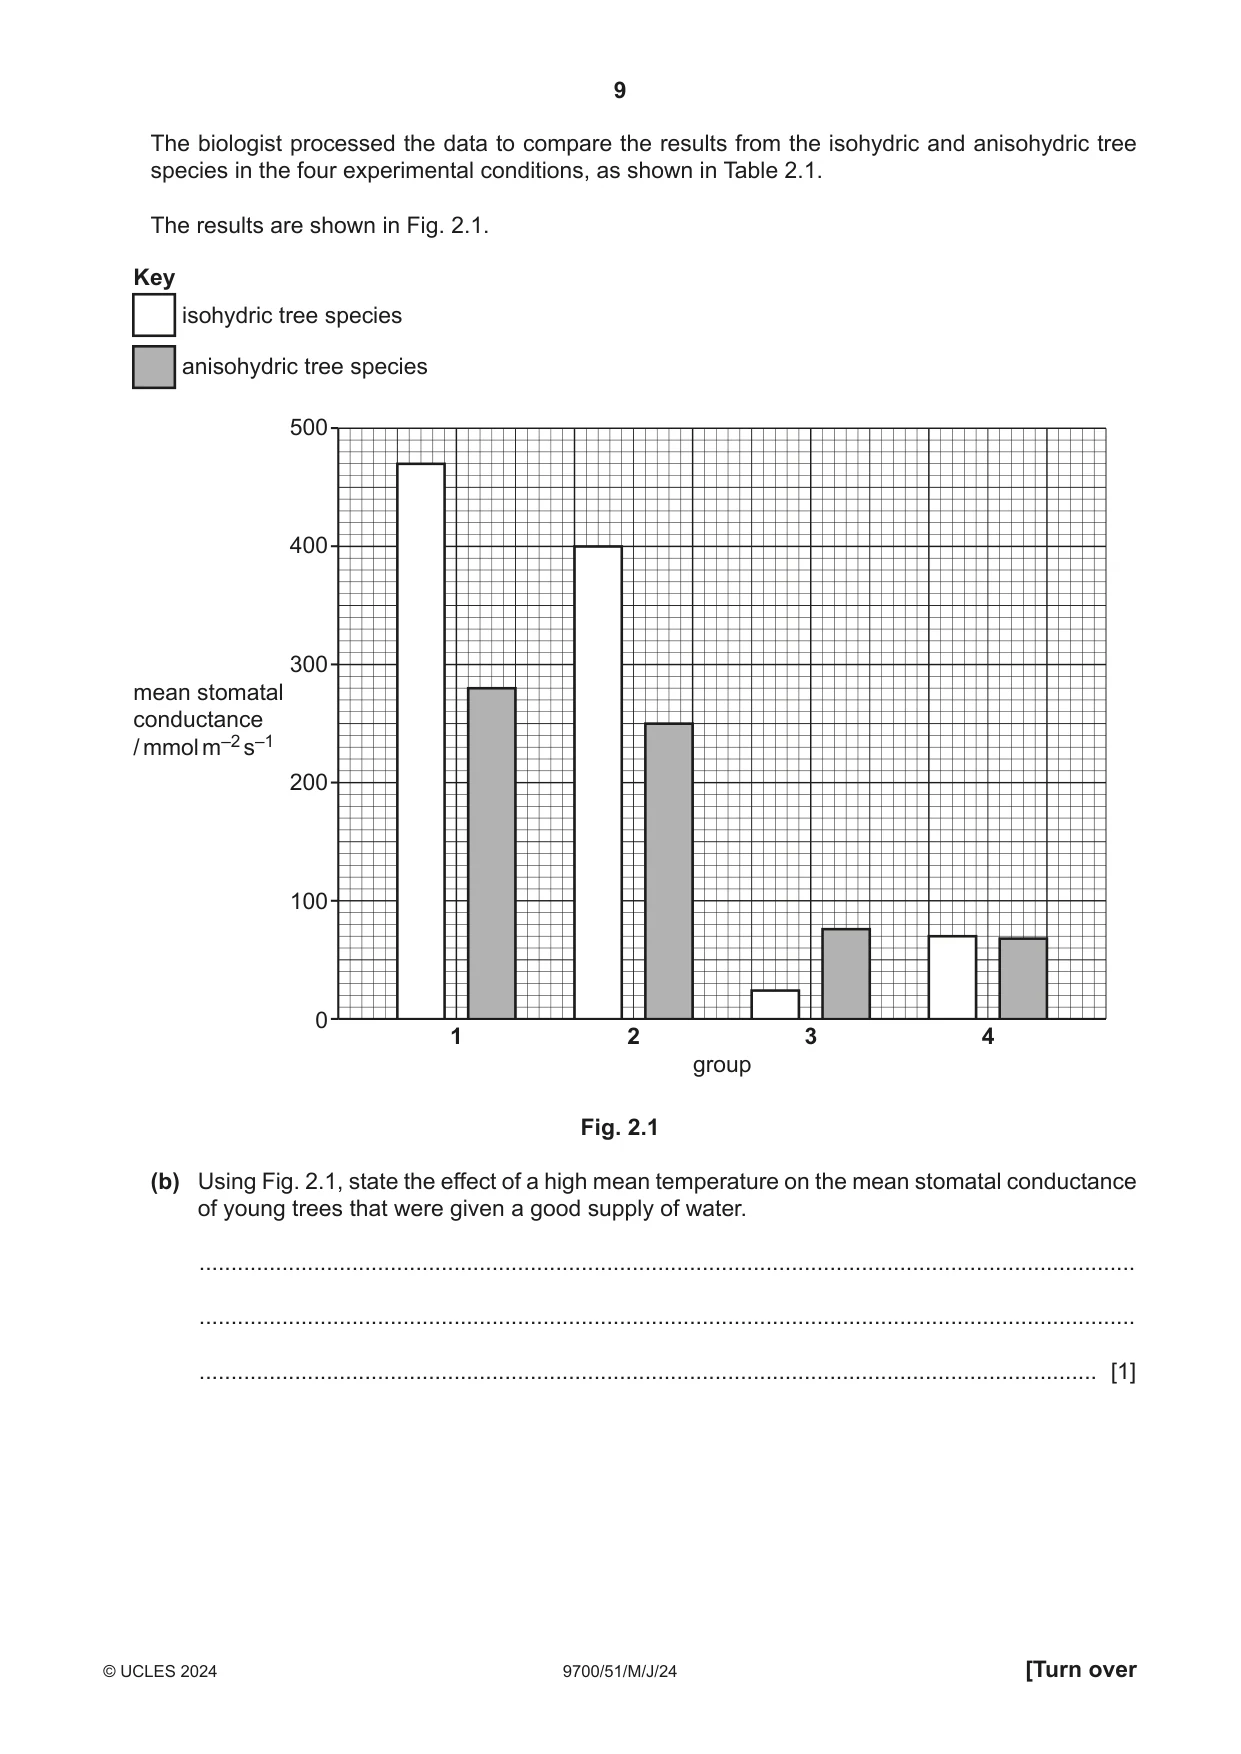
4 The young trees were given a reduced supply of water for five weeks (water stress). The mean glasshouse temperature during weeks 1 to 4 was 28 °C. During week 5, the mean glasshouse temperature was increased to 35 °C. At the end of week 5, the biologist measured the stomatal conductance of three leaves from each young tree at 12:00 (midday). Stomatal conductance is a measure of water vapour loss from the intercellular air spaces of leaves to the atmosphere through the stomata. The biologist processed the data to compare the results from the isohydric and anisohydric tree species in the four experimental conditions, as shown in Table 2.1. The results are shown in Fig. 2.1. Key isohydric tree species anisohydric tree species 500 400 300 mean stomatal conductance / mmol m–2 s–1 200 100 0 1 2 3 4 group Fig. 2.1 (b) Using Fig. 2.1, state the effect of a high mean temperature on the mean stomatal conductance of young trees that were given a good supply of water. ................................................................................................................................................... ................................................................................................................................................... ............................................................................................................................................. [1] (c) The biologist then compared the young trees from group 3 and group 4 that were exposed to water stress. The biologist carried out statistical tests on the data to see if the difference between the mean stomatal conductance of young trees in group 3 and the mean stomatal conductance of young trees in group 4 was significant. Table 2.2 shows the probability values (p) from the results of the statistical tests. Table 2.2 tree species value of p significance isohydric tree species 0.046 significant anisohydric tree species 0.788 not significant With reference to Fig. 2.1 and Table 2.2, suggest and explain the conclusions that can be made about the effect of water stress and a high environmental temperature on isohydric and anisohydric tree species. ................................................................................................................................................... ................................................................................................................................................... ................................................................................................................................................... ................................................................................................................................................... ................................................................................................................................................... ................................................................................................................................................... ................................................................................................................................................... ................................................................................................................................................... ................................................................................................................................................... ................................................................................................................................................... ............................................................................................................................................. [4]
What was in this paper
The subtopics covered by these 4 questions, and how many questions each got. Open one in a new tab to see every Cambridge question on it.
What you needed in this session
Cambridge’s own grade thresholds for 2024 May/June, Paper 5 · Variant 1. A higher threshold means an easier paper — the bar moves with how the cohort did.