Cambridge A Level Biology 9700 — 2023 May/June Paper 5 · Variant 1
9700/51/M/J/23 · 2 questions · 30 marks · ≈34 min
The question paper and its mark scheme, free to read here and free to download. This is Cambridge’s own paper, exactly as it was sat.
Question paper20 pages


Mark scheme12 pages
Answers below. Sit the paper first if you are practising.
Questions as text
Q1 · Catalase is an enzyme that is found in many plant cells and animal cells
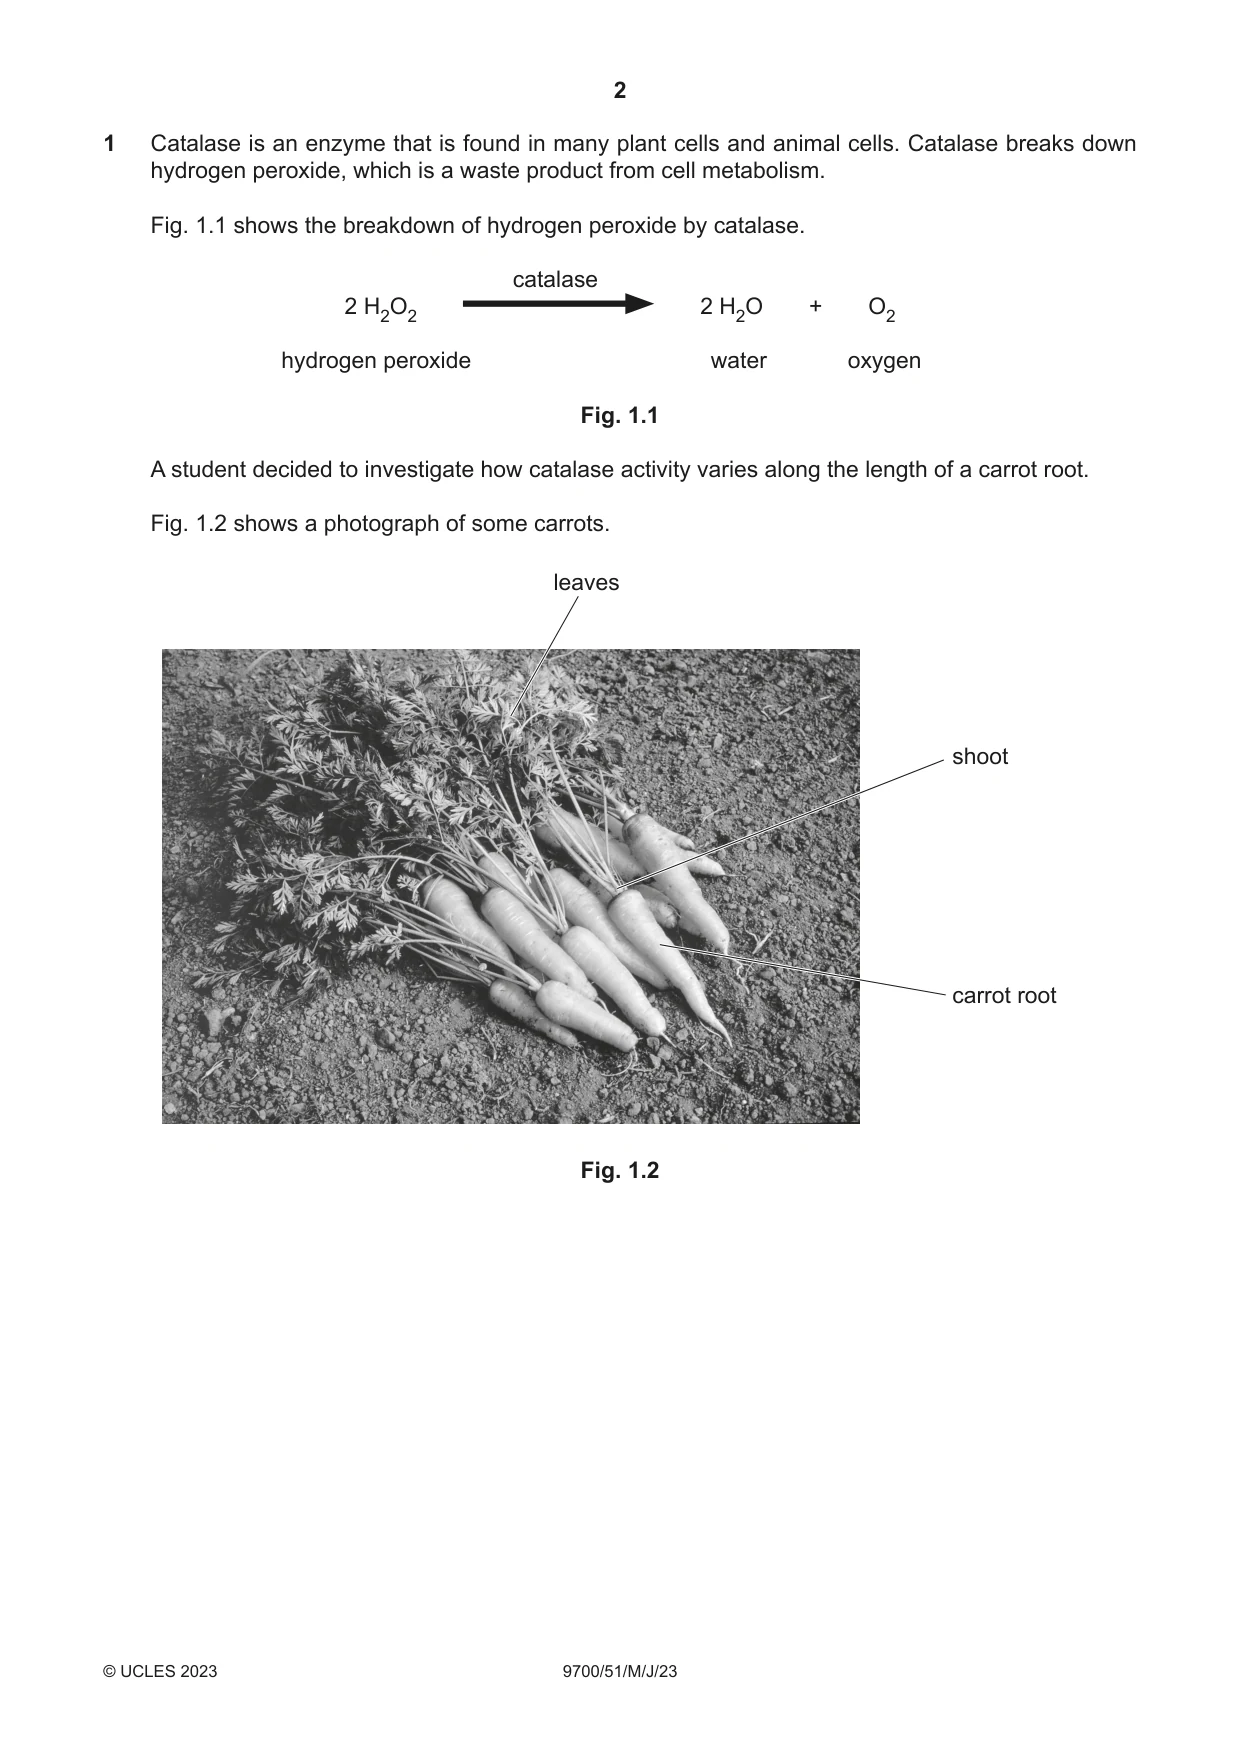
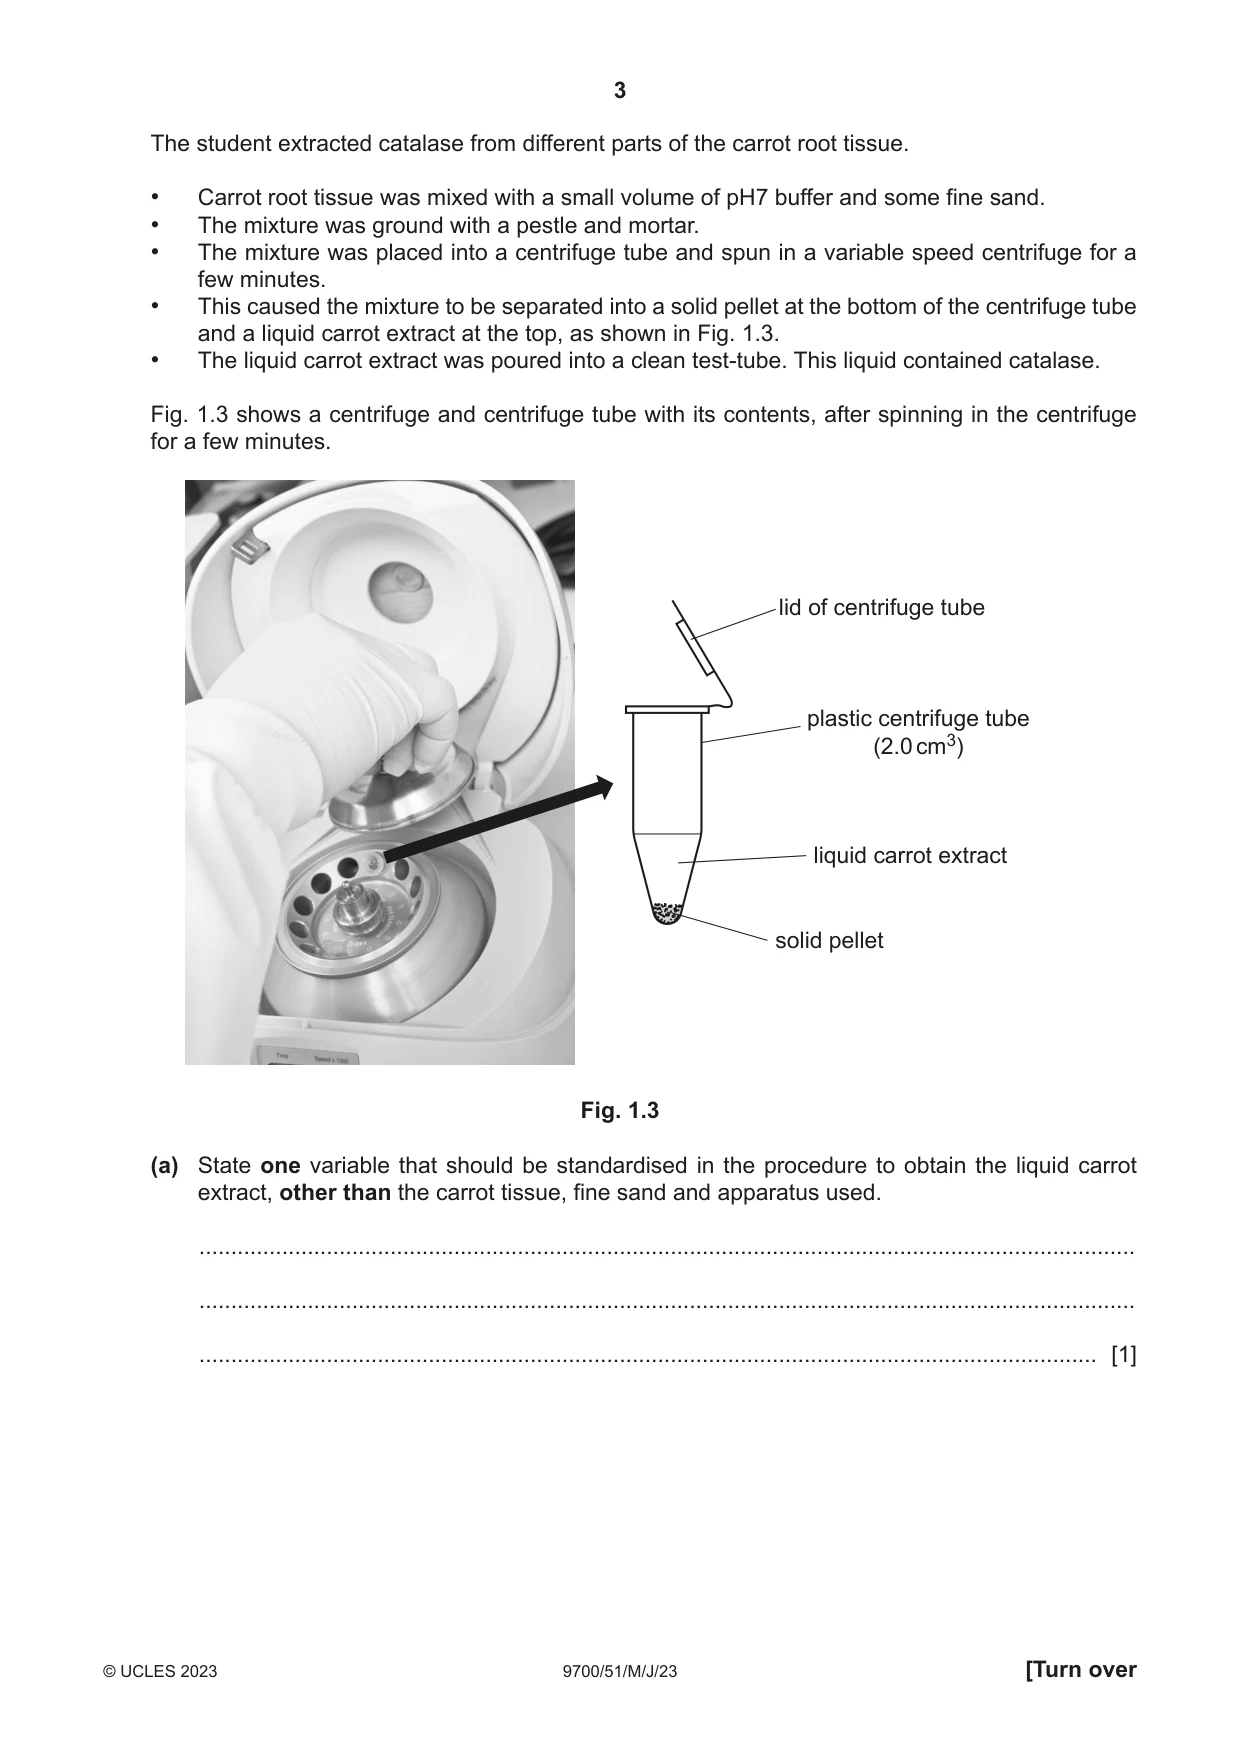
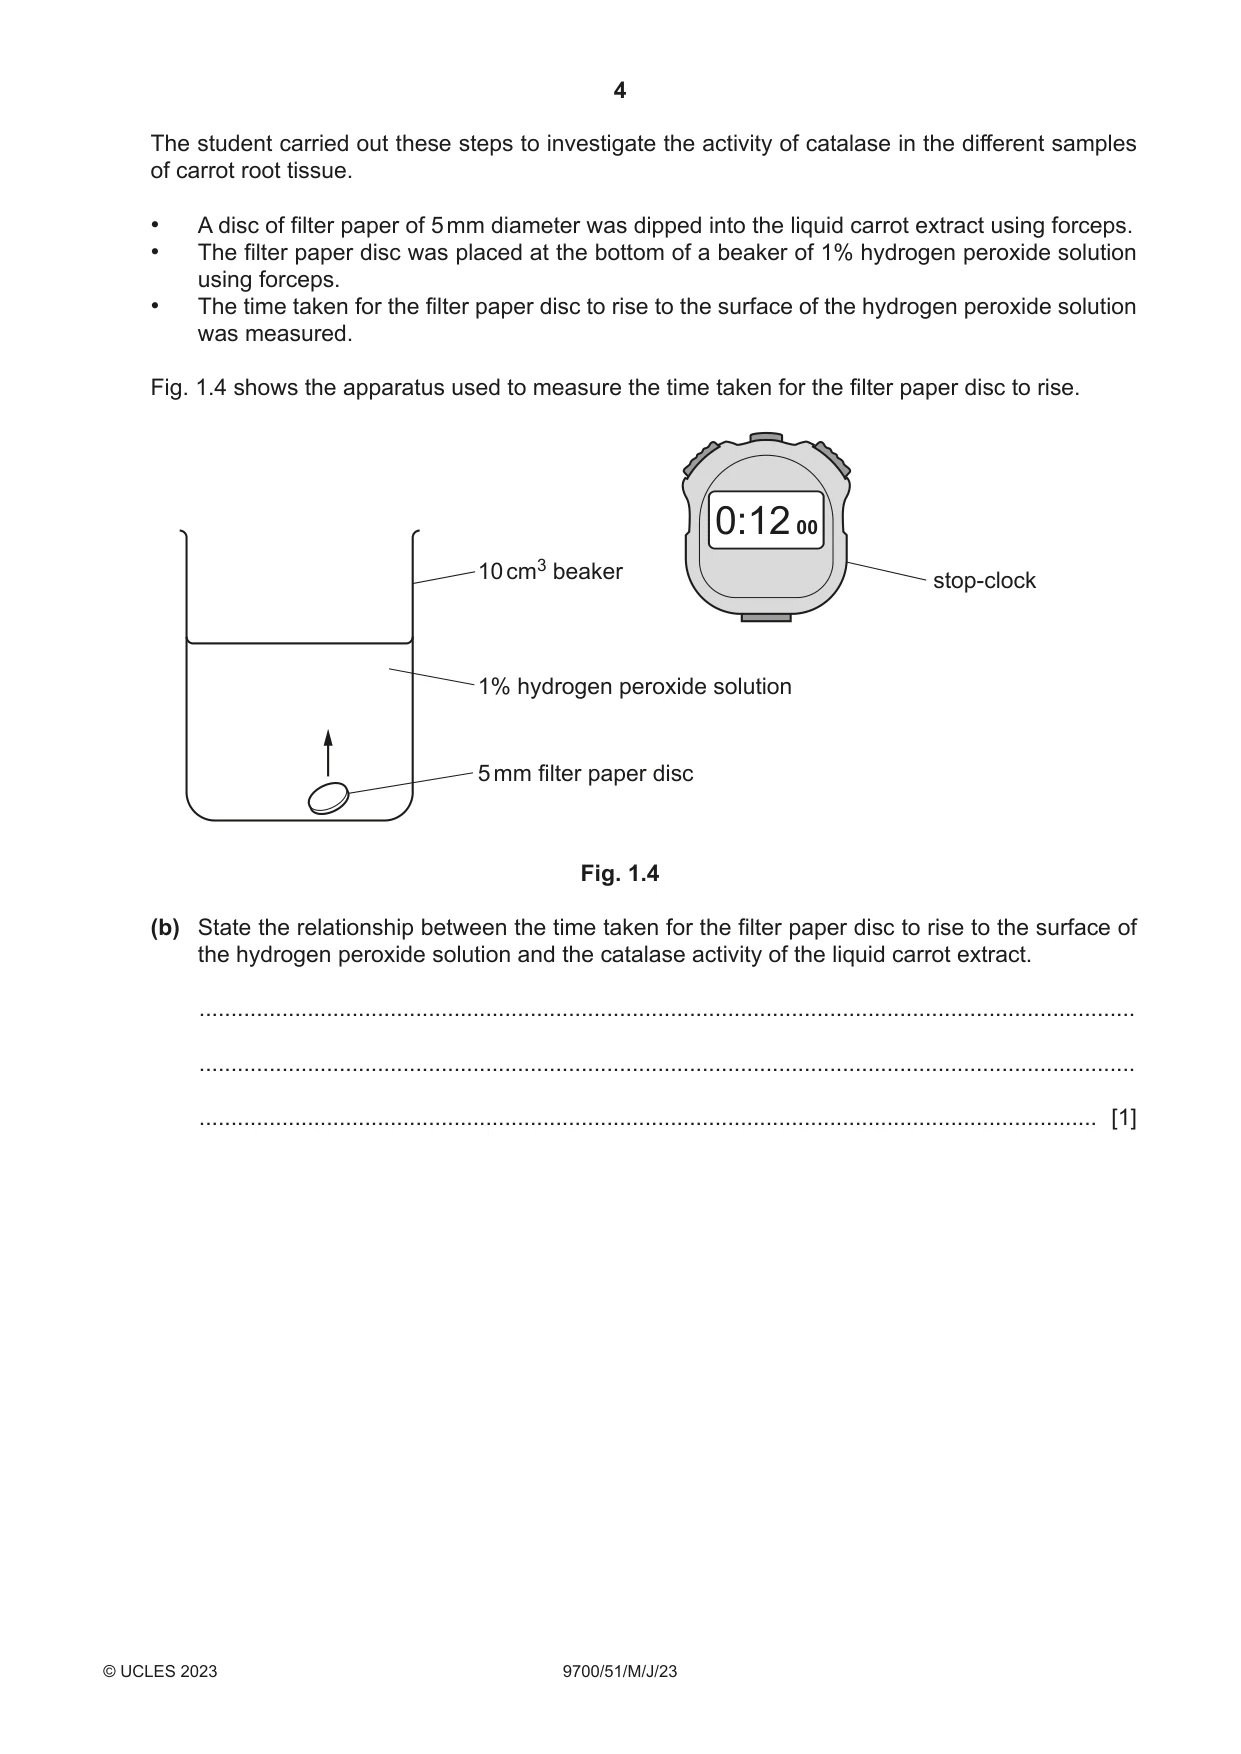
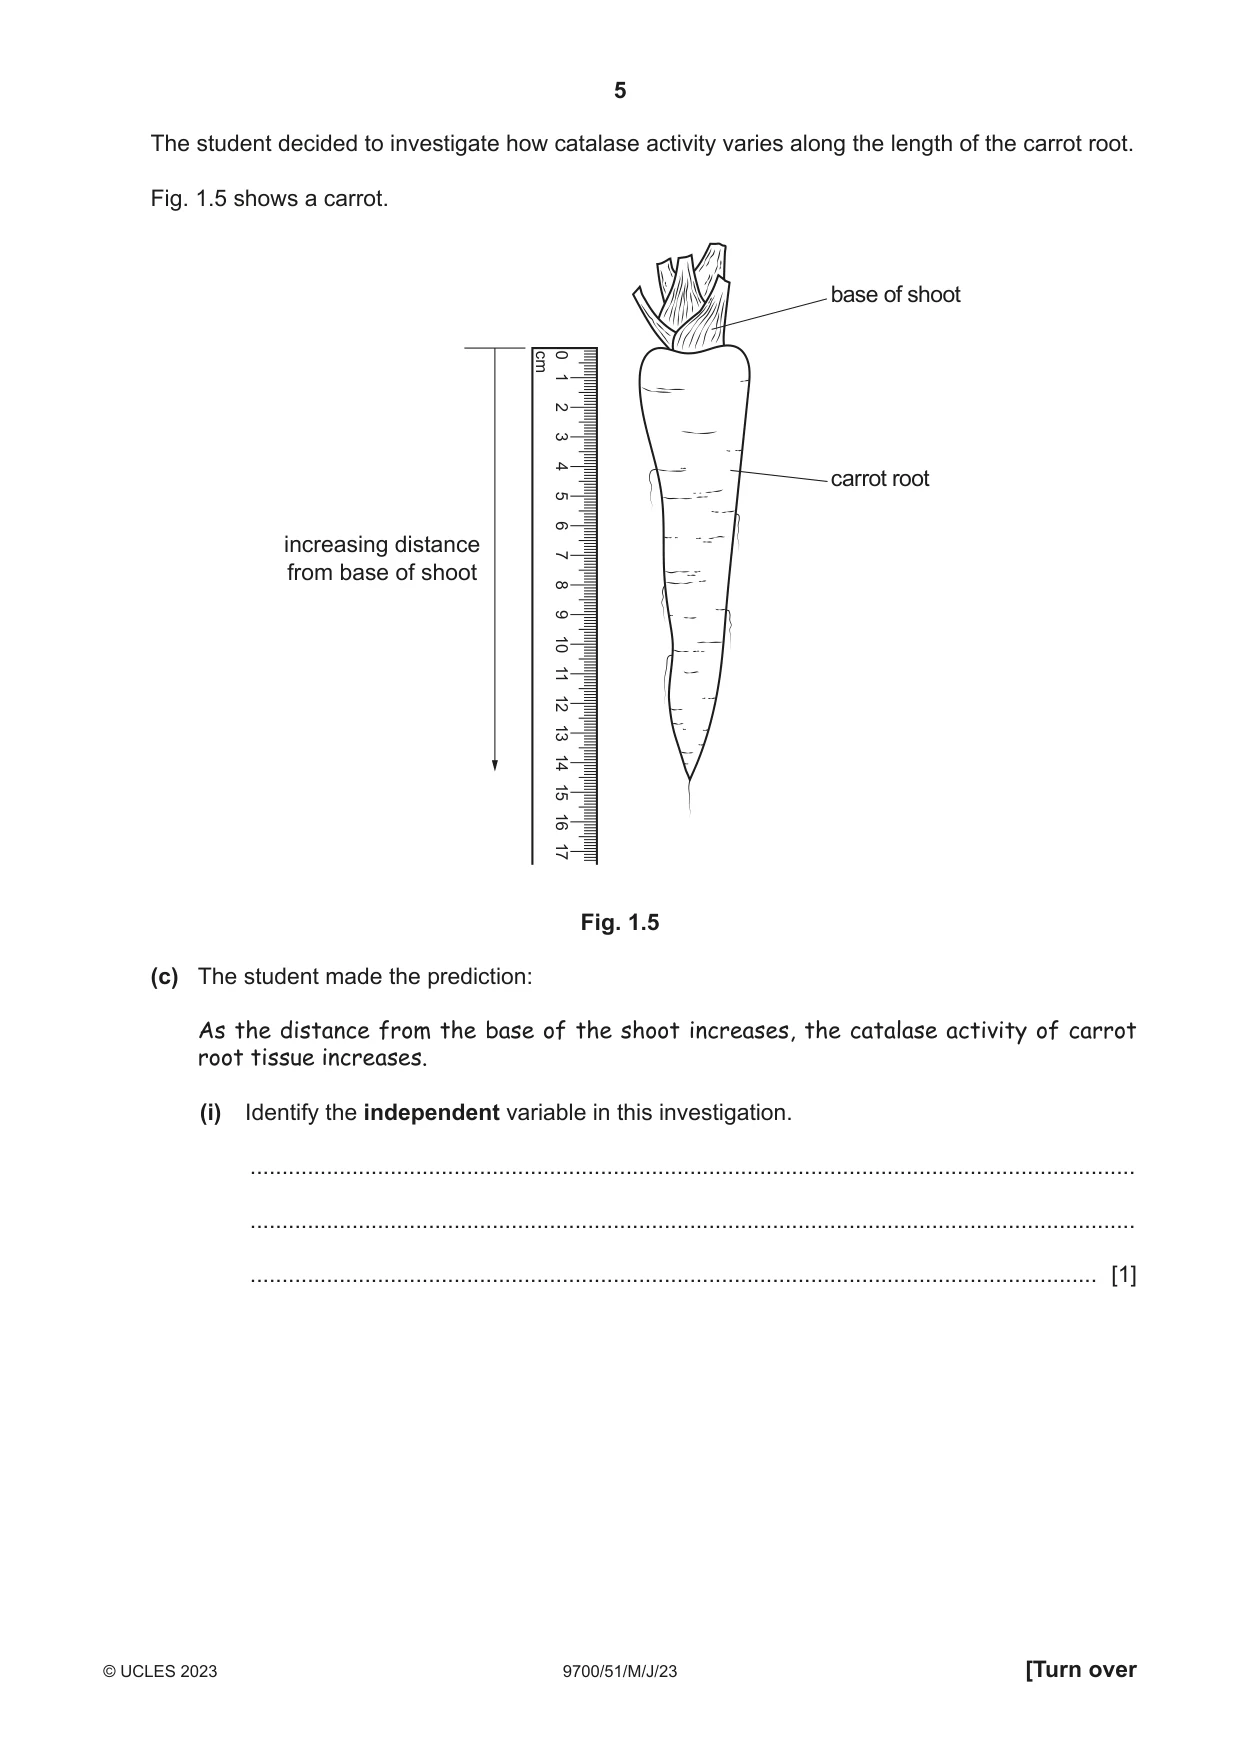
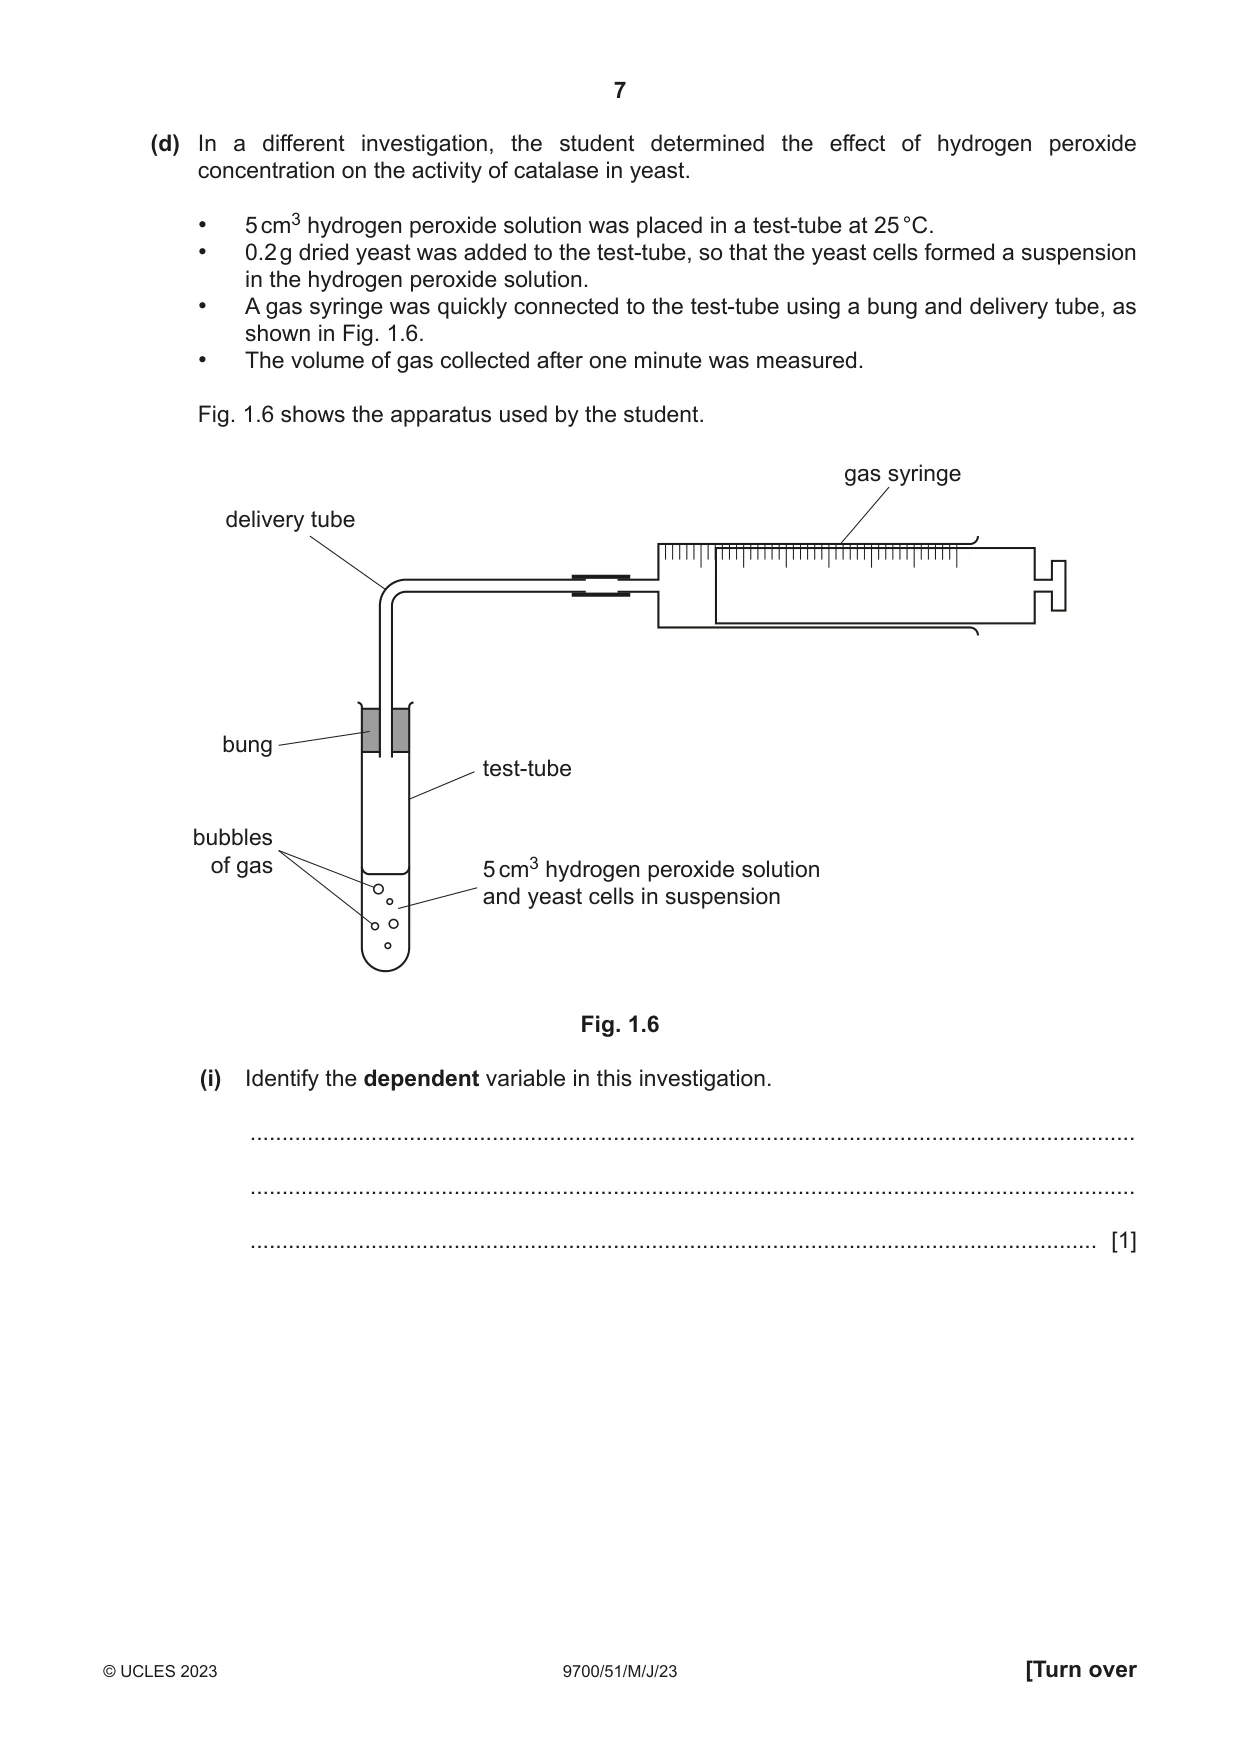
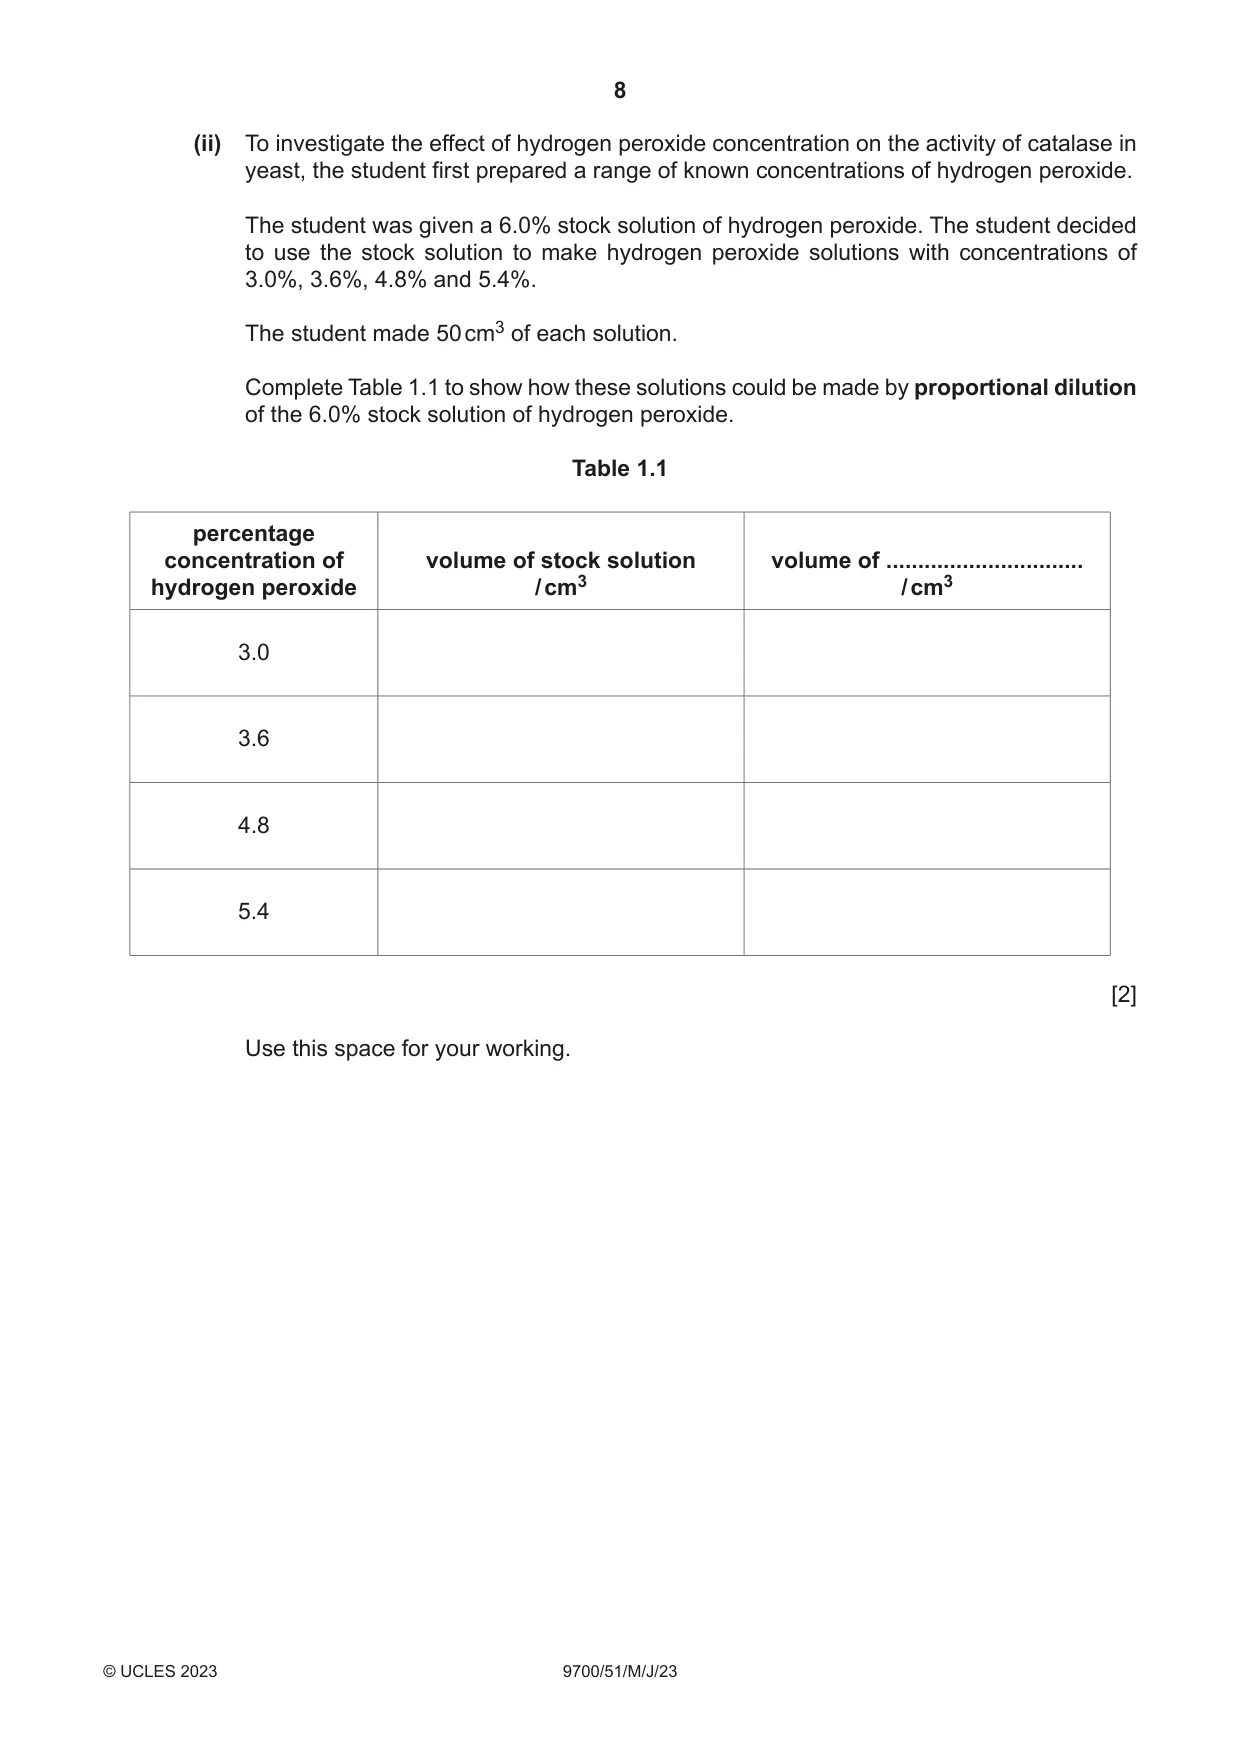
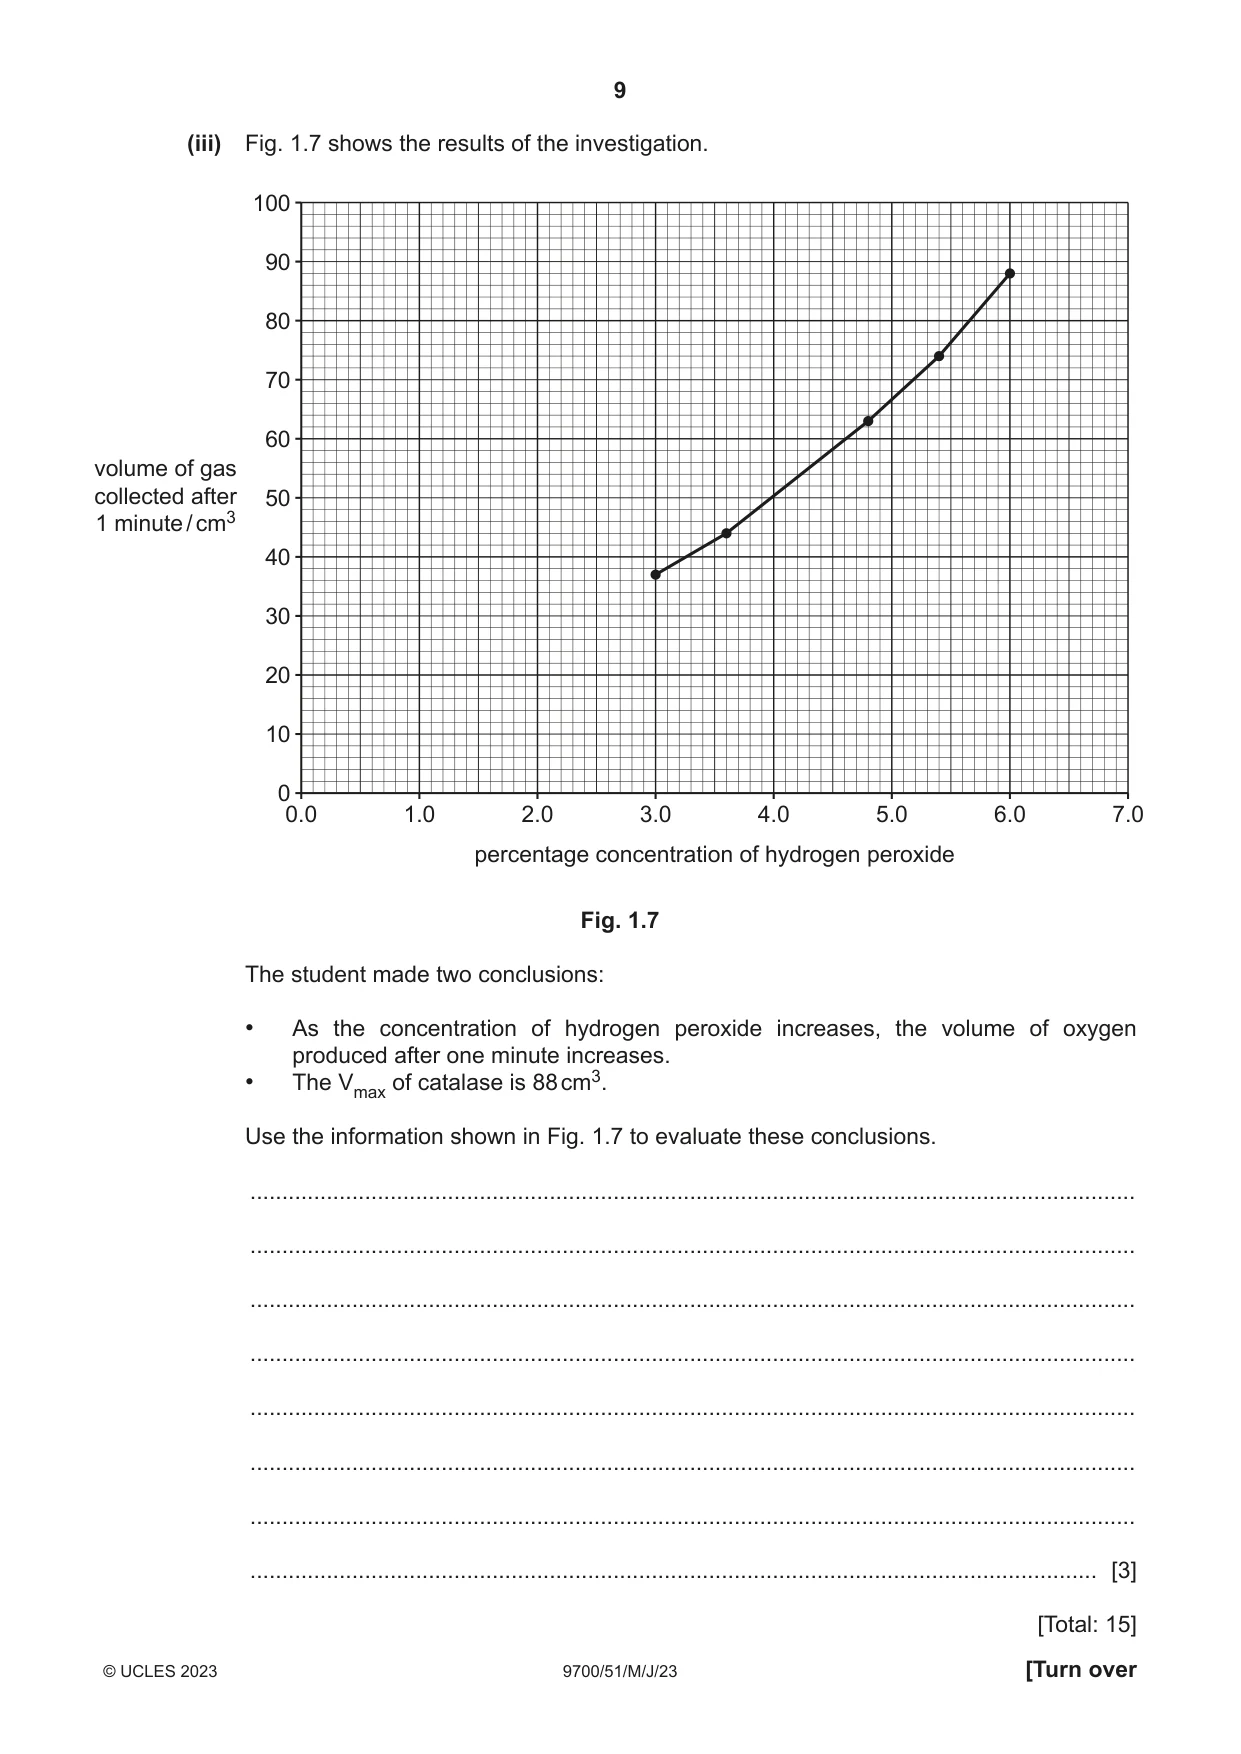
1 Catalase is an enzyme that is found in many plant cells and animal cells. Catalase breaks down hydrogen peroxide, which is a waste product from cell metabolism. Fig. 1.1 shows the breakdown of hydrogen peroxide by catalase. catalase 2 H2O2 2 H2O + O2 hydrogen peroxide water oxygen Fig. 1.1 A student decided to investigate how catalase activity varies along the length of a carrot root. Fig. 1.2 shows a photograph of some carrots. leaves shoot carrot root Fig. 1.2 The student extracted catalase from different parts of the carrot root tissue. • Carrot root tissue was mixed with a small volume of pH7 buffer and some fine sand. • The mixture was ground with a pestle and mortar. • The mixture was placed into a centrifuge tube and spun in a variable speed centrifuge for a few minutes. • This caused the mixture to be separated into a solid pellet at the bottom of the centrifuge tube and a liquid carrot extract at the top, as shown in Fig. 1.3. • The liquid carrot extract was poured into a clean test-tube. This liquid contained catalase. Fig. 1.3 shows a centrifuge and centrifuge tube with its contents, after spinning in the centrifuge for a few minutes. lid of centrifuge tube plastic centrifuge tube (2.0 cm3) liquid carrot extract solid pellet Fig. 1.3 (a) State one variable that should be standardised in the procedure to obtain the liquid carrot extract, other than the carrot tissue, fine sand and apparatus used. ................................................................................................................................................... ................................................................................................................................................... ............................................................................................................................................. [1] The student carried out these steps to investigate the activity of catalase in the different samples of carrot root tissue. • A disc of filter paper of 5 mm diameter was dipped into the liquid carrot extract using forceps. • The filter paper disc was placed at the bottom of a beaker of 1% hydrogen peroxide solution using forceps. • The time taken for the filter paper disc to rise to the surface of the hydrogen peroxide solution was measured. Fig. 1.4 shows the apparatus used to measure the time taken for the filter paper disc to rise. 0:12 00 10 cm3 beaker stop-clock 1% hydrogen peroxide solution 5 mm filter paper disc Fig. 1.4 (b) State the relationship between the time taken for the filter paper disc to rise to the surface of the hydrogen peroxide solution and the catalase activity of the liquid carrot extract. ................................................................................................................................................... ................................................................................................................................................... ............................................................................................................................................. [1] The student decided to investigate how catalase activity varies along the length of the carrot root. Fig. 1.5 shows a carrot. base of shoot cm0 1 2 3 4 carrot root 5 6 increasing distance 7 from base of shoot 8 9 10 11 12 13 14 15 16 17 Fig. 1.5 (c) The student made the prediction: As the distance from the base of the shoot increases, the catalase activity of carrot root tissue increases. (i) Identify the independent variable in this investigation. ........................................................................................................................................... ........................................................................................................................................... ..................................................................................................................................... [1] (ii) Describe a method that the student could use to test the prediction that: As the distance from the base of the shoot increases, the catalase activity of carrot root tissue increases. Your method should be set out in a logical order and be detailed enough to allow another person to follow it. Details of how to use the centrifuge to prepare the liquid carrot extract should not be included. ........................................................................................................................................... ........................................................................................................................................... ........................................................................................................................................... ........................................................................................................................................... ........................................................................................................................................... ........................................................................................................................................... ........................................................................................................................................... ........................................................................................................................................... ........................................................................................................................................... ........................................................................................................................................... ........................................................................................................................................... ........................................................................................................................................... ........................................................................................................................................... ........................................................................................................................................... ........................................................................................................................................... ........................................................................................................................................... ........................................................................................................................................... ........................................................................................................................................... ........................................................................................................................................... ........................................................................................................................................... ..................................................................................................................................... [6] (d) In a different investigation, the student determined the effect of hydrogen peroxide concentration on the activity of catalase in yeast. • 5 cm3 hydrogen peroxide solution was placed in a test-tube at 25 °C. • 0.2 g dried yeast was added to the test-tube, so that the yeast cells formed a suspension in the hydrogen peroxide solution. • A gas syringe was quickly connected to the test-tube using a bung and delivery tube, as shown in Fig. 1.6. • The volume of gas collected after one minute was measured. Fig. 1.6 shows the apparatus used by the student. gas syringe delivery tube bung test-tube bubbles of gas 5 cm3 hydrogen peroxide solution and yeast cells in suspension Fig. 1.6 (i) Identify the dependent variable in this investigation. ........................................................................................................................................... ........................................................................................................................................... ..................................................................................................................................... [1] (ii) To investigate the effect of hydrogen peroxide concentration on the activity of catalase in yeast, the student first prepared a range of known concentrations of hydrogen peroxide. The student was given a 6.0% stock solution of hydrogen peroxide. The student decided to use the stock solution to make hydrogen peroxide solutions with concentrations of 3.0%, 3.6%, 4.8% and 5.4%. The student made 50 cm3 of each solution. Complete Table 1.1 to show how these solutions could be made by proportional dilution of the 6.0% stock solution of hydrogen peroxide. Table 1.1 percentage concentration of volume of stock solution volume of ............................... hydrogen peroxide / cm3 / cm3 3.0 3.6 4.8 5.4 [2] Use this space for your working. (iii) Fig. 1.7 shows the results of the investigation. 100 90 80 70 60 volume of gas collected after 50 1 minute / cm3 40 30 20 10 0 0.0 1.0 2.0 3.0 4.0 5.0 6.0 7.0 percentage concentration of hydrogen peroxide Fig. 1.7 The student made two conclusions: • As the concentration of hydrogen peroxide increases, the volume of oxygen produced after one minute increases. • The Vmax of catalase is 88 cm3. Use the information shown in Fig. 1.7 to evaluate these conclusions. ........................................................................................................................................... ........................................................................................................................................... ........................................................................................................................................... ........................................................................................................................................... ........................................................................................................................................... ........................................................................................................................................... ........................................................................................................................................... ..................................................................................................................................... [3] [Total: 15]
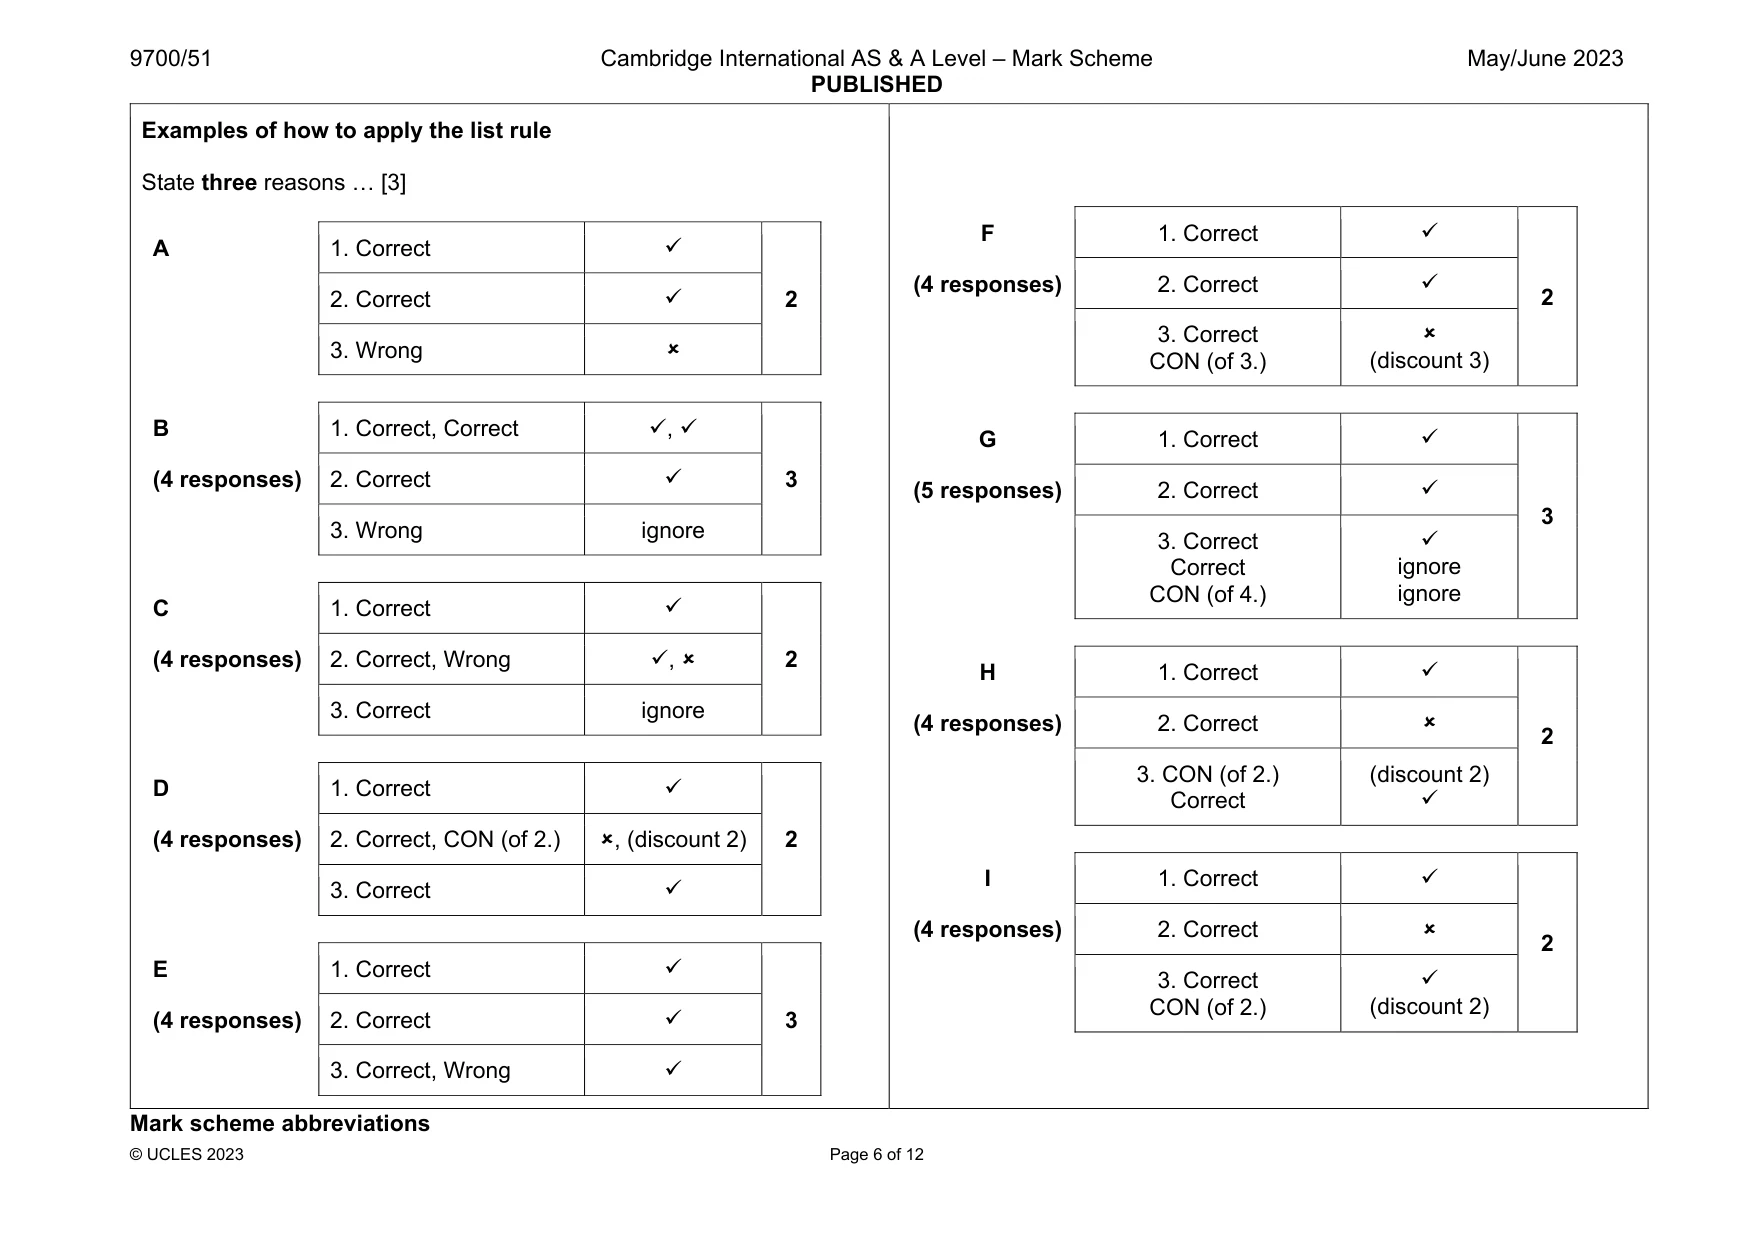
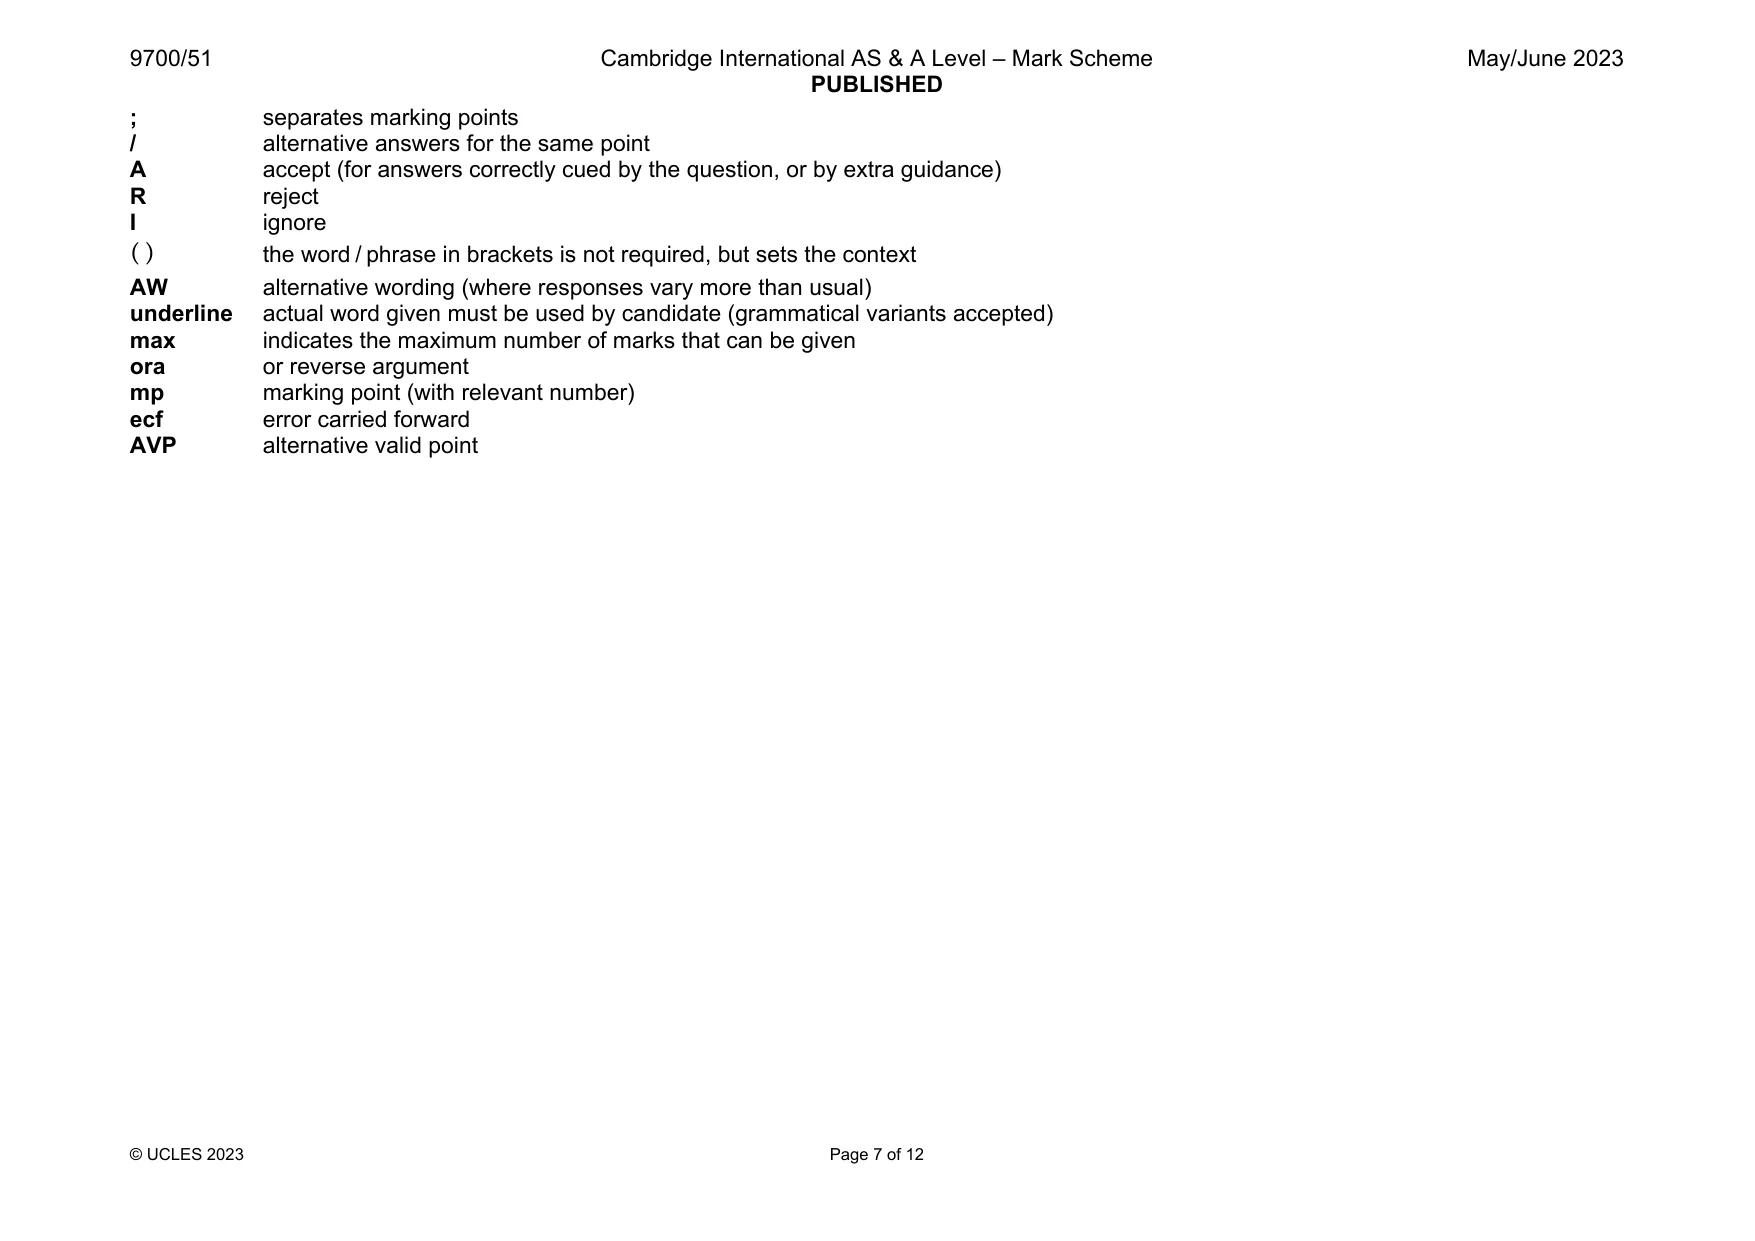
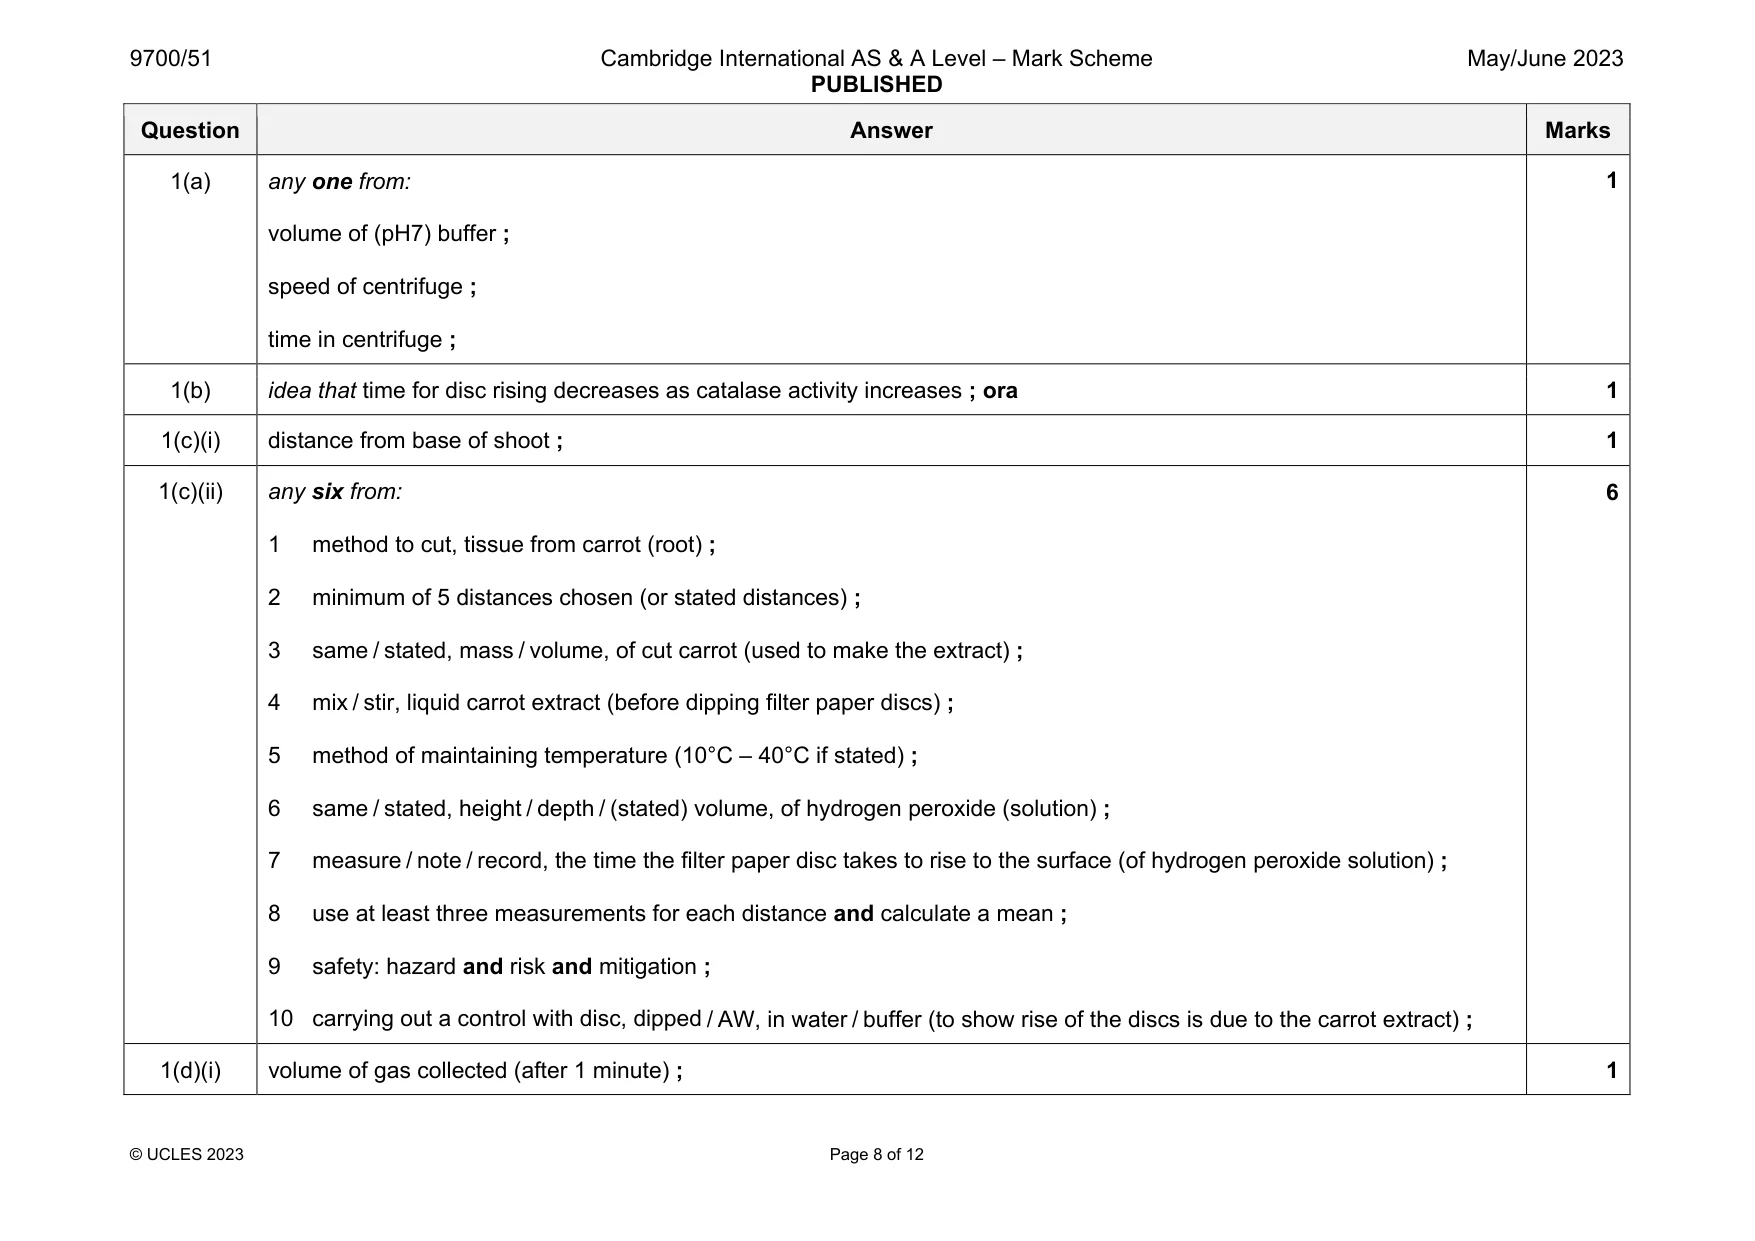
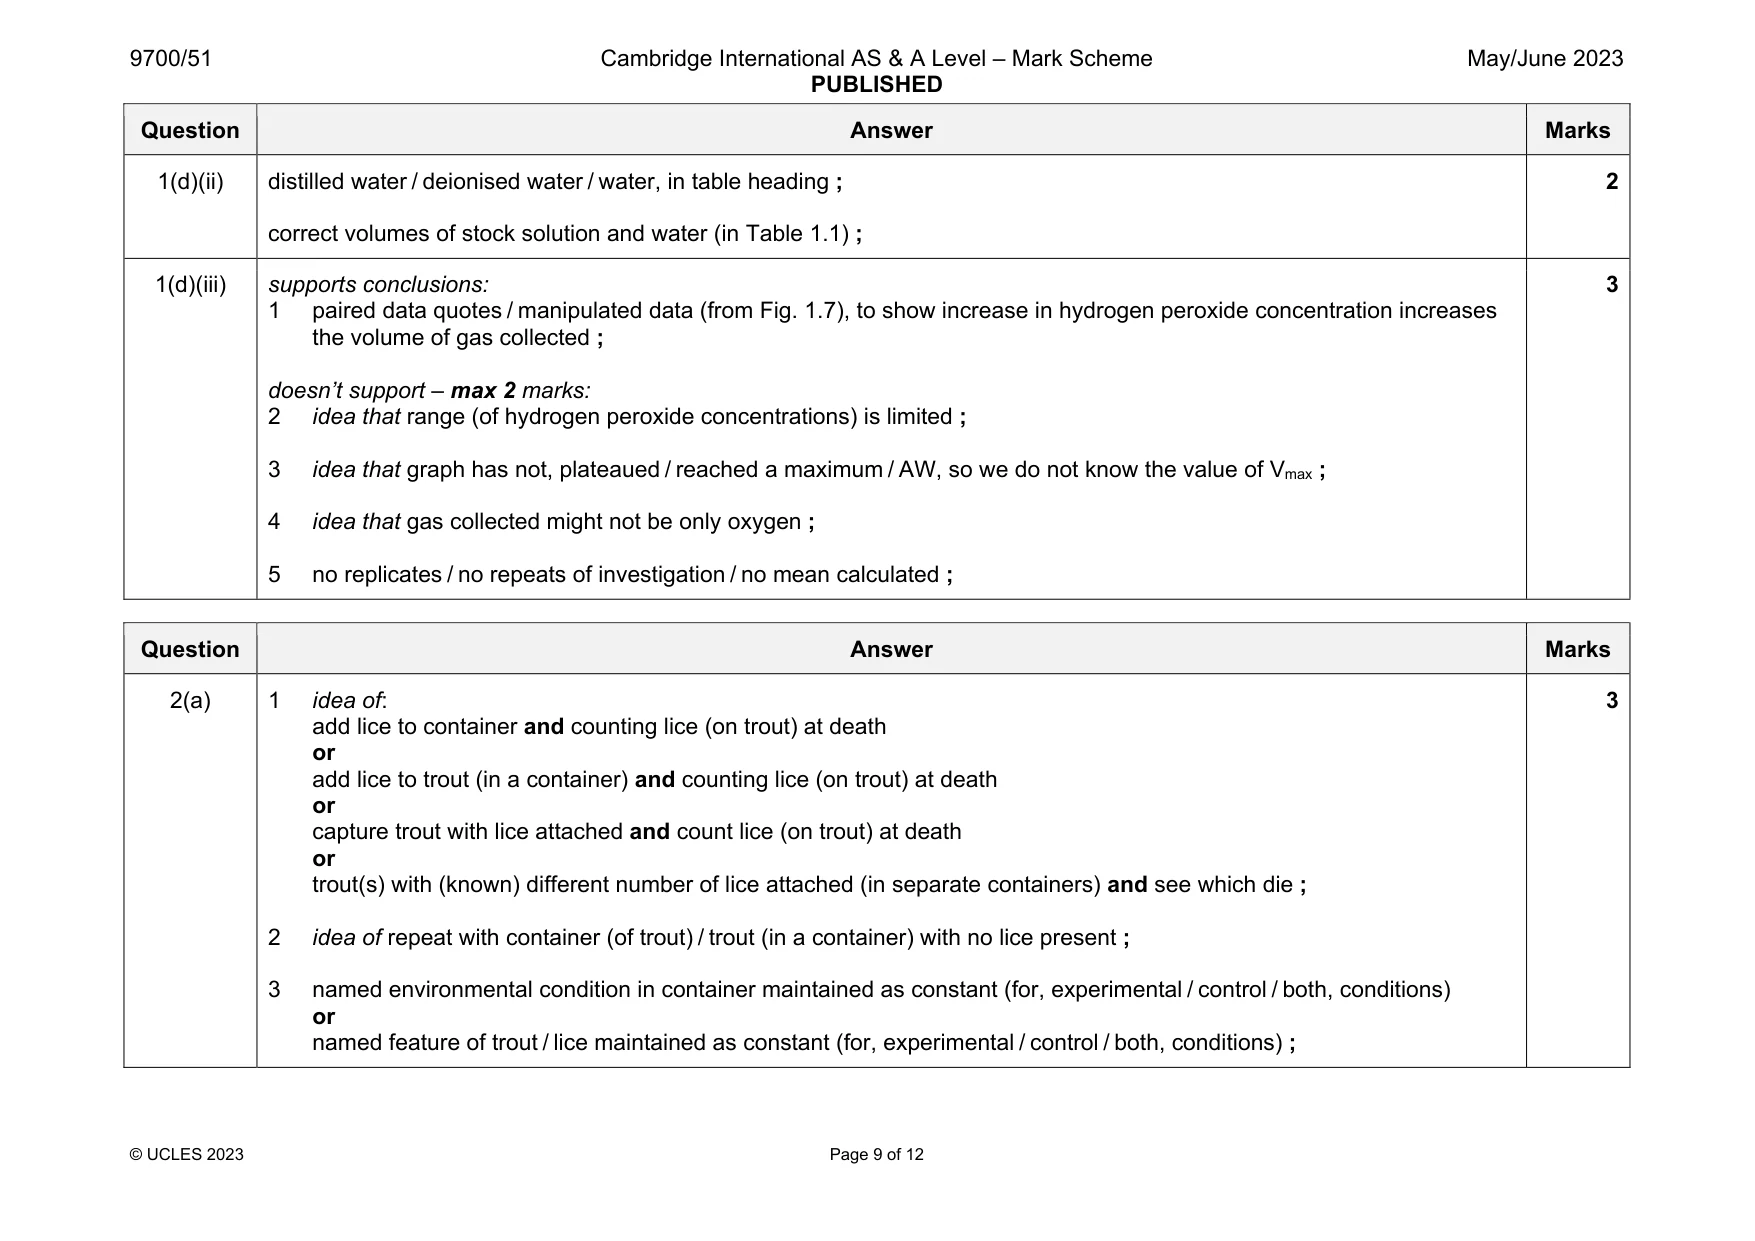
Mark scheme: 1(a) any one from: volume of (pH7) buffer ; speed of centrifuge ; time in centrifuge ; 1(b) idea that time for disc rising decreases as catalase activity increases ; ora 1 1(c)(i) distance from base of shoot ; 1 1(c)(ii) any six from: 1 method to cut, tissue from carrot (root) ; 2 minimum of 5 distances chosen (or stated distances) ; 3 same / stated, mass / volume, of cut carrot (used to make the extract) ; 4 mix / stir, liquid carrot extract (before dipping filter paper discs) ; 5 method of maintaining temperature (10°C – 40°C if stated) ; 6 same / stated, height / depth / (stated) volume, of hydrogen peroxide (solution) ; 7 measure / note / record, the time the filter paper disc takes to rise to the surface (of hydrogen peroxide solution) ; 8 use at least three measurements for each distance and calculate a mean ; 9 safety: hazard and risk and mitigation ; 10 carrying out a control with disc, dipped / AW, in water / buffer (to show rise of the discs is due to the carrot extract) ; 6 1(d)(i) volume of gas collected (after 1 minute) ; 1 Question Answer Marks 1(d)(ii) distilled water / deionised water / water, in table heading ; correct volumes of stock solution and water (in Table 1.1) ; 2 1(d)(iii) supports conclusions: 1 paired data quotes / manipulated data (from Fig. 1.7), to show increase in hydrogen peroxide concentration increases the volume of gas collected ; doesn’t support – max 2 marks: 2 idea that range (of hydrogen peroxide concentrations) is limited ; 3 idea that graph has not, plateaued / reached a maximum / AW, so we do not know the value of Vmax ; 4 idea that gas collected might not be only oxygen ; 5 no replicates / no repeats of investigation / no mean calculated ; 3
Q2 · Sea trout, Salmo trutta, are found in rivers and coastal seawaters in many regions of the…
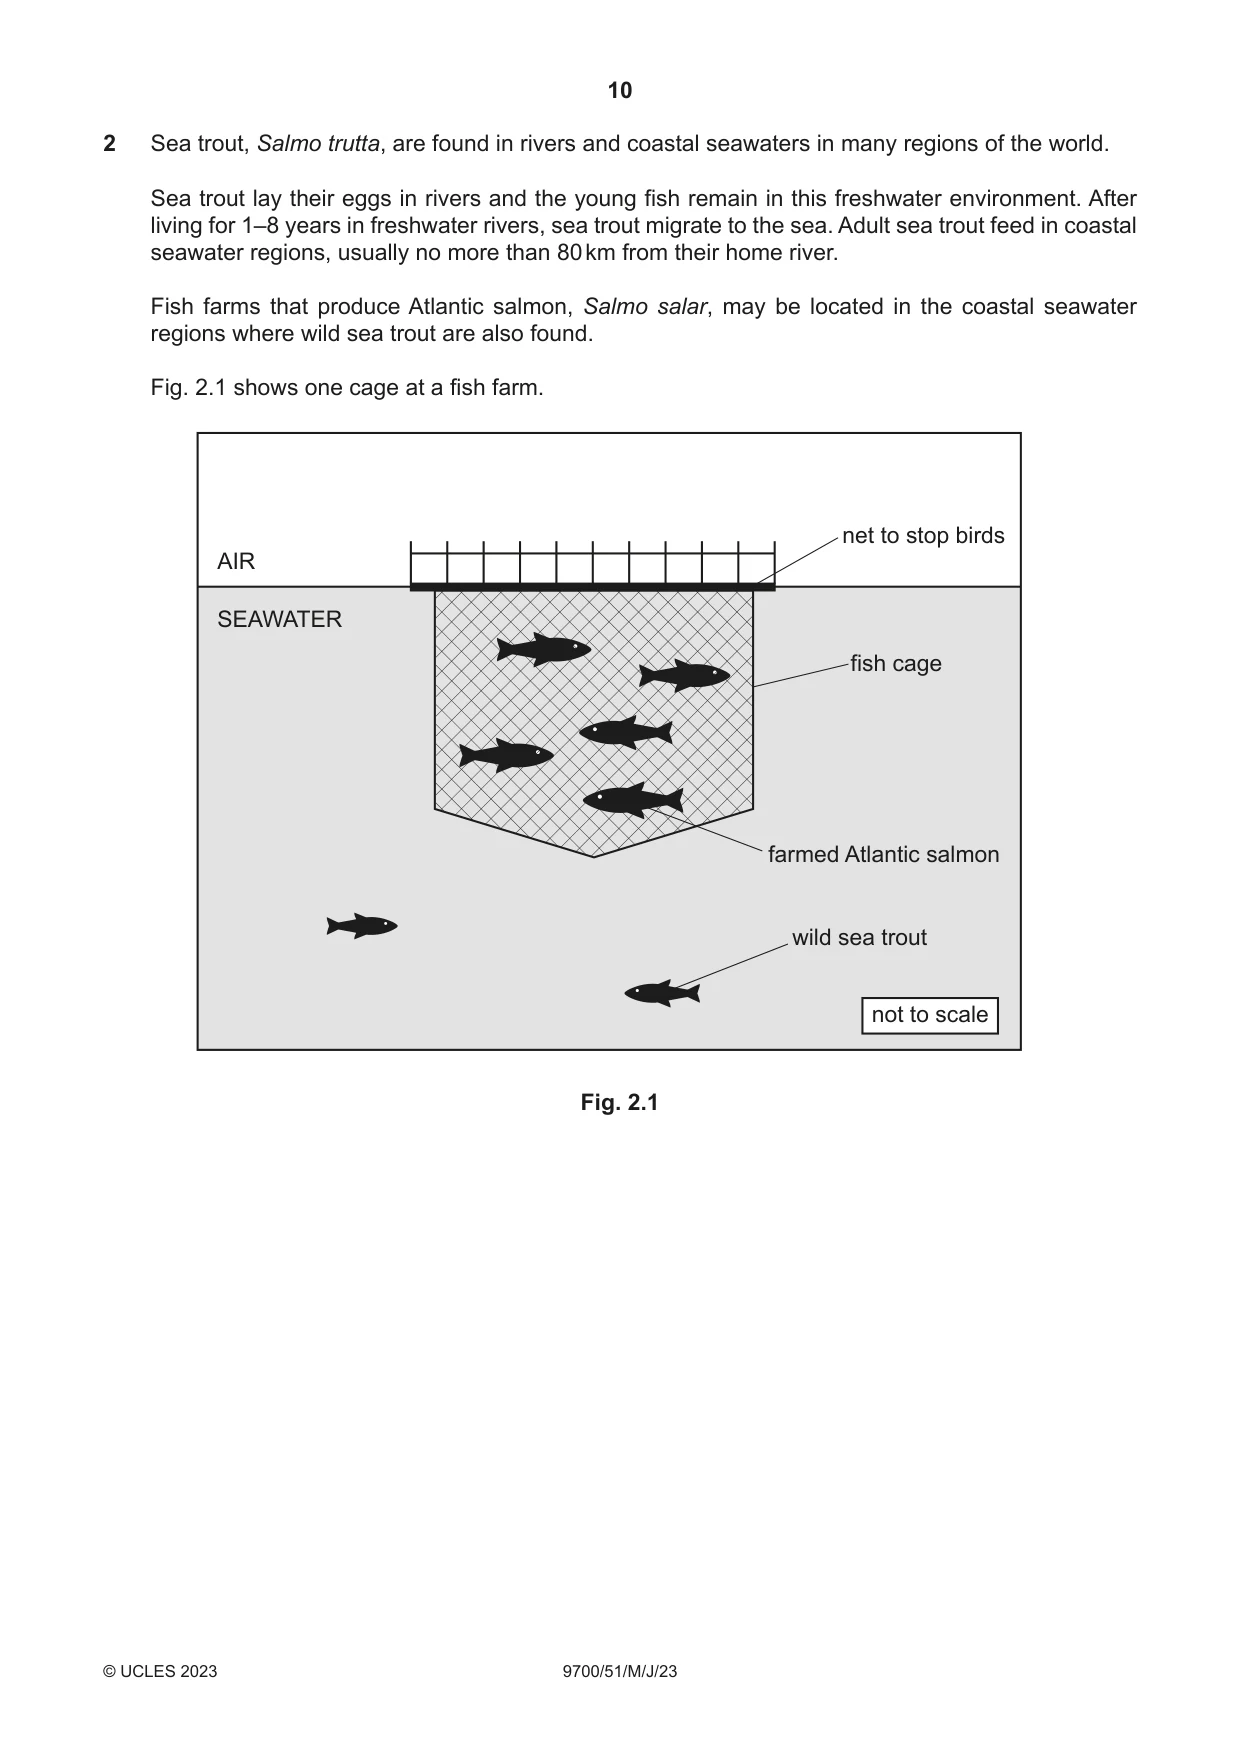
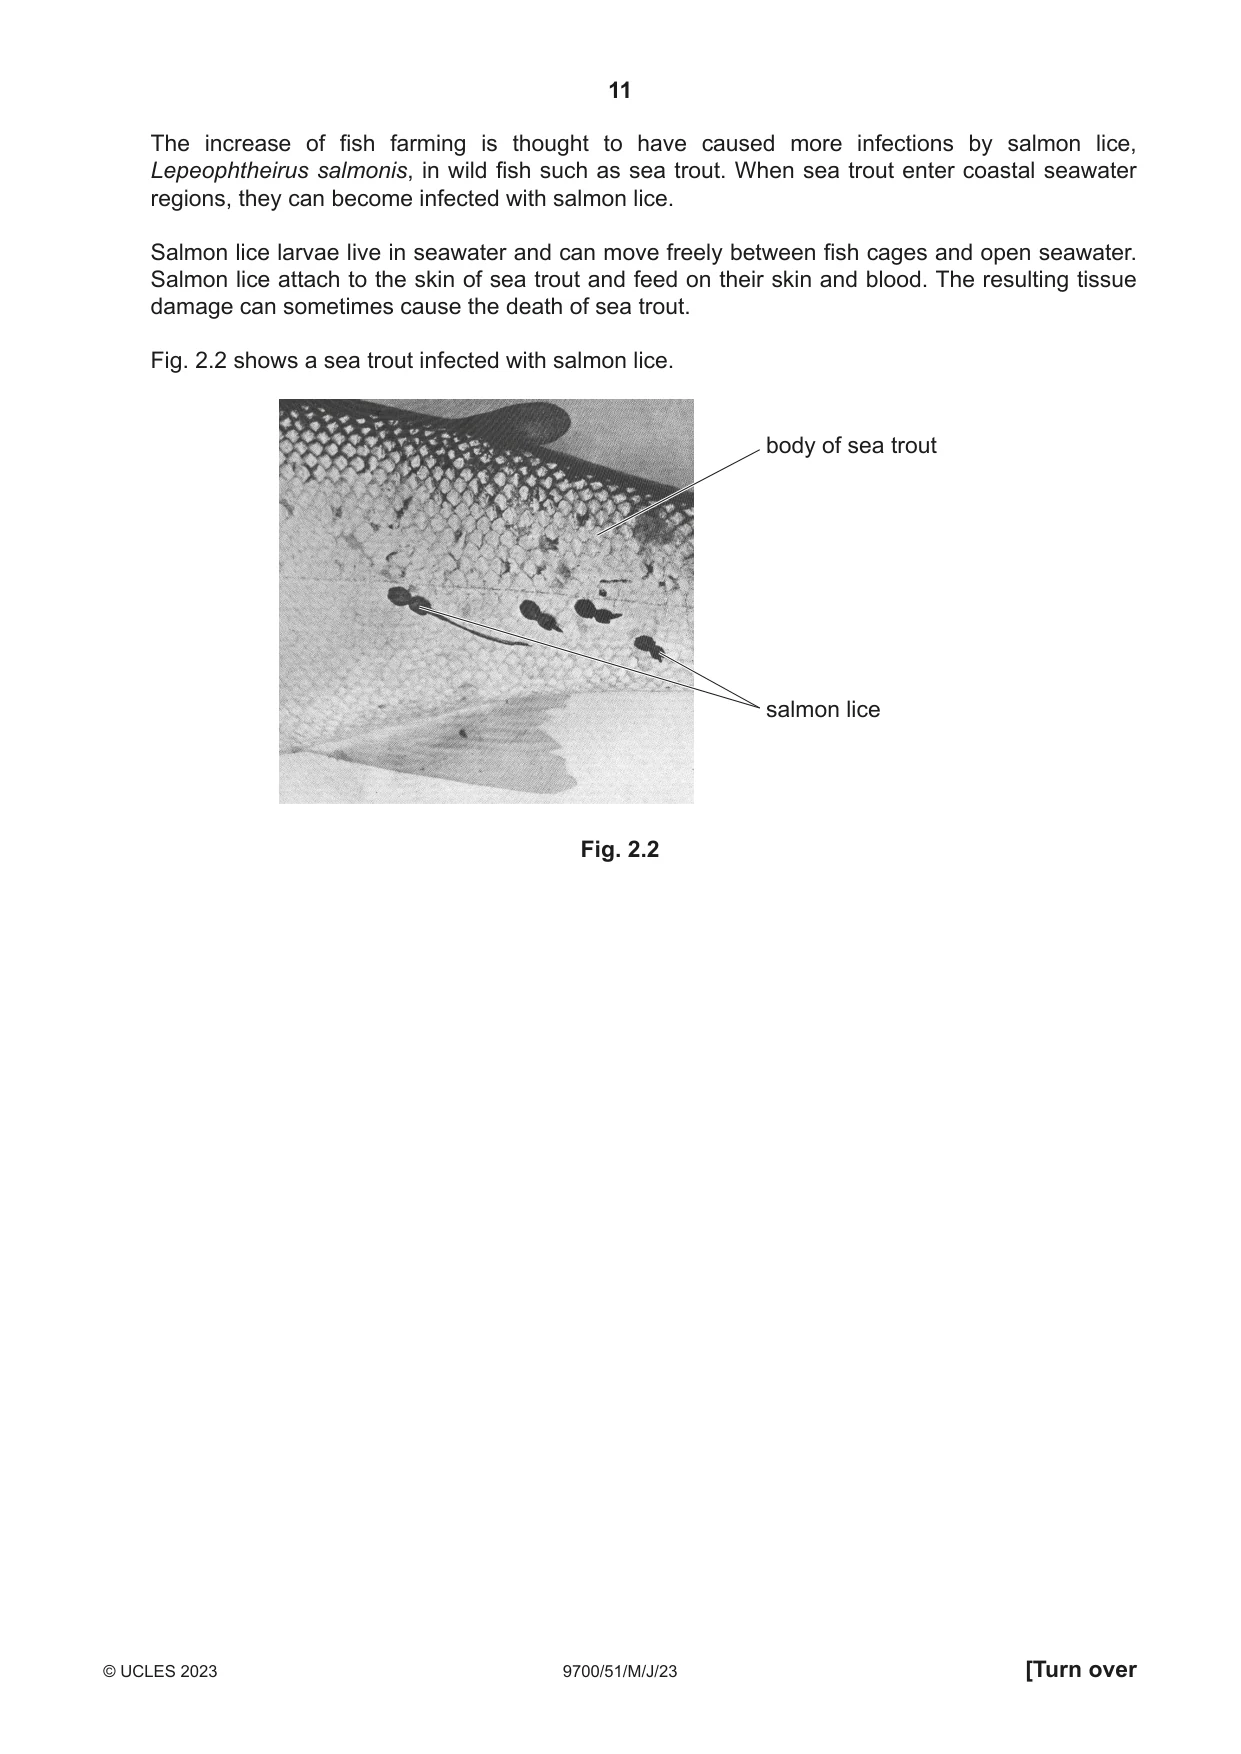
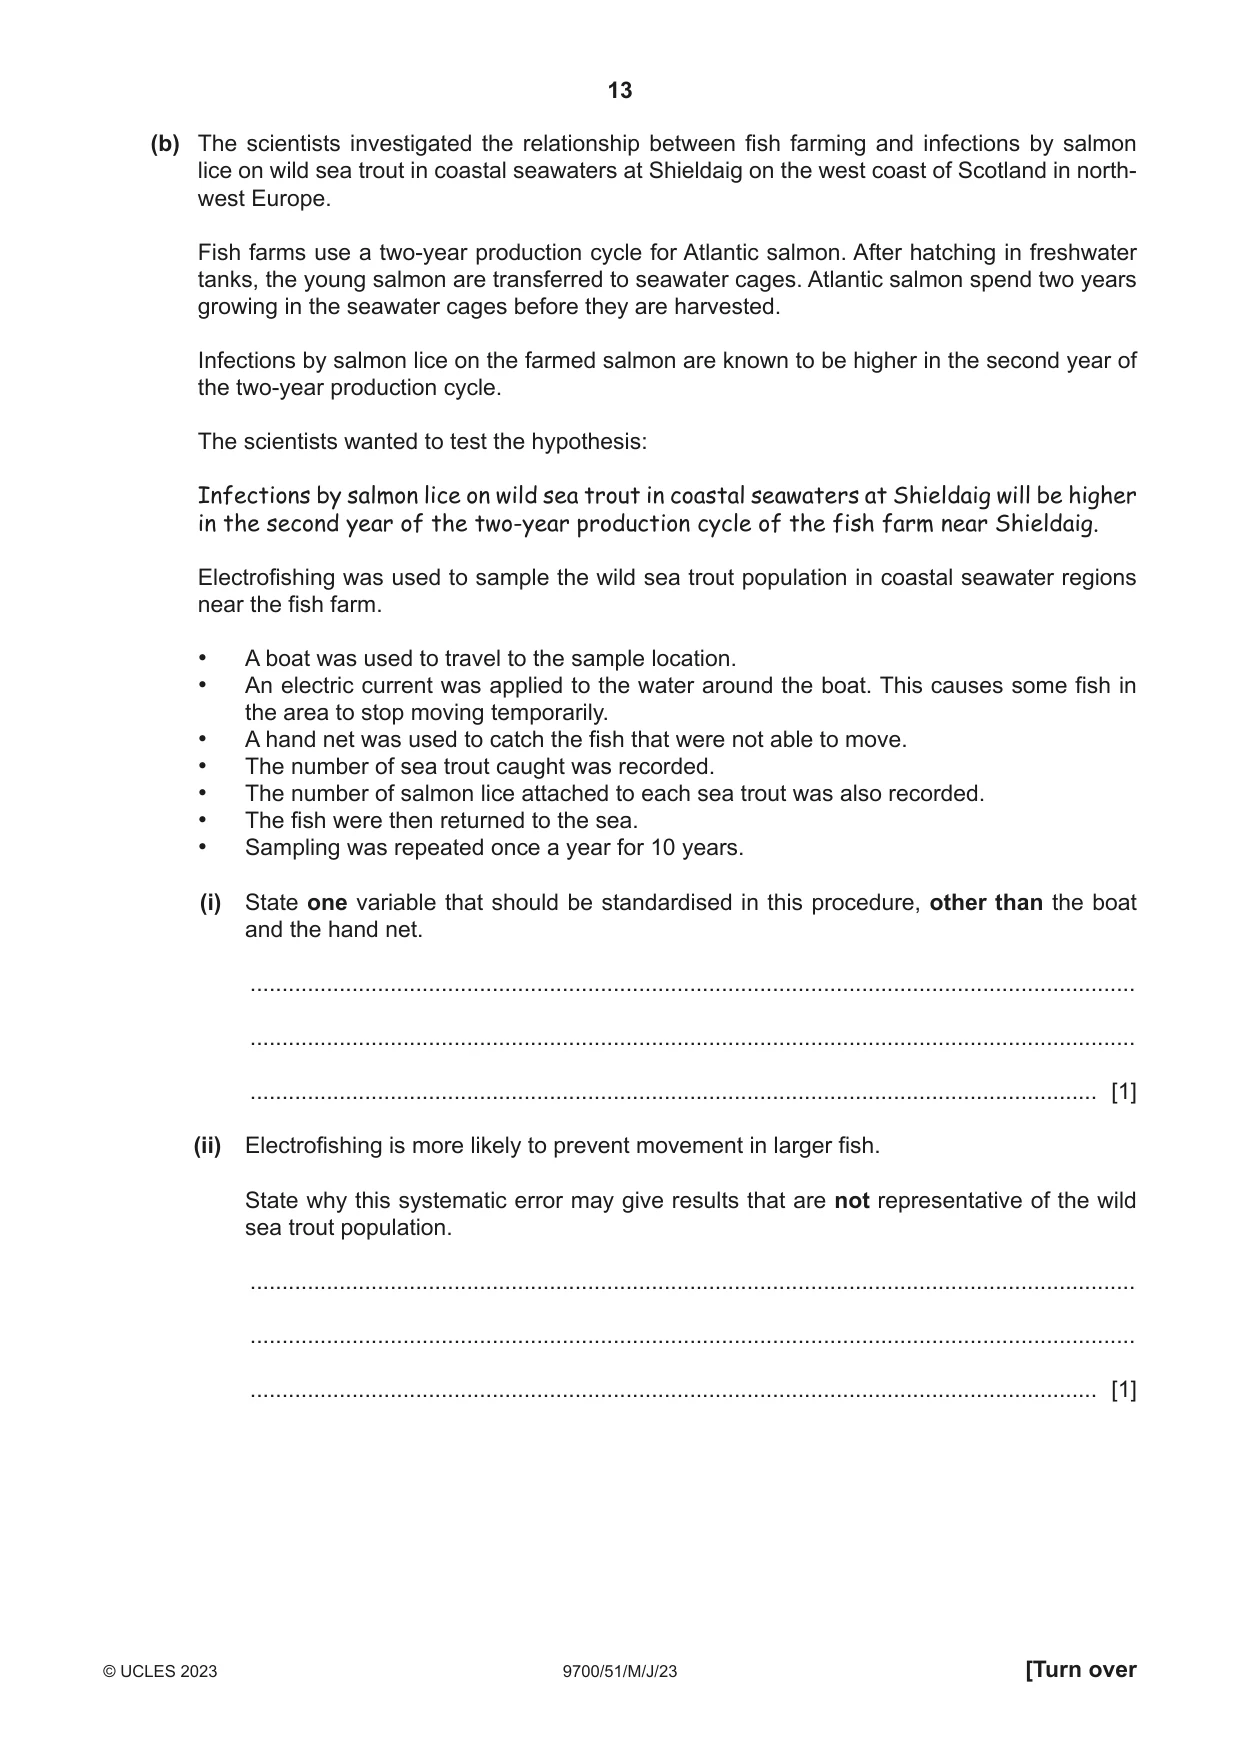
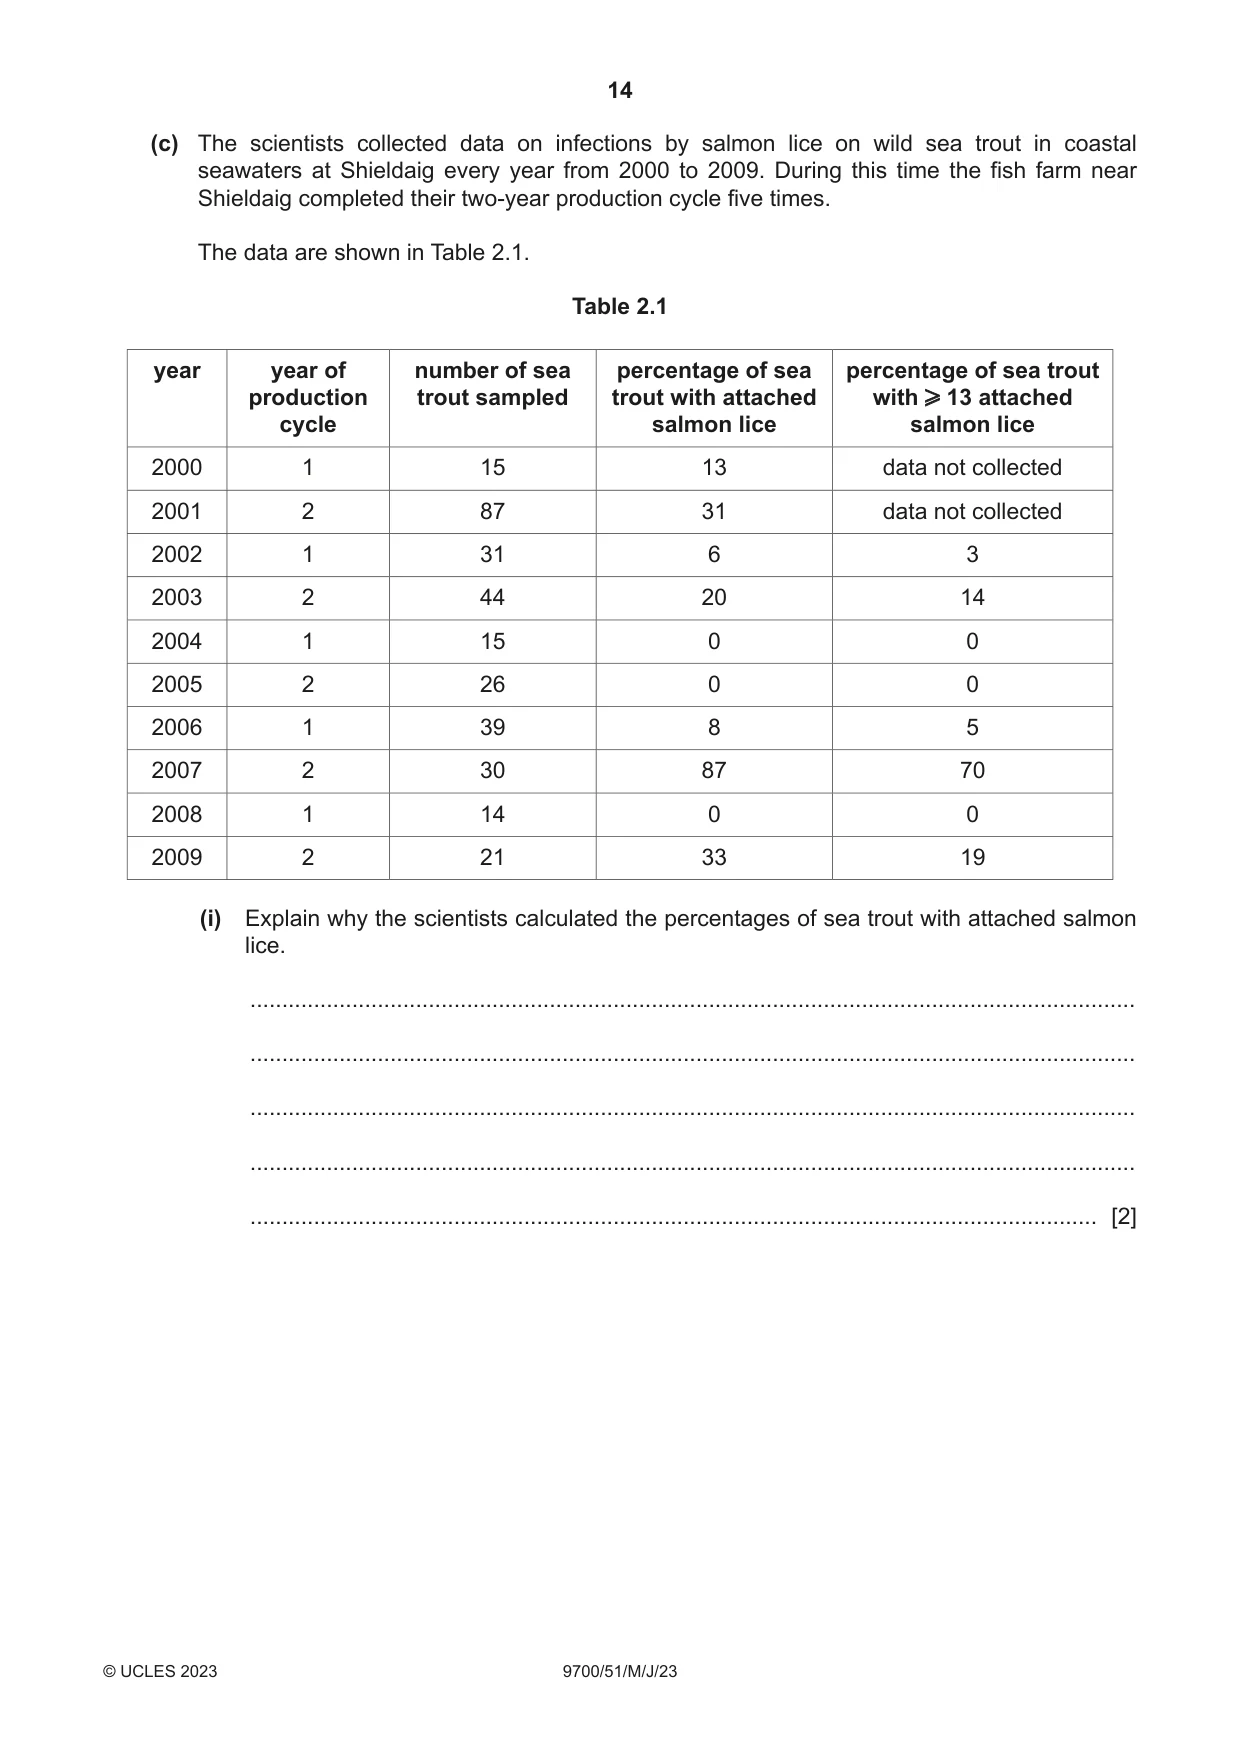
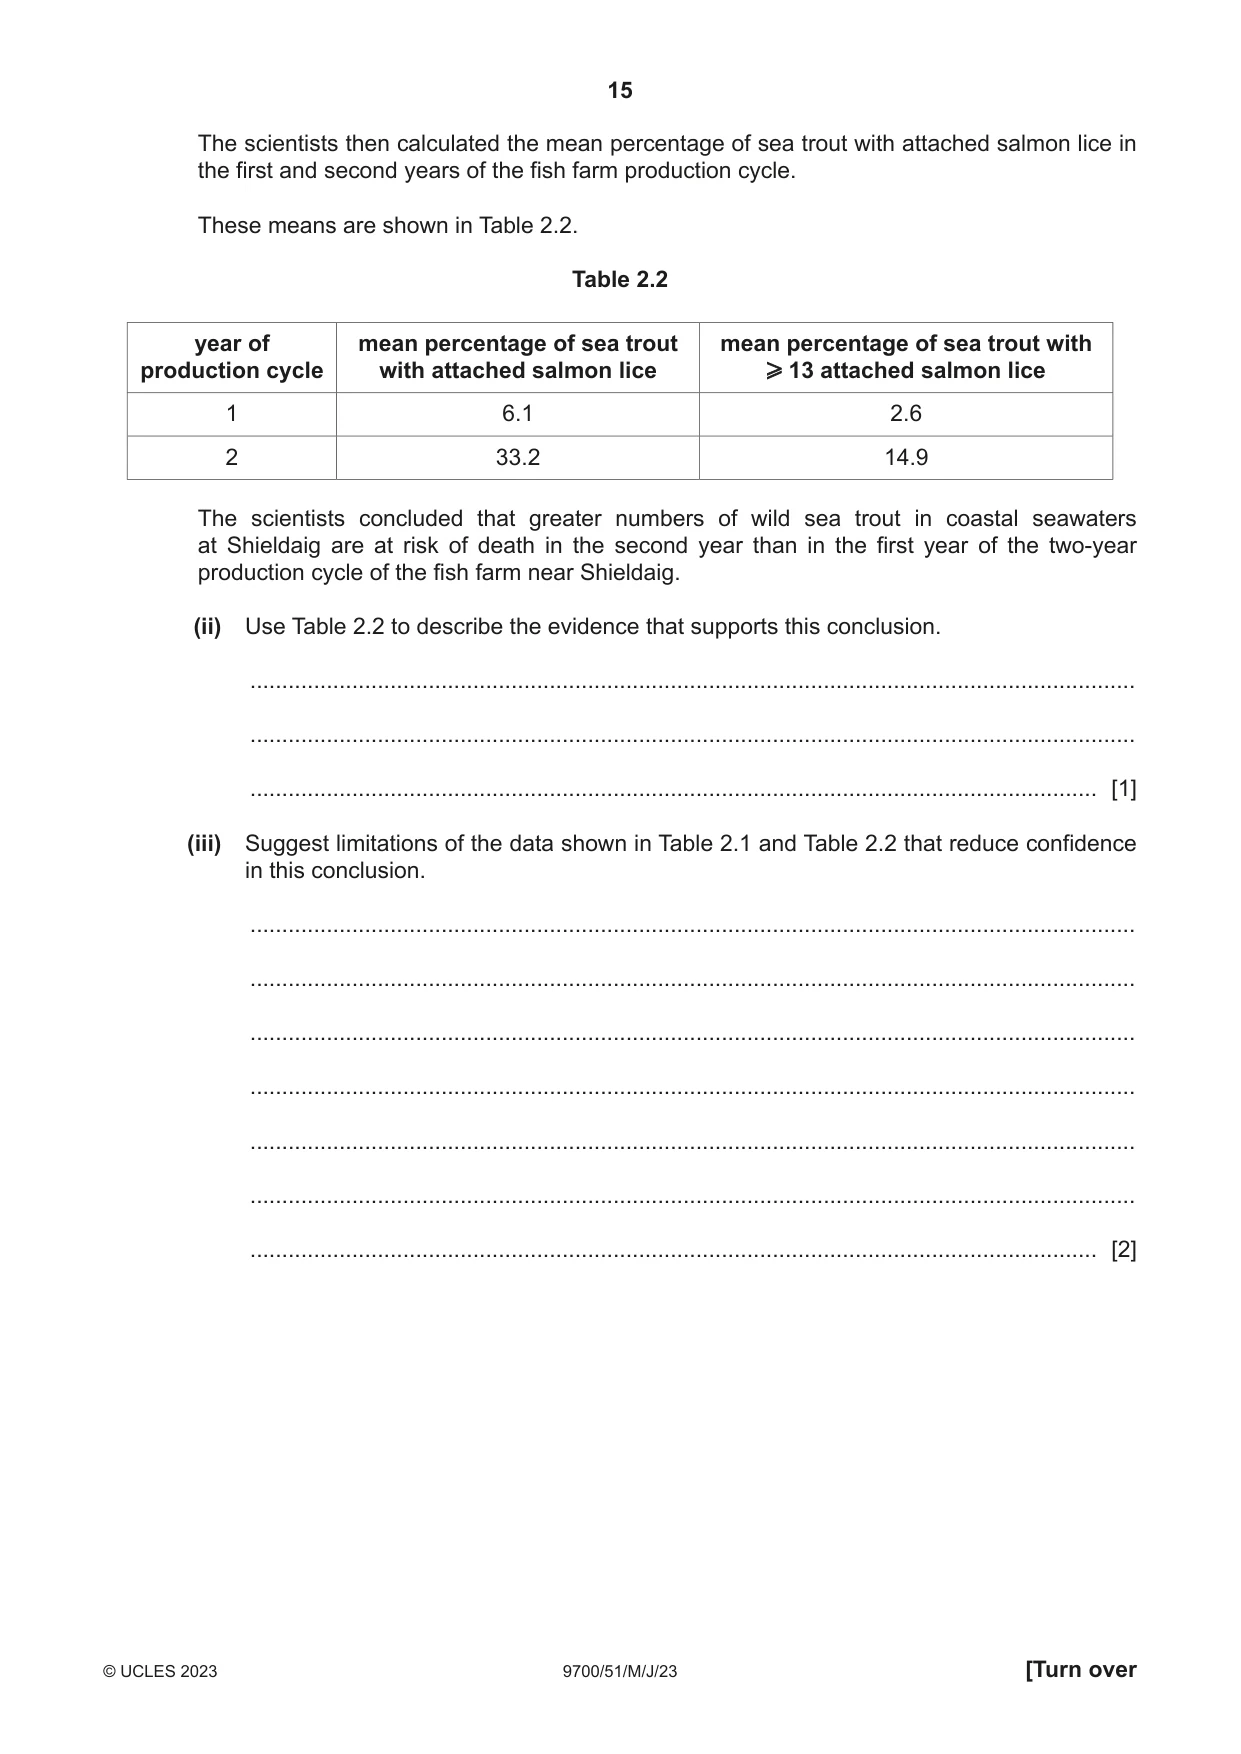
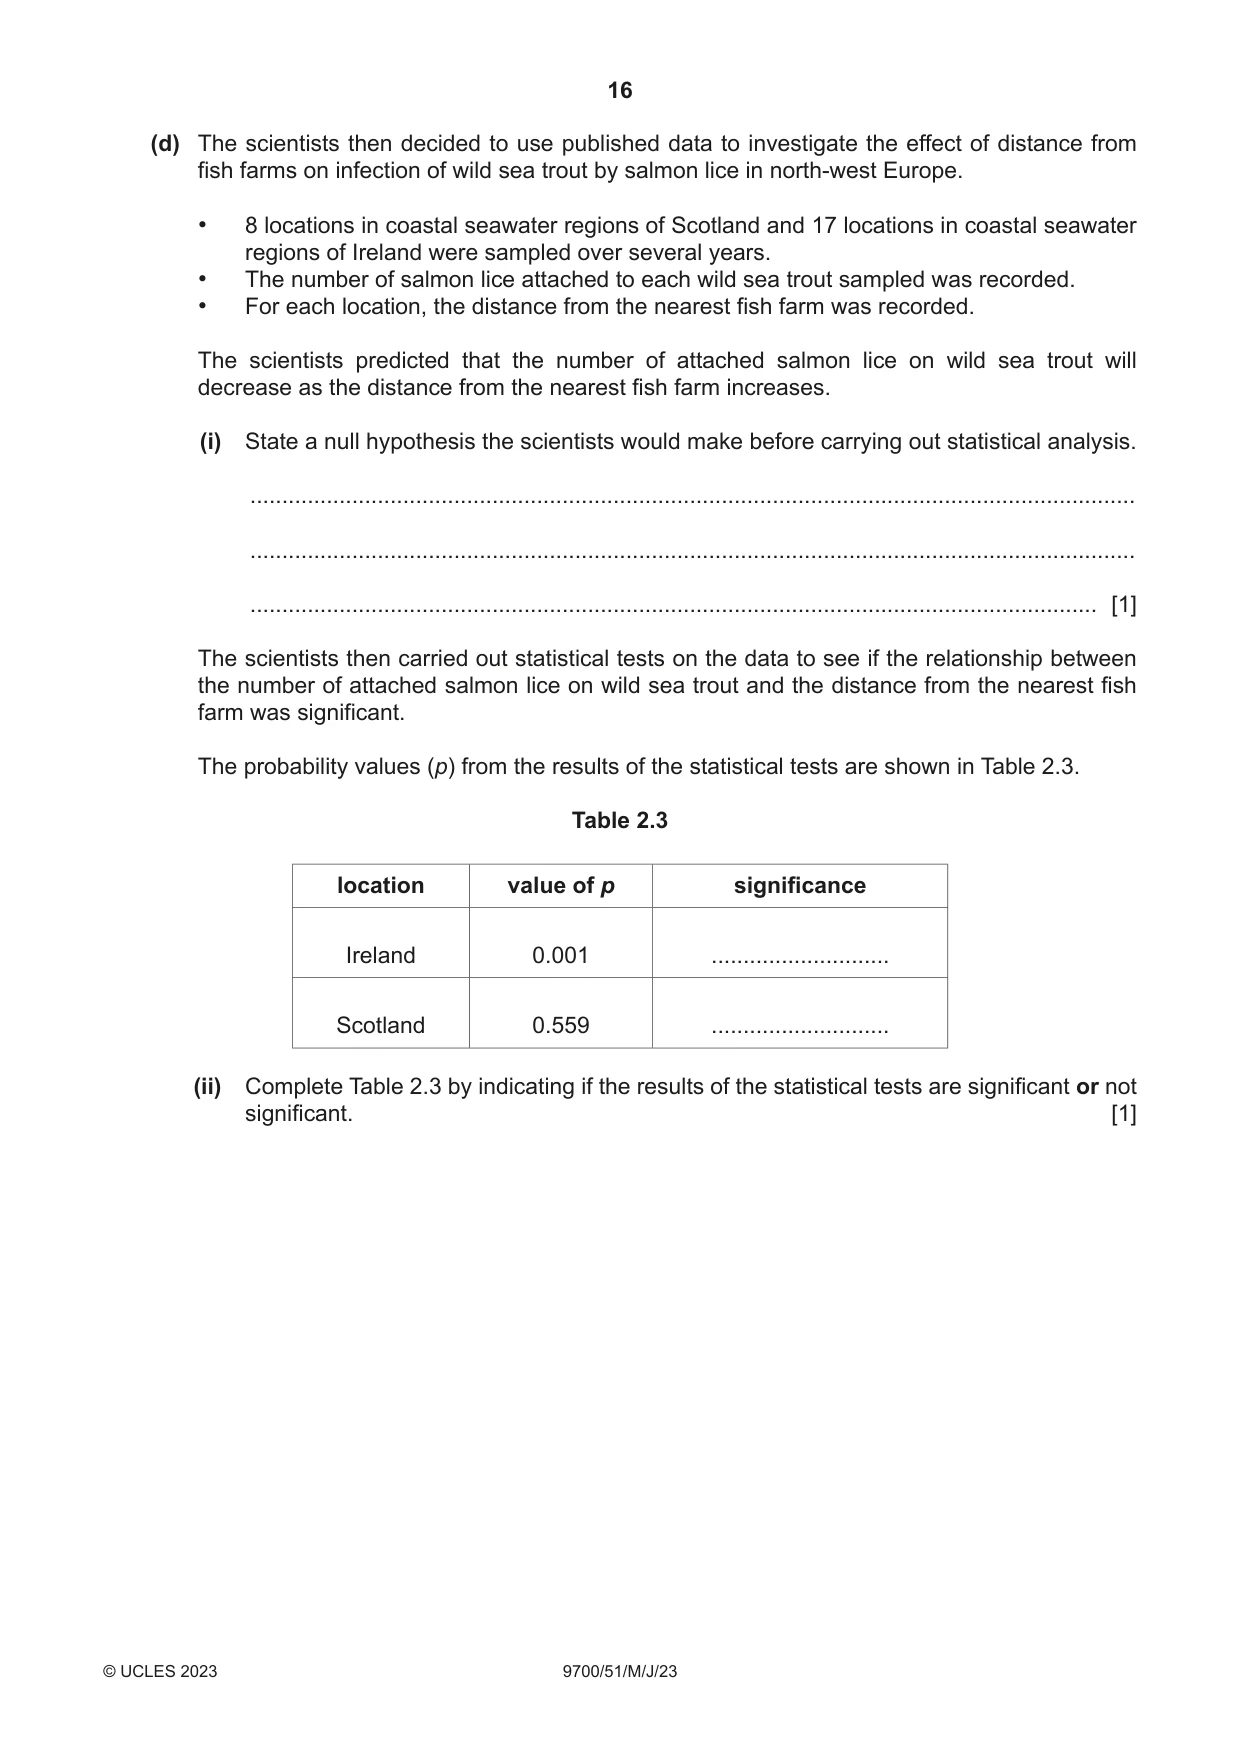
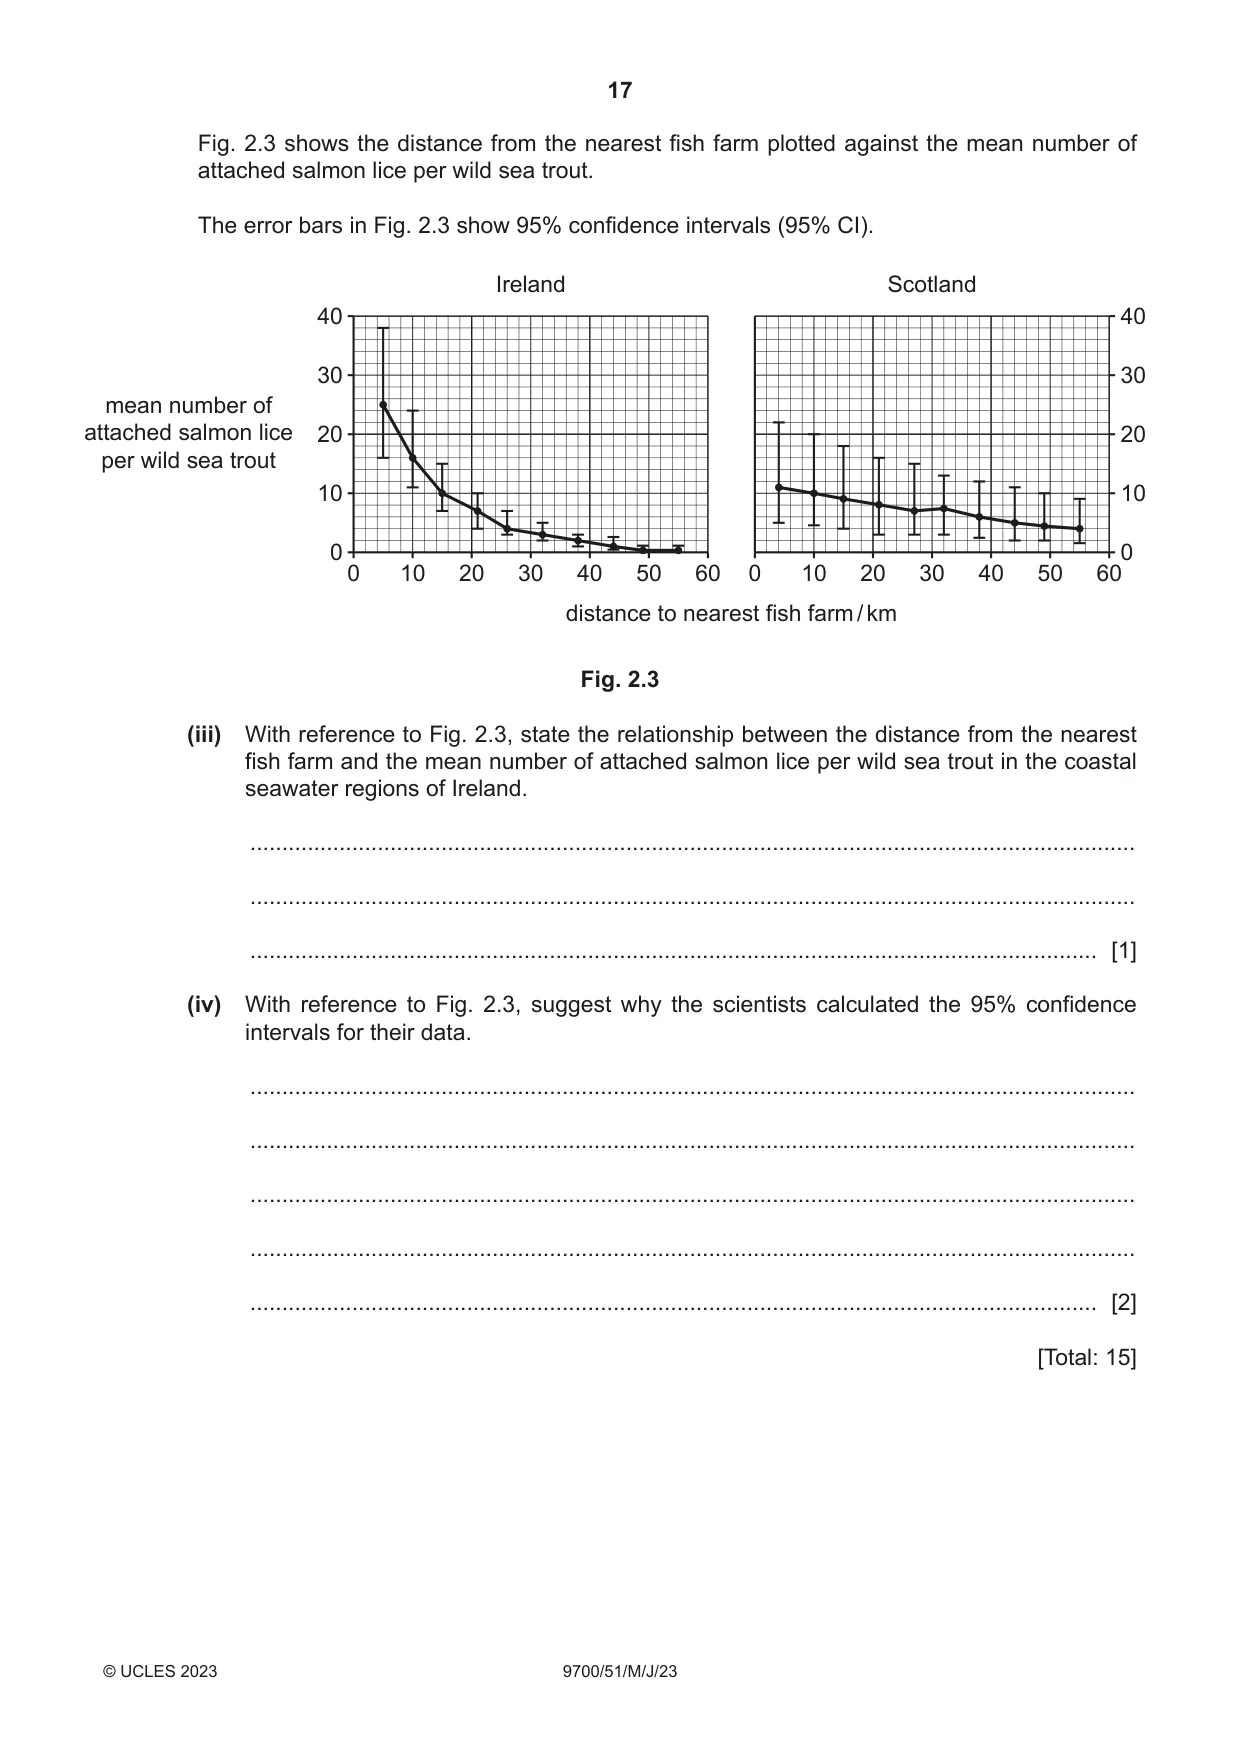
2 Sea trout, Salmo trutta, are found in rivers and coastal seawaters in many regions of the world. Sea trout lay their eggs in rivers and the young fish remain in this freshwater environment. After living for 1–8 years in freshwater rivers, sea trout migrate to the sea. Adult sea trout feed in coastal seawater regions, usually no more than 80 km from their home river. Fish farms that produce Atlantic salmon, Salmo salar, may be located in the coastal seawater regions where wild sea trout are also found. Fig. 2.1 shows one cage at a fish farm. net to stop birds AIR SEAWATER fish cage farmed Atlantic salmon wild sea trout not to scale Fig. 2.1 The increase of fish farming is thought to have caused more infections by salmon lice, Lepeophtheirus salmonis, in wild fish such as sea trout. When sea trout enter coastal seawater regions, they can become infected with salmon lice. Salmon lice larvae live in seawater and can move freely between fish cages and open seawater. Salmon lice attach to the skin of sea trout and feed on their skin and blood. The resulting tissue damage can sometimes cause the death of sea trout. Fig. 2.2 shows a sea trout infected with salmon lice. body of sea trout salmon lice Fig. 2.2 (a) Some scientists found out from a published source that 13 or more attached salmon lice usually cause the death of a sea trout kept in laboratory conditions. The scientists decided that each wild sea trout with 13 or more salmon lice is at risk of physiological stress and potential death. Outline a laboratory method that could be used to determine the number of salmon lice needed to cause the death of a sea trout. Suggest a suitable control that could be used to confirm that it is the salmon lice that are causing the death of the sea trout. method that could be used ....................................................................................................... ................................................................................................................................................... ................................................................................................................................................... ................................................................................................................................................... ................................................................................................................................................... suitable control ......................................................................................................................... ................................................................................................................................................... ................................................................................................................................................... ................................................................................................................................................... [3]
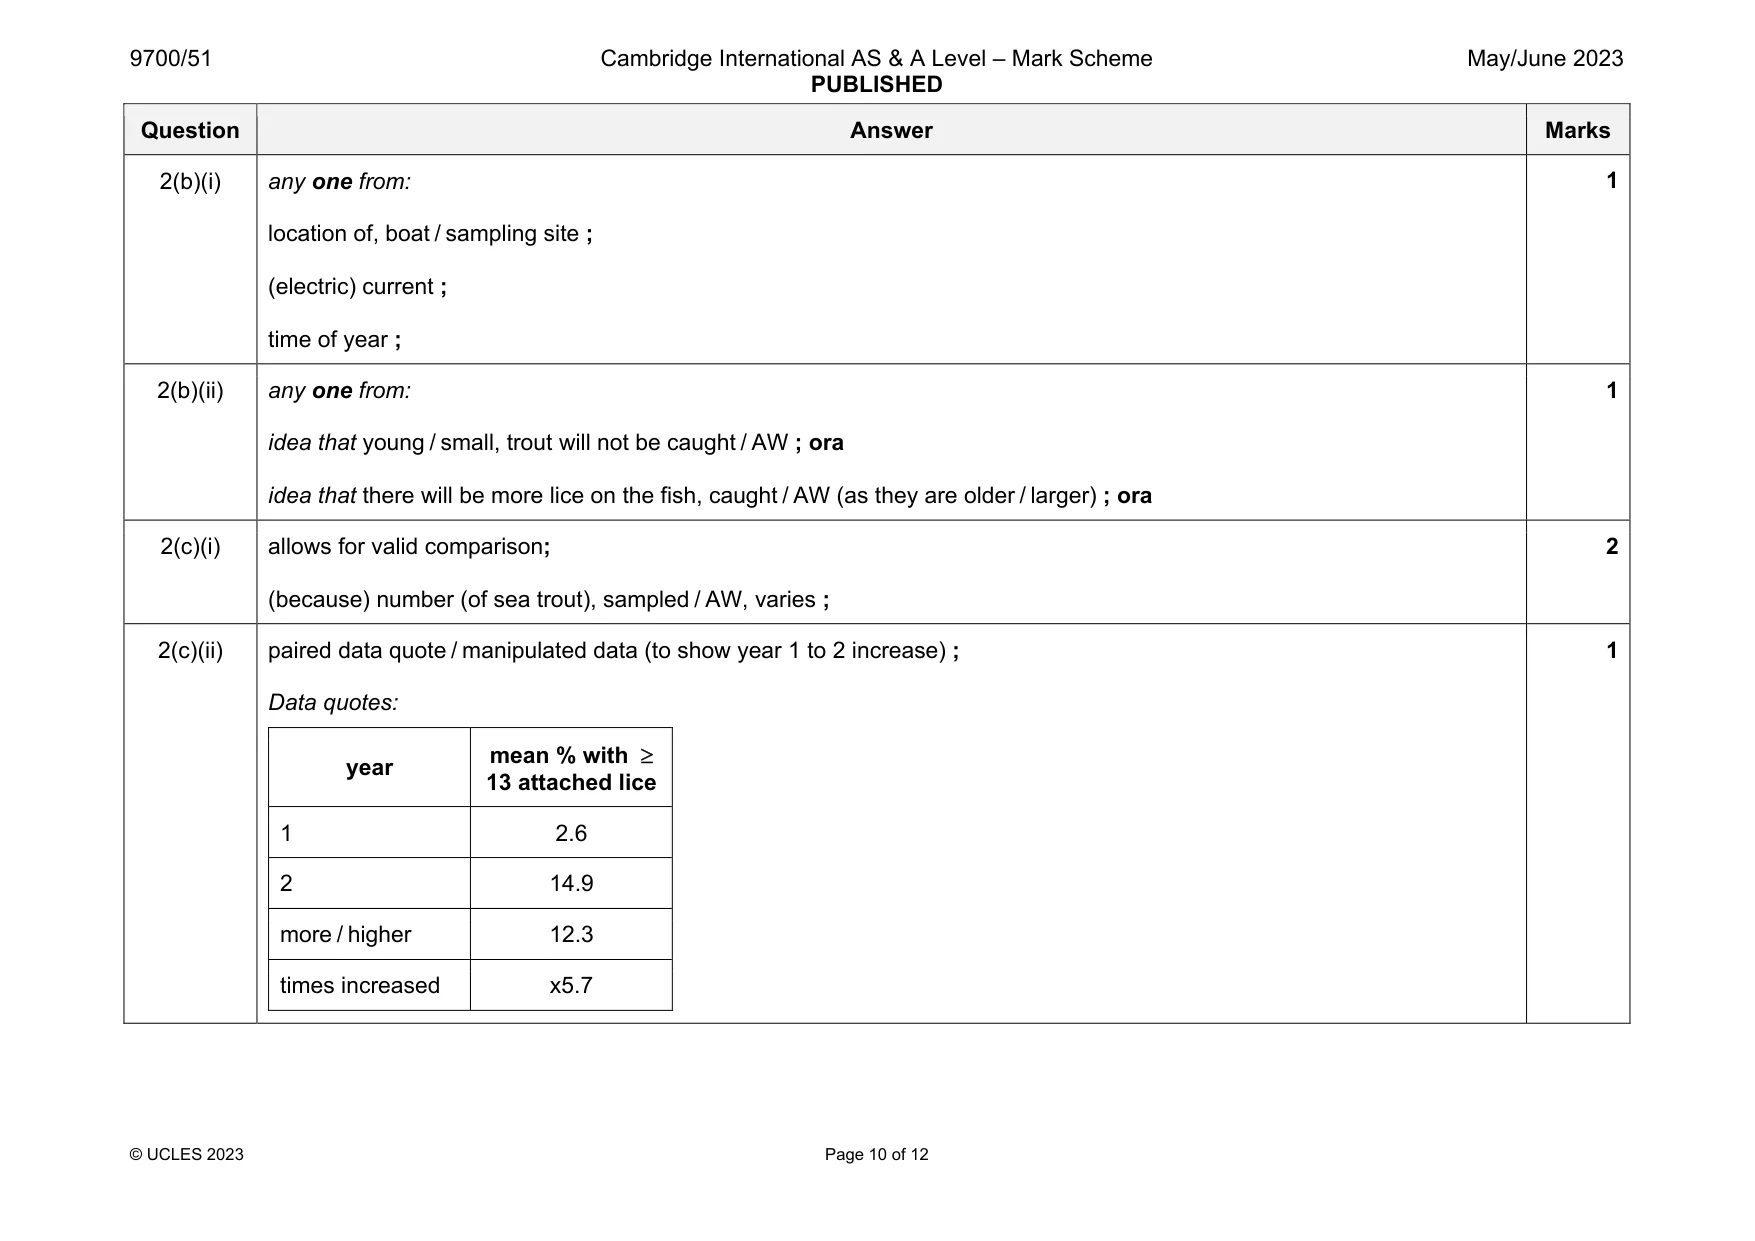
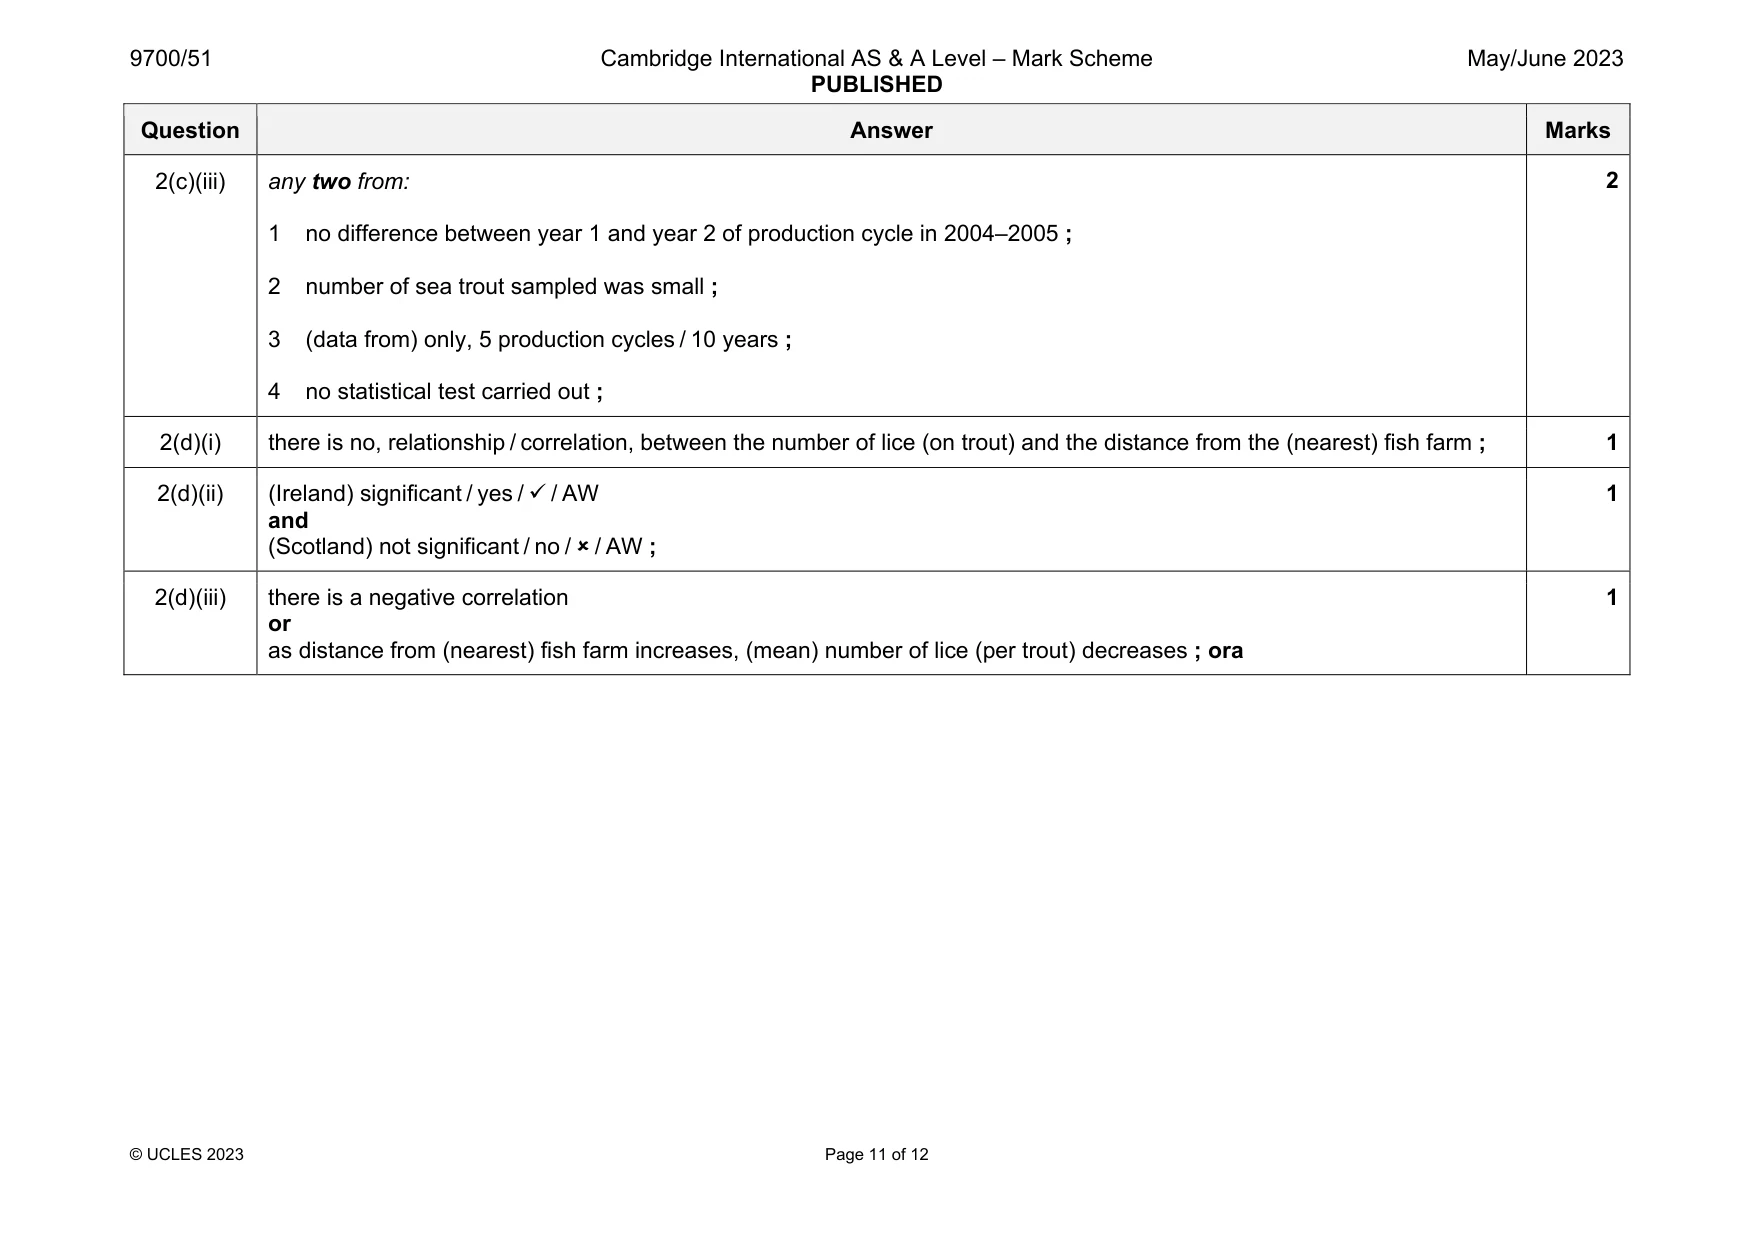
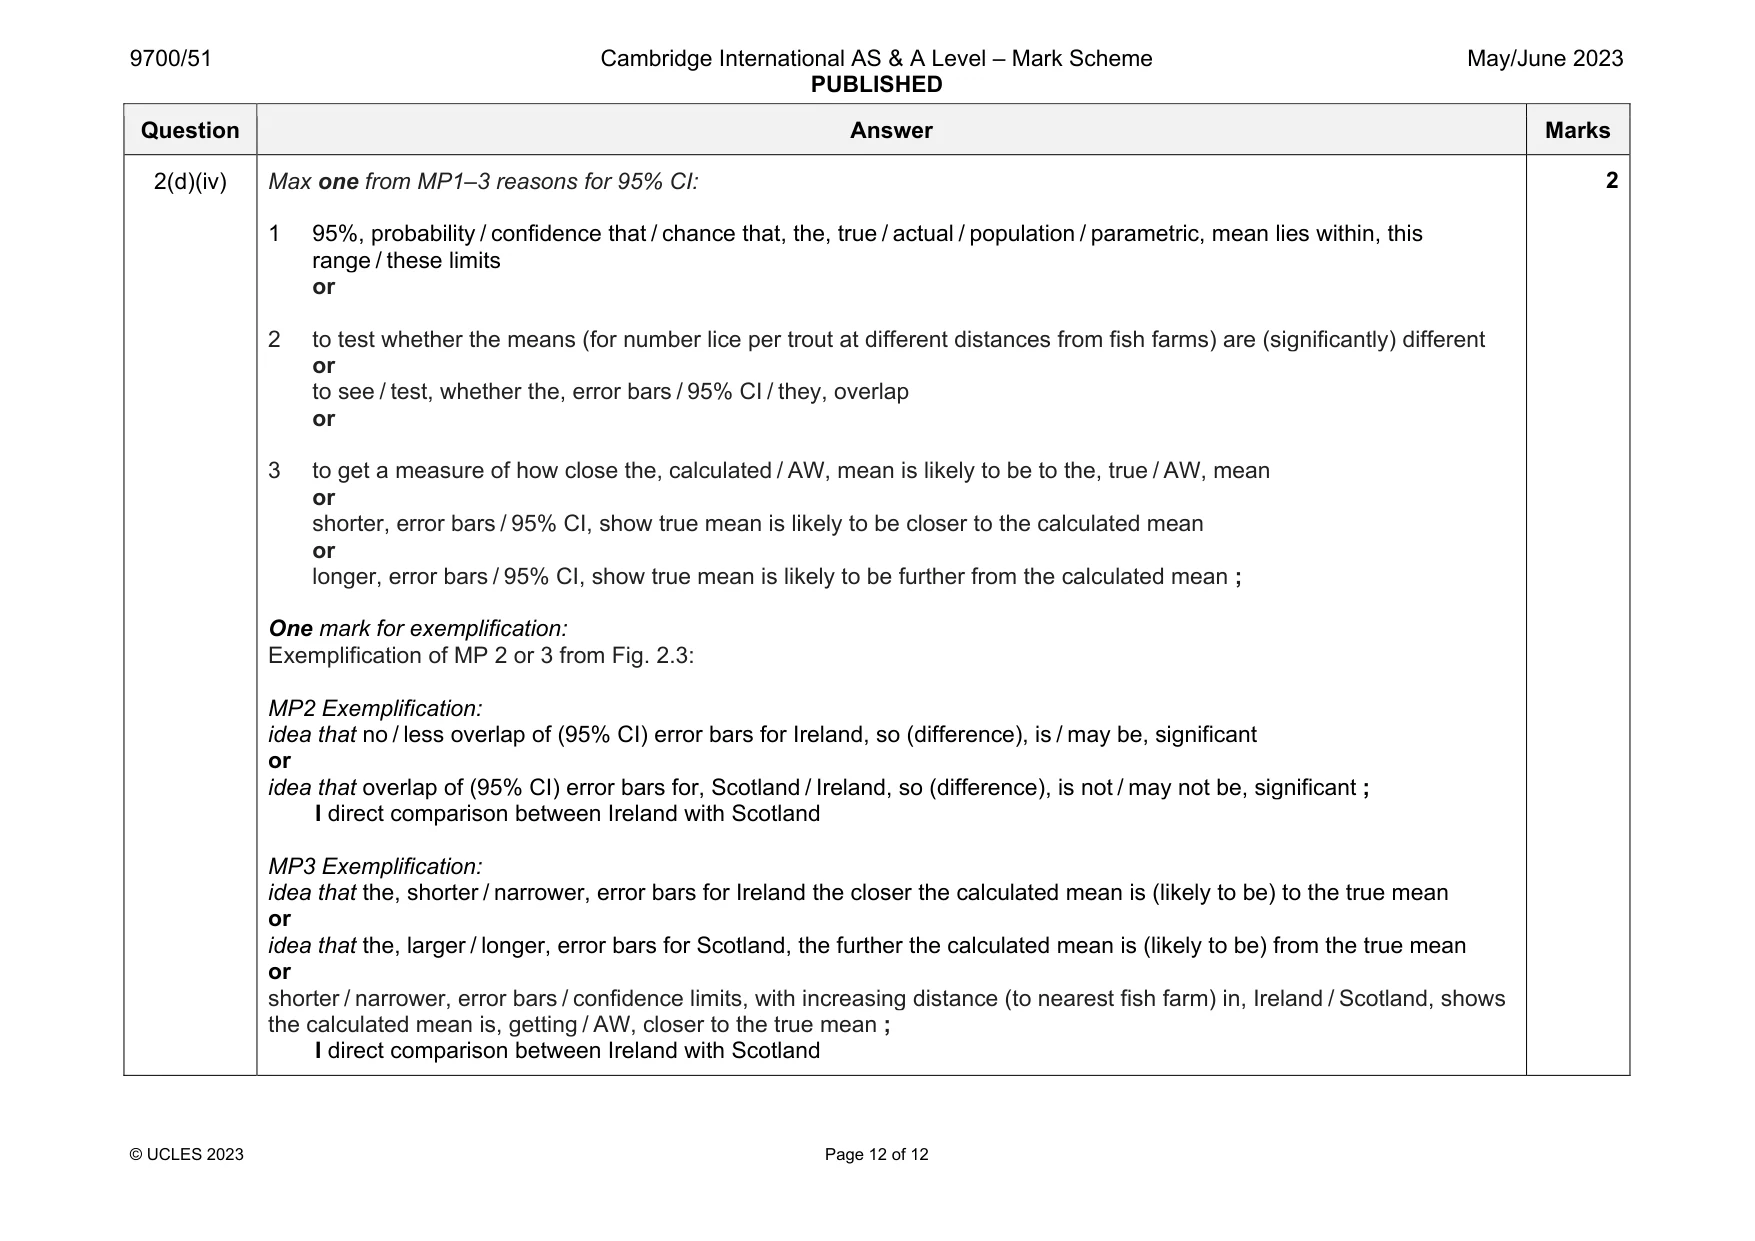
Mark scheme: 2(a) 1 idea of: add lice to container and counting lice (on trout) at death or add lice to trout (in a container) and counting lice (on trout) at death or capture trout with lice attached and count lice (on trout) at death or trout(s) with (known) different number of lice attached (in separate containers) and see which die ; 2 idea of repeat with container (of trout) / trout (in a container) with no lice present ; 3 named environmental condition in container maintained as constant (for, experimental / control / both, conditions) or named feature of trout / lice maintained as constant (for, experimental / control / both, conditions) ; Question Answer Marks 2(b)(i) any one from: location of, boat / sampling site ; (electric) current ; time of year ; 1 2(b)(ii) any one from: idea that young / small, trout will not be caught / AW ; ora idea that there will be more lice on the fish, caught / AW (as they are older / larger) ; ora 1 2(c)(i) allows for valid comparison; (because) number (of sea trout), sampled / AW, varies ; 2 2(c)(ii) paired data quote / manipulated data (to show year 1 to 2 increase) ; Data quotes: year mean % with 13 attached lice 1 2.6 2 14.9 more / higher 12.3 times increased x5.7 1 Question Answer Marks 2(c)(iii) any two from: 1 no difference between year 1 and year 2 of production cycle in 2004–2005 ; 2 number of sea trout sampled was small ; 3 (data from) only, 5 production cycles / 10 years ; 4 no statistical test carried out ; 2 2(d)(i) there is no, relationship / correlation, between the number of lice (on trout) and the distance from the (nearest) fish farm ; 1 2(d)(ii) (Ireland) significant / yes / / AW and (Scotland) not significant / no / / AW ; 1 2(d)(iii) there is a negative correlation or as distance from (nearest) fish farm increases, (mean) number of lice (per trout) decreases ; ora 1 Question Answer Marks 2(d)(iv) Max one from MP1–3 reasons for 95% CI: 1 95%, probability / confidence that / chance that, the, true / actual / population / parametric, mean lies within, this range / these limits or 2 to test whether the means (for number lice per trout at different distances from fish farms) are (significantly) different or to see / test, whether the, error bars / 95% CI / they, overlap or 3 to get a measure of how close the, calculated / AW, mean is likely to be to the, true / AW, mean or shorter, error bars / 95% CI, show true mean is likely to be closer to the calculated mean or longer, error bars / 95% CI, show true mean is likely to be further from the calculated mean ; One mark for exemplification: Exemplification of MP 2 or 3 from Fig. 2.3: MP2 Exemplification: idea that no / less overlap of (95% CI) error bars for Ireland, so (difference), is / may be, significant or idea that overlap of (95% CI) error bars for, Scotland / Ireland, so (difference), is not / may not be, significant ; I direct comparison between Ireland with Scotland MP3 Exemplification: idea that the, shorter / narrower, error bars for Ireland the closer the calculated mean is (likely to be) to the true mean or idea that the, larger / longer, error bars for Scotland, the further the calculated mean is (likely to be) from the true mean or shorter / narrower, error bars / confidence limits, with increasing distance (to nearest fish farm) in, Ireland / Scotland, shows the calculated mean is, getting / AW, closer to the true mean ; I direct comparison between Ireland with Scotland 2
What was in this paper
The subtopics covered by these 2 questions, and how many questions each got. Open one in a new tab to see every Cambridge question on it.
What you needed in this session
Cambridge’s own grade thresholds for 2023 May/June, Paper 5 · Variant 1. A higher threshold means an easier paper — the bar moves with how the cohort did.