Cambridge A Level Biology 9700 — 2023 Oct/Nov Paper 5 · Variant 1
9700/51/O/N/23 · 2 questions · 30 marks · ≈34 min
The question paper and its mark scheme, free to read here and free to download. This is Cambridge’s own paper, exactly as it was sat.
Question paper16 pages
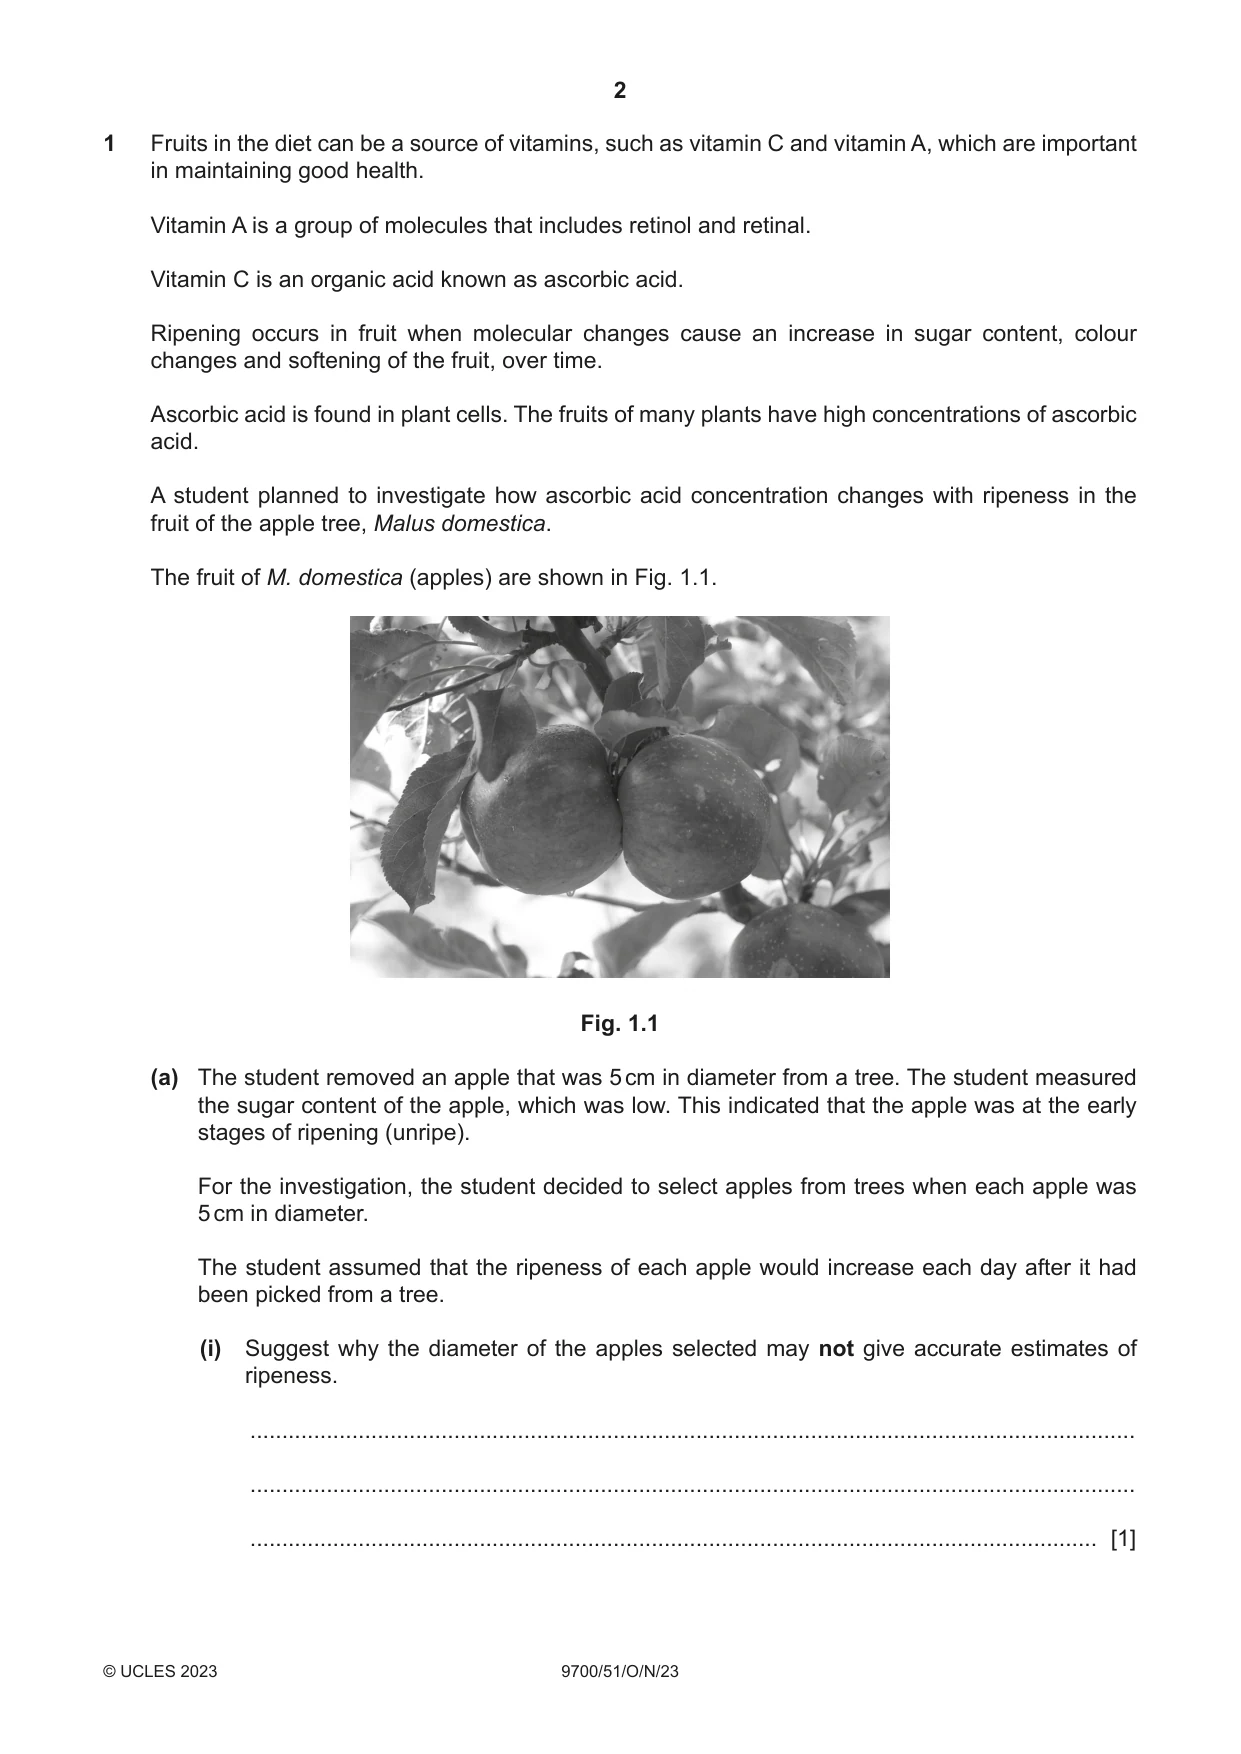
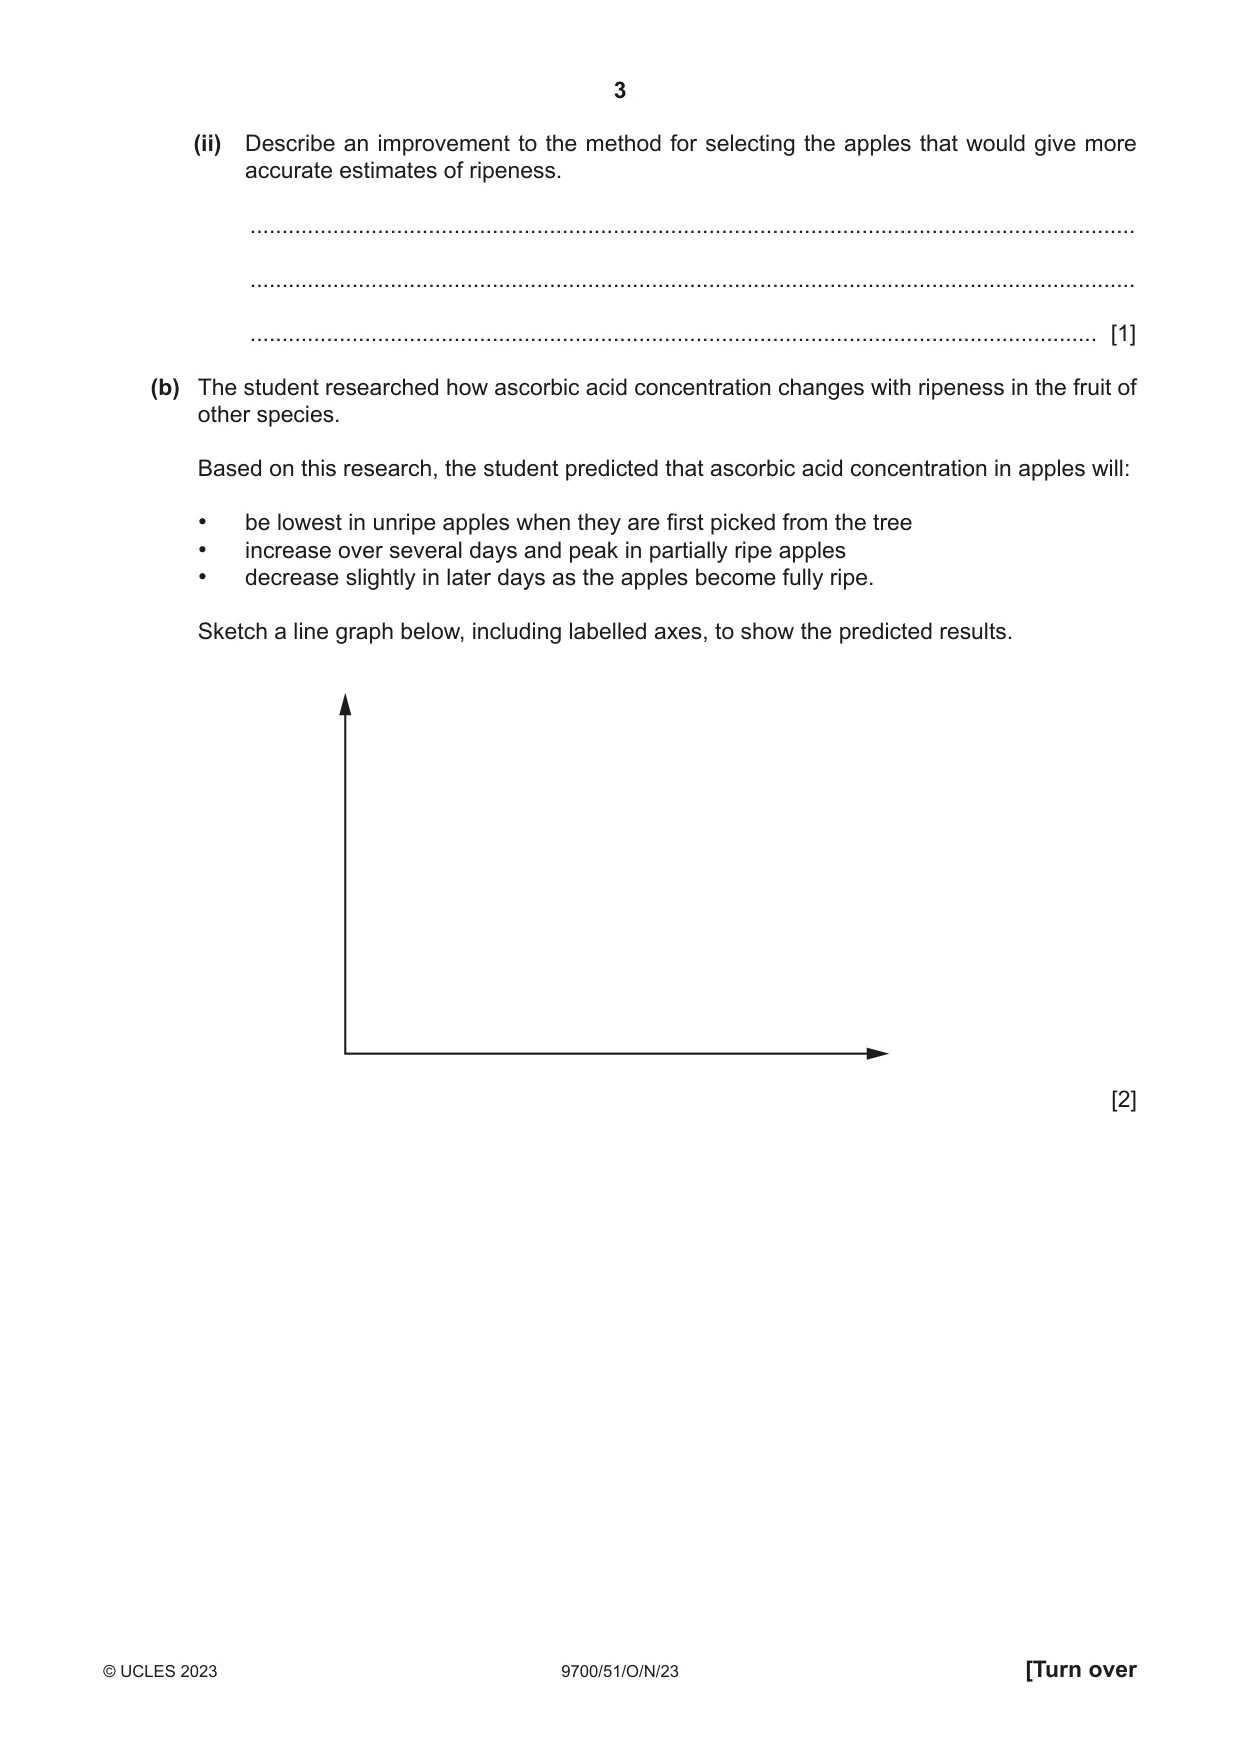




Mark scheme10 pages
Answers below. Sit the paper first if you are practising.
Questions as text
Q1 · Fruits in the diet can be a source of vitamins, such as vitamin C and vitamin A, which…
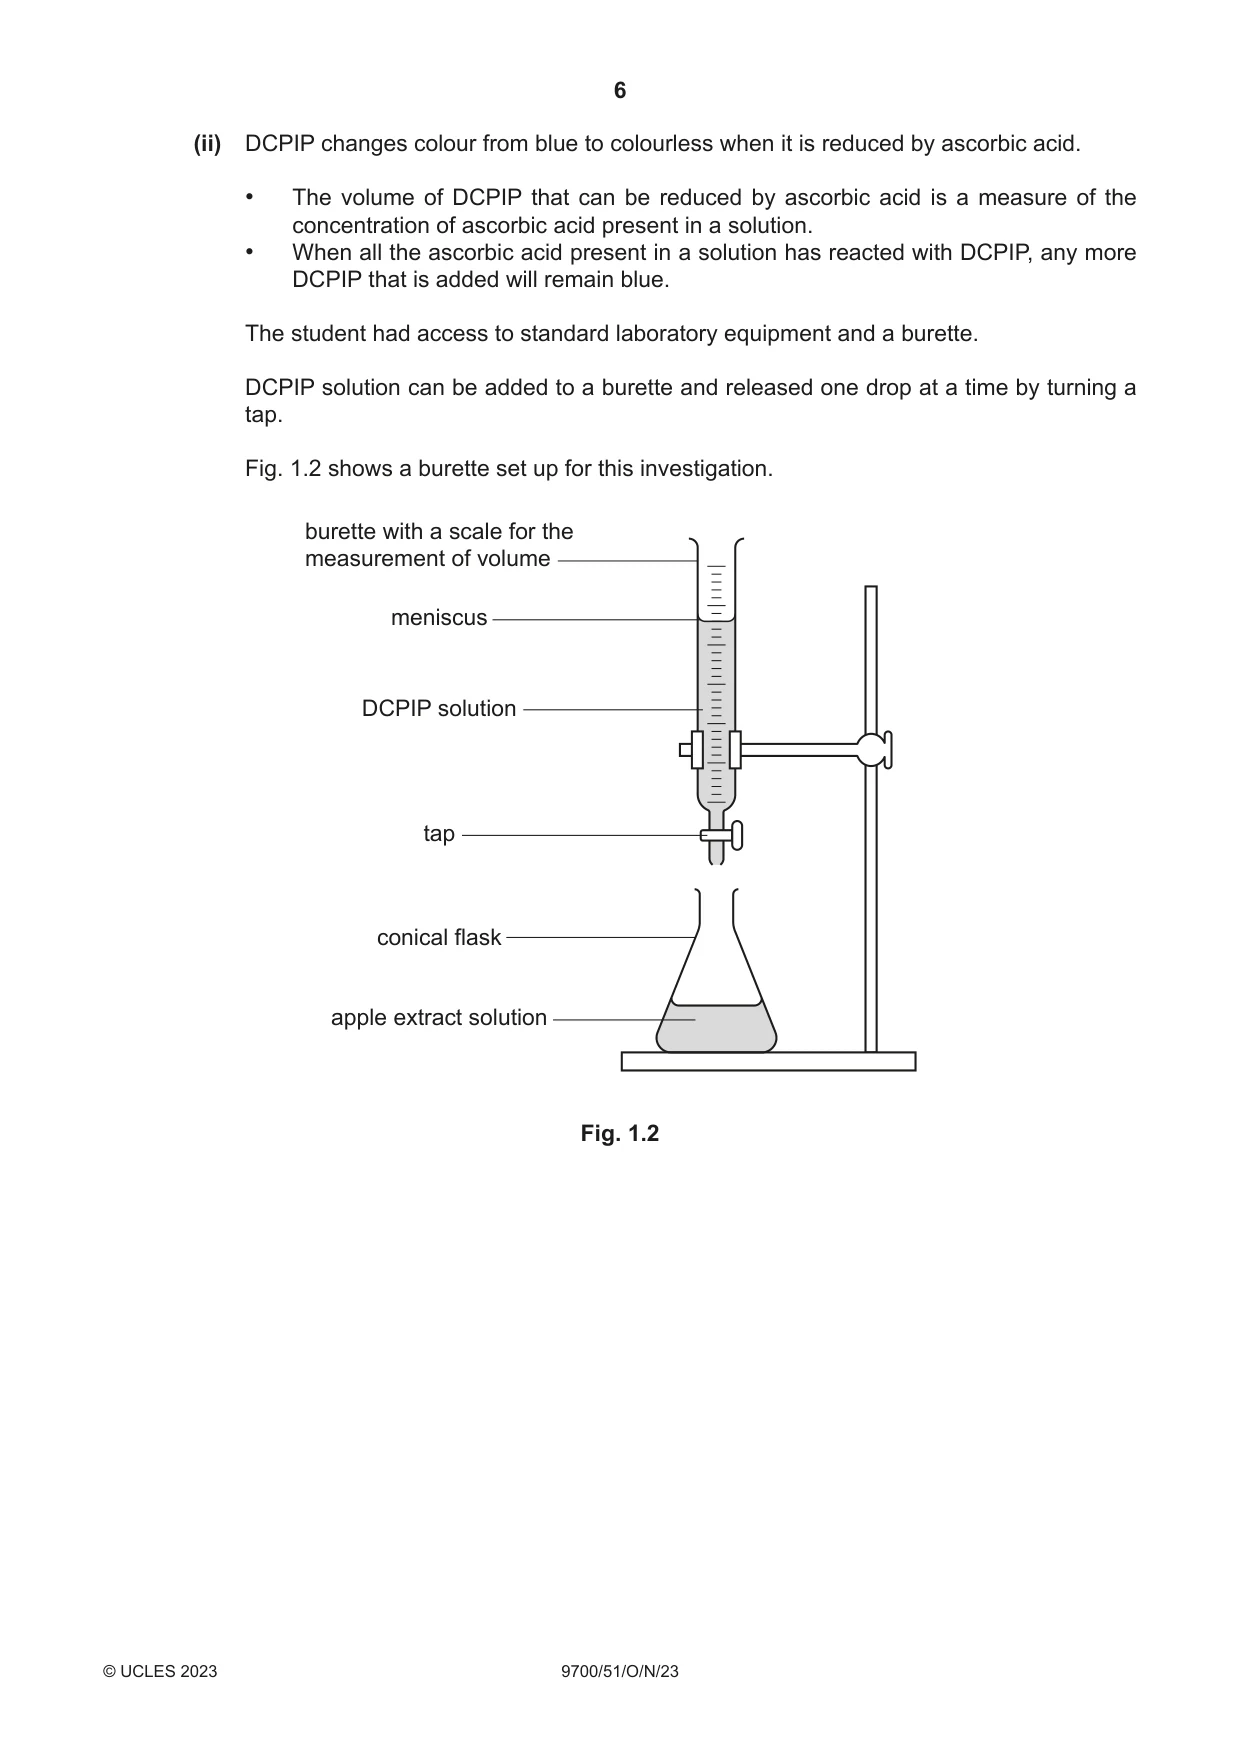
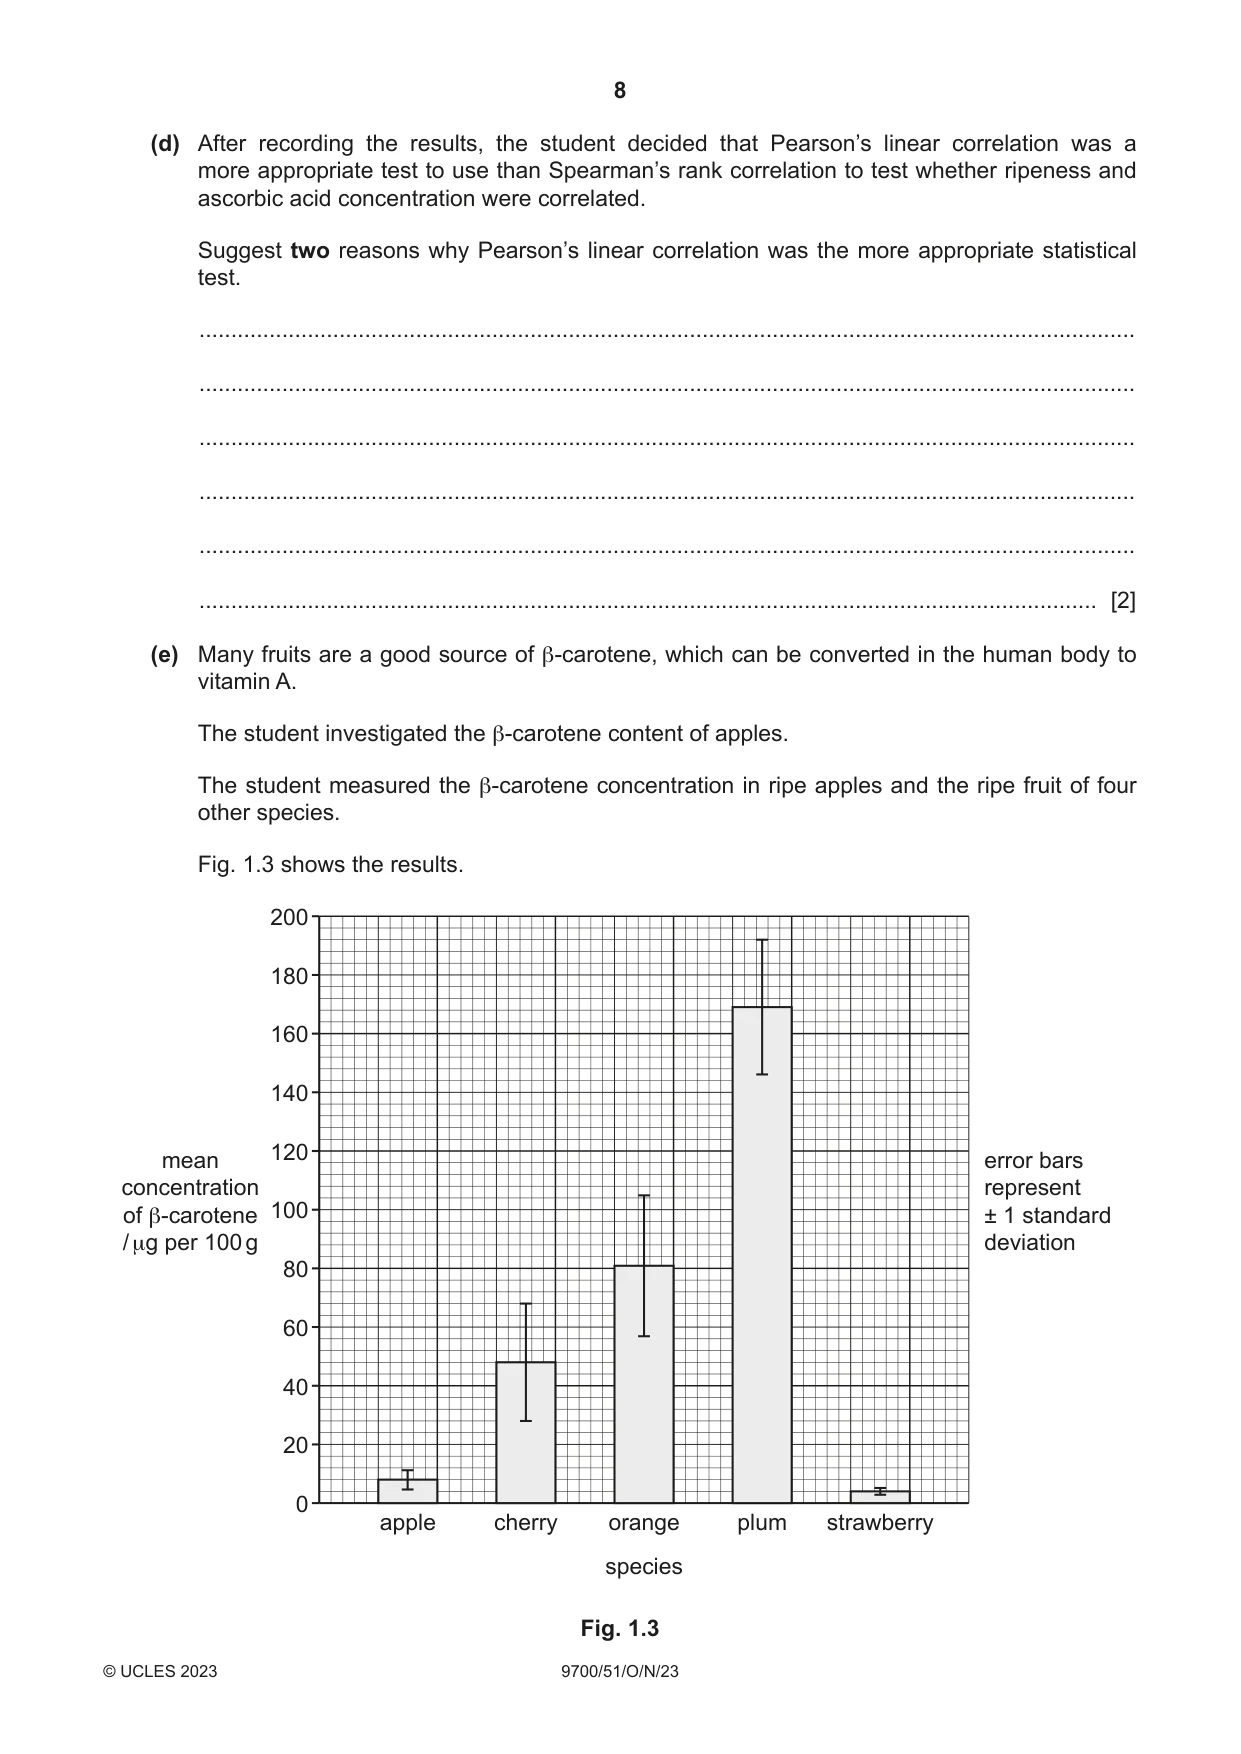
1 Fruits in the diet can be a source of vitamins, such as vitamin C and vitamin A, which are important in maintaining good health. Vitamin A is a group of molecules that includes retinol and retinal. Vitamin C is an organic acid known as ascorbic acid. Ripening occurs in fruit when molecular changes cause an increase in sugar content, colour changes and softening of the fruit, over time. Ascorbic acid is found in plant cells. The fruits of many plants have high concentrations of ascorbic acid. A student planned to investigate how ascorbic acid concentration changes with ripeness in the fruit of the apple tree, Malus domestica. The fruit of M. domestica (apples) are shown in Fig. 1.1. Fig. 1.1 (a) The student removed an apple that was 5 cm in diameter from a tree. The student measured the sugar content of the apple, which was low. This indicated that the apple was at the early stages of ripening (unripe). For the investigation, the student decided to select apples from trees when each apple was 5 cm in diameter. The student assumed that the ripeness of each apple would increase each day after it had been picked from a tree. (i) Suggest why the diameter of the apples selected may not give accurate estimates of ripeness. ........................................................................................................................................... ........................................................................................................................................... ..................................................................................................................................... [1] (ii) Describe an improvement to the method for selecting the apples that would give more accurate estimates of ripeness. ........................................................................................................................................... ........................................................................................................................................... ..................................................................................................................................... [1] (b) The student researched how ascorbic acid concentration changes with ripeness in the fruit of other species. Based on this research, the student predicted that ascorbic acid concentration in apples will: • be lowest in unripe apples when they are first picked from the tree • increase over several days and peak in partially ripe apples • decrease slightly in later days as the apples become fully ripe. Sketch a line graph below, including labelled axes, to show the predicted results. [2] (c) The student used the redox indicator DCPIP to investigate how ascorbic acid concentration changes as the apples ripen. The student tested the ascorbic acid concentration of the apples at intervals from the time they were taken from the tree until the apples were fully ripe. For each test, the student prepared an apple extract solution and reacted this with a DCPIP solution of standardised concentration. (i) The student was provided with a 0.01 mol dm–3 stock solution of DCPIP. After preliminary research, the student decided to dilute the stock solution to prepare a 0.0005 mol dm–3 DCPIP solution to use in the experiment. The student used two steps to dilute the stock solution to the 0.0005 mol dm–3 DCPIP solution. Complete the description of the two steps for the dilution by adding the correct values to the sentences. step 1 The student mixed 10 cm3 of 0.01 mol dm–3 DCPIP stock solution with .................. cm3 of distilled water to produce solution A. Solution A had a concentration of 0.001 mol dm–3. step 2 The student then mixed .................. cm3 of solution A with 50 cm3 of distilled water to produce the 0.0005 mol dm–3 DCPIP solution. [2] (ii) DCPIP changes colour from blue to colourless when it is reduced by ascorbic acid. • The volume of DCPIP that can be reduced by ascorbic acid is a measure of the concentration of ascorbic acid present in a solution. • When all the ascorbic acid present in a solution has reacted with DCPIP, any more DCPIP that is added will remain blue. The student had access to standard laboratory equipment and a burette. DCPIP solution can be added to a burette and released one drop at a time by turning a tap. Fig. 1.2 shows a burette set up for this investigation. burette with a scale for the measurement of volume meniscus DCPIP solution tap conical flask apple extract solution Fig. 1.2 Describe a method the student could use to: • prepare apple extract solutions from the fruit • collect the results needed to show the changes in ascorbic acid concentrations as the apples ripen, using DCPIP. The description of your method should be set out in a logical way and be detailed enough for another person to follow. You should not repeat the details from (c)(i) describing how to dilute the 0.01 mol dm–3 stock solution of DCPIP. ........................................................................................................................................... ........................................................................................................................................... ........................................................................................................................................... ........................................................................................................................................... ........................................................................................................................................... ........................................................................................................................................... ........................................................................................................................................... ........................................................................................................................................... ........................................................................................................................................... ........................................................................................................................................... ........................................................................................................................................... ........................................................................................................................................... ........................................................................................................................................... ........................................................................................................................................... ........................................................................................................................................... ........................................................................................................................................... ........................................................................................................................................... ........................................................................................................................................... ........................................................................................................................................... ........................................................................................................................................... ........................................................................................................................................... ..................................................................................................................................... [9] (d) After recording the results, the student decided that Pearson’s linear correlation was a more appropriate test to use than Spearman’s rank correlation to test whether ripeness and ascorbic acid concentration were correlated. Suggest two reasons why Pearson’s linear correlation was the more appropriate statistical test. ................................................................................................................................................... ................................................................................................................................................... ................................................................................................................................................... ................................................................................................................................................... ................................................................................................................................................... ............................................................................................................................................. [2] (e) Many fruits are a good source of β-carotene, which can be converted in the human body to vitamin A. The student investigated the β-carotene content of apples. The student measured the β-carotene concentration in ripe apples and the ripe fruit of four other species. Fig. 1.3 shows the results. 200 180 160 140 120 mean error bars concentration represent of β-carotene 100 ± 1 standard / μg per 100 g deviation 80 60 40 20 0 apple cherry orange plum strawberry species Fig. 1.3 The student concluded that apples are not a good dietary source of vitamin A. Use the data in Fig. 1.3 to evaluate this conclusion. ................................................................................................................................................... ................................................................................................................................................... ................................................................................................................................................... ................................................................................................................................................... ................................................................................................................................................... ................................................................................................................................................... ................................................................................................................................................... ................................................................................................................................................... ............................................................................................................................................. [3] [Total: 20]
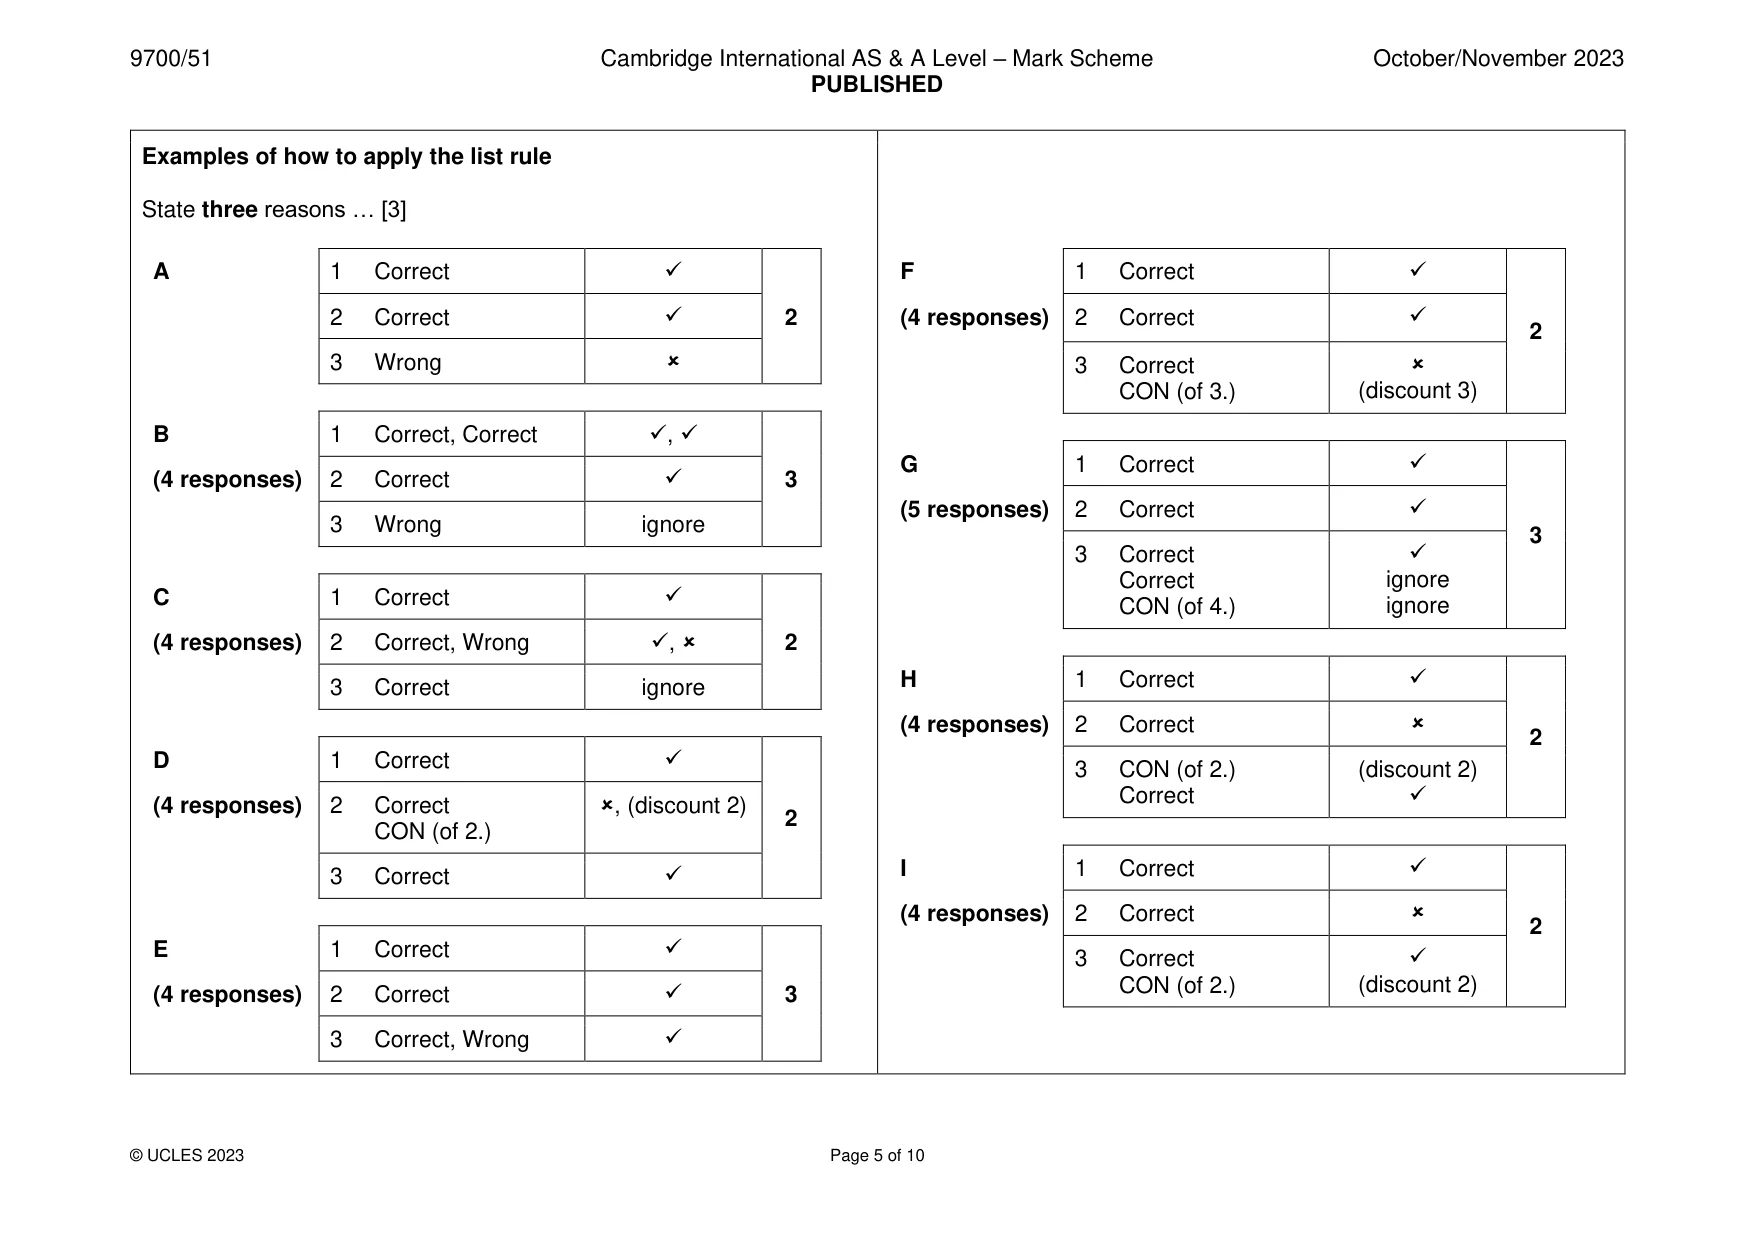
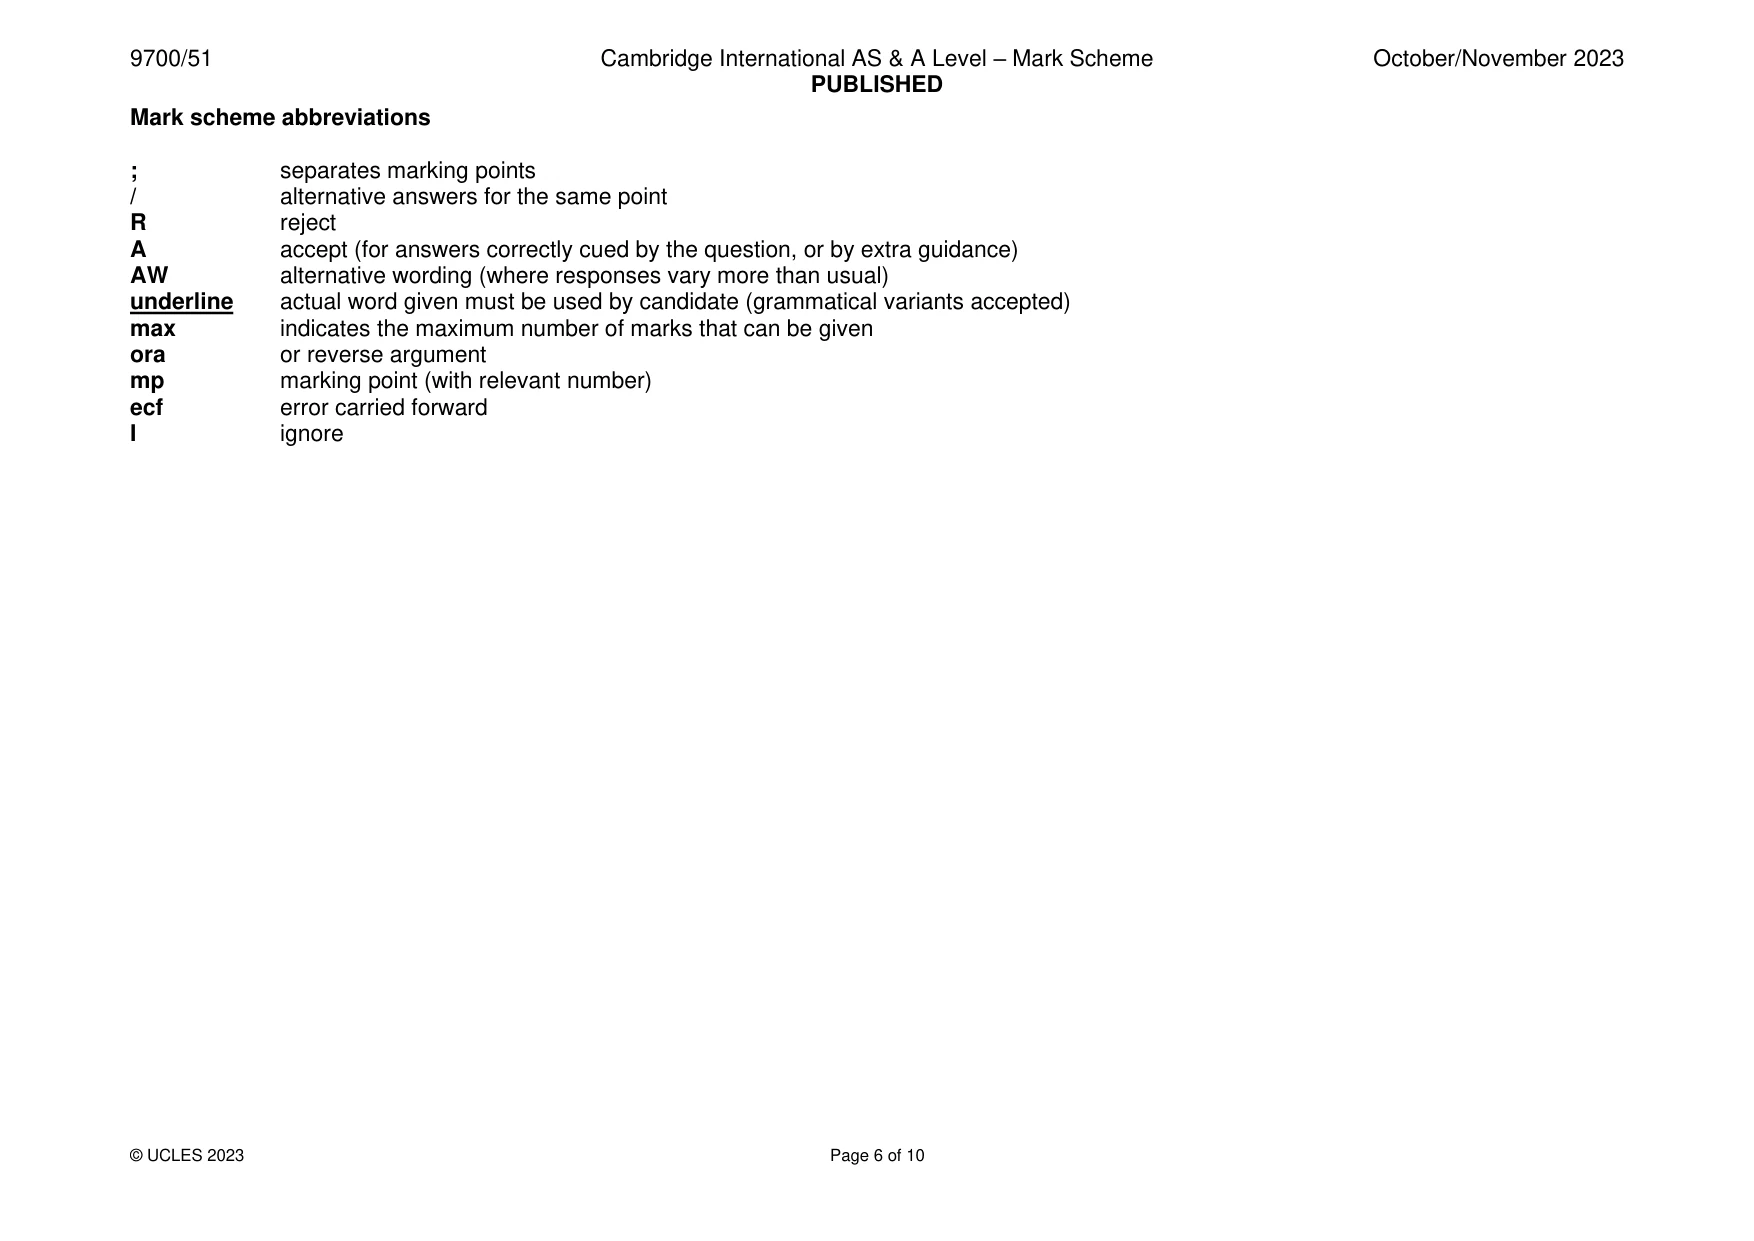
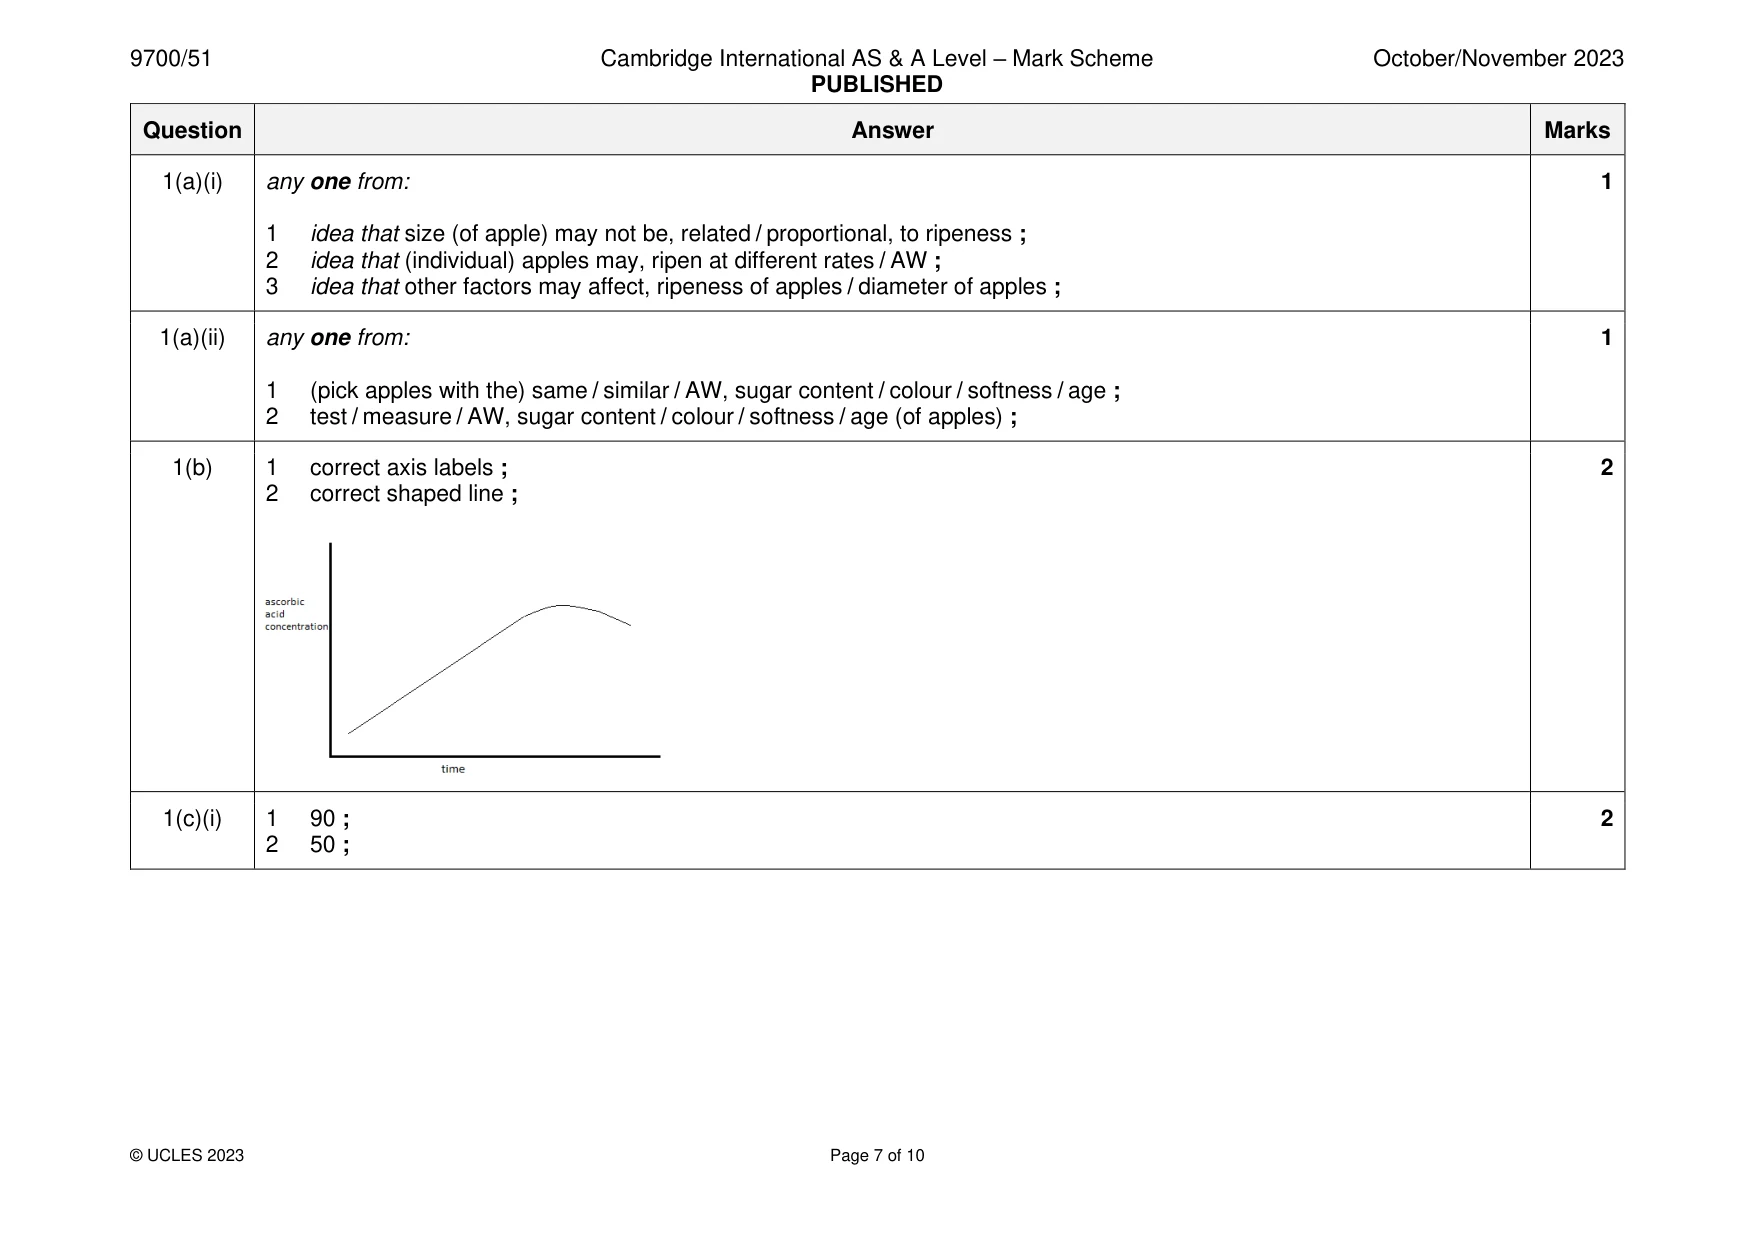
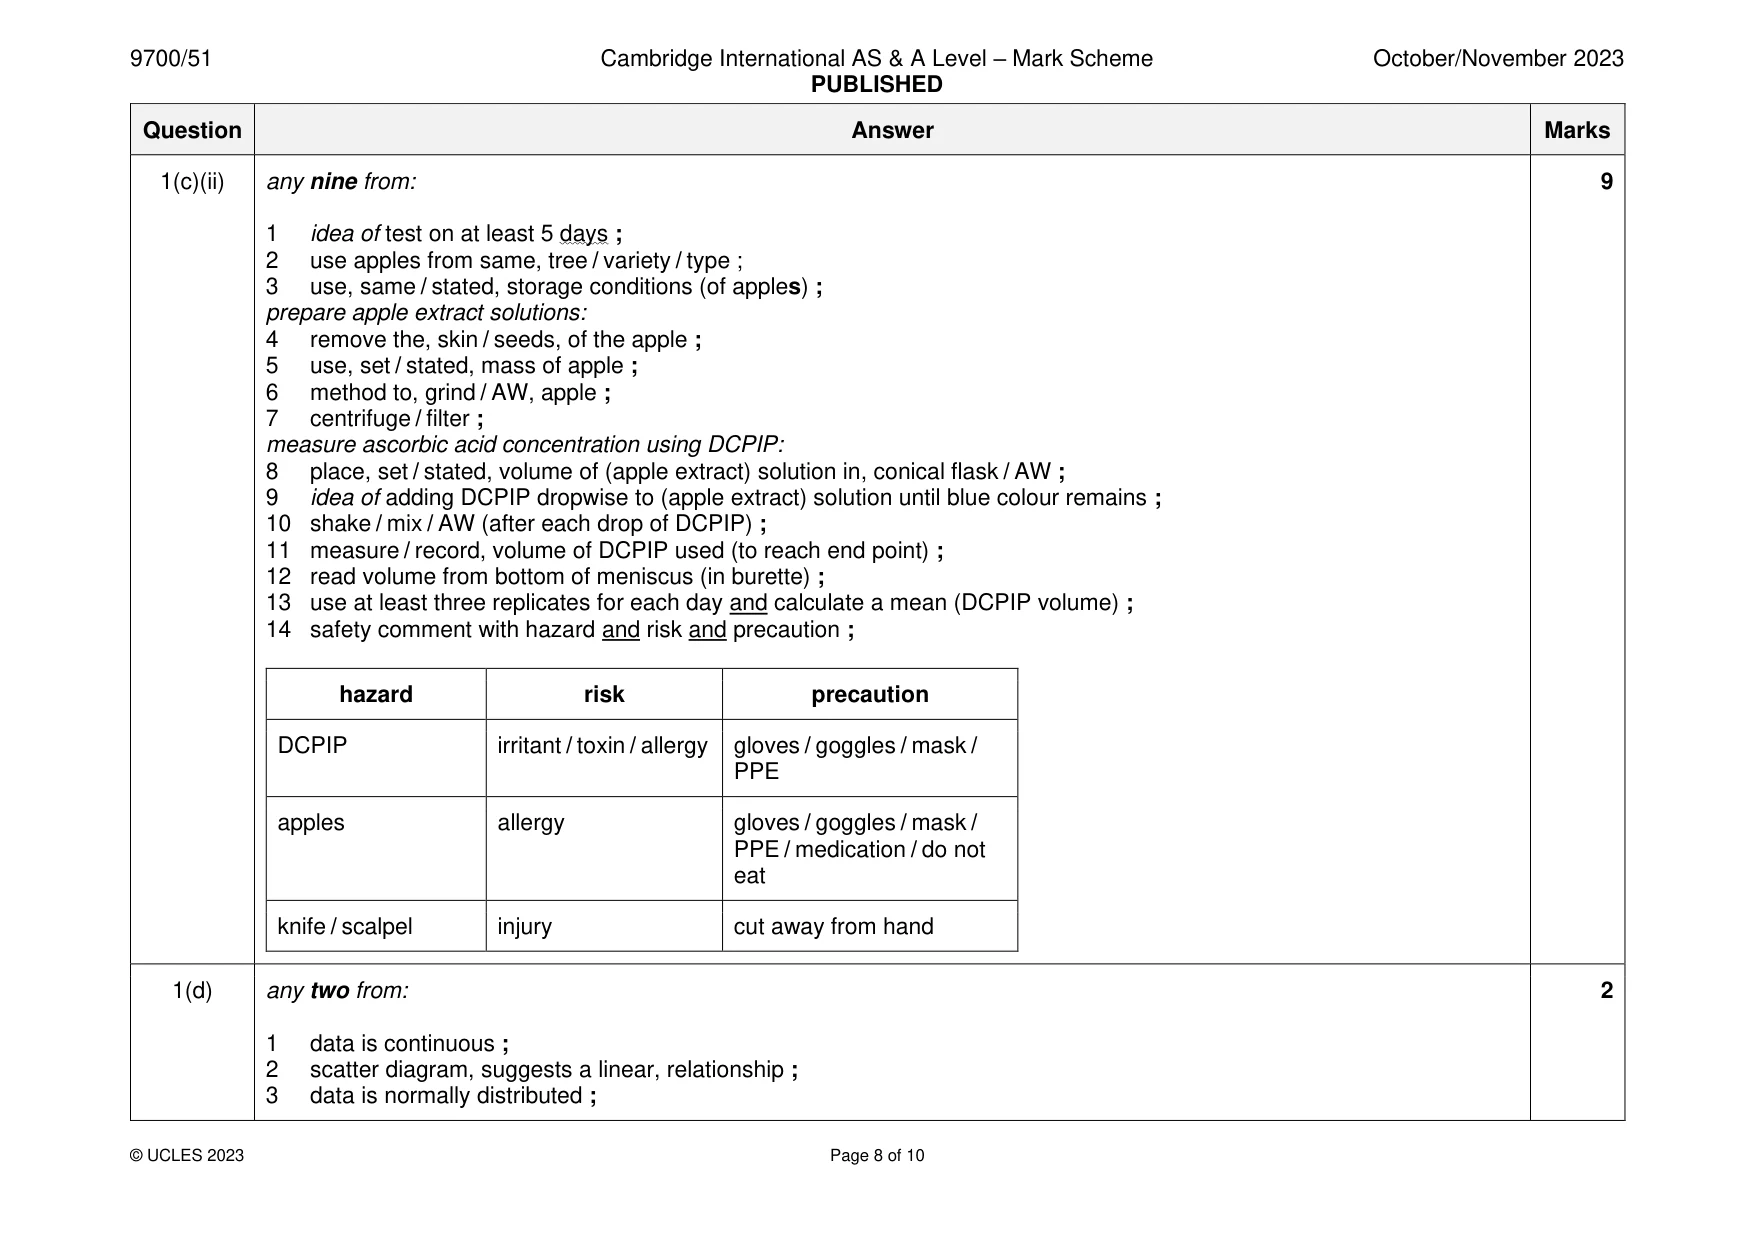
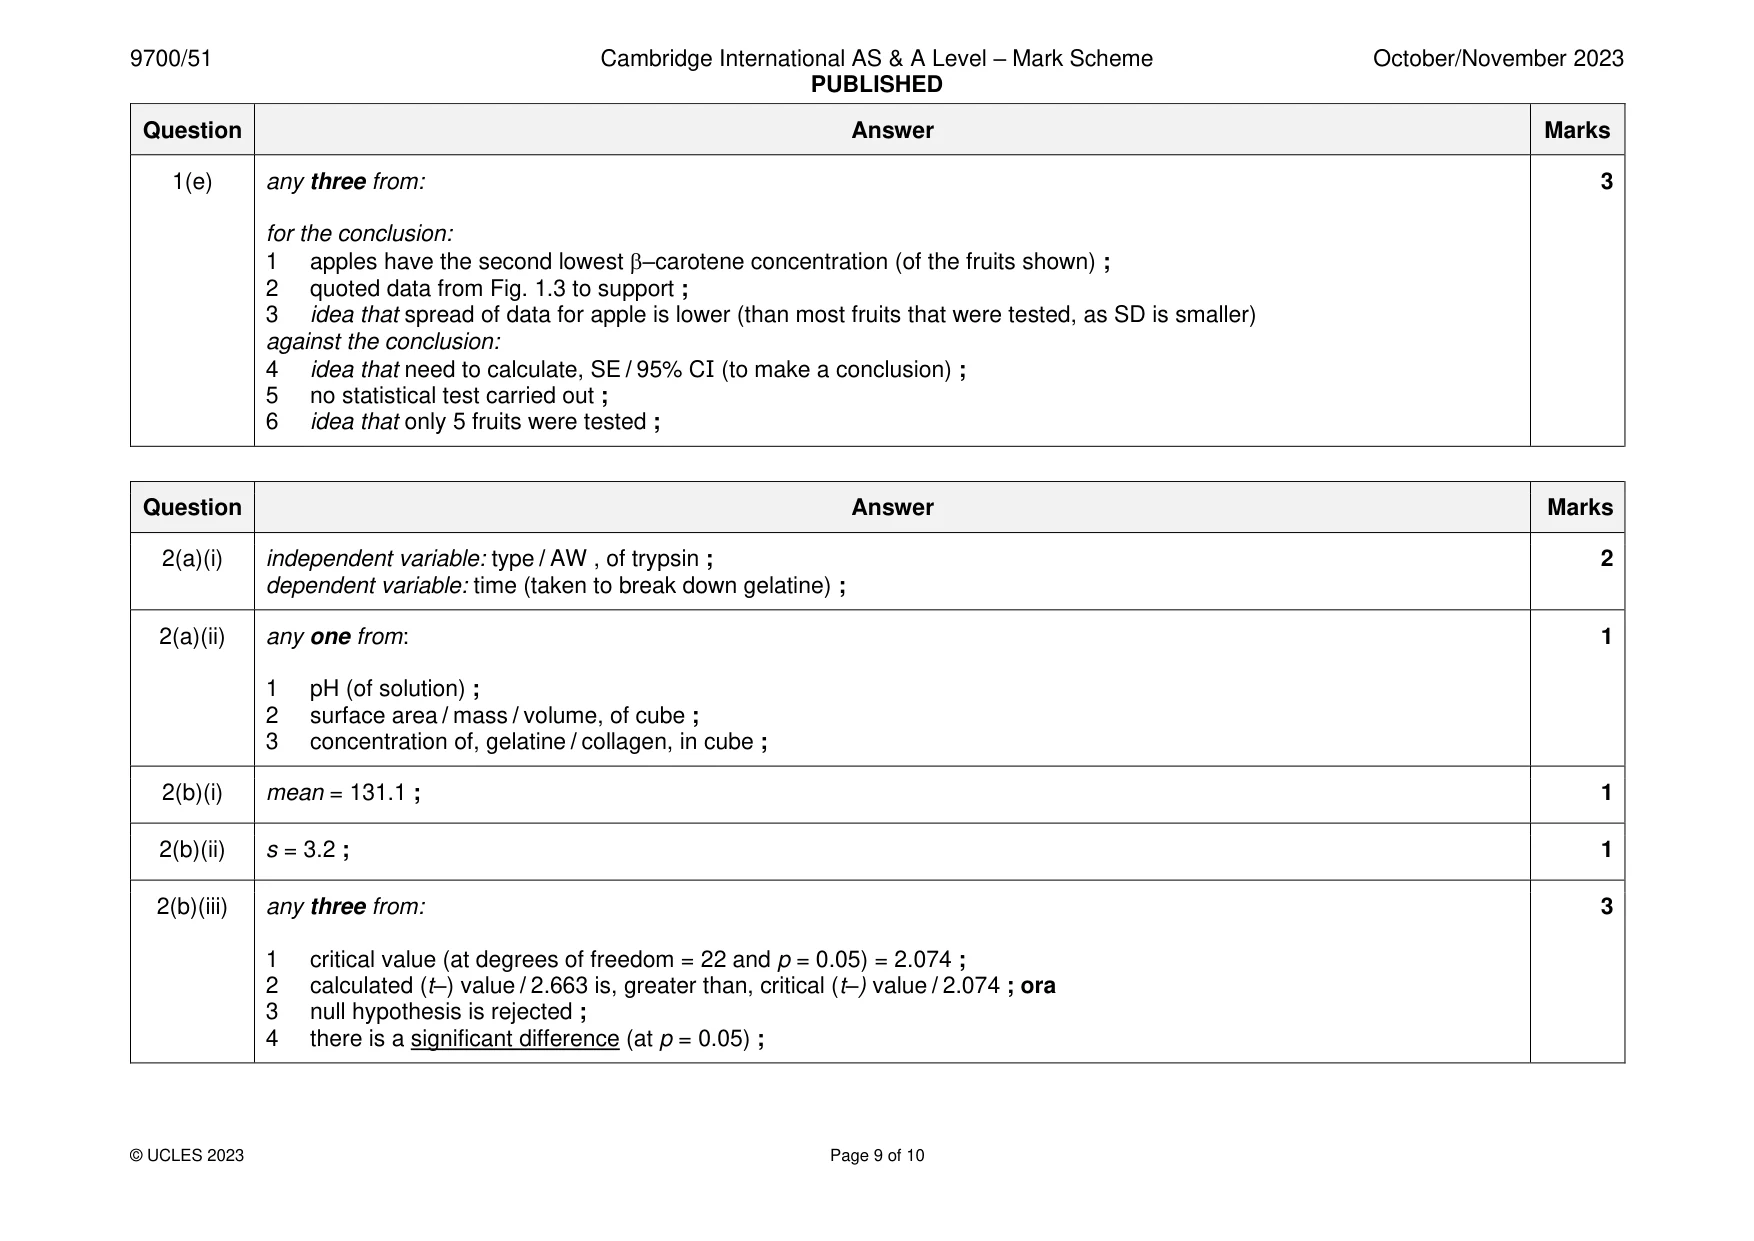
Mark scheme: Question Answer Marks 1(a)(i) any one from: 1 1 idea that size (of apple) may not be, related / proportional, to ripeness ; 2 idea that (individual) apples may, ripen at different rates / AW ; 3 idea that other factors may affect, ripeness of apples / diameter of apples ; 1(a)(ii) any one from: 1 1 (pick apples with the) same / similar / AW, sugar content / colour / softness / age ; 2 test / measure / AW, sugar content / colour / softness / age (of apples) ; 1(b) 1 correct axis labels ; 2 2 correct shaped line ; 1(c)(i) 1 90 ; 2 2 50 ; 1(c)(ii) any nine from: 9 1 idea of test on at least 5 days ; 2 use apples from same, tree / variety / type ; 3 use, same / stated, storage conditions (of apples) ; prepare apple extract solutions: 4 remove the, skin / seeds, of the apple ; 5 use, set / stated, mass of apple ; 6 method to, grind / AW, apple ; 7 centrifuge / filter ; measure ascorbic acid concentration using DCPIP: 8 place, set / stated, volume of (apple extract) solution in, conical flask / AW ; 9 idea of adding DCPIP dropwise to (apple extract) solution until blue colour remains ; 10 shake / mix / AW (after each drop of DCPIP) ; 11 measure / record, volume of DCPIP used (to reach end point) ; 12 read volume from bottom of meniscus (in burette) ; 13 use at least three replicates for each day and calculate a mean (DCPIP volume) ; 14 safety comment with hazard and risk and precaution ; hazard risk precaution DCPIP irritant / toxin / allergy gloves / goggles / mask / PPE apples allergy gloves / goggles / mask / PPE / medication / do not eat knife / scalpel injury cut away from hand 1(d) any two from: 2 1 data is continuous ; 2 scatter diagram, suggests a linear, relationship ; 3 data is normally distributed ; 1(e) any three from: 3 for the conclusion: 1 apples have the second lowest –carotene concentration (of the fruits shown) ; 2 quoted data from Fig. 1.3 to support ; 3 idea that spread of data for apple is lower (than most fruits that were tested, as SD is smaller) against the conclusion: 4 idea that need to calculate, SE / 95% CI (to make a conclusion) ; 5 no statistical test carried out ; 6 idea that only 5 fruits were tested ;
Q2 · Trypsin is a protease enzyme
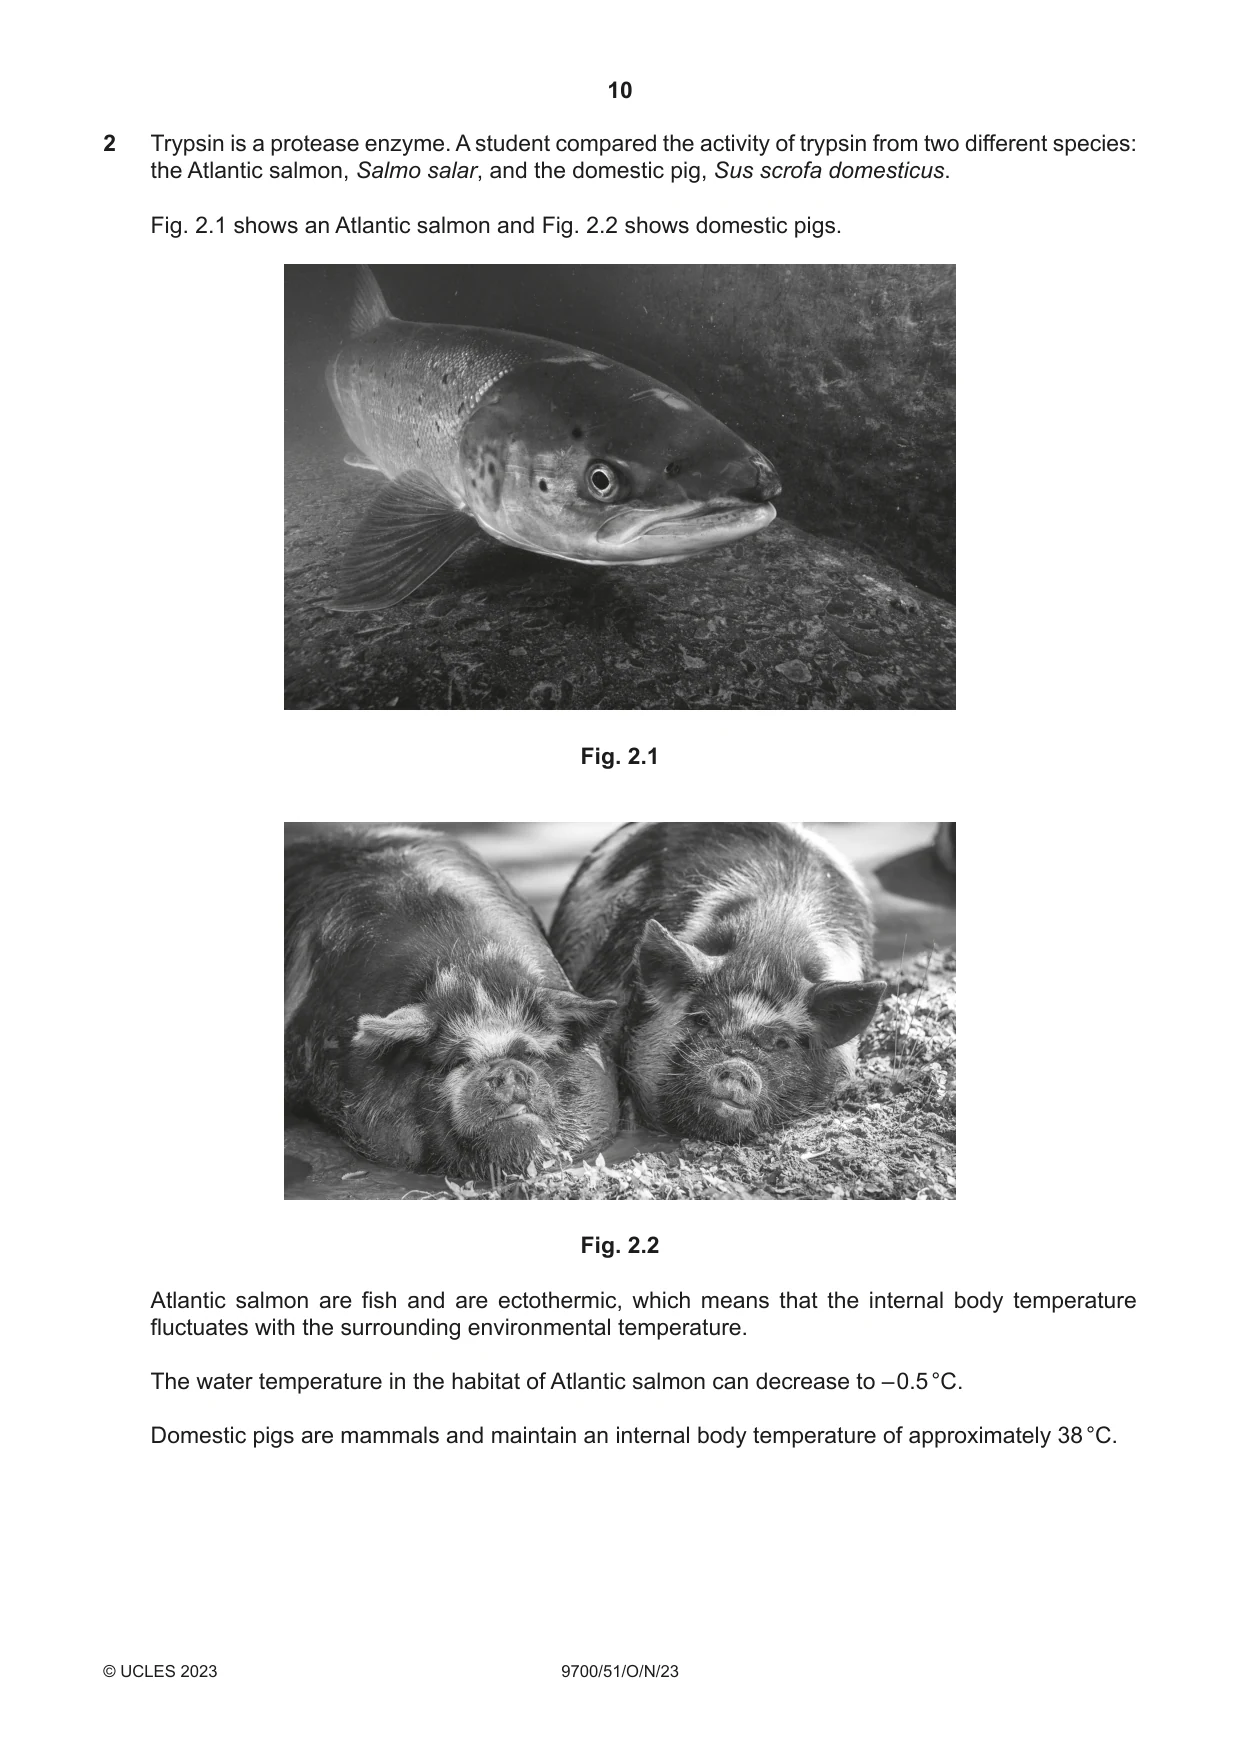
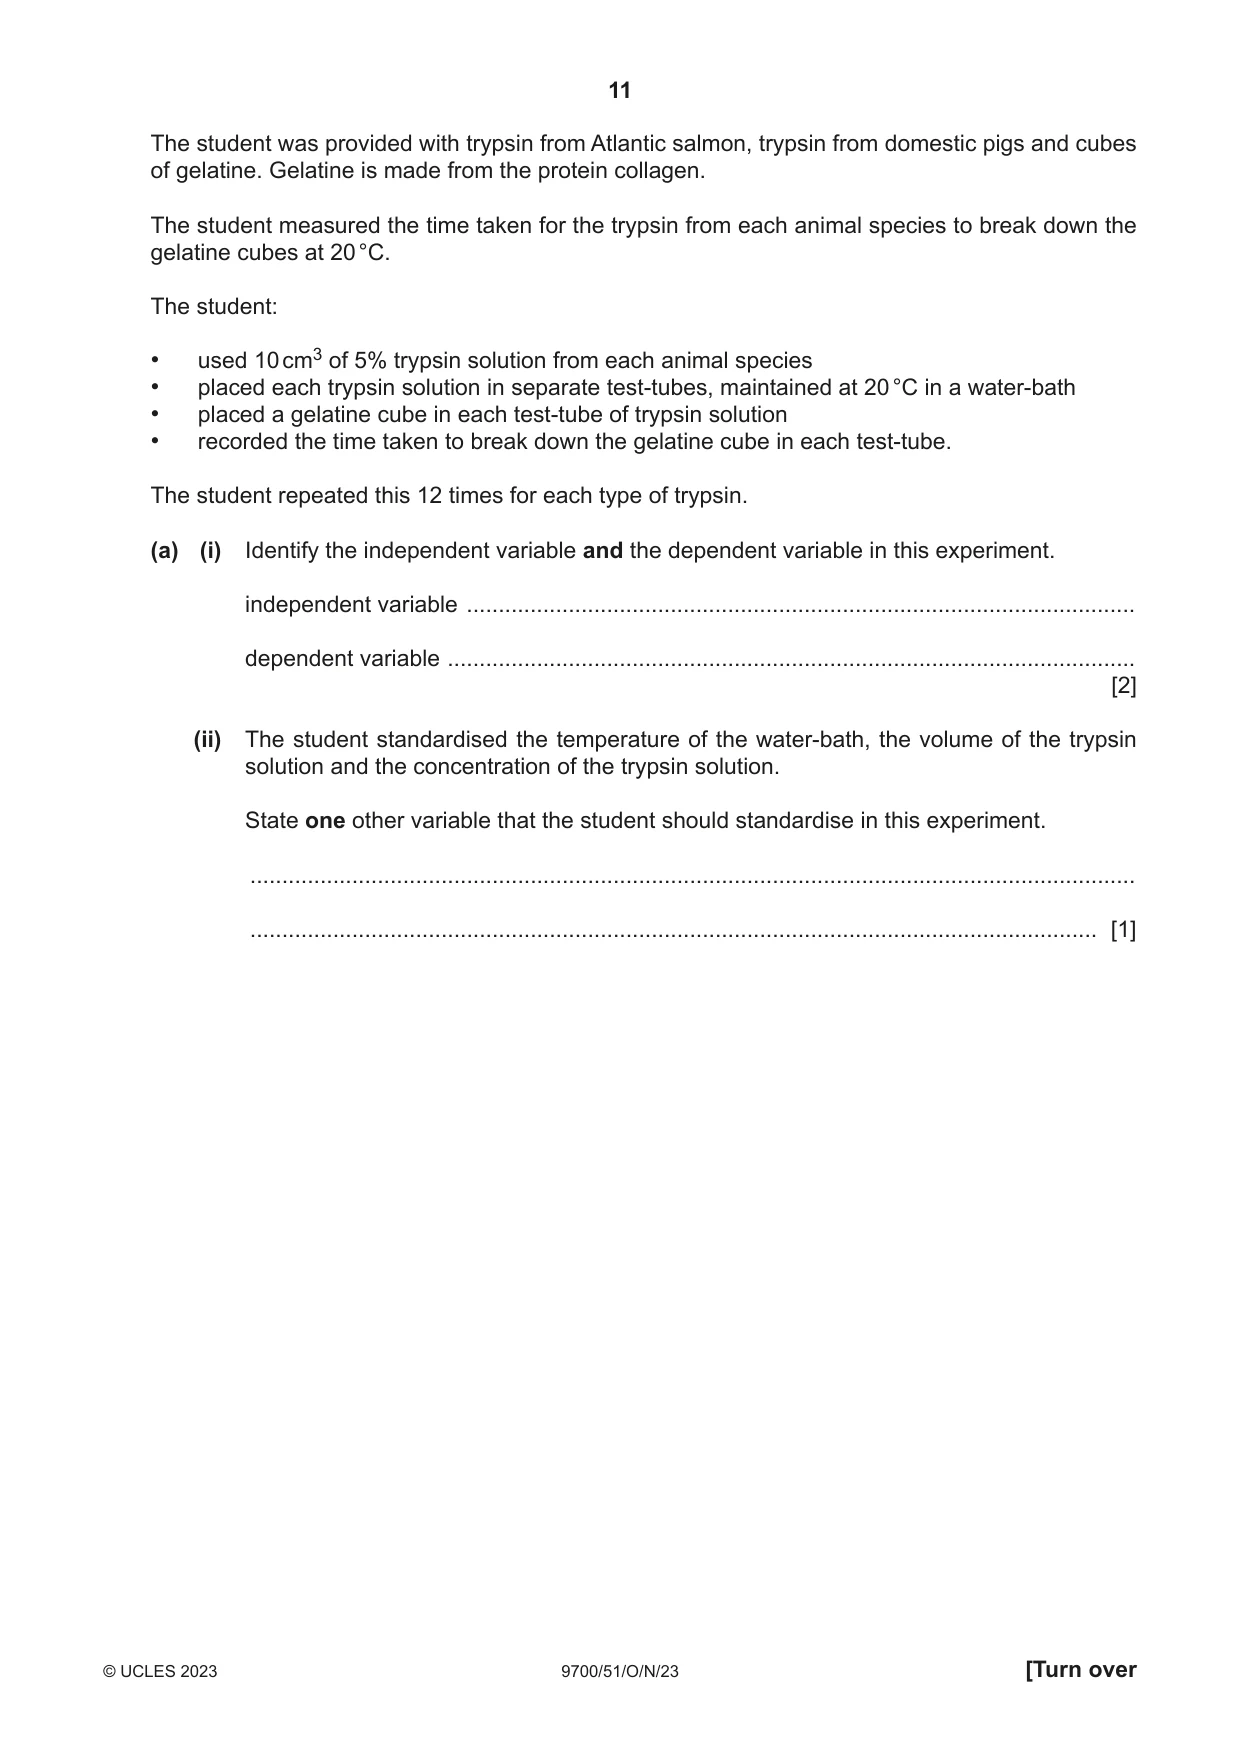
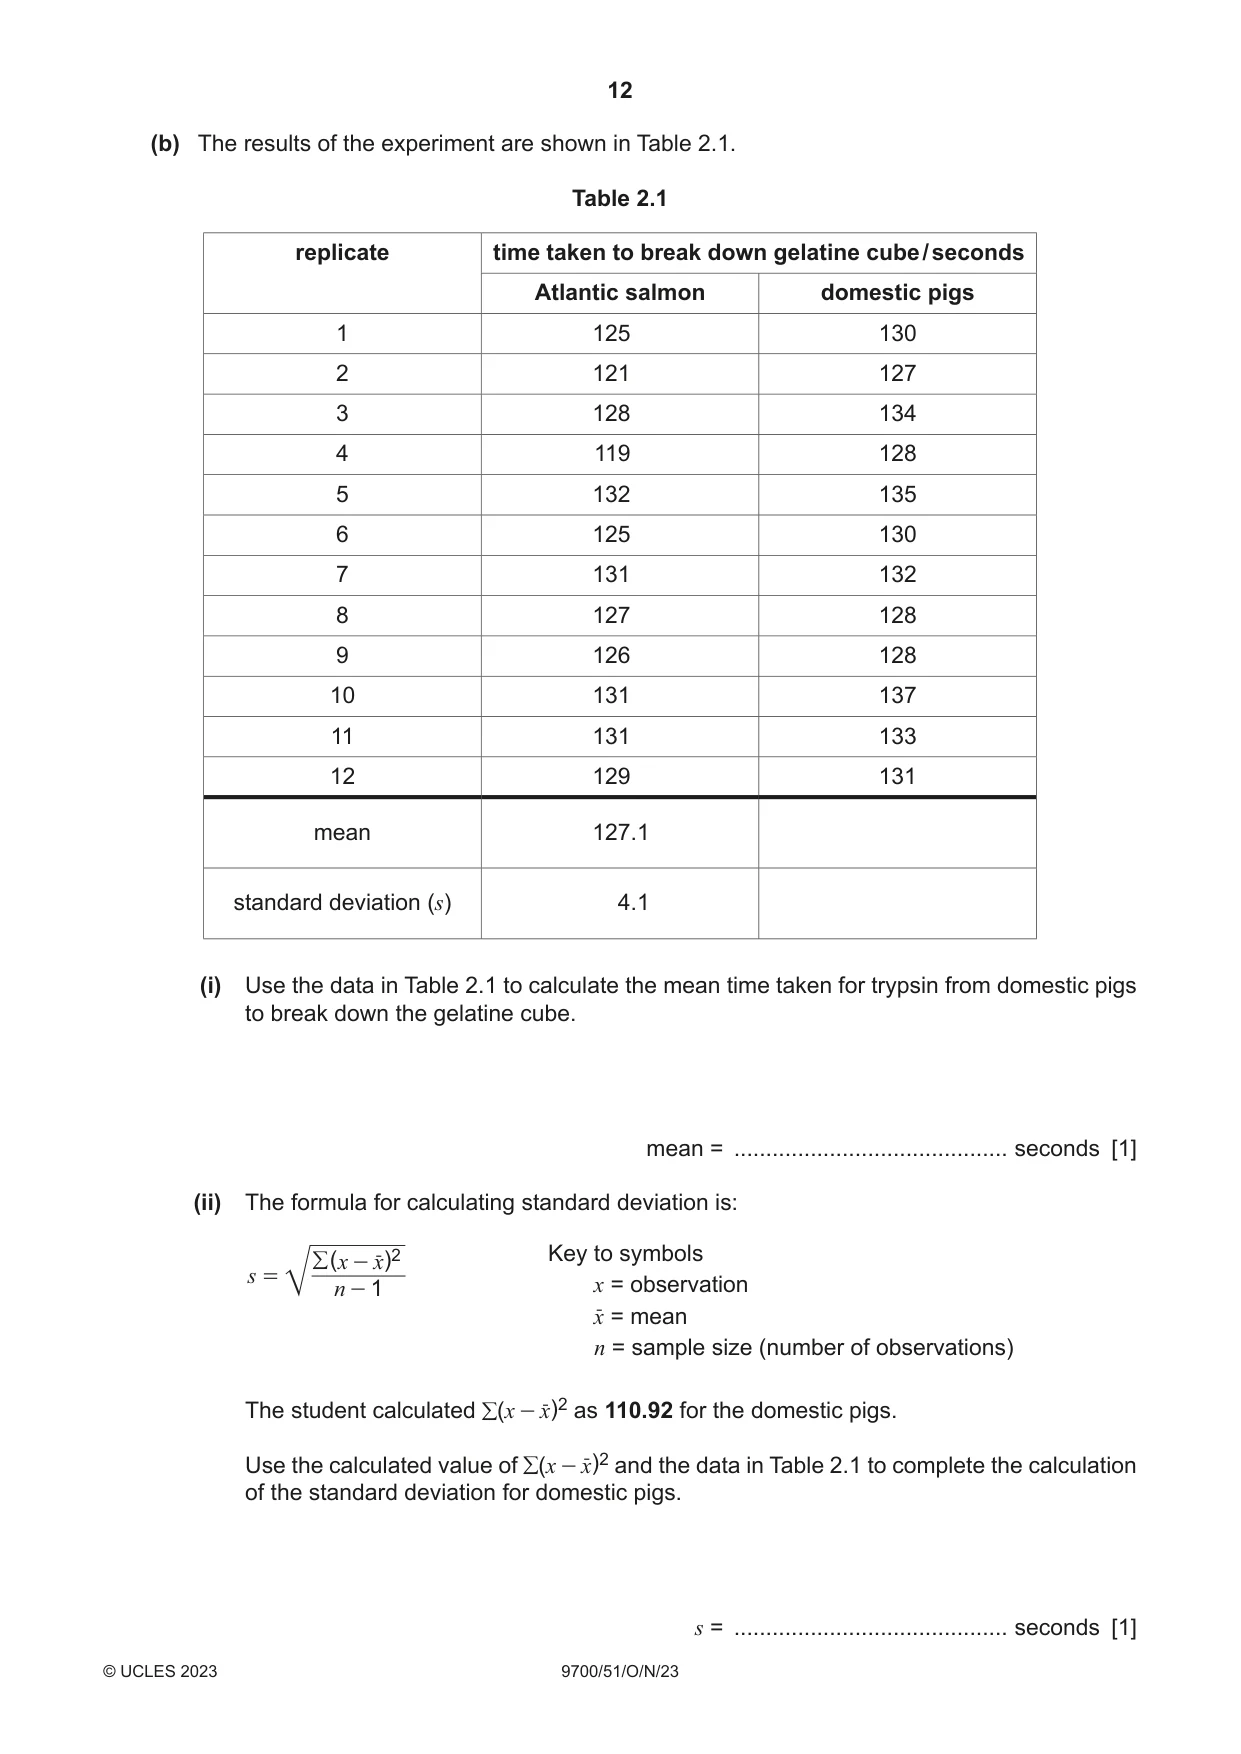
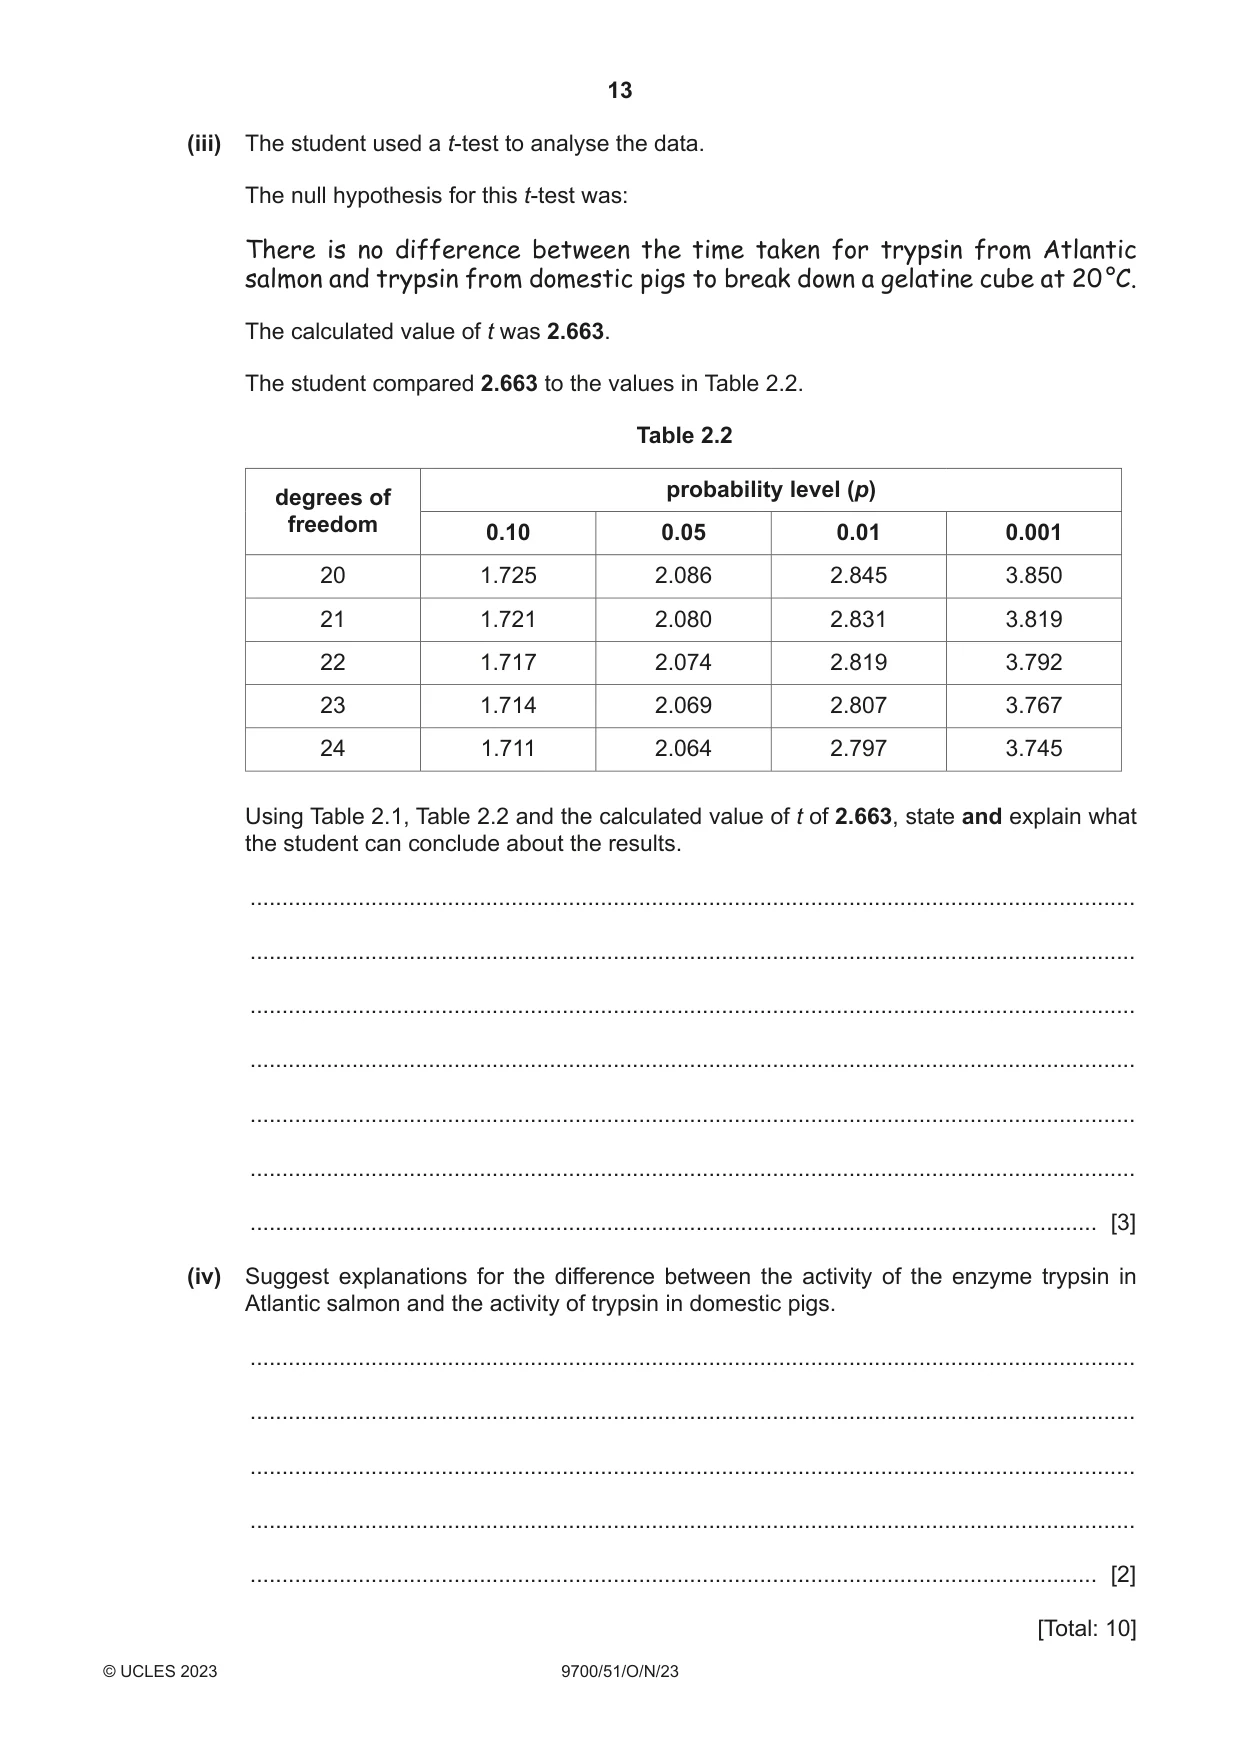
2 Trypsin is a protease enzyme. A student compared the activity of trypsin from two different species: the Atlantic salmon, Salmo salar, and the domestic pig, Sus scrofa domesticus. Fig. 2.1 shows an Atlantic salmon and Fig. 2.2 shows domestic pigs. Fig. 2.1 Fig. 2.2 Atlantic salmon are fish and are ectothermic, which means that the internal body temperature fluctuates with the surrounding environmental temperature. The water temperature in the habitat of Atlantic salmon can decrease to – 0.5 °C. Domestic pigs are mammals and maintain an internal body temperature of approximately 38 °C. The student was provided with trypsin from Atlantic salmon, trypsin from domestic pigs and cubes of gelatine. Gelatine is made from the protein collagen. The student measured the time taken for the trypsin from each animal species to break down the gelatine cubes at 20 °C. The student: • used 10 cm3 of 5% trypsin solution from each animal species • placed each trypsin solution in separate test-tubes, maintained at 20 °C in a water-bath • placed a gelatine cube in each test-tube of trypsin solution • recorded the time taken to break down the gelatine cube in each test-tube. The student repeated this 12 times for each type of trypsin. (a) (i) Identify the independent variable and the dependent variable in this experiment. independent variable ......................................................................................................... dependent variable ............................................................................................................ [2] (ii) The student standardised the temperature of the water-bath, the volume of the trypsin solution and the concentration of the trypsin solution. State one other variable that the student should standardise in this experiment. ........................................................................................................................................... ..................................................................................................................................... [1] (b) The results of the experiment are shown in Table 2.1. Table 2.1 replicate time taken to break down gelatine cube / seconds Atlantic salmon domestic pigs 1 125 130 2 121 127 3 128 134 4 119 128 5 132 135 6 125 130 7 131 132 8 127 128 9 126 128 10 131 137 11 131 133 12 129 131 mean 127.1 standard deviation (s) 4.1 (i) Use the data in Table 2.1 to calculate the mean time taken for trypsin from domestic pigs to break down the gelatine cube. mean = ........................................... seconds [1] (ii) The formula for calculating standard deviation is: / ( x - x˗ )2 Key to symbols s = n - 1 x = observation x˗ = mean n = sample size (number of observations) The student calculated /(x - x˗ )2 as 110.92 for the domestic pigs. Use the calculated value of /(x - x˗ )2 and the data in Table 2.1 to complete the calculation of the standard deviation for domestic pigs. s = ........................................... seconds [1]
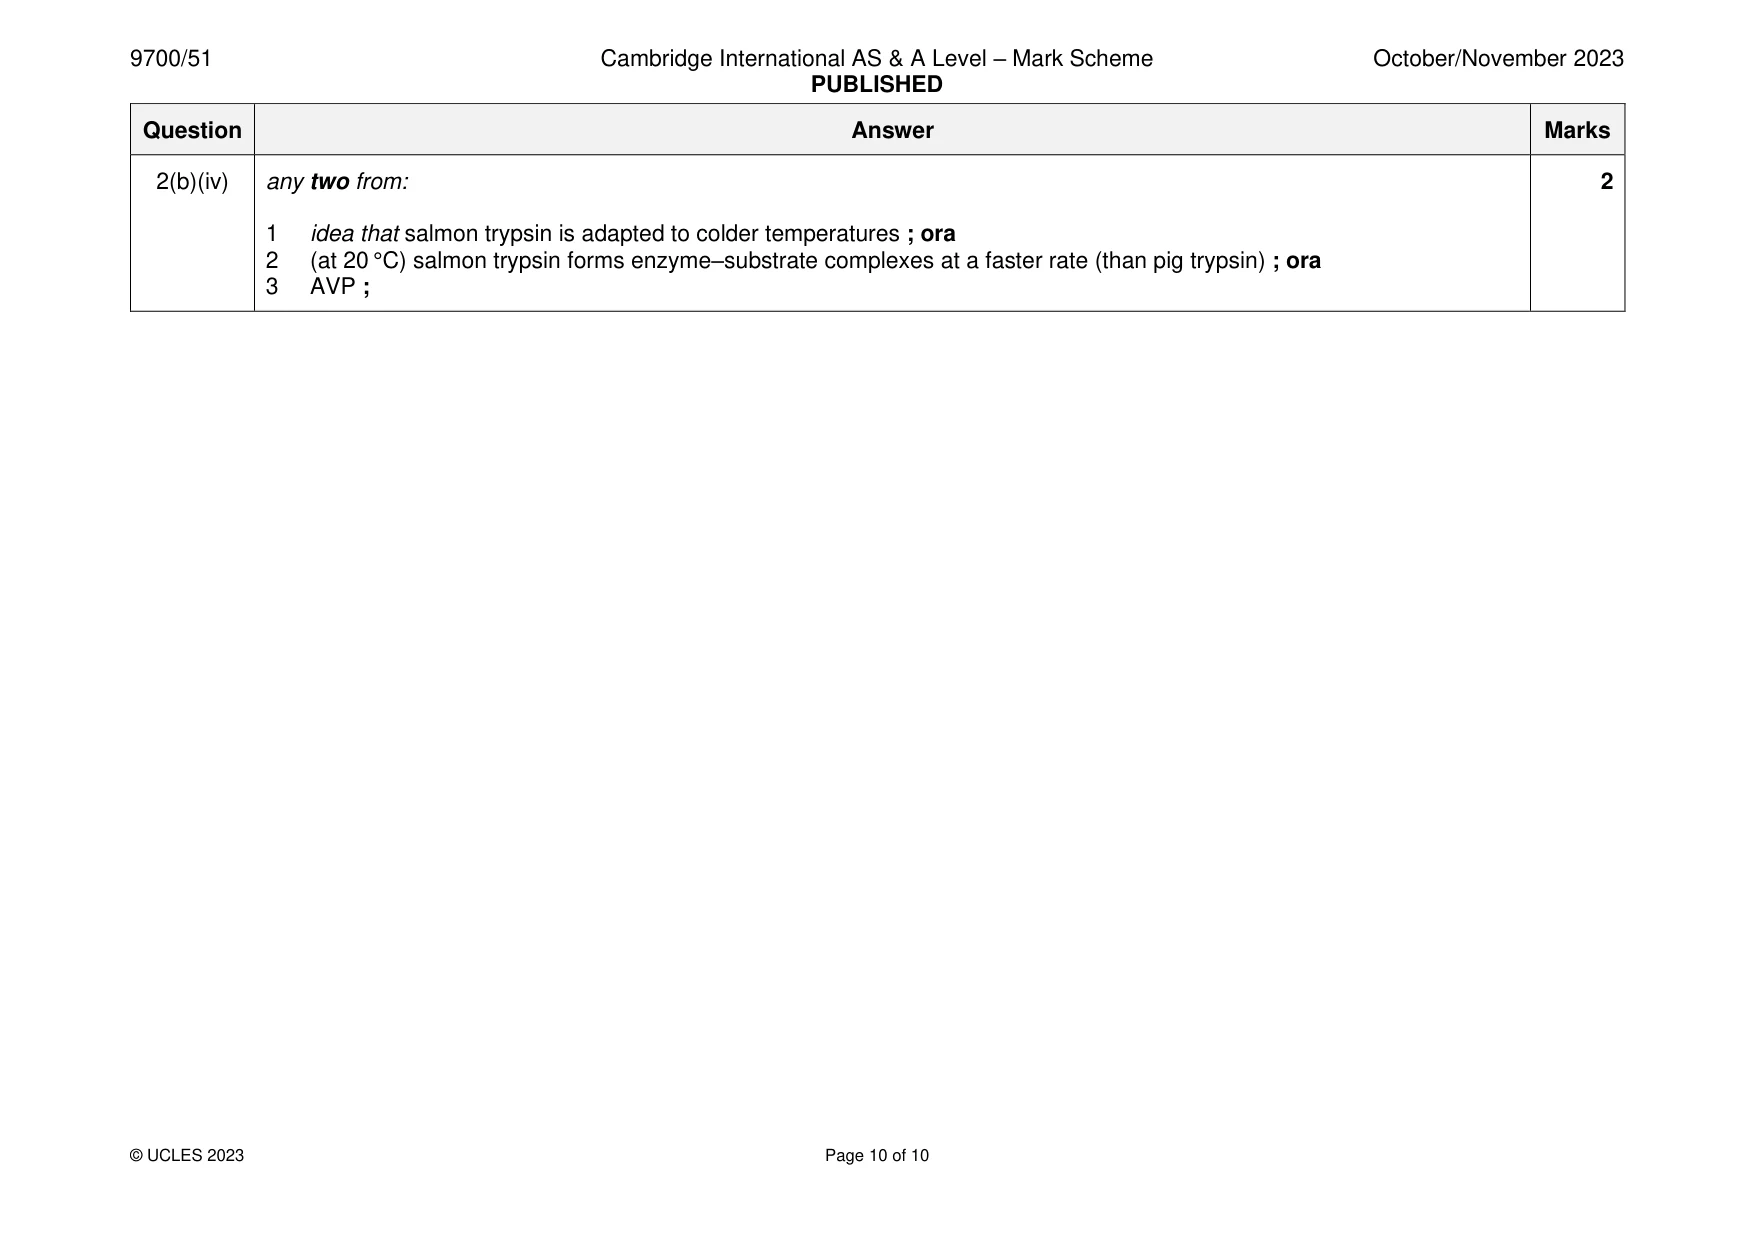
Mark scheme: 2(a)(i) independent variable: type / AW , of trypsin ; 2 dependent variable: time (taken to break down gelatine) ; 2(a)(ii) any one from: 1 1 pH (of solution) ; 2 surface area / mass / volume, of cube ; 3 concentration of, gelatine / collagen, in cube ; 2(b)(i) mean = 131.1 ; 1 2(b)(ii) s = 3.2 ; 1 2(b)(iii) any three from: 3 1 critical value (at degrees of freedom = 22 and p = 0.05) = 2.074 ; 2 calculated (t–) value / 2.663 is, greater than, critical (t–) value / 2.074 ; ora 3 null hypothesis is rejected ; 4 there is a significant difference (at p = 0.05) ; 2(b)(iv) any two from: 2 1 idea that salmon trypsin is adapted to colder temperatures ; ora 2 (at 20 °C) salmon trypsin forms enzyme–substrate complexes at a faster rate (than pig trypsin) ; ora 3 AVP ;
What was in this paper
The subtopics covered by these 2 questions, and how many questions each got. Open one in a new tab to see every Cambridge question on it.
What you needed in this session
Cambridge’s own grade thresholds for 2023 Oct/Nov, Paper 5 · Variant 1. A higher threshold means an easier paper — the bar moves with how the cohort did.