Cambridge A Level Biology 9700 — 2022 May/June Paper 5 · Variant 1
9700/51/M/J/22 · 2 questions · 30 marks · ≈34 min
The question paper and its mark scheme, free to read here and free to download. This is Cambridge’s own paper, exactly as it was sat.
Question paper16 pages




Mark scheme10 pages
Answers below. Sit the paper first if you are practising.
Questions as text
Q1 · A group of students investigated two habitats: dense woodland and open grassland
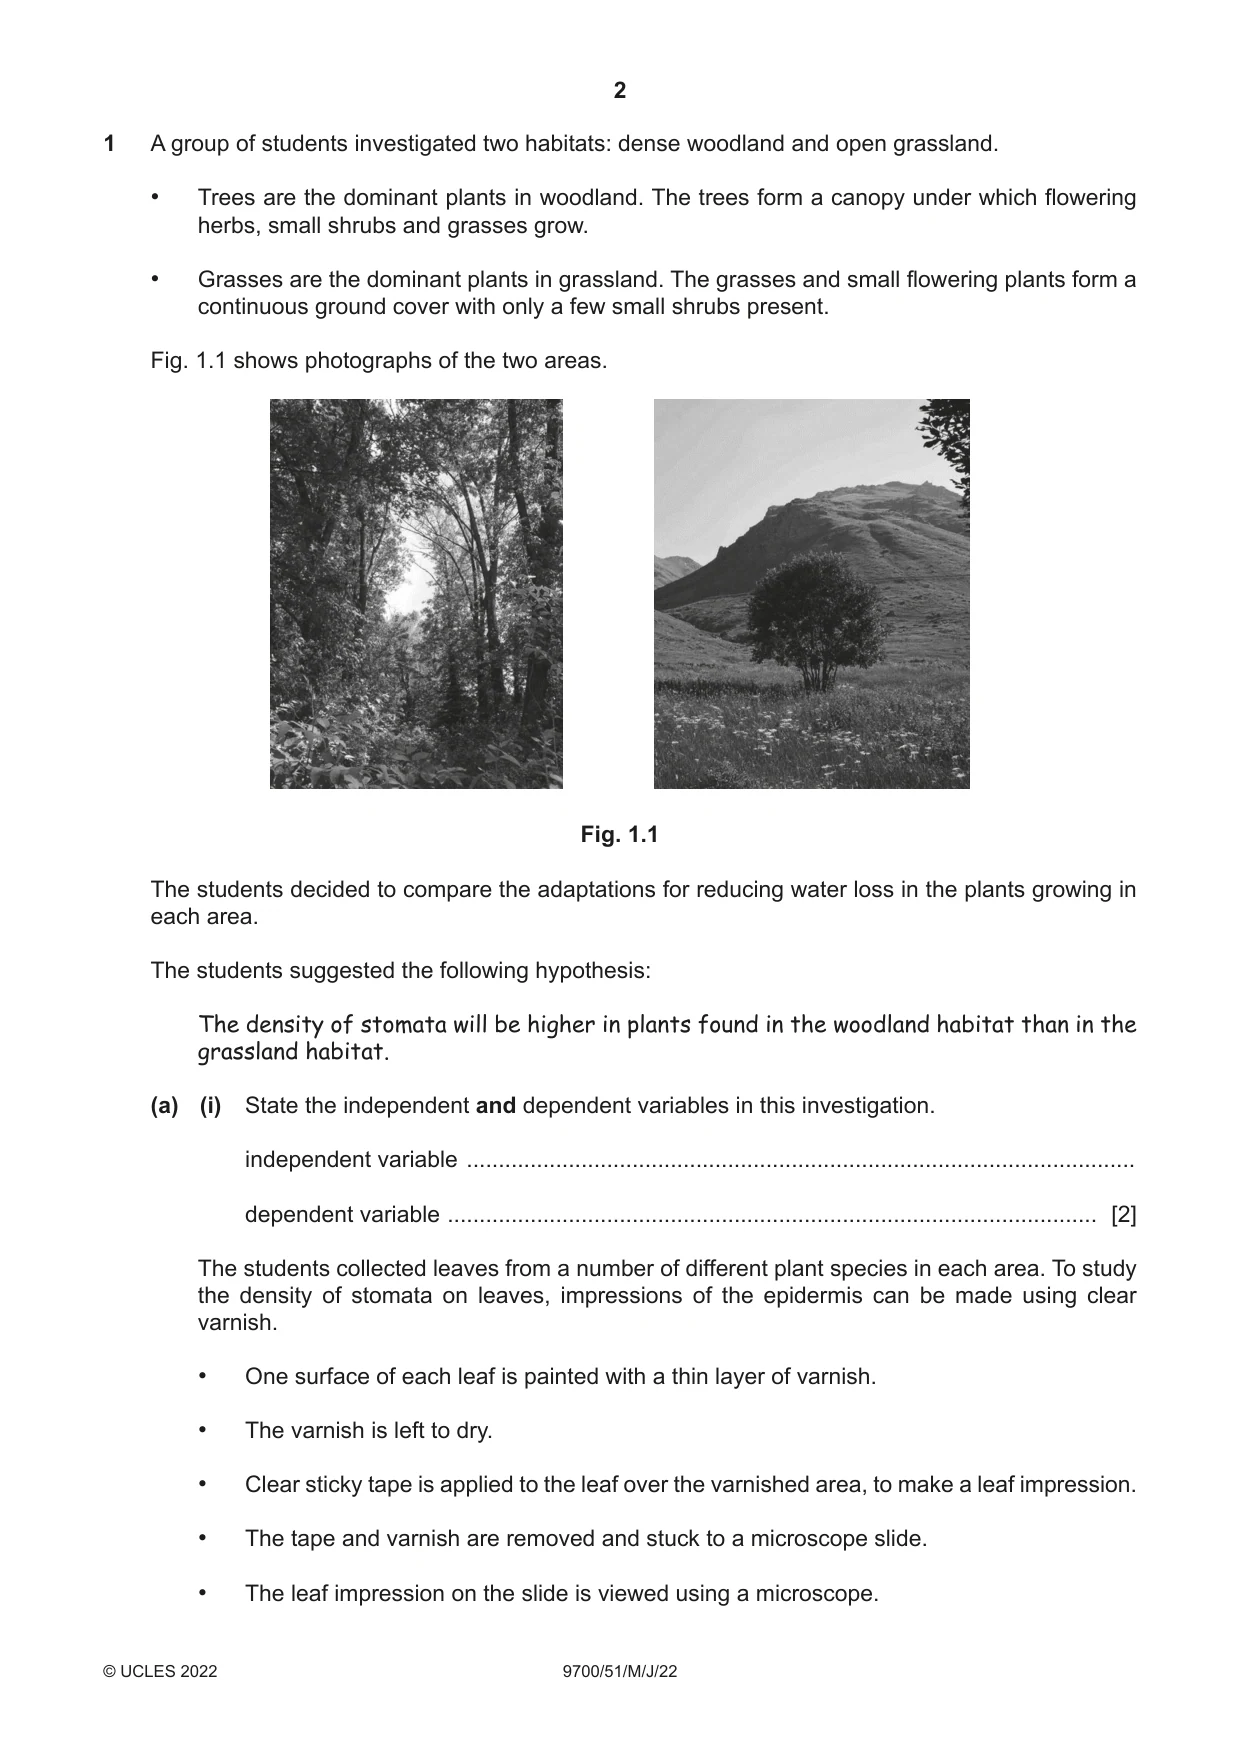
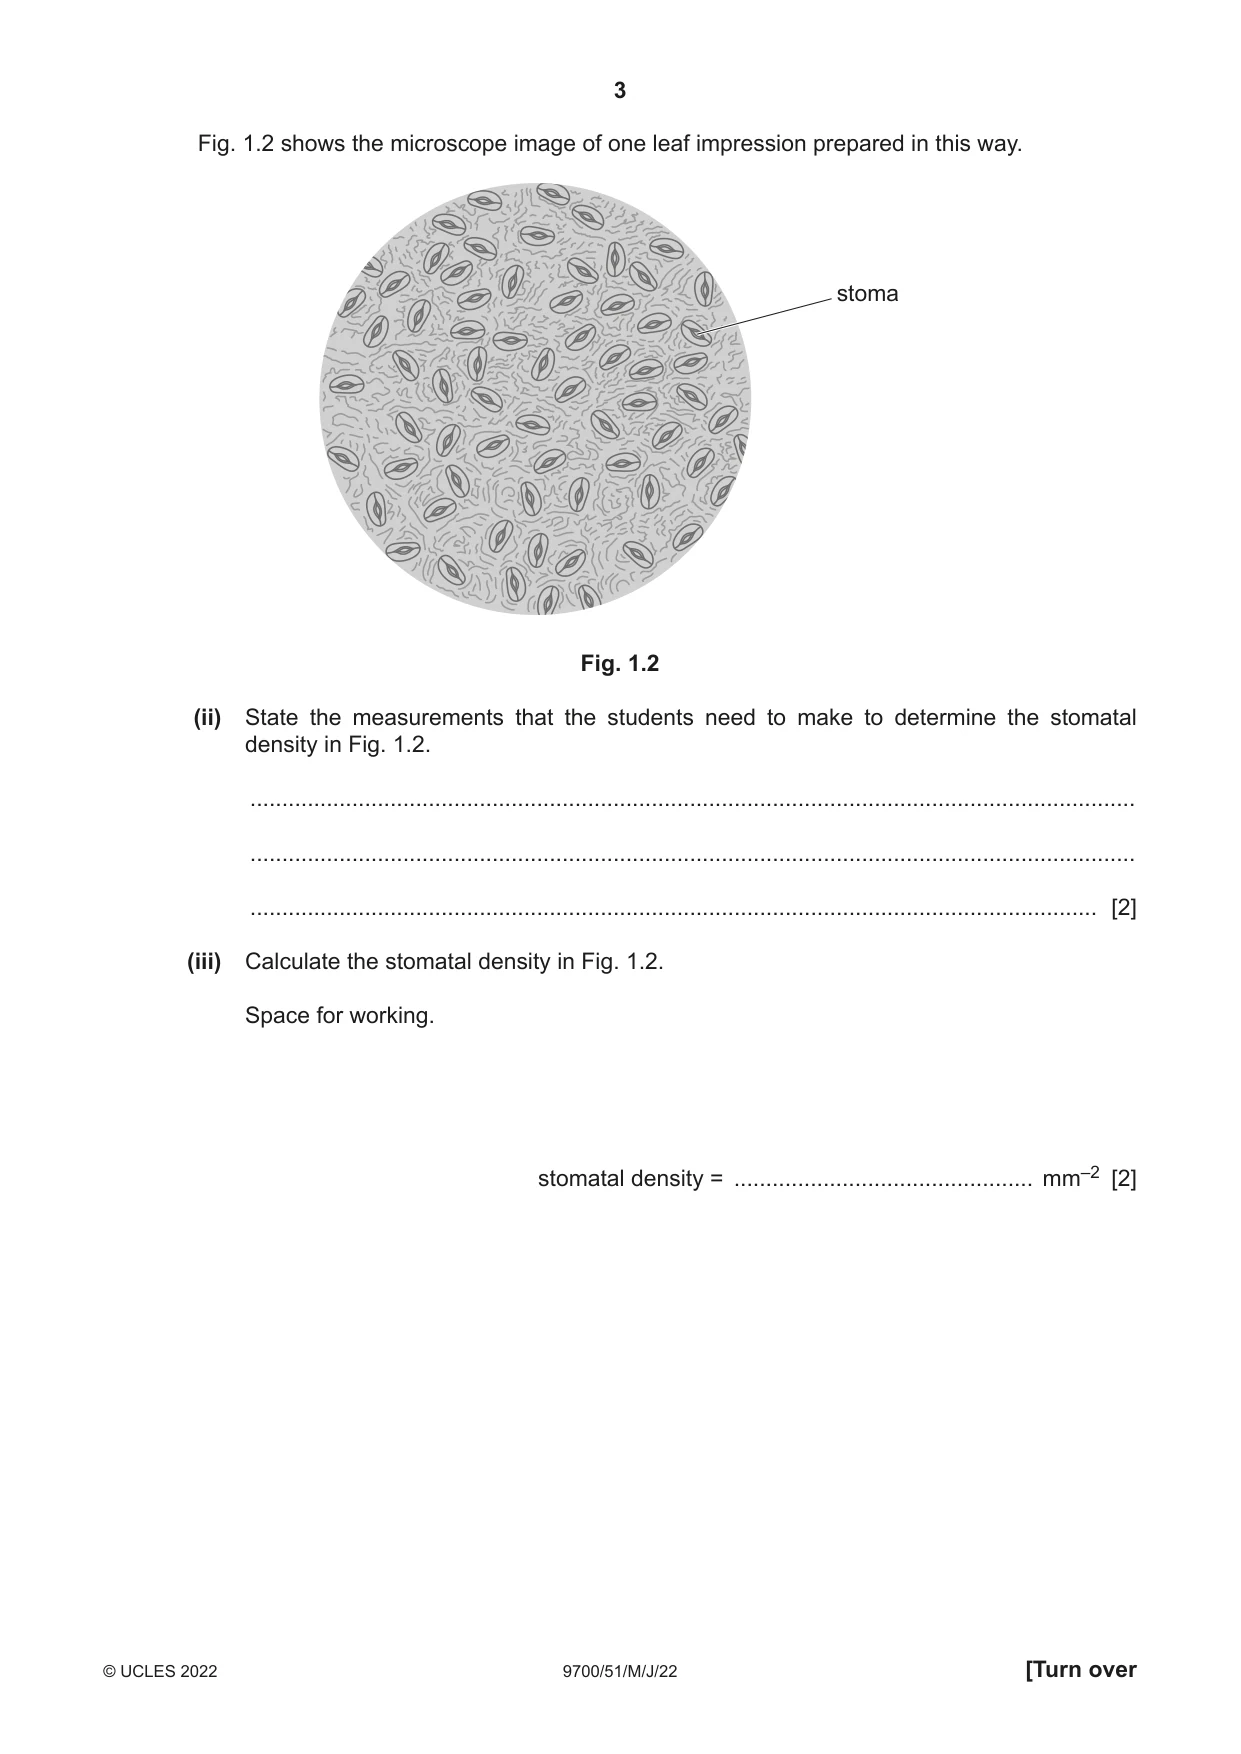
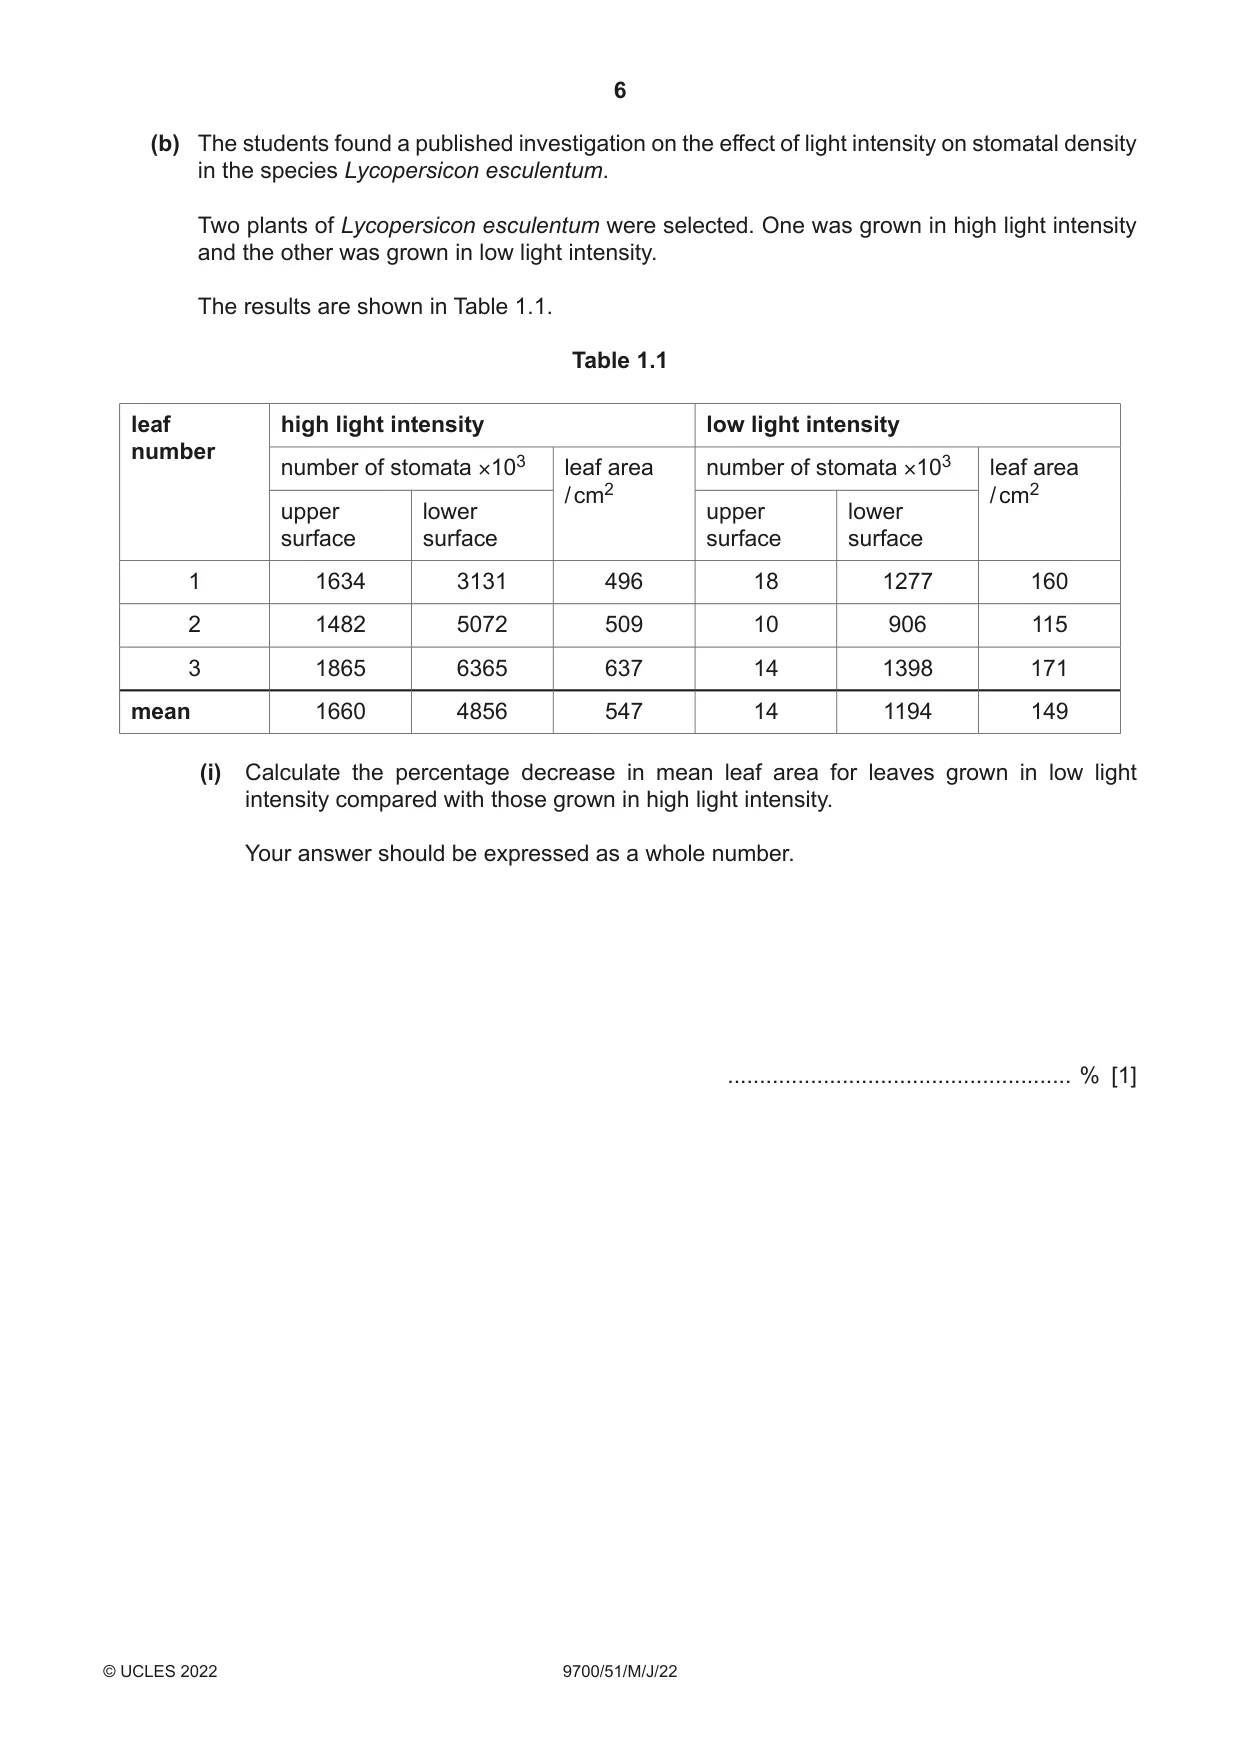
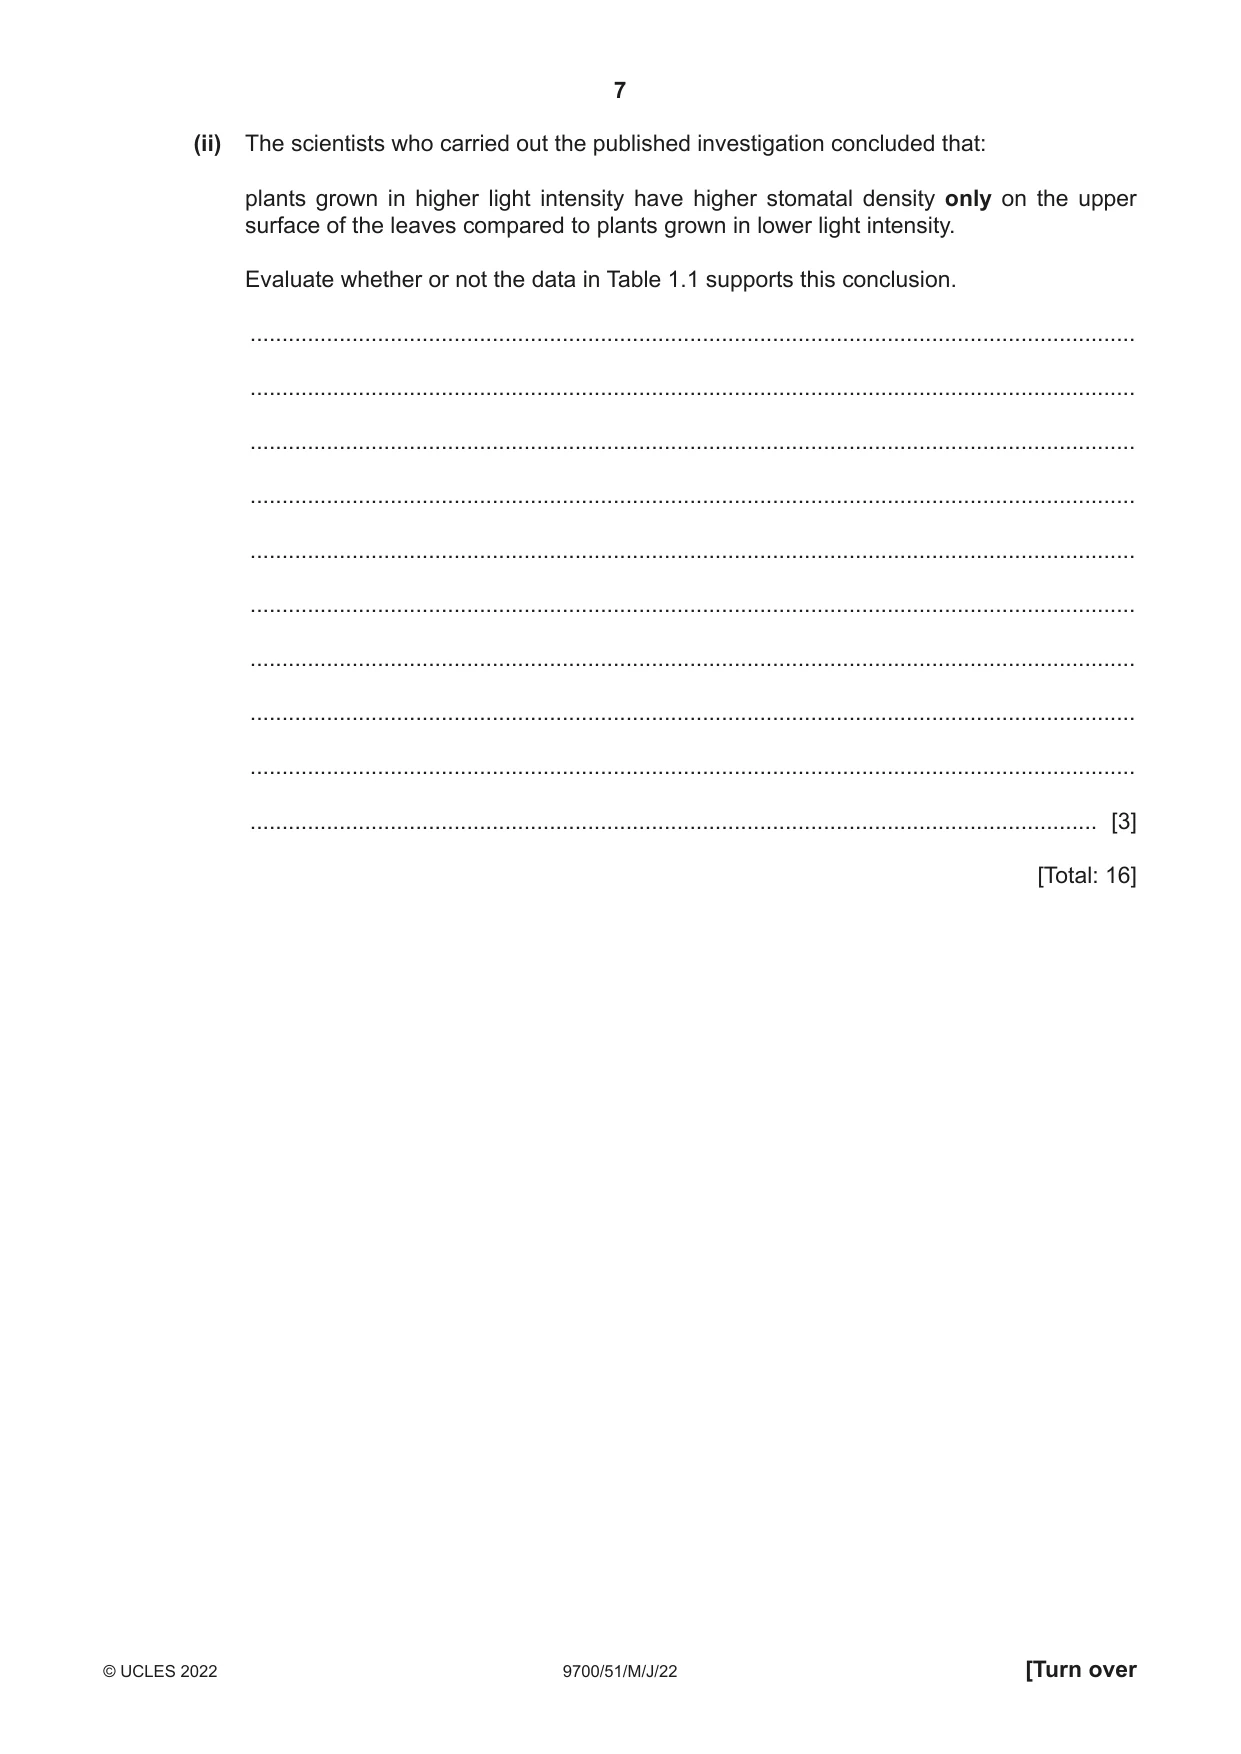
1 A group of students investigated two habitats: dense woodland and open grassland. • Trees are the dominant plants in woodland. The trees form a canopy under which flowering herbs, small shrubs and grasses grow. • Grasses are the dominant plants in grassland. The grasses and small flowering plants form a continuous ground cover with only a few small shrubs present. Fig. 1.1 shows photographs of the two areas. Fig. 1.1 The students decided to compare the adaptations for reducing water loss in the plants growing in each area. The students suggested the following hypothesis: The density of stomata will be higher in plants found in the woodland habitat than in the grassland habitat. (a) (i) State the independent and dependent variables in this investigation. independent variable ......................................................................................................... dependent variable ...................................................................................................... [2] The students collected leaves from a number of different plant species in each area. To study the density of stomata on leaves, impressions of the epidermis can be made using clear varnish. • One surface of each leaf is painted with a thin layer of varnish. • The varnish is left to dry. • Clear sticky tape is applied to the leaf over the varnished area, to make a leaf impression. • The tape and varnish are removed and stuck to a microscope slide. • The leaf impression on the slide is viewed using a microscope. Fig. 1.2 shows the microscope image of one leaf impression prepared in this way. stoma Fig. 1.2 (ii) State the measurements that the students need to make to determine the stomatal density in Fig. 1.2. ........................................................................................................................................... ........................................................................................................................................... ..................................................................................................................................... [2] (iii) Calculate the stomatal density in Fig. 1.2. Space for working. stomatal density = ............................................... mm–2 [2] (iv) Describe how the students could gather data to compare the stomatal density of plants growing in the woodland and the grassland habitat. Your method should be set out in a logical order and be detailed enough to allow another person to follow it. You should not repeat details of the method for making the leaf impressions. ........................................................................................................................................... ........................................................................................................................................... ........................................................................................................................................... ........................................................................................................................................... ........................................................................................................................................... ........................................................................................................................................... ........................................................................................................................................... ........................................................................................................................................... ........................................................................................................................................... ........................................................................................................................................... ........................................................................................................................................... ........................................................................................................................................... ........................................................................................................................................... ........................................................................................................................................... ........................................................................................................................................... ........................................................................................................................................... ........................................................................................................................................... ........................................................................................................................................... ........................................................................................................................................... ........................................................................................................................................... ........................................................................................................................................... ........................................................................................................................................... ........................................................................................................................................... ..................................................................................................................................... [6] Question 1 continues on page 6. (b) The students found a published investigation on the effect of light intensity on stomatal density in the species Lycopersicon esculentum. Two plants of Lycopersicon esculentum were selected. One was grown in high light intensity and the other was grown in low light intensity. The results are shown in Table 1.1. Table 1.1 leaf high light intensity low light intensity number number of stomata ×103 leaf area number of stomata ×103 leaf area / cm2 / cm2 upper lower upper lower surface surface surface surface 1 1634 3131 496 18 1277 160 2 1482 5072 509 10 906 115 3 1865 6365 637 14 1398 171 mean 1660 4856 547 14 1194 149 (i) Calculate the percentage decrease in mean leaf area for leaves grown in low light intensity compared with those grown in high light intensity. Your answer should be expressed as a whole number. ...................................................... % [1] (ii) The scientists who carried out the published investigation concluded that: plants grown in higher light intensity have higher stomatal density only on the upper surface of the leaves compared to plants grown in lower light intensity. Evaluate whether or not the data in Table 1.1 supports this conclusion. ........................................................................................................................................... ........................................................................................................................................... ........................................................................................................................................... ........................................................................................................................................... ........................................................................................................................................... ........................................................................................................................................... ........................................................................................................................................... ........................................................................................................................................... ........................................................................................................................................... ..................................................................................................................................... [3] [Total: 16]
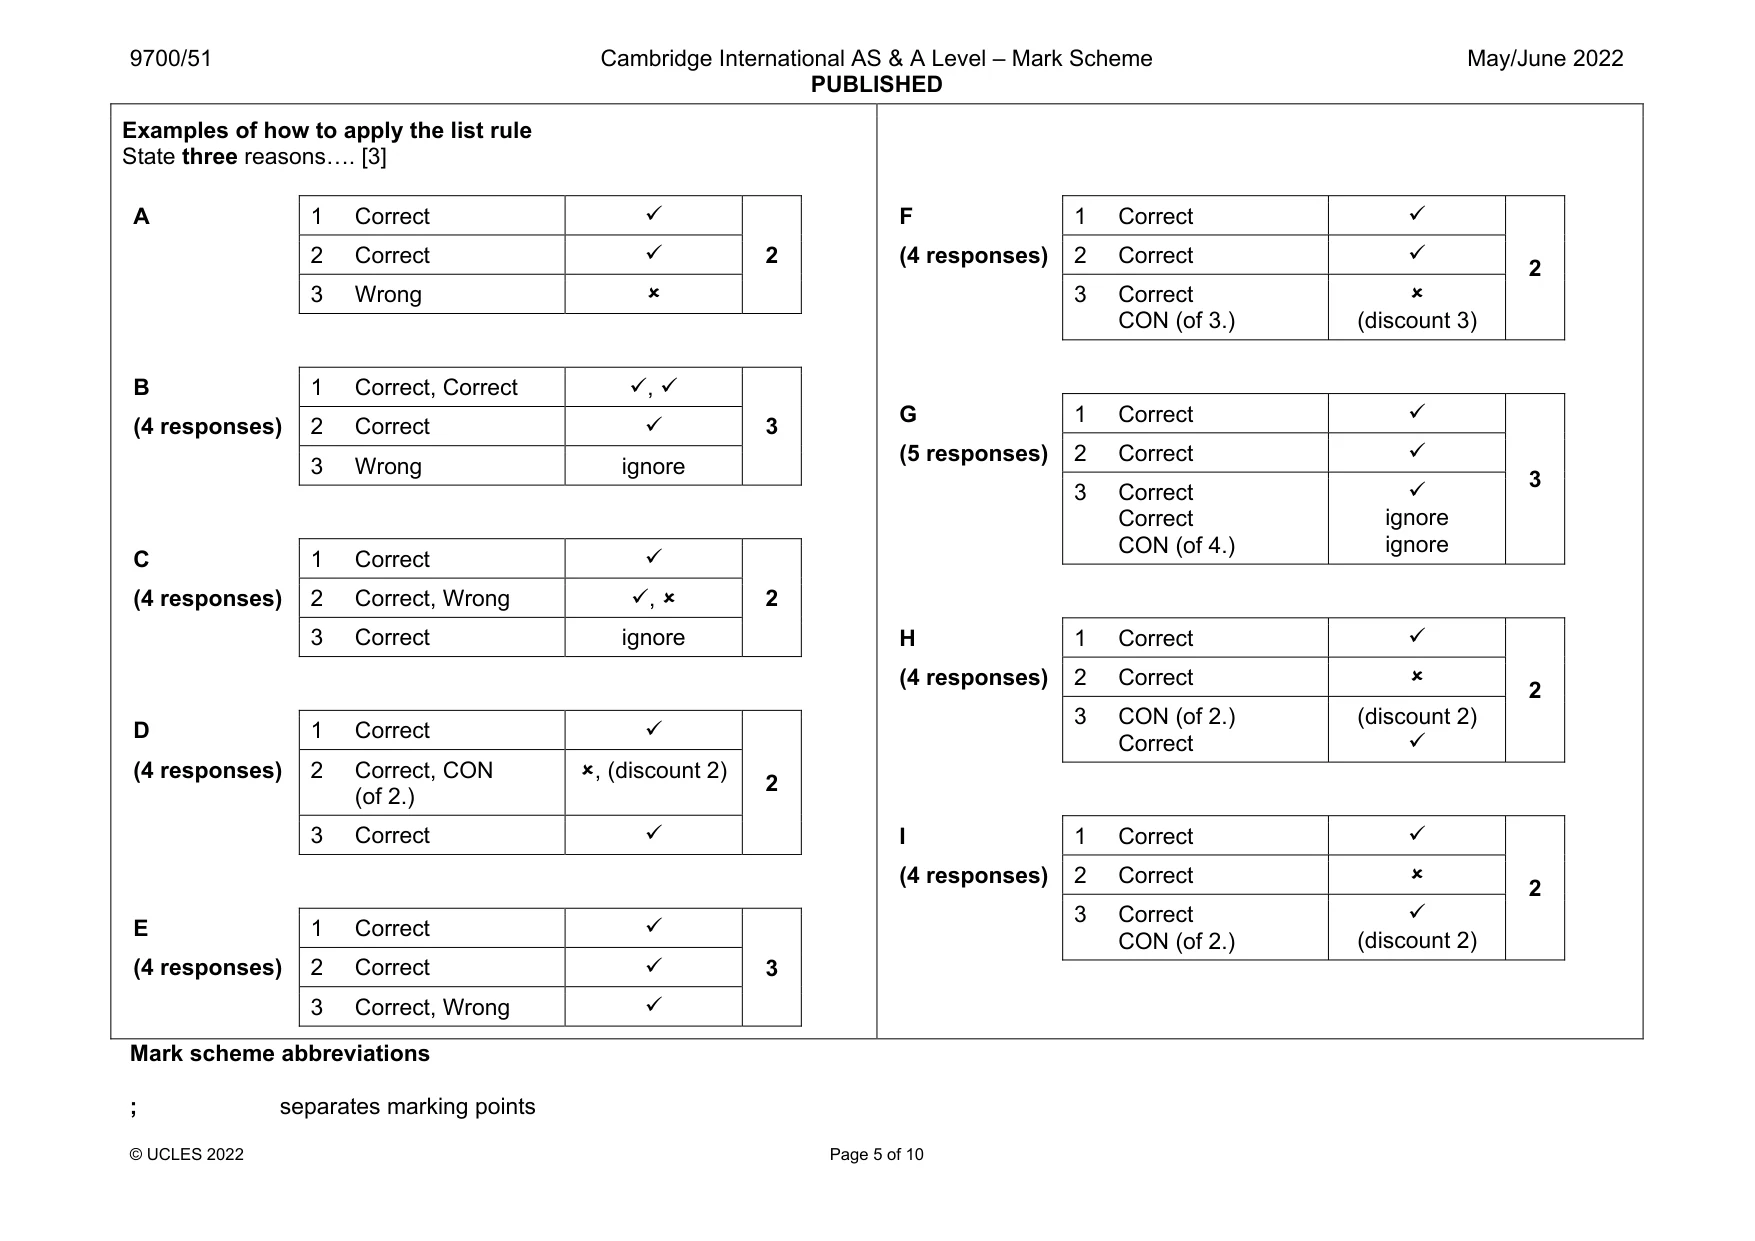
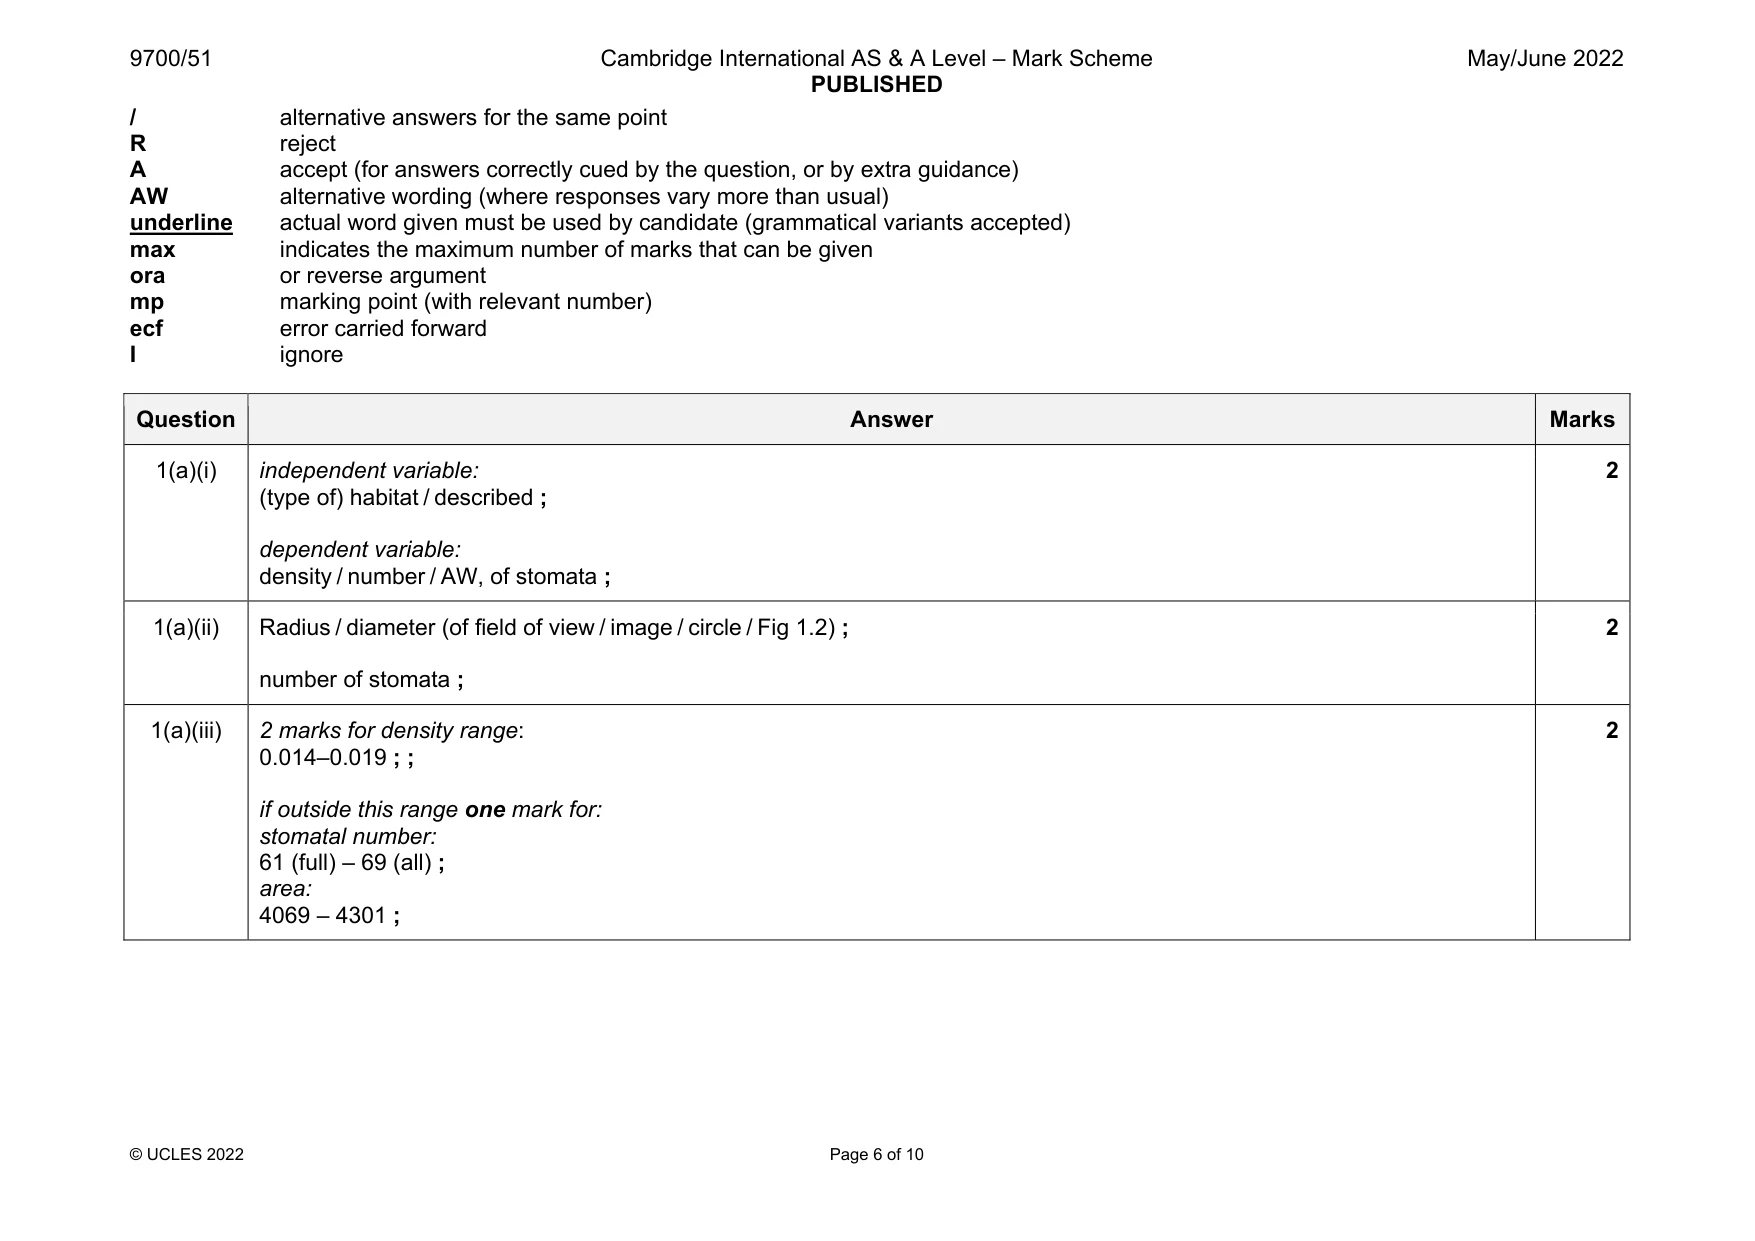
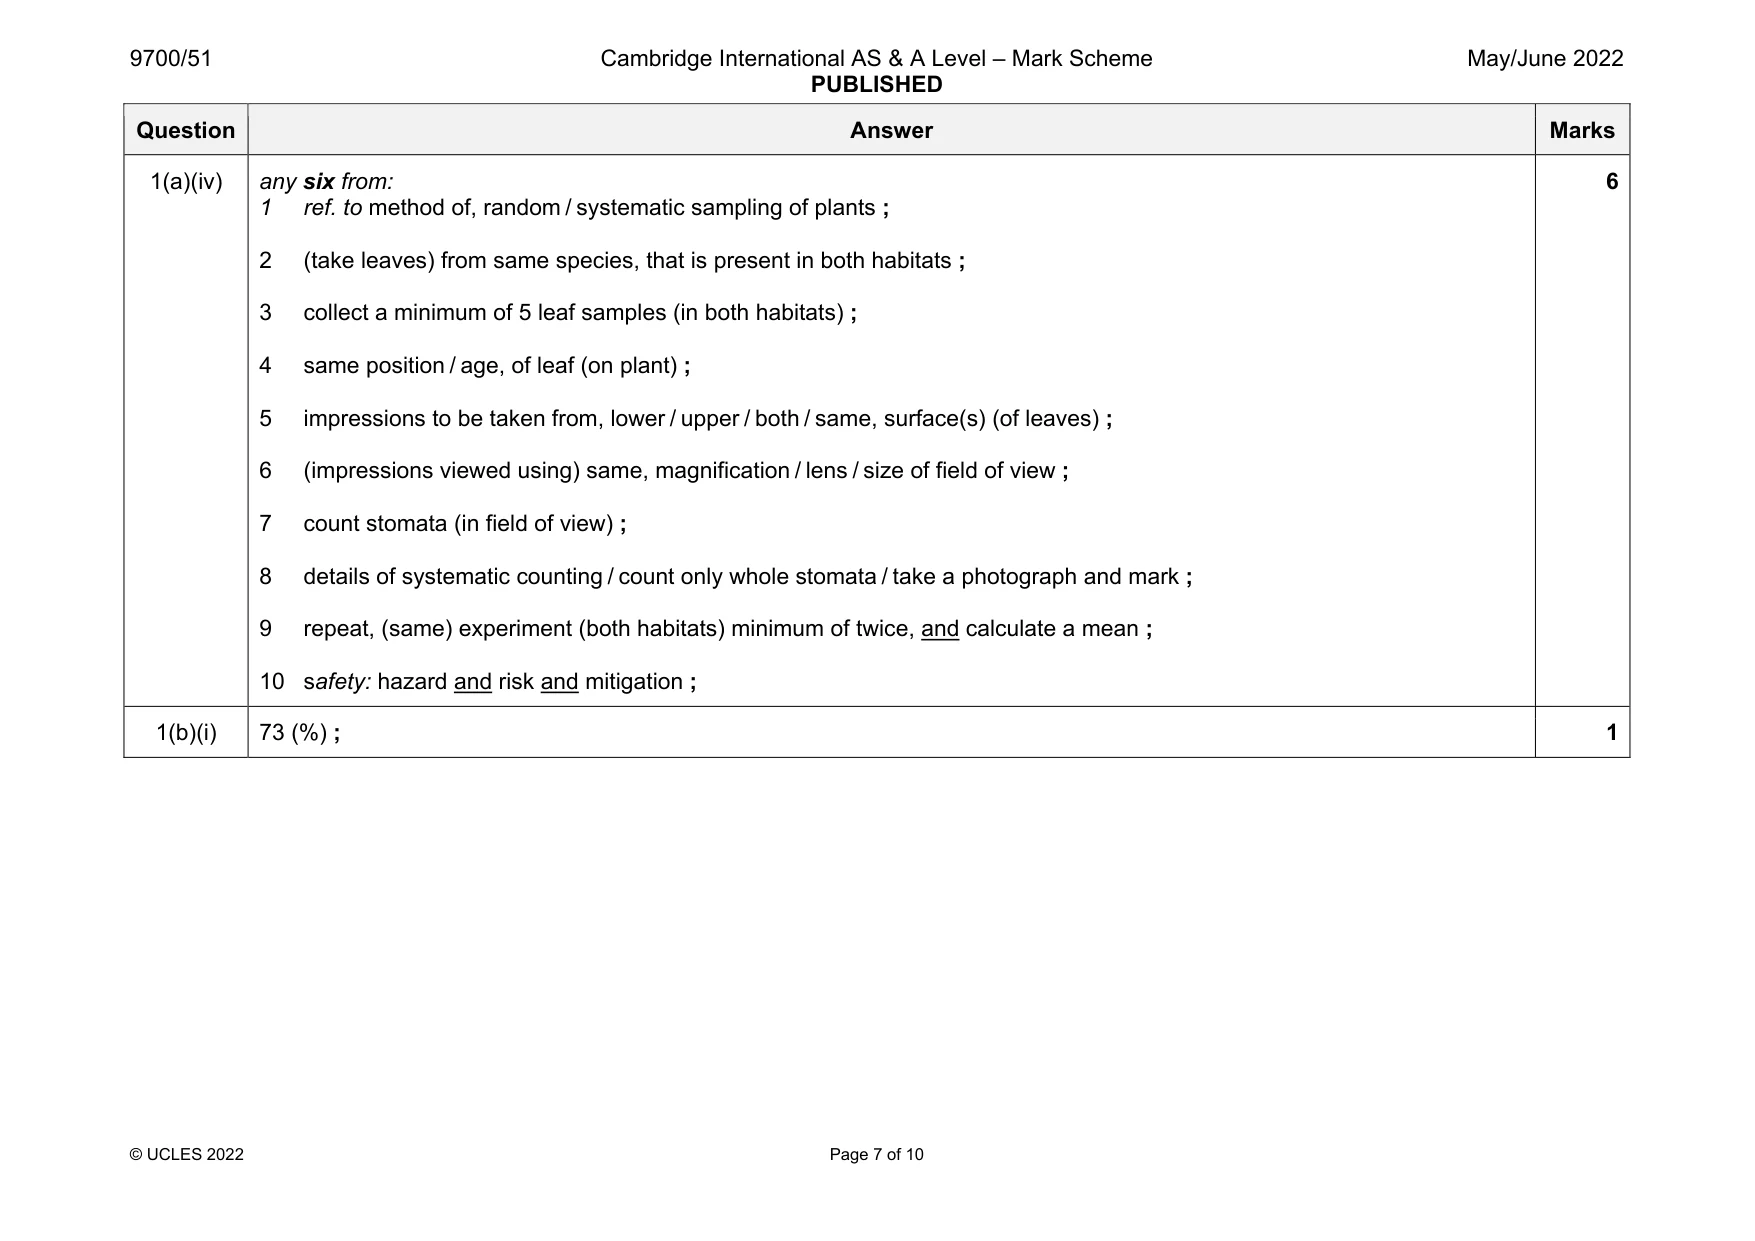
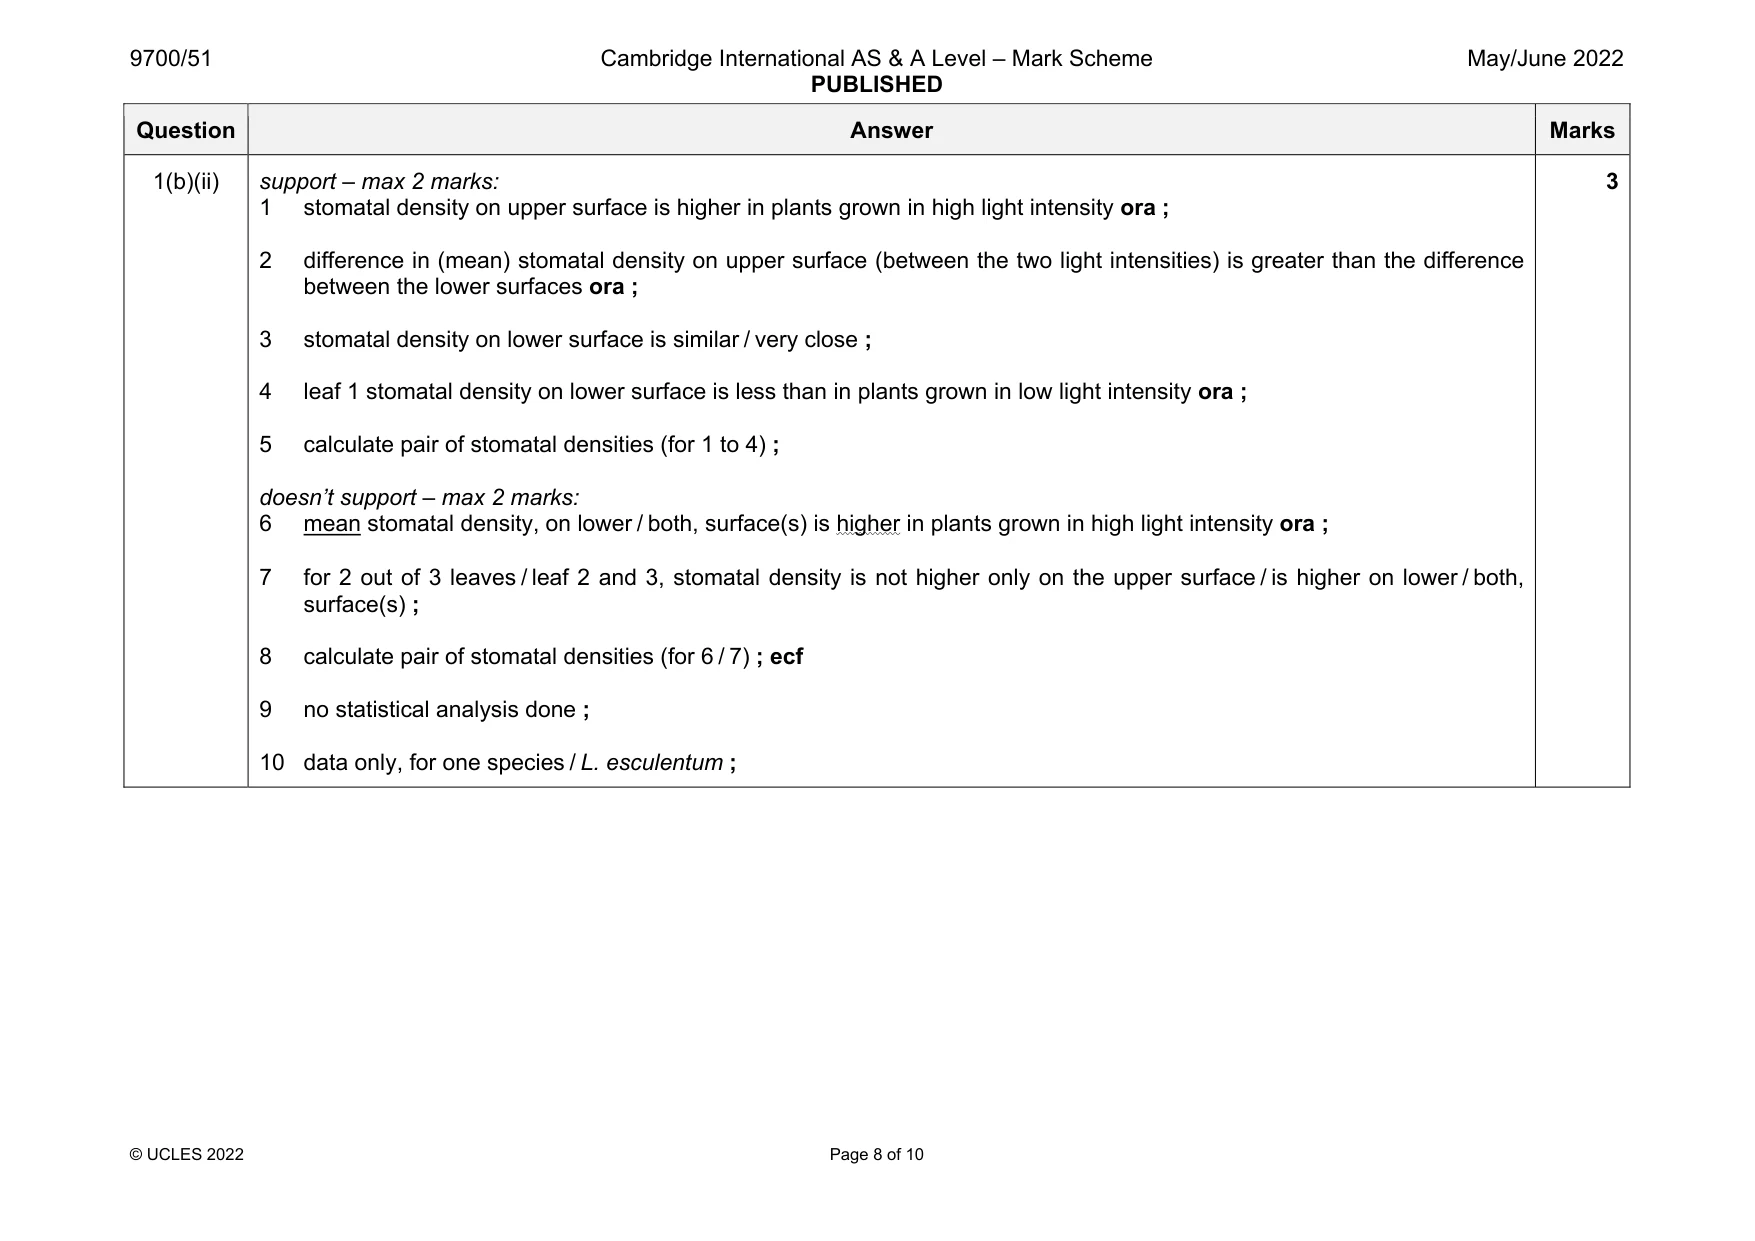
Mark scheme: 1(a)(i) independent variable: (type of) habitat / described ; dependent variable: density / number / AW, of stomata ; 2 1(a)(ii) Radius / diameter (of field of view / image / circle / Fig 1.2) ; number of stomata ; 2 1(a)(iii) 2 marks for density range: 0.014–0.019 ; ; if outside this range one mark for: stomatal number: 61 (full) – 69 (all) ; area: 4069 – 4301 ; 2 Question Answer Marks 1(a)(iv) any six from: 1 ref. to method of, random / systematic sampling of plants ; 2 (take leaves) from same species, that is present in both habitats ; 3 collect a minimum of 5 leaf samples (in both habitats) ; 4 same position / age, of leaf (on plant) ; 5 impressions to be taken from, lower / upper / both / same, surface(s) (of leaves) ; 6 (impressions viewed using) same, magnification / lens / size of field of view ; 7 count stomata (in field of view) ; 8 details of systematic counting / count only whole stomata / take a photograph and mark ; 9 repeat, (same) experiment (both habitats) minimum of twice, and calculate a mean ; 10 safety: hazard and risk and mitigation ; 6 1(b)(i) 73 (%) ; 1 Question Answer Marks 1(b)(ii) support – max 2 marks: 1 stomatal density on upper surface is higher in plants grown in high light intensity ora ; 2 difference in (mean) stomatal density on upper surface (between the two light intensities) is greater than the difference between the lower surfaces ora ; 3 stomatal density on lower surface is similar / very close ; 4 leaf 1 stomatal density on lower surface is less than in plants grown in low light intensity ora ; 5 calculate pair of stomatal densities (for 1 to 4) ; doesn’t support – max 2 marks: 6 mean stomatal density, on lower / both, surface(s) is higher in plants grown in high light intensity ora ; 7 for 2 out of 3 leaves / leaf 2 and 3, stomatal density is not higher only on the upper surface / is higher on lower / both, surface(s) ; 8 calculate pair of stomatal densities (for 6 / 7) ; ecf 9 no statistical analysis done ; 10 data only, for one species / L. esculentum ; 3
Q2 · Human immunodeficiency virus (HIV) is an example of a virus that spreads from other…
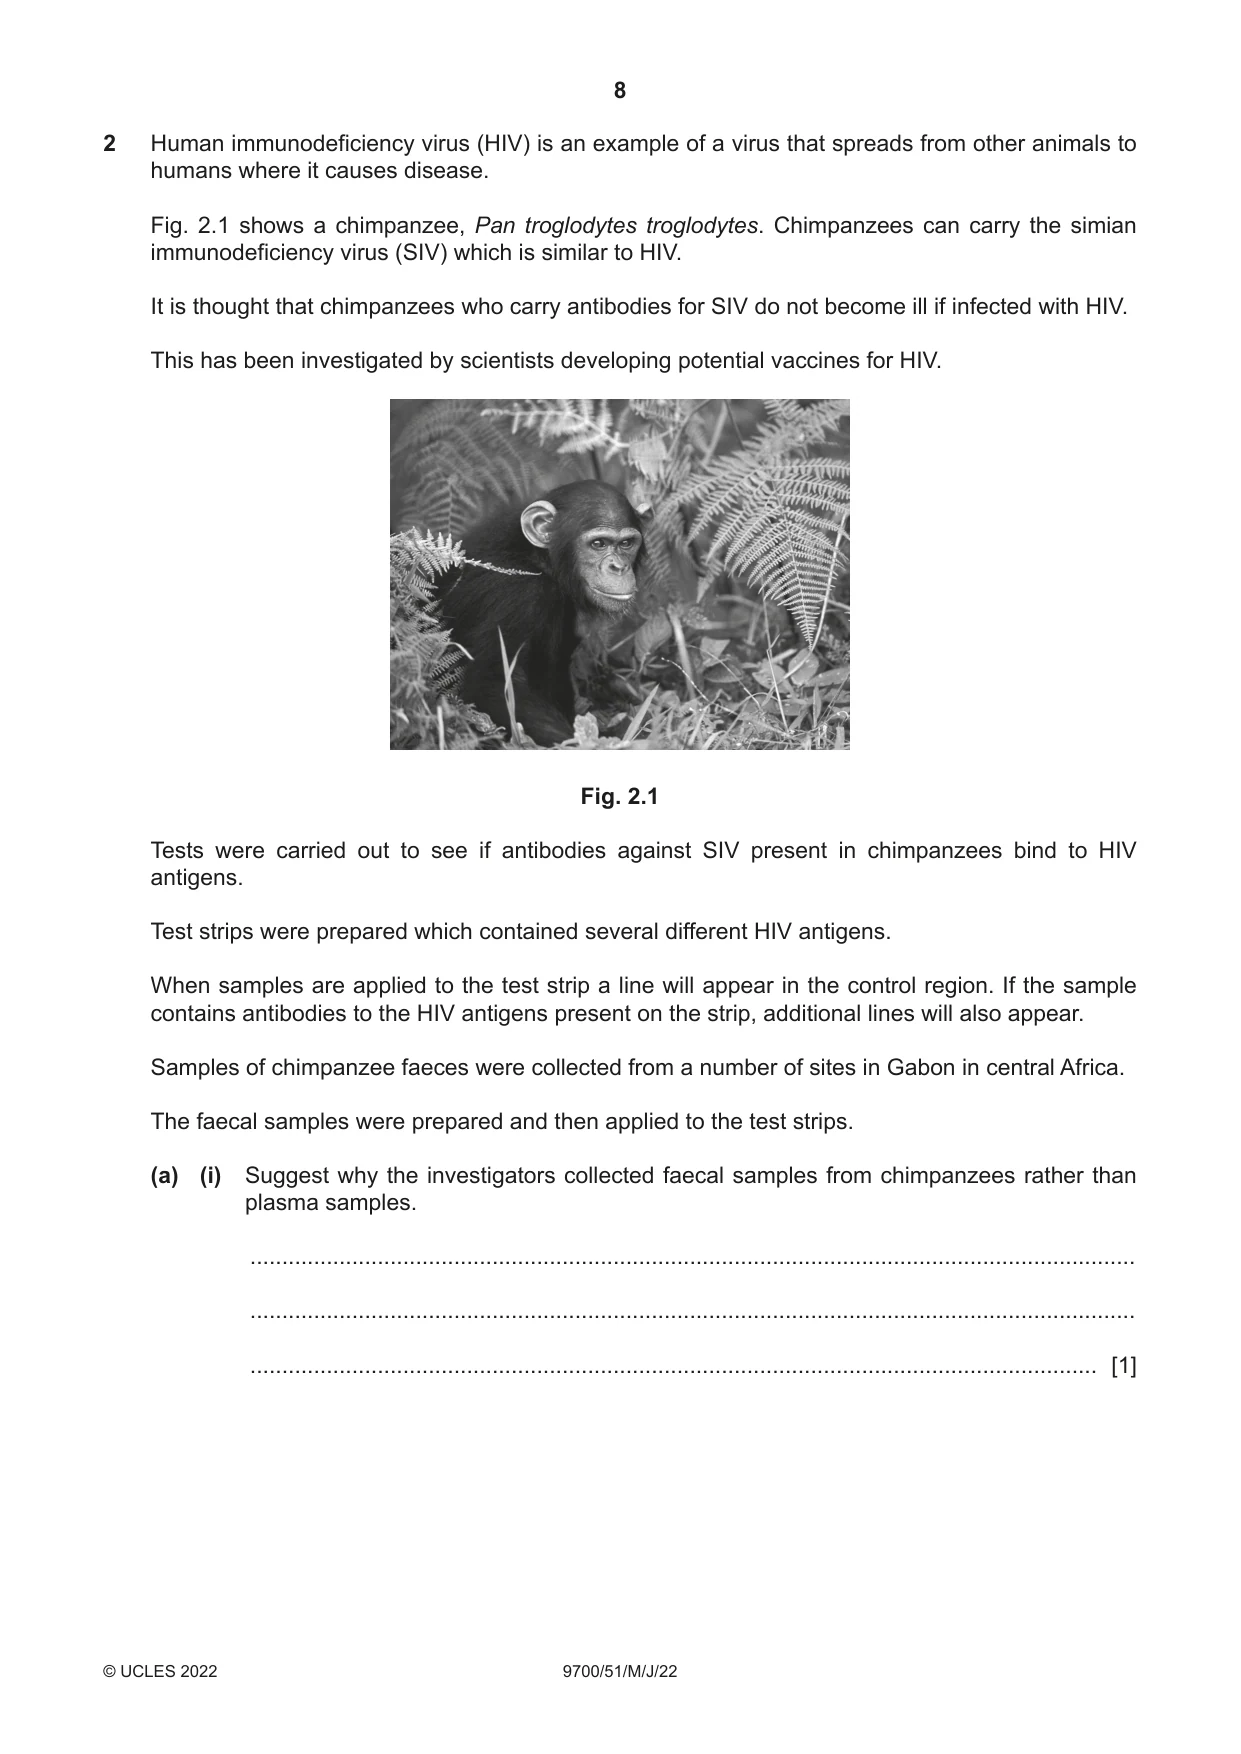
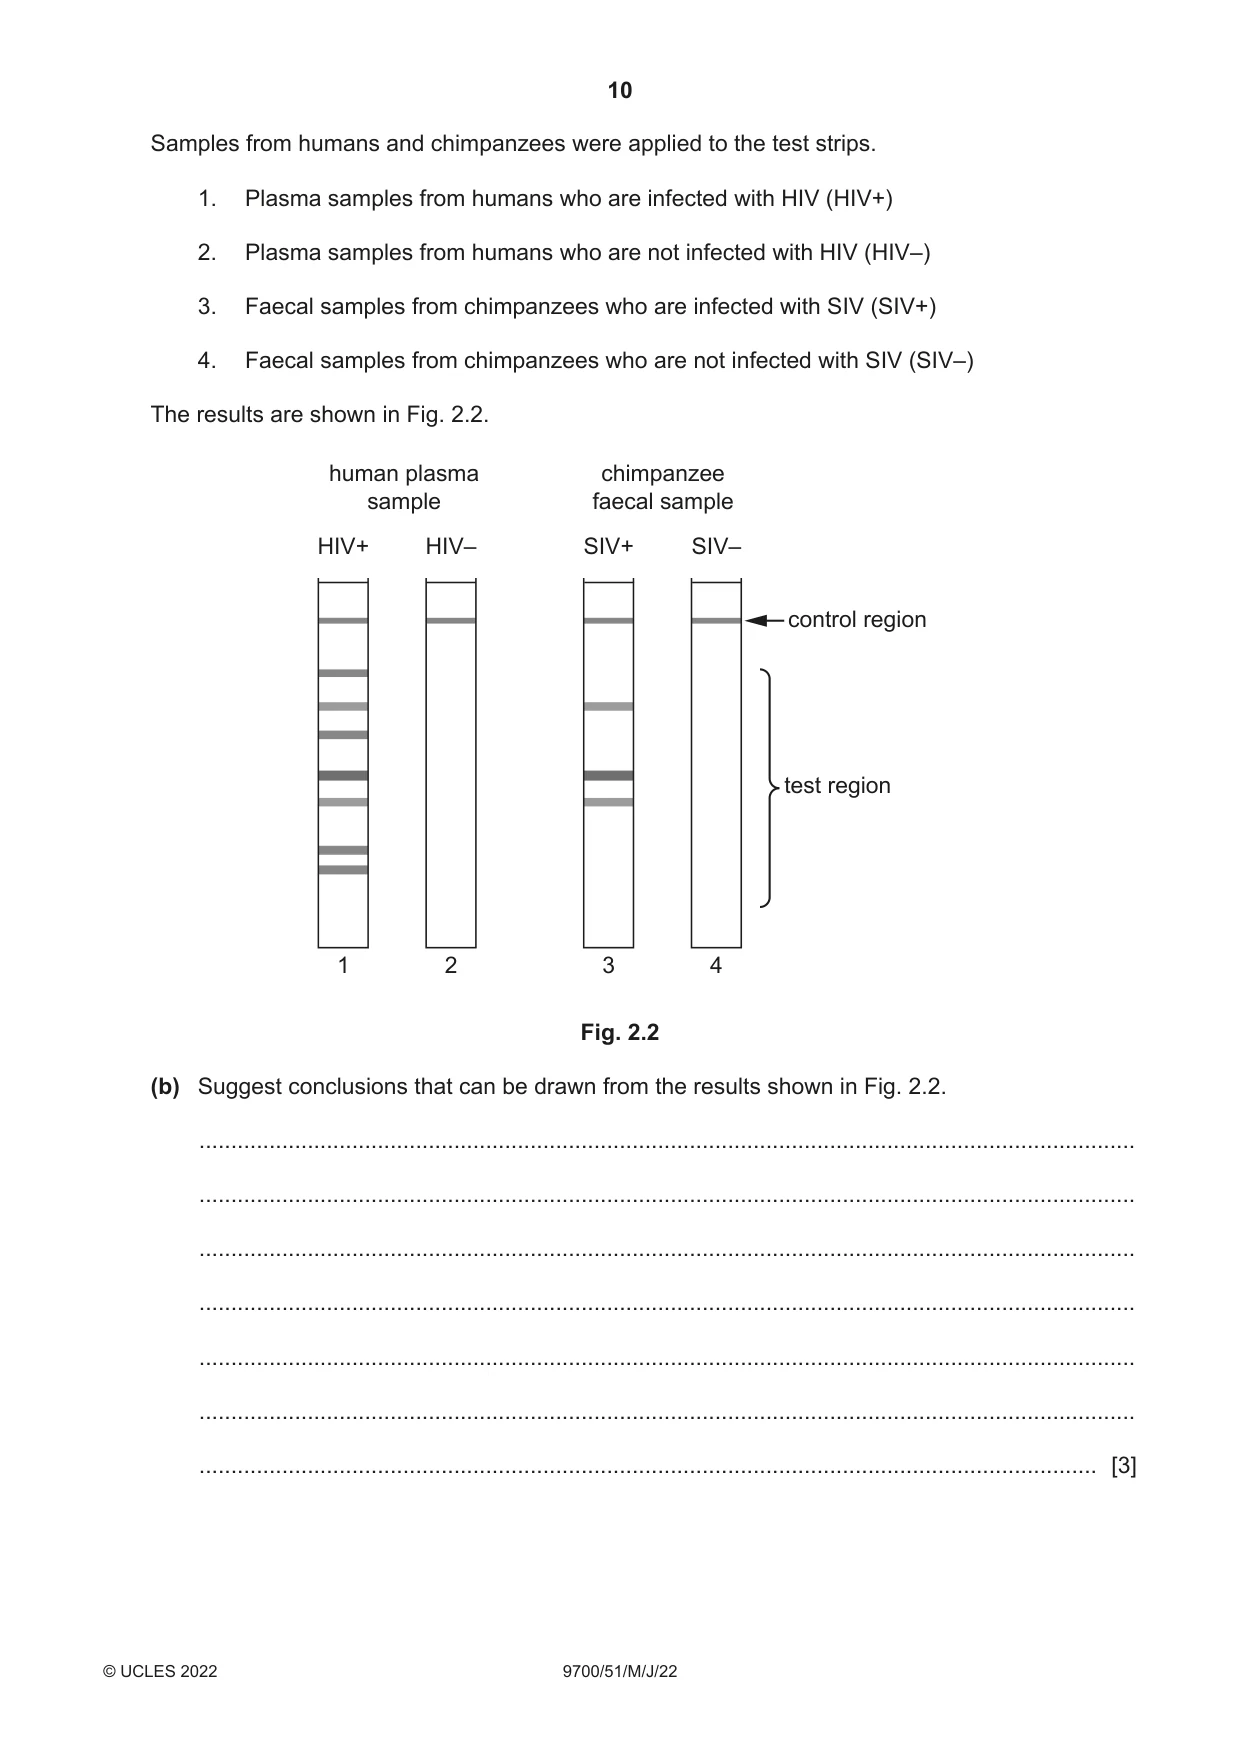
2 Human immunodeficiency virus (HIV) is an example of a virus that spreads from other animals to humans where it causes disease. Fig. 2.1 shows a chimpanzee, Pan troglodytes troglodytes. Chimpanzees can carry the simian immunodeficiency virus (SIV) which is similar to HIV. It is thought that chimpanzees who carry antibodies for SIV do not become ill if infected with HIV. This has been investigated by scientists developing potential vaccines for HIV. Fig. 2.1 Tests were carried out to see if antibodies against SIV present in chimpanzees bind to HIV antigens. Test strips were prepared which contained several different HIV antigens. When samples are applied to the test strip a line will appear in the control region. If the sample contains antibodies to the HIV antigens present on the strip, additional lines will also appear. Samples of chimpanzee faeces were collected from a number of sites in Gabon in central Africa. The faecal samples were prepared and then applied to the test strips. (a) (i) Suggest why the investigators collected faecal samples from chimpanzees rather than plasma samples. ........................................................................................................................................... ........................................................................................................................................... ..................................................................................................................................... [1] (ii) Suggest a method for preparing the faecal samples before applying them to the test strips. ........................................................................................................................................... ........................................................................................................................................... ........................................................................................................................................... ........................................................................................................................................... ..................................................................................................................................... [2] (iii) The scientists collected 608 faecal samples from 224 individual chimpanzees. Suggest a laboratory method that could be used to identify whether two faecal samples belong to the same individual or not. ........................................................................................................................................... ........................................................................................................................................... ..................................................................................................................................... [1] Samples from humans and chimpanzees were applied to the test strips. 1. Plasma samples from humans who are infected with HIV (HIV+) 2. Plasma samples from humans who are not infected with HIV (HIV–) 3. Faecal samples from chimpanzees who are infected with SIV (SIV+) 4. Faecal samples from chimpanzees who are not infected with SIV (SIV–) The results are shown in Fig. 2.2. human plasma chimpanzee sample faecal sample HIV+ HIV– SIV+ SIV– control region test region 1 2 3 4 Fig. 2.2 (b) Suggest conclusions that can be drawn from the results shown in Fig. 2.2. ................................................................................................................................................... ................................................................................................................................................... ................................................................................................................................................... ................................................................................................................................................... ................................................................................................................................................... ................................................................................................................................................... ............................................................................................................................................. [3]
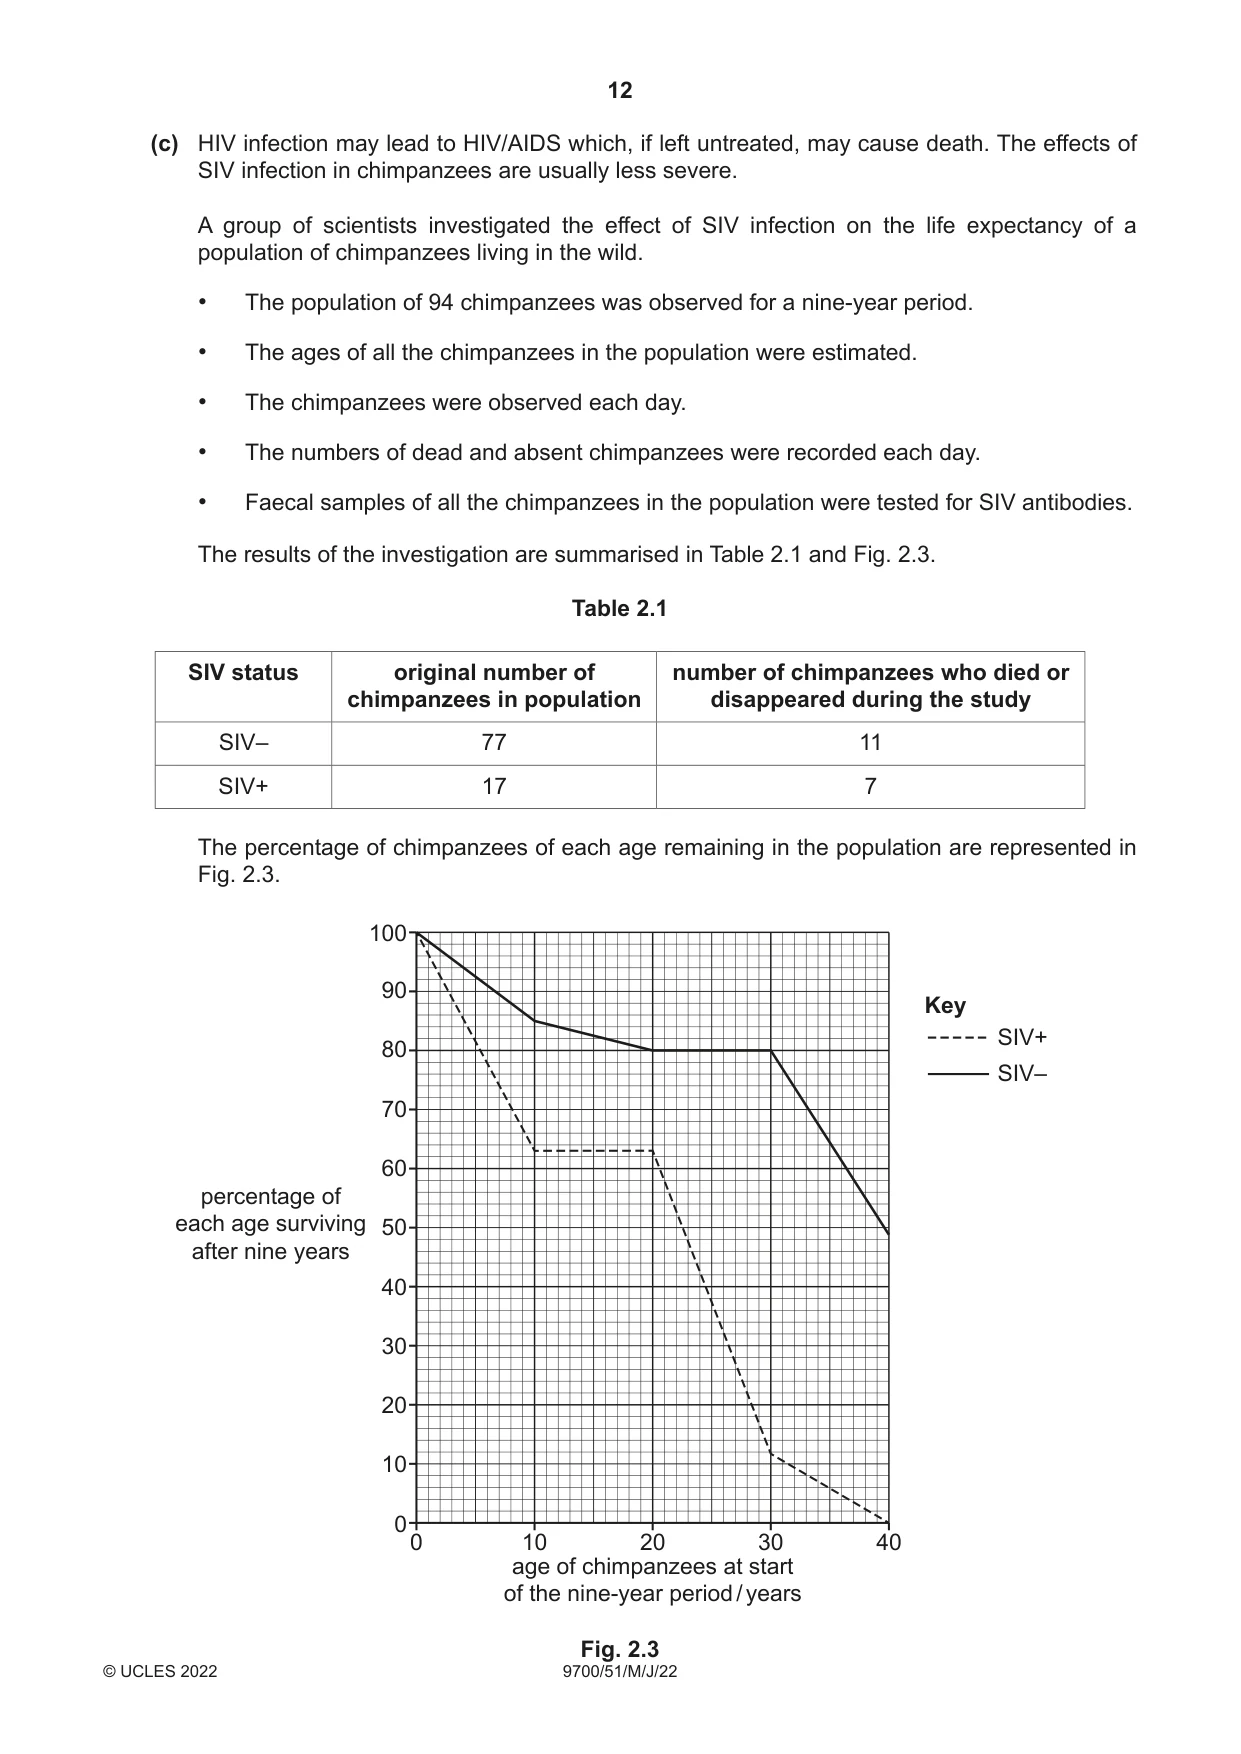
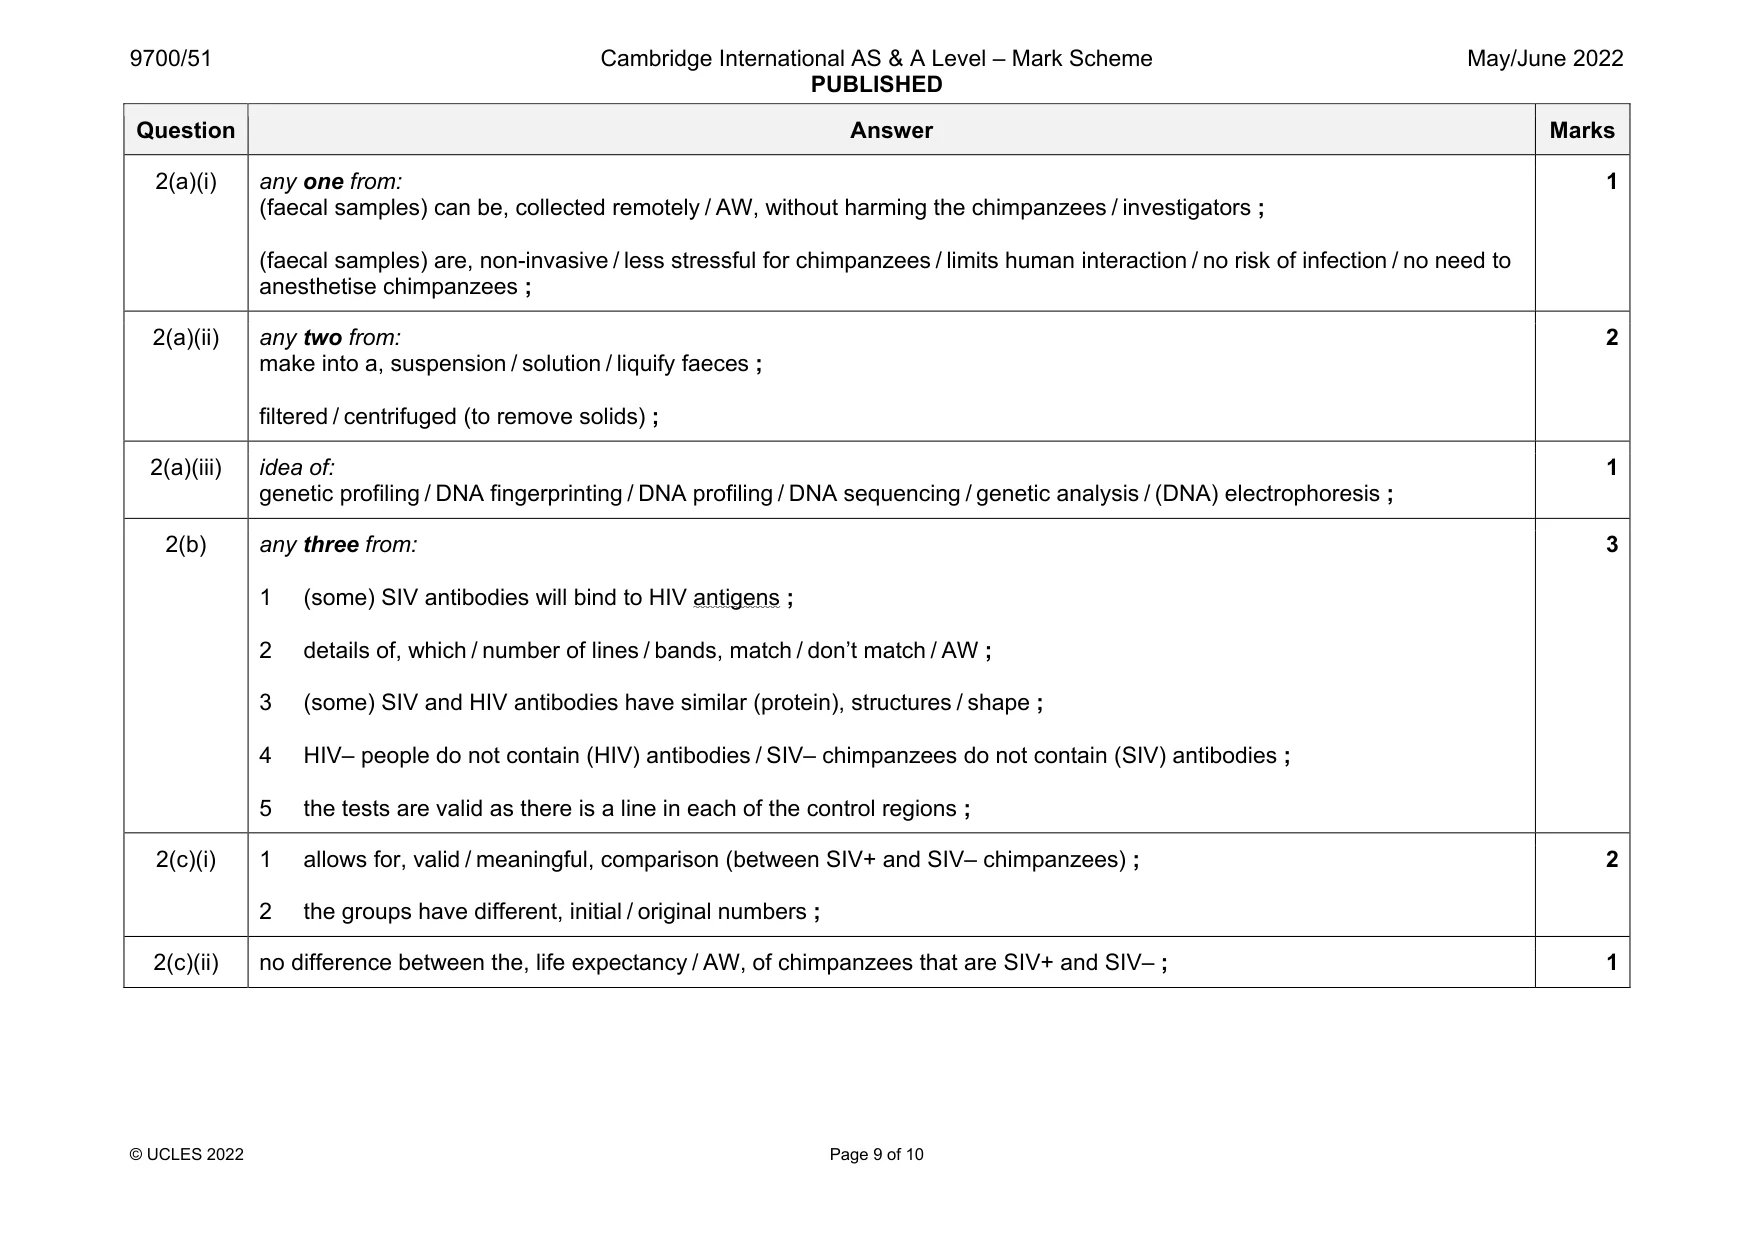
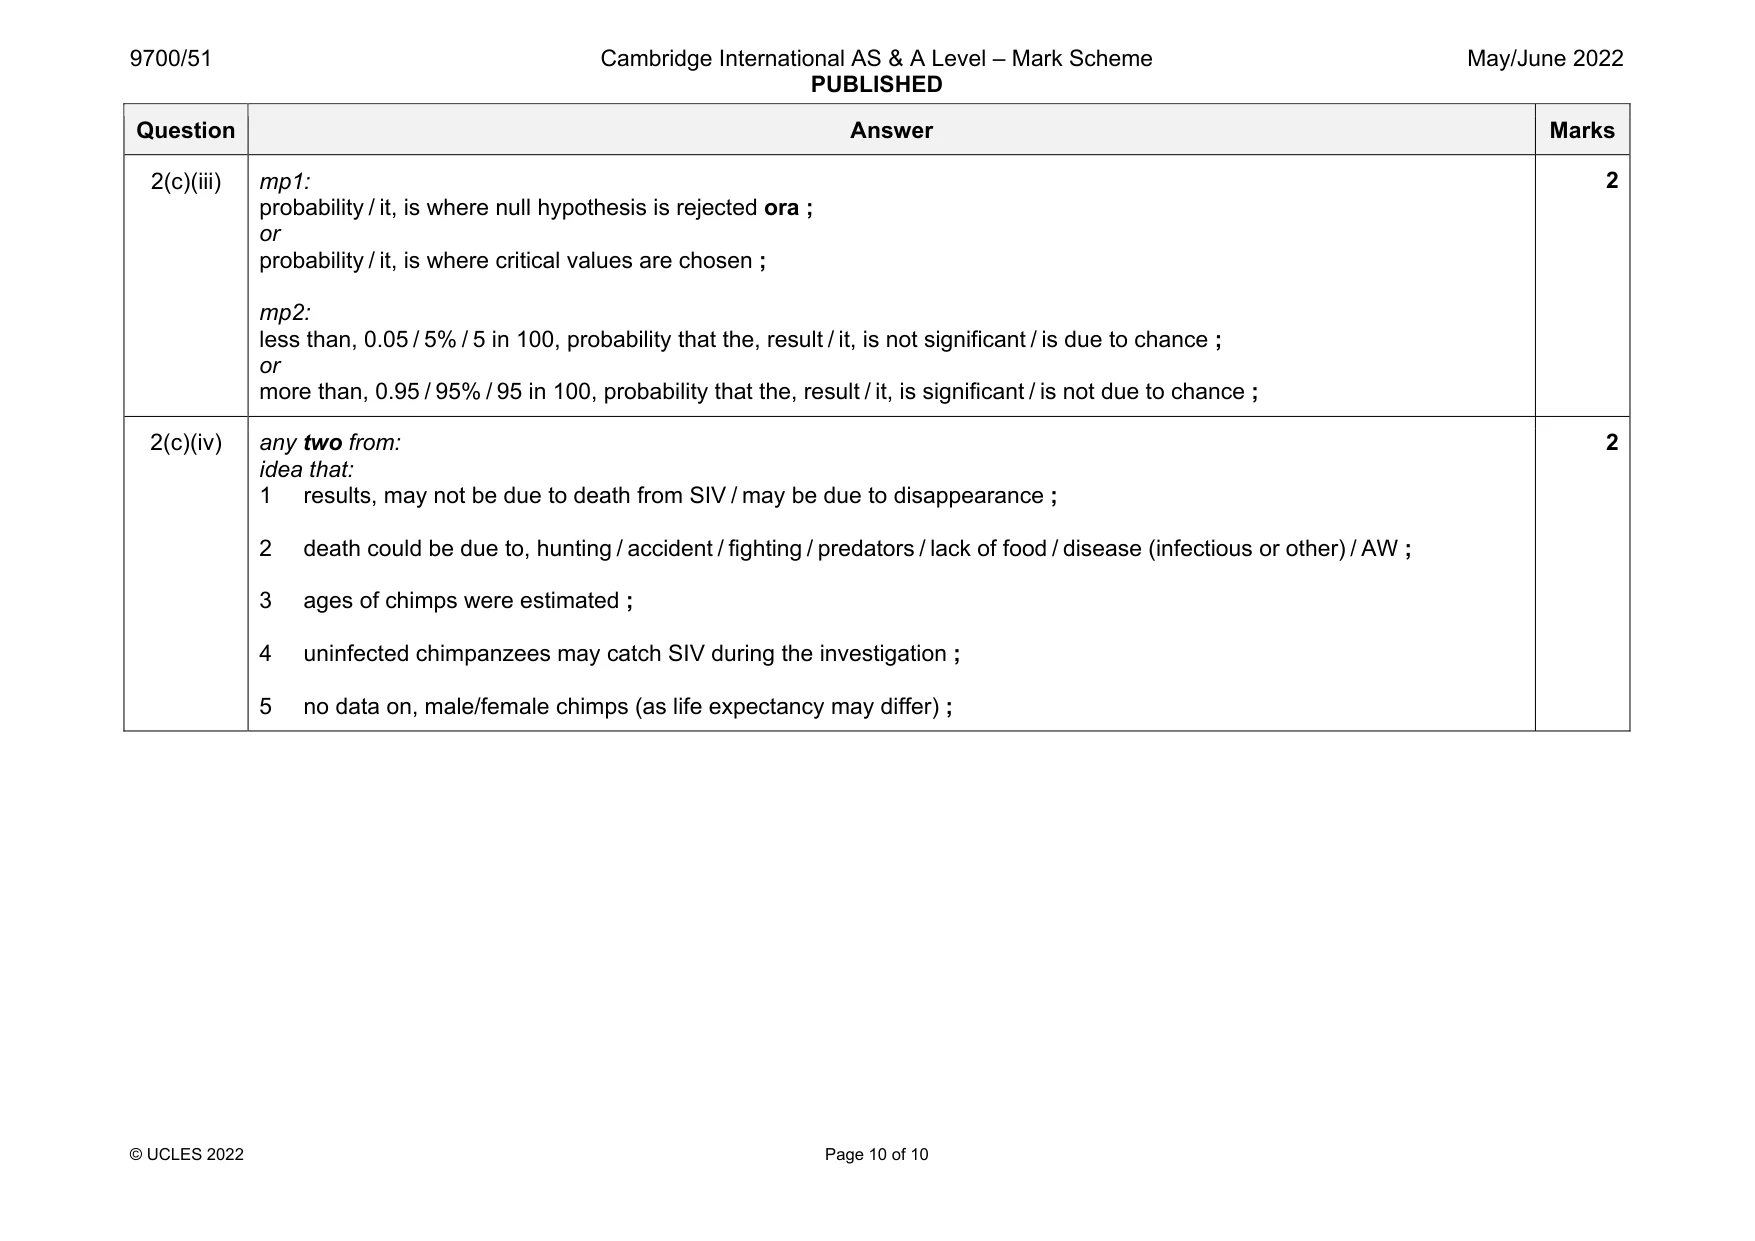
Mark scheme: 2(a)(i) any one from: (faecal samples) can be, collected remotely / AW, without harming the chimpanzees / investigators ; (faecal samples) are, non-invasive / less stressful for chimpanzees / limits human interaction / no risk of infection / no need to anesthetise chimpanzees ; 1 2(a)(ii) any two from: make into a, suspension / solution / liquify faeces ; filtered / centrifuged (to remove solids) ; 2 2(a)(iii) idea of: genetic profiling / DNA fingerprinting / DNA profiling / DNA sequencing / genetic analysis / (DNA) electrophoresis ; 1 2(b) any three from: 1 (some) SIV antibodies will bind to HIV antigens ; 2 details of, which / number of lines / bands, match / don’t match / AW ; 3 (some) SIV and HIV antibodies have similar (protein), structures / shape ; 4 HIV– people do not contain (HIV) antibodies / SIV– chimpanzees do not contain (SIV) antibodies ; 5 the tests are valid as there is a line in each of the control regions ; 3 2(c)(i) 1 allows for, valid / meaningful, comparison (between SIV+ and SIV– chimpanzees) ; 2 the groups have different, initial / original numbers ; 2 2(c)(ii) no difference between the, life expectancy / AW, of chimpanzees that are SIV+ and SIV– ; 1 Question Answer Marks 2(c)(iii) mp1: probability / it, is where null hypothesis is rejected ora ; or probability / it, is where critical values are chosen ; mp2: less than, 0.05 / 5% / 5 in 100, probability that the, result / it, is not significant / is due to chance ; or more than, 0.95 / 95% / 95 in 100, probability that the, result / it, is significant / is not due to chance ; 2 2(c)(iv) any two from: idea that: 1 results, may not be due to death from SIV / may be due to disappearance ; 2 death could be due to, hunting / accident / fighting / predators / lack of food / disease (infectious or other) / AW ; 3 ages of chimps were estimated ; 4 uninfected chimpanzees may catch SIV during the investigation ; 5 no data on, male/female chimps (as life expectancy may differ) ; 2
What was in this paper
The subtopics covered by these 2 questions, and how many questions each got. Open one in a new tab to see every Cambridge question on it.
What you needed in this session
Cambridge’s own grade thresholds for 2022 May/June, Paper 5 · Variant 1. A higher threshold means an easier paper — the bar moves with how the cohort did.