Cambridge A Level Biology 9700 — 2021 Oct/Nov Paper 2 · Variant 3
9700/23/O/N/21 · 6 questions · 60 marks · ≈68 min
The question paper and its mark scheme, free to read here and free to download. This is Cambridge’s own paper, exactly as it was sat.
Question paper16 pages

Mark scheme16 pages
Answers below. Sit the paper first if you are practising.
Questions as text
Q1 · A diagram showing a stage in protein synthesis
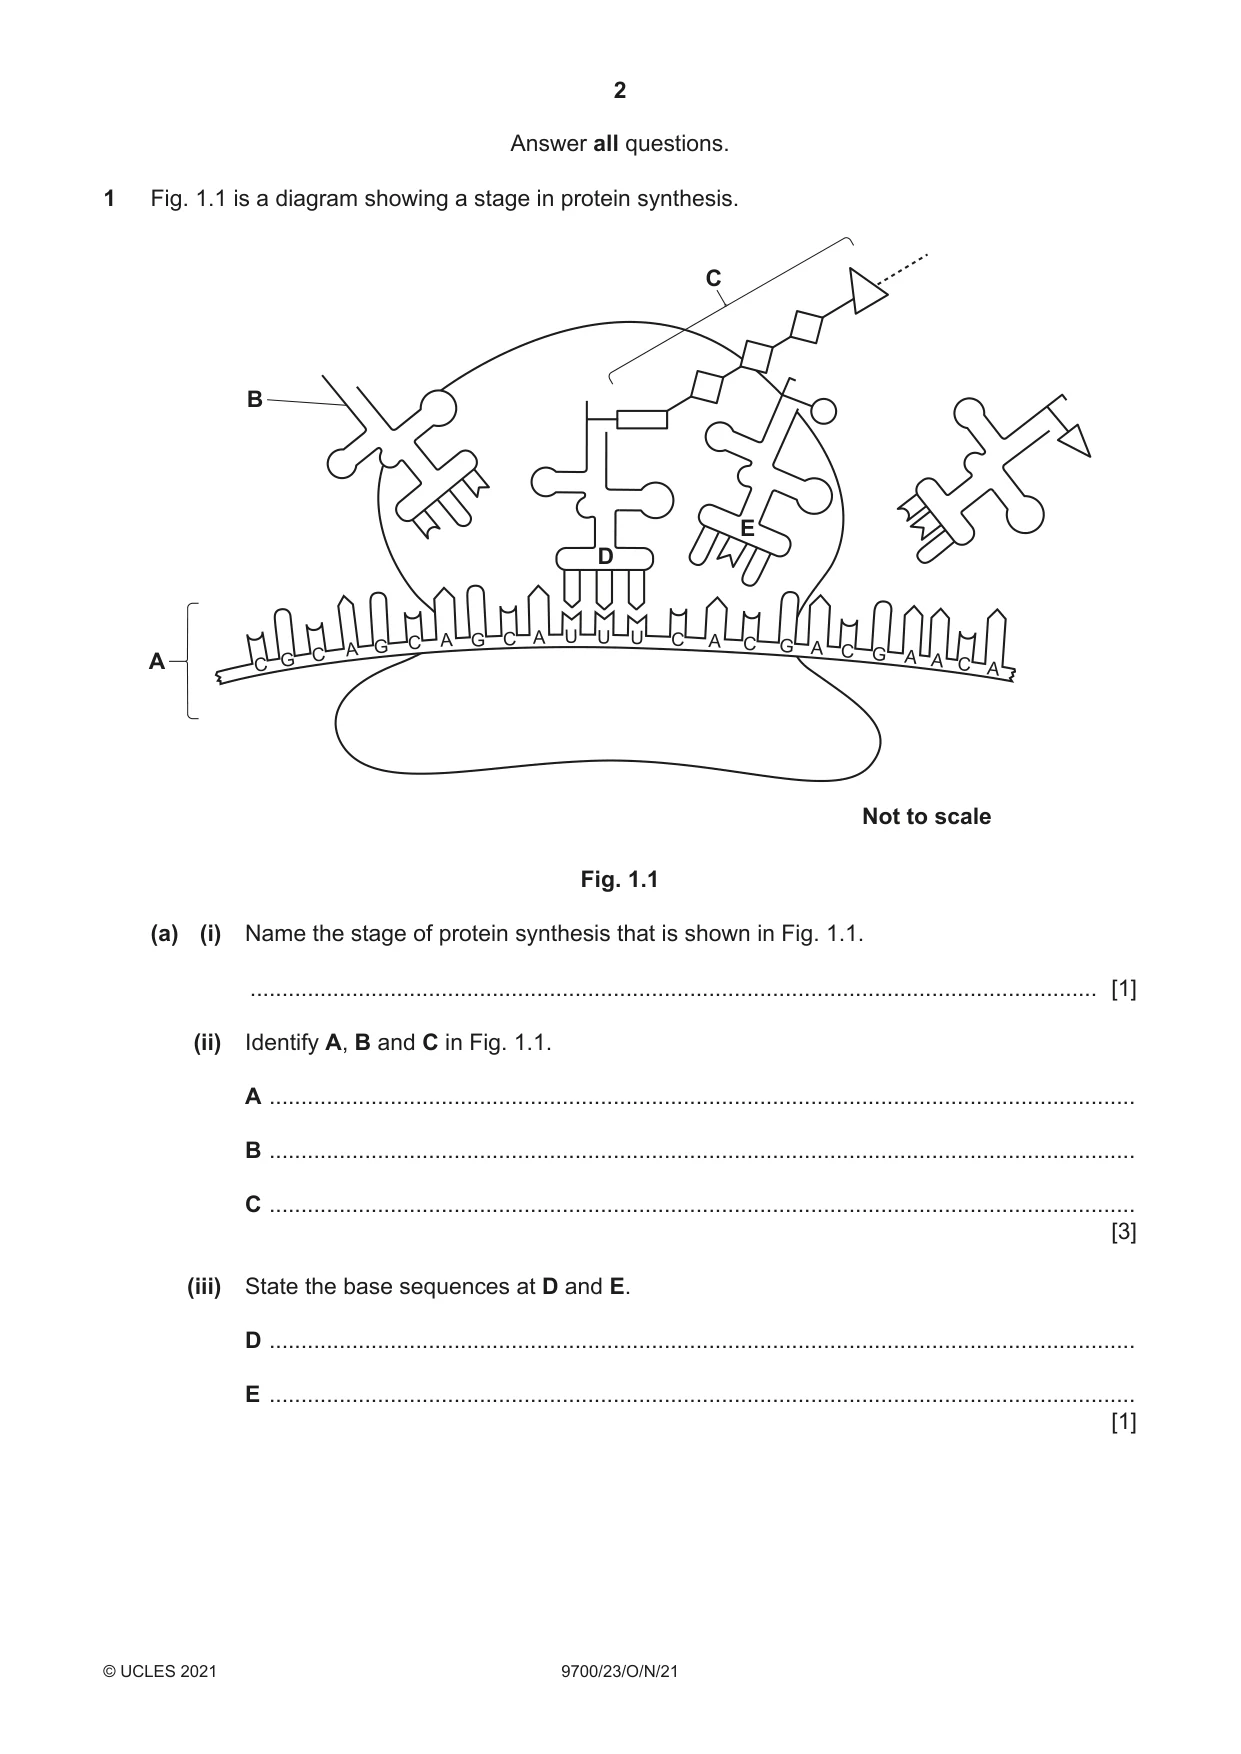
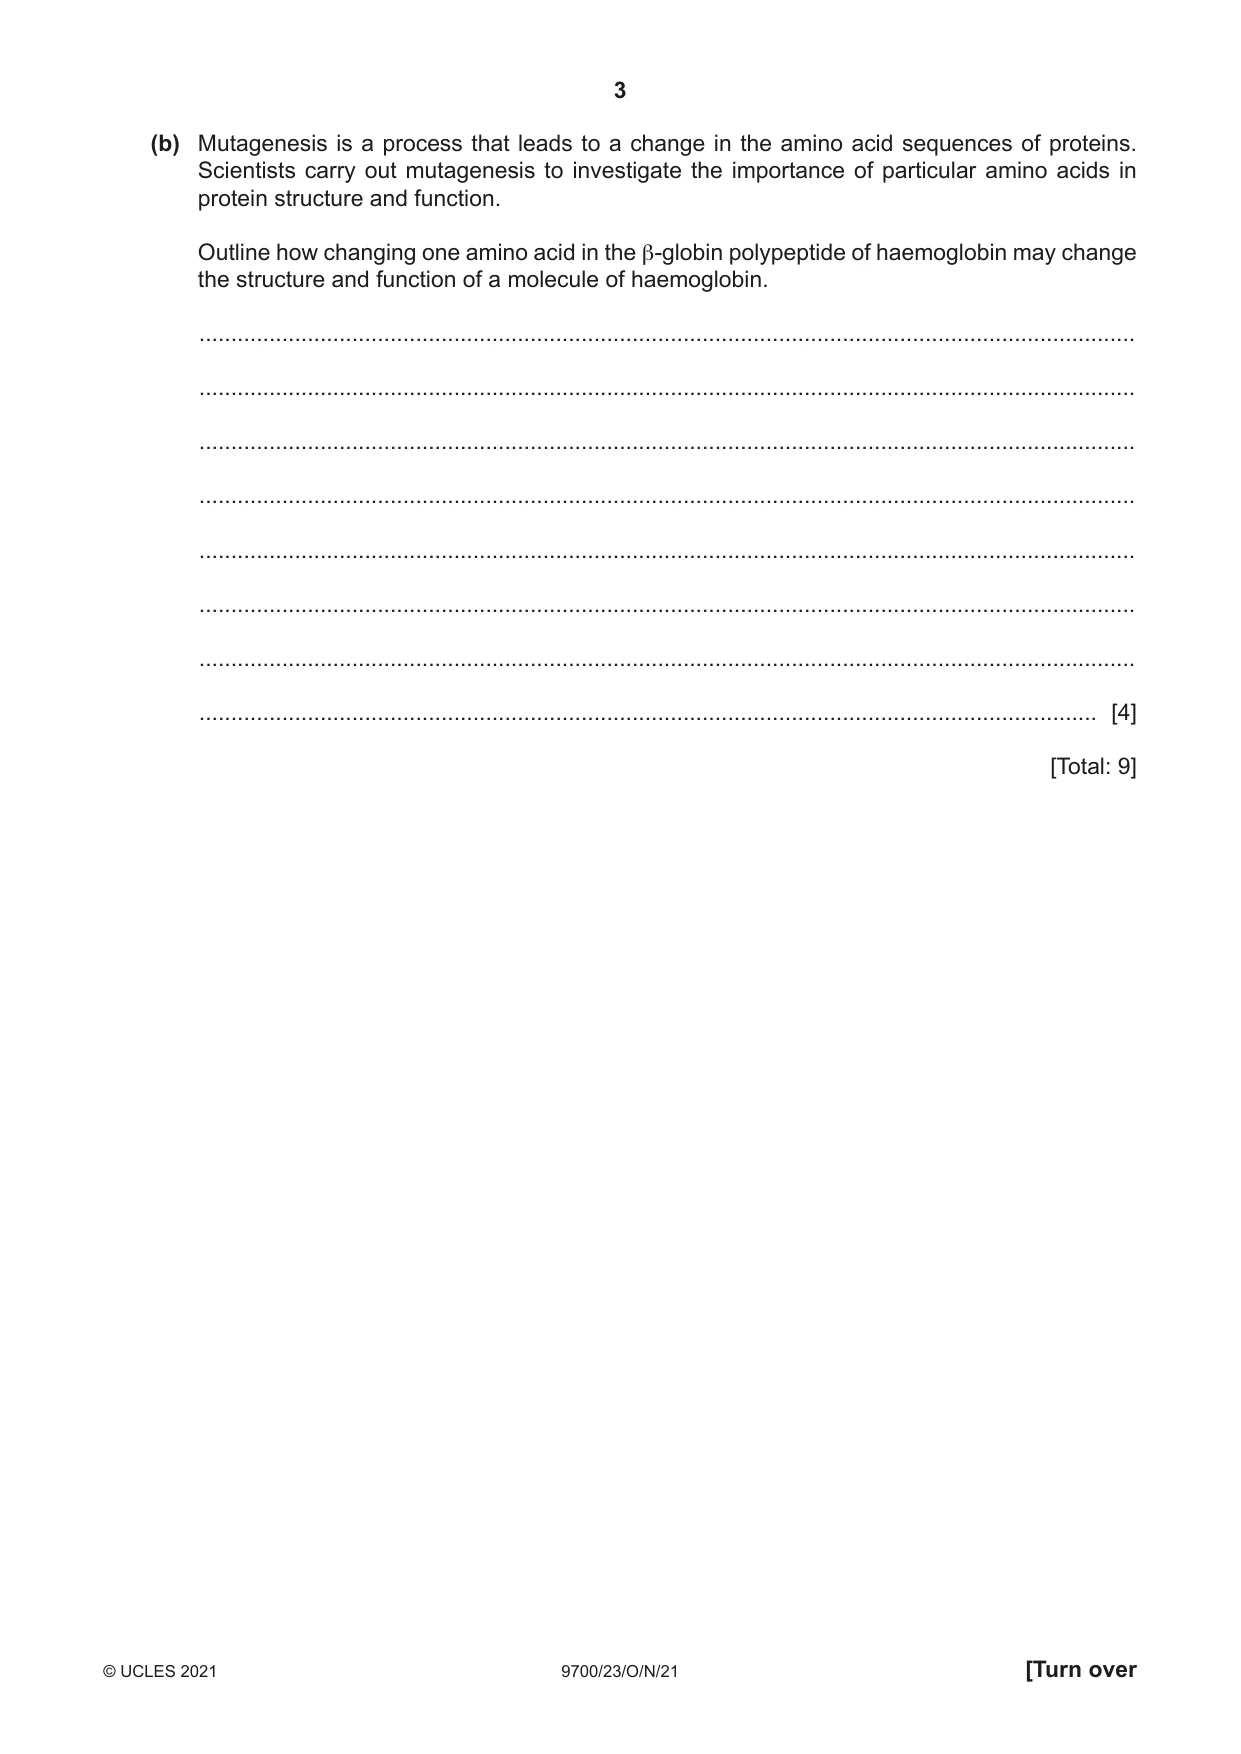
1 Fig. 1.1 is a diagram showing a stage in protein synthesis. C B E D A C G C A G C A G C A U U U C A C G A C G A A C A Not to scale Fig. 1.1 (a) (i) Name the stage of protein synthesis that is shown in Fig. 1.1. ..................................................................................................................................... [1] (ii) Identify A, B and C in Fig. 1.1. A ........................................................................................................................................ B ........................................................................................................................................ C ........................................................................................................................................ [3] (iii) State the base sequences at D and E. D ........................................................................................................................................ E ........................................................................................................................................ [1] (b) Mutagenesis is a process that leads to a change in the amino acid sequences of proteins. Scientists carry out mutagenesis to investigate the importance of particular amino acids in protein structure and function. Outline how changing one amino acid in the β-globin polypeptide of haemoglobin may change the structure and function of a molecule of haemoglobin. ................................................................................................................................................... ................................................................................................................................................... ................................................................................................................................................... ................................................................................................................................................... ................................................................................................................................................... ................................................................................................................................................... ................................................................................................................................................... ............................................................................................................................................. [4] [Total: 9]
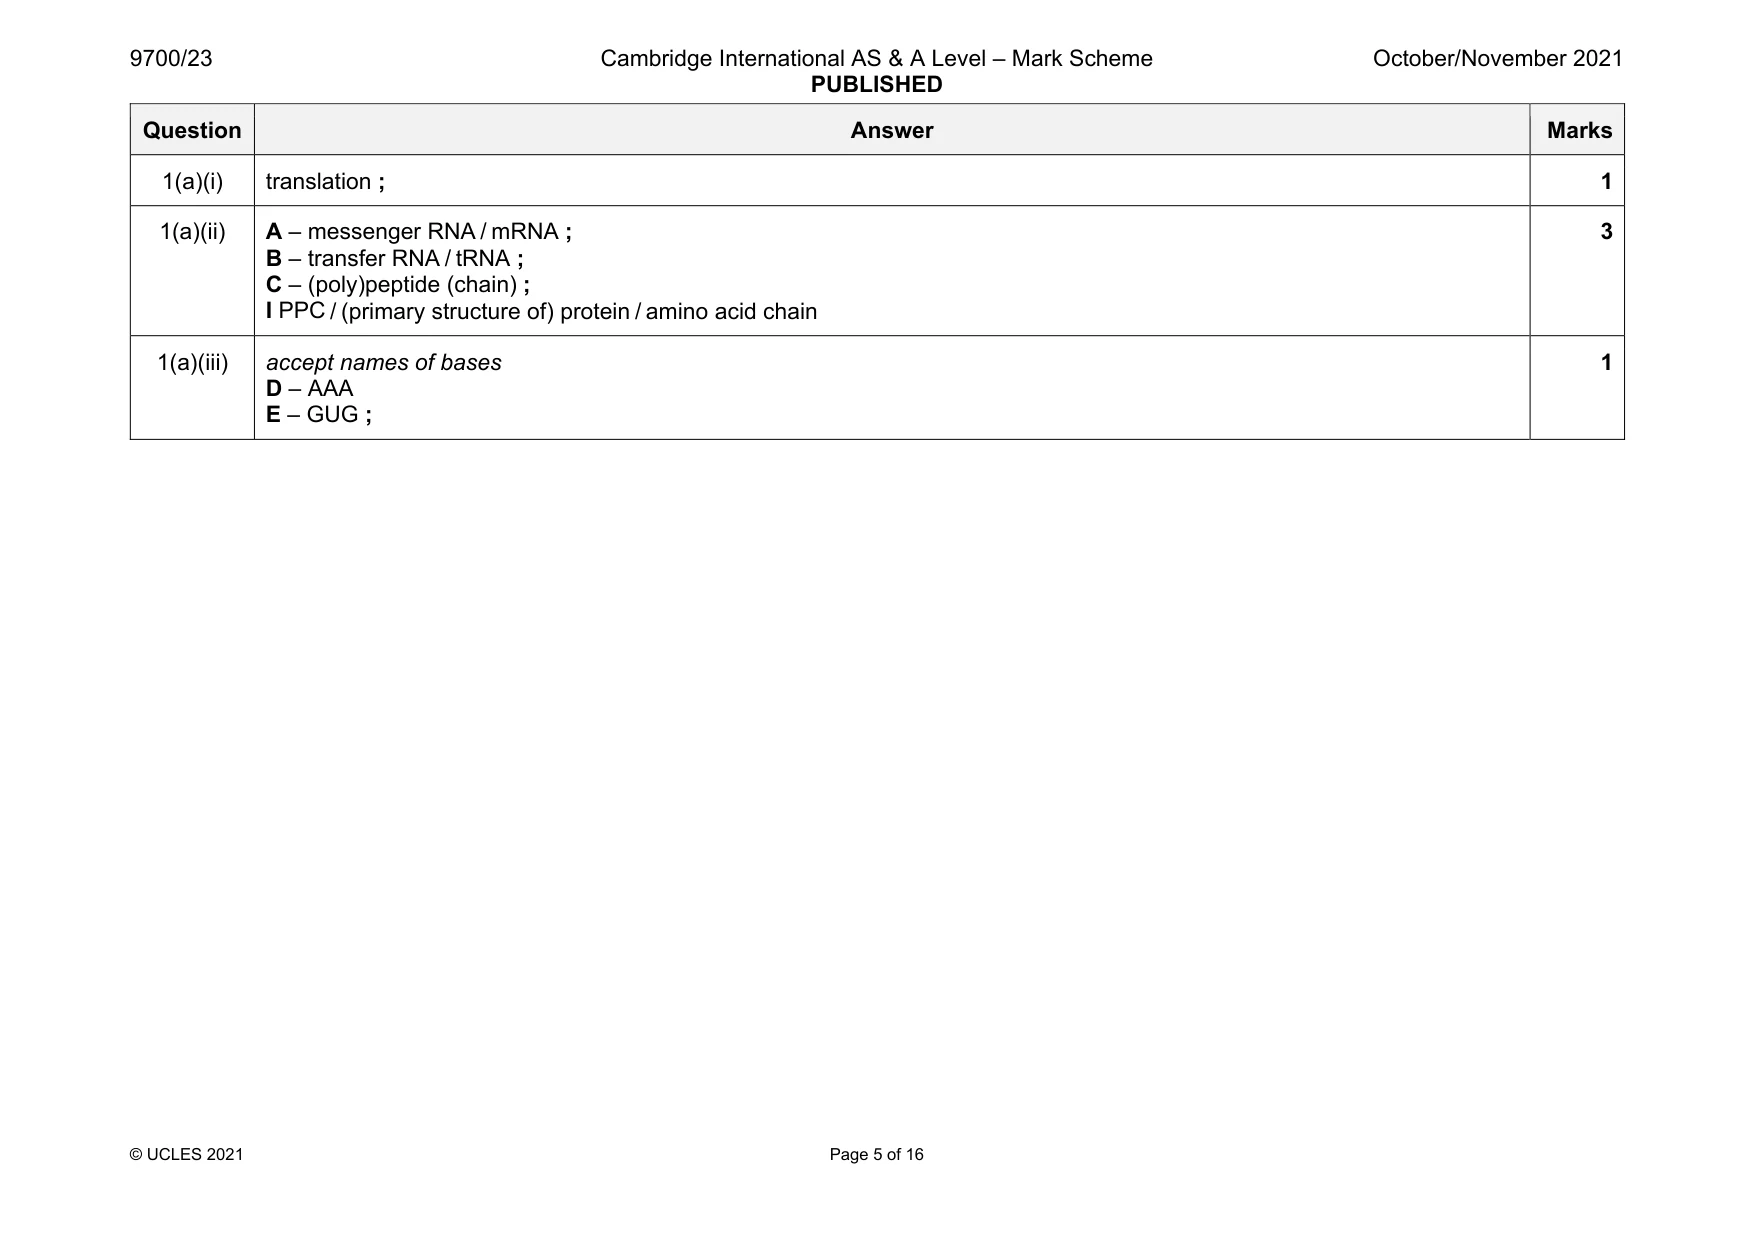
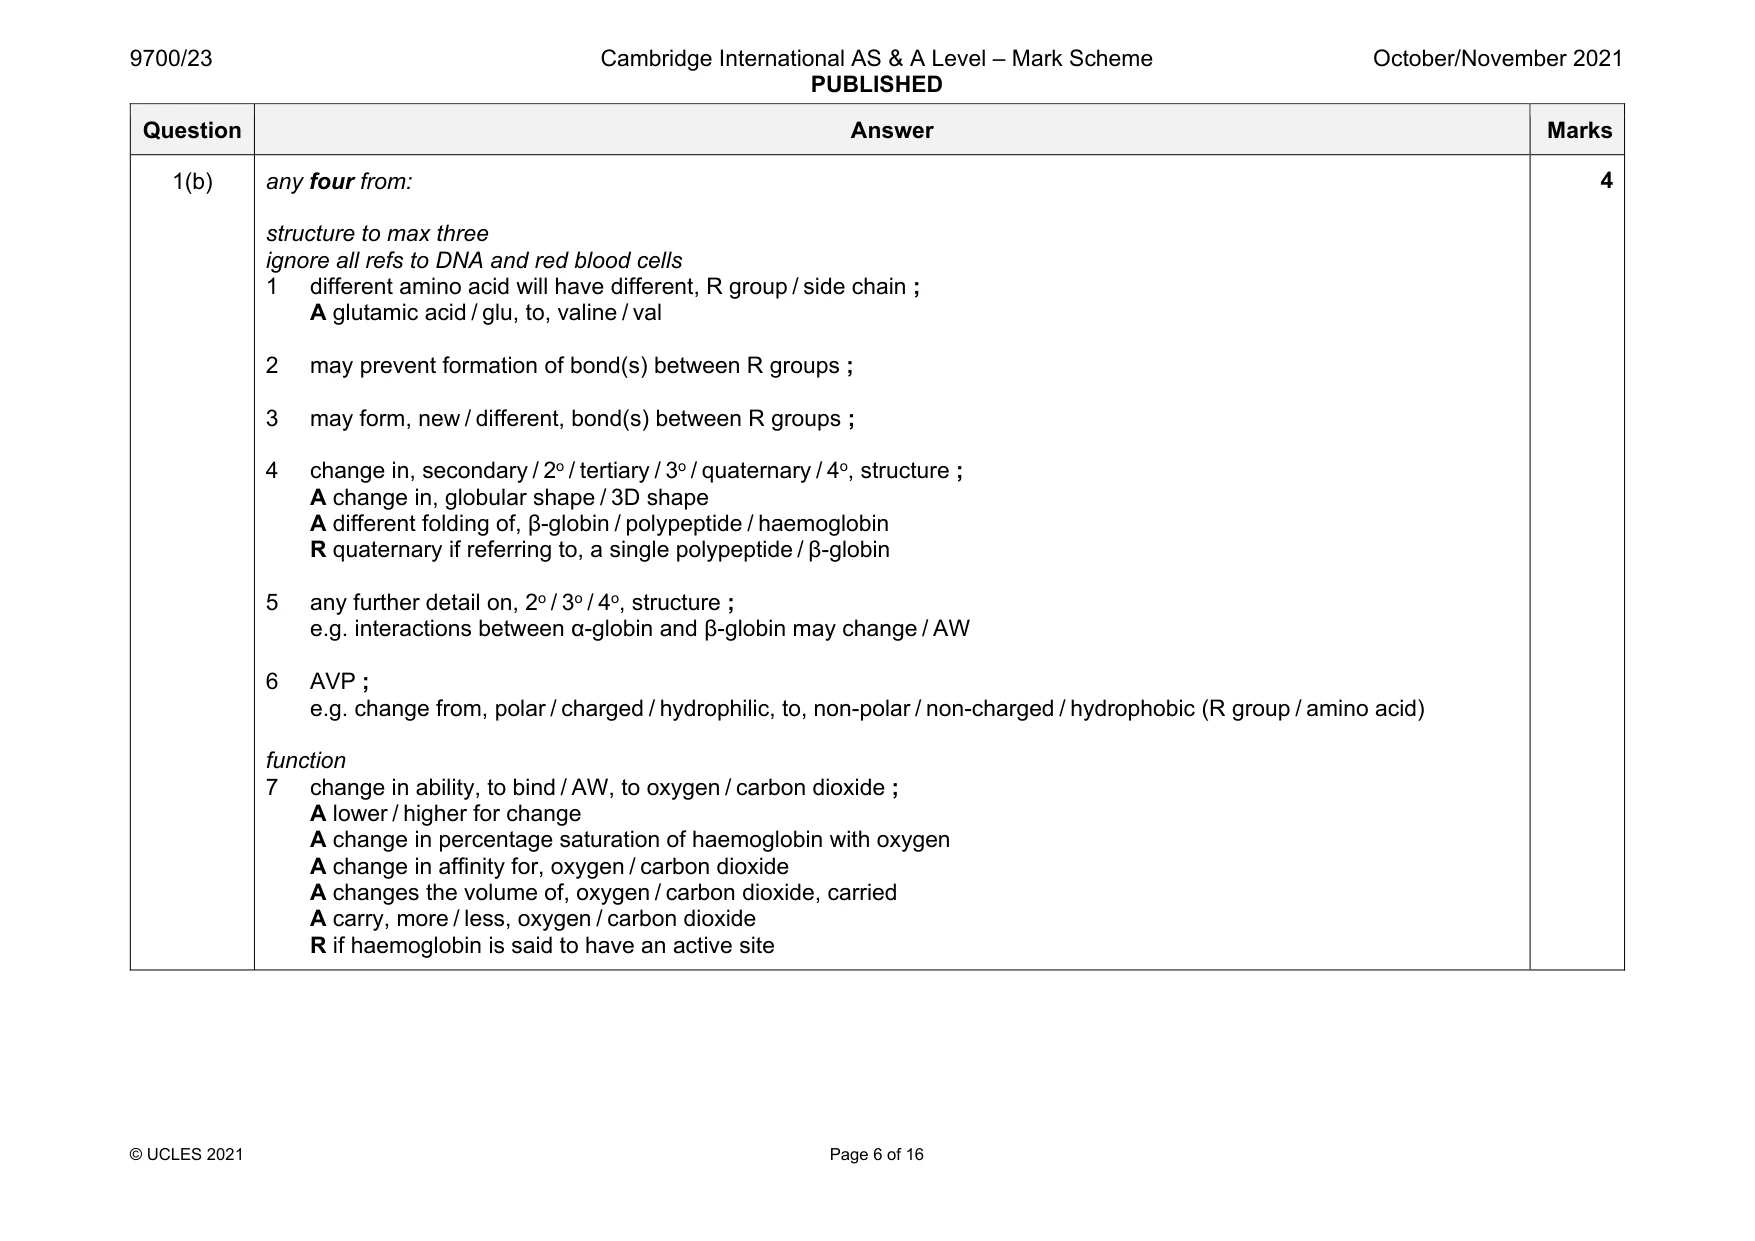
Mark scheme: 1(a)(i) translation ; 1 1(a)(ii) A – messenger RNA / mRNA ; B – transfer RNA / tRNA ; C – (poly)peptide (chain) ; I PPC / (primary structure of) protein / amino acid chain 3 1(a)(iii) accept names of bases D – AAA E – GUG ; 1 Question Answer Marks 1(b) any four from: structure to max three ignore all refs to DNA and red blood cells 1 different amino acid will have different, R group / side chain ; A glutamic acid / glu, to, valine / val 2 may prevent formation of bond(s) between R groups ; 3 may form, new / different, bond(s) between R groups ; 4 change in, secondary / 2o / tertiary / 3o / quaternary / 4o, structure ; A change in, globular shape / 3D shape A different folding of, β-globin / polypeptide / haemoglobin R quaternary if referring to, a single polypeptide / β-globin 5 any further detail on, 2o / 3o / 4o, structure ; e.g. interactions between α-globin and β-globin may change / AW 6 AVP ; e.g. change from, polar / charged / hydrophilic, to, non-polar / non-charged / hydrophobic (R group / amino acid) function 7 change in ability, to bind / AW, to oxygen / carbon dioxide ; A lower / higher for change A change in percentage saturation of haemoglobin with oxygen A change in affinity for, oxygen / carbon dioxide A changes the volume of, oxygen / carbon dioxide, carried A carry, more / less, oxygen / carbon dioxide R if haemoglobin is said to have an active site 4
Q2 · Pepsin is an enzyme that hydrolyses proteins (protease)
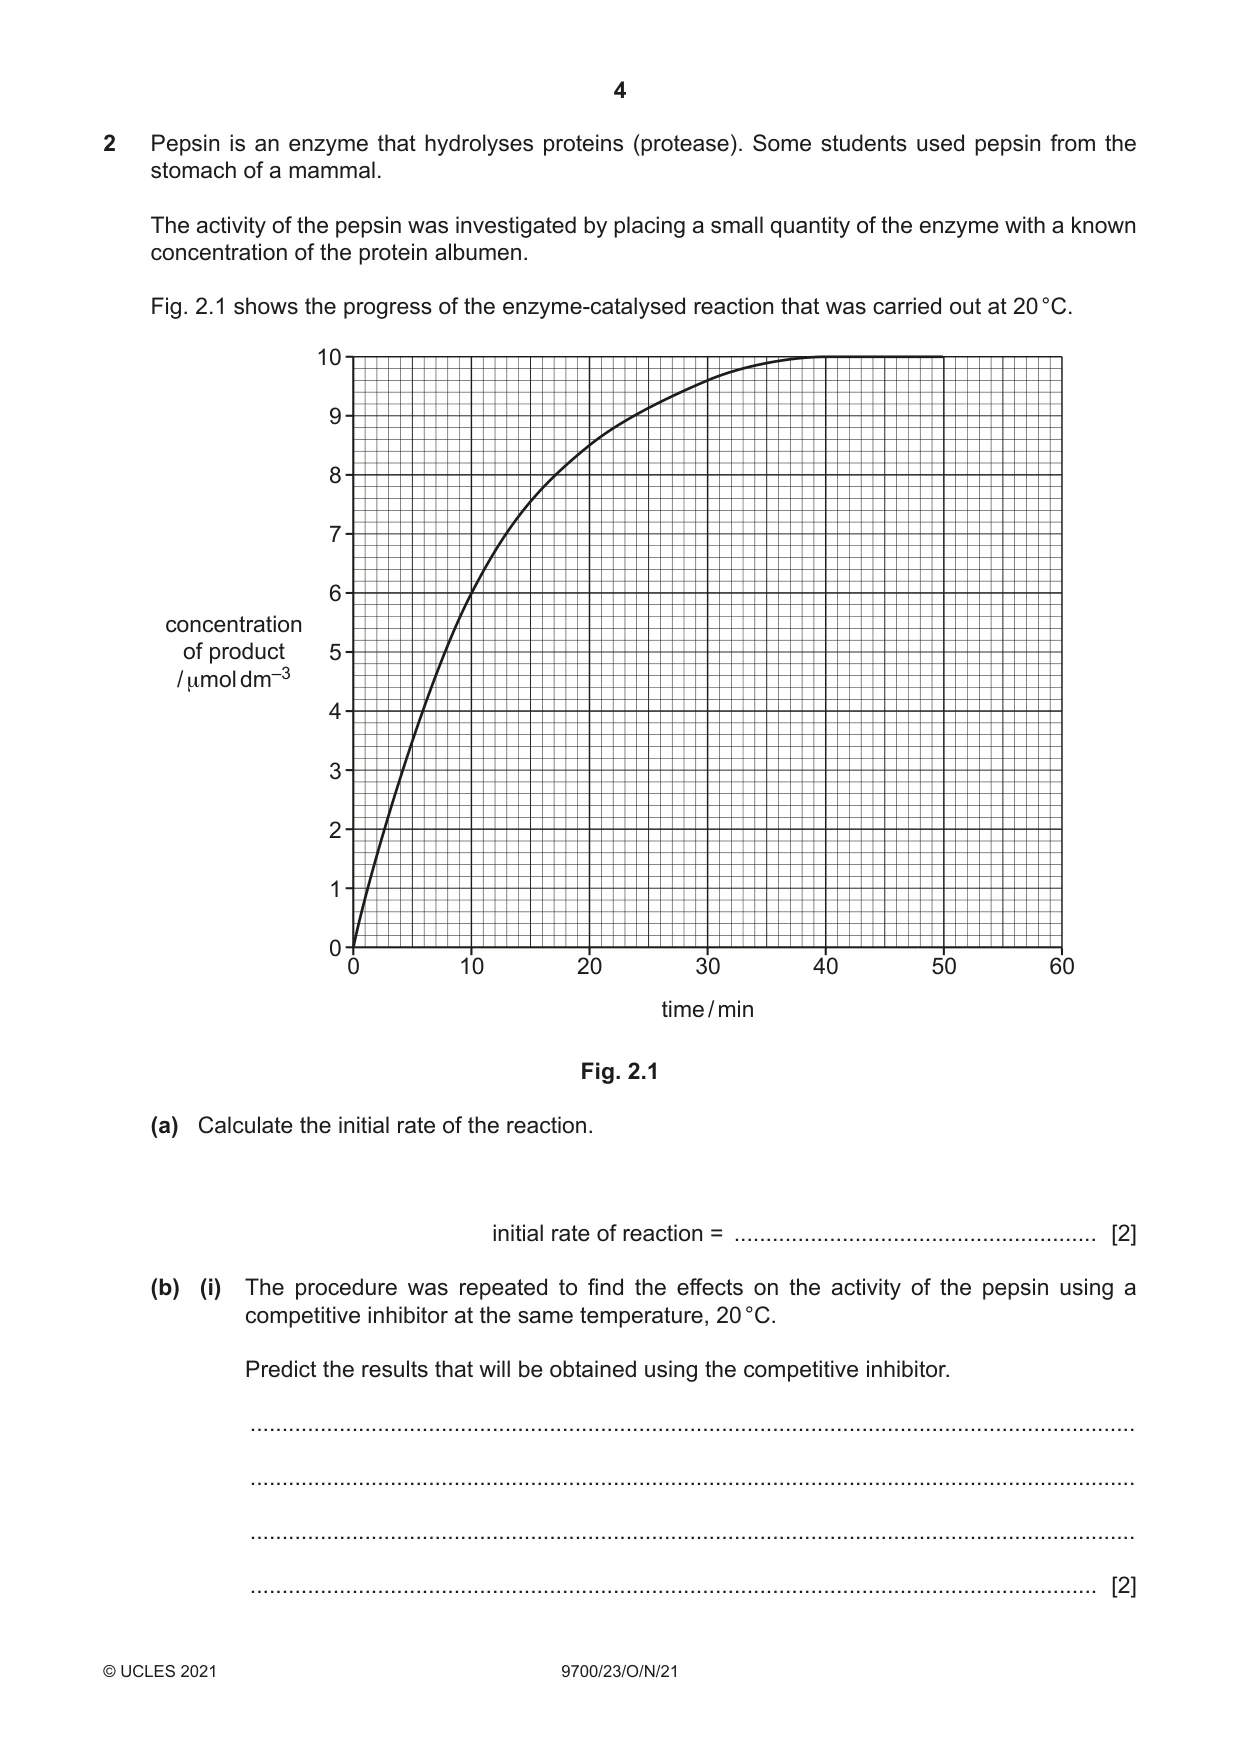
2 Pepsin is an enzyme that hydrolyses proteins (protease). Some students used pepsin from the stomach of a mammal. The activity of the pepsin was investigated by placing a small quantity of the enzyme with a known concentration of the protein albumen. Fig. 2.1 shows the progress of the enzyme-catalysed reaction that was carried out at 20 °C. 10 9 8 7 6 concentration of product 5 / μmol dm–3 4 3 2 1 0 0 10 20 30 40 50 60 time / min Fig. 2.1 (a) Calculate the initial rate of the reaction. initial rate of reaction = ......................................................... [2] (b) (i) The procedure was repeated to find the effects on the activity of the pepsin using a competitive inhibitor at the same temperature, 20 °C. Predict the results that will be obtained using the competitive inhibitor. ........................................................................................................................................... ........................................................................................................................................... ........................................................................................................................................... ..................................................................................................................................... [2] (ii) The procedure was repeated without the competitive inhibitor but at the higher temperature of 30 °C. Predict the results that will be obtained at 30 °C. ........................................................................................................................................... ........................................................................................................................................... ........................................................................................................................................... ..................................................................................................................................... [2] (c) The students extended their investigation by using pepsin from a different species of mammal. The experiments were carried out at 20 °C and without a competitive inhibitor. With reference to Fig. 2.1, explain the advantage of calculating the initial rate of reaction in each experiment. ................................................................................................................................................... ................................................................................................................................................... ................................................................................................................................................... ................................................................................................................................................... ................................................................................................................................................... ............................................................................................................................................. [2] [Total: 8]
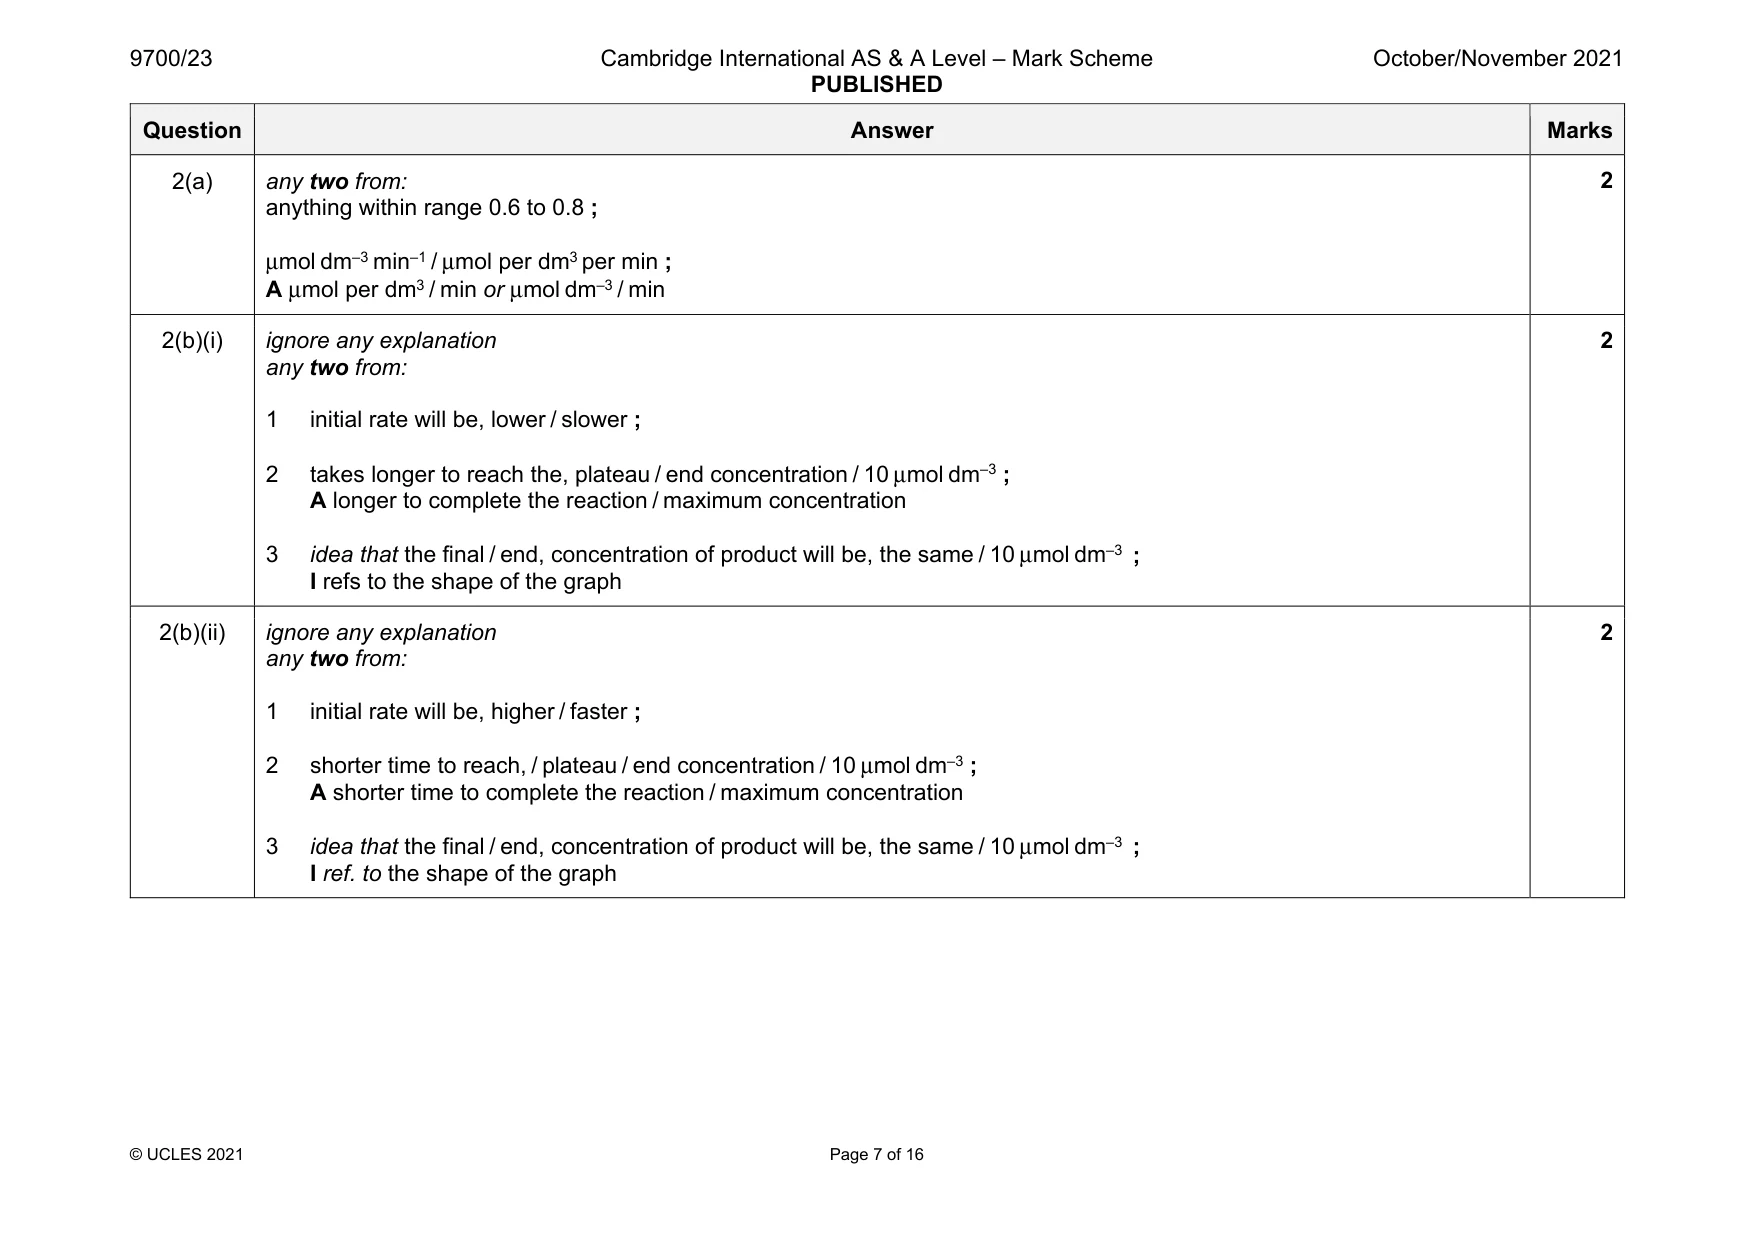
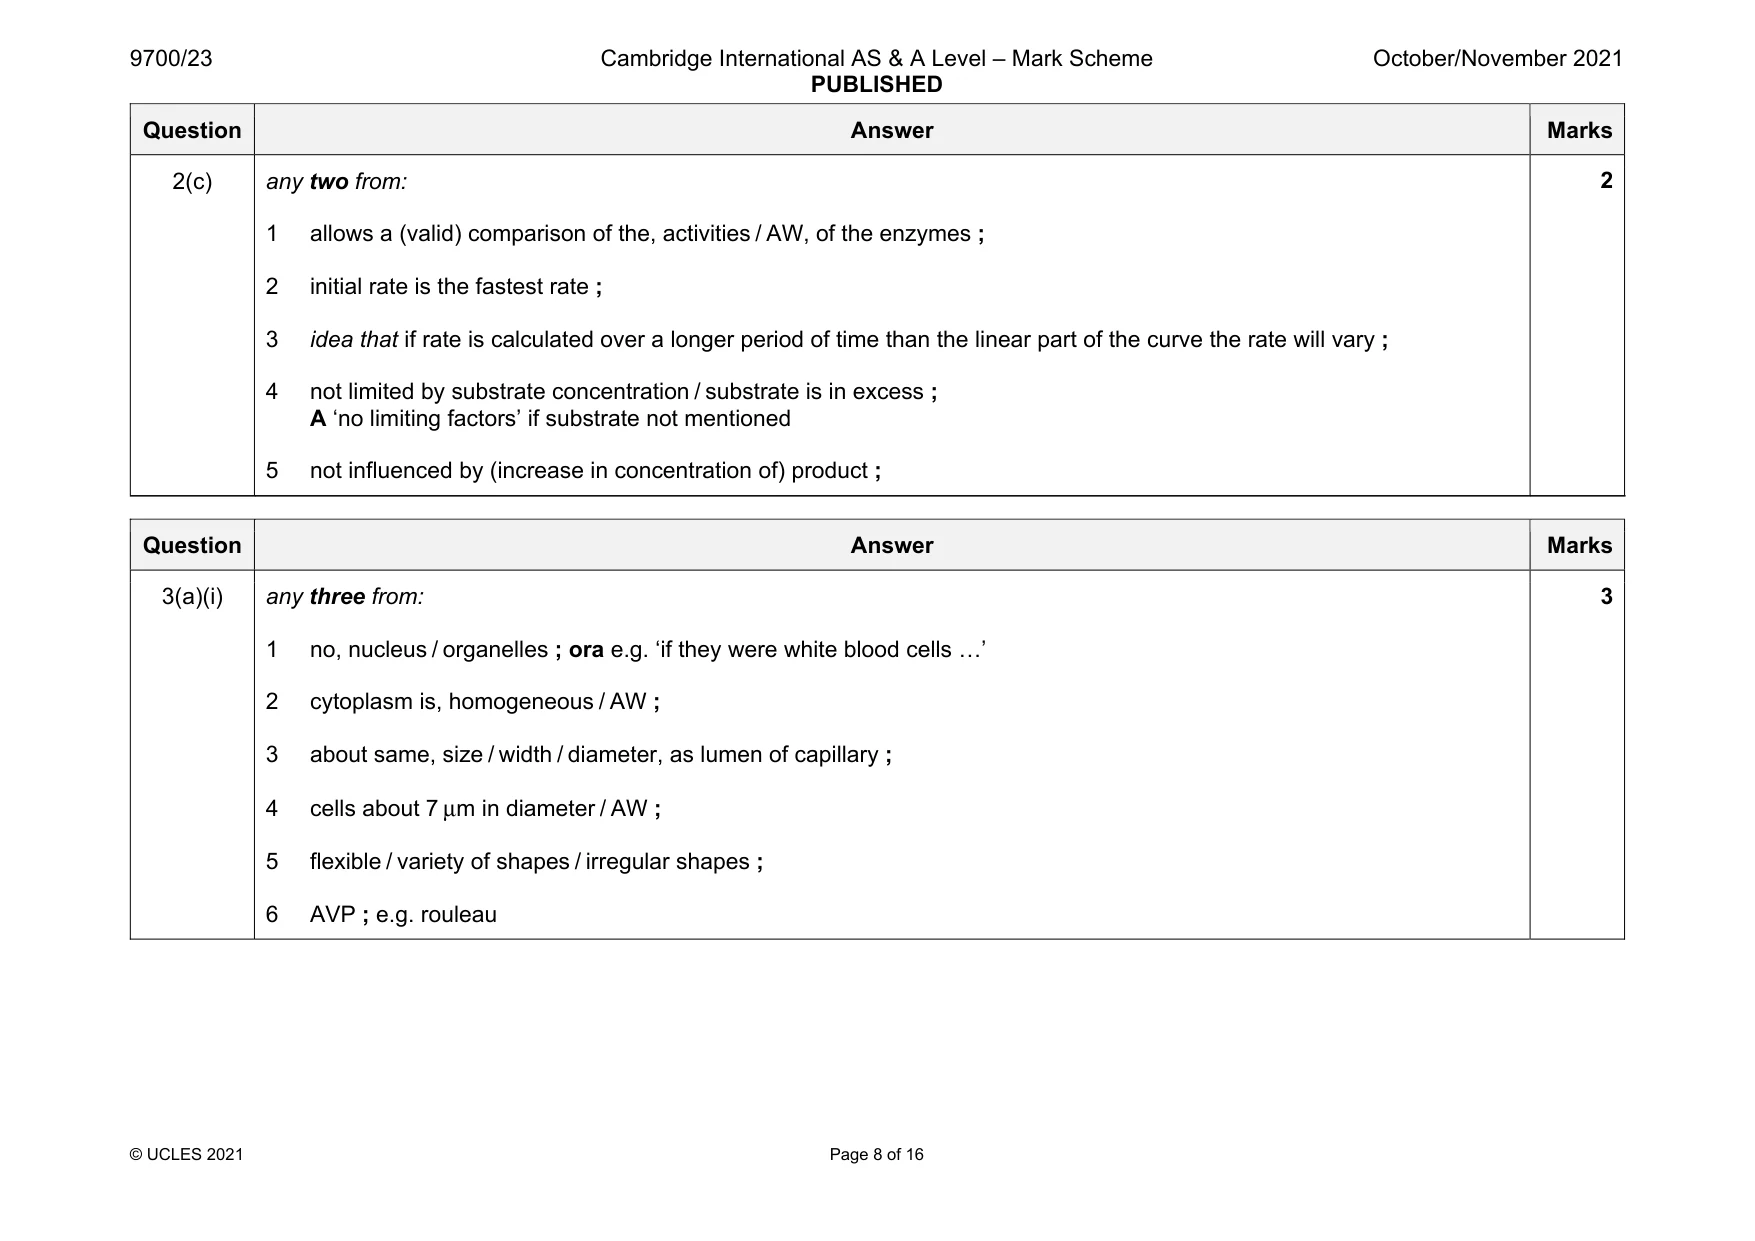
Mark scheme: 2(a) any two from: anything within range 0.6 to 0.8 ; μmol dm–3 min–1 / μmol per dm3 per min ; A μmol per dm3 / min or μmol dm–3 / min 2(b)(i) ignore any explanation any two from: 1 initial rate will be, lower / slower ; 2 takes longer to reach the, plateau / end concentration / 10 μmol dm–3 ; A longer to complete the reaction / maximum concentration 3 idea that the final / end, concentration of product will be, the same / 10 μmol dm–3 ; I refs to the shape of the graph 2 2(b)(ii) ignore any explanation any two from: 1 initial rate will be, higher / faster ; 2 shorter time to reach, / plateau / end concentration / 10 μmol dm–3 ; A shorter time to complete the reaction / maximum concentration 3 idea that the final / end, concentration of product will be, the same / 10 μmol dm–3 ; I ref. to the shape of the graph 2 Question Answer Marks 2(c) any two from: 1 allows a (valid) comparison of the, activities / AW, of the enzymes ; 2 initial rate is the fastest rate ; 3 idea that if rate is calculated over a longer period of time than the linear part of the curve the rate will vary ; 4 not limited by substrate concentration / substrate is in excess ; A ‘no limiting factors’ if substrate not mentioned 5 not influenced by (increase in concentration of) product ; 2
Q3 · A transmission electron micrograph showing red blood cells in a capillary of a healthy…
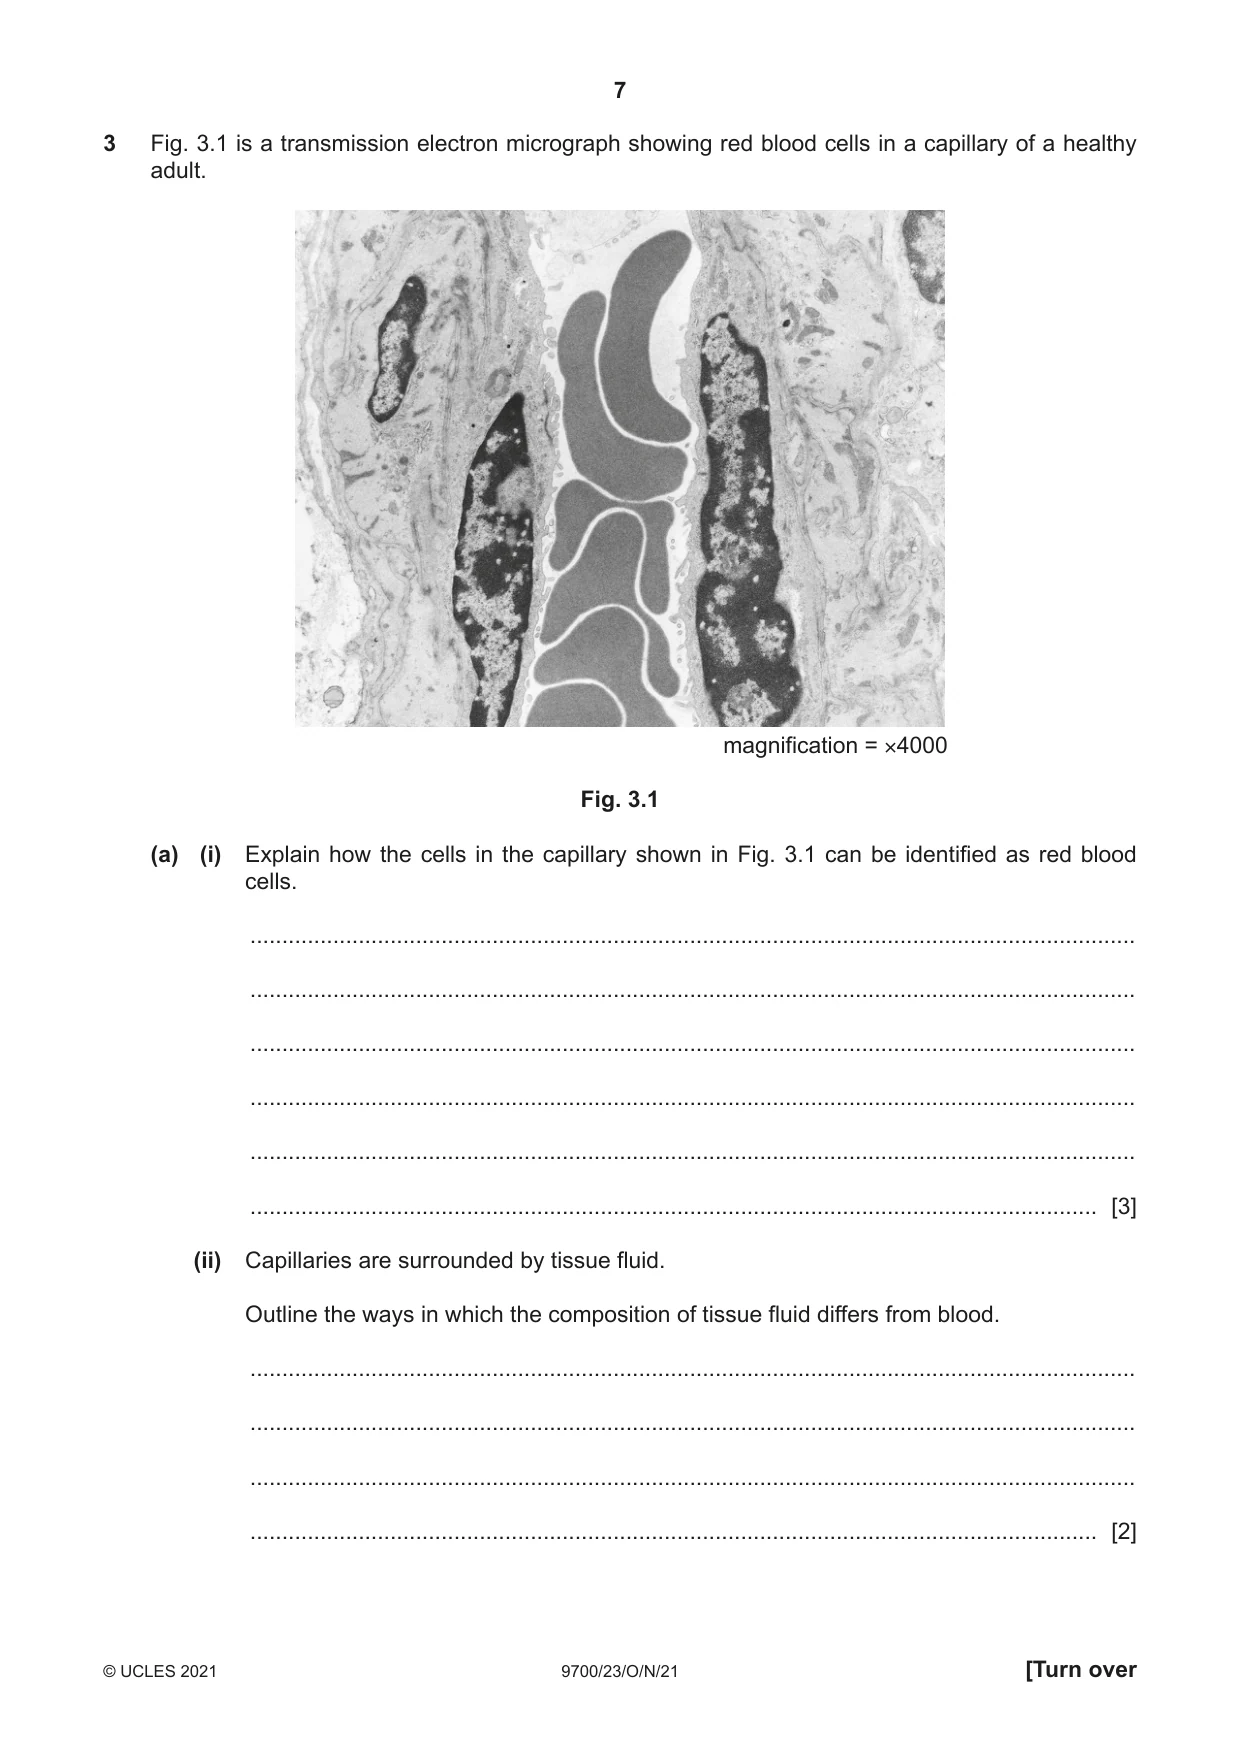
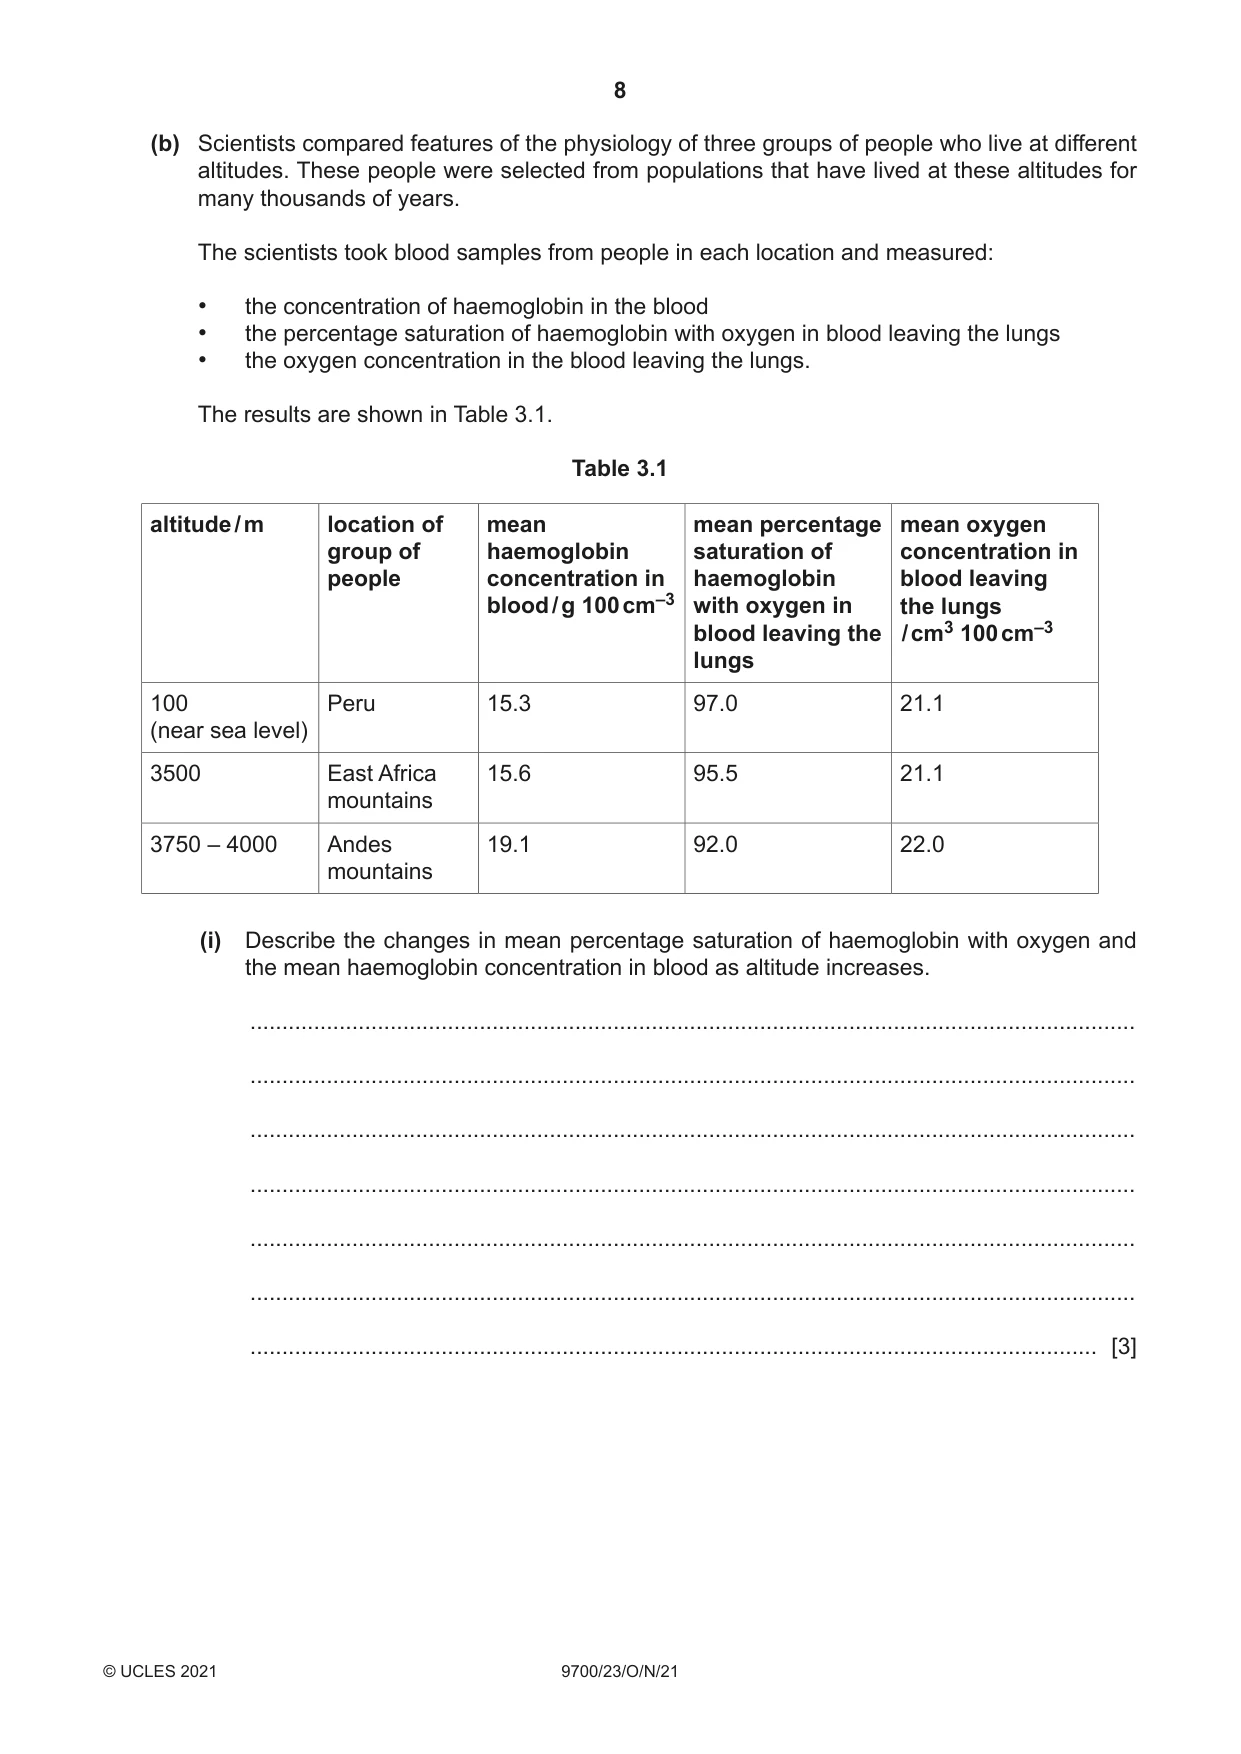
3 Fig. 3.1 is a transmission electron micrograph showing red blood cells in a capillary of a healthy adult. magnification = ×4000 Fig. 3.1 (a) (i) Explain how the cells in the capillary shown in Fig. 3.1 can be identified as red blood cells. ........................................................................................................................................... ........................................................................................................................................... ........................................................................................................................................... ........................................................................................................................................... ........................................................................................................................................... ..................................................................................................................................... [3] (ii) Capillaries are surrounded by tissue fluid. Outline the ways in which the composition of tissue fluid differs from blood. ........................................................................................................................................... ........................................................................................................................................... ........................................................................................................................................... ..................................................................................................................................... [2] (b) Scientists compared features of the physiology of three groups of people who live at different altitudes. These people were selected from populations that have lived at these altitudes for many thousands of years. The scientists took blood samples from people in each location and measured: • the concentration of haemoglobin in the blood • the percentage saturation of haemoglobin with oxygen in blood leaving the lungs • the oxygen concentration in the blood leaving the lungs. The results are shown in Table 3.1. Table 3.1 altitude / m location of mean mean percentage mean oxygen group of haemoglobin saturation of concentration in people concentration in haemoglobin blood leaving blood / g 100 cm–3 with oxygen in the lungs blood leaving the / cm3 100 cm–3 lungs 100 Peru 15.3 97.0 21.1 (near sea level) 3500 East Africa 15.6 95.5 21.1 mountains 3750 – 4000 Andes 19.1 92.0 22.0 mountains (i) Describe the changes in mean percentage saturation of haemoglobin with oxygen and the mean haemoglobin concentration in blood as altitude increases. ........................................................................................................................................... ........................................................................................................................................... ........................................................................................................................................... ........................................................................................................................................... ........................................................................................................................................... ........................................................................................................................................... ..................................................................................................................................... [3] (ii) With reference to Table 3.1, suggest how the people living at high altitude can have an oxygen concentration in blood leaving the lungs similar to that of the people living at sea level. ........................................................................................................................................... ........................................................................................................................................... ........................................................................................................................................... ........................................................................................................................................... ........................................................................................................................................... ........................................................................................................................................... ..................................................................................................................................... [3] [Total: 11]
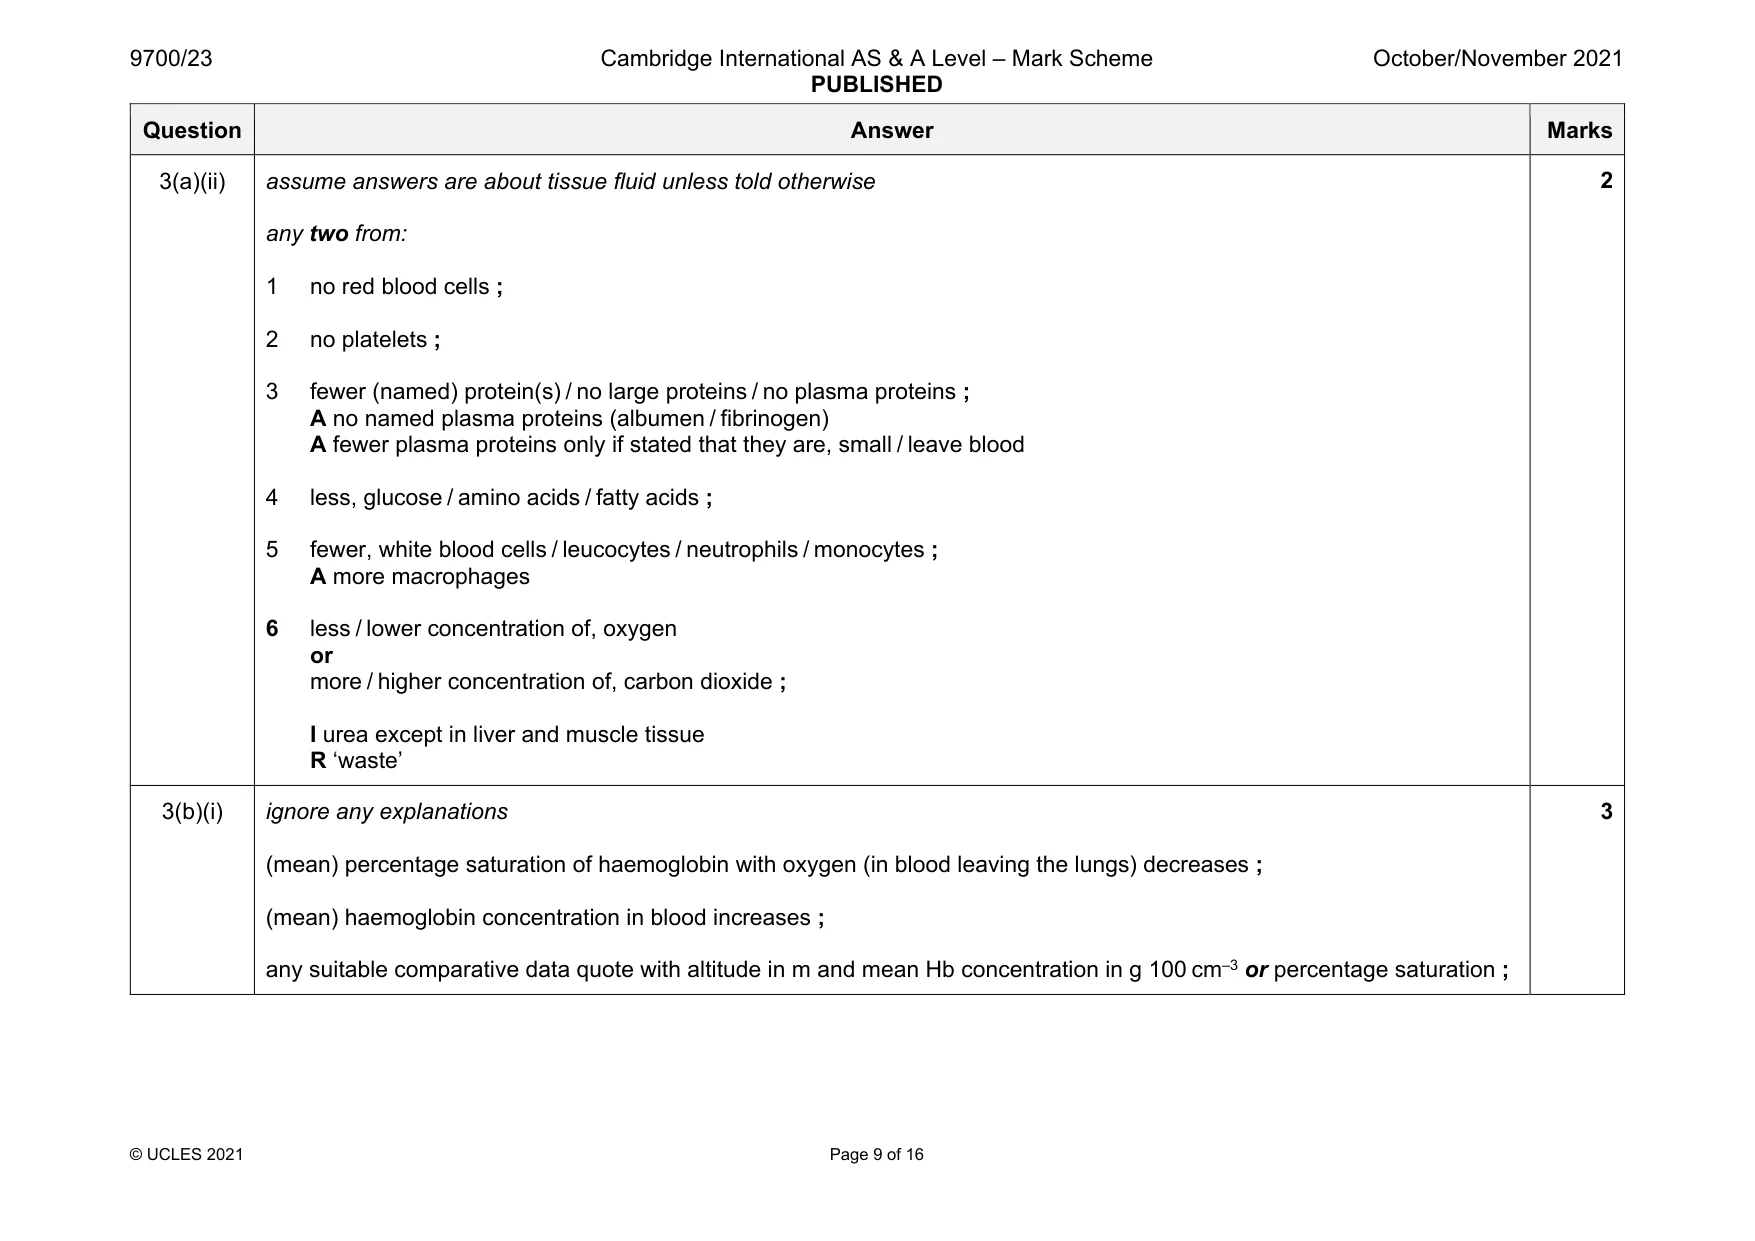
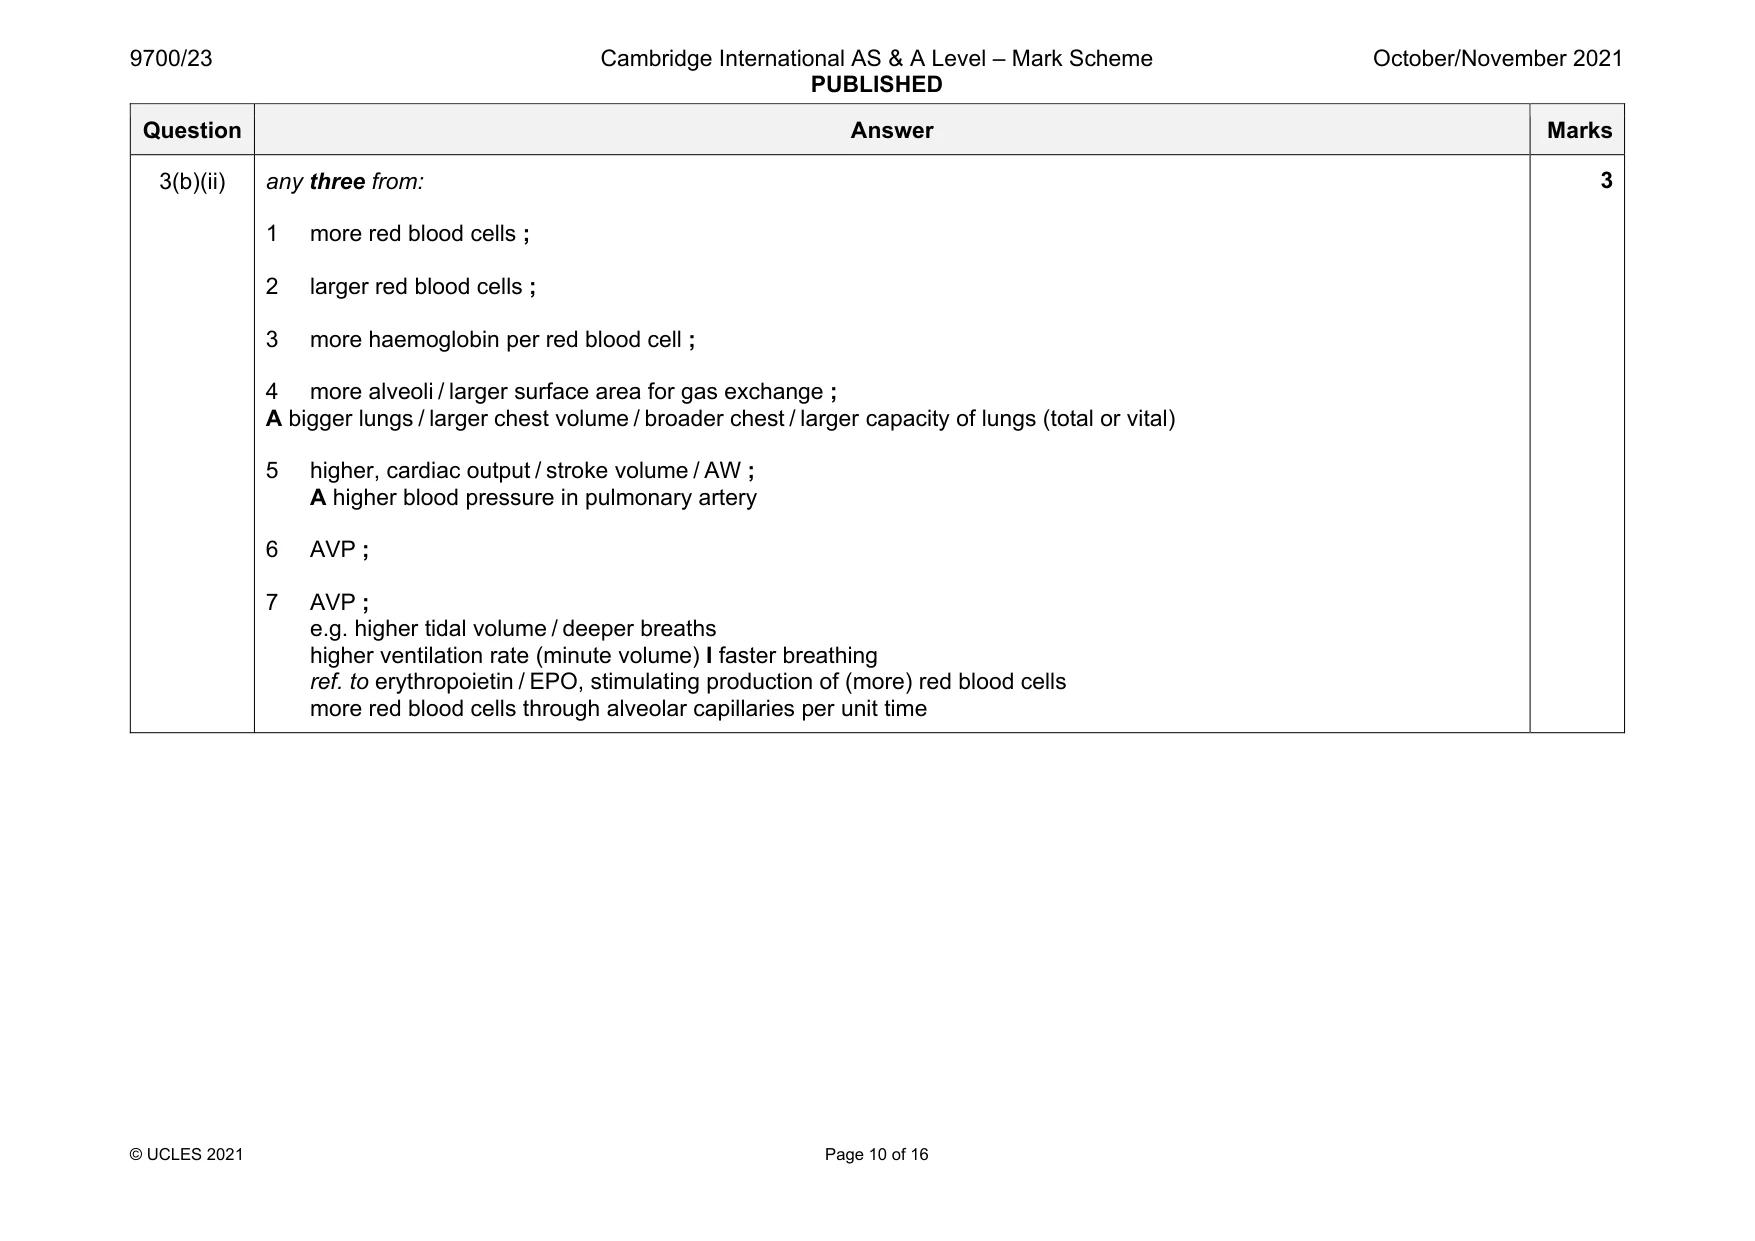
Mark scheme: 3(a)(i) any three from: 1 no, nucleus / organelles ; ora e.g. ‘if they were white blood cells …’ 2 cytoplasm is, homogeneous / AW ; 3 about same, size / width / diameter, as lumen of capillary ; 4 cells about 7 μm in diameter / AW ; 5 flexible / variety of shapes / irregular shapes ; 6 AVP ; e.g. rouleau Question Answer Marks 3(a)(ii) assume answers are about tissue fluid unless told otherwise any two from: 1 no red blood cells ; 2 no platelets ; 3 fewer (named) protein(s) / no large proteins / no plasma proteins ; A no named plasma proteins (albumen / fibrinogen) A fewer plasma proteins only if stated that they are, small / leave blood 4 less, glucose / amino acids / fatty acids ; 5 fewer, white blood cells / leucocytes / neutrophils / monocytes ; A more macrophages 6 less / lower concentration of, oxygen or more / higher concentration of, carbon dioxide ; I urea except in liver and muscle tissue R ‘waste’ 2 3(b)(i) ignore any explanations (mean) percentage saturation of haemoglobin with oxygen (in blood leaving the lungs) decreases ; (mean) haemoglobin concentration in blood increases ; any suitable comparative data quote with altitude in m and mean Hb concentration in g 100 cm–3 or percentage saturation ; 3 Question Answer Marks 3(b)(ii) any three from: 1 more red blood cells ; 2 larger red blood cells ; 3 more haemoglobin per red blood cell ; 4 more alveoli / larger surface area for gas exchange ; A bigger lungs / larger chest volume / broader chest / larger capacity of lungs (total or vital) 5 higher, cardiac output / stroke volume / AW ; A higher blood pressure in pulmonary artery 6 AVP ; 7 AVP ; e.g. higher tidal volume / deeper breaths higher ventilation rate (minute volume) I faster breathing ref. to erythropoietin / EPO, stimulating production of (more) red blood cells more red blood cells through alveolar capillaries per unit time 3
Q4 · In thale cress, Arabidopsis thaliana, most of the stomata are on the lower surface of the…
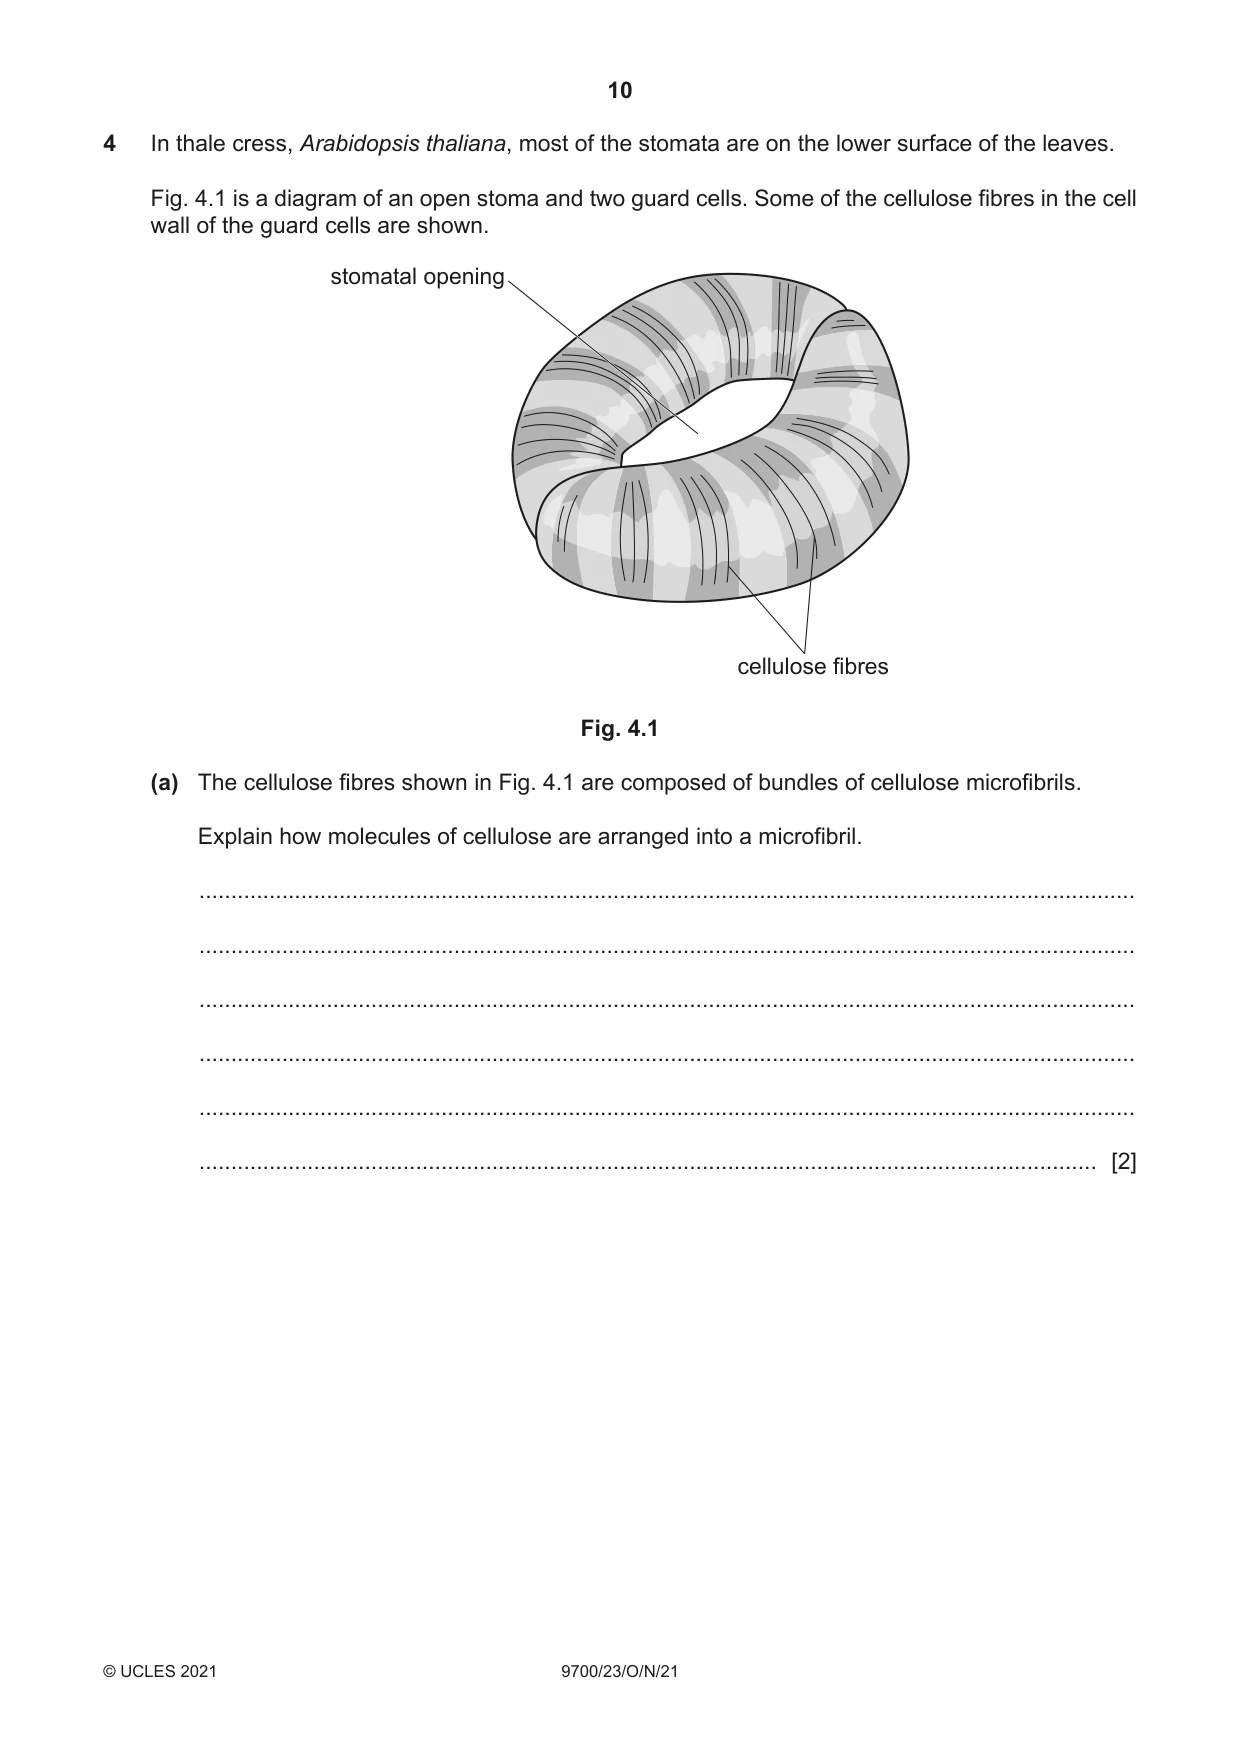
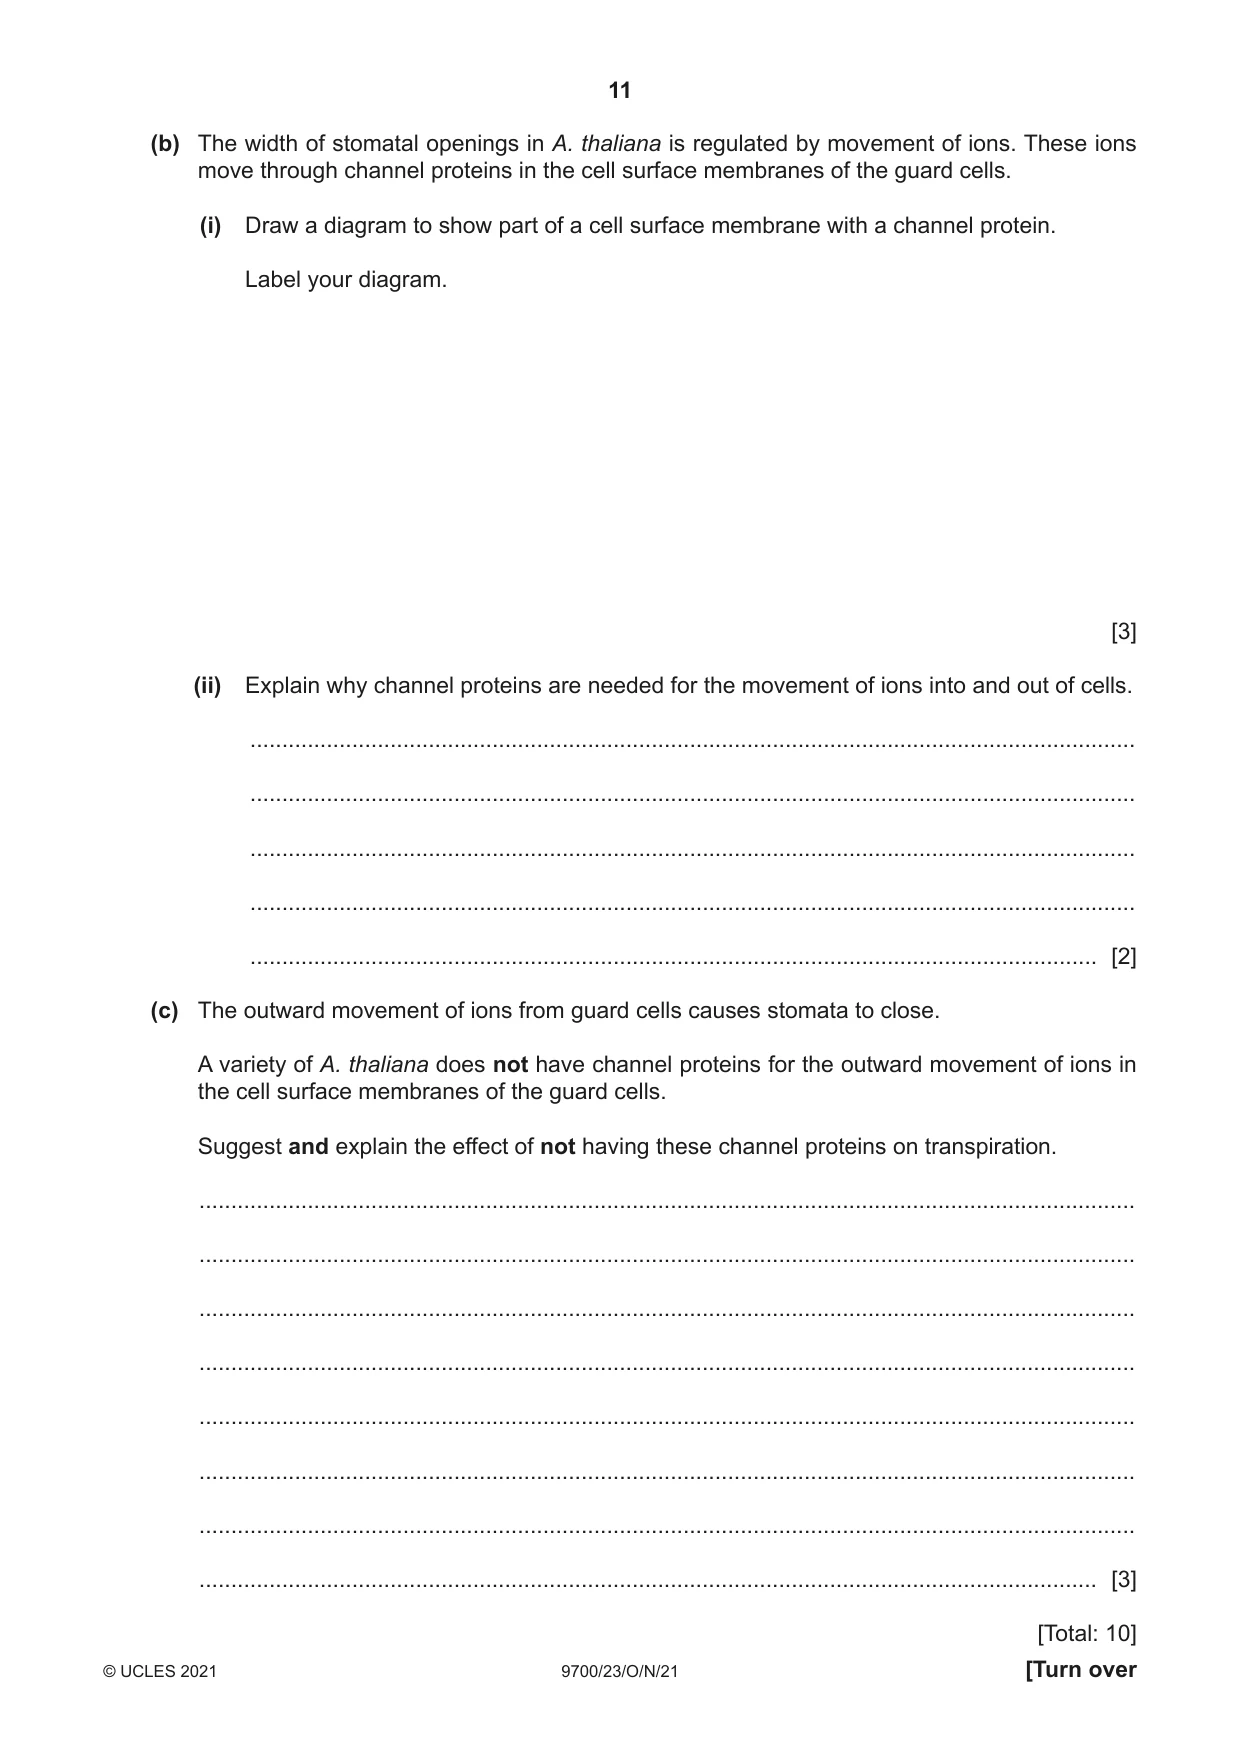
4 In thale cress, Arabidopsis thaliana, most of the stomata are on the lower surface of the leaves. Fig. 4.1 is a diagram of an open stoma and two guard cells. Some of the cellulose fibres in the cell wall of the guard cells are shown. stomatal opening cellulose fibres Fig. 4.1 (a) The cellulose fibres shown in Fig. 4.1 are composed of bundles of cellulose microfibrils. Explain how molecules of cellulose are arranged into a microfibril. ................................................................................................................................................... ................................................................................................................................................... ................................................................................................................................................... ................................................................................................................................................... ................................................................................................................................................... ............................................................................................................................................. [2] (b) The width of stomatal openings in A. thaliana is regulated by movement of ions. These ions move through channel proteins in the cell surface membranes of the guard cells. (i) Draw a diagram to show part of a cell surface membrane with a channel protein. Label your diagram. [3] (ii) Explain why channel proteins are needed for the movement of ions into and out of cells. ........................................................................................................................................... ........................................................................................................................................... ........................................................................................................................................... ........................................................................................................................................... ..................................................................................................................................... [2] (c) The outward movement of ions from guard cells causes stomata to close. A variety of A. thaliana does not have channel proteins for the outward movement of ions in the cell surface membranes of the guard cells. Suggest and explain the effect of not having these channel proteins on transpiration. ................................................................................................................................................... ................................................................................................................................................... ................................................................................................................................................... ................................................................................................................................................... ................................................................................................................................................... ................................................................................................................................................... ................................................................................................................................................... ............................................................................................................................................. [3] [Total: 10]
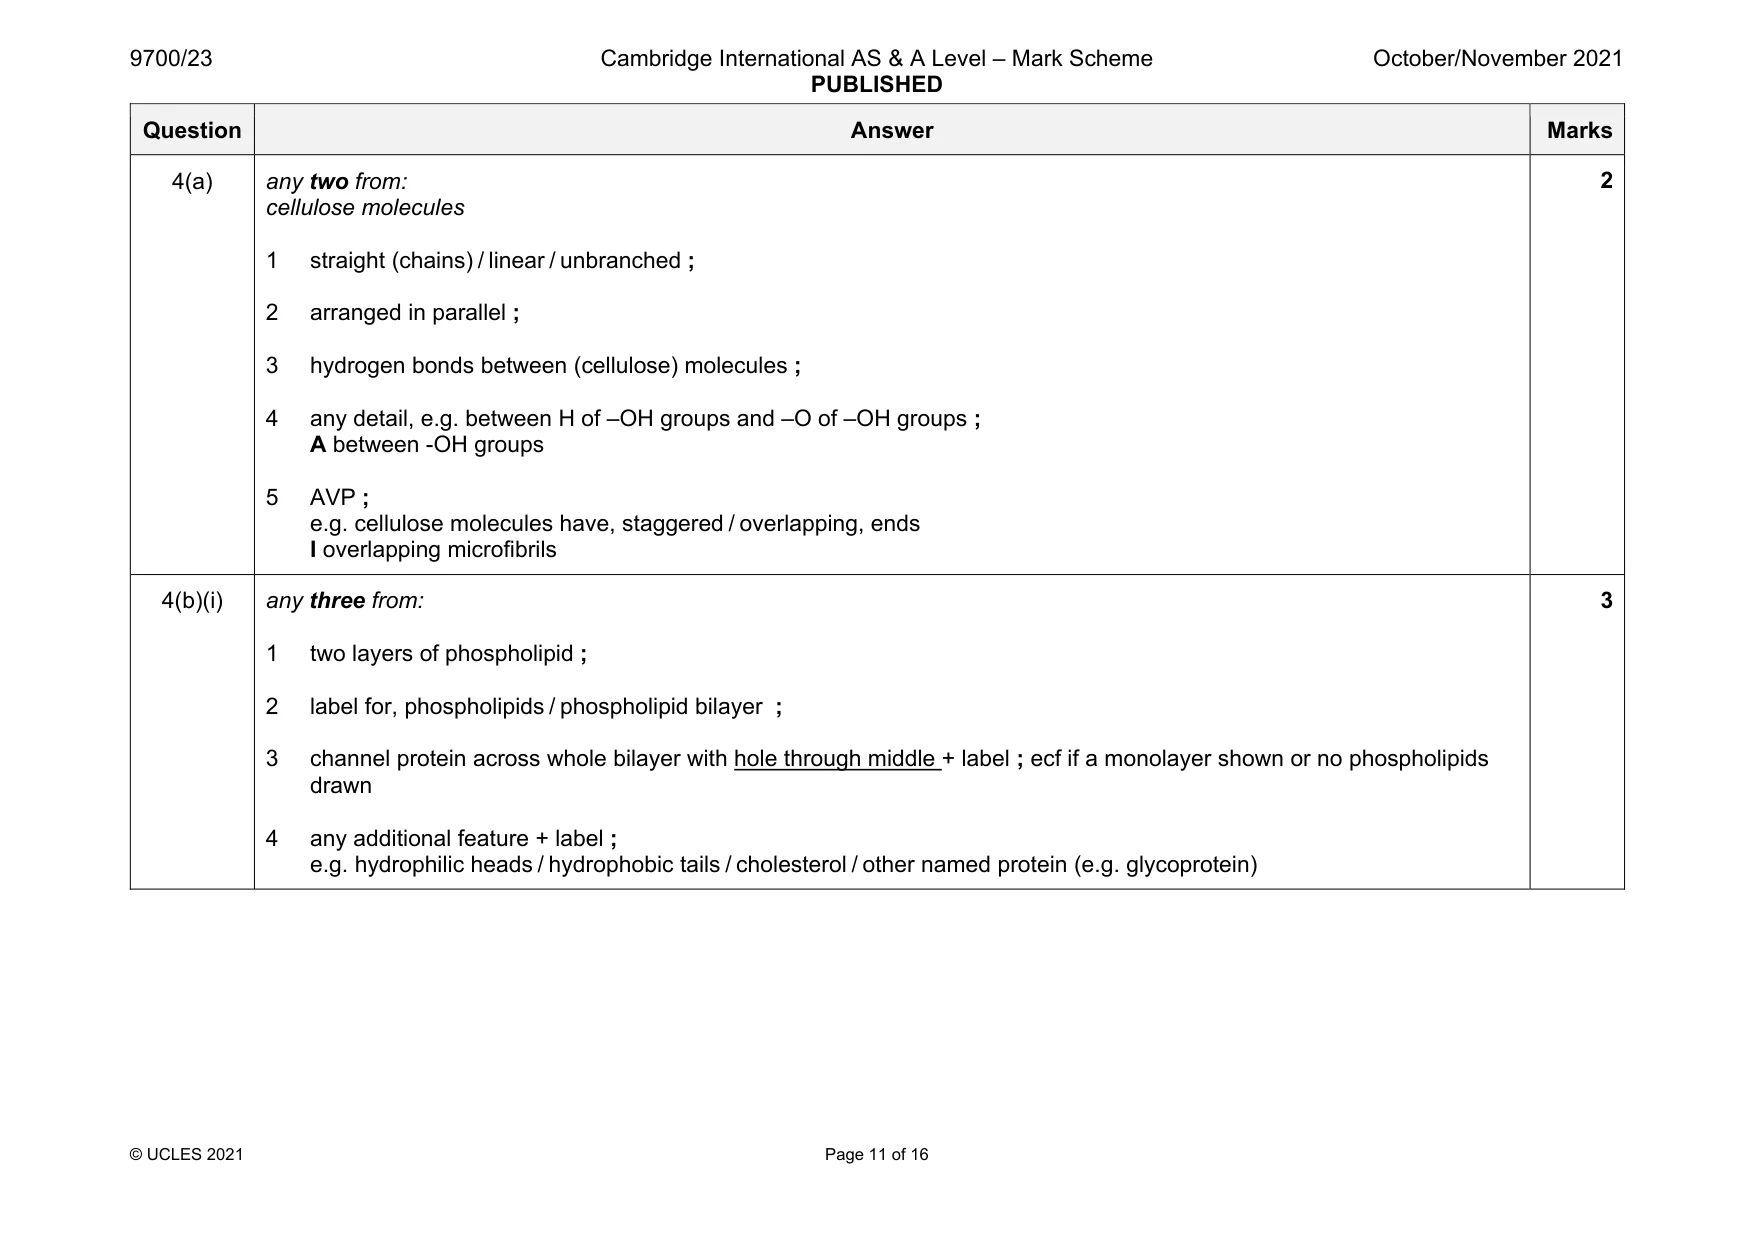
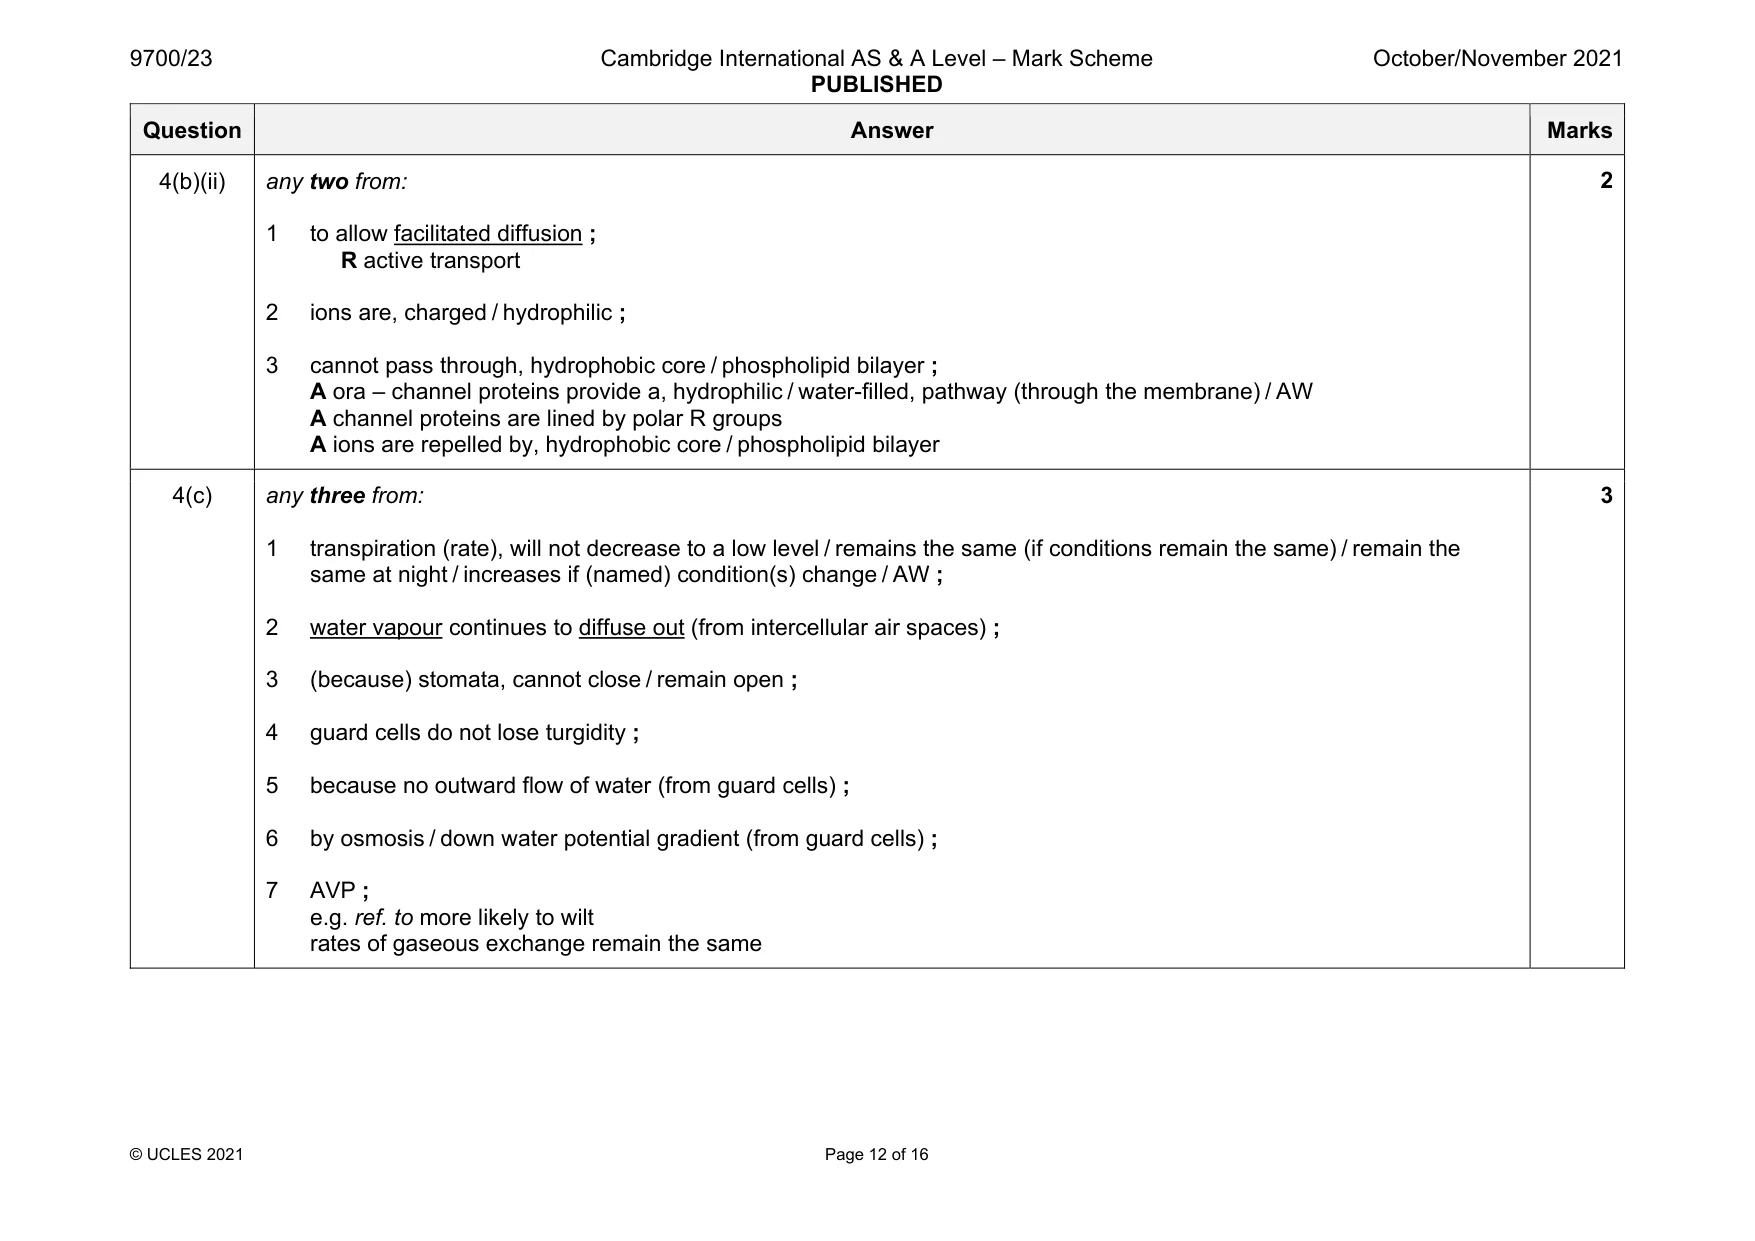
Mark scheme: 4(a) any two from: cellulose molecules 1 straight (chains) / linear / unbranched ; 2 arranged in parallel ; 3 hydrogen bonds between (cellulose) molecules ; 4 any detail, e.g. between H of –OH groups and –O of –OH groups ; A between -OH groups 5 AVP ; e.g. cellulose molecules have, staggered / overlapping, ends I overlapping microfibrils 4(b)(i) any three from: 1 two layers of phospholipid ; 2 label for, phospholipids / phospholipid bilayer ; 3 channel protein across whole bilayer with hole through middle + label ; ecf if a monolayer shown or no phospholipids drawn 4 any additional feature + label ; e.g. hydrophilic heads / hydrophobic tails / cholesterol / other named protein (e.g. glycoprotein) 3 Question Answer Marks 4(b)(ii) any two from: 1 to allow facilitated diffusion ; R active transport 2 ions are, charged / hydrophilic ; 3 cannot pass through, hydrophobic core / phospholipid bilayer ; A ora – channel proteins provide a, hydrophilic / water-filled, pathway (through the membrane) / AW A channel proteins are lined by polar R groups A ions are repelled by, hydrophobic core / phospholipid bilayer 2 4(c) any three from: 1 transpiration (rate), will not decrease to a low level / remains the same (if conditions remain the same) / remain the same at night / increases if (named) condition(s) change / AW ; 2 water vapour continues to diffuse out (from intercellular air spaces) ; 3 (because) stomata, cannot close / remain open ; 4 guard cells do not lose turgidity ; 5 because no outward flow of water (from guard cells) ; 6 by osmosis / down water potential gradient (from guard cells) ; 7 AVP ; e.g. ref. to more likely to wilt rates of gaseous exchange remain the same 3
Q5 · Measles is a highly infectious disease
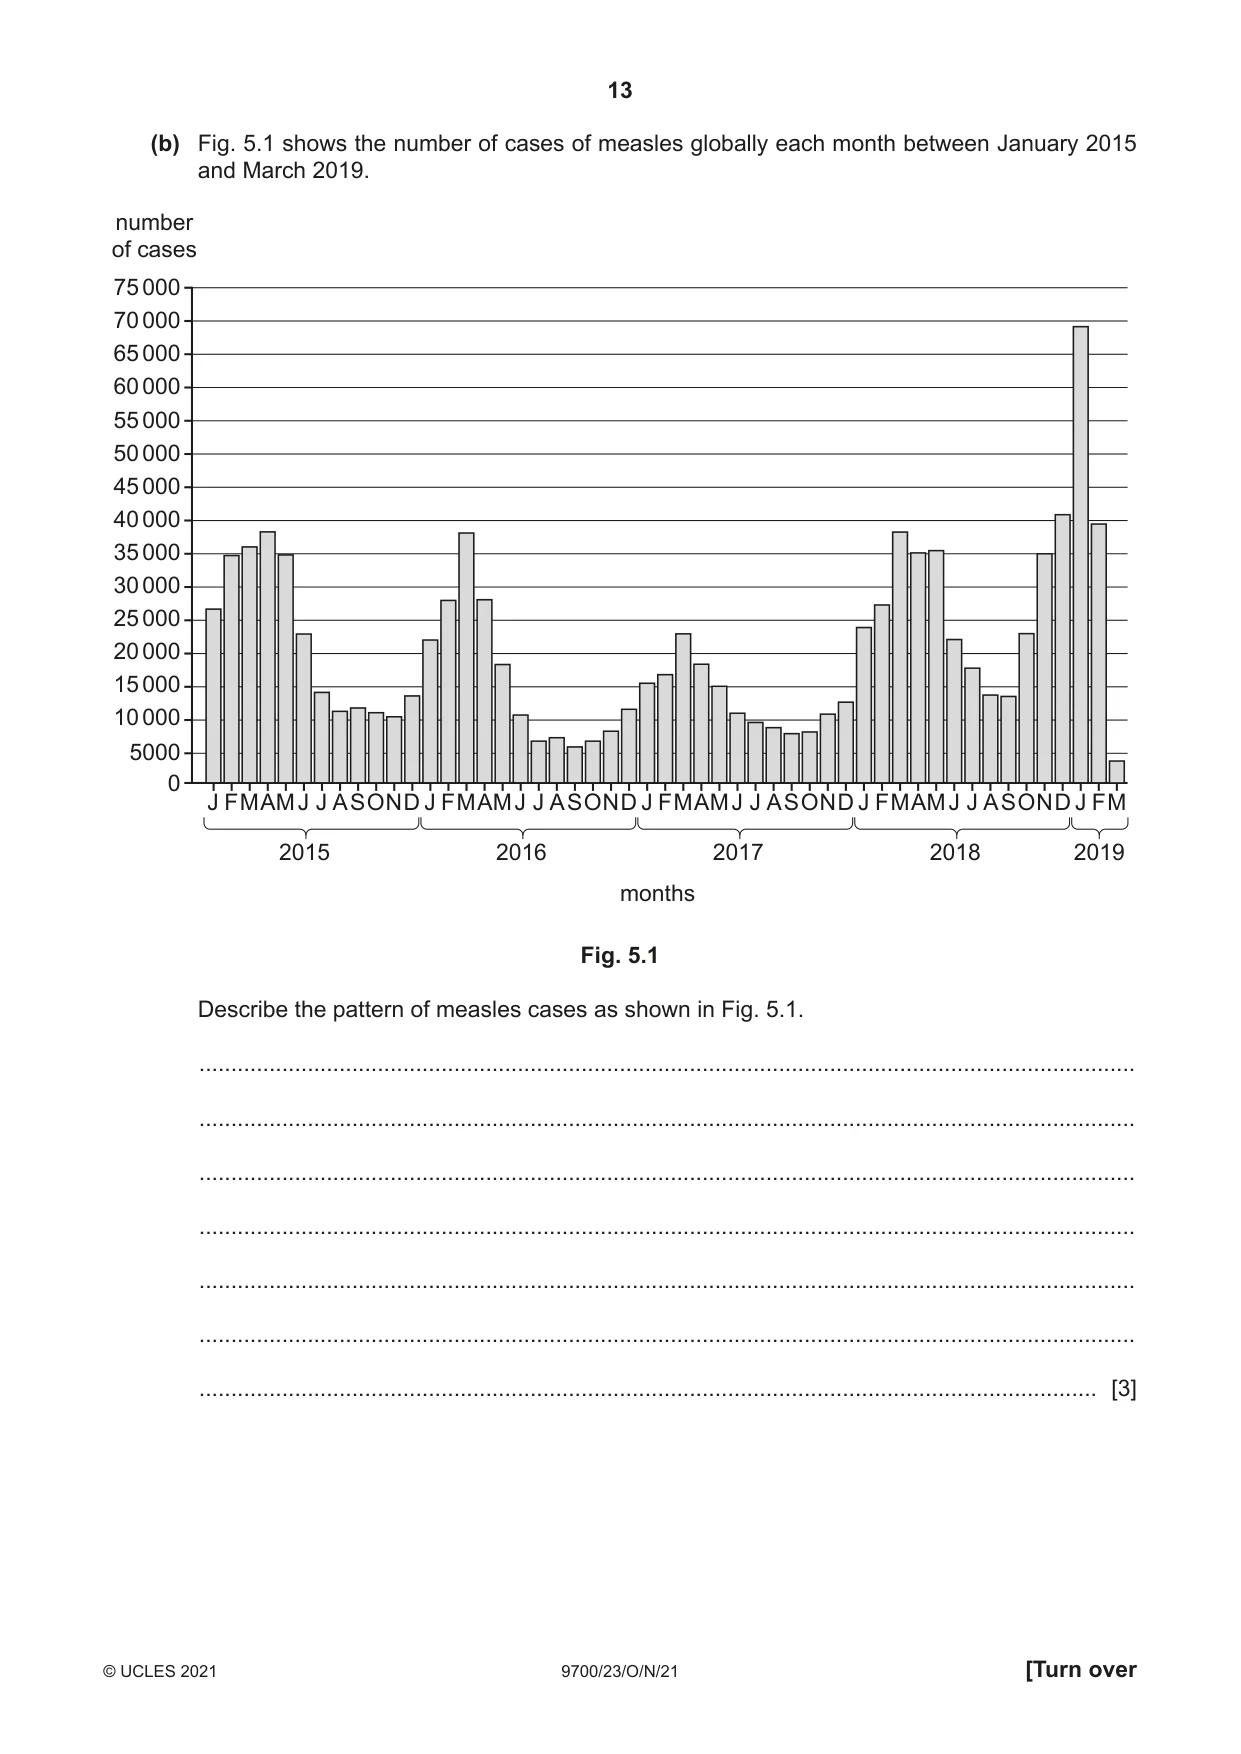
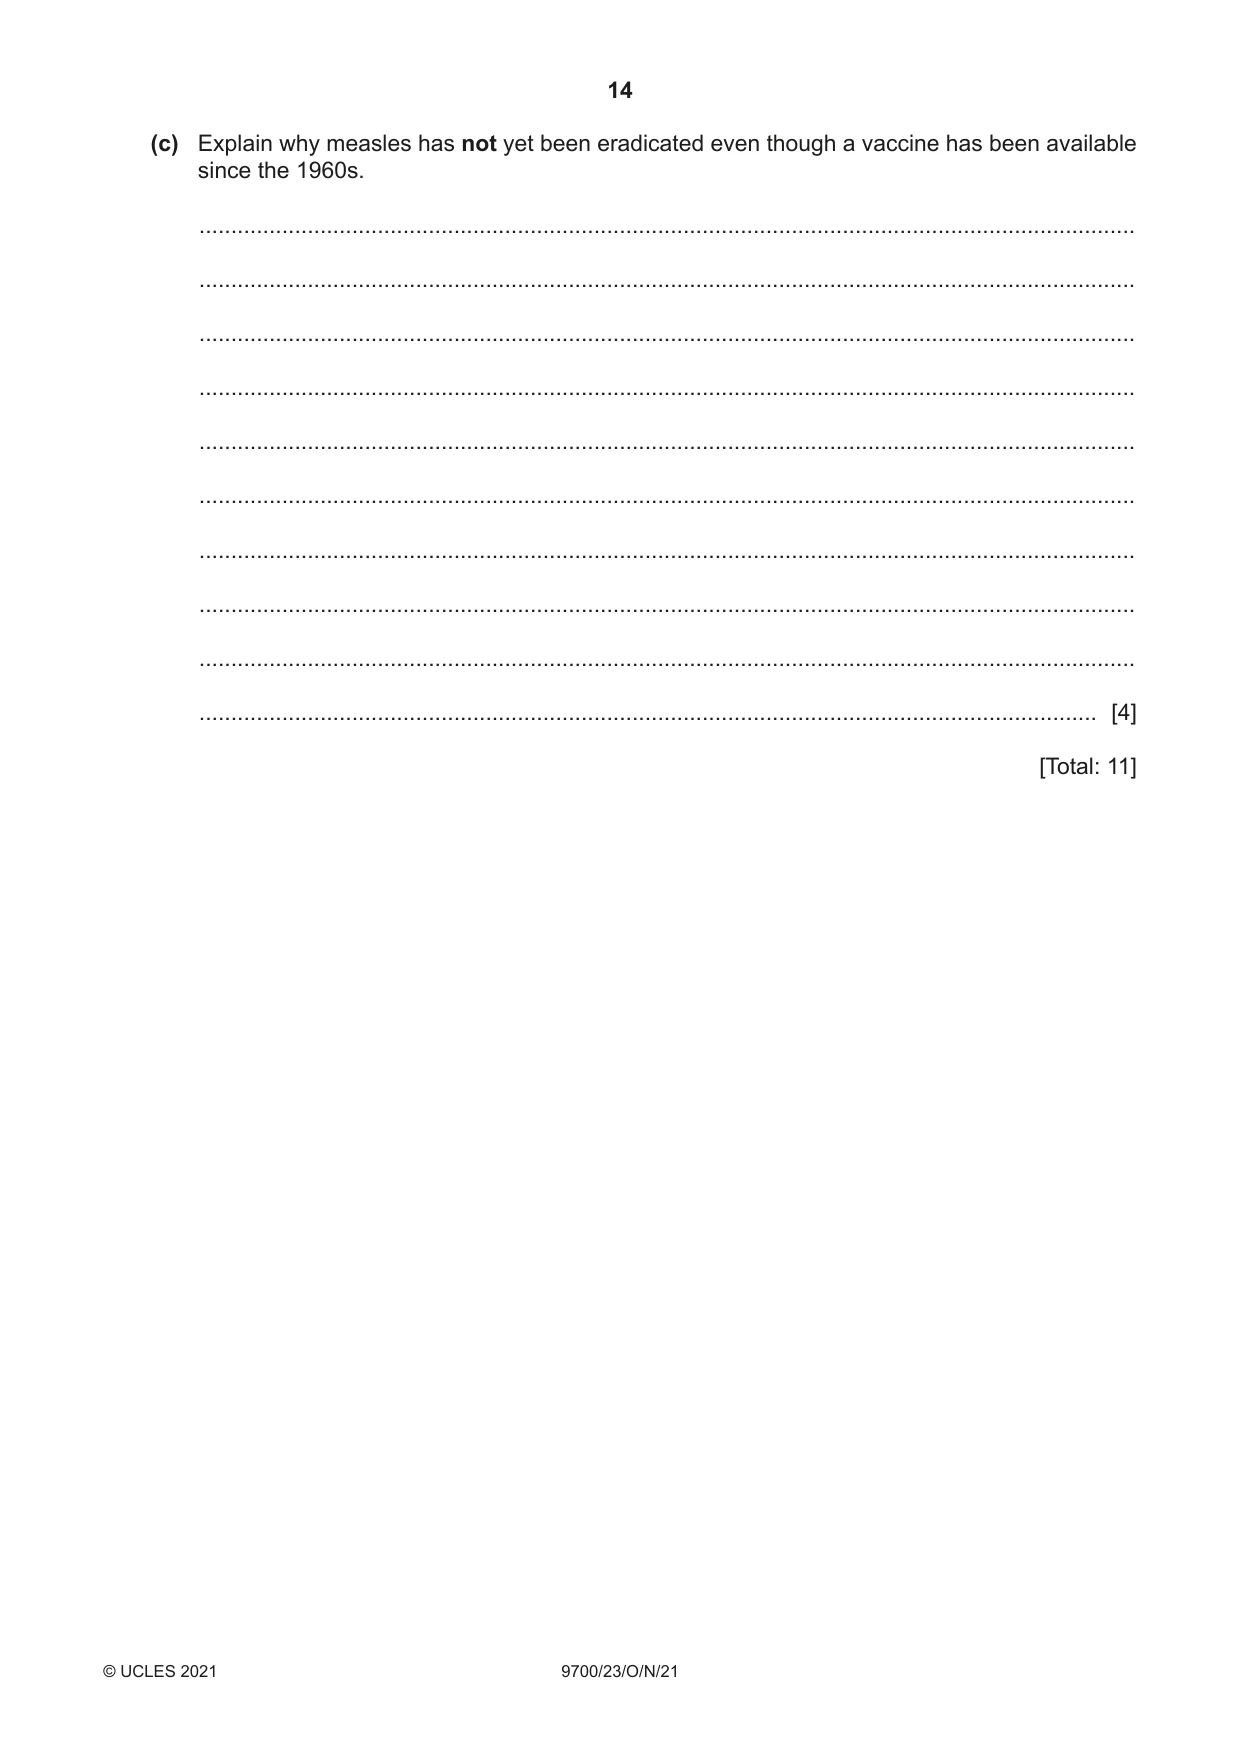
5 Measles is a highly infectious disease. The World Health Organization (WHO) has coordinated a programme for controlling this disease by using vaccination. (a) (i) Name the pathogen that causes measles. ..................................................................................................................................... [1] (ii) Explain how the measles pathogen is transmitted. ........................................................................................................................................... ........................................................................................................................................... ........................................................................................................................................... ........................................................................................................................................... ........................................................................................................................................... ........................................................................................................................................... ..................................................................................................................................... [3] (b) Fig. 5.1 shows the number of cases of measles globally each month between January 2015 and March 2019. number of cases 75 000 70 000 65 000 60 000 55 000 50 000 45 000 40 000 35 000 30 000 25 000 20 000 15 000 10 000 5000 0 J FMAMJ J ASOND J FMAMJ J ASOND J FMAMJ J ASOND J FMAMJ J ASOND J FM 2015 2016 2017 2018 2019 months Fig. 5.1 Describe the pattern of measles cases as shown in Fig. 5.1. ................................................................................................................................................... ................................................................................................................................................... ................................................................................................................................................... ................................................................................................................................................... ................................................................................................................................................... ................................................................................................................................................... ............................................................................................................................................. [3] (c) Explain why measles has not yet been eradicated even though a vaccine has been available since the 1960s. ................................................................................................................................................... ................................................................................................................................................... ................................................................................................................................................... ................................................................................................................................................... ................................................................................................................................................... ................................................................................................................................................... ................................................................................................................................................... ................................................................................................................................................... ................................................................................................................................................... ............................................................................................................................................. [4] [Total: 11]
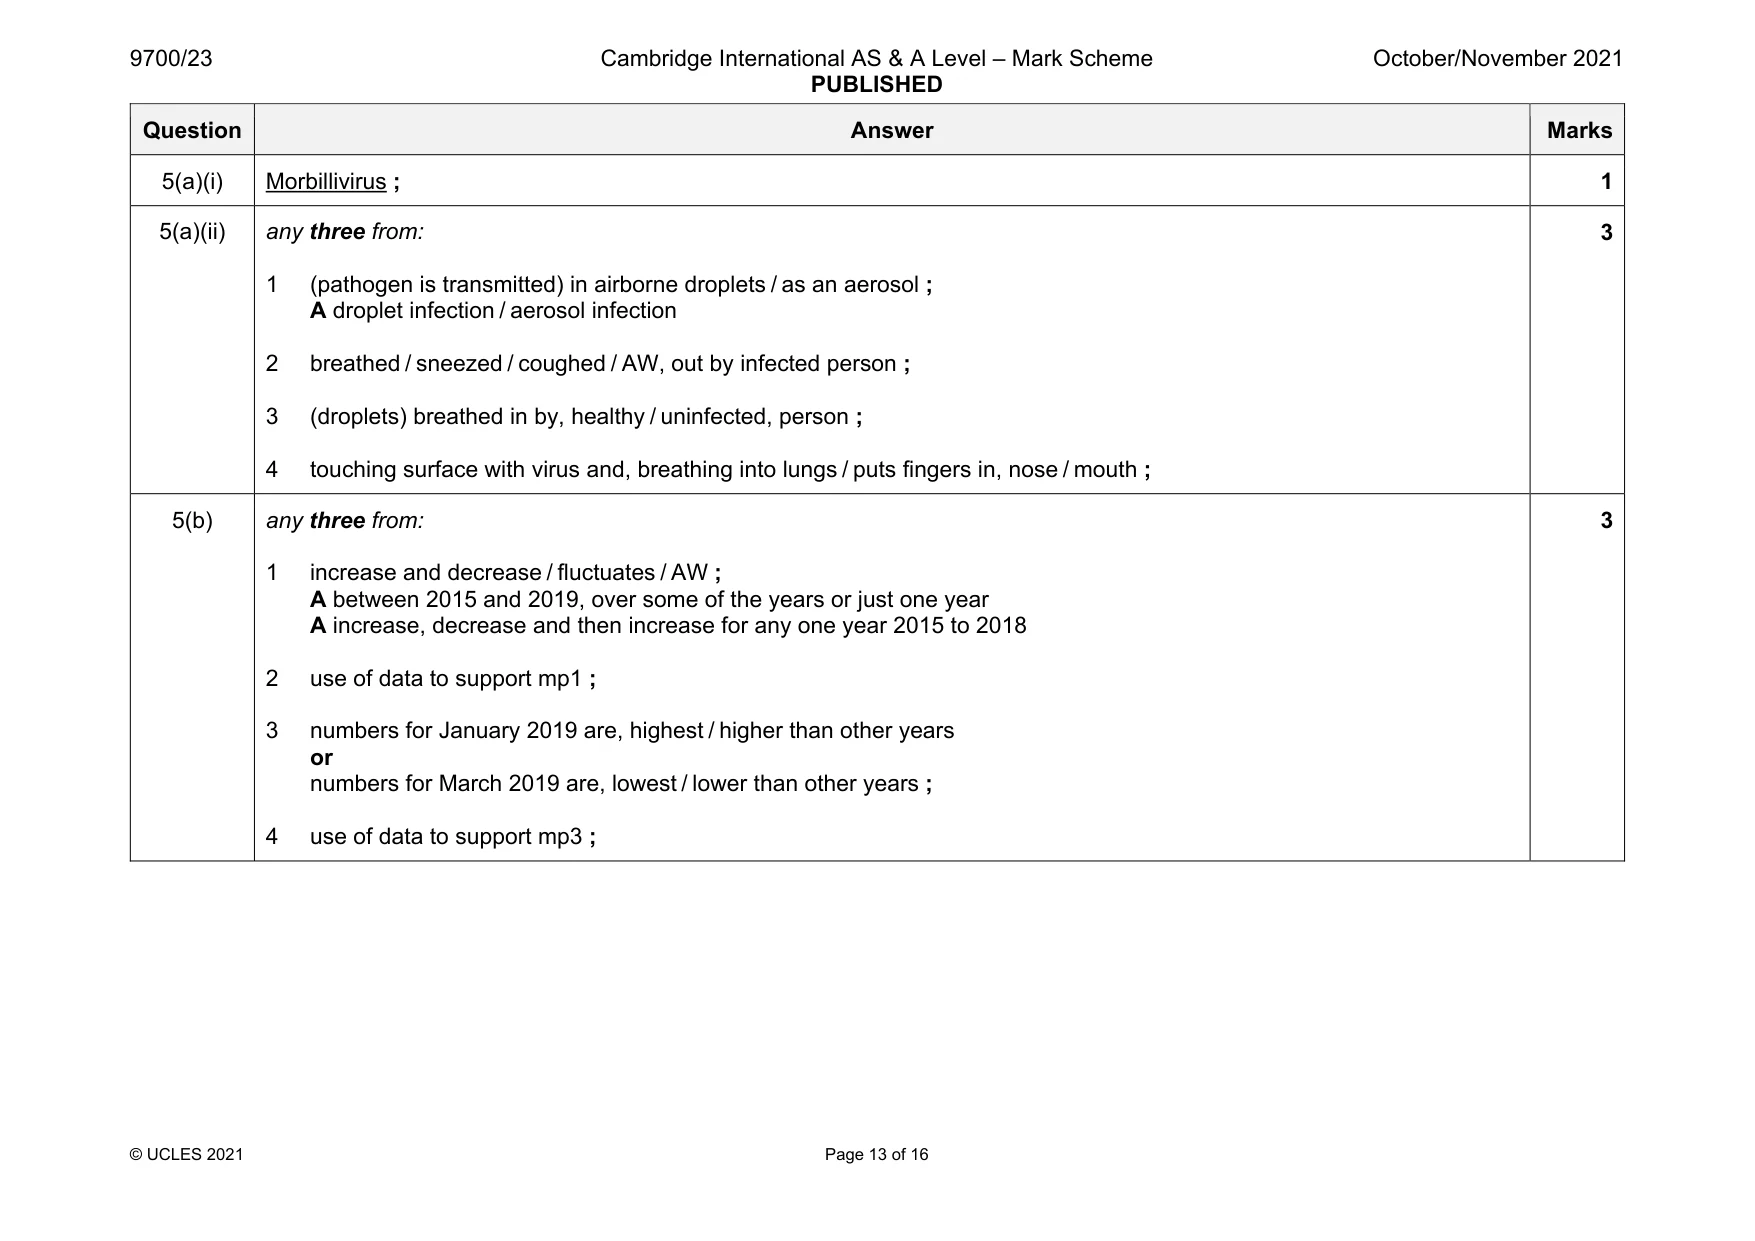
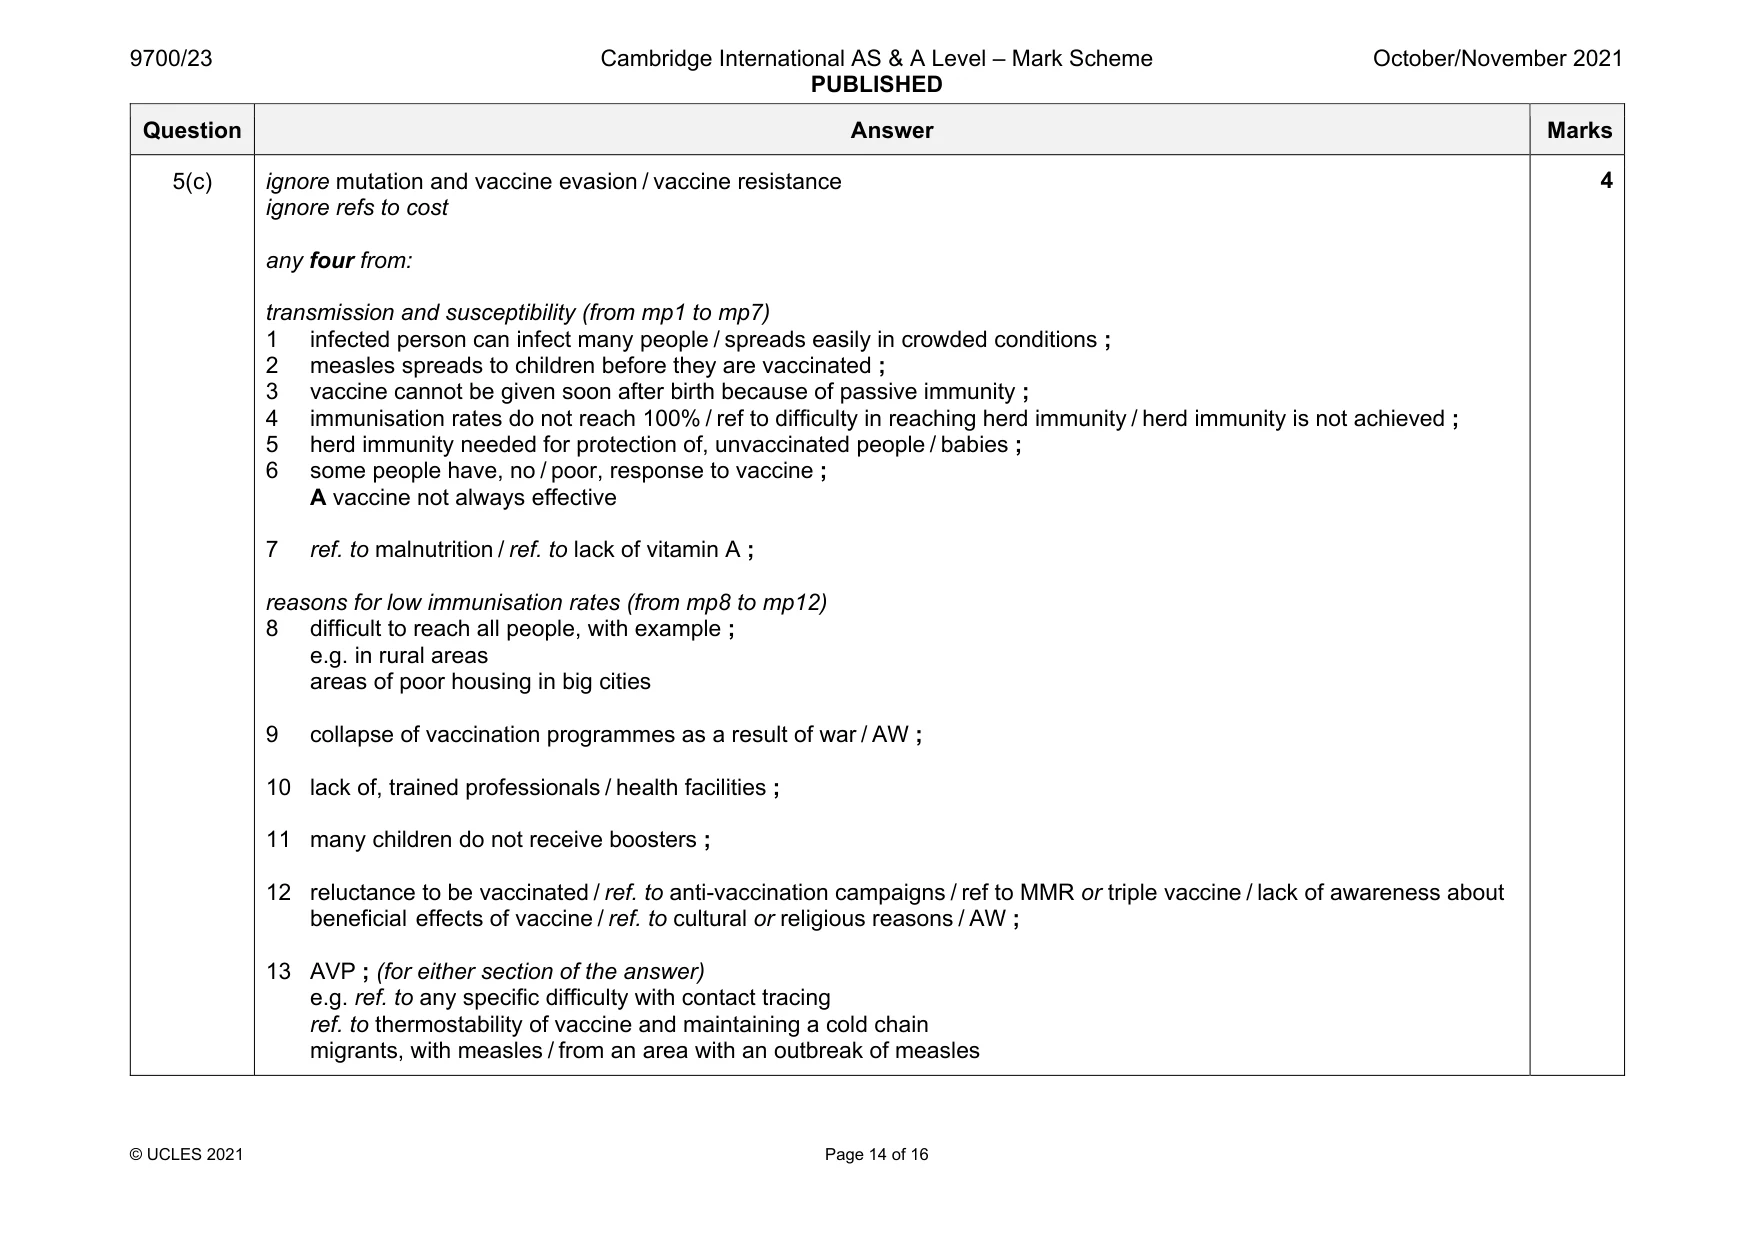
Mark scheme: 5(a)(i) Morbillivirus ; 1 5(a)(ii) any three from: 1 (pathogen is transmitted) in airborne droplets / as an aerosol ; A droplet infection / aerosol infection 2 breathed / sneezed / coughed / AW, out by infected person ; 3 (droplets) breathed in by, healthy / uninfected, person ; 4 touching surface with virus and, breathing into lungs / puts fingers in, nose / mouth ; 3 5(b) any three from: 1 increase and decrease / fluctuates / AW ; A between 2015 and 2019, over some of the years or just one year A increase, decrease and then increase for any one year 2015 to 2018 2 use of data to support mp1 ; 3 numbers for January 2019 are, highest / higher than other years or numbers for March 2019 are, lowest / lower than other years ; 4 use of data to support mp3 ; 3 Question Answer Marks 5(c) ignore mutation and vaccine evasion / vaccine resistance ignore refs to cost any four from: transmission and susceptibility (from mp1 to mp7) 1 infected person can infect many people / spreads easily in crowded conditions ; 2 measles spreads to children before they are vaccinated ; 3 vaccine cannot be given soon after birth because of passive immunity ; 4 immunisation rates do not reach 100% / ref to difficulty in reaching herd immunity / herd immunity is not achieved ; 5 herd immunity needed for protection of, unvaccinated people / babies ; 6 some people have, no / poor, response to vaccine ; A vaccine not always effective 7 ref. to malnutrition / ref. to lack of vitamin A ; reasons for low immunisation rates (from mp8 to mp12) 8 difficult to reach all people, with example ; e.g. in rural areas areas of poor housing in big cities 9 collapse of vaccination programmes as a result of war / AW ; 10 lack of, trained professionals / health facilities ; 11 many children do not receive boosters ; 12 reluctance to be vaccinated / ref. to anti-vaccination campaigns / ref to MMR or triple vaccine / lack of awareness about beneficial effects of vaccine / ref. to cultural or religious reasons / AW ; 13 AVP ; (for either section of the answer) e.g. ref. to any specific difficulty with contact tracing ref. to thermostability of vaccine and maintaining a cold chain migrants, with measles / from an area with an outbreak of measles 4
Q6 · Table 6.1 compares some of the features of DNA with the protein collagen
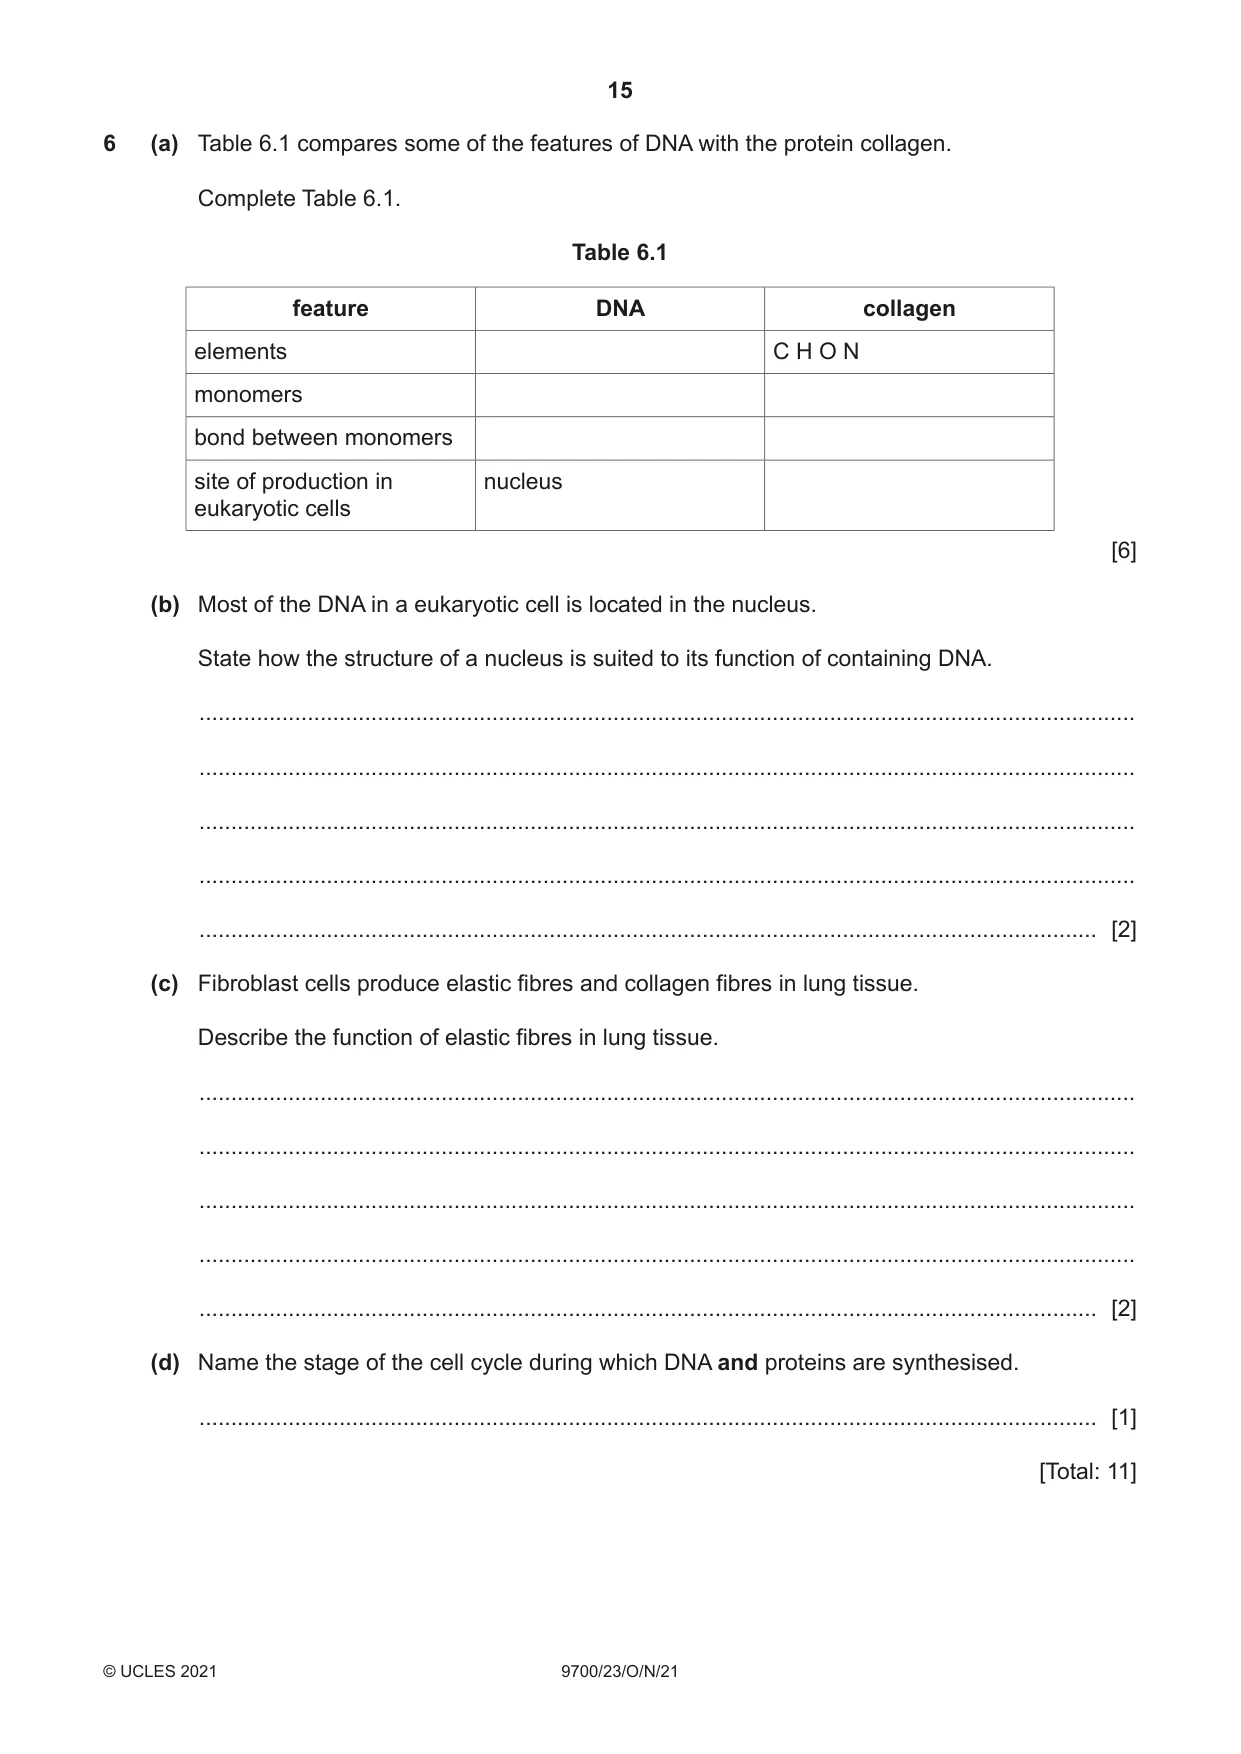
6 (a) Table 6.1 compares some of the features of DNA with the protein collagen. Complete Table 6.1. Table 6.1 feature DNA collagen elements C H O N monomers bond between monomers site of production in nucleus eukaryotic cells [6] (b) Most of the DNA in a eukaryotic cell is located in the nucleus. State how the structure of a nucleus is suited to its function of containing DNA. ................................................................................................................................................... ................................................................................................................................................... ................................................................................................................................................... ................................................................................................................................................... ............................................................................................................................................. [2] (c) Fibroblast cells produce elastic fibres and collagen fibres in lung tissue. Describe the function of elastic fibres in lung tissue. ................................................................................................................................................... ................................................................................................................................................... ................................................................................................................................................... ................................................................................................................................................... ............................................................................................................................................. [2] (d) Name the stage of the cell cycle during which DNA and proteins are synthesised. ............................................................................................................................................. [1] [Total: 11]
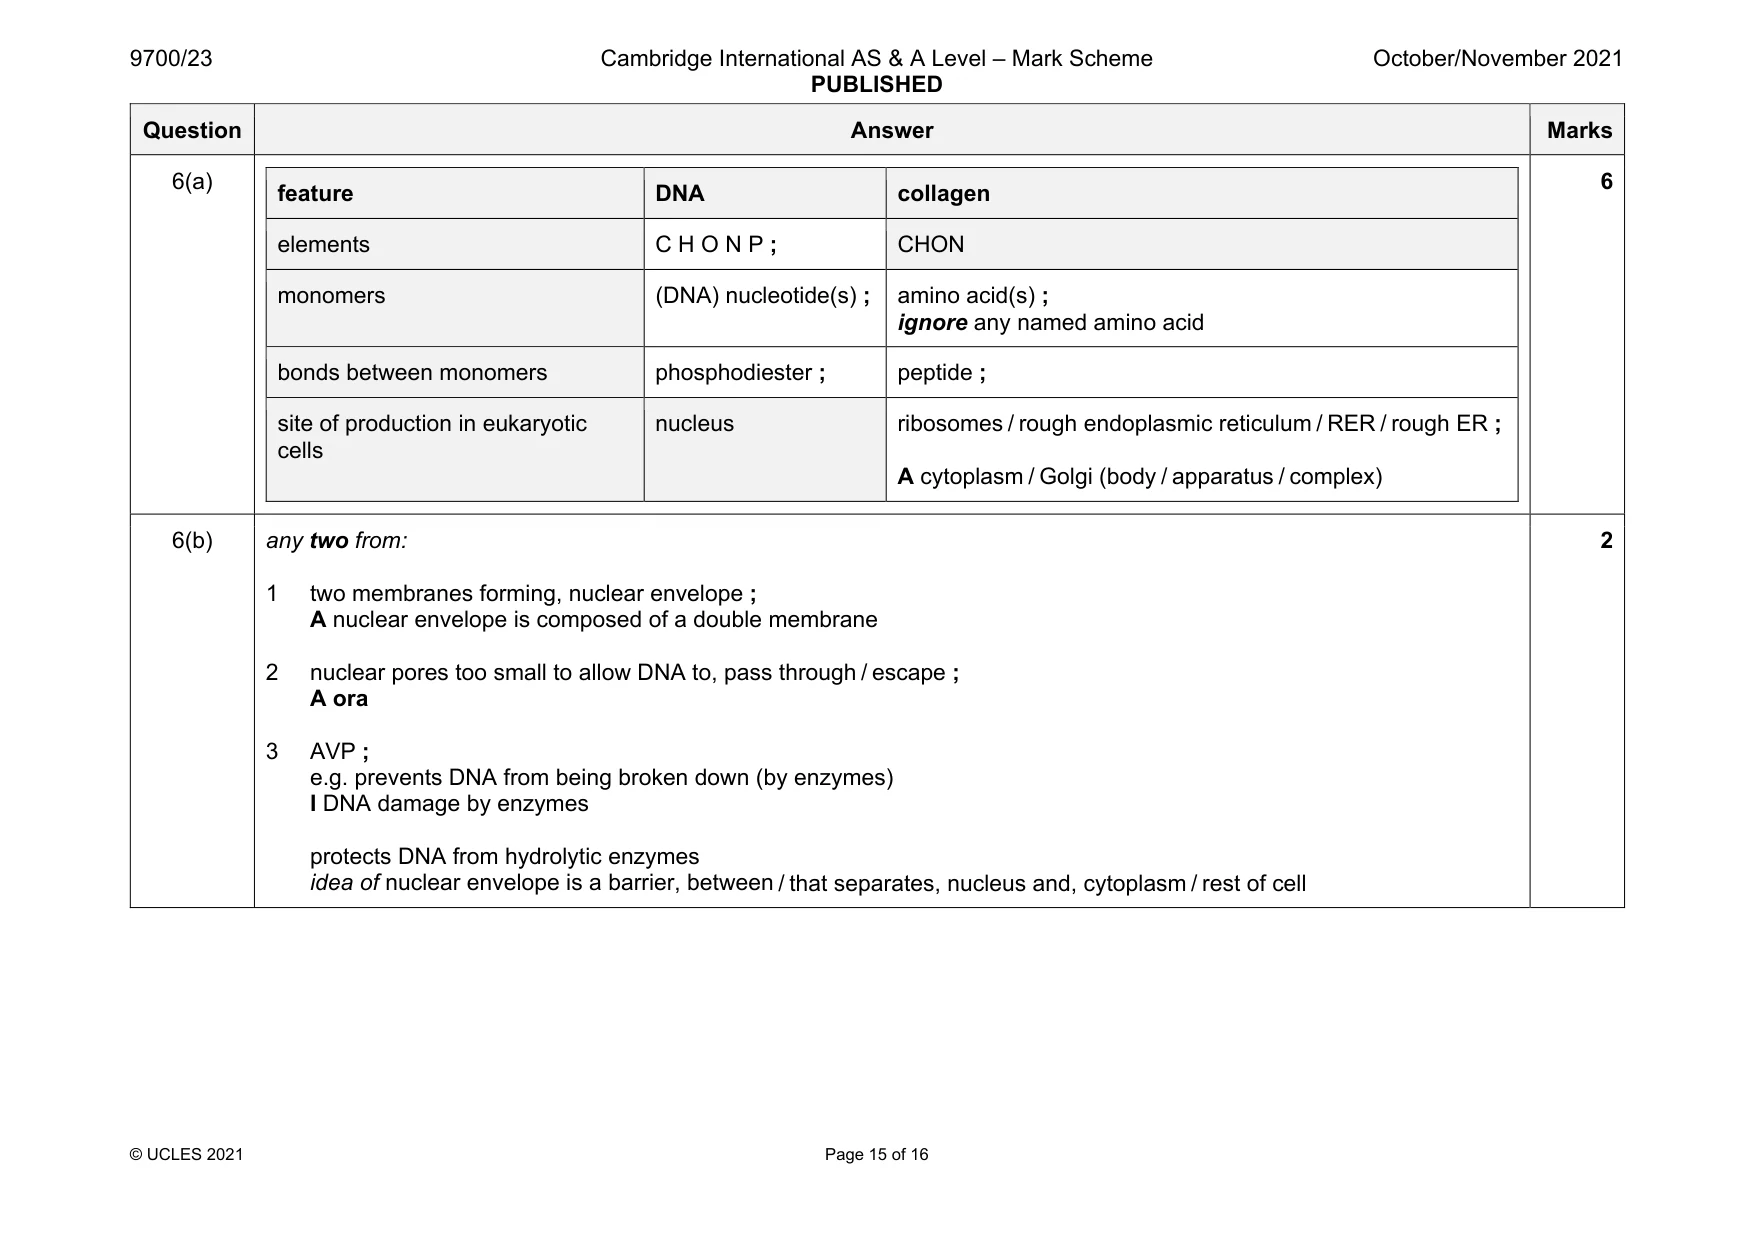
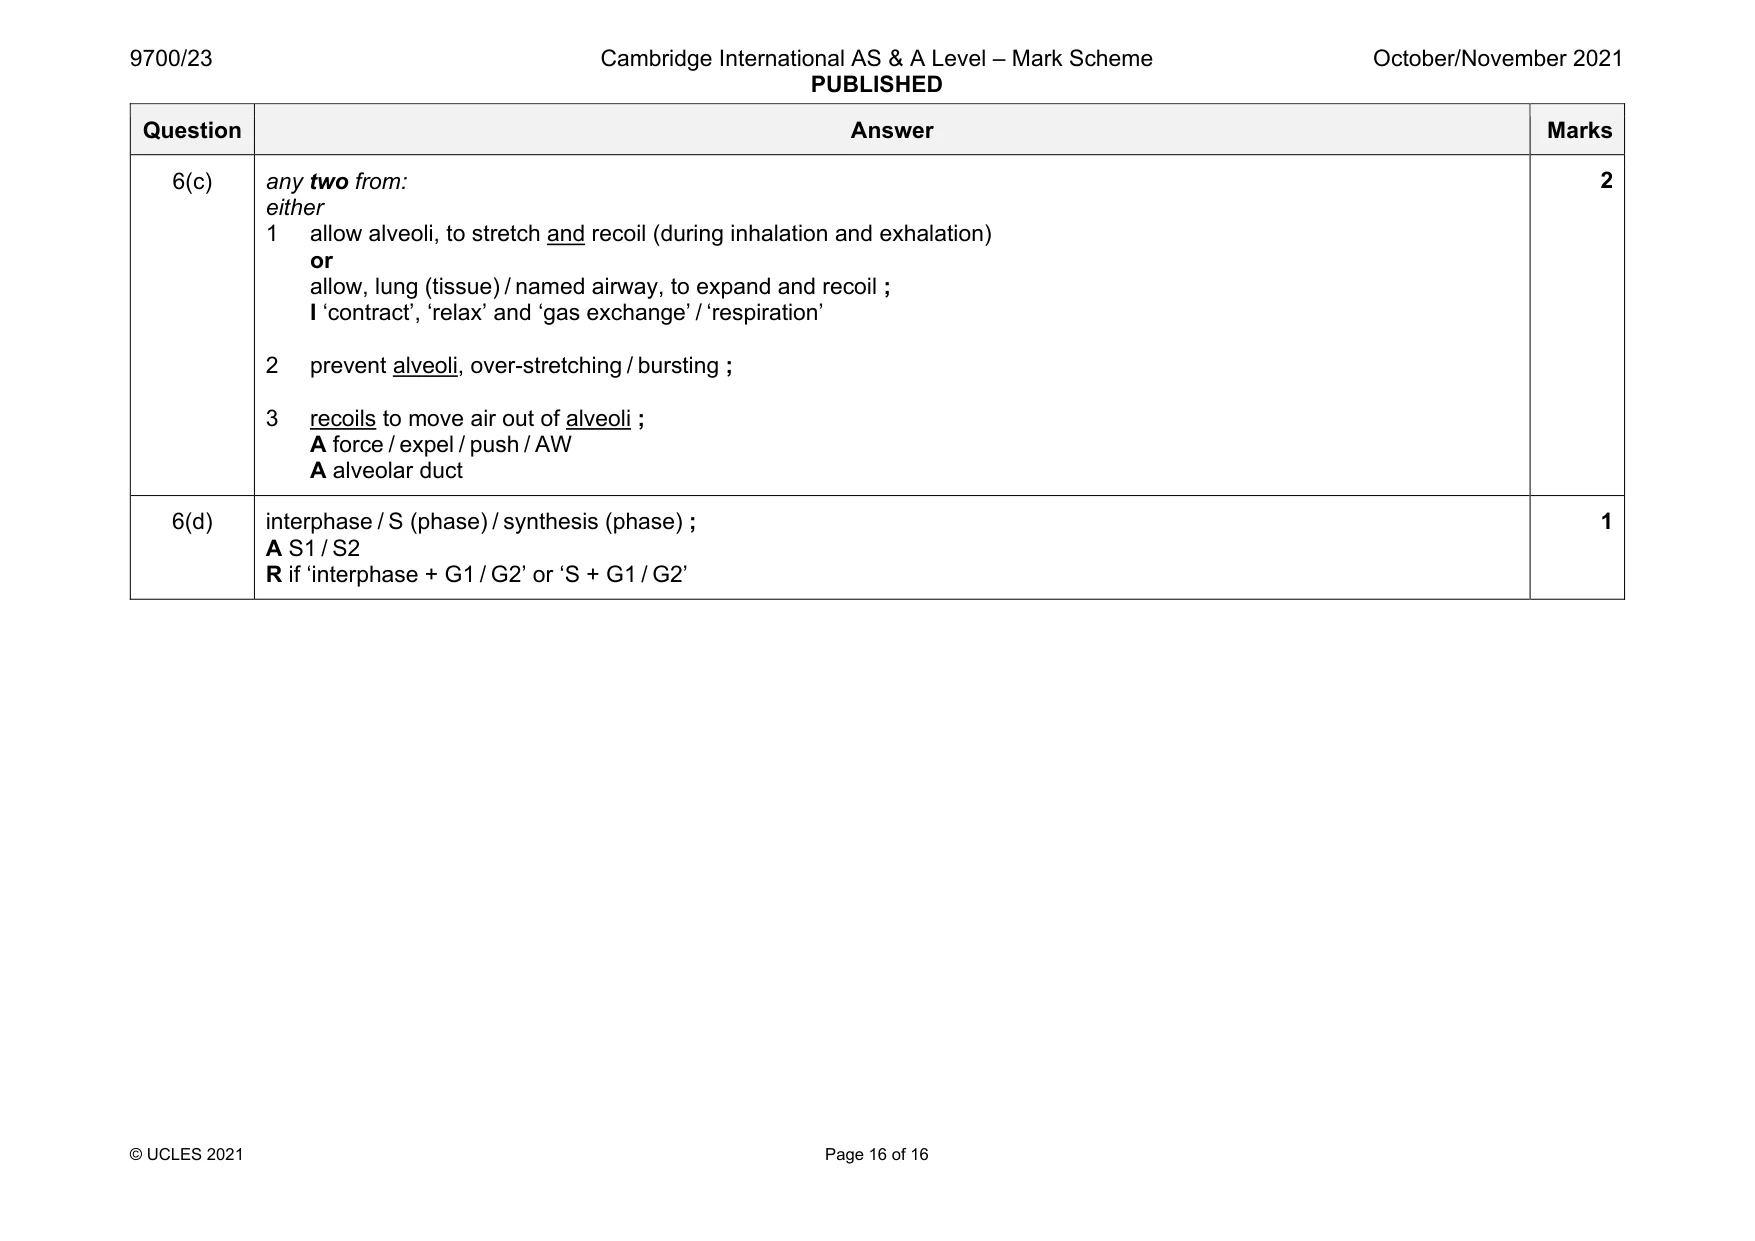
Mark scheme: 6(a) feature DNA collagen elements C H O N P ; CHON monomers (DNA) nucleotide(s) ; amino acid(s) ; ignore any named amino acid bonds between monomers phosphodiester ; peptide ; site of production in eukaryotic cells nucleus ribosomes / rough endoplasmic reticulum / RER / rough ER ; A cytoplasm / Golgi (body / apparatus / complex) 6 6(b) any two from: 1 two membranes forming, nuclear envelope ; A nuclear envelope is composed of a double membrane 2 nuclear pores too small to allow DNA to, pass through / escape ; A ora 3 AVP ; e.g. prevents DNA from being broken down (by enzymes) I DNA damage by enzymes protects DNA from hydrolytic enzymes idea of nuclear envelope is a barrier, between / that separates, nucleus and, cytoplasm / rest of cell 2 Question Answer Marks 6(c) any two from: either 1 allow alveoli, to stretch and recoil (during inhalation and exhalation) or allow, lung (tissue) / named airway, to expand and recoil ; I ‘contract’, ‘relax’ and ‘gas exchange’ / ‘respiration’ 2 prevent alveoli, over-stretching / bursting ; 3 recoils to move air out of alveoli ; A force / expel / push / AW A alveolar duct 2 6(d) interphase / S (phase) / synthesis (phase) ; A S1 / S2 R if ‘interphase + G1 / G2’ or ‘S + G1 / G2’ 1
What was in this paper
The subtopics covered by these 6 questions, and how many questions each got. Open one in a new tab to see every Cambridge question on it.
What you needed in this session
Cambridge’s own grade thresholds for 2021 Oct/Nov, Paper 2 · Variant 3. A higher threshold means an easier paper — the bar moves with how the cohort did.