Cambridge A Level Biology 9700 — 2020 May/June Paper 2 · Variant 3
9700/23/M/J/20 · 6 questions · 60 marks · ≈68 min
The question paper and its mark scheme, free to read here and free to download. This is Cambridge’s own paper, exactly as it was sat.
Question paper16 pages

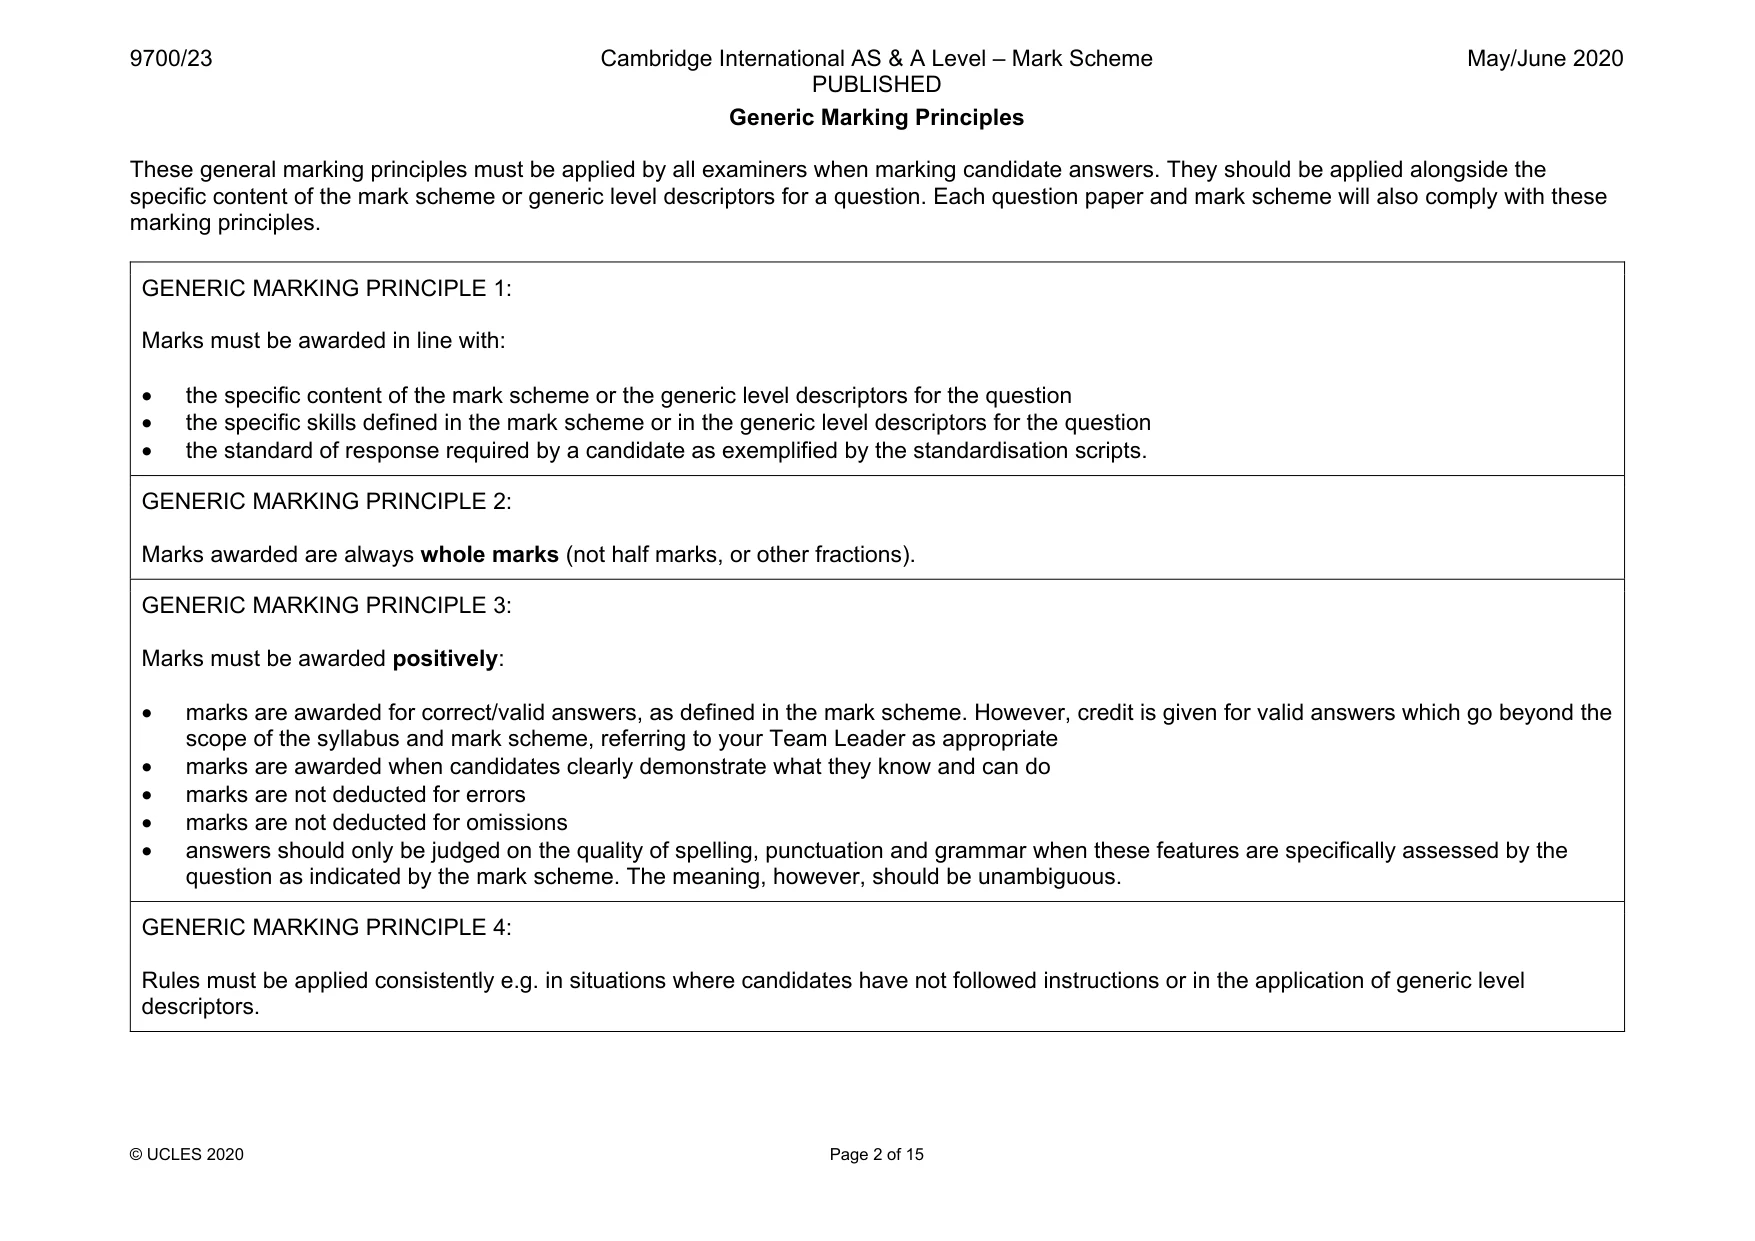
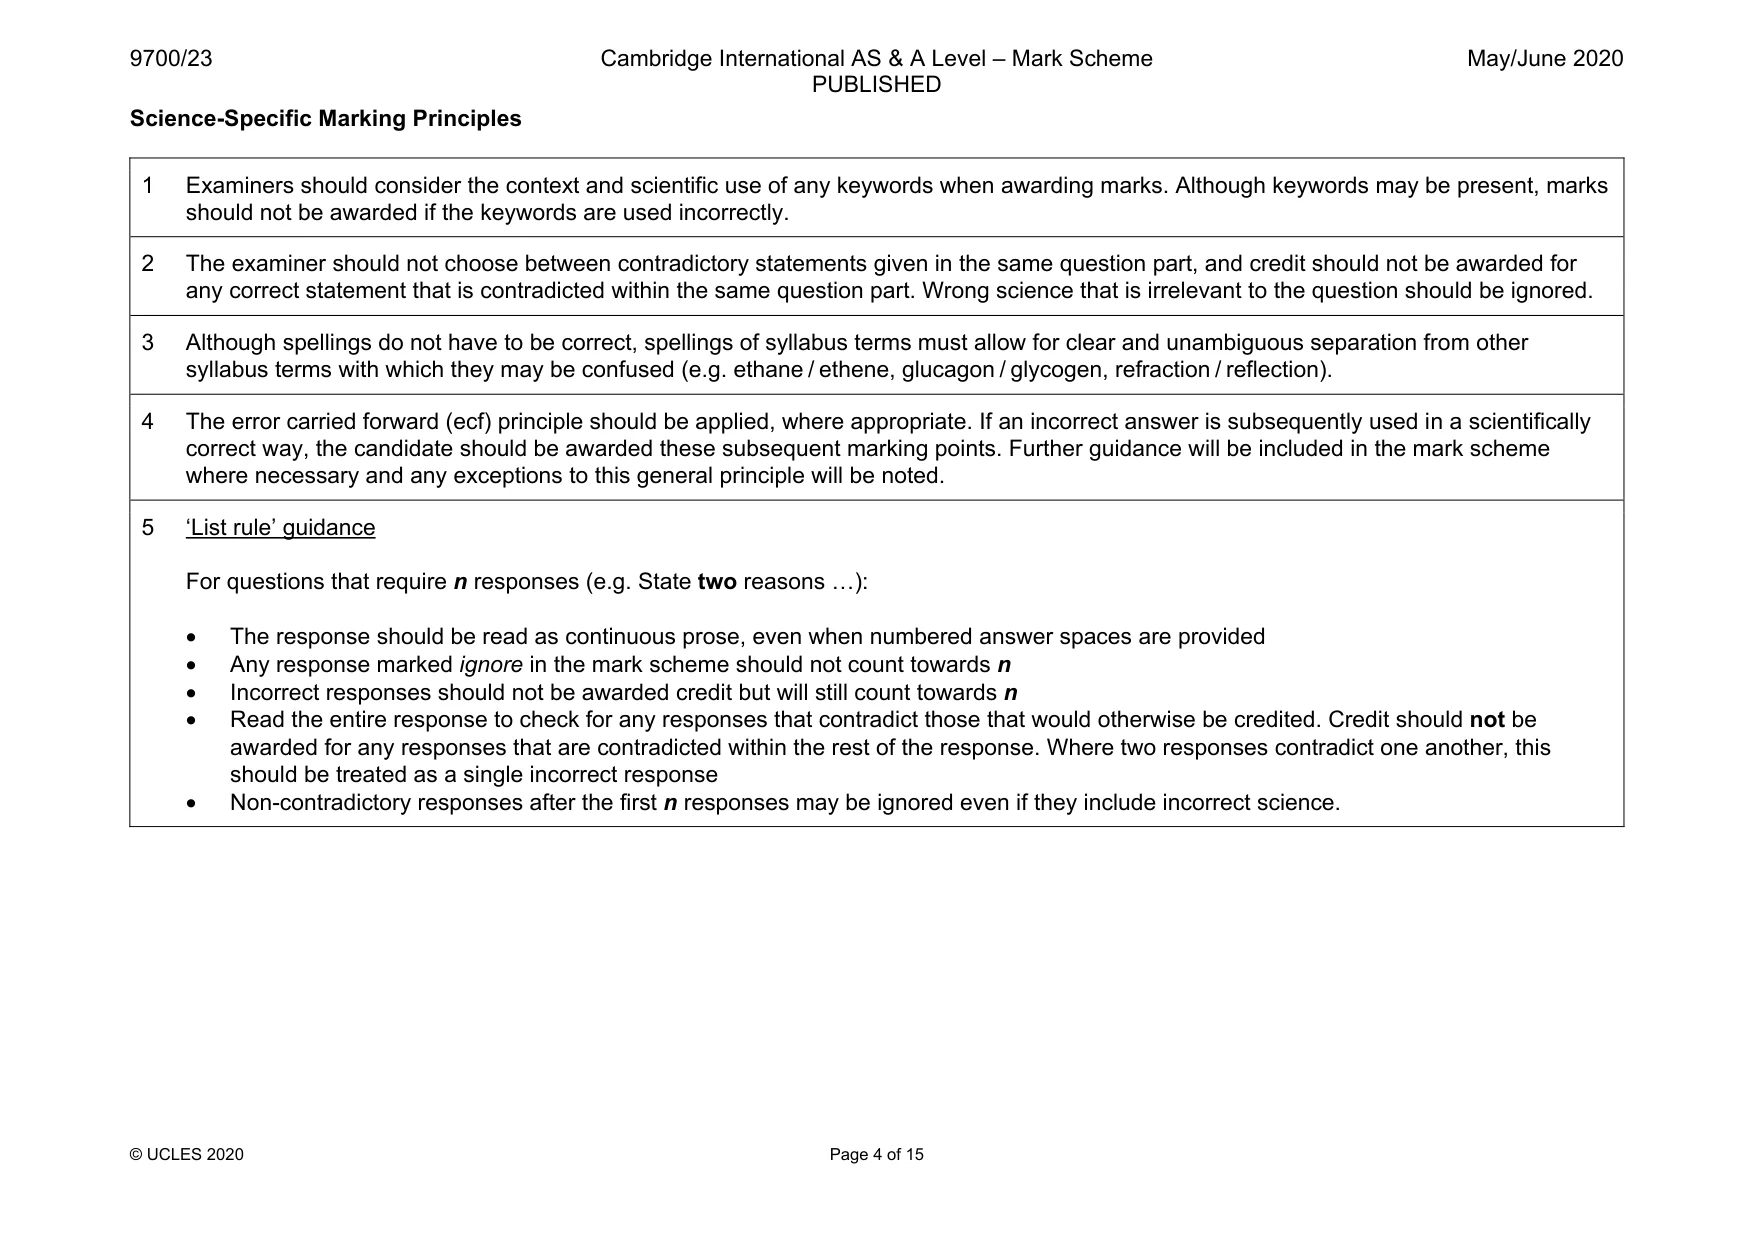
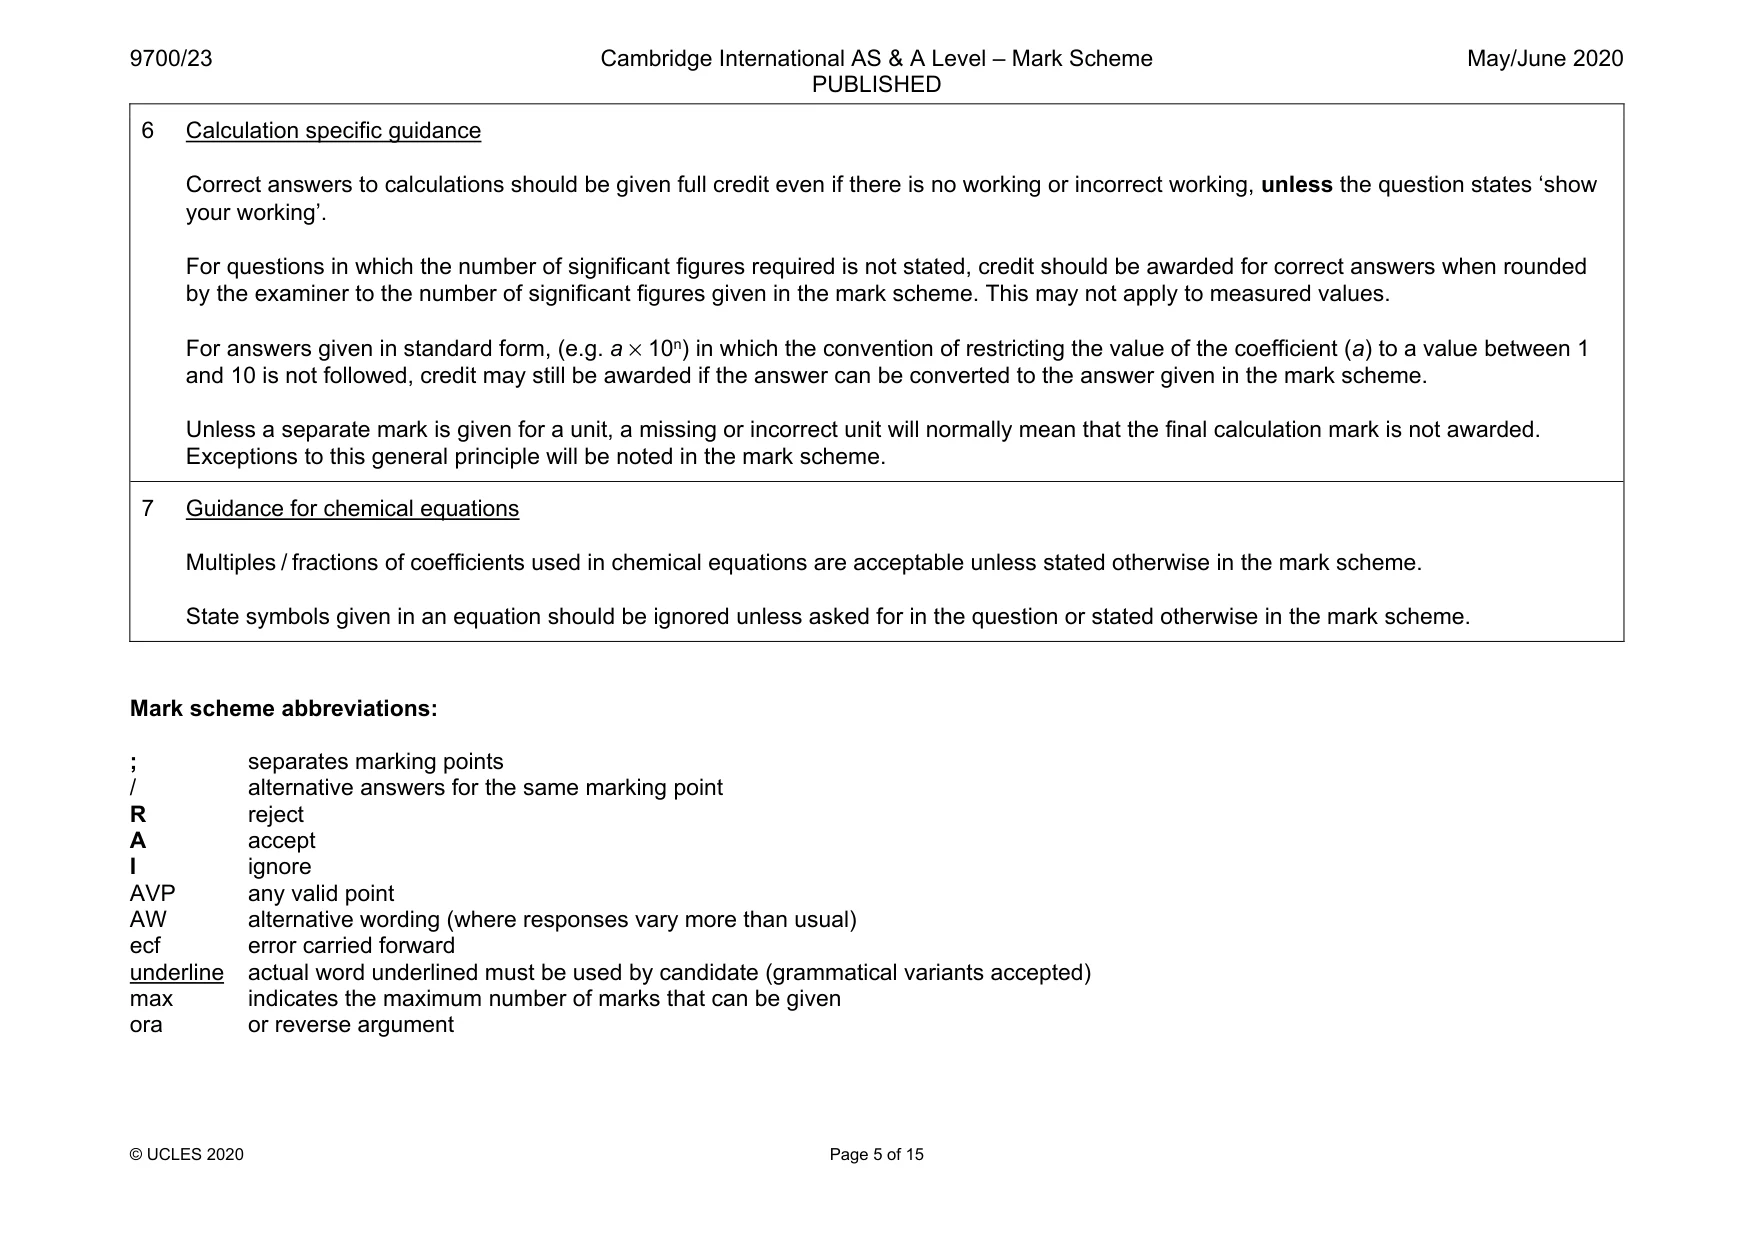
Mark scheme15 pages
Answers below. Sit the paper first if you are practising.
Questions as text
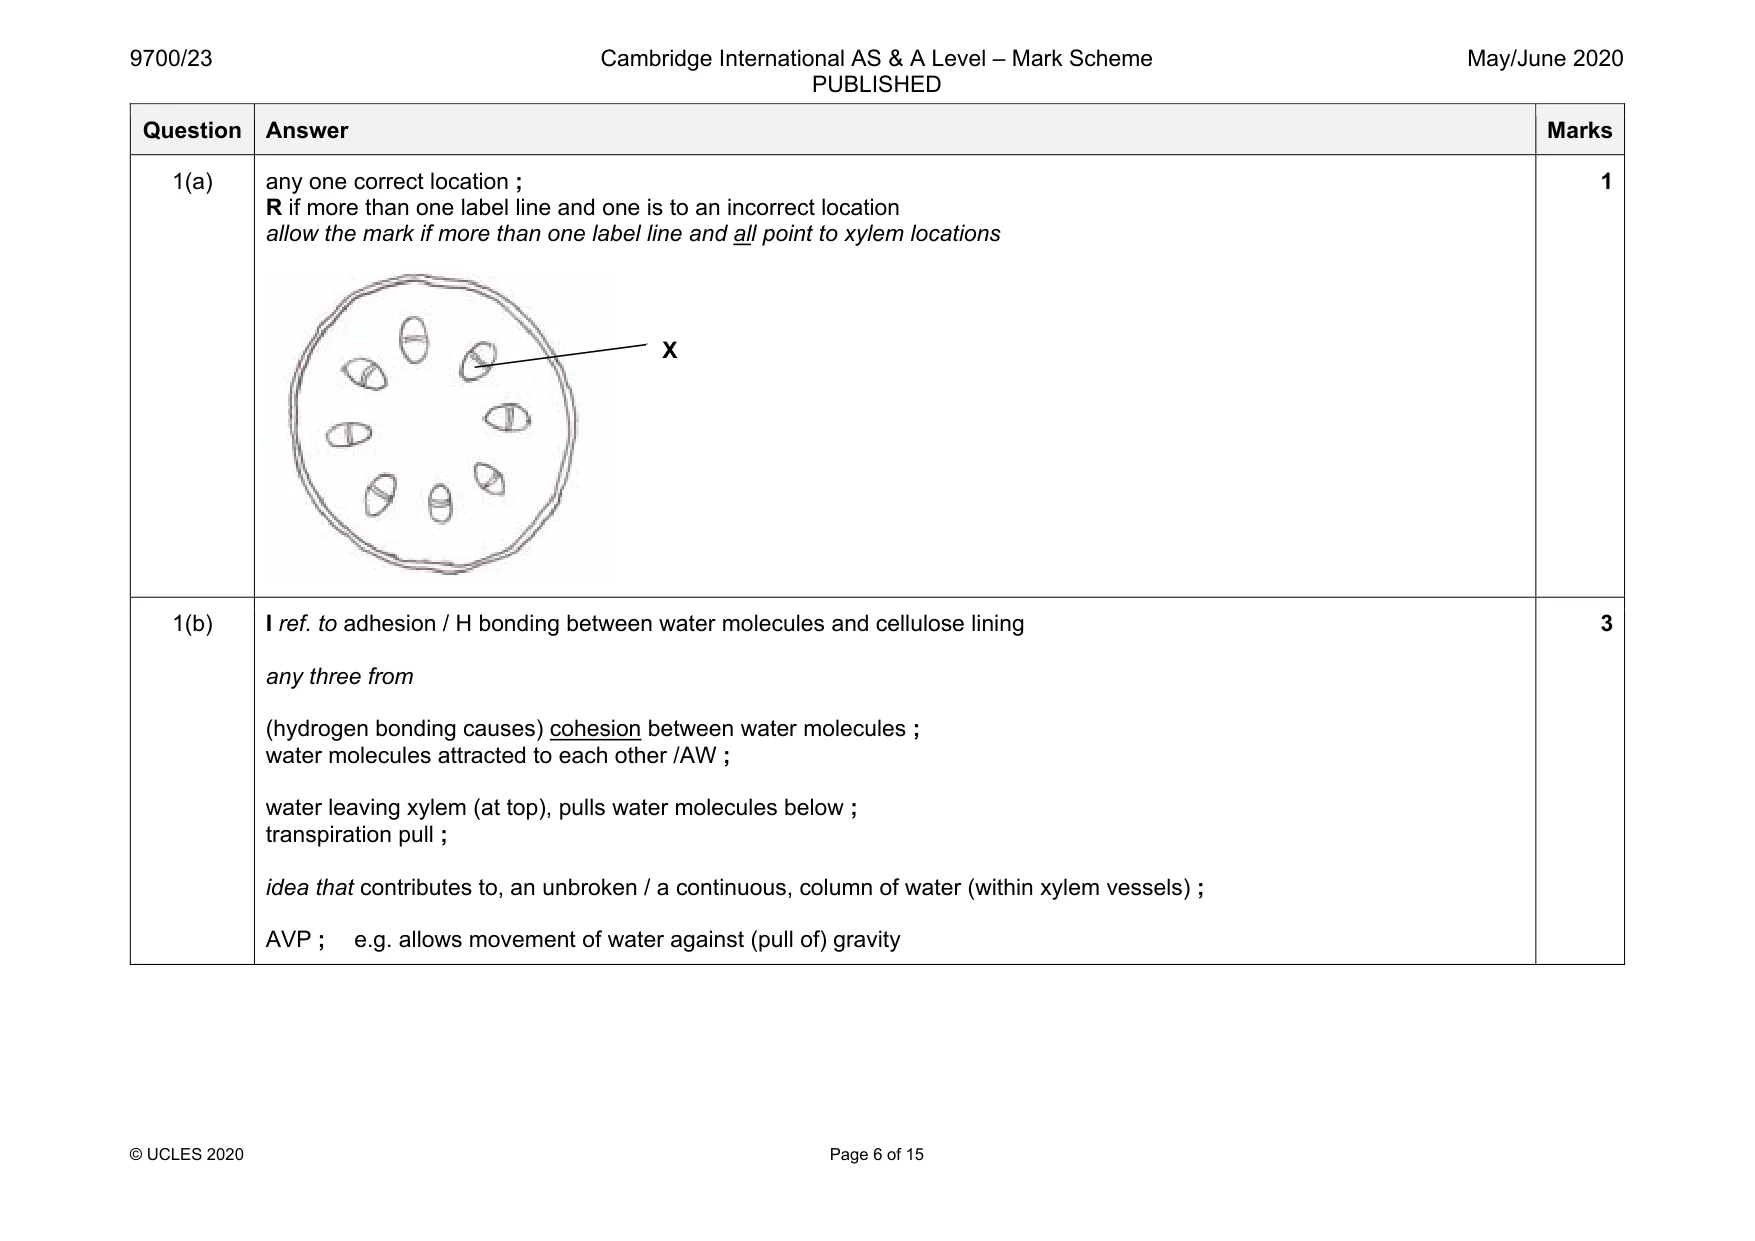
Q1 · Water and mineral ions are transported up the stem of a plant to the leaves within xylem…
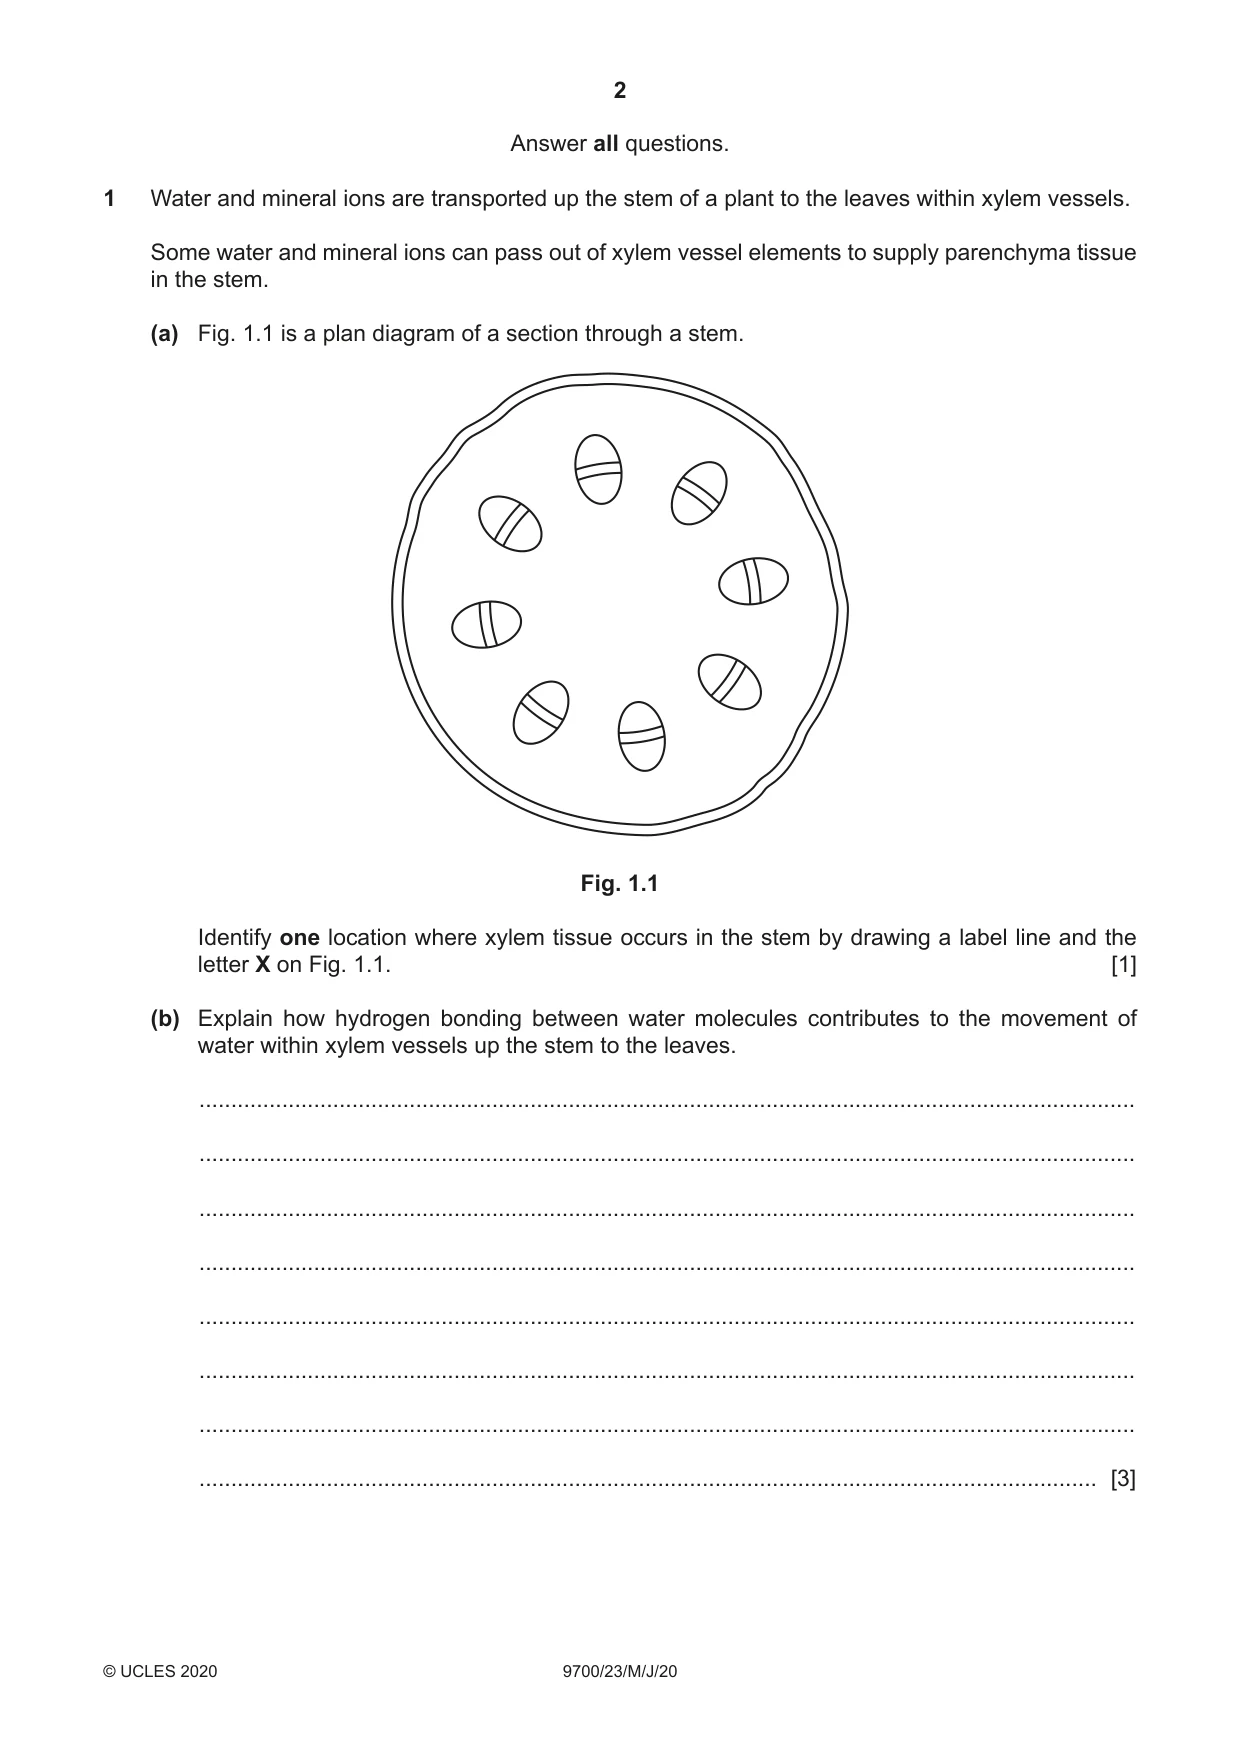
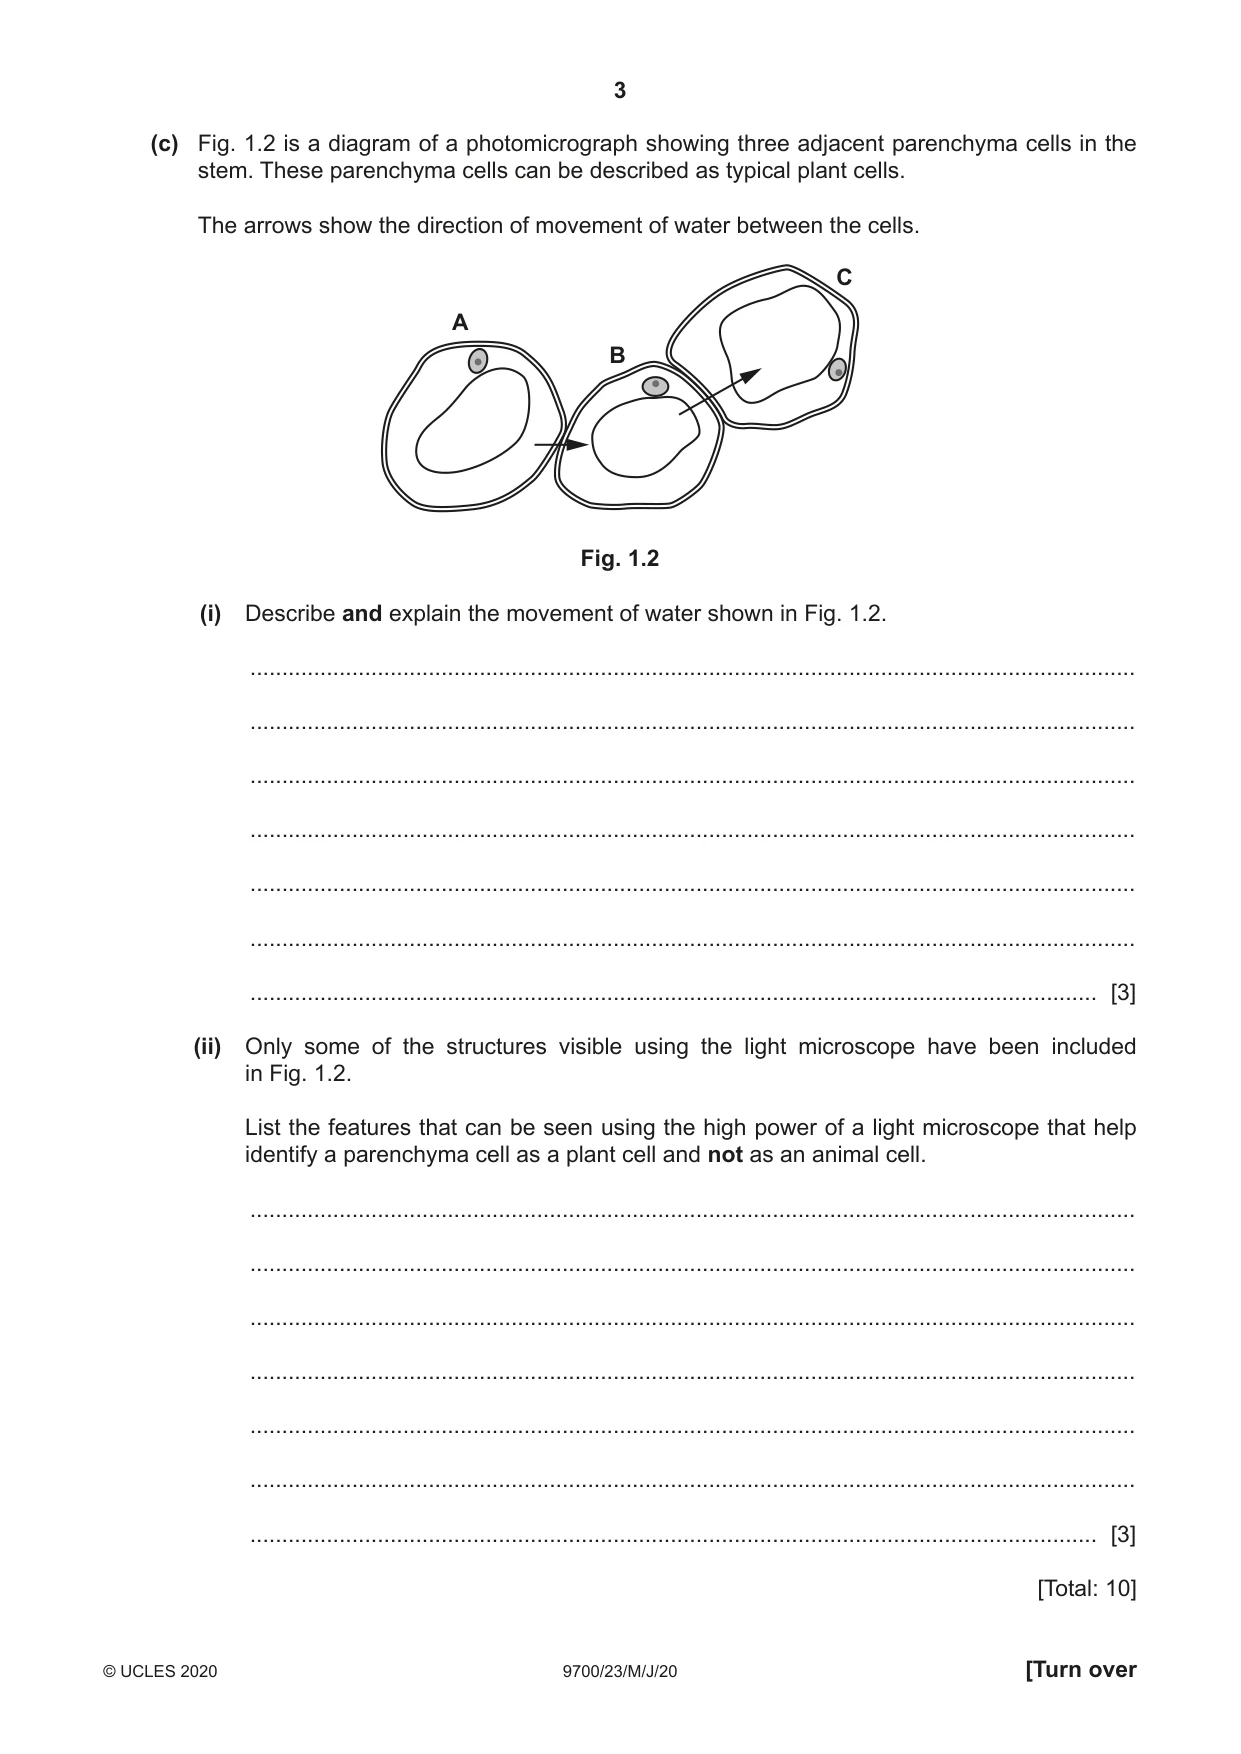
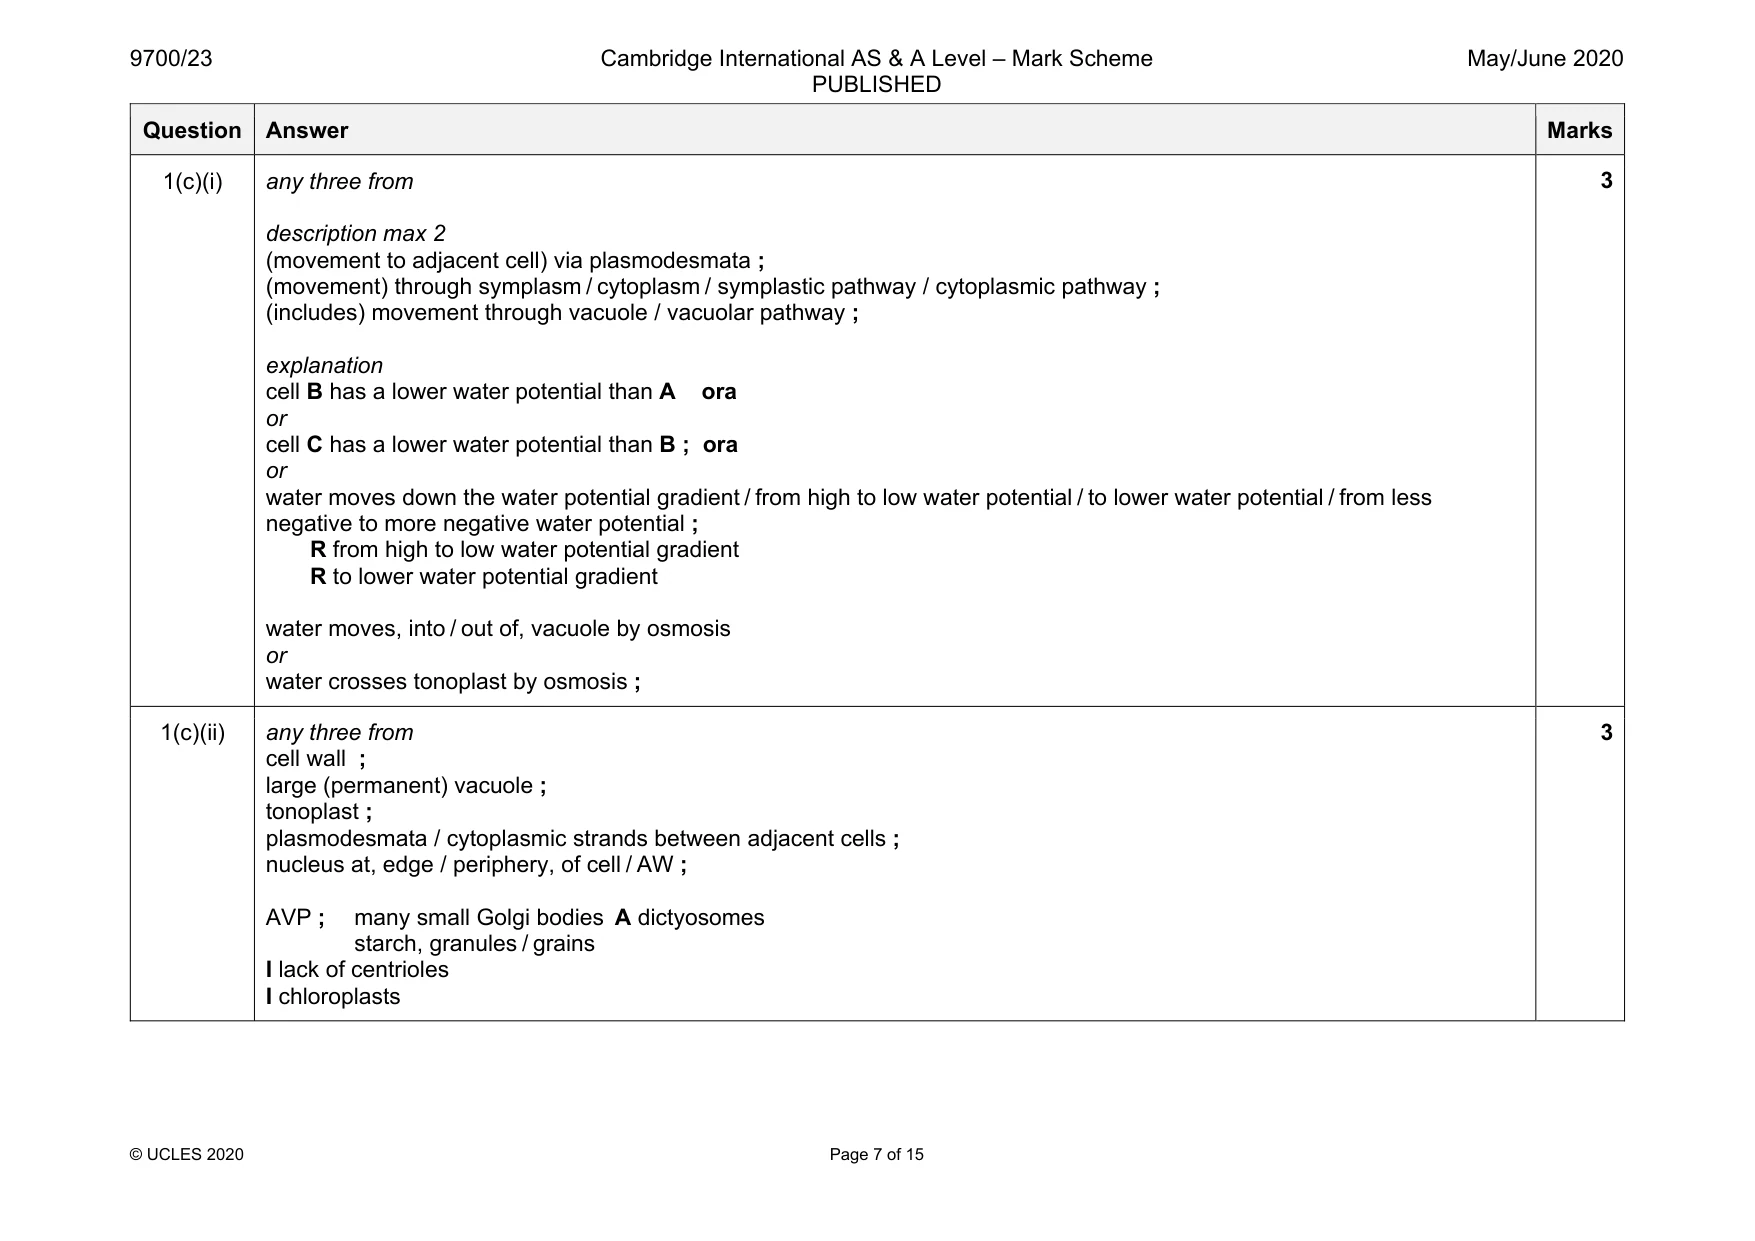
1 Water and mineral ions are transported up the stem of a plant to the leaves within xylem vessels. Some water and mineral ions can pass out of xylem vessel elements to supply parenchyma tissue in the stem. (a) Fig. 1.1 is a plan diagram of a section through a stem. Fig. 1.1 Identify one location where xylem tissue occurs in the stem by drawing a label line and the letter X on Fig. 1.1. [1] (b) Explain how hydrogen bonding between water molecules contributes to the movement of water within xylem vessels up the stem to the leaves. ................................................................................................................................................... ................................................................................................................................................... ................................................................................................................................................... ................................................................................................................................................... ................................................................................................................................................... ................................................................................................................................................... ................................................................................................................................................... ............................................................................................................................................. [3] (c) Fig. 1.2 is a diagram of a photomicrograph showing three adjacent parenchyma cells in the stem. These parenchyma cells can be described as typical plant cells. The arrows show the direction of movement of water between the cells. C A B Fig. 1.2 (i) Describe and explain the movement of water shown in Fig. 1.2. ........................................................................................................................................... ........................................................................................................................................... ........................................................................................................................................... ........................................................................................................................................... ........................................................................................................................................... ........................................................................................................................................... ..................................................................................................................................... [3] (ii) Only some of the structures visible using the light microscope have been included in Fig. 1.2. List the features that can be seen using the high power of a light microscope that help identify a parenchyma cell as a plant cell and not as an animal cell. ........................................................................................................................................... ........................................................................................................................................... ........................................................................................................................................... ........................................................................................................................................... ........................................................................................................................................... ........................................................................................................................................... ..................................................................................................................................... [3] [Total: 10]
Q2 · In 2016, the highest number of cases of malaria and deaths caused by the disease were in…
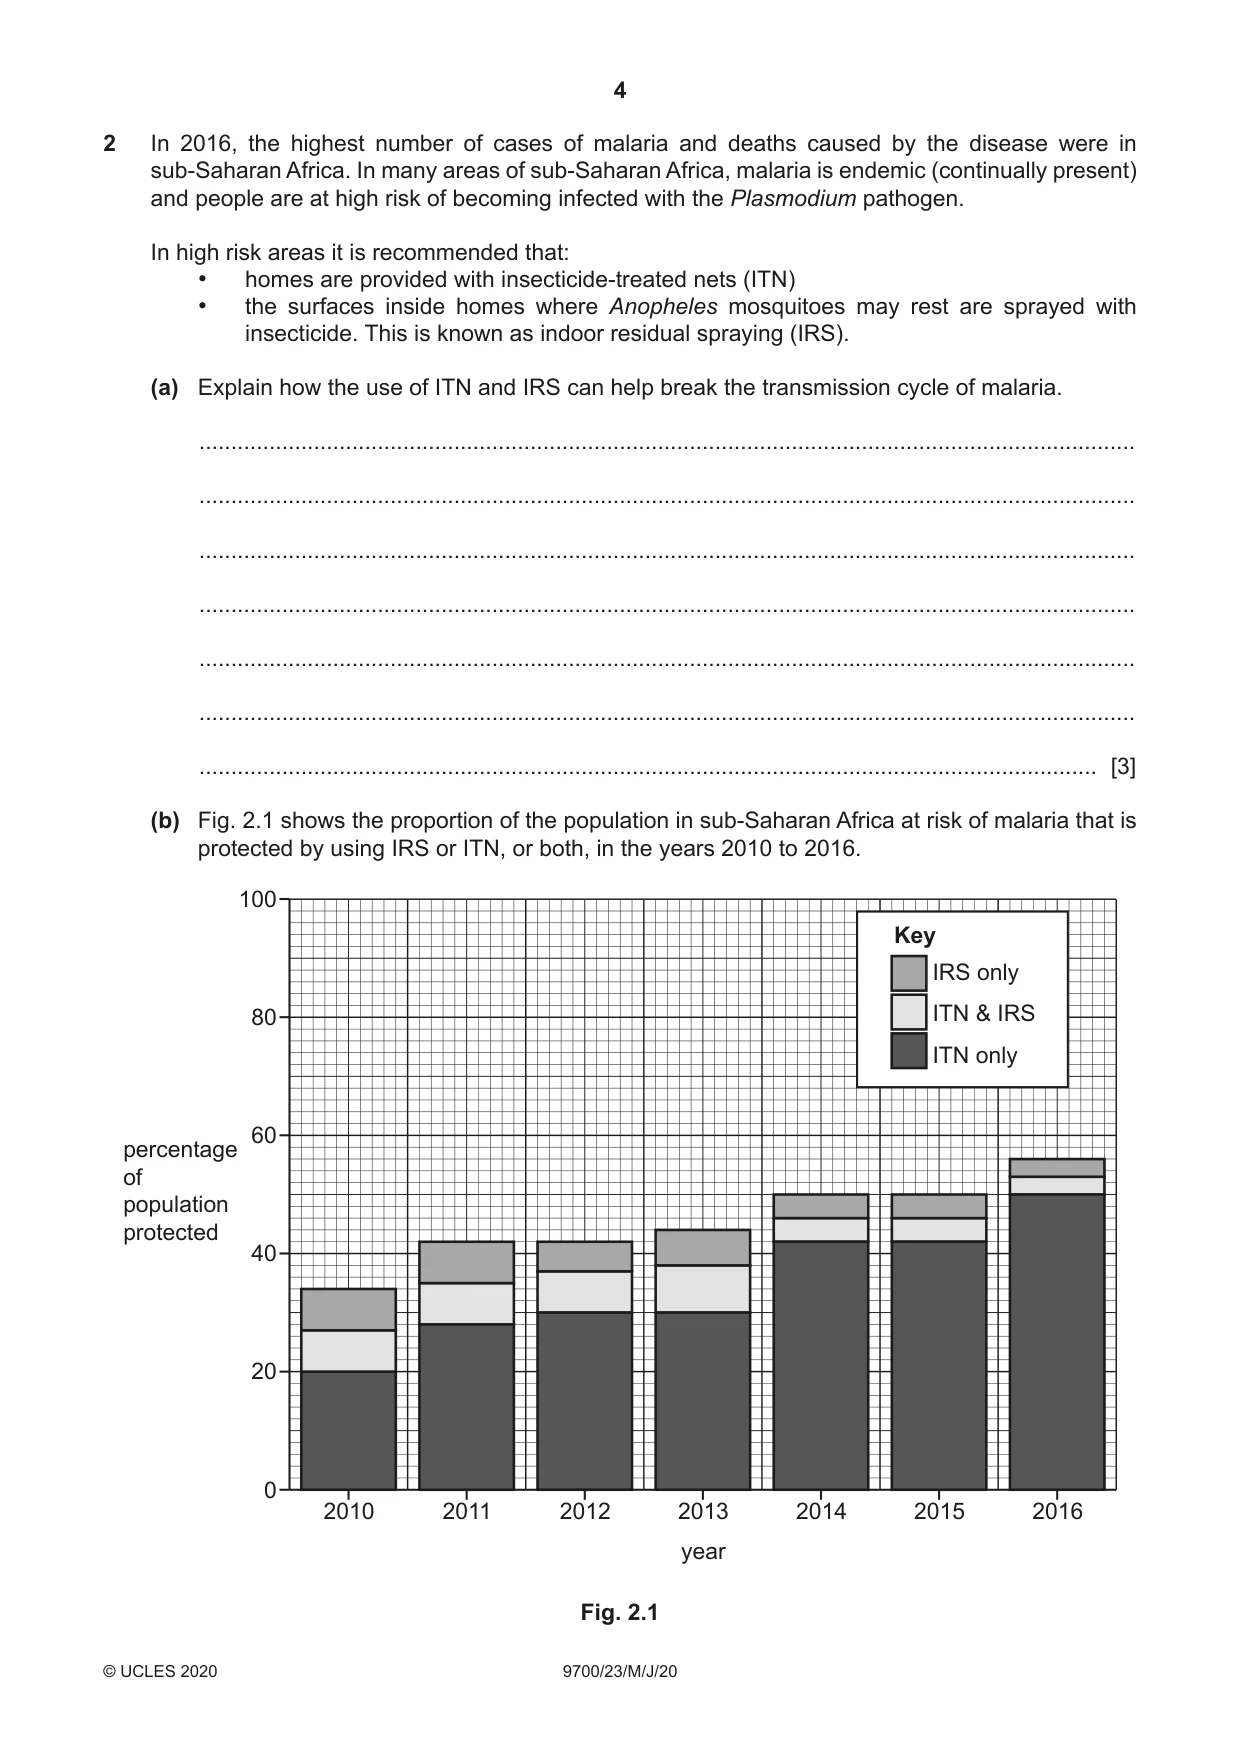
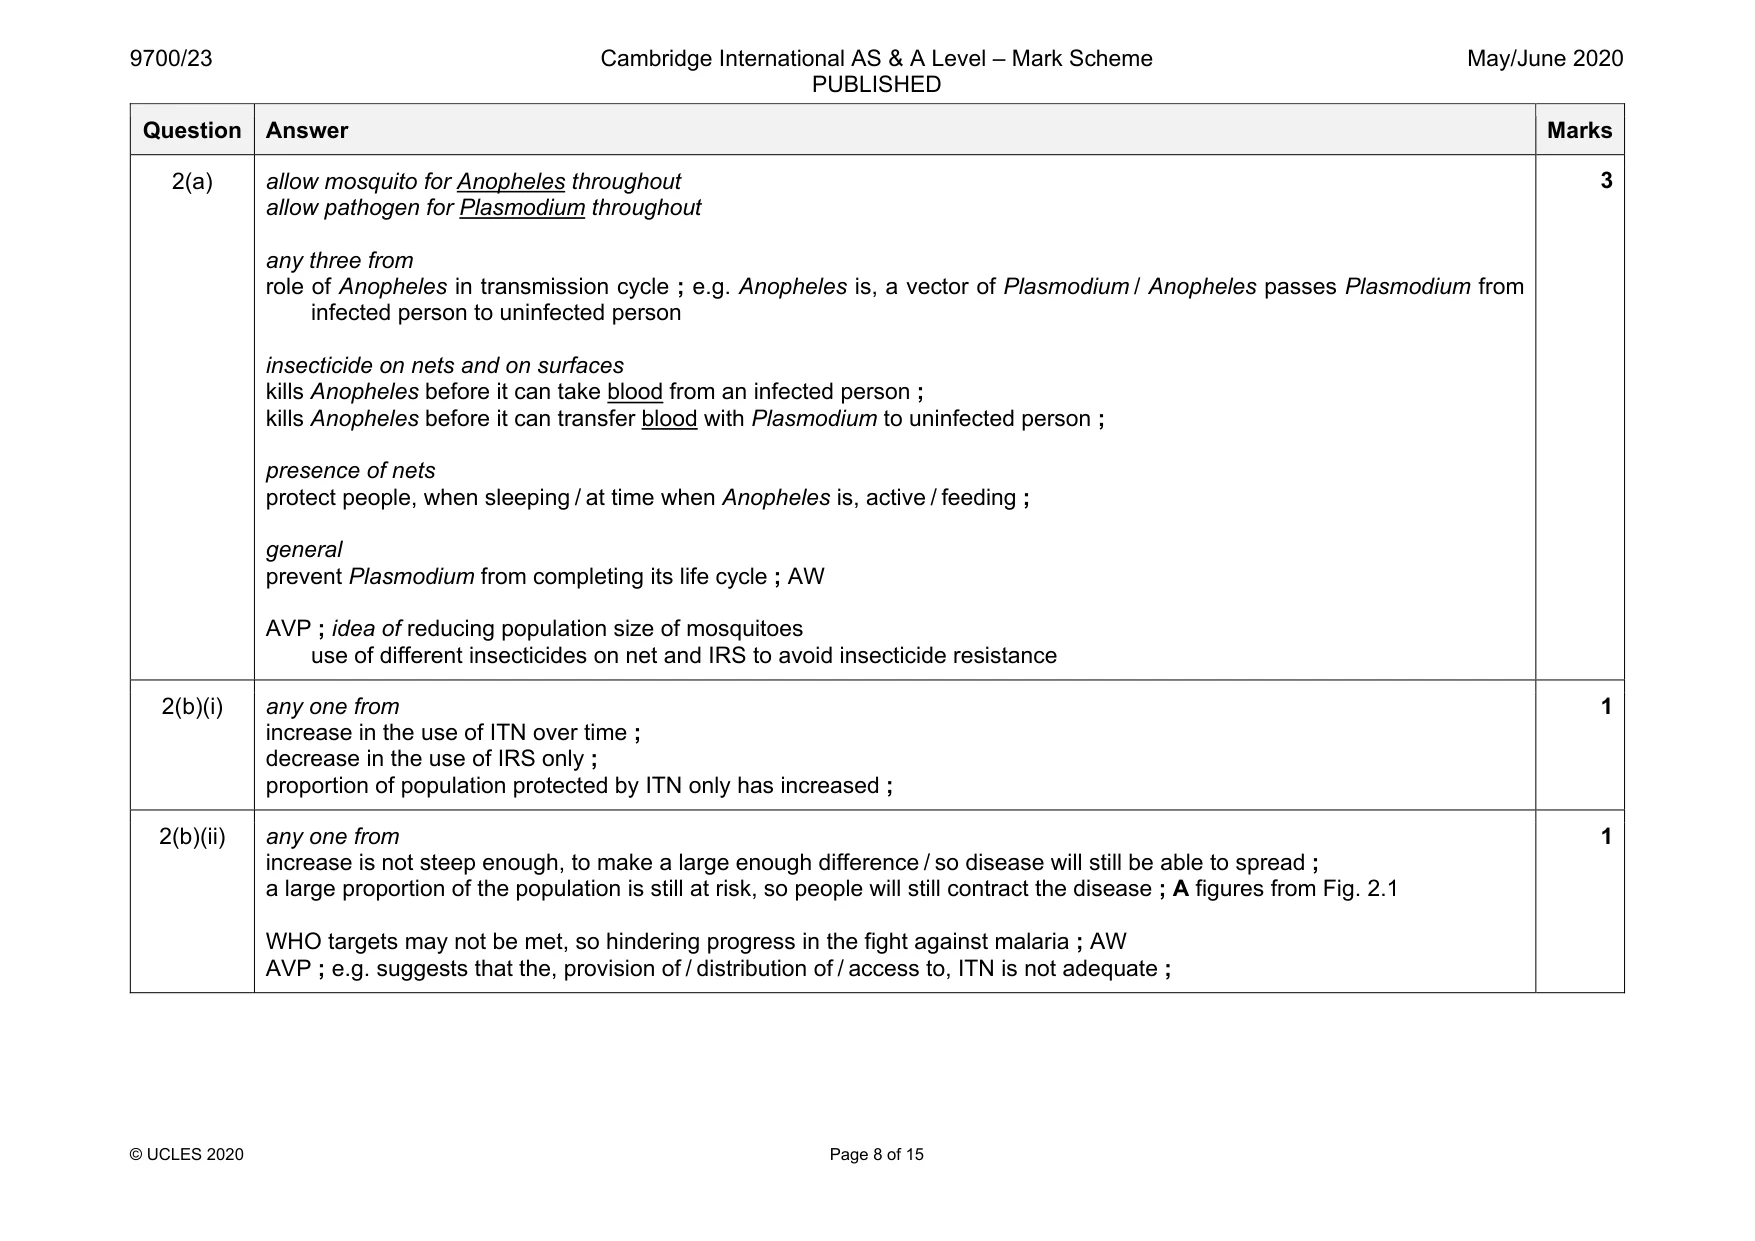
2 In 2016, the highest number of cases of malaria and deaths caused by the disease were in sub‑Saharan Africa. In many areas of sub‑Saharan Africa, malaria is endemic (continually present) and people are at high risk of becoming infected with the Plasmodium pathogen. In high risk areas it is recommended that: • homes are provided with insecticide‑treated nets (ITN) • the surfaces inside homes where Anopheles mosquitoes may rest are sprayed with insecticide. This is known as indoor residual spraying (IRS). (a) Explain how the use of ITN and IRS can help break the transmission cycle of malaria. ................................................................................................................................................... ................................................................................................................................................... ................................................................................................................................................... ................................................................................................................................................... ................................................................................................................................................... ................................................................................................................................................... ............................................................................................................................................. [3] (b) Fig. 2.1 shows the proportion of the population in sub‑Saharan Africa at risk of malaria that is protected by using IRS or ITN, or both, in the years 2010 to 2016. 100 Key IRS only 80 ITN & IRS ITN only 60 percentage of population protected 40 20 0 2010 2011 2012 2013 2014 2015 2016 year Fig. 2.1 The main trend in Fig. 2.1 shows that there is an increase in the percentage of the population protected over time. (i) State one other trend shown in Fig. 2.1. ........................................................................................................................................... ........................................................................................................................................... ..................................................................................................................................... [1] (ii) Explain why the main trend shown in Fig. 2.1 could be a concern for the World Health Organization. ........................................................................................................................................... ........................................................................................................................................... ..................................................................................................................................... [1] (iii) With reference to Fig. 2.1, suggest a reason for the difference in trends shown for ITN only compared with IRS only. ........................................................................................................................................... ..................................................................................................................................... [1] (c) In a primary immune response, antibodies against Plasmodium are produced within one to two weeks following infection. In some people, the pathogen is eliminated and the concentration of antibodies in the circulation decreases over time. Infection again by Plasmodium with the same antigens causes a secondary response that also involves antibody production. State and explain how the antibody response following a second infection will differ from the primary immune response. ................................................................................................................................................... ................................................................................................................................................... ................................................................................................................................................... ................................................................................................................................................... ................................................................................................................................................... ................................................................................................................................................... ............................................................................................................................................. [3] (d) In malaria, the production of antibodies is beneficial to recovery, whereas in the disease myasthenia gravis the production of antibodies is harmful. Explain why the production of antibodies in a person with myasthenia gravis is harmful. ................................................................................................................................................... ................................................................................................................................................... ................................................................................................................................................... ................................................................................................................................................... ............................................................................................................................................. [2] [Total: 11]
Mark scheme: 2(a) allow mosquito for Anopheles throughout allow pathogen for Plasmodium throughout any three from role of Anopheles in transmission cycle ; e.g. Anopheles is, a vector of Plasmodium / Anopheles passes Plasmodium from infected person to uninfected person insecticide on nets and on surfaces kills Anopheles before it can take blood from an infected person ; kills Anopheles before it can transfer blood with Plasmodium to uninfected person ; presence of nets protect people, when sleeping / at time when Anopheles is, active / feeding ; general prevent Plasmodium from completing its life cycle ; AW AVP ; idea of reducing population size of mosquitoes use of different insecticides on net and IRS to avoid insecticide resistance 2(b)(i) any one from increase in the use of ITN over time ; decrease in the use of IRS only ; proportion of population protected by ITN only has increased ; 1 2(b)(ii) any one from increase is not steep enough, to make a large enough difference / so disease will still be able to spread ; a large proportion of the population is still at risk, so people will still contract the disease ; A figures from Fig. 2.1 WHO targets may not be met, so hindering progress in the fight against malaria ; AW AVP ; e.g. suggests that the, provision of / distribution of / access to, ITN is not adequate ; 1 Question Answer Marks 2(b)(iii) any one suggestion from ITN more effective in control than IRS ; more cost effective to provide ITN ; lack of personnel to carry out work required for IRS ; ref. to insecticide on net may be more effective at killing ; AVP ; e.g. outside agencies / AW, provide ITN but do not help with IRS 1 2(c) any three from higher concentration of antibodies ; faster production of antibodies ; because of presence of memory, B-lymphocytes / B cells ; higher numbers of specific B-lymphocytes, so increased chance of faster recognition / because of clonal expansion in first response ; AVP ; e.g. also more memory T-cells to stimulate B-lymphocyte response ref. to higher concentration antibodies in circulation remaining after recovery 3 2(d) any two from result of an autoimmune disease / AW ; antibodies produced against, self-antigens / antigens on body cells or antibodies bind to self-antigens / antigens on (own) body cells ; detail ; e.g. prevents functioning of muscle cells binds to receptors on muscle cells 2 Question Answer Marks
Q3 · A photomicrograph of a section through two different types of blood vessels, X and Y
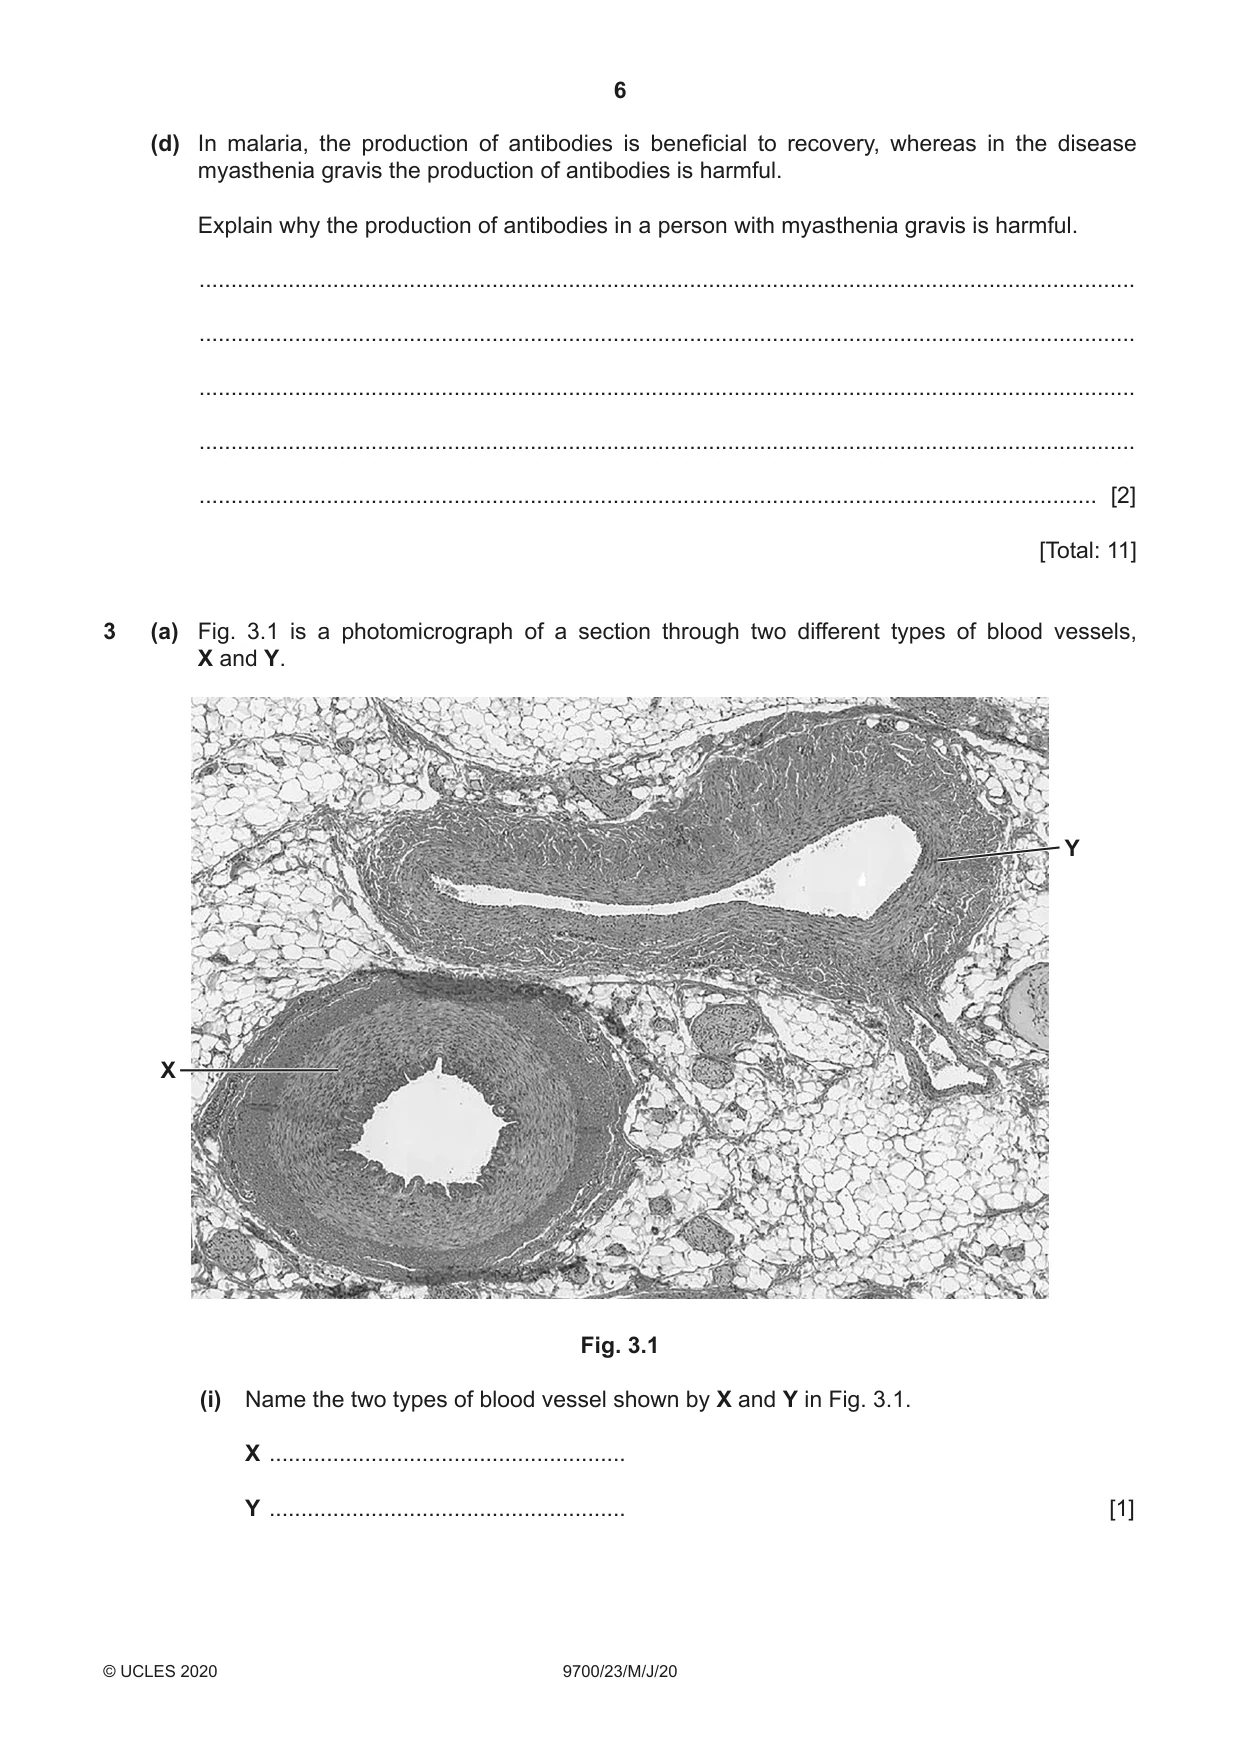
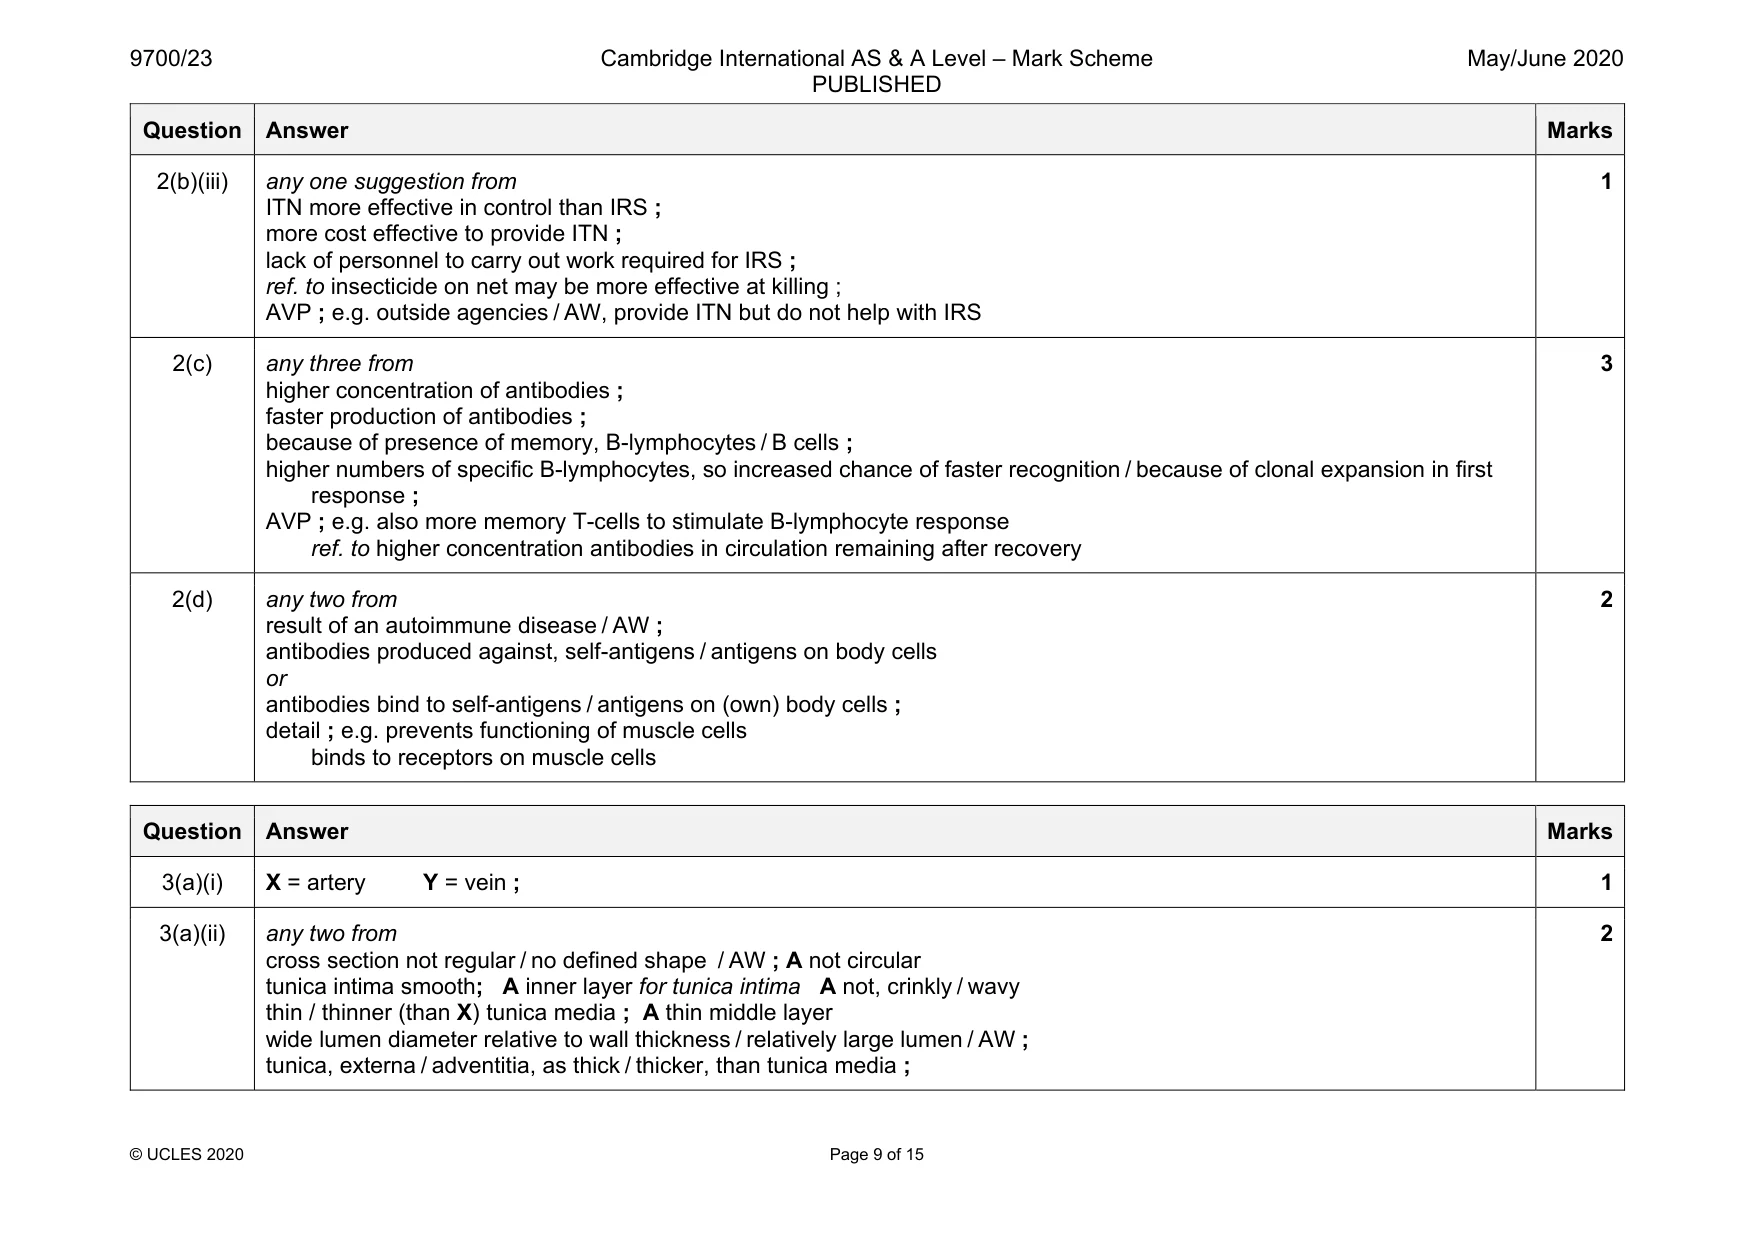
3 (a) Fig. 3.1 is a photomicrograph of a section through two different types of blood vessels, X and Y. Y X Fig. 3.1 (i) Name the two types of blood vessel shown by X and Y in Fig. 3.1. X ........................................................ Y ........................................................ [1] (ii) State the reasons for your identification of the type of blood vessel shown by Y in Fig. 3.1. ........................................................................................................................................... ........................................................................................................................................... ........................................................................................................................................... ........................................................................................................................................... ..................................................................................................................................... [2] (b) Tissue fluid and lymph are formed when blood arrives in the capillary networks of body tissues. (i) Explain why tissue fluid is more similar to blood plasma than it is to blood. ........................................................................................................................................... ........................................................................................................................................... ........................................................................................................................................... ........................................................................................................................................... ........................................................................................................................................... ..................................................................................................................................... [2] (ii) Explain why the tissue fluid formed after blood arrives in the capillary network has a higher concentration of amino acids than the newly formed lymph draining away from the network. ........................................................................................................................................... ........................................................................................................................................... ..................................................................................................................................... [1] (c) The trachea, bronchi and bronchioles in the gas exchange system require a supply of glucose and oxygen from the blood for the functioning of smooth muscle. Outline the function of smooth muscle in the gas exchange system. ................................................................................................................................................... ................................................................................................................................................... ................................................................................................................................................... ................................................................................................................................................... ............................................................................................................................................. [2] [Total: 8]
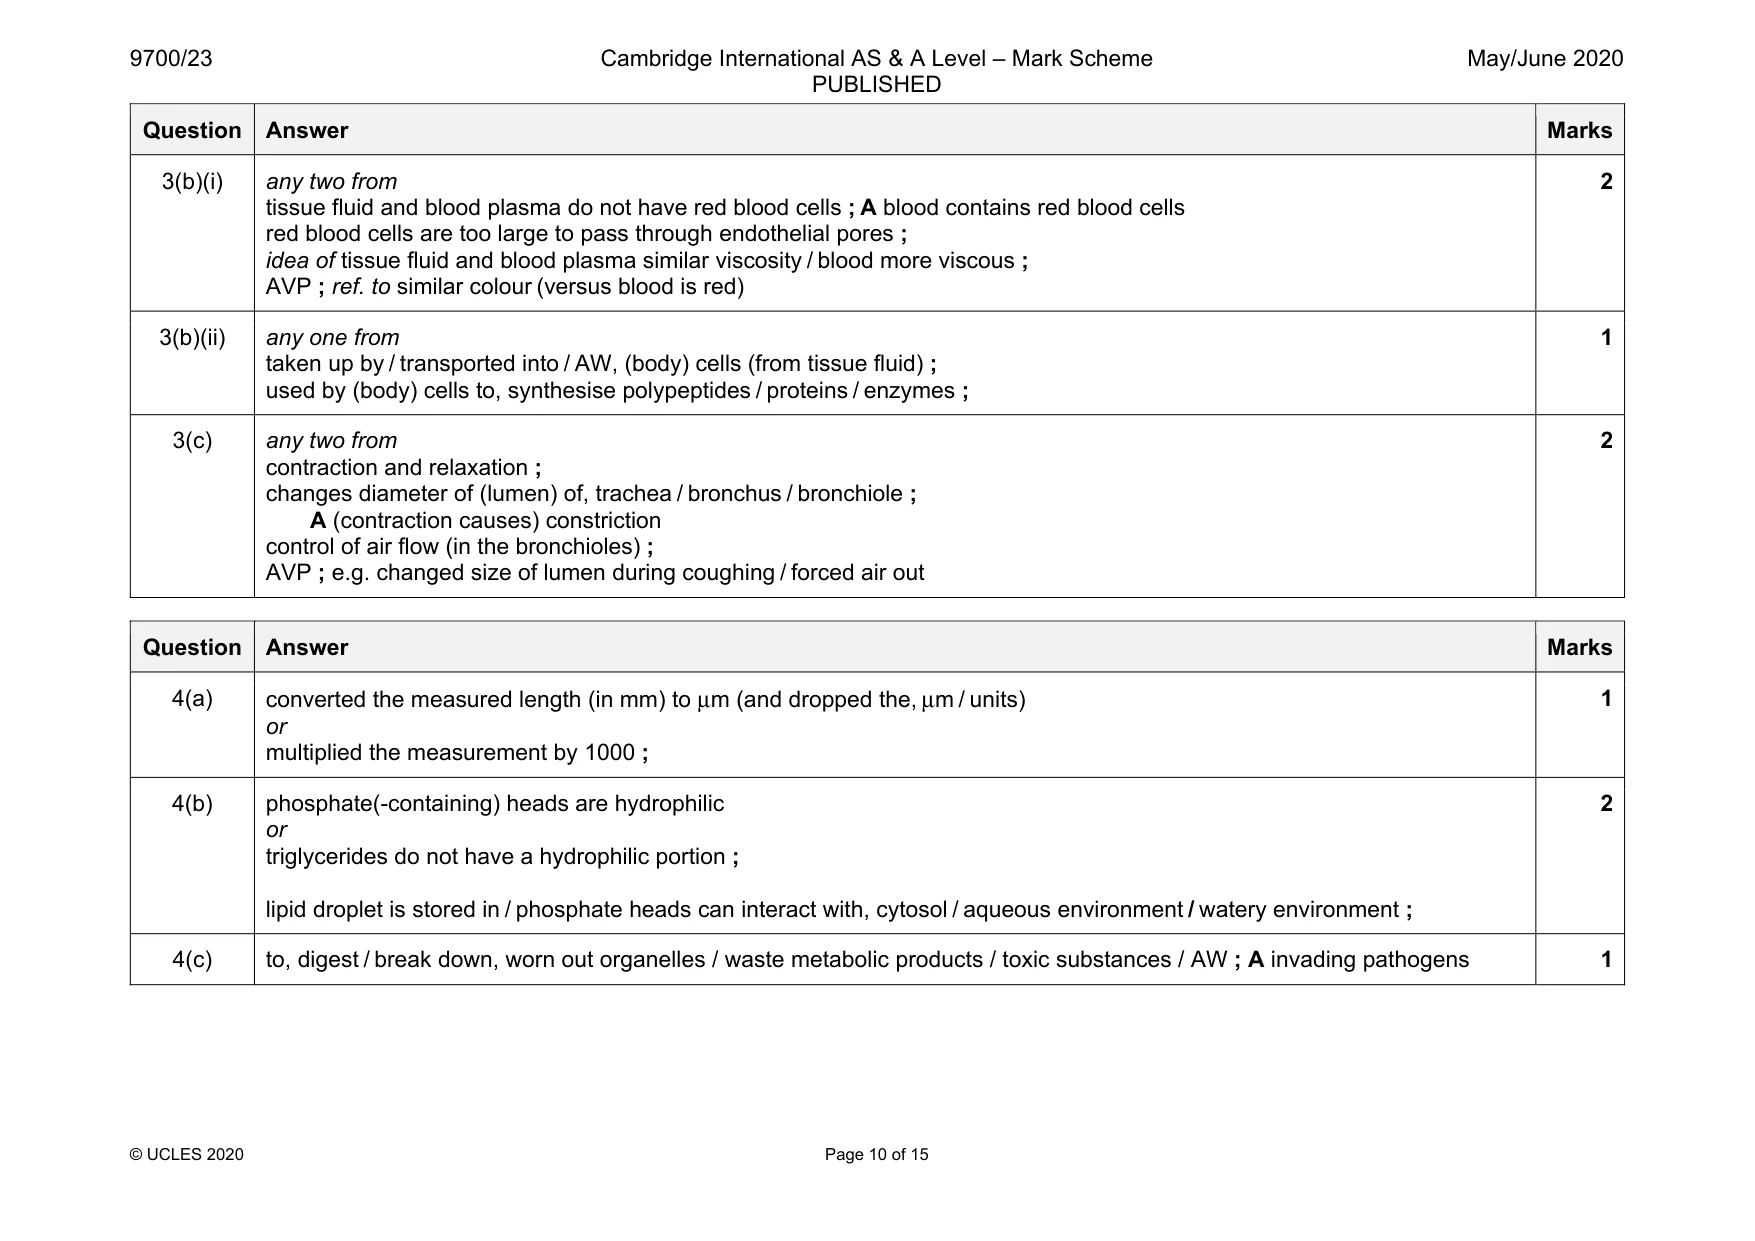
Mark scheme: 3(a)(i) X = artery Y = vein ; 1 3(a)(ii) any two from cross section not regular / no defined shape / AW ; A not circular tunica intima smooth; A inner layer for tunica intima A not, crinkly / wavy thin / thinner (than X) tunica media ; A thin middle layer wide lumen diameter relative to wall thickness / relatively large lumen / AW ; tunica, externa / adventitia, as thick / thicker, than tunica media ; 2 Question Answer Marks 3(b)(i) any two from tissue fluid and blood plasma do not have red blood cells ; A blood contains red blood cells red blood cells are too large to pass through endothelial pores ; idea of tissue fluid and blood plasma similar viscosity / blood more viscous ; AVP ; ref. to similar colour (versus blood is red) 2 3(b)(ii) any one from taken up by / transported into / AW, (body) cells (from tissue fluid) ; used by (body) cells to, synthesise polypeptides / proteins / enzymes ; 1 3(c) any two from contraction and relaxation ; changes diameter of (lumen) of, trachea / bronchus / bronchiole ; A (contraction causes) constriction control of air flow (in the bronchioles) ; AVP ; e.g. changed size of lumen during coughing / forced air out 2 Question Answer Marks
Q4 · Saccharomyces cerevisiae is a unicellular fungus that is important in the brewing and…
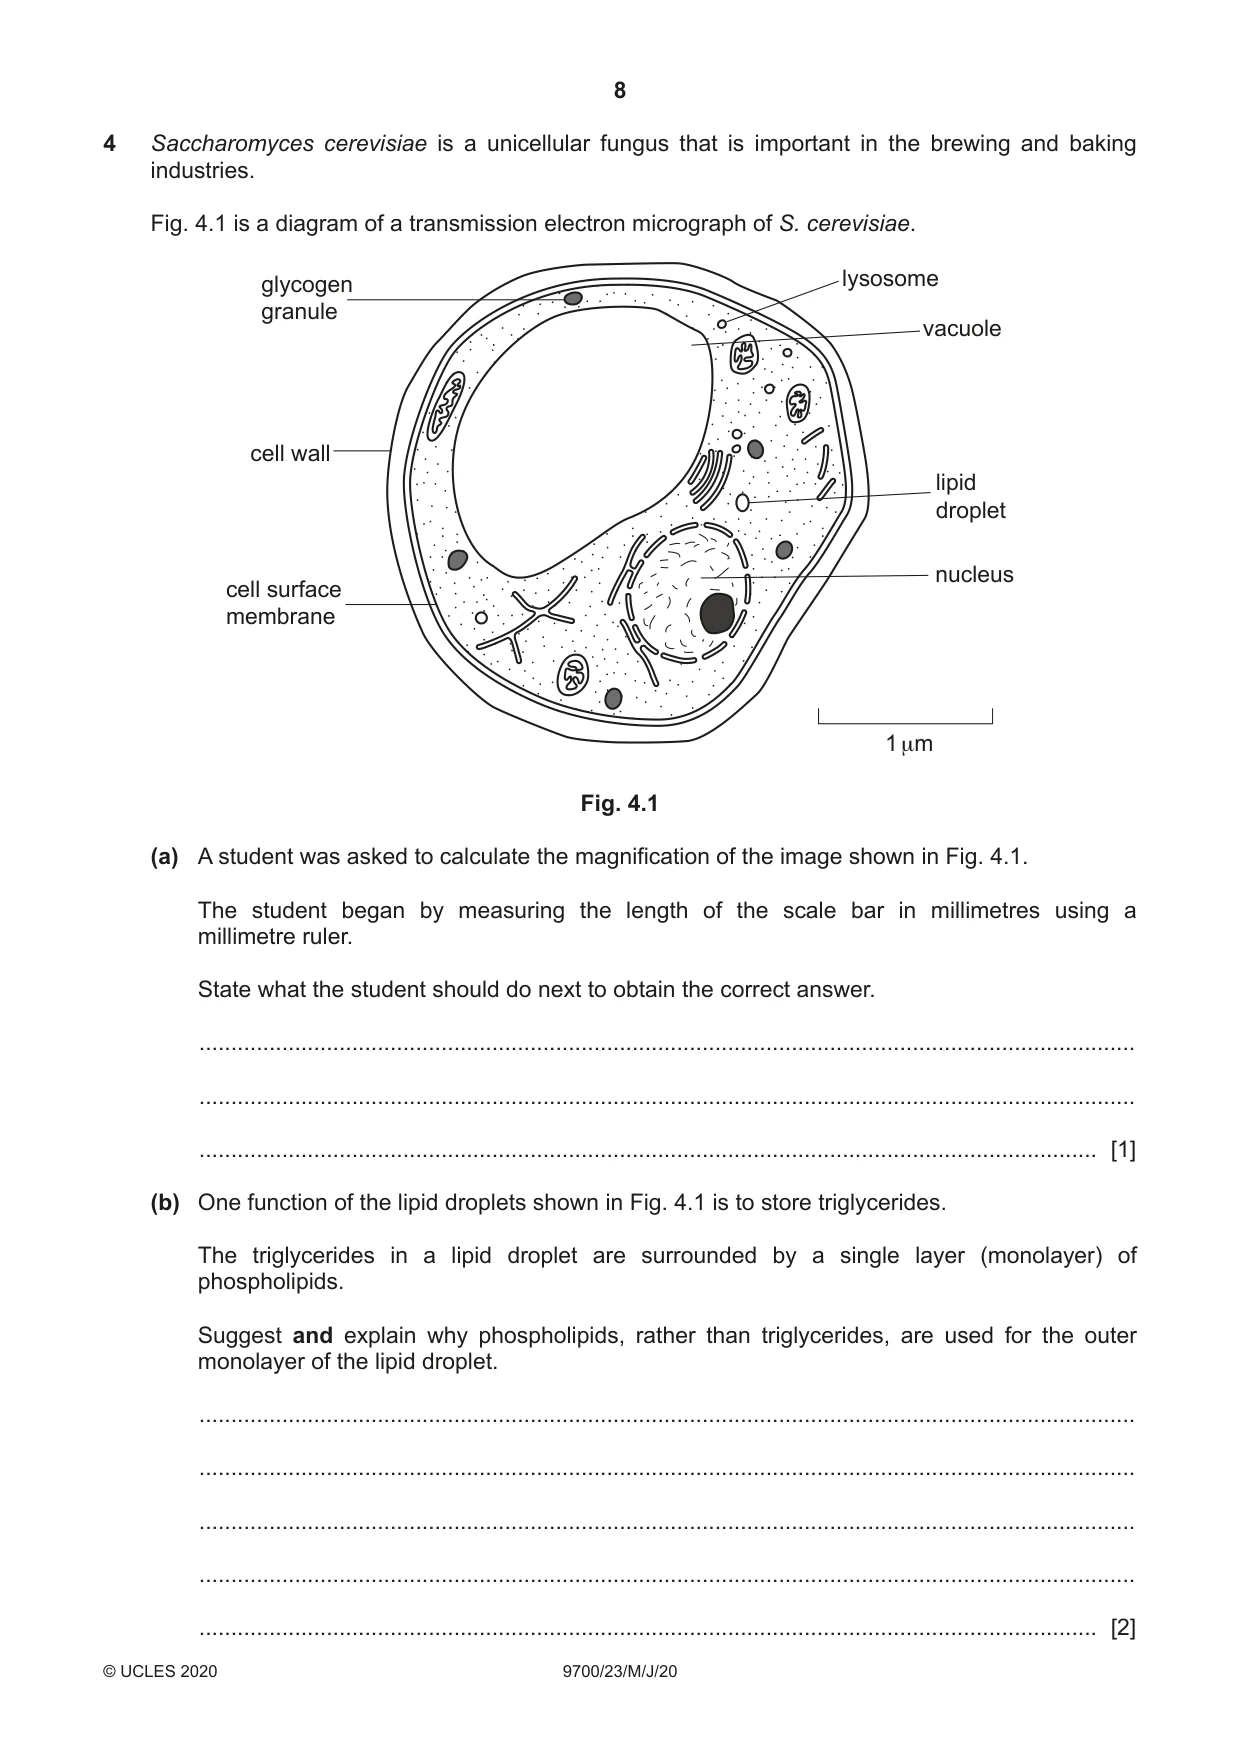
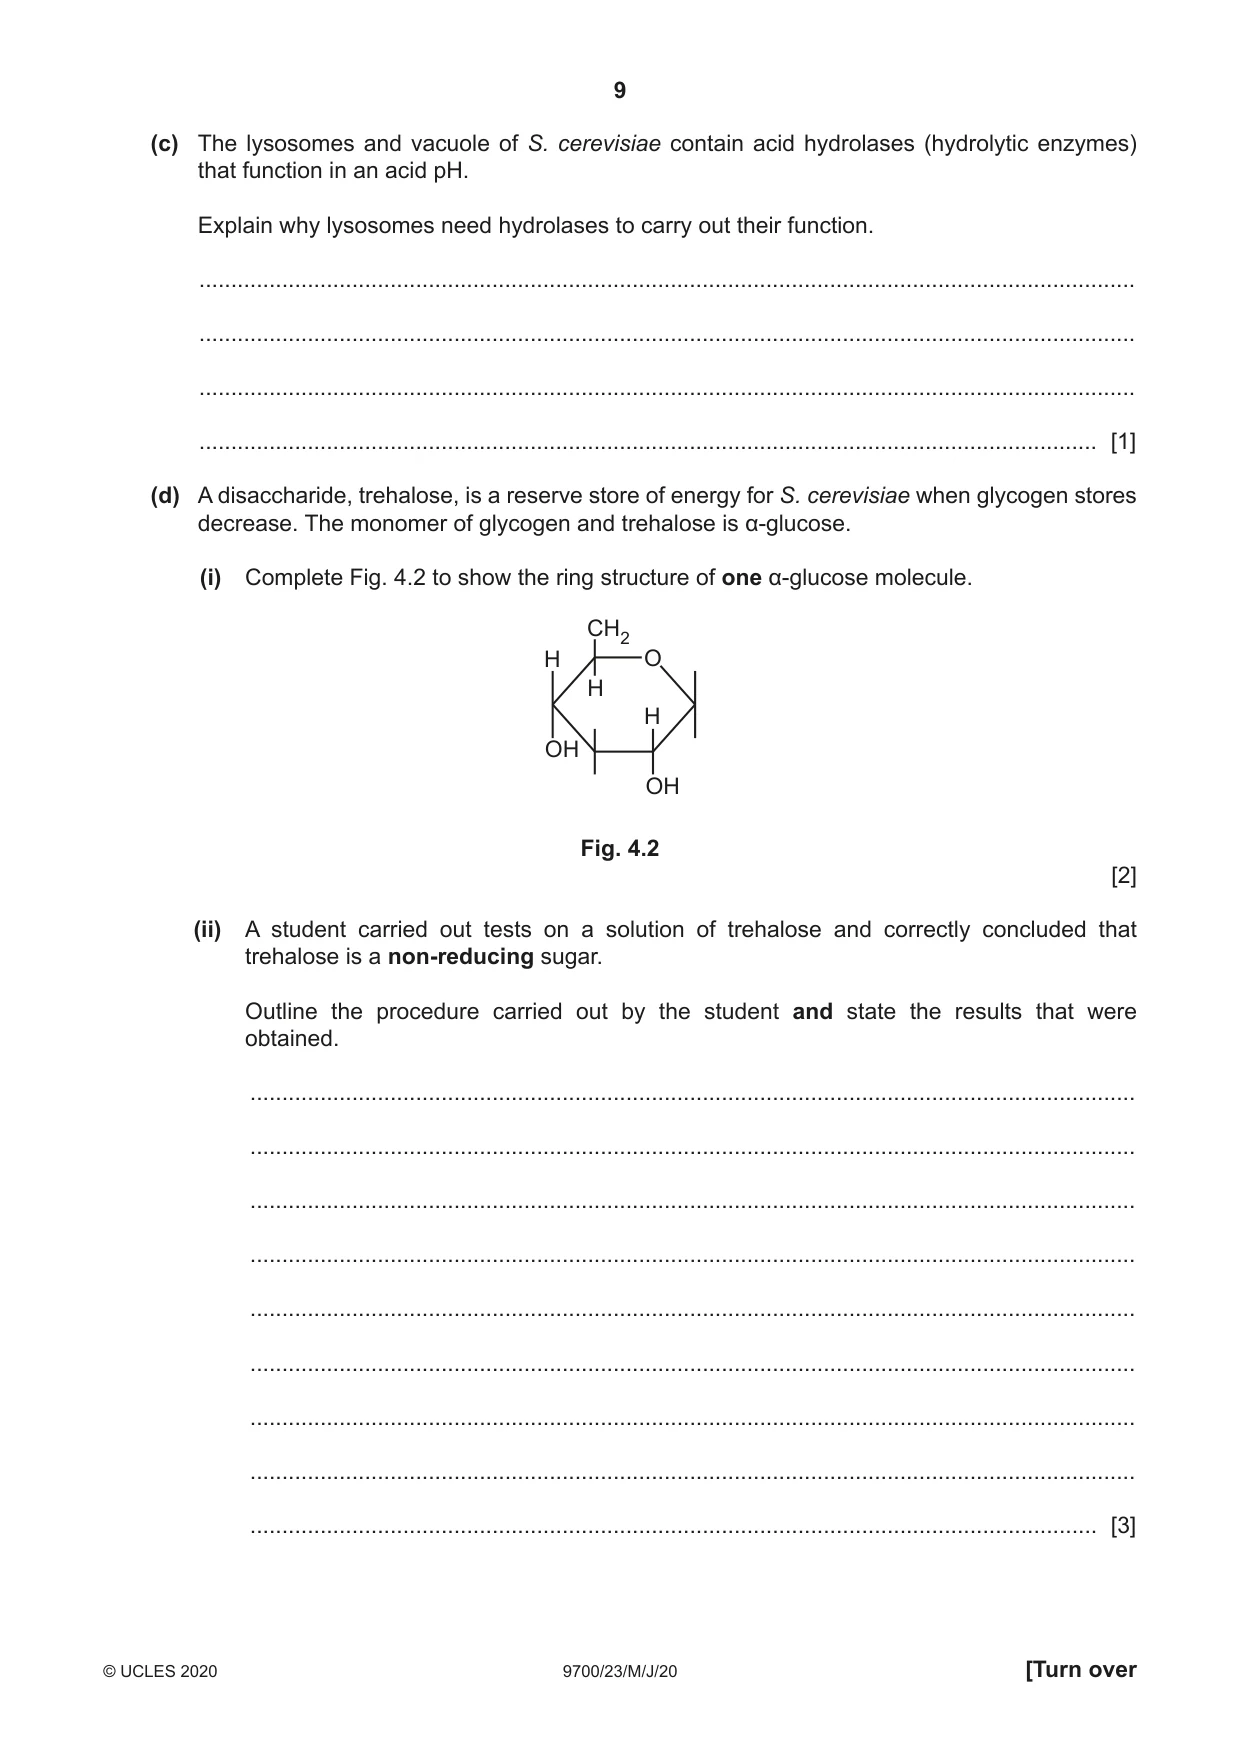
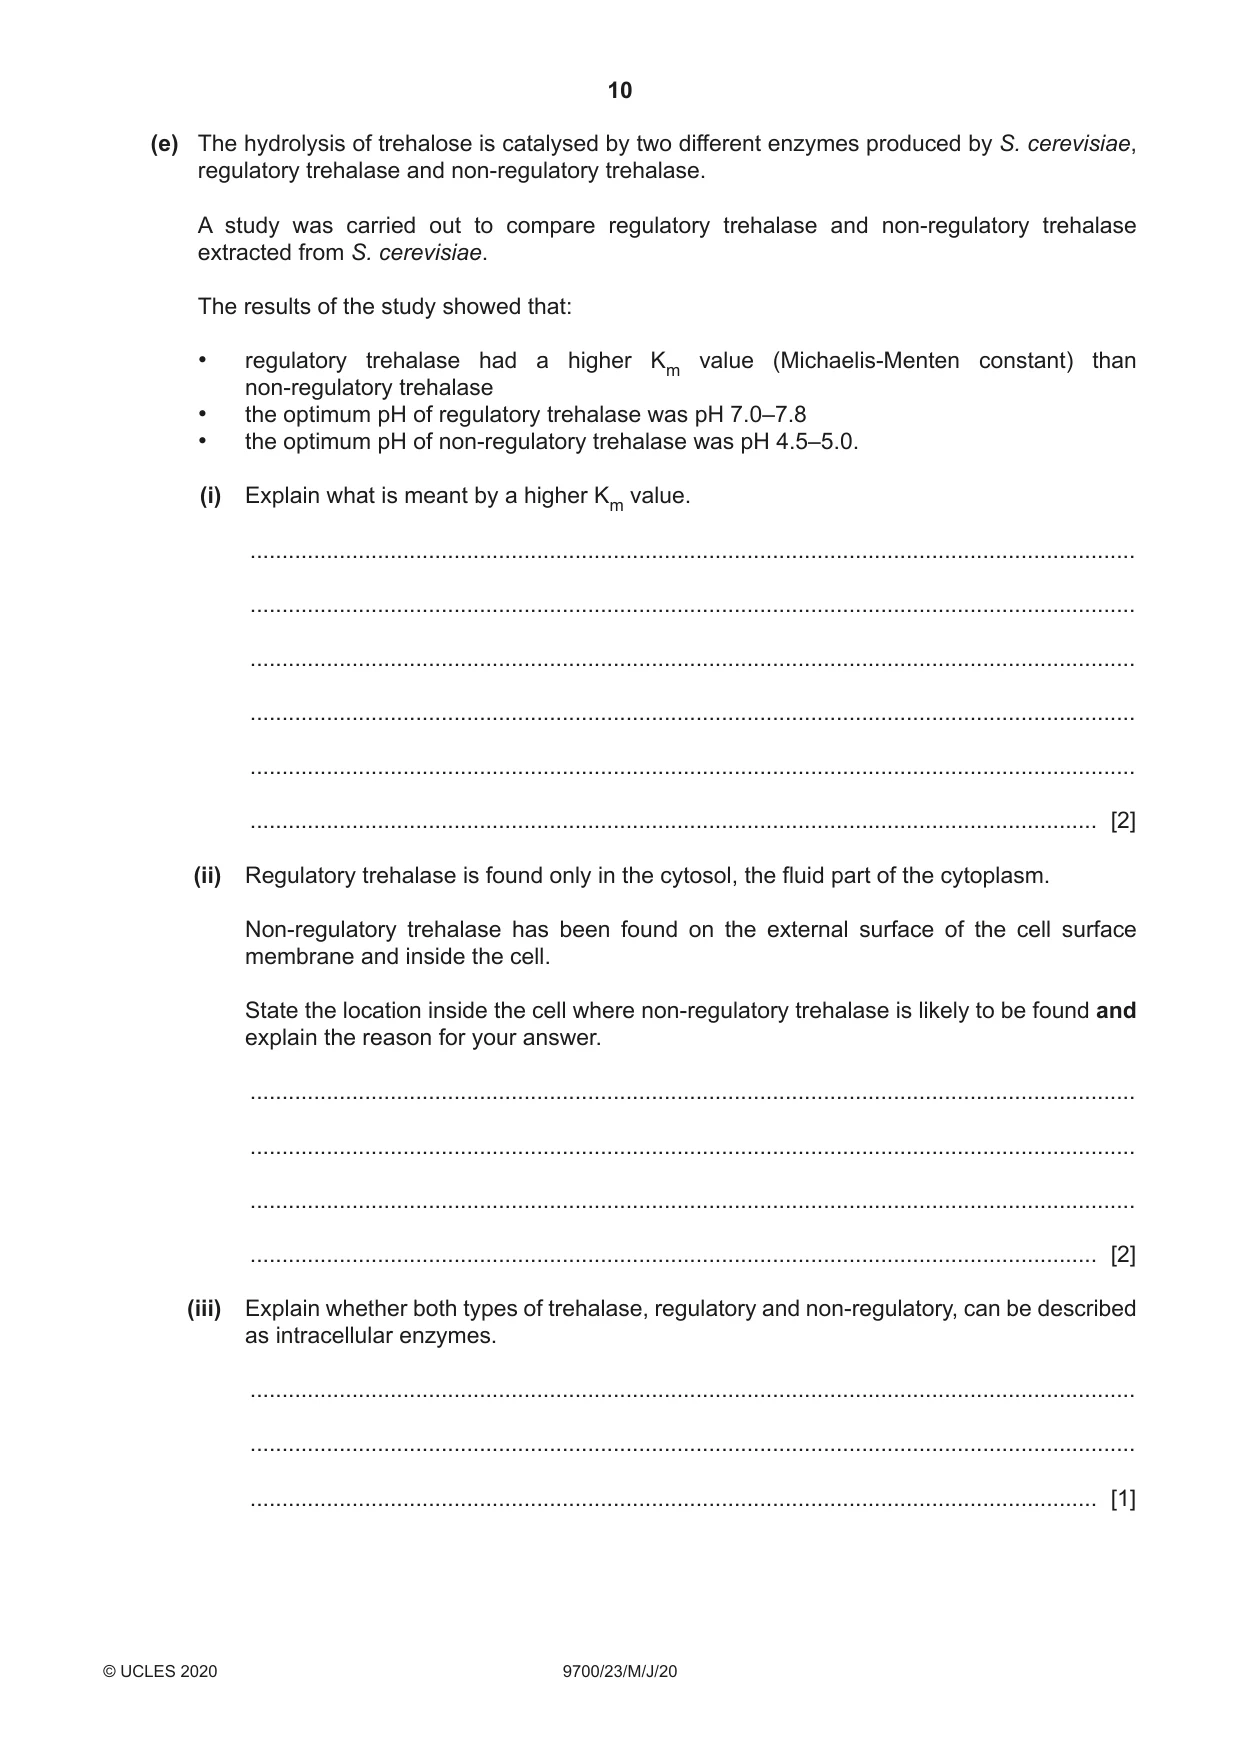
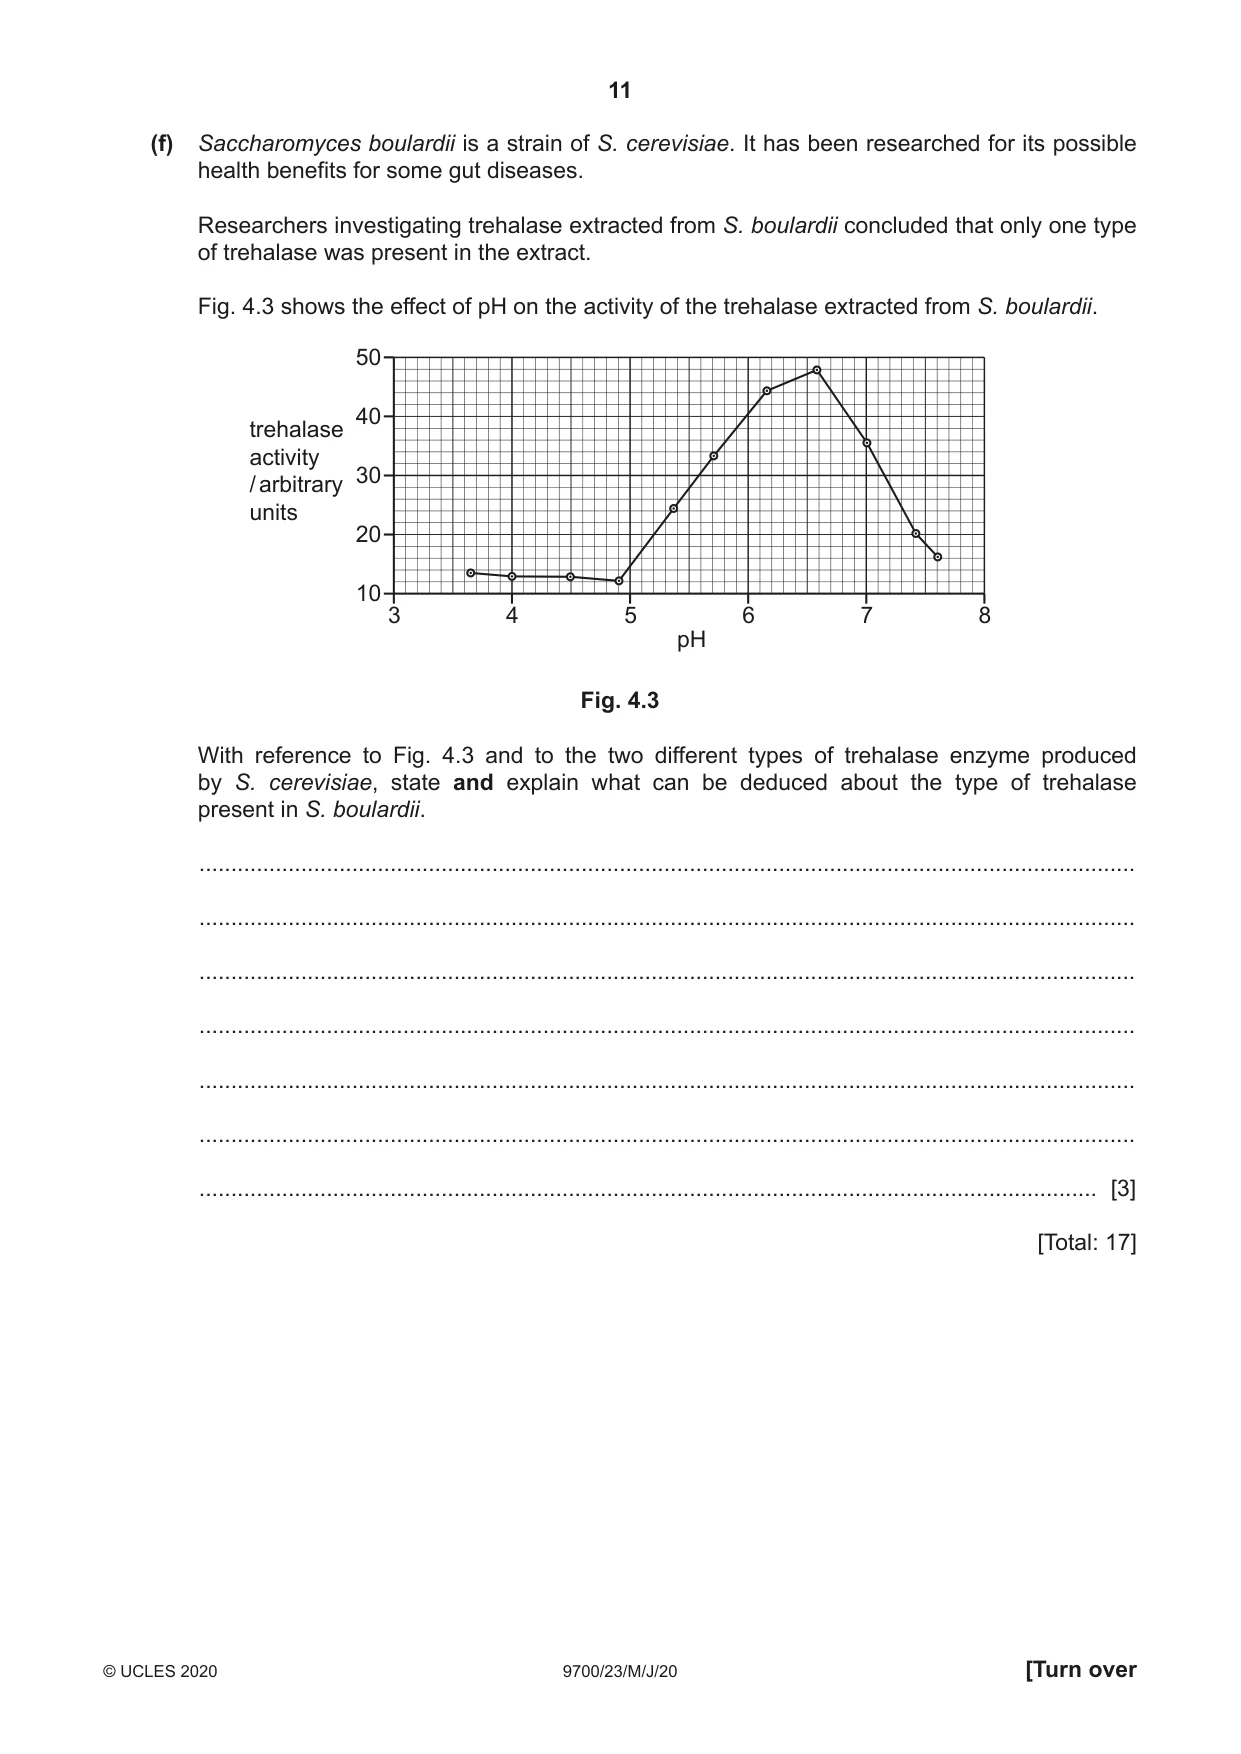
4 Saccharomyces cerevisiae is a unicellular fungus that is important in the brewing and baking industries. Fig. 4.1 is a diagram of a transmission electron micrograph of S. cerevisiae. glycogen lysosome granule vacuole cell wall lipid droplet nucleus cell surface membrane 1 μm Fig. 4.1 (a) A student was asked to calculate the magnification of the image shown in Fig. 4.1. The student began by measuring the length of the scale bar in millimetres using a millimetre ruler. State what the student should do next to obtain the correct answer. ................................................................................................................................................... ................................................................................................................................................... ............................................................................................................................................. [1] (b) One function of the lipid droplets shown in Fig. 4.1 is to store triglycerides. The triglycerides in a lipid droplet are surrounded by a single layer (monolayer) of phospholipids. Suggest and explain why phospholipids, rather than triglycerides, are used for the outer monolayer of the lipid droplet. ................................................................................................................................................... ................................................................................................................................................... ................................................................................................................................................... ................................................................................................................................................... ............................................................................................................................................. [2] (c) The lysosomes and vacuole of S. cerevisiae contain acid hydrolases (hydrolytic enzymes) that function in an acid pH. Explain why lysosomes need hydrolases to carry out their function. ................................................................................................................................................... ................................................................................................................................................... ................................................................................................................................................... ............................................................................................................................................. [1] (d) A disaccharide, trehalose, is a reserve store of energy for S. cerevisiae when glycogen stores decrease. The monomer of glycogen and trehalose is α-glucose. (i) Complete Fig. 4.2 to show the ring structure of one α-glucose molecule. CH2 H O H H OH OH Fig. 4.2 [2] (ii) A student carried out tests on a solution of trehalose and correctly concluded that trehalose is a non-reducing sugar. Outline the procedure carried out by the student and state the results that were obtained. ........................................................................................................................................... ........................................................................................................................................... ........................................................................................................................................... ........................................................................................................................................... ........................................................................................................................................... ........................................................................................................................................... ........................................................................................................................................... ........................................................................................................................................... ..................................................................................................................................... [3] (e) The hydrolysis of trehalose is catalysed by two different enzymes produced by S. cerevisiae, regulatory trehalase and non‑regulatory trehalase. A study was carried out to compare regulatory trehalase and non‑regulatory trehalase extracted from S. cerevisiae. The results of the study showed that: • regulatory trehalase had a higher Km value (Michaelis‑Menten constant) than non‑regulatory trehalase • the optimum pH of regulatory trehalase was pH 7.0–7.8 • the optimum pH of non‑regulatory trehalase was pH 4.5–5.0. (i) Explain what is meant by a higher Km value. ........................................................................................................................................... ........................................................................................................................................... ........................................................................................................................................... ........................................................................................................................................... ........................................................................................................................................... ..................................................................................................................................... [2] (ii) Regulatory trehalase is found only in the cytosol, the fluid part of the cytoplasm. Non‑regulatory trehalase has been found on the external surface of the cell surface membrane and inside the cell. State the location inside the cell where non‑regulatory trehalase is likely to be found and explain the reason for your answer. ........................................................................................................................................... ........................................................................................................................................... ........................................................................................................................................... ..................................................................................................................................... [2] (iii) Explain whether both types of trehalase, regulatory and non‑regulatory, can be described as intracellular enzymes. ........................................................................................................................................... ........................................................................................................................................... ..................................................................................................................................... [1] (f) Saccharomyces boulardii is a strain of S. cerevisiae. It has been researched for its possible health benefits for some gut diseases. Researchers investigating trehalase extracted from S. boulardii concluded that only one type of trehalase was present in the extract. Fig. 4.3 shows the effect of pH on the activity of the trehalase extracted from S. boulardii. 50 40 trehalase activity 30 / arbitrary units 20 10 3 4 5 6 7 8 pH Fig. 4.3 With reference to Fig. 4.3 and to the two different types of trehalase enzyme produced by S. cerevisiae, state and explain what can be deduced about the type of trehalase present in S. boulardii. ................................................................................................................................................... ................................................................................................................................................... ................................................................................................................................................... ................................................................................................................................................... ................................................................................................................................................... ................................................................................................................................................... ............................................................................................................................................. [3] [Total: 17]
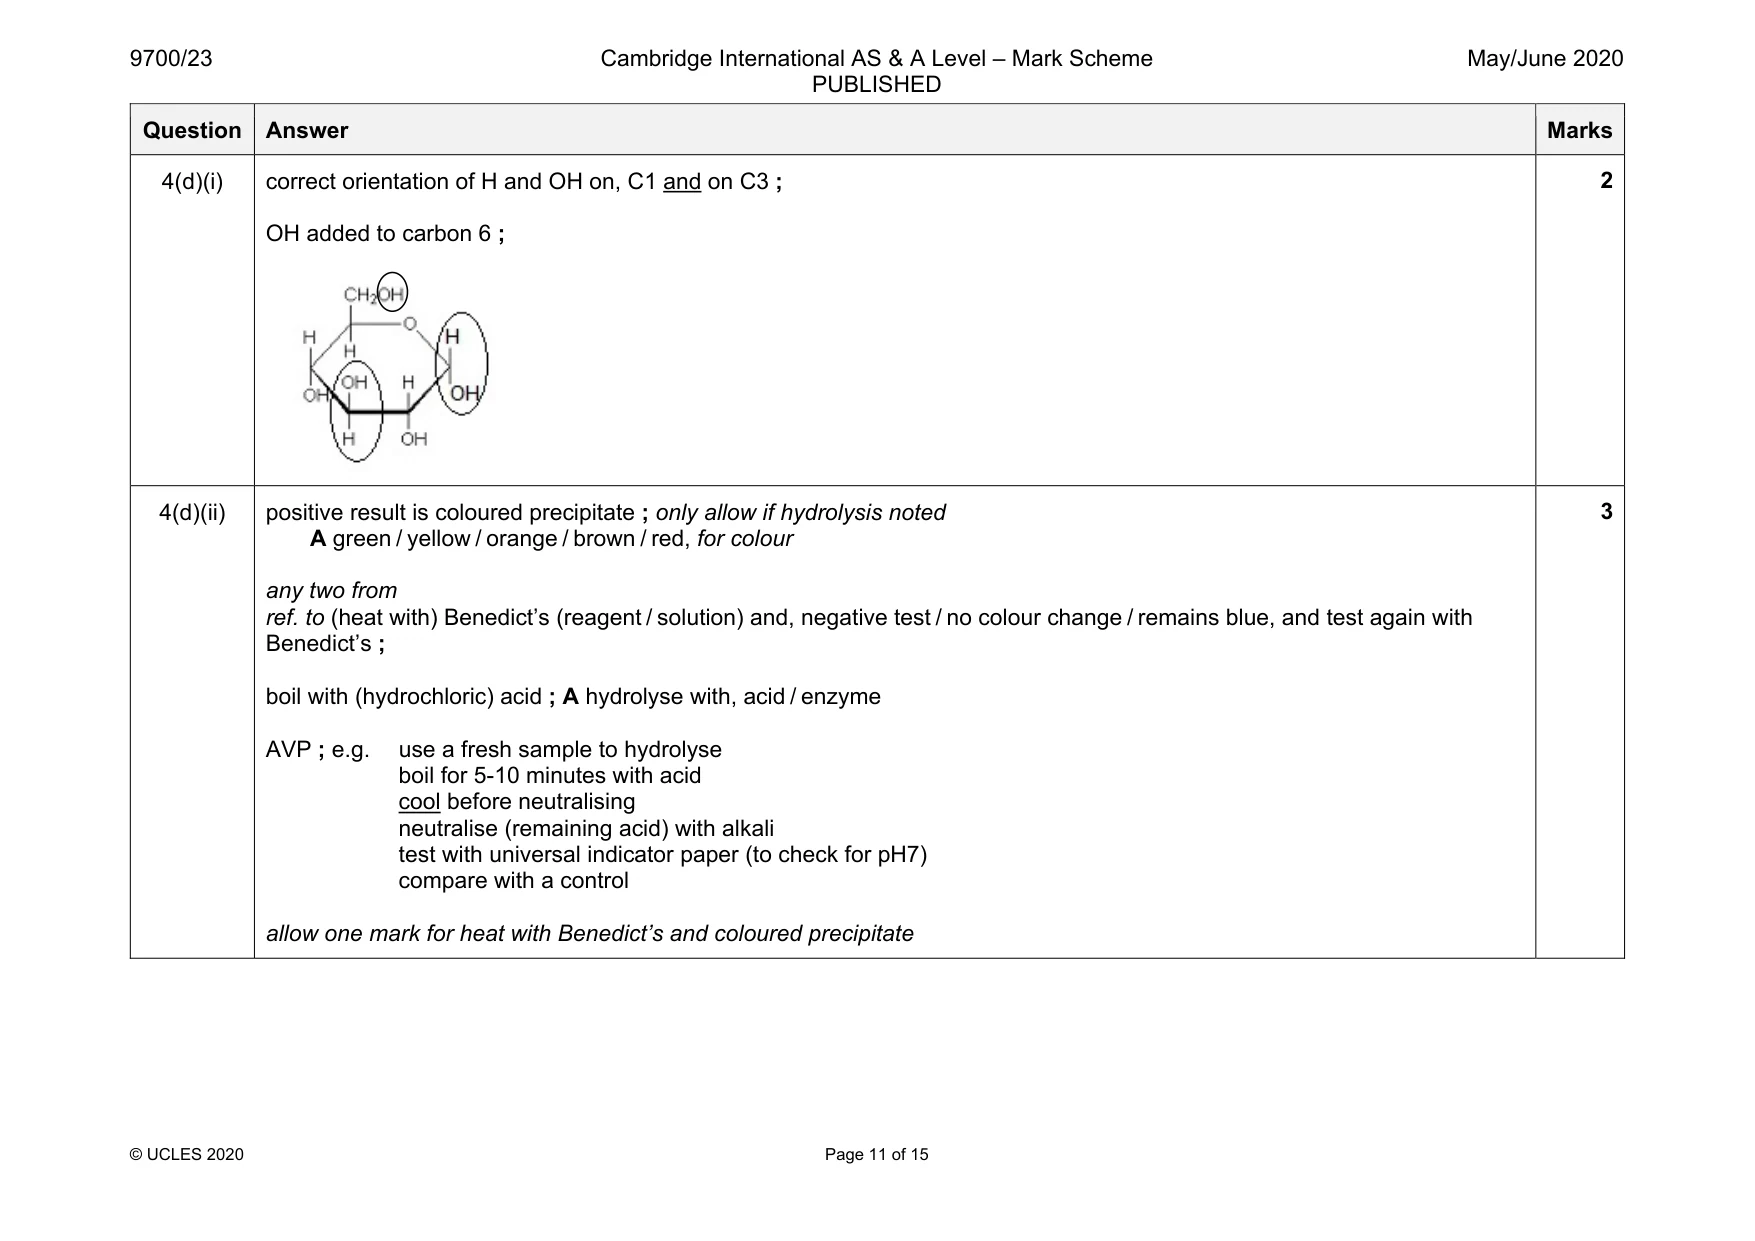
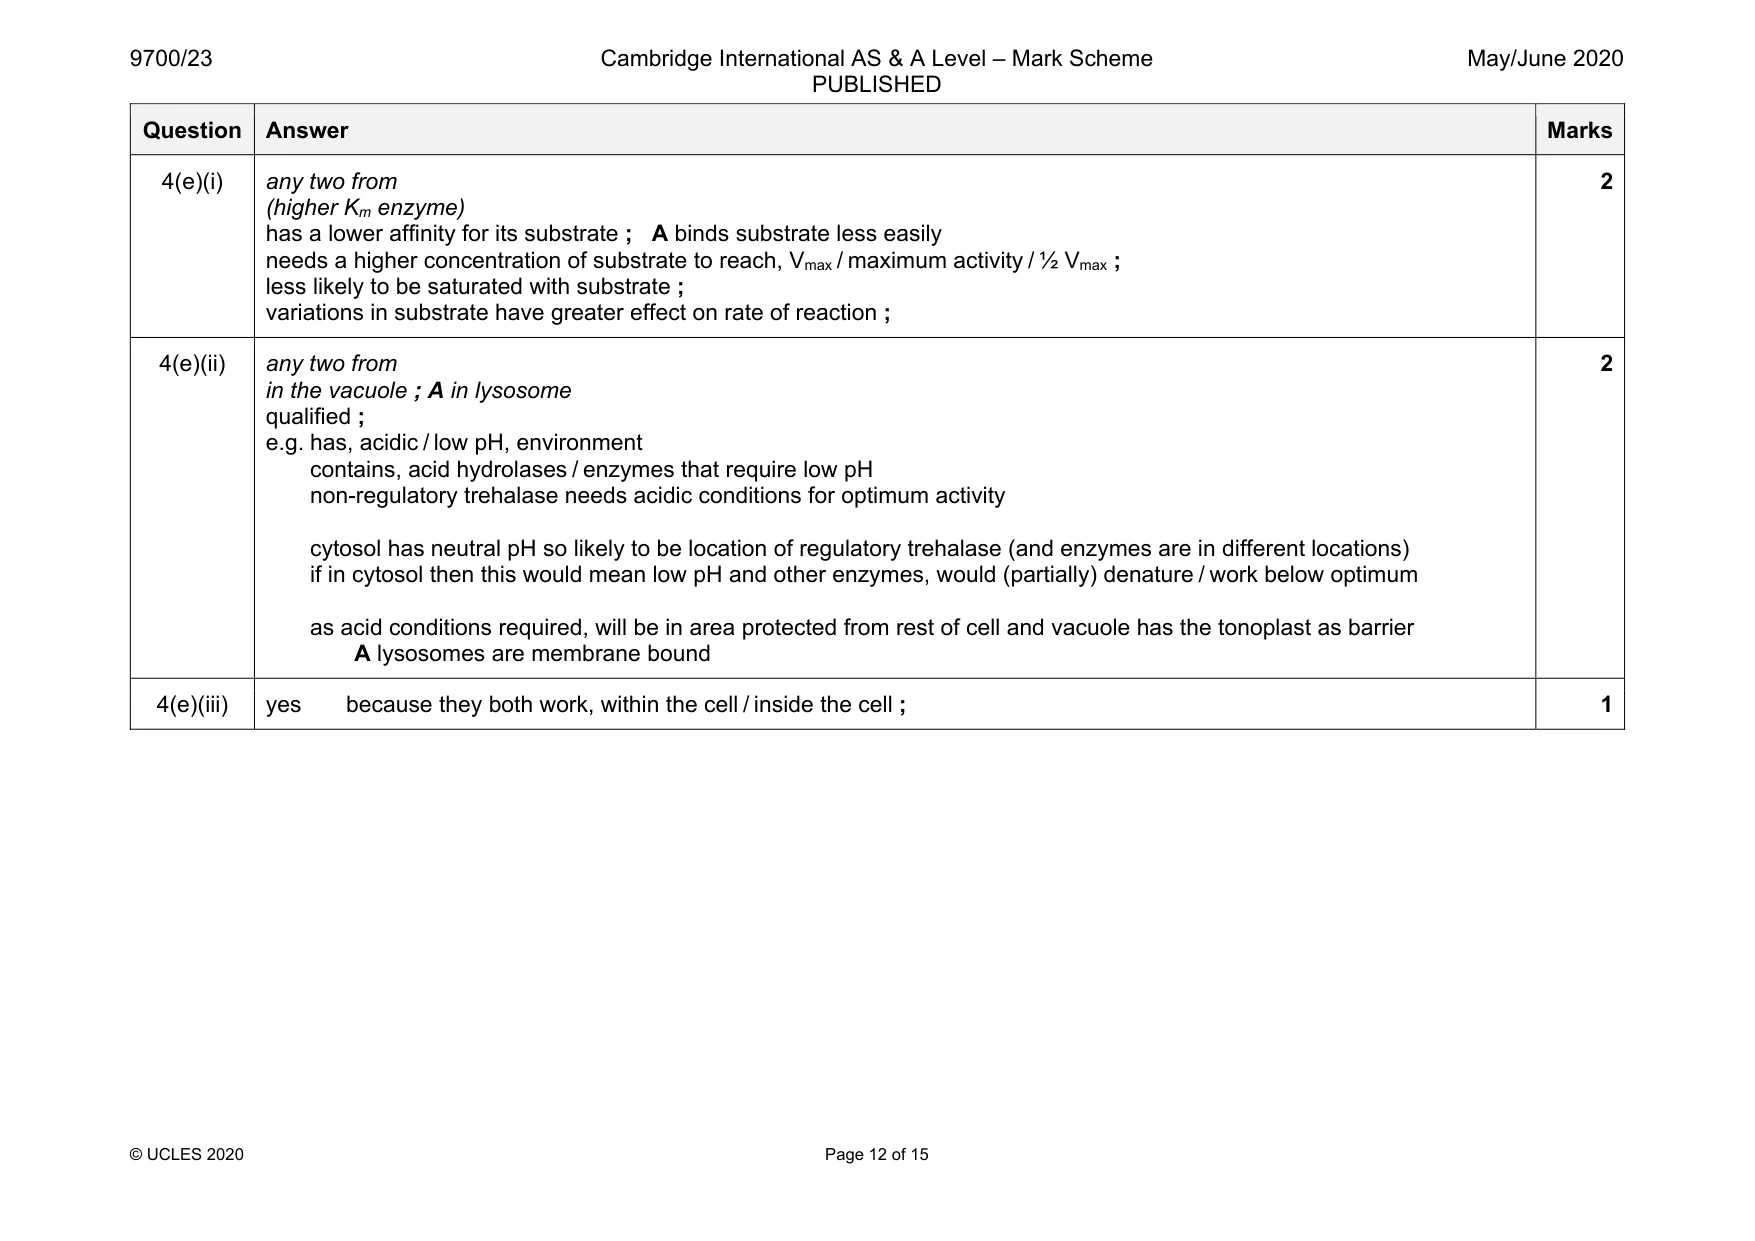
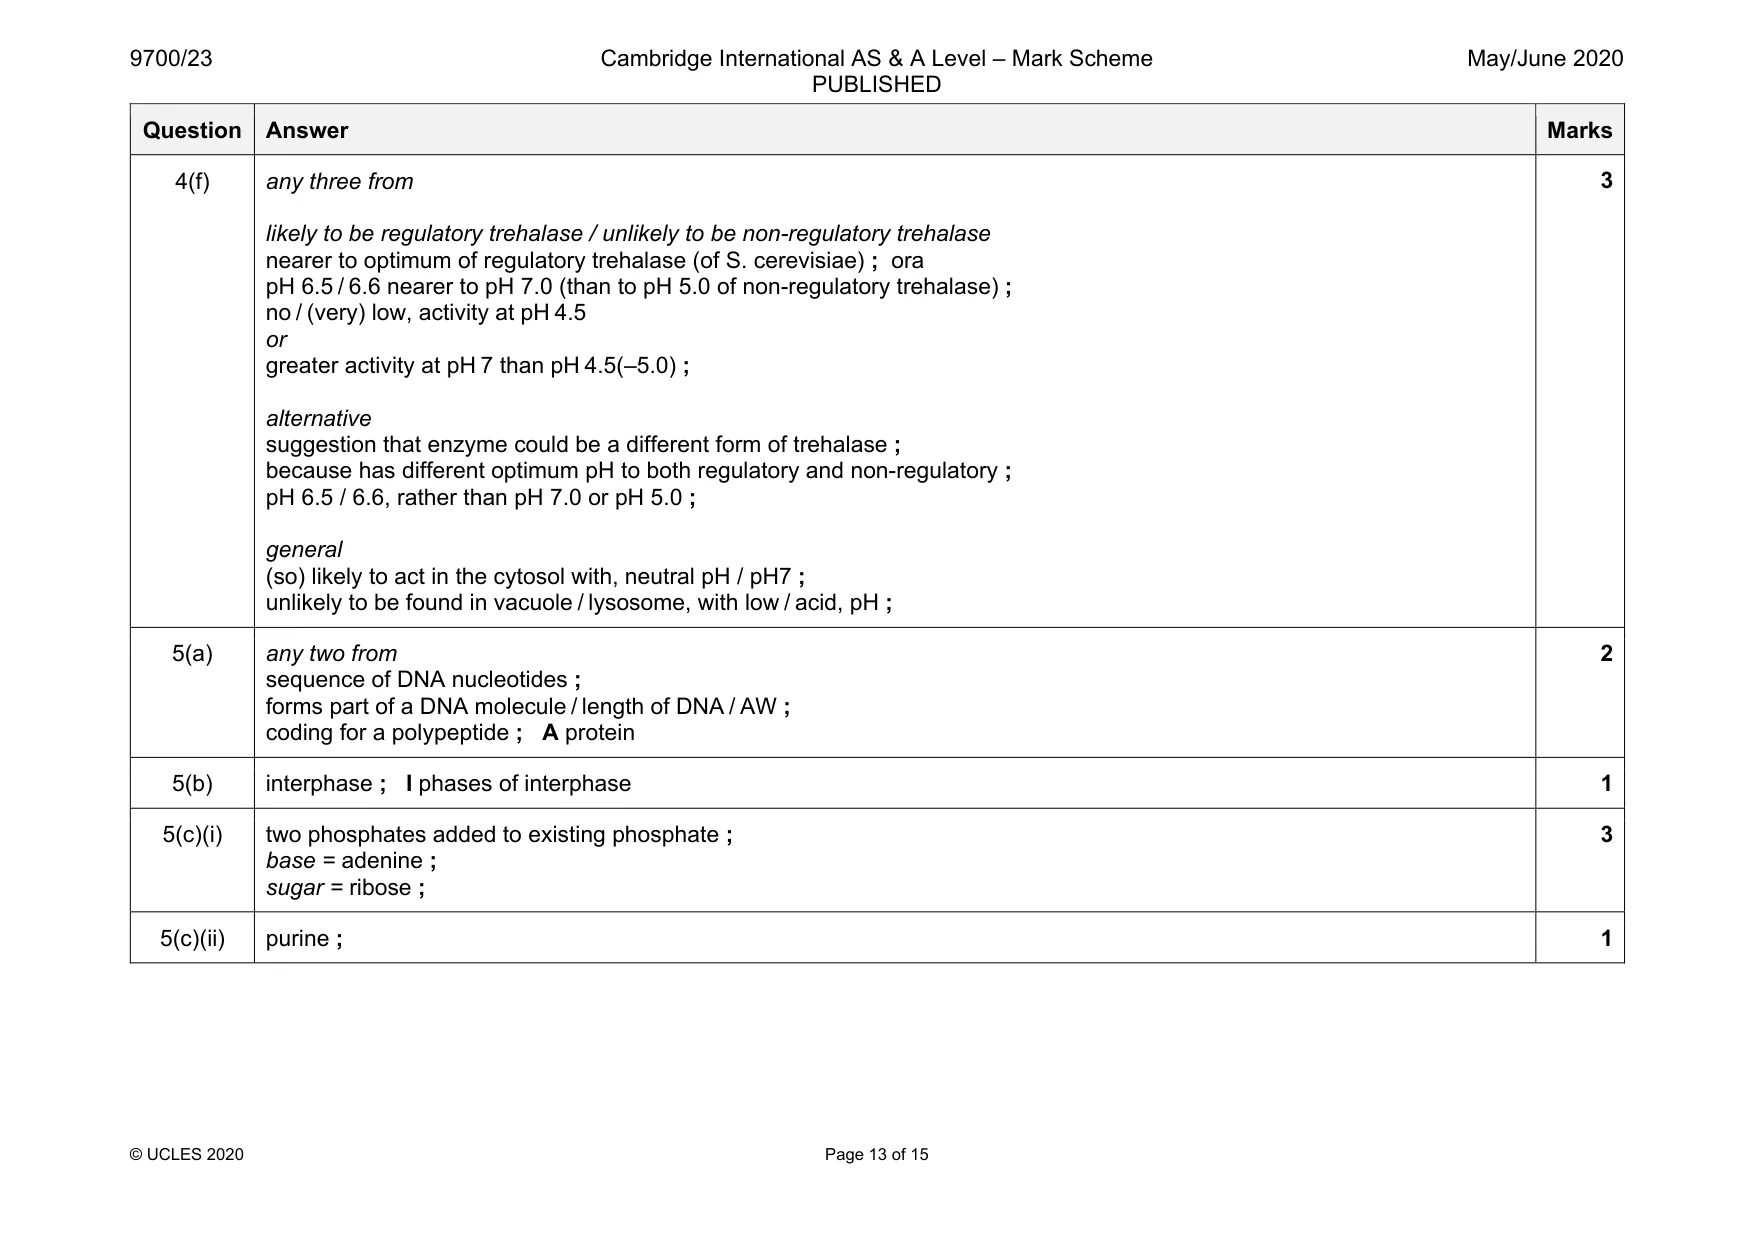
Mark scheme: 4(a) converted the measured length (in mm) to μm (and dropped the, μm / units) or multiplied the measurement by 1000 ; 1 4(b) phosphate(-containing) heads are hydrophilic or triglycerides do not have a hydrophilic portion ; lipid droplet is stored in / phosphate heads can interact with, cytosol / aqueous environment / watery environment ; 2 4(c) to, digest / break down, worn out organelles / waste metabolic products / toxic substances / AW ; A invading pathogens 1 Question Answer Marks 4(d)(i) correct orientation of H and OH on, C1 and on C3 ; OH added to carbon 6 ; 2 4(d)(ii) positive result is coloured precipitate ; only allow if hydrolysis noted A green / yellow / orange / brown / red, for colour any two from ref. to (heat with) Benedict’s (reagent / solution) and, negative test / no colour change / remains blue, and test again with Benedict’s ; boil with (hydrochloric) acid ; A hydrolyse with, acid / enzyme AVP ; e.g. use a fresh sample to hydrolyse boil for 5-10 minutes with acid cool before neutralising neutralise (remaining acid) with alkali test with universal indicator paper (to check for pH7) compare with a control allow one mark for heat with Benedict’s and coloured precipitate 3 Question Answer Marks 4(e)(i) any two from (higher Km enzyme) has a lower affinity for its substrate ; A binds substrate less easily needs a higher concentration of substrate to reach, Vmax / maximum activity / ½ Vmax ; less likely to be saturated with substrate ; variations in substrate have greater effect on rate of reaction ; 2 4(e)(ii) any two from in the vacuole ; A in lysosome qualified ; e.g. has, acidic / low pH, environment contains, acid hydrolases / enzymes that require low pH non-regulatory trehalase needs acidic conditions for optimum activity cytosol has neutral pH so likely to be location of regulatory trehalase (and enzymes are in different locations) if in cytosol then this would mean low pH and other enzymes, would (partially) denature / work below optimum as acid conditions required, will be in area protected from rest of cell and vacuole has the tonoplast as barrier A lysosomes are membrane bound 2 4(e)(iii) yes because they both work, within the cell / inside the cell ; 1 Question Answer Marks 4(f) any three from likely to be regulatory trehalase / unlikely to be non-regulatory trehalase nearer to optimum of regulatory trehalase (of S. cerevisiae) ; ora pH 6.5 / 6.6 nearer to pH 7.0 (than to pH 5.0 of non-regulatory trehalase) ; no / (very) low, activity at pH 4.5 or greater activity at pH 7 than pH 4.5(–5.0) ; alternative suggestion that enzyme could be a different form of trehalase ; because has different optimum pH to both regulatory and non-regulatory ; pH 6.5 / 6.6, rather than pH 7.0 or pH 5.0 ; general (so) likely to act in the cytosol with, neutral pH / pH7 ; unlikely to be found in vacuole / lysosome, with low / acid, pH ; 3 2
Q5 · Blood cells are formed from tissue stem cells in the bone marrow
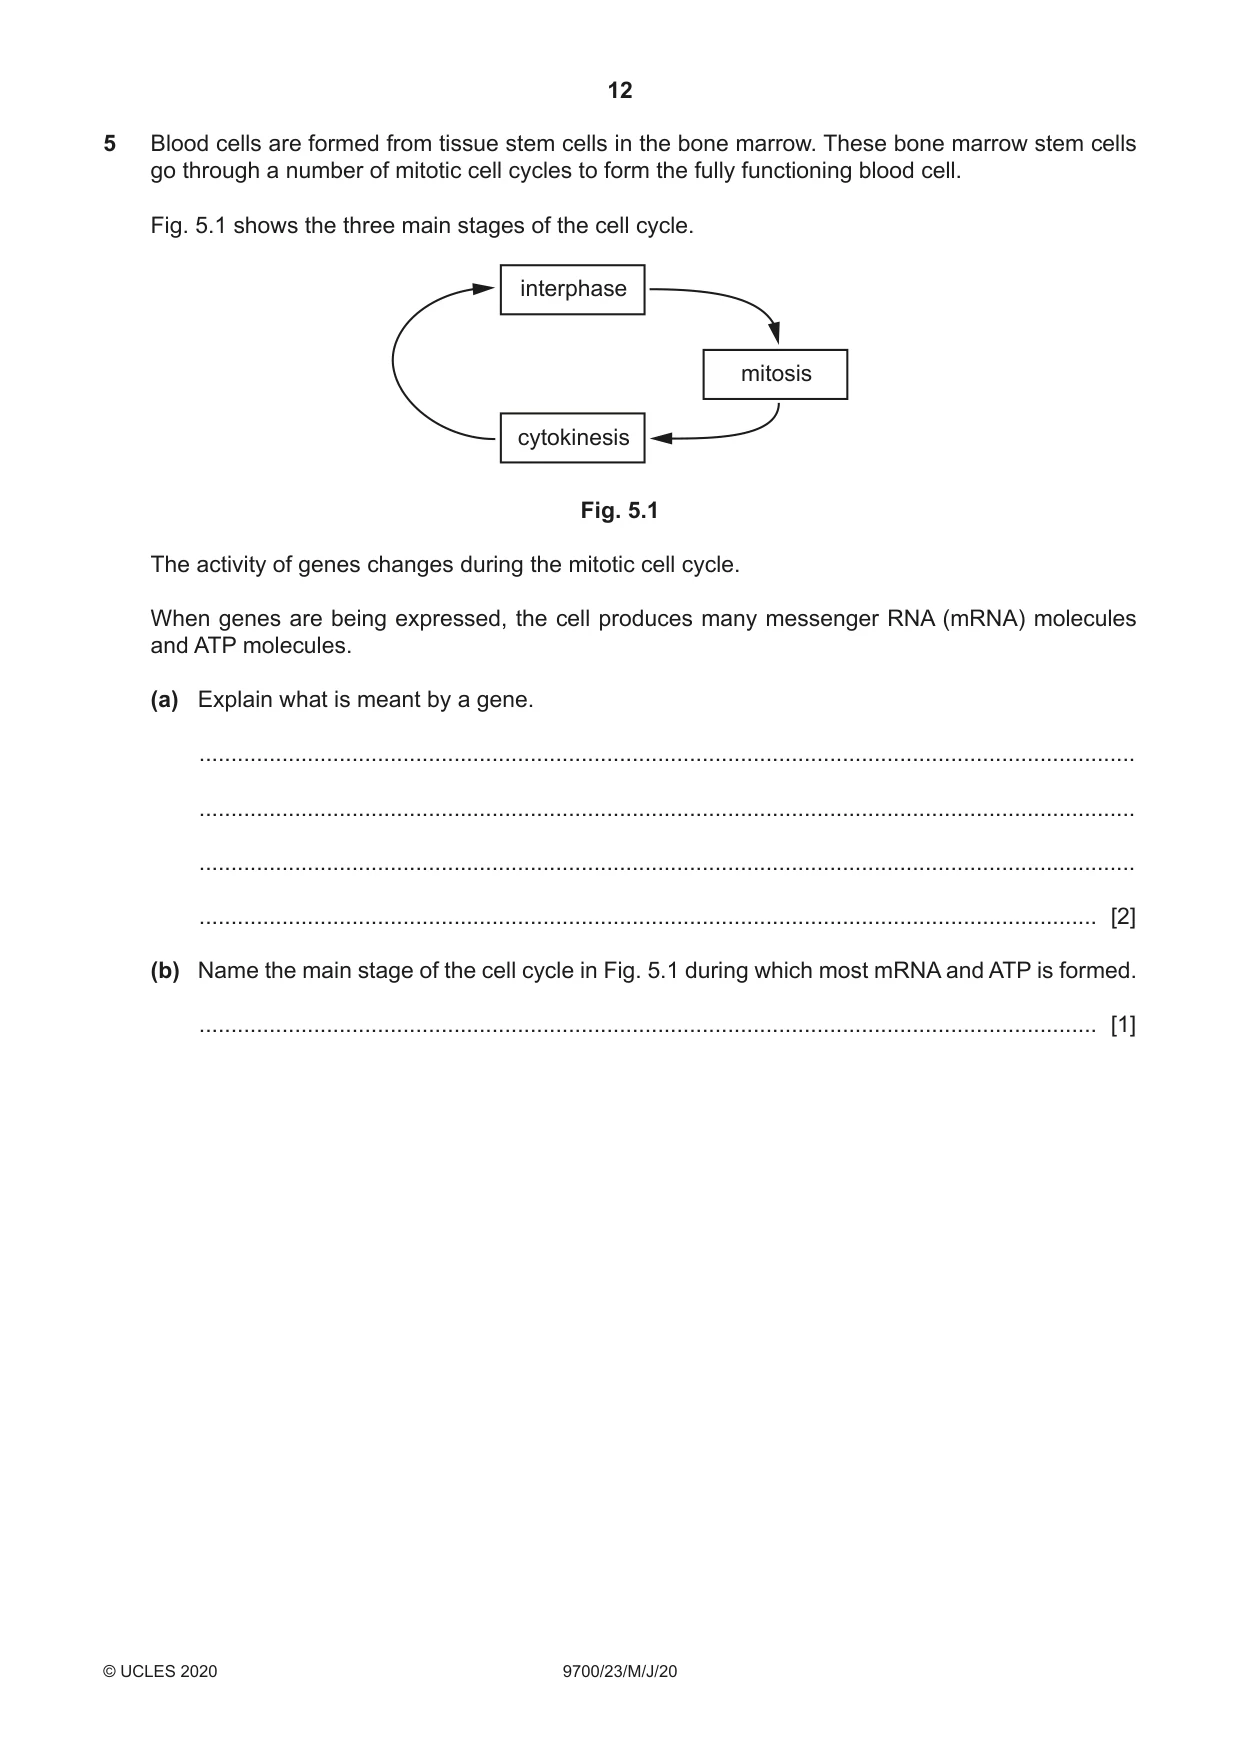
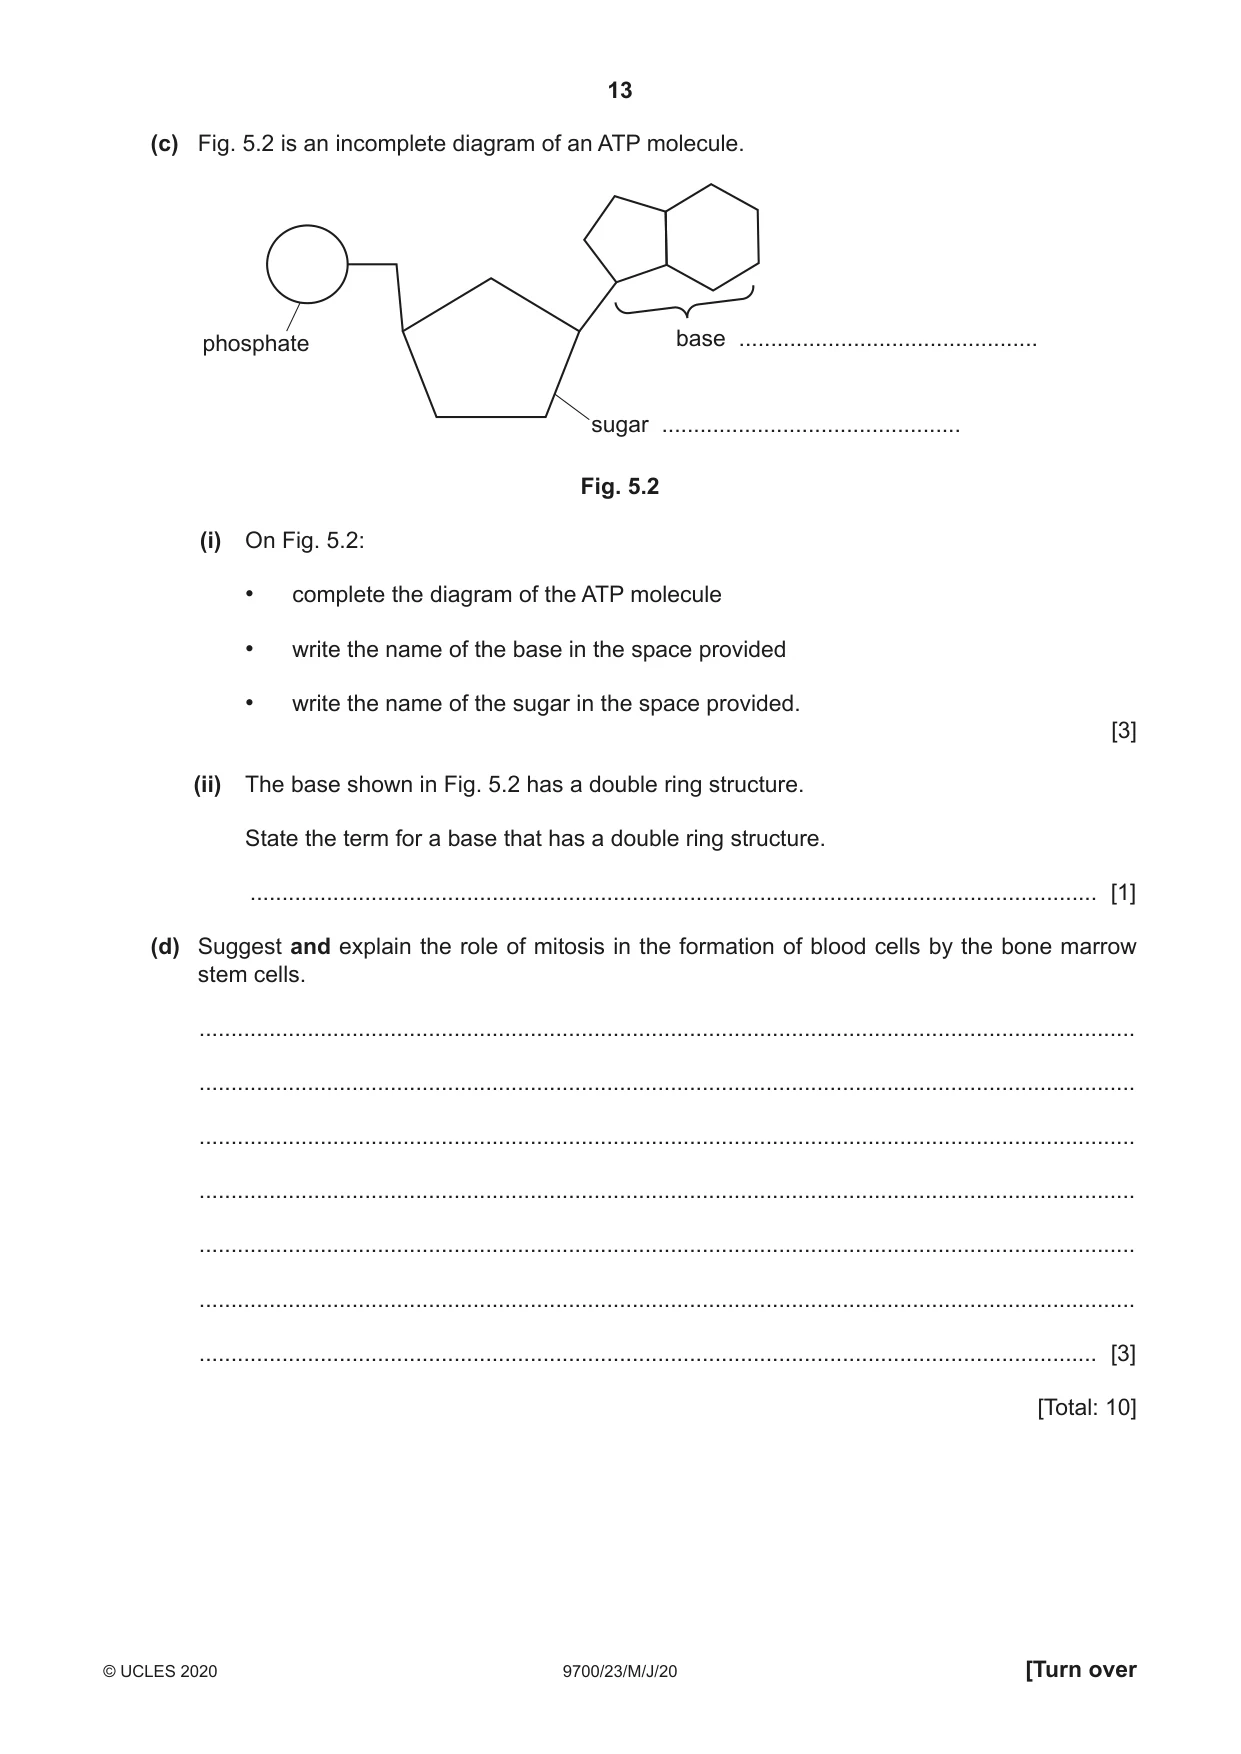
5 Blood cells are formed from tissue stem cells in the bone marrow. These bone marrow stem cells go through a number of mitotic cell cycles to form the fully functioning blood cell. Fig. 5.1 shows the three main stages of the cell cycle. interphase mitosis cytokinesis Fig. 5.1 The activity of genes changes during the mitotic cell cycle. When genes are being expressed, the cell produces many messenger RNA (mRNA) molecules and ATP molecules. (a) Explain what is meant by a gene. ................................................................................................................................................... ................................................................................................................................................... ................................................................................................................................................... ............................................................................................................................................. [2] (b) Name the main stage of the cell cycle in Fig. 5.1 during which most mRNA and ATP is formed. ............................................................................................................................................. [1] (c) Fig. 5.2 is an incomplete diagram of an ATP molecule. phosphate base ............................................... sugar ............................................... Fig. 5.2 (i) On Fig. 5.2: • complete the diagram of the ATP molecule • write the name of the base in the space provided • write the name of the sugar in the space provided. [3] (ii) The base shown in Fig. 5.2 has a double ring structure. State the term for a base that has a double ring structure. ..................................................................................................................................... [1] (d) Suggest and explain the role of mitosis in the formation of blood cells by the bone marrow stem cells. ................................................................................................................................................... ................................................................................................................................................... ................................................................................................................................................... ................................................................................................................................................... ................................................................................................................................................... ................................................................................................................................................... ............................................................................................................................................. [3] [Total: 10]
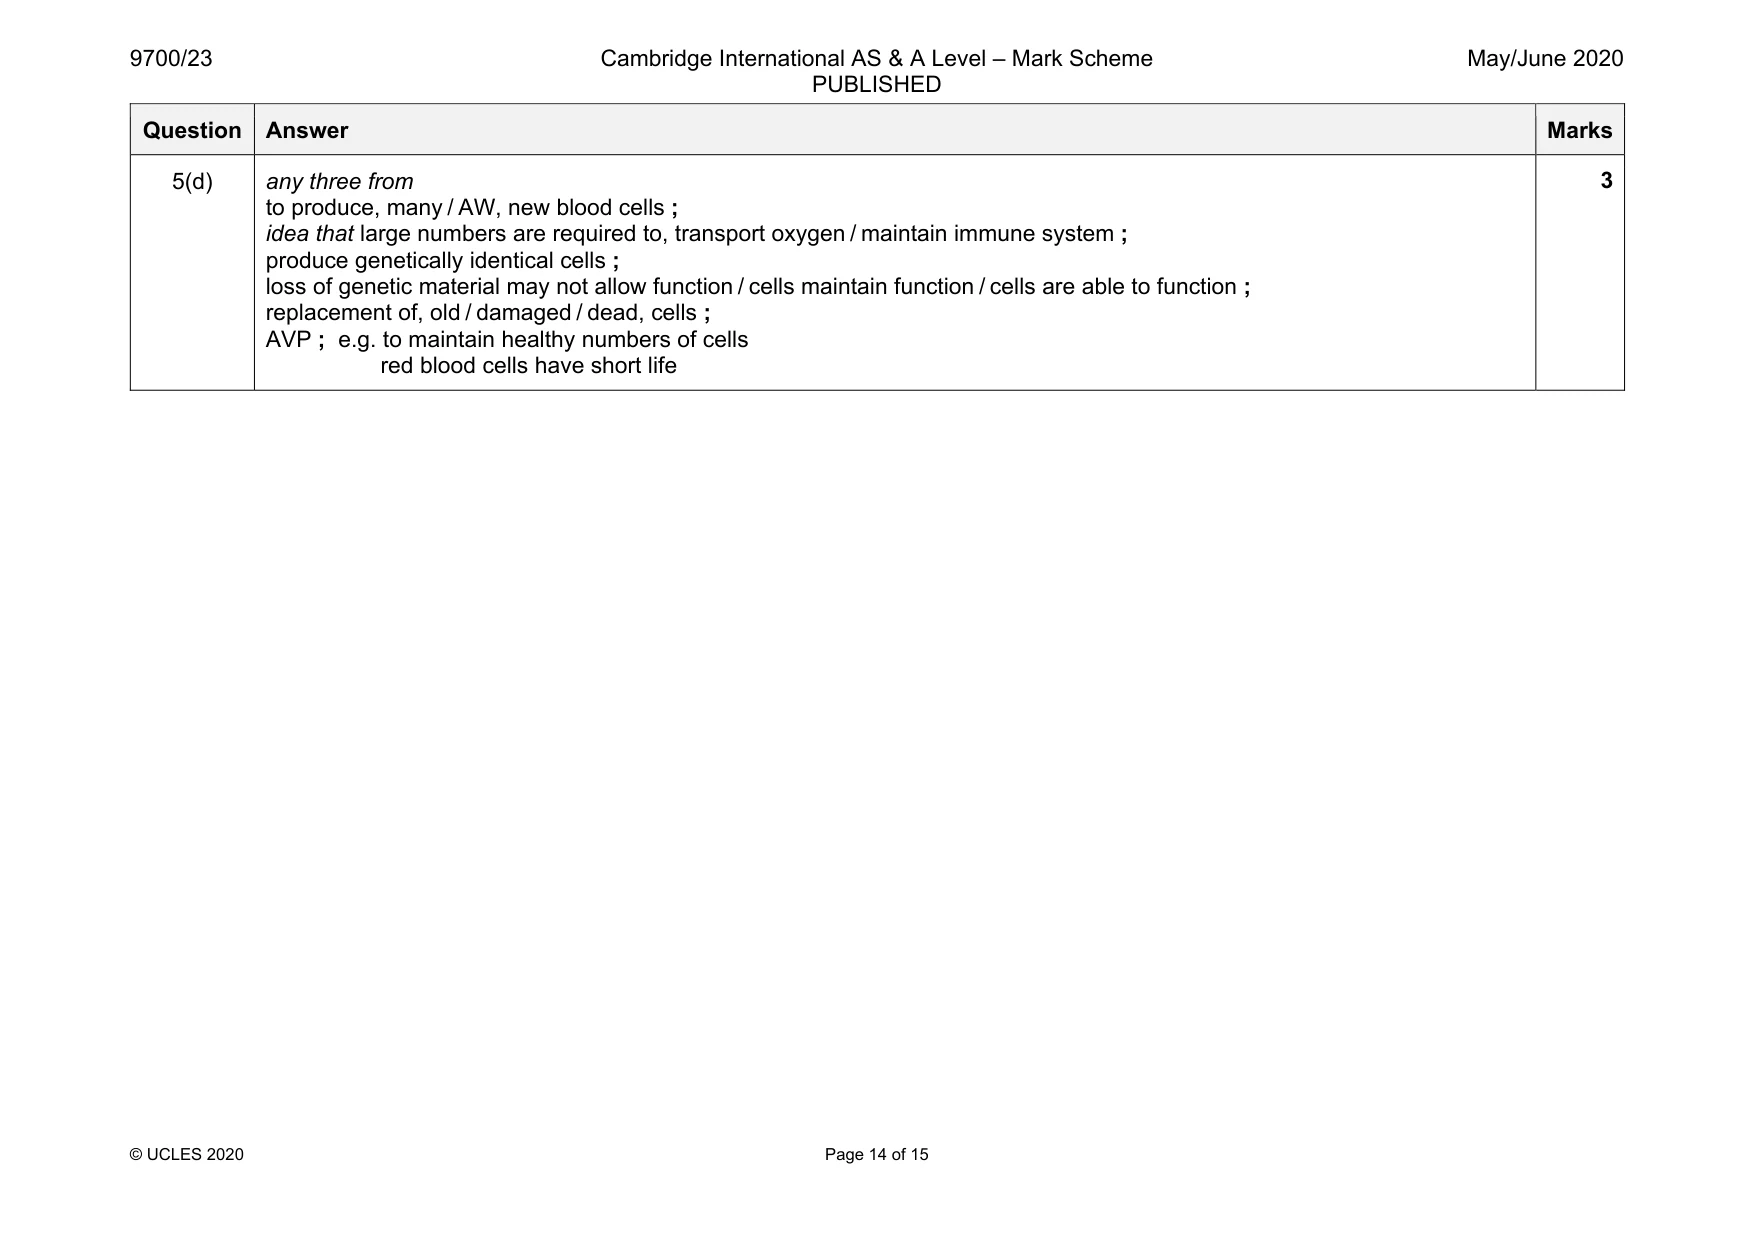
Mark scheme: 5(a) any two from sequence of DNA nucleotides ; forms part of a DNA molecule / length of DNA / AW ; coding for a polypeptide ; A protein 5(b) interphase ; I phases of interphase 1 5(c)(i) two phosphates added to existing phosphate ; base = adenine ; sugar = ribose ; 3 5(c)(ii) purine ; 1 Question Answer Marks 5(d) any three from to produce, many / AW, new blood cells ; idea that large numbers are required to, transport oxygen / maintain immune system ; produce genetically identical cells ; loss of genetic material may not allow function / cells maintain function / cells are able to function ; replacement of, old / damaged / dead, cells ; AVP ; e.g. to maintain healthy numbers of cells red blood cells have short life 3 Question Answer Marks 3
Q6 · A student carried out an investigation to estimate the water potential of potato tissue
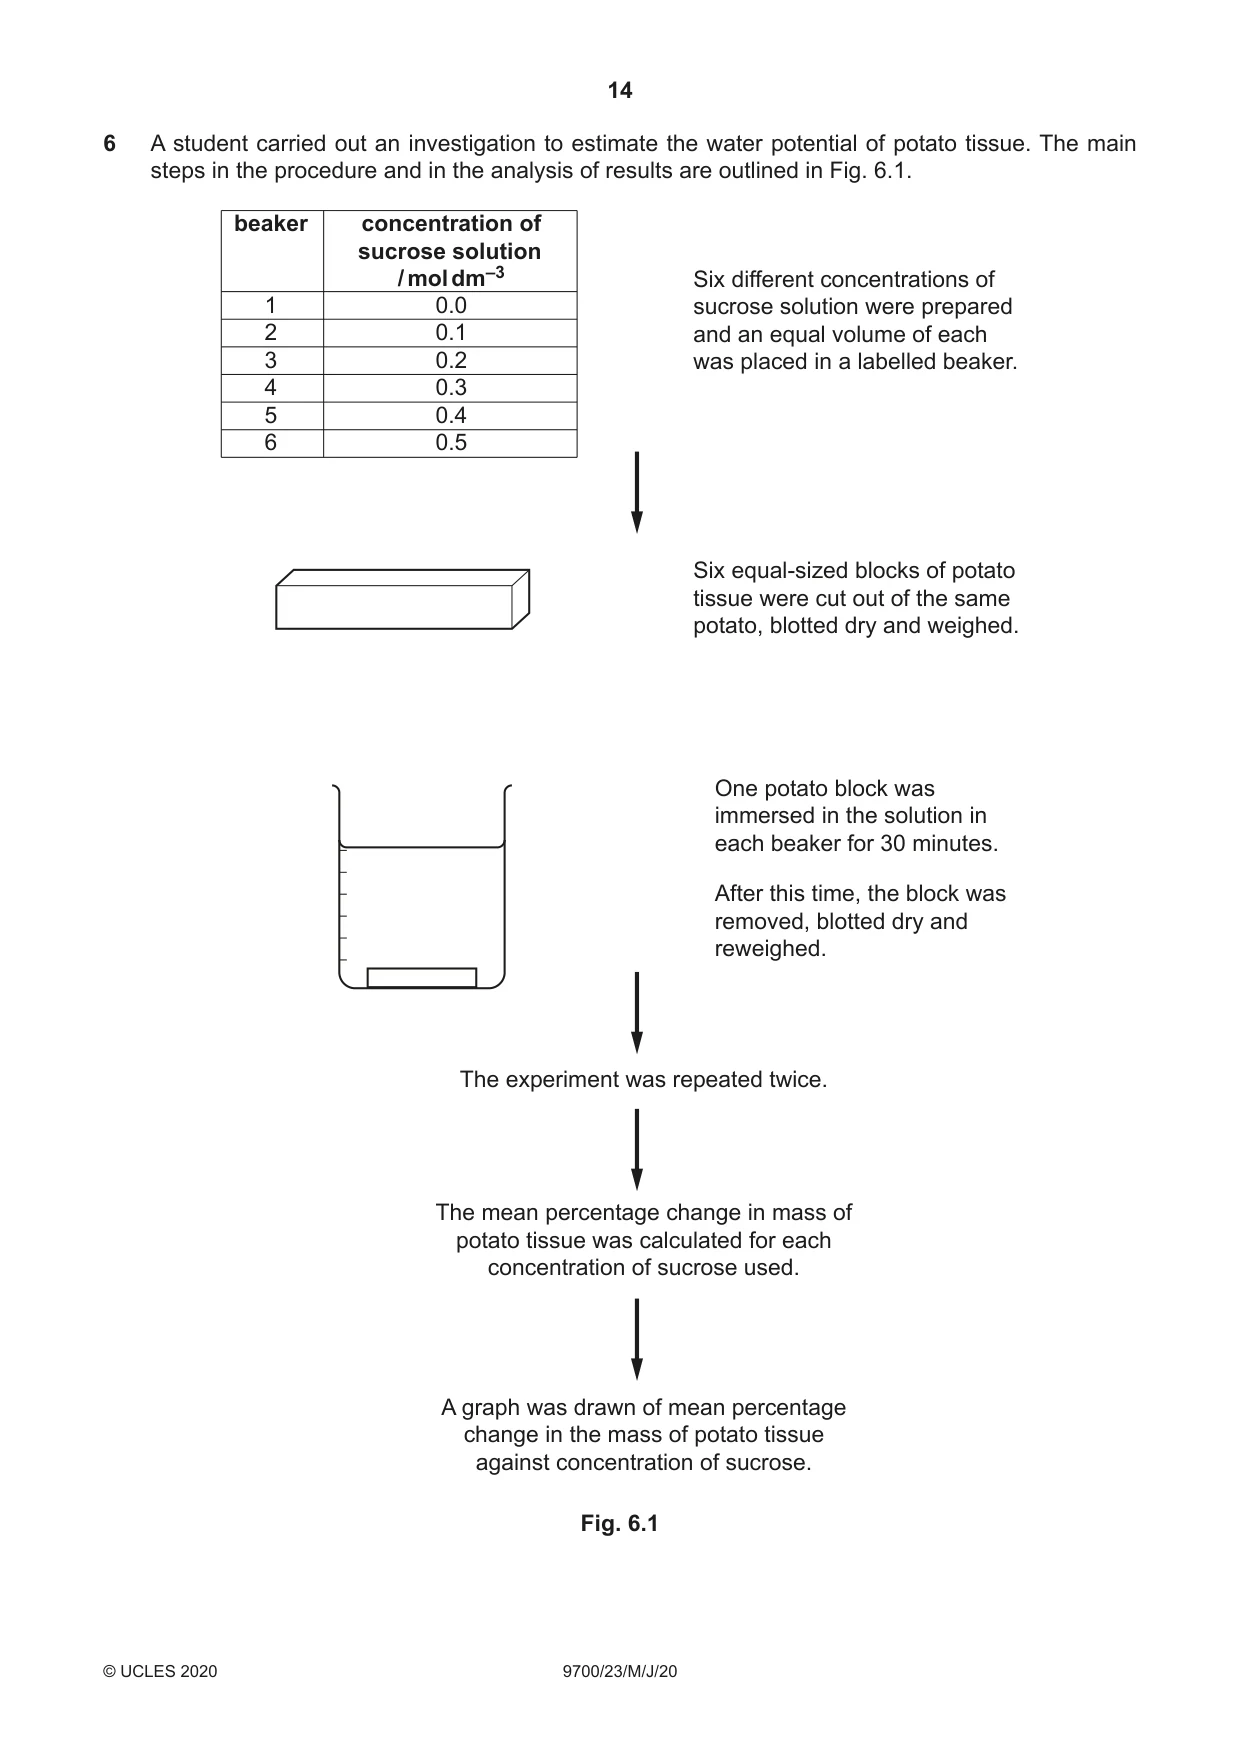
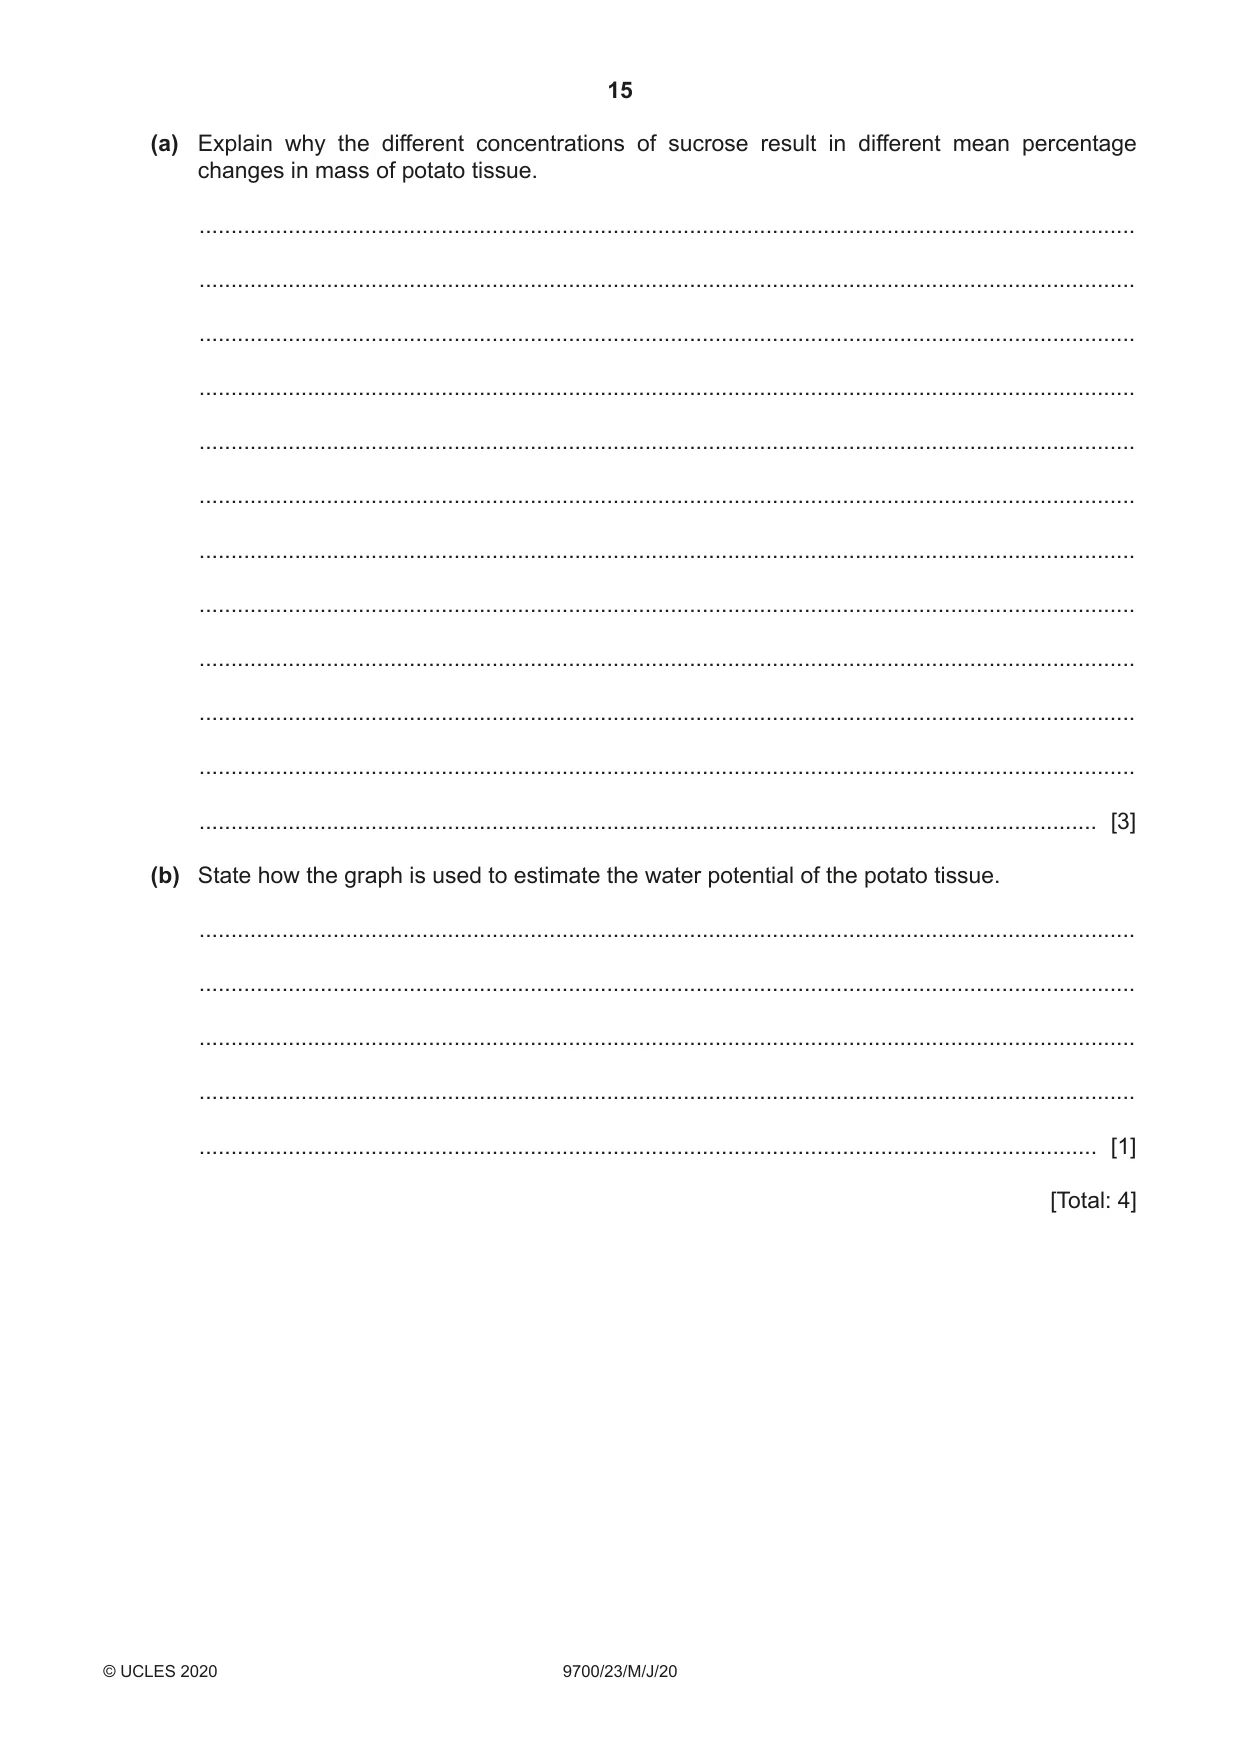
6 A student carried out an investigation to estimate the water potential of potato tissue. The main steps in the procedure and in the analysis of results are outlined in Fig. 6.1. beaker concentration of sucrose solution / mol dm–3 Six different concentrations of 1 0.0 sucrose solution were prepared 2 0.1 and an equal volume of each 3 0.2 was placed in a labelled beaker. 4 0.3 5 0.4 6 0.5 Six equal-sized blocks of potato tissue were cut out of the same potato, blotted dry and weighed. One potato block was immersed in the solution in each beaker for 30 minutes. After this time, the block was removed, blotted dry and reweighed. The experiment was repeated twice. The mean percentage change in mass of potato tissue was calculated for each concentration of sucrose used. A graph was drawn of mean percentage change in the mass of potato tissue against concentration of sucrose. Fig. 6.1 (a) Explain why the different concentrations of sucrose result in different mean percentage changes in mass of potato tissue. ................................................................................................................................................... ................................................................................................................................................... ................................................................................................................................................... ................................................................................................................................................... ................................................................................................................................................... ................................................................................................................................................... ................................................................................................................................................... ................................................................................................................................................... ................................................................................................................................................... ................................................................................................................................................... ................................................................................................................................................... ............................................................................................................................................. [3] (b) State how the graph is used to estimate the water potential of the potato tissue. ................................................................................................................................................... ................................................................................................................................................... ................................................................................................................................................... ................................................................................................................................................... ............................................................................................................................................. [1] [Total: 4]
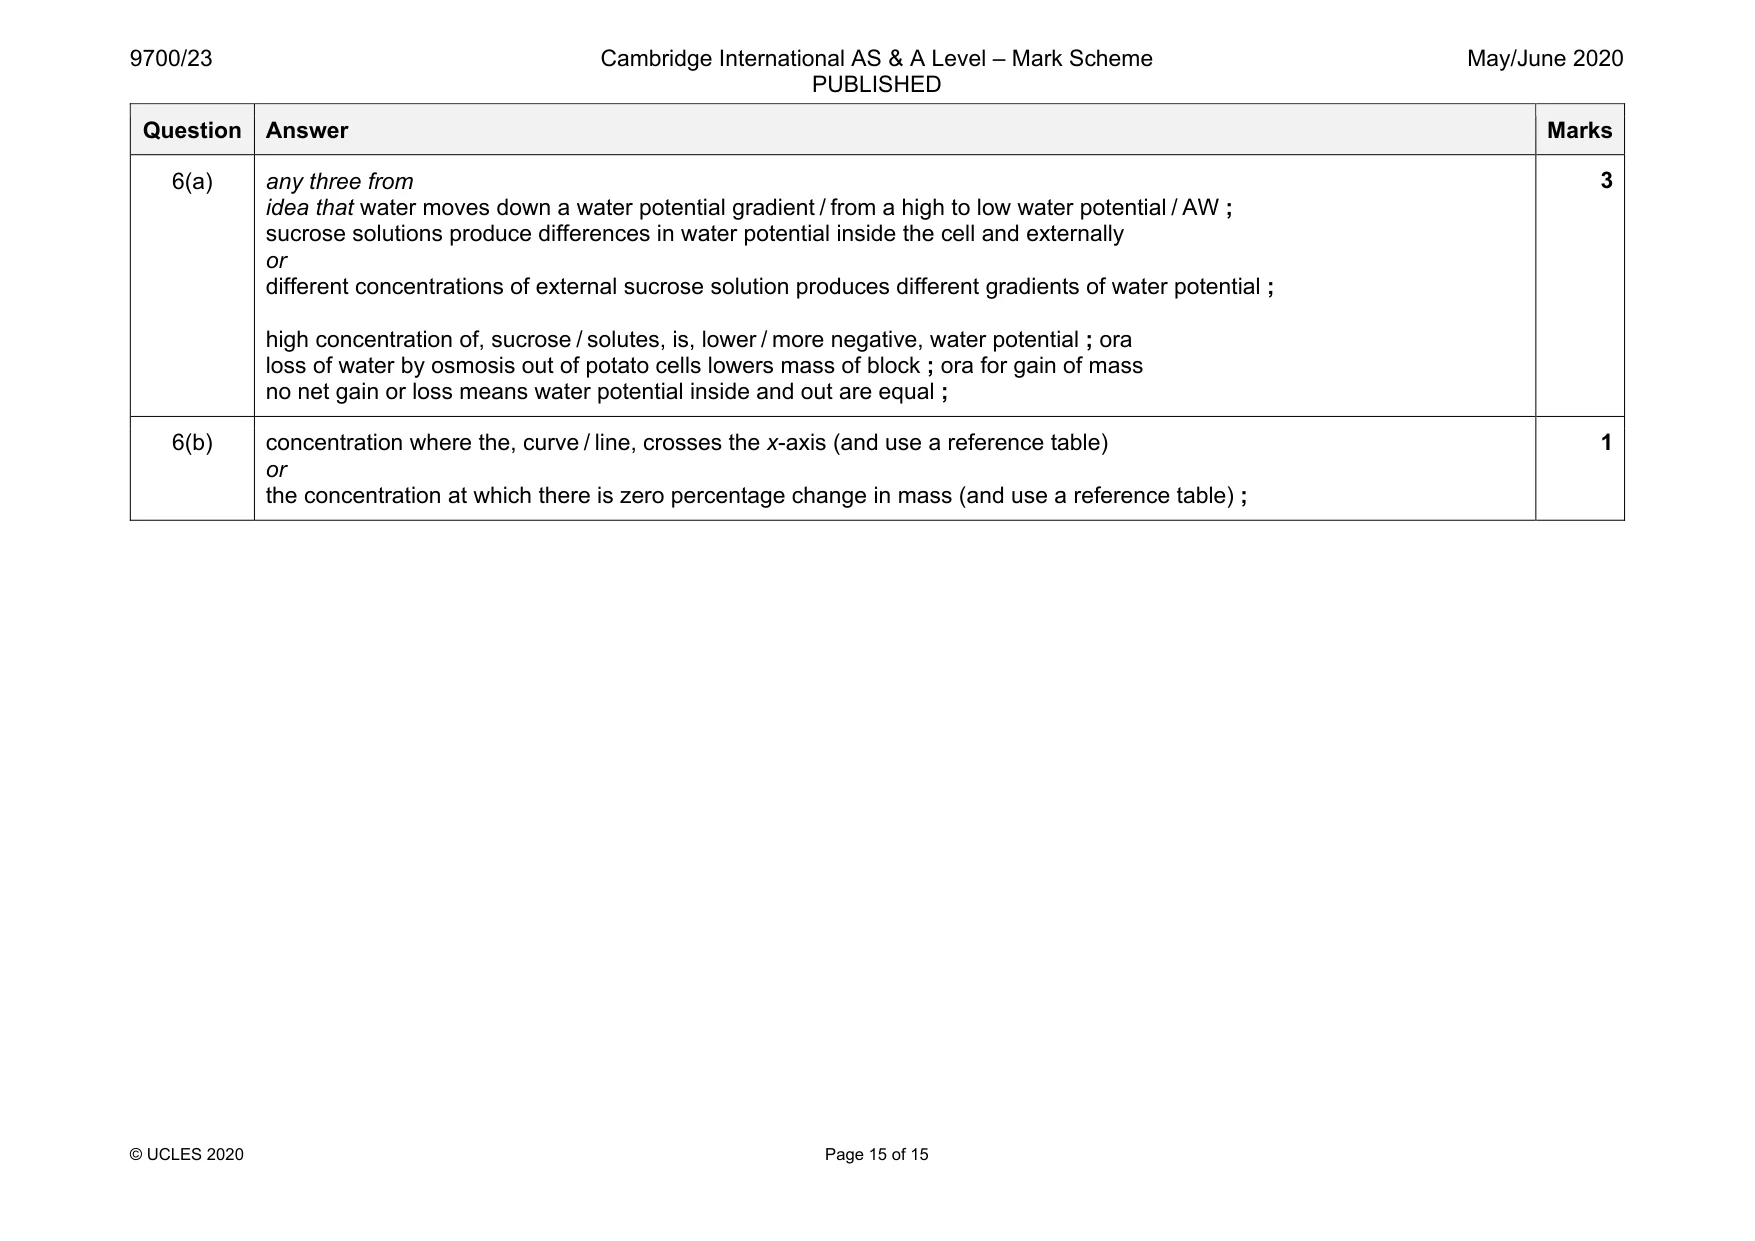
Mark scheme: 6(a) any three from idea that water moves down a water potential gradient / from a high to low water potential / AW ; sucrose solutions produce differences in water potential inside the cell and externally or different concentrations of external sucrose solution produces different gradients of water potential ; high concentration of, sucrose / solutes, is, lower / more negative, water potential ; ora loss of water by osmosis out of potato cells lowers mass of block ; ora for gain of mass no net gain or loss means water potential inside and out are equal ; 6(b) concentration where the, curve / line, crosses the x-axis (and use a reference table) or the concentration at which there is zero percentage change in mass (and use a reference table) ; 1
What was in this paper
The subtopics covered by these 6 questions, and how many questions each got. Open one in a new tab to see every Cambridge question on it.