Cambridge A Level Biology 9700 — 2020 May/June Paper 2 · Variant 1
9700/21/M/J/20 · 6 questions · 60 marks · ≈68 min
The question paper and its mark scheme, free to read here and free to download. This is Cambridge’s own paper, exactly as it was sat.
Question paper16 pages
Mark scheme14 pages
Answers below. Sit the paper first if you are practising.
Questions as text
Question 1
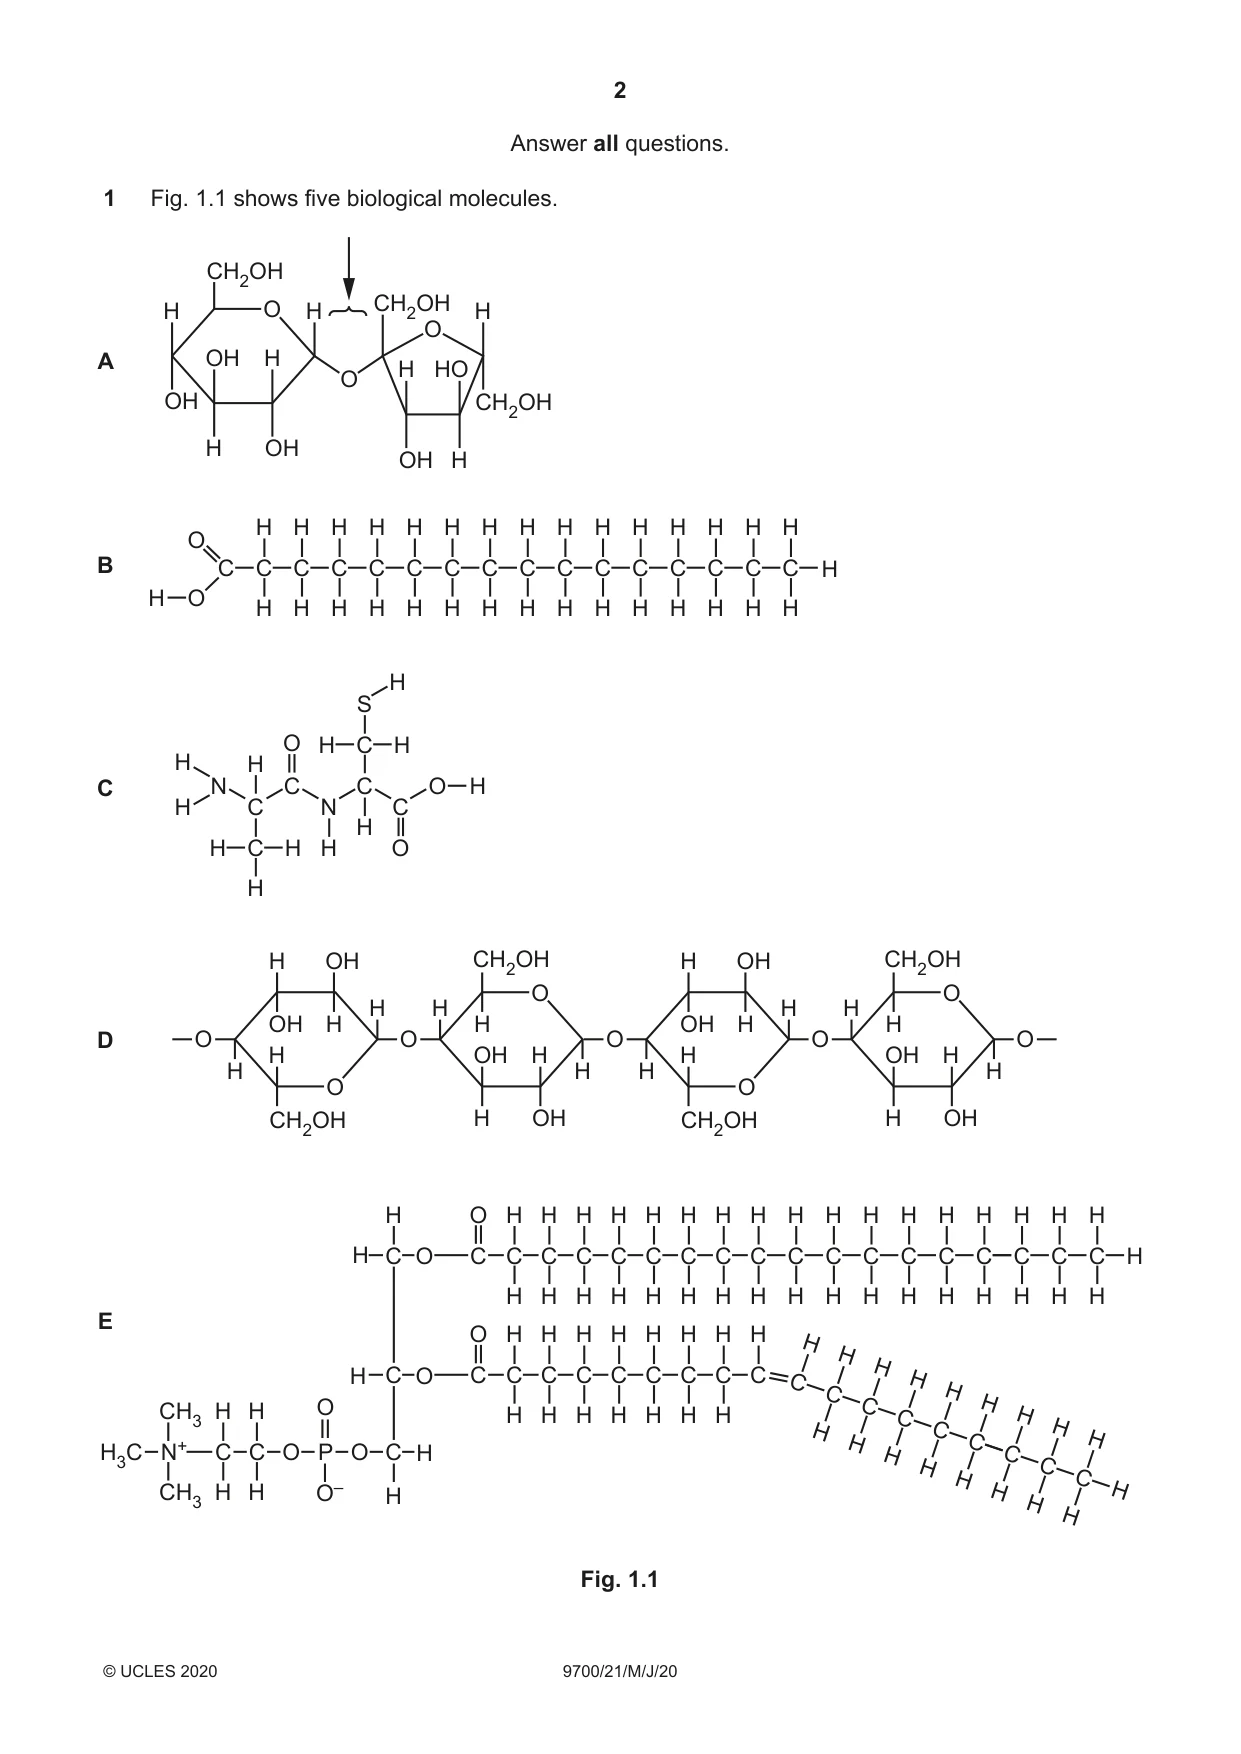
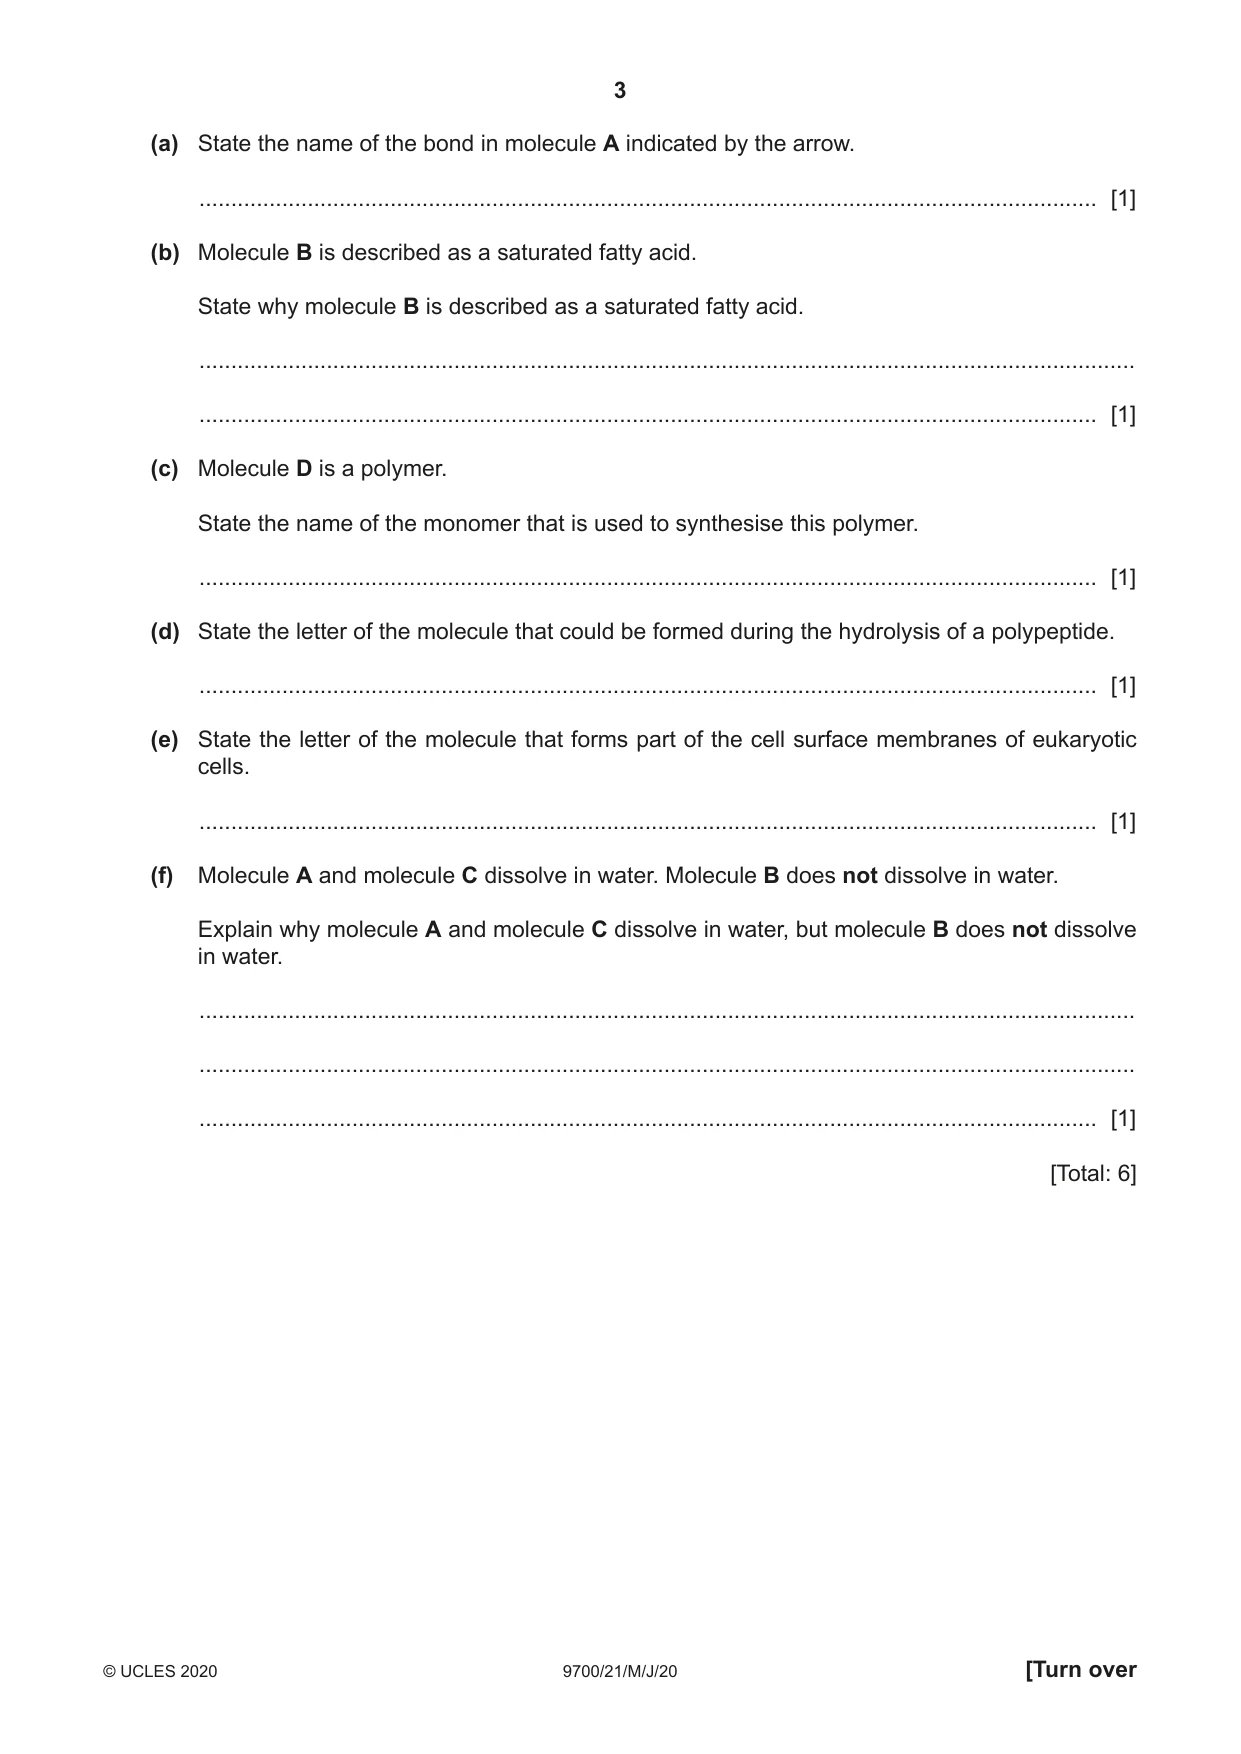
1 Fig. 1.1 shows five biological molecules. CH2OH H O H CH2OH H O A OH H H HO O OH CH2OH H OH OH H H H H H H H H H H H H H H H H O B C C C C C C C C C C C C C C C C H H O H H H H H H H H H H H H H H H H S O H C H H H C N C C O H H C N C H H C H H O H H OH CH2OH H OH CH2OH O O H H H H OH H H OH H H D O O O O O H OH H H OH H H H H H O O CH2OH H OH CH2OH H OH H O H H H H H H H H H H H H H H H H H H C O C C C C C C C C C C C C C C C C C C H H H H H H H H H H H H H H H H H H E O H H H H H H H H H H H H H C O C C C C C C C C C C C H CH3 H H O H H H H H H H C C H H H C H H C H C HH3C N+ C C O P O C H H C H C CH3 H H O– H H H H H Fig. 1.1 (a) State the name of the bond in molecule A indicated by the arrow. ............................................................................................................................................. [1] (b) Molecule B is described as a saturated fatty acid. State why molecule B is described as a saturated fatty acid. ................................................................................................................................................... ............................................................................................................................................. [1] (c) Molecule D is a polymer. State the name of the monomer that is used to synthesise this polymer. ............................................................................................................................................. [1] (d) State the letter of the molecule that could be formed during the hydrolysis of a polypeptide. ............................................................................................................................................. [1] (e) State the letter of the molecule that forms part of the cell surface membranes of eukaryotic cells. ............................................................................................................................................. [1] (f) Molecule A and molecule C dissolve in water. Molecule B does not dissolve in water. Explain why molecule A and molecule C dissolve in water, but molecule B does not dissolve in water. ................................................................................................................................................... ................................................................................................................................................... ............................................................................................................................................. [1] [Total: 6]
Mark scheme: 1(a) glycosidic ; 1 1(b) any one from: no double, bond / bonds, in hydrocarbon chain ; each carbon (atom) in the hydrocarbon chain is bonded to two hydrogen atoms ; there is, a full complement / maximum number, of hydrogen atoms on the hydrocarbon chain ; A aliphatic chain for hydrocarbon chain A hydrogens for hydrogen atoms 1 1(c) β-glucose / beta-glucose ; R B-glucose 1 1(d) C ; 1 1(e) E ; 1 1(f) any one from: A and C are, polar / hydrophilic ; A has many, OH / hydroxyl groups B is, non-polar / hydrophobic ; A has, only one OH / no groups, that interact with water 1
Q2 · Some stages of the cell cycle in the meristematic tissue in the root tip of a plant
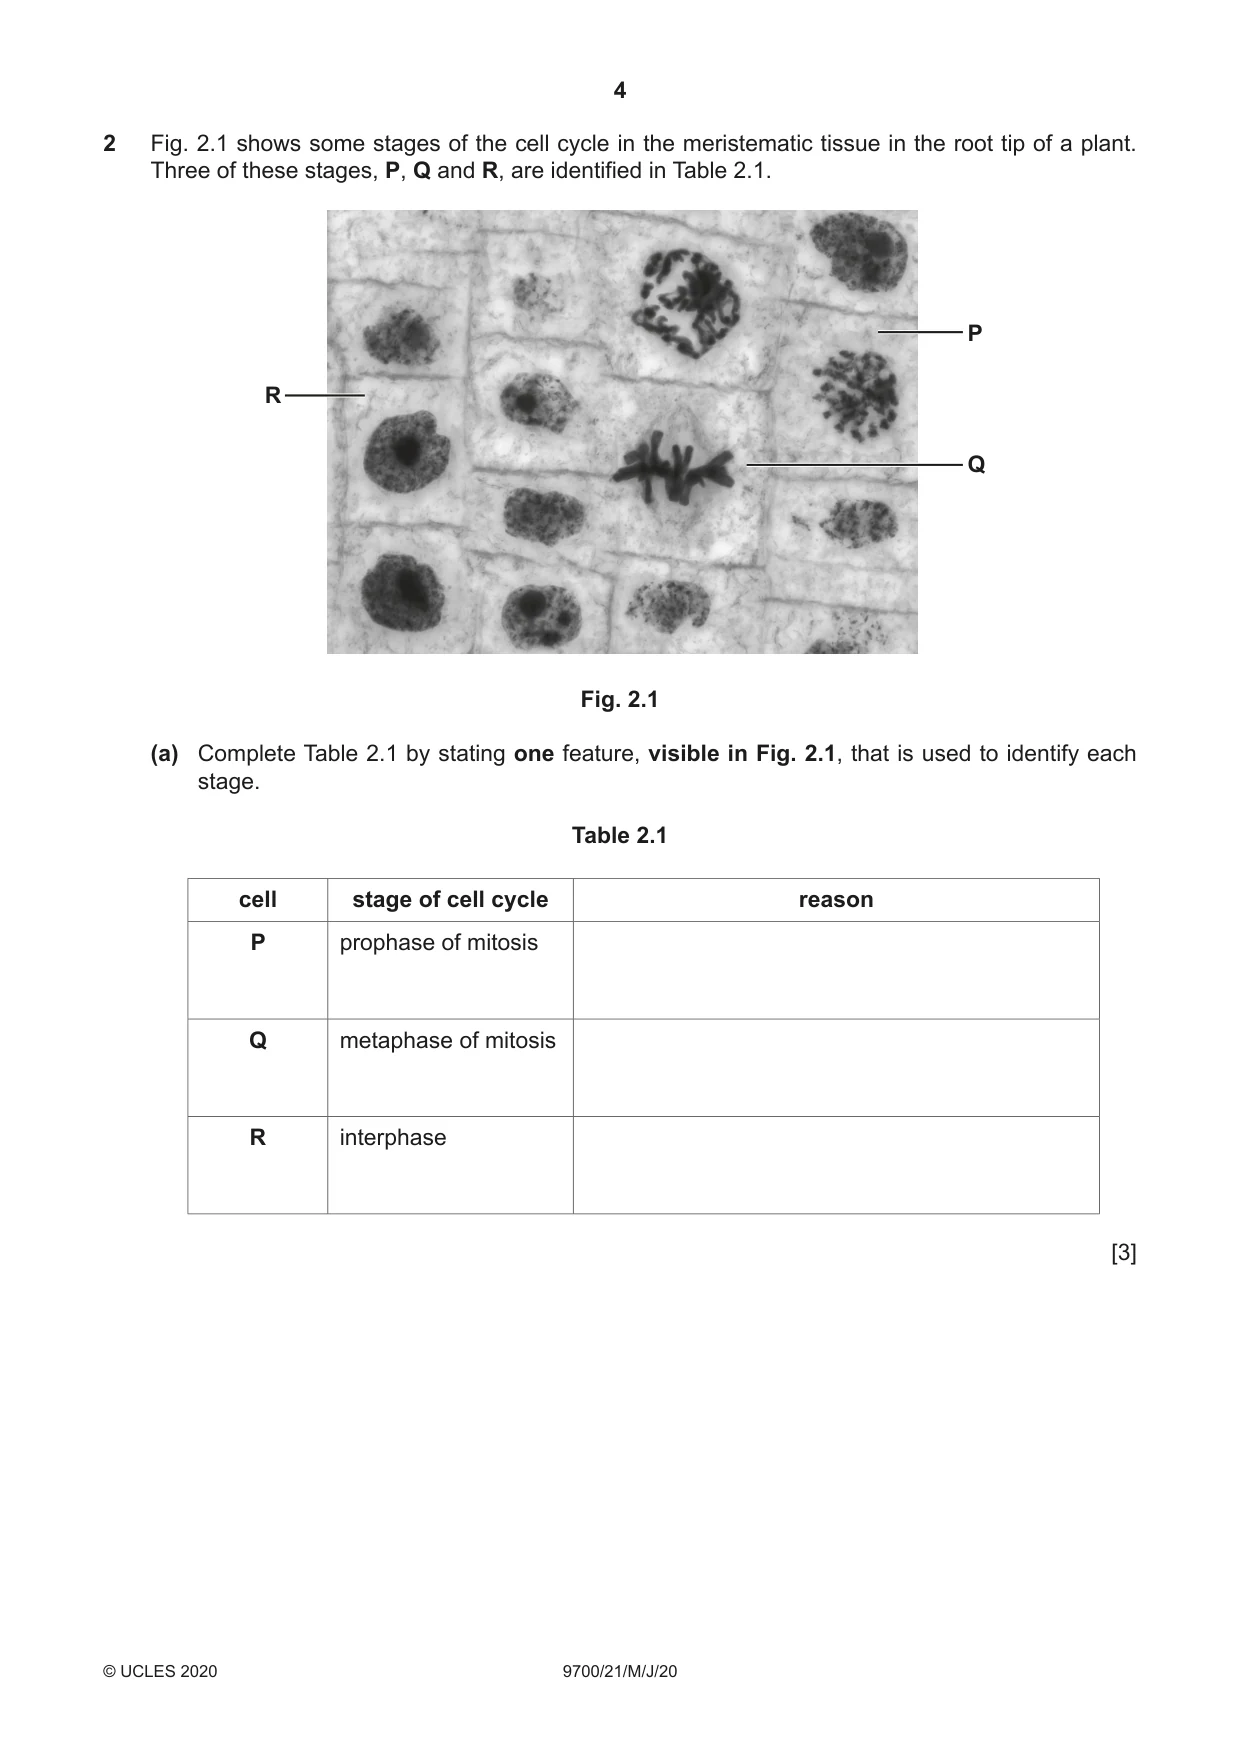
2 Fig. 2.1 shows some stages of the cell cycle in the meristematic tissue in the root tip of a plant. Three of these stages, P, Q and R, are identified in Table 2.1. P R Q Fig. 2.1 (a) Complete Table 2.1 by stating one feature, visible in Fig. 2.1, that is used to identify each stage. Table 2.1 cell stage of cell cycle reason P prophase of mitosis Q metaphase of mitosis R interphase [3] (b) (i) Draw a labelled diagram to show one chromosome at metaphase of mitosis. On the chromosome you have drawn add labels to show: • the position of a telomere • a chromatid • the centromere. [4] (ii) State the type of protein that is associated with DNA in chromosomes. ..................................................................................................................................... [1] (iii) Describe how the spindle is involved during the process of mitosis. ........................................................................................................................................... ........................................................................................................................................... ........................................................................................................................................... ........................................................................................................................................... ........................................................................................................................................... ........................................................................................................................................... ..................................................................................................................................... [3] [Total: 11]
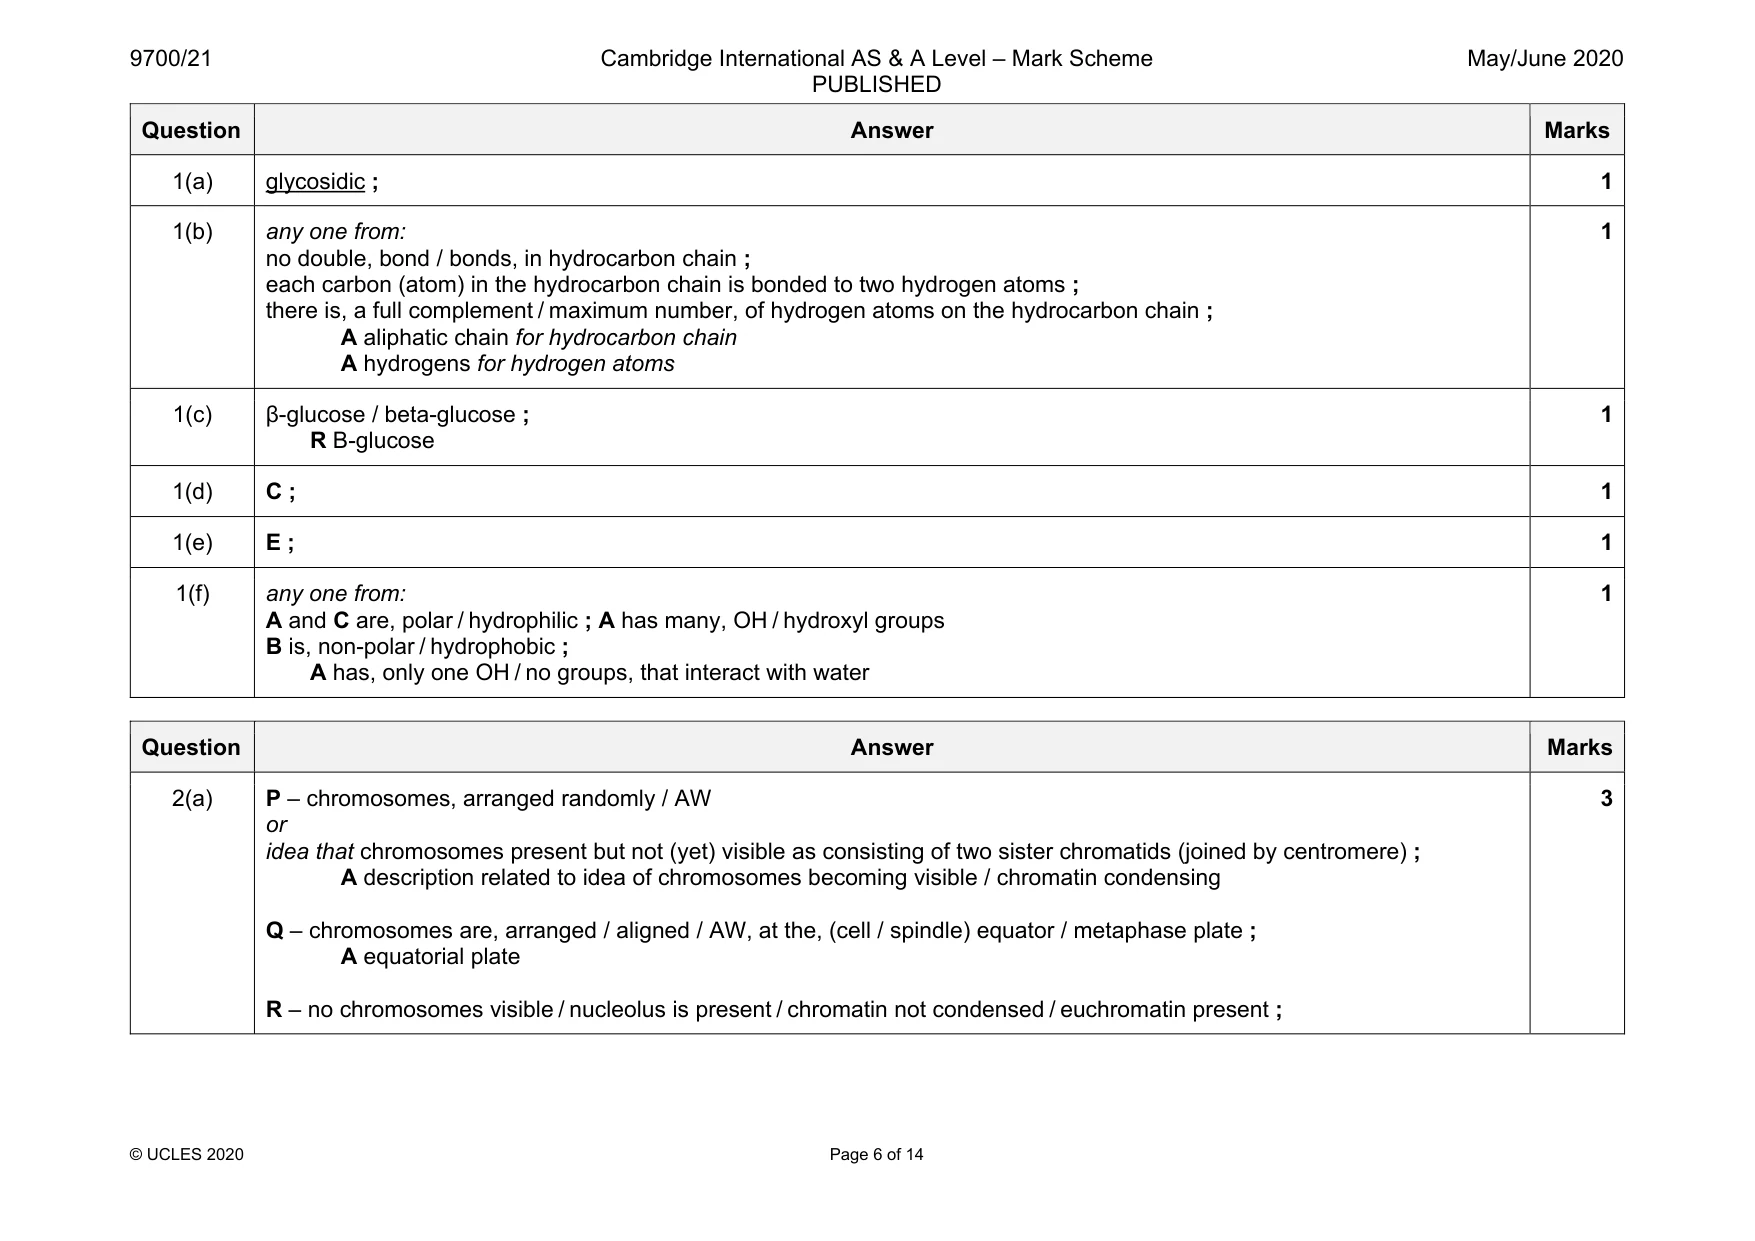
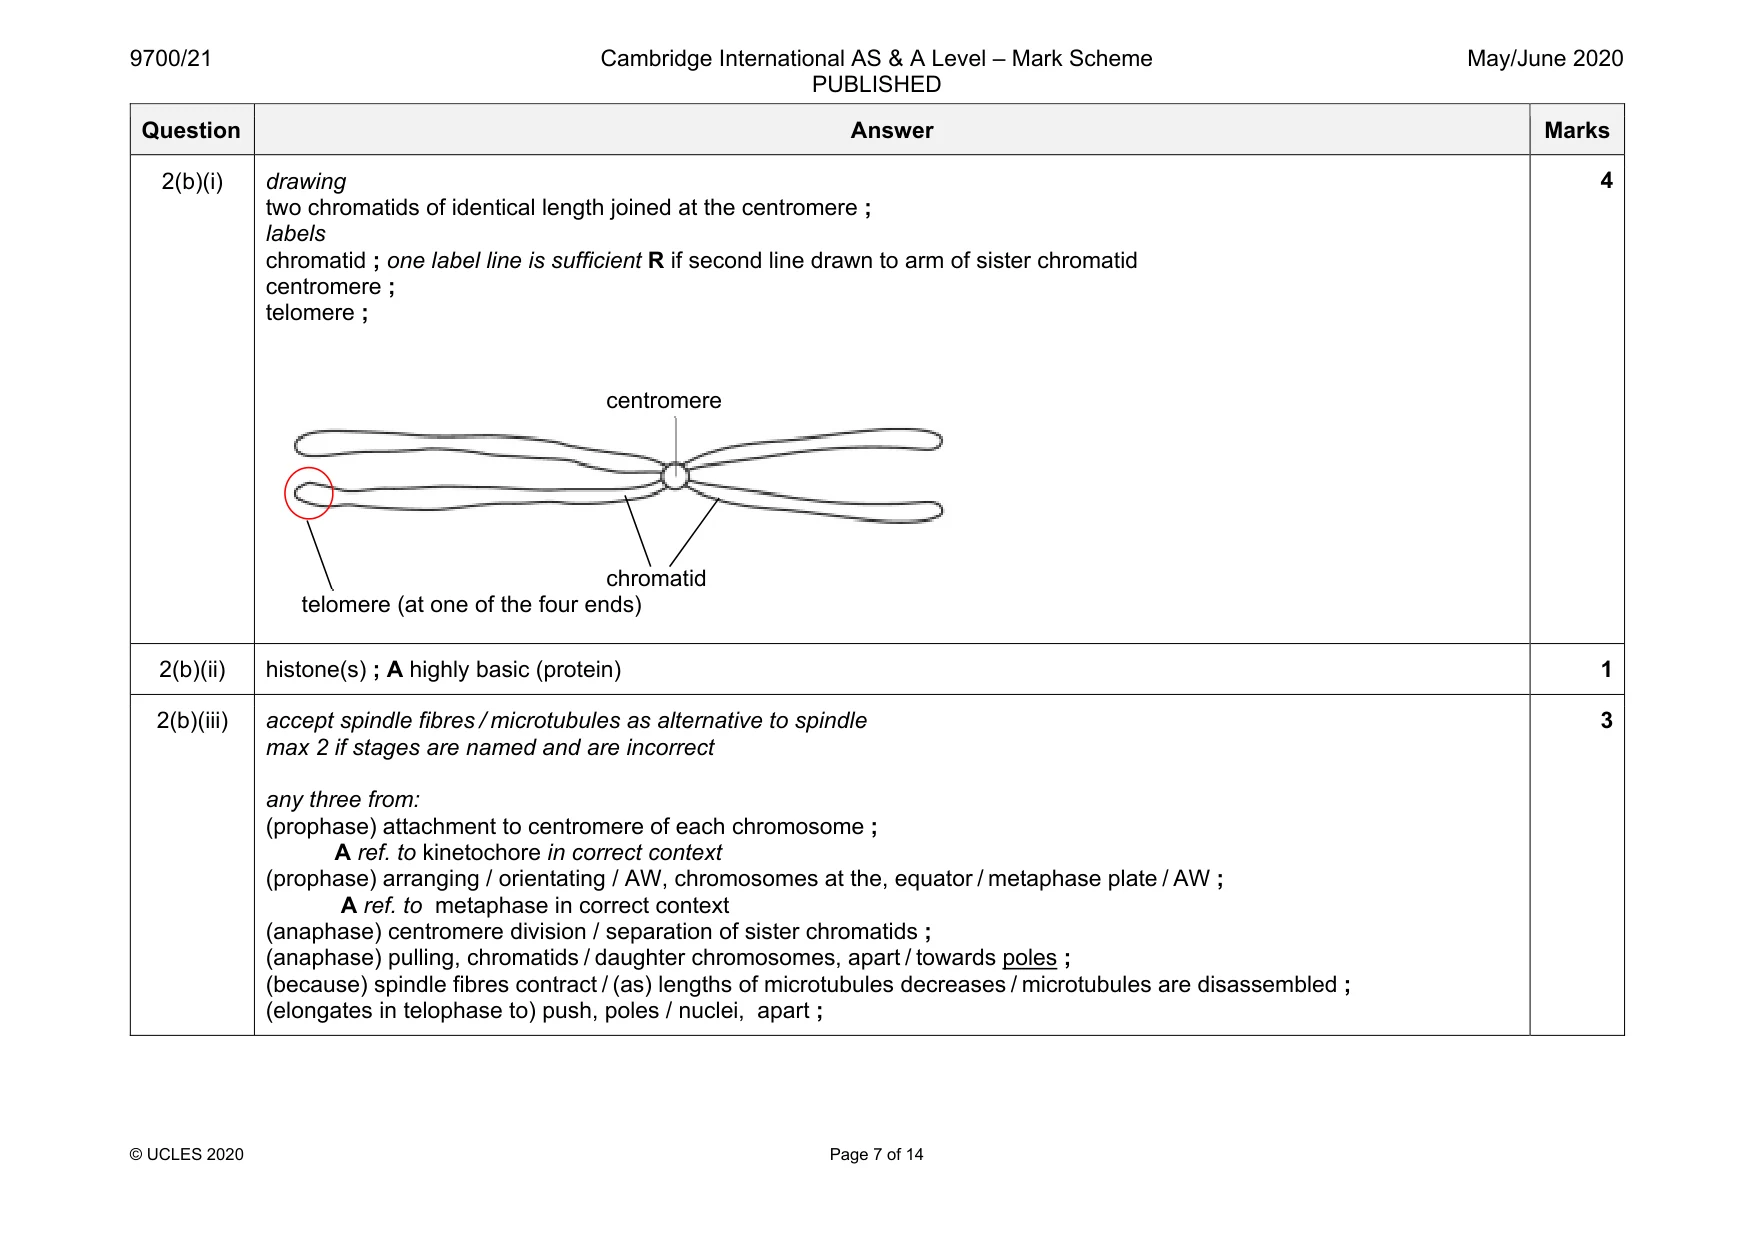
Mark scheme: 2(a) P – chromosomes, arranged randomly / AW or idea that chromosomes present but not (yet) visible as consisting of two sister chromatids (joined by centromere) ; A description related to idea of chromosomes becoming visible / chromatin condensing Q – chromosomes are, arranged / aligned / AW, at the, (cell / spindle) equator / metaphase plate ; A equatorial plate R – no chromosomes visible / nucleolus is present / chromatin not condensed / euchromatin present ; Question Answer Marks 2(b)(i) drawing two chromatids of identical length joined at the centromere ; labels chromatid ; one label line is sufficient R if second line drawn to arm of sister chromatid centromere ; telomere ; 4 2(b)(ii) histone(s) ; A highly basic (protein) 1 2(b)(iii) accept spindle fibres / microtubules as alternative to spindle max 2 if stages are named and are incorrect any three from: (prophase) attachment to centromere of each chromosome ; A ref. to kinetochore in correct context (prophase) arranging / orientating / AW, chromosomes at the, equator / metaphase plate / AW ; A ref. to metaphase in correct context (anaphase) centromere division / separation of sister chromatids ; (anaphase) pulling, chromatids / daughter chromosomes, apart / towards poles ; (because) spindle fibres contract / (as) lengths of microtubules decreases / microtubules are disassembled ; (elongates in telophase to) push, poles / nuclei, apart ; 3 centromere chromatid telomere (at one of the four ends)
Q3 · The enzyme glucose 6-phosphate dehydrogenase (G6PD) is composed of two identical…
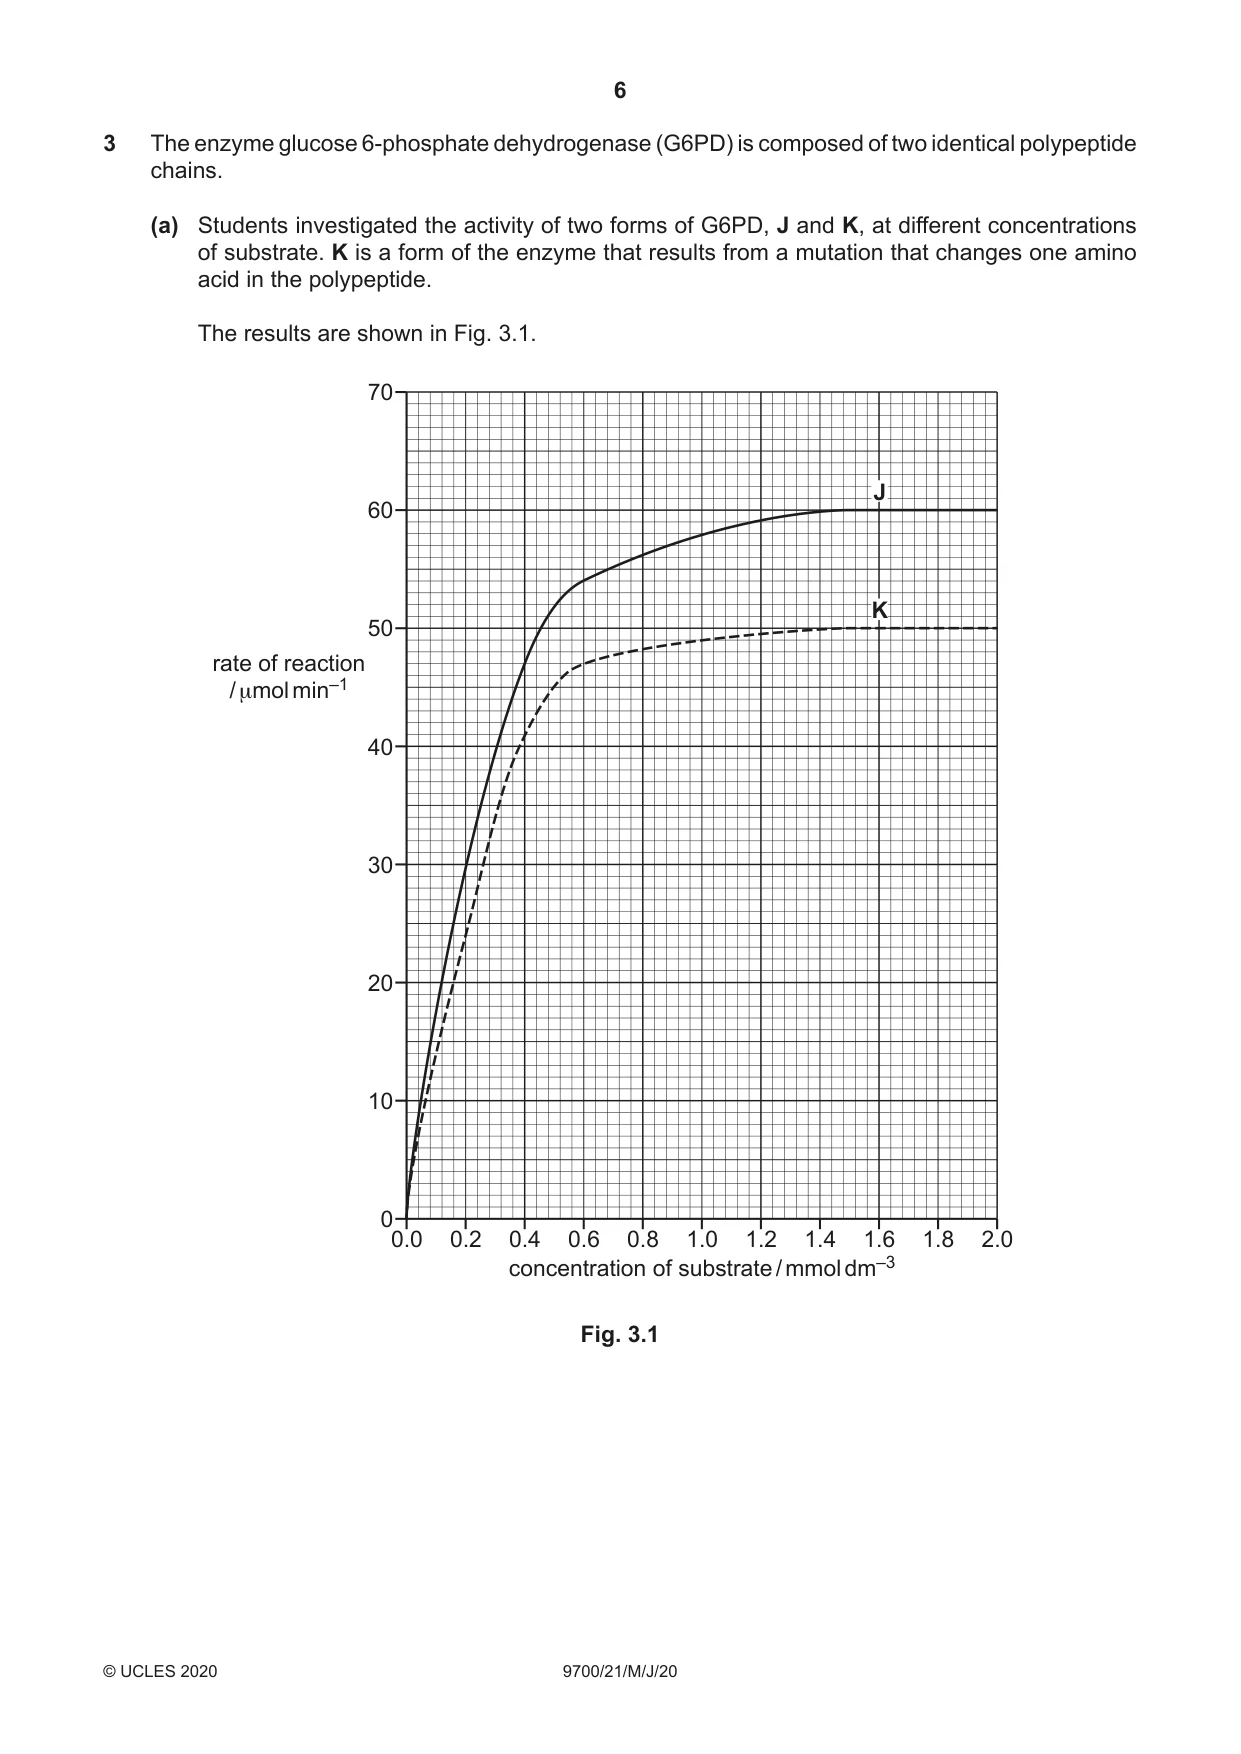
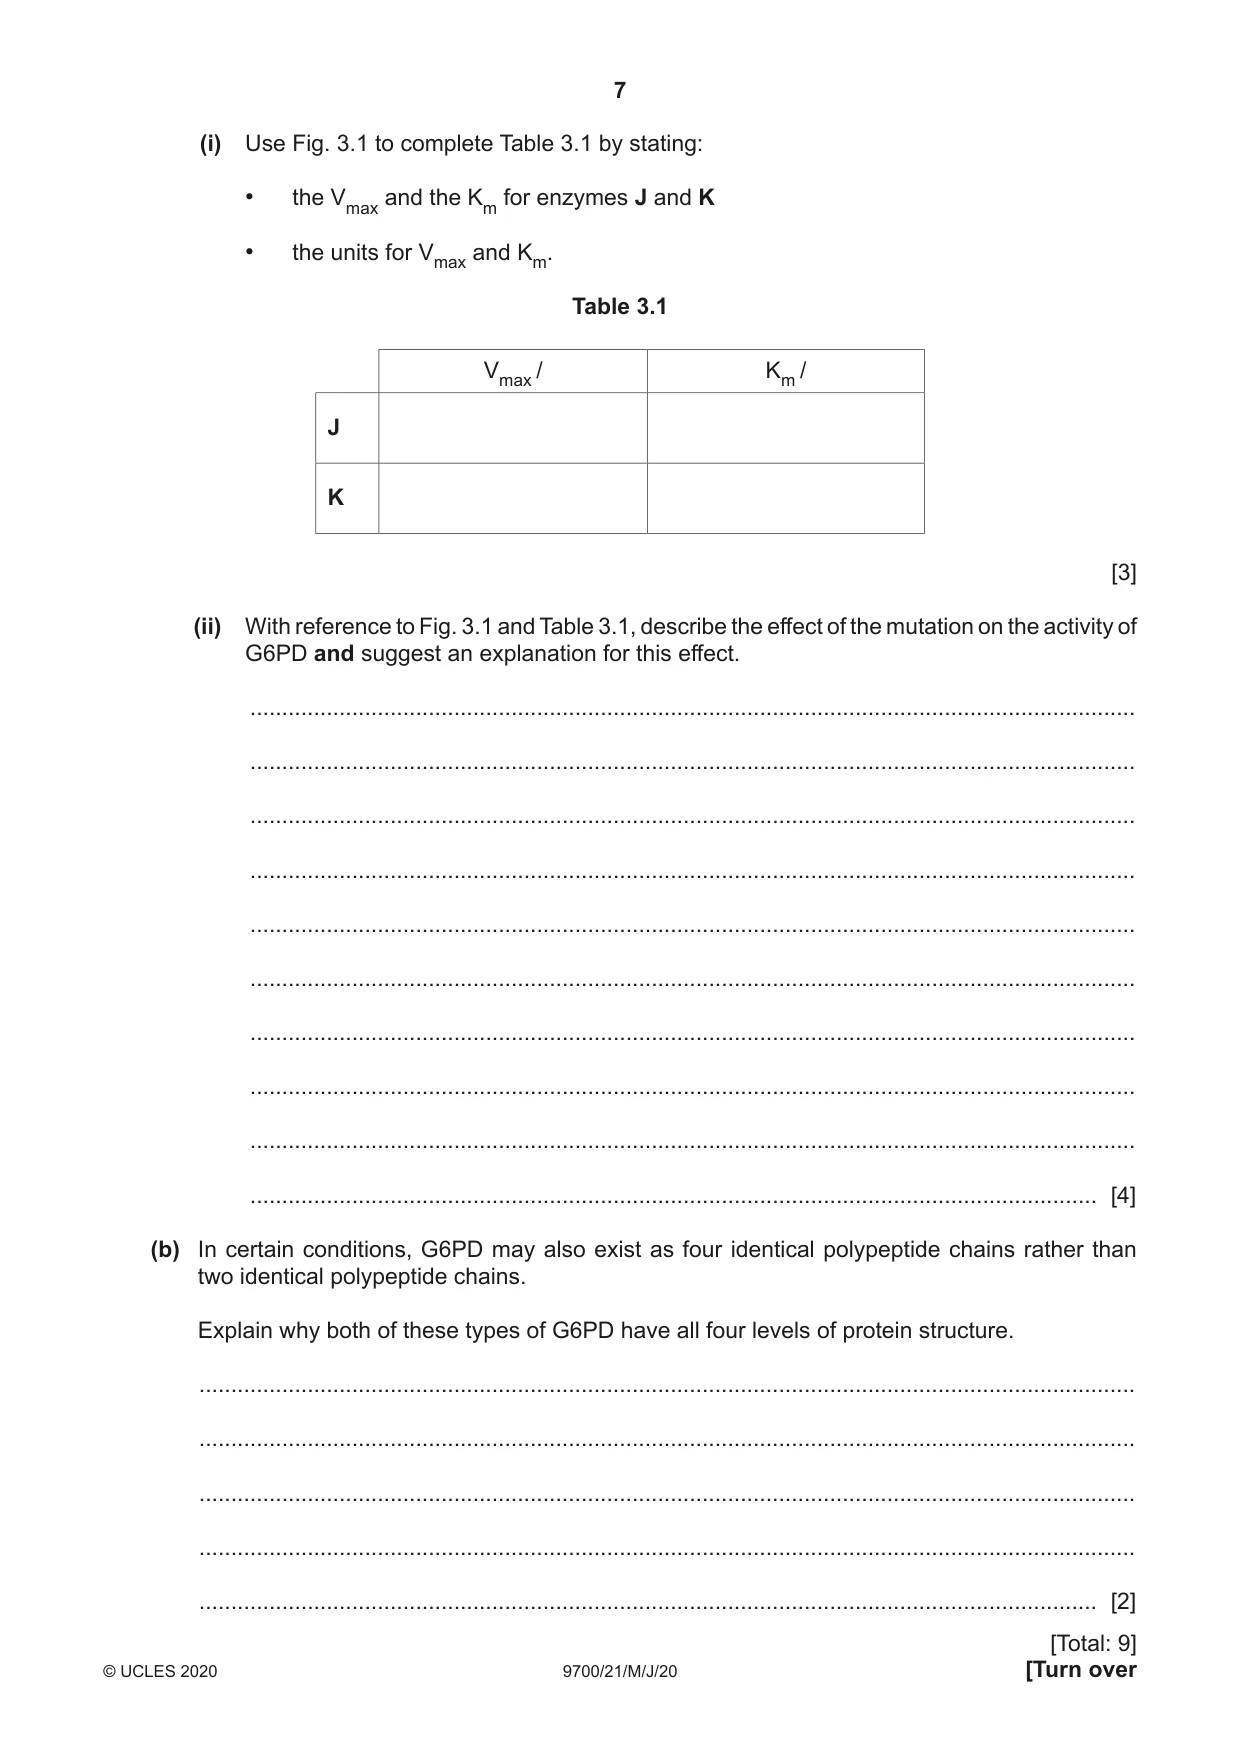
3 The enzyme glucose 6-phosphate dehydrogenase (G6PD) is composed of two identical polypeptide chains. (a) Students investigated the activity of two forms of G6PD, J and K, at different concentrations of substrate. K is a form of the enzyme that results from a mutation that changes one amino acid in the polypeptide. The results are shown in Fig. 3.1. 70 J 60 K 50 rate of reaction / μmol min–1 40 30 20 10 0 0.0 0.2 0.4 0.6 0.8 1.0 1.2 1.4 1.6 1.8 2.0 concentration of substrate / mmol dm–3 Fig. 3.1 (i) Use Fig. 3.1 to complete Table 3.1 by stating: • the Vmax and the Km for enzymes J and K • the units for Vmax and Km. Table 3.1 Vmax / Km / J K [3] (ii) With reference to Fig. 3.1 and Table 3.1, describe the effect of the mutation on the activity of G6PD and suggest an explanation for this effect. ........................................................................................................................................... ........................................................................................................................................... ........................................................................................................................................... ........................................................................................................................................... ........................................................................................................................................... ........................................................................................................................................... ........................................................................................................................................... ........................................................................................................................................... ........................................................................................................................................... ..................................................................................................................................... [4] (b) In certain conditions, G6PD may also exist as four identical polypeptide chains rather than two identical polypeptide chains. Explain why both of these types of G6PD have all four levels of protein structure. ................................................................................................................................................... ................................................................................................................................................... ................................................................................................................................................... ................................................................................................................................................... ............................................................................................................................................. [2]
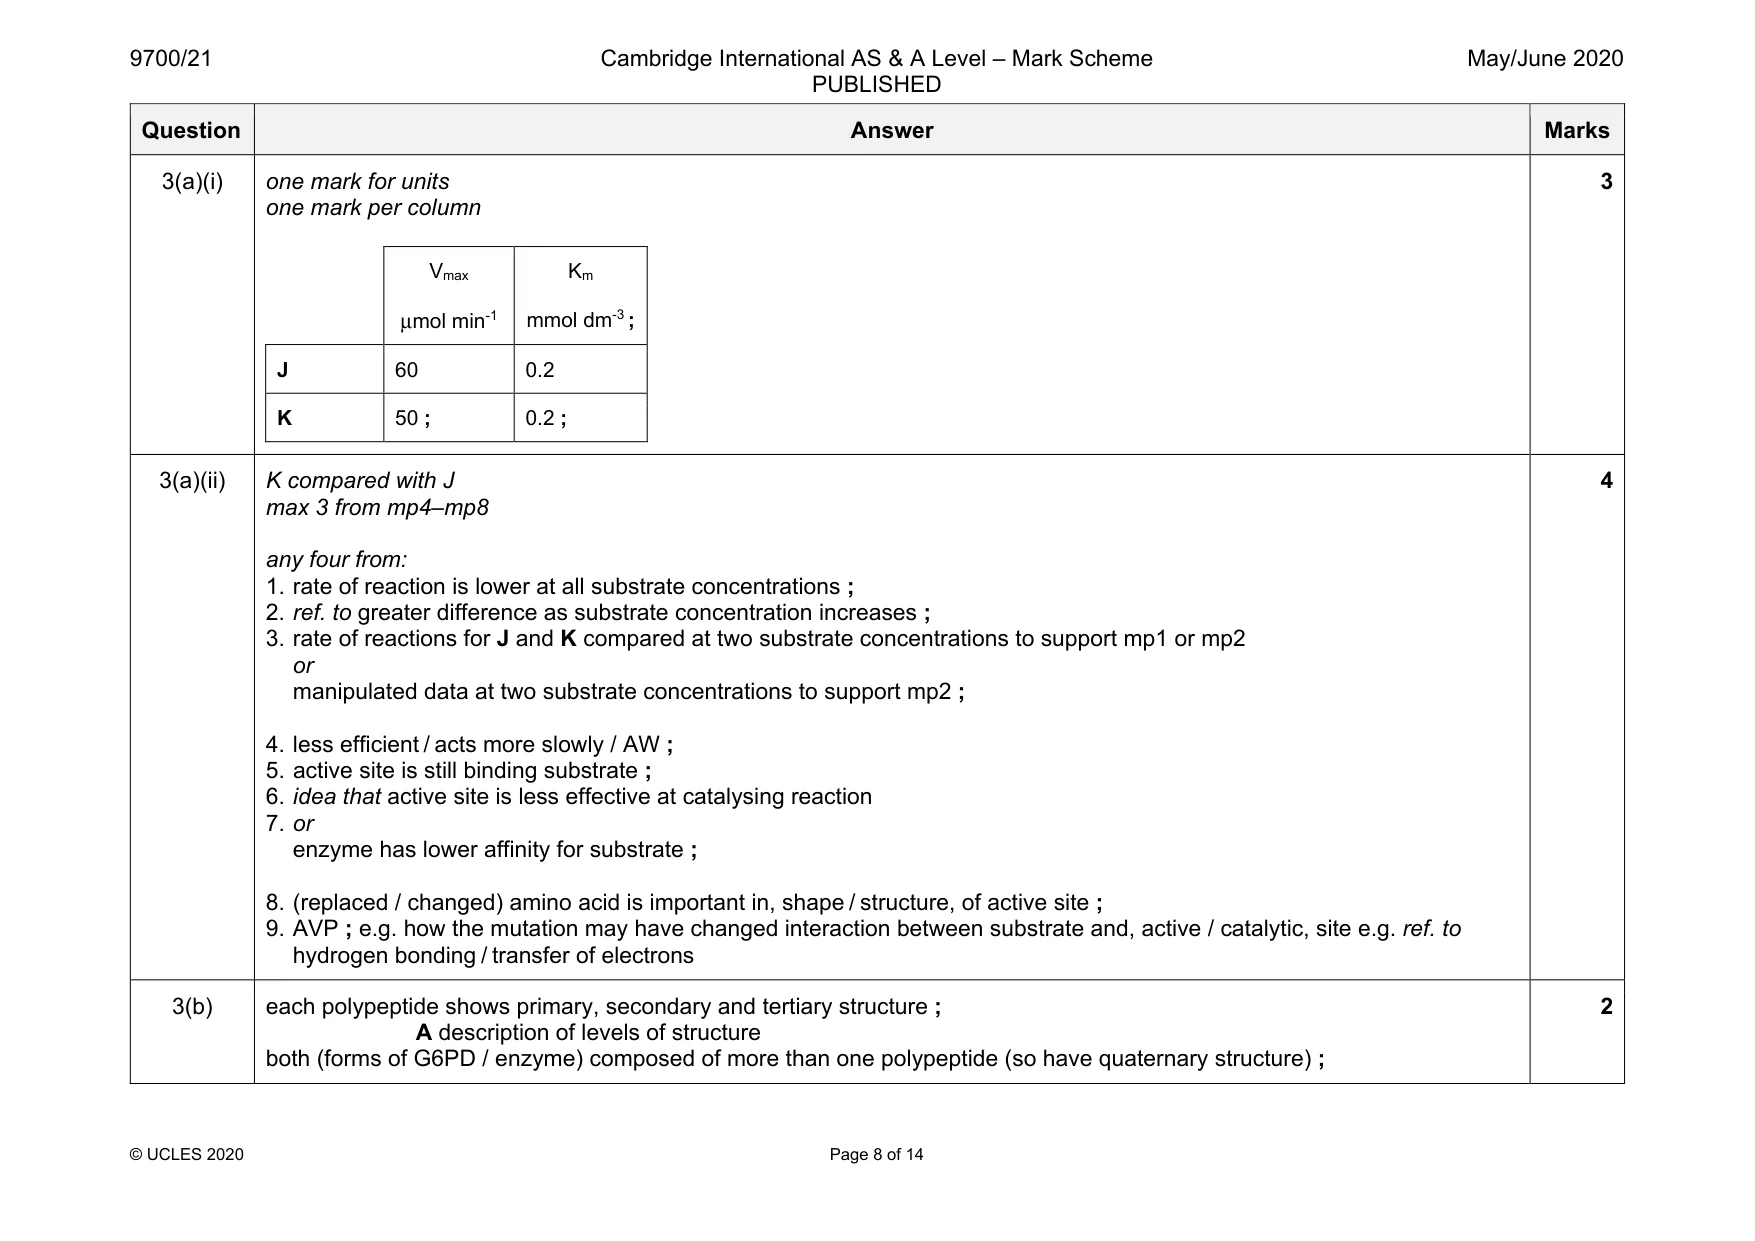
Mark scheme: 3(a)(i) one mark for units one mark per column Vmax μmol min-1 Km mmol dm-3 ; J 60 0.2 K 50 ; 0.2 ; 3 3(a)(ii) K compared with J max 3 from mp4–mp8 any four from: 1. rate of reaction is lower at all substrate concentrations ; 2. ref. to greater difference as substrate concentration increases ; 3. rate of reactions for J and K compared at two substrate concentrations to support mp1 or mp2 or manipulated data at two substrate concentrations to support mp2 ; 4. less efficient / acts more slowly / AW ; 5. active site is still binding substrate ; 6. idea that active site is less effective at catalysing reaction 7. or enzyme has lower affinity for substrate ; 8. (replaced / changed) amino acid is important in, shape / structure, of active site ; 9. AVP ; e.g. how the mutation may have changed interaction between substrate and, active / catalytic, site e.g. ref. to hydrogen bonding / transfer of electrons 4 3(b) each polypeptide shows primary, secondary and tertiary structure ; A description of levels of structure both (forms of G6PD / enzyme) composed of more than one polypeptide (so have quaternary structure) ; 2
Q4 · The site of gas exchange in the mammalian lung
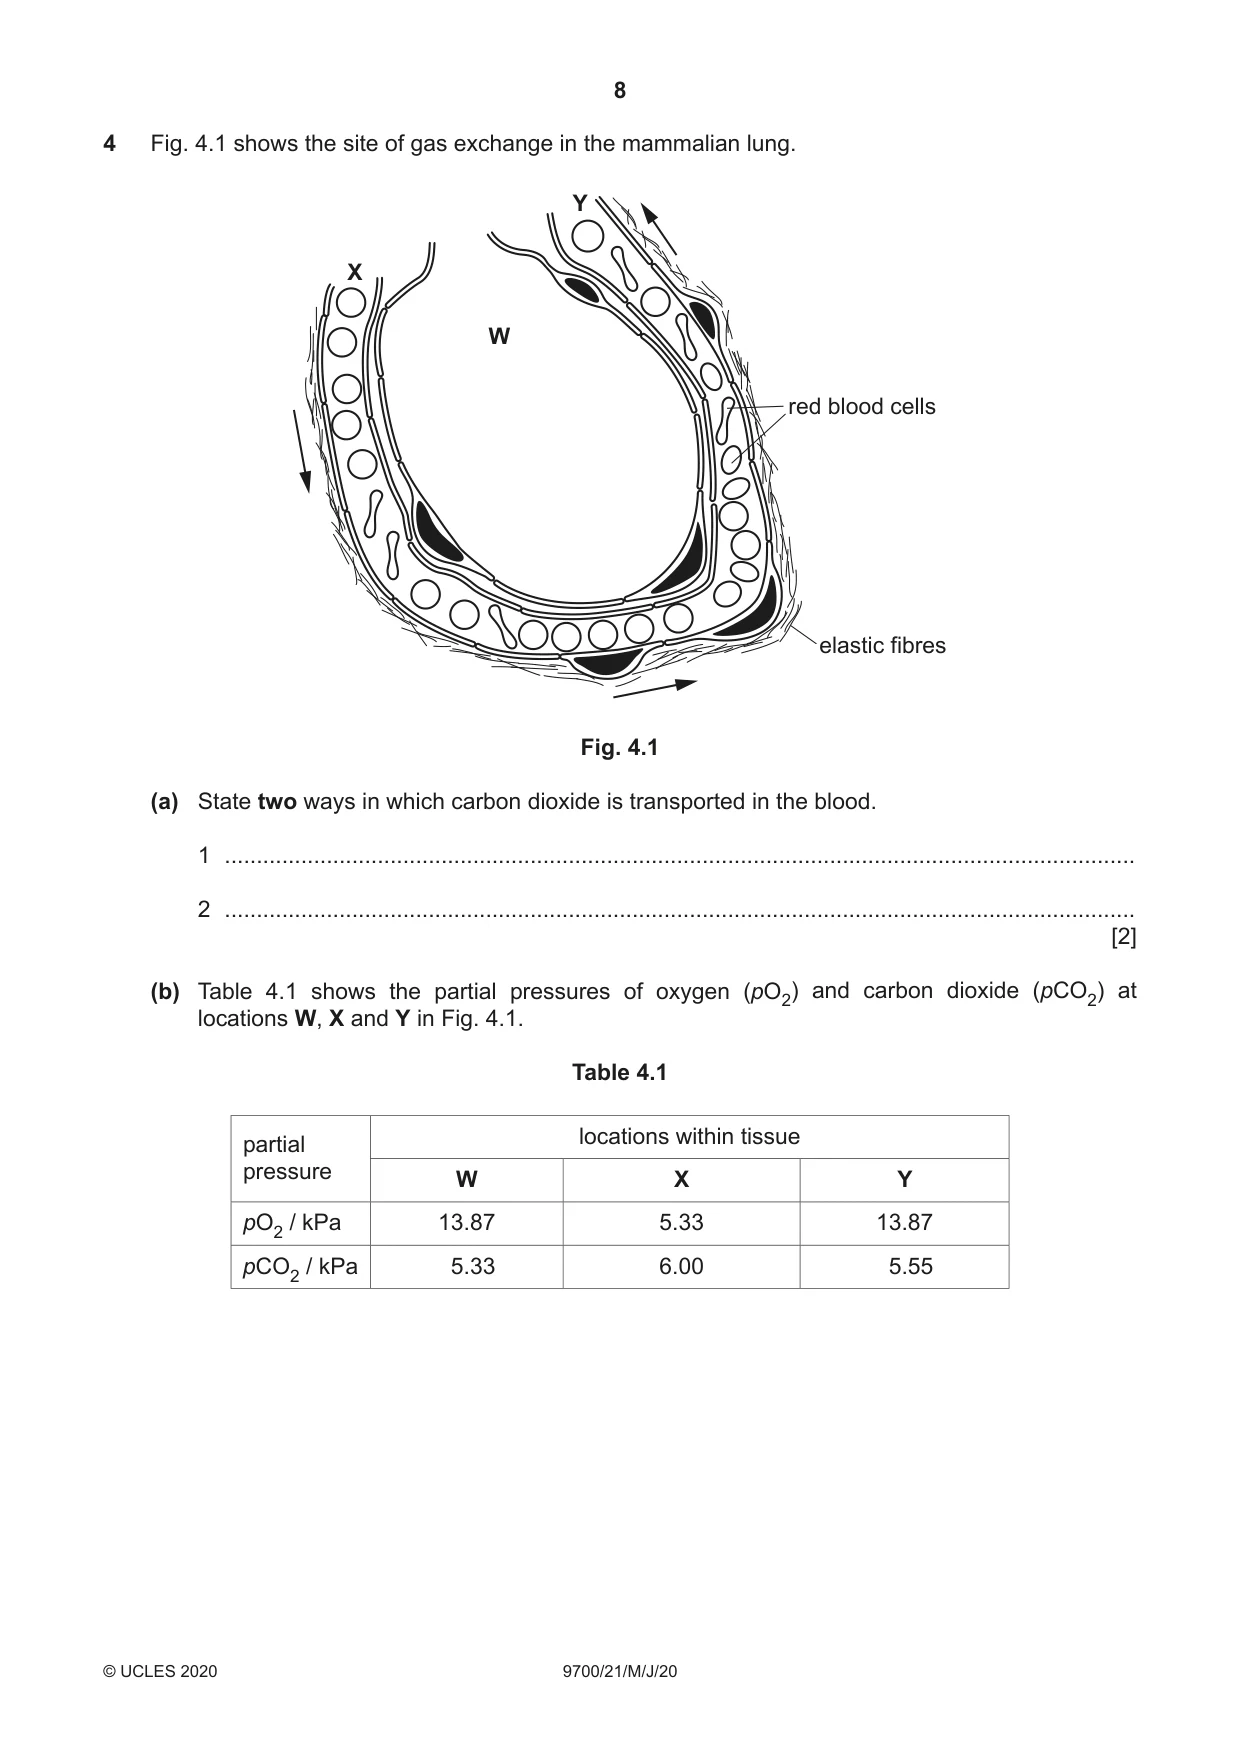
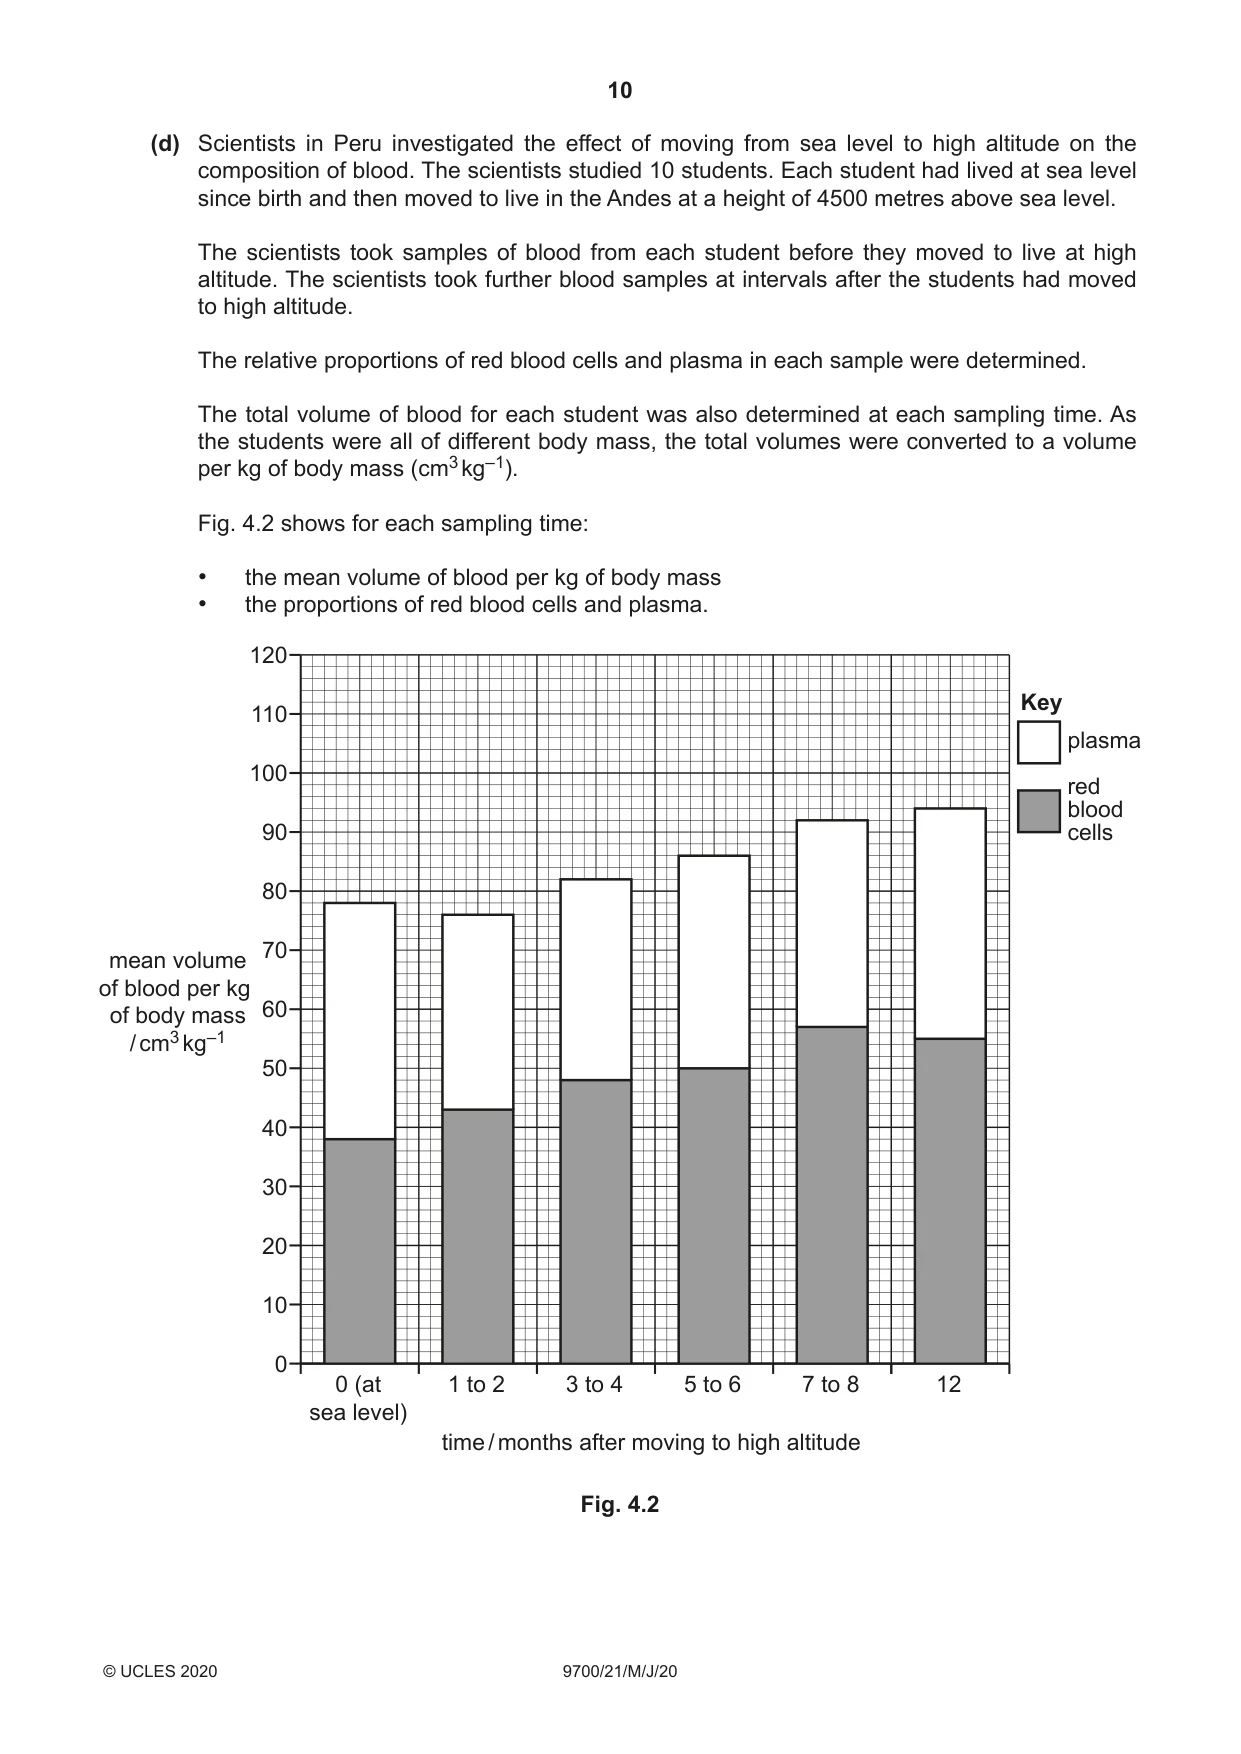
4 Fig. 4.1 shows the site of gas exchange in the mammalian lung. Y X W red blood cells elastic fibres Fig. 4.1 (a) State two ways in which carbon dioxide is transported in the blood. 1 ............................................................................................................................................... 2 ............................................................................................................................................... [2] (b) Table 4.1 shows the partial pressures of oxygen (pO2) and carbon dioxide (pCO2) at locations W, X and Y in Fig. 4.1. Table 4.1 locations within tissue partial pressure W X Y pO2 / kPa 13.87 5.33 13.87 pCO2 / kPa 5.33 6.00 5.55 With reference to Fig. 4.1 and Table 4.1, describe the exchanges that occur as blood flows from X to Y. ................................................................................................................................................... ................................................................................................................................................... ................................................................................................................................................... ................................................................................................................................................... ................................................................................................................................................... ................................................................................................................................................... ................................................................................................................................................... ................................................................................................................................................... ............................................................................................................................................. [4] (c) Elastic fibres are present in tissues at the site of gas exchange in the lungs. Describe the roles of elastic fibres in the gas exchange system and in the cardiovascular system. ................................................................................................................................................... ................................................................................................................................................... ................................................................................................................................................... ................................................................................................................................................... ................................................................................................................................................... ................................................................................................................................................... ................................................................................................................................................... ................................................................................................................................................... ................................................................................................................................................... ............................................................................................................................................. [4] (d) Scientists in Peru investigated the effect of moving from sea level to high altitude on the composition of blood. The scientists studied 10 students. Each student had lived at sea level since birth and then moved to live in the Andes at a height of 4500 metres above sea level. The scientists took samples of blood from each student before they moved to live at high altitude. The scientists took further blood samples at intervals after the students had moved to high altitude. The relative proportions of red blood cells and plasma in each sample were determined. The total volume of blood for each student was also determined at each sampling time. As the students were all of different body mass, the total volumes were converted to a volume per kg of body mass (cm3 kg–1). Fig. 4.2 shows for each sampling time: • the mean volume of blood per kg of body mass • the proportions of red blood cells and plasma. 120 Key 110 plasma 100 red blood 90 cells 80 70 mean volume of blood per kg of body mass 60 / cm3 kg–1 50 40 30 20 10 0 0 (at 1 to 2 3 to 4 5 to 6 7 to 8 12 sea level) time / months after moving to high altitude Fig. 4.2 (i) The percentage of mean blood volume that is represented by red blood cells for the samples taken at sea level is 48%. Calculate the percentage of mean blood volume that is represented by red blood cells at 5 to 6 months after living at high altitude. Show your working and give your answer to the nearest whole number. answer = ......................................................% [2] (ii) Describe and explain the results in Fig. 4.2. ........................................................................................................................................... ........................................................................................................................................... ........................................................................................................................................... ........................................................................................................................................... ........................................................................................................................................... ........................................................................................................................................... ........................................................................................................................................... ........................................................................................................................................... ..................................................................................................................................... [4] [Total: 16]
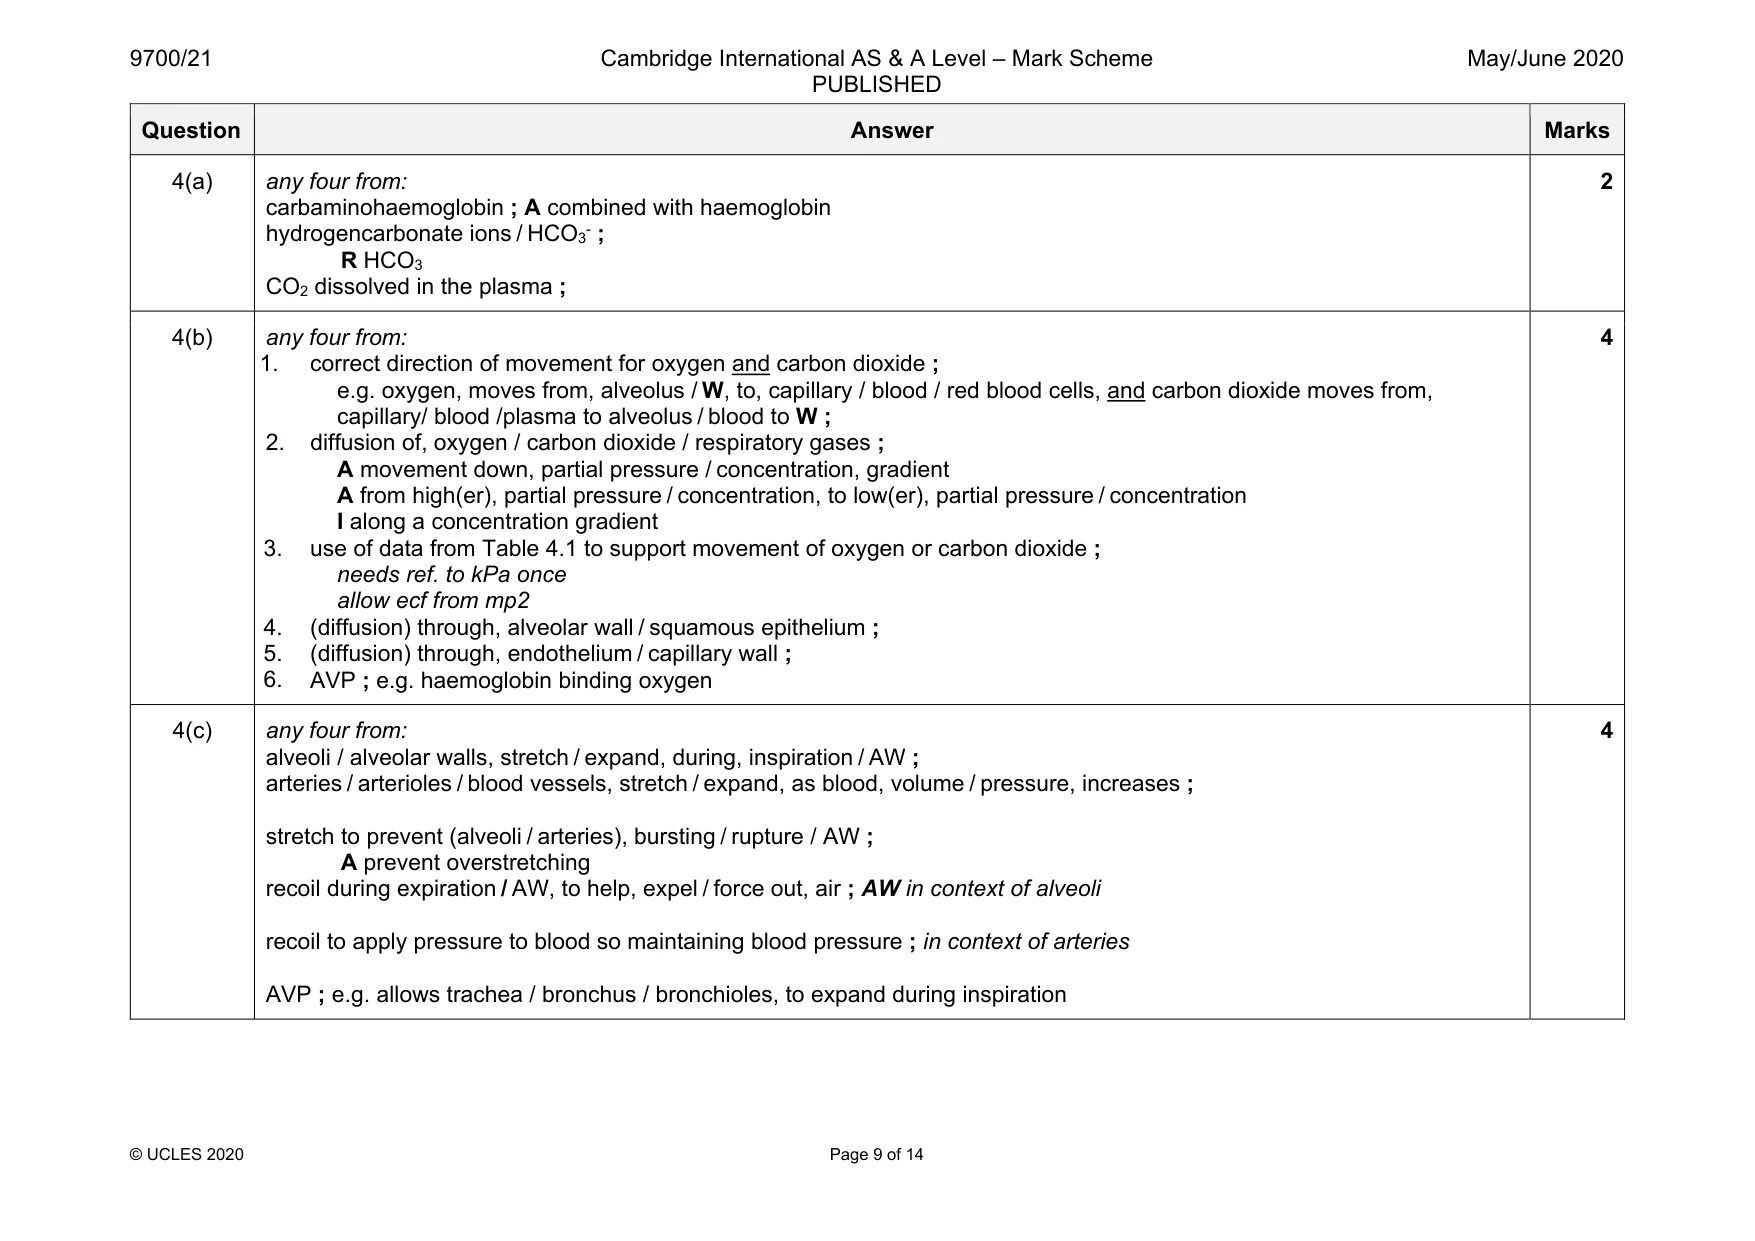
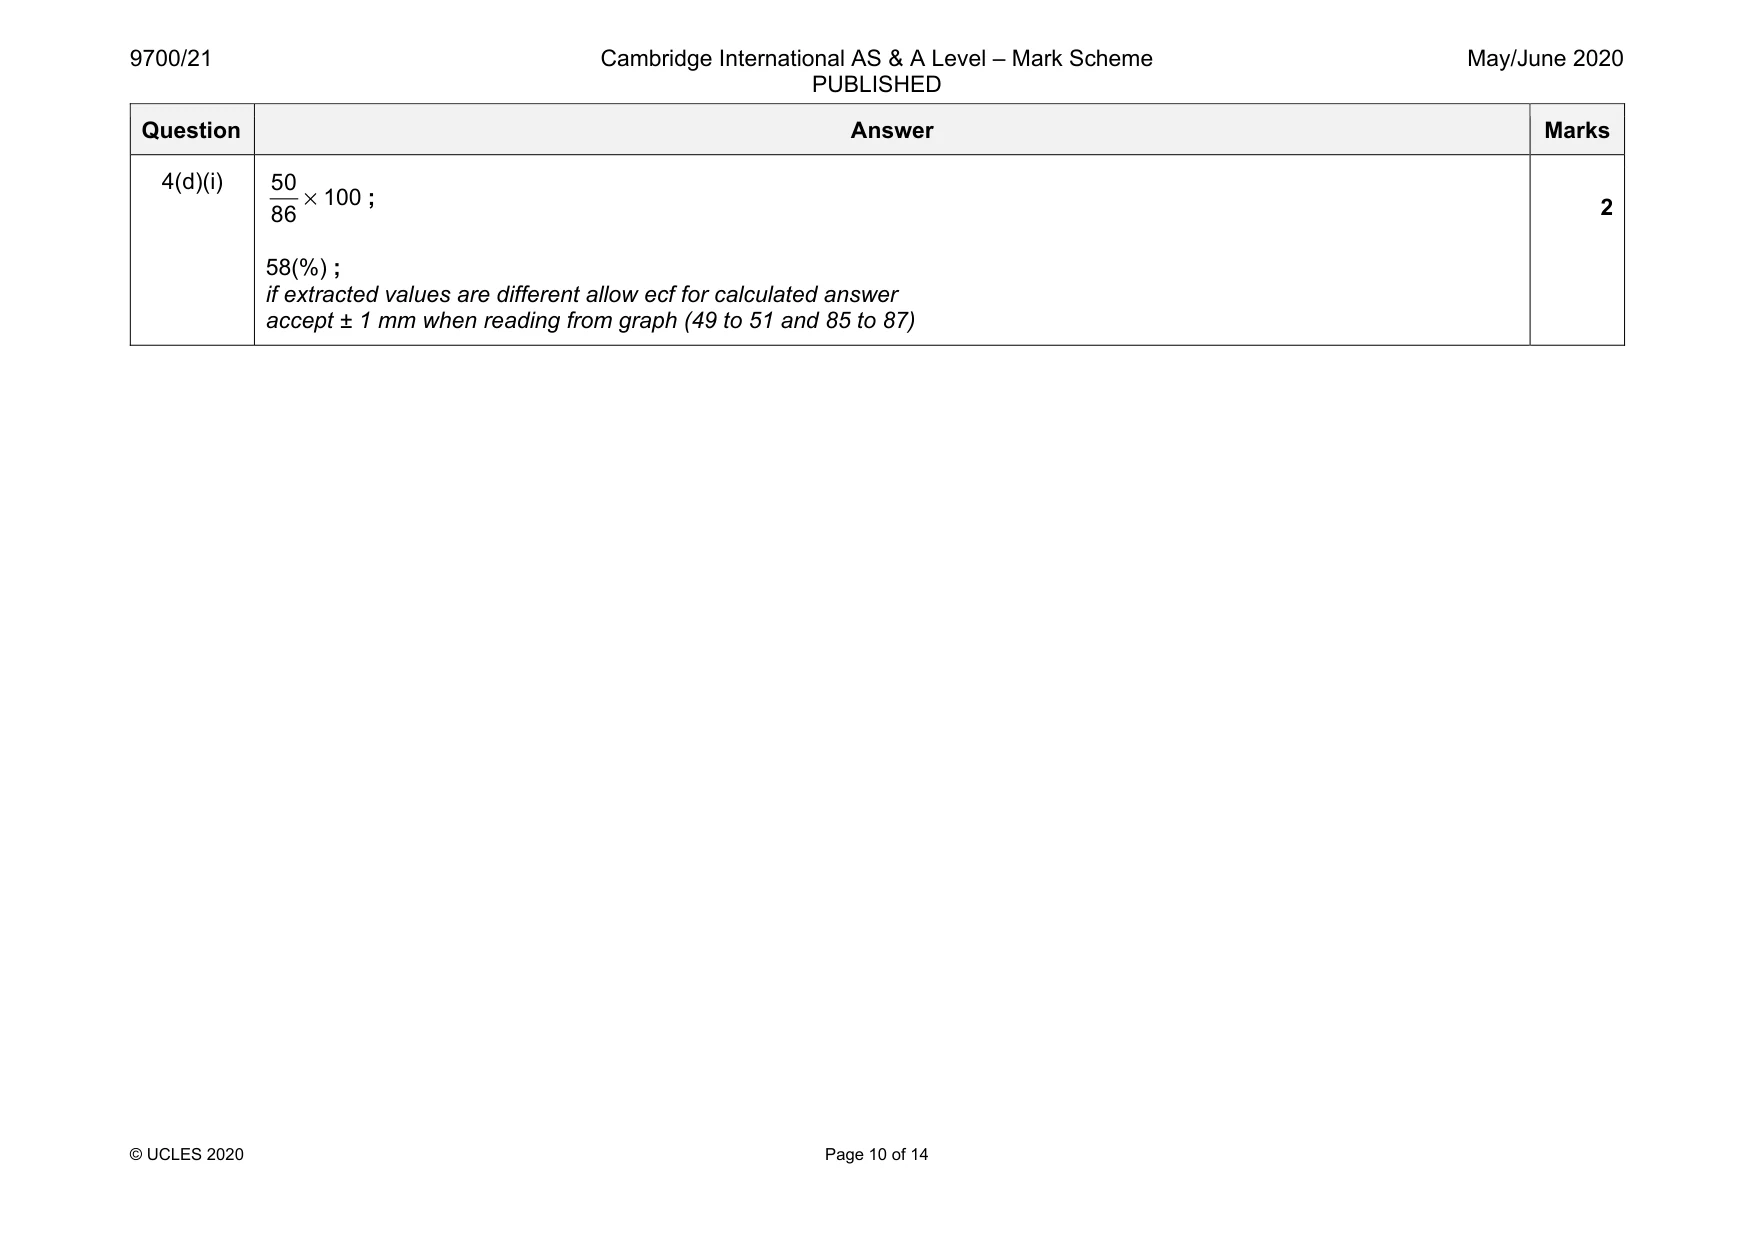
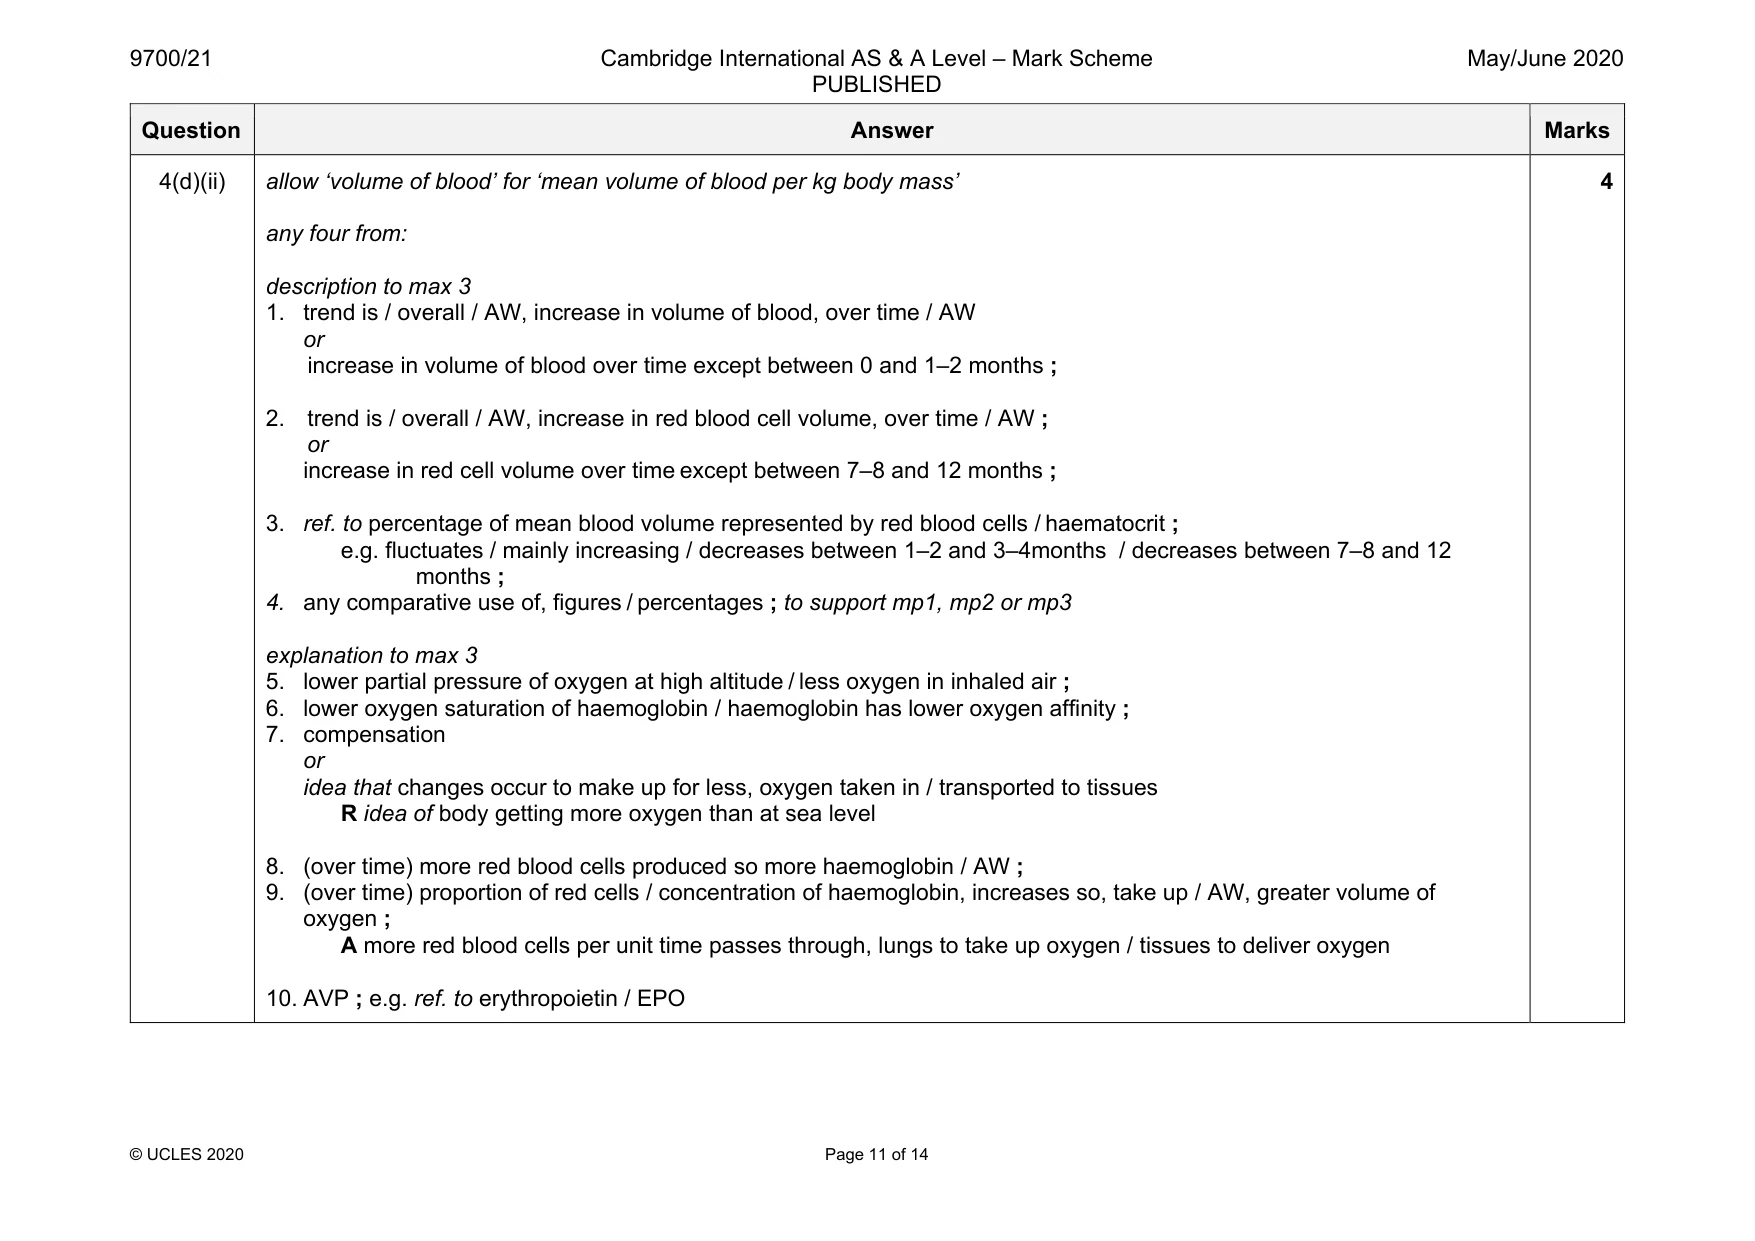
Mark scheme: 4(a) any four from: carbaminohaemoglobin ; A combined with haemoglobin hydrogencarbonate ions / HCO3- ; R HCO3 CO2 dissolved in the plasma ; 2 4(b) any four from: 1. correct direction of movement for oxygen and carbon dioxide ; e.g. oxygen, moves from, alveolus / W, to, capillary / blood / red blood cells, and carbon dioxide moves from, capillary/ blood /plasma to alveolus / blood to W ; 2. diffusion of, oxygen / carbon dioxide / respiratory gases ; A movement down, partial pressure / concentration, gradient A from high(er), partial pressure / concentration, to low(er), partial pressure / concentration I along a concentration gradient 3. use of data from Table 4.1 to support movement of oxygen or carbon dioxide ; needs ref. to kPa once allow ecf from mp2 4. (diffusion) through, alveolar wall / squamous epithelium ; 5. (diffusion) through, endothelium / capillary wall ; 6. AVP ; e.g. haemoglobin binding oxygen 4 4(c) any four from: alveoli / alveolar walls, stretch / expand, during, inspiration / AW ; arteries / arterioles / blood vessels, stretch / expand, as blood, volume / pressure, increases ; stretch to prevent (alveoli / arteries), bursting / rupture / AW ; A prevent overstretching recoil during expiration / AW, to help, expel / force out, air ; AW in context of alveoli recoil to apply pressure to blood so maintaining blood pressure ; in context of arteries AVP ; e.g. allows trachea / bronchus / bronchioles, to expand during inspiration 4 Question Answer Marks 4(d)(i) 50 86 × 100 ; 58(%) ; if extracted values are different allow ecf for calculated answer accept ± 1 mm when reading from graph (49 to 51 and 85 to 87) 2 Question Answer Marks 4(d)(ii) allow ‘volume of blood’ for ‘mean volume of blood per kg body mass’ any four from: description to max 3 1. trend is / overall / AW, increase in volume of blood, over time / AW or increase in volume of blood over time except between 0 and 1–2 months ; 2. trend is / overall / AW, increase in red blood cell volume, over time / AW ; or increase in red cell volume over time except between 7–8 and 12 months ; 3. ref. to percentage of mean blood volume represented by red blood cells / haematocrit ; e.g. fluctuates / mainly increasing / decreases between 1–2 and 3–4months / decreases between 7–8 and 12 months ; 4. any comparative use of, figures / percentages ; to support mp1, mp2 or mp3 explanation to max 3 5. lower partial pressure of oxygen at high altitude / less oxygen in inhaled air ; 6. lower oxygen saturation of haemoglobin / haemoglobin has lower oxygen affinity ; 7. compensation or idea that changes occur to make up for less, oxygen taken in / transported to tissues R idea of body getting more oxygen than at sea level 8. (over time) more red blood cells produced so more haemoglobin / AW ; 9. (over time) proportion of red cells / concentration of haemoglobin, increases so, take up / AW, greater volume of oxygen ; A more red blood cells per unit time passes through, lungs to take up oxygen / tissues to deliver oxygen 10. AVP ; e.g. ref. to erythropoietin / EPO 4
Q5 · The vaccine used to control tuberculosis (TB) is known as Bacillus Calmette-Guérin (BCG)
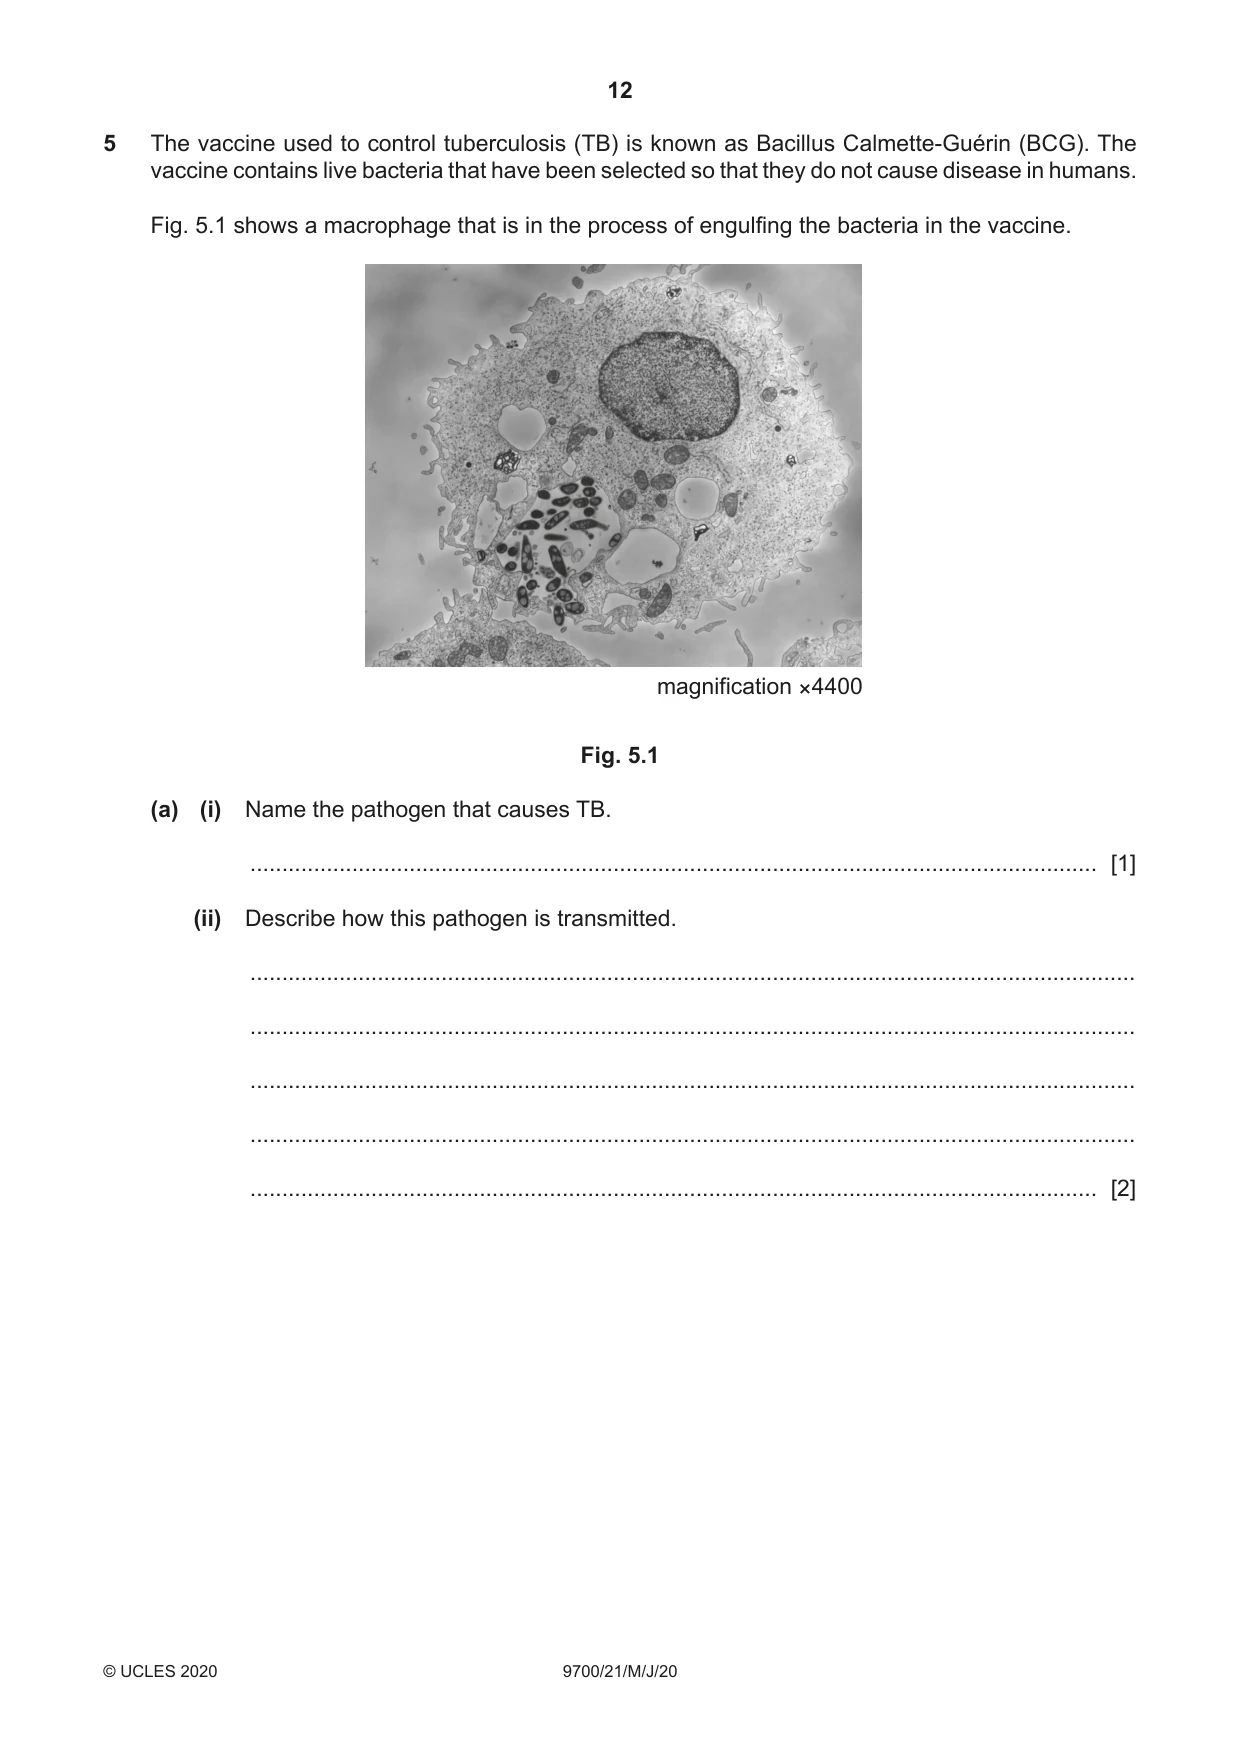
5 The vaccine used to control tuberculosis (TB) is known as Bacillus Calmette-Guérin (BCG). The vaccine contains live bacteria that have been selected so that they do not cause disease in humans. Fig. 5.1 shows a macrophage that is in the process of engulfing the bacteria in the vaccine. magnification ×4400 Fig. 5.1 (a) (i) Name the pathogen that causes TB. ..................................................................................................................................... [1] (ii) Describe how this pathogen is transmitted. ........................................................................................................................................... ........................................................................................................................................... ........................................................................................................................................... ........................................................................................................................................... ..................................................................................................................................... [2] (b) Describe the events that occur in the body after the macrophage has engulfed the bacteria until the production of antibodies in response to the BCG vaccine. ................................................................................................................................................... ................................................................................................................................................... ................................................................................................................................................... ................................................................................................................................................... ................................................................................................................................................... ................................................................................................................................................... ................................................................................................................................................... ................................................................................................................................................... ................................................................................................................................................... ................................................................................................................................................... ............................................................................................................................................. [5] (c) Vaccines, such as BCG, stimulate the formation of memory cells. Explain the role of memory cells in the body’s defence against the TB pathogen. ................................................................................................................................................... ................................................................................................................................................... ................................................................................................................................................... ................................................................................................................................................... ................................................................................................................................................... ................................................................................................................................................... ................................................................................................................................................... ................................................................................................................................................... ............................................................................................................................................. [3] (d) Suggest why vaccination with BCG has not yet eradicated TB. ................................................................................................................................................... ................................................................................................................................................... ................................................................................................................................................... ................................................................................................................................................... ................................................................................................................................................... ................................................................................................................................................... ................................................................................................................................................... ............................................................................................................................................. [3] [Total: 14]
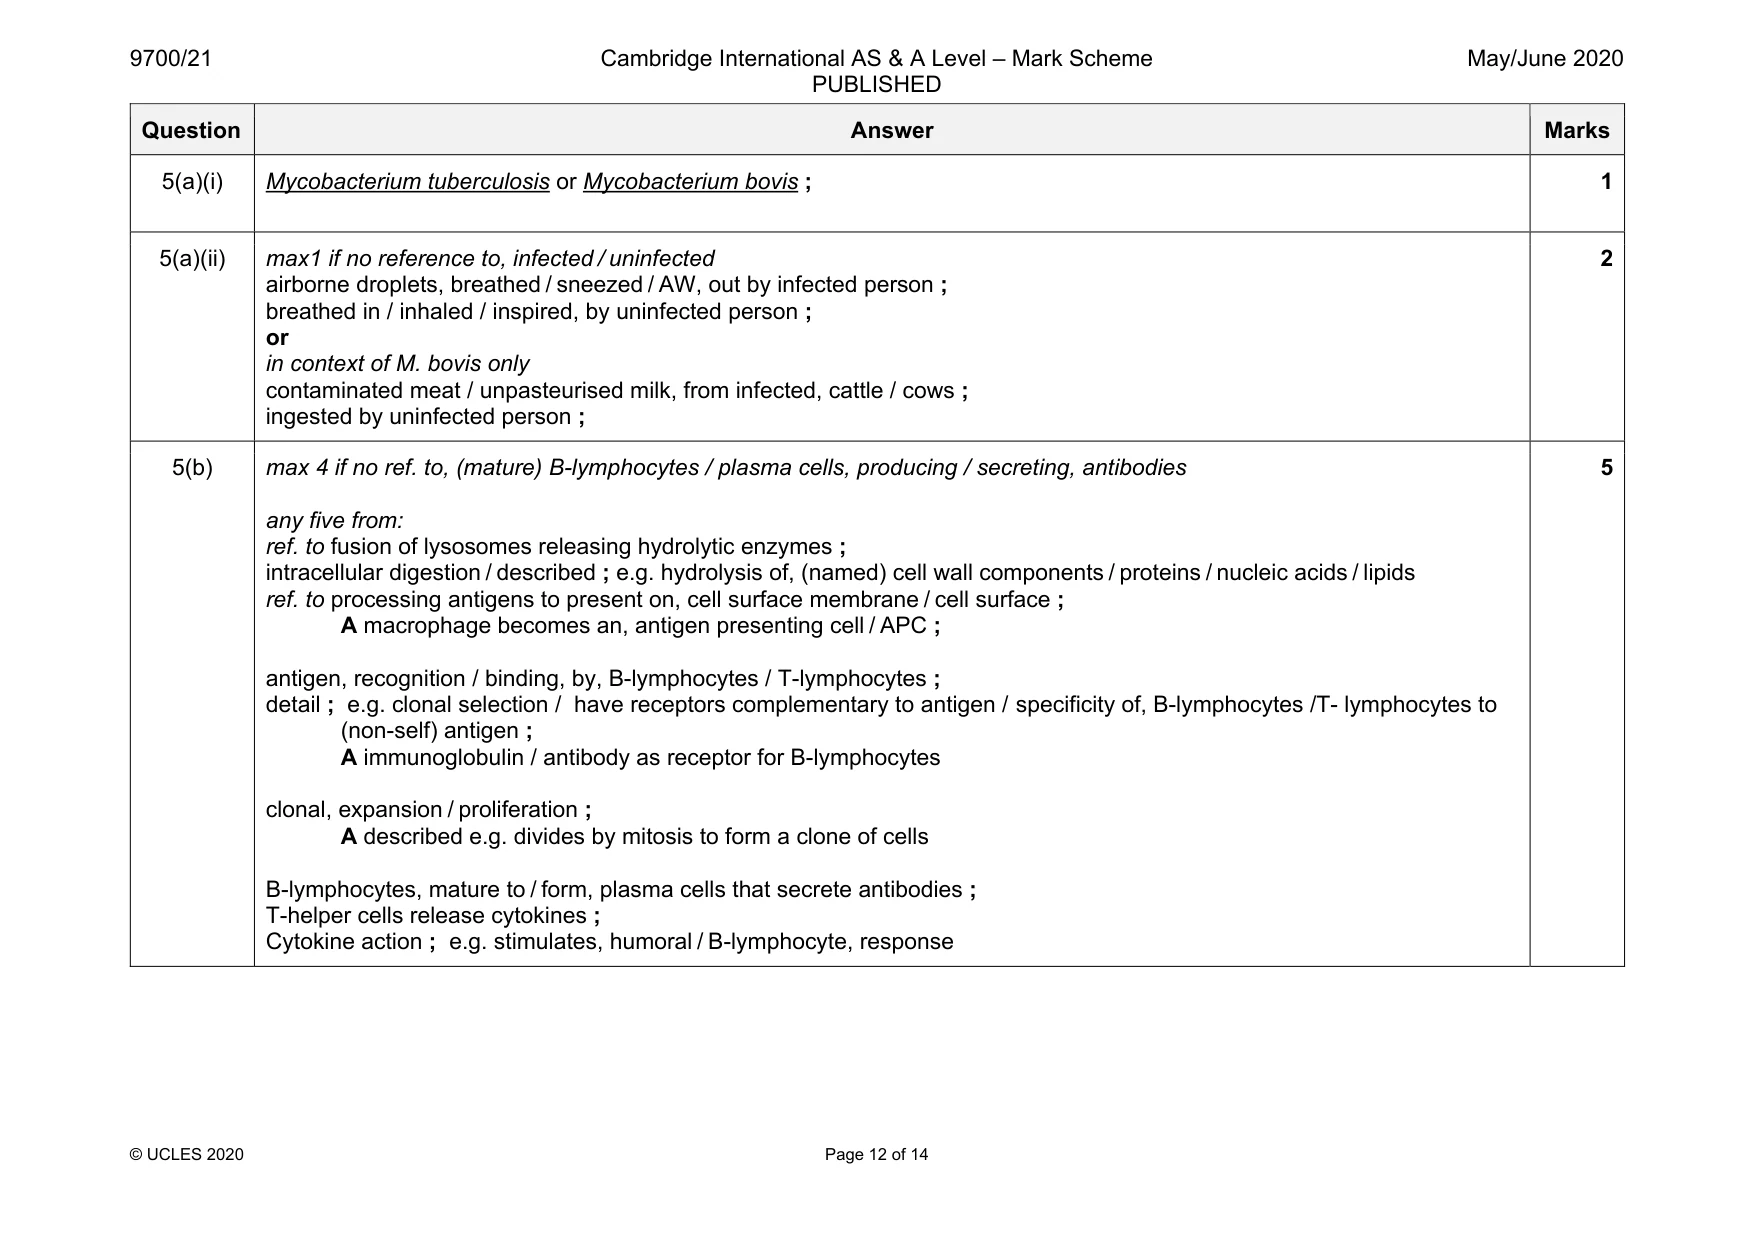
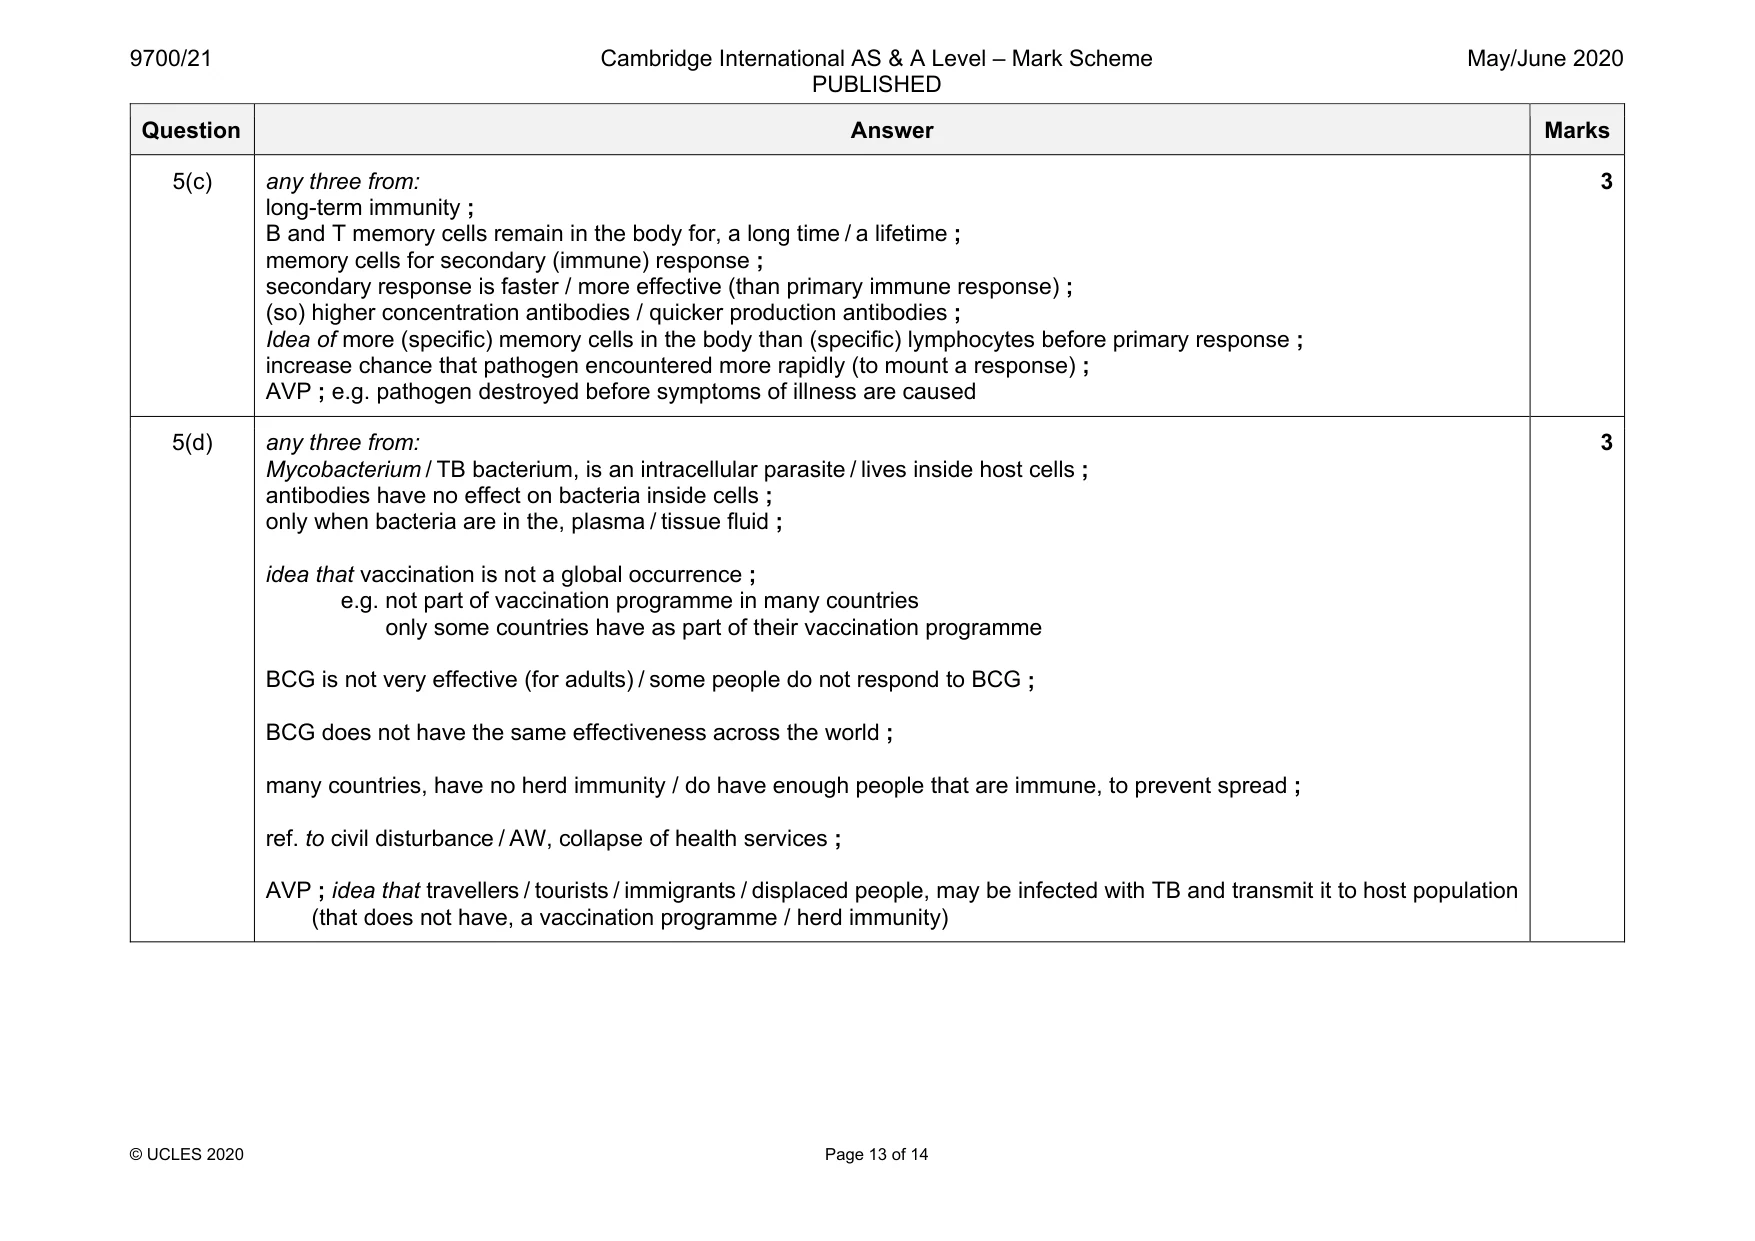
Mark scheme: 5(a)(i) Mycobacterium tuberculosis or Mycobacterium bovis ; 1 5(a)(ii) max1 if no reference to, infected / uninfected airborne droplets, breathed / sneezed / AW, out by infected person ; breathed in / inhaled / inspired, by uninfected person ; or in context of M. bovis only contaminated meat / unpasteurised milk, from infected, cattle / cows ; ingested by uninfected person ; 2 5(b) max 4 if no ref. to, (mature) B-lymphocytes / plasma cells, producing / secreting, antibodies any five from: ref. to fusion of lysosomes releasing hydrolytic enzymes ; intracellular digestion / described ; e.g. hydrolysis of, (named) cell wall components / proteins / nucleic acids / lipids ref. to processing antigens to present on, cell surface membrane / cell surface ; A macrophage becomes an, antigen presenting cell / APC ; antigen, recognition / binding, by, B-lymphocytes / T-lymphocytes ; detail ; e.g. clonal selection / have receptors complementary to antigen / specificity of, B-lymphocytes /T- lymphocytes to (non-self) antigen ; A immunoglobulin / antibody as receptor for B-lymphocytes clonal, expansion / proliferation ; A described e.g. divides by mitosis to form a clone of cells B-lymphocytes, mature to / form, plasma cells that secrete antibodies ; T-helper cells release cytokines ; Cytokine action ; e.g. stimulates, humoral / B-lymphocyte, response 5 Question Answer Marks 5(c) any three from: long-term immunity ; B and T memory cells remain in the body for, a long time / a lifetime ; memory cells for secondary (immune) response ; secondary response is faster / more effective (than primary immune response) ; (so) higher concentration antibodies / quicker production antibodies ; Idea of more (specific) memory cells in the body than (specific) lymphocytes before primary response ; increase chance that pathogen encountered more rapidly (to mount a response) ; AVP ; e.g. pathogen destroyed before symptoms of illness are caused 3 5(d) any three from: Mycobacterium / TB bacterium, is an intracellular parasite / lives inside host cells ; antibodies have no effect on bacteria inside cells ; only when bacteria are in the, plasma / tissue fluid ; idea that vaccination is not a global occurrence ; e.g. not part of vaccination programme in many countries only some countries have as part of their vaccination programme BCG is not very effective (for adults) / some people do not respond to BCG ; BCG does not have the same effectiveness across the world ; many countries, have no herd immunity / do have enough people that are immune, to prevent spread ; ref. to civil disturbance / AW, collapse of health services ; AVP ; idea that travellers / tourists / immigrants / displaced people, may be infected with TB and transmit it to host population (that does not have, a vaccination programme / herd immunity) 3
Q6 · The formation of a polypeptide during translation in a eukaryotic cell
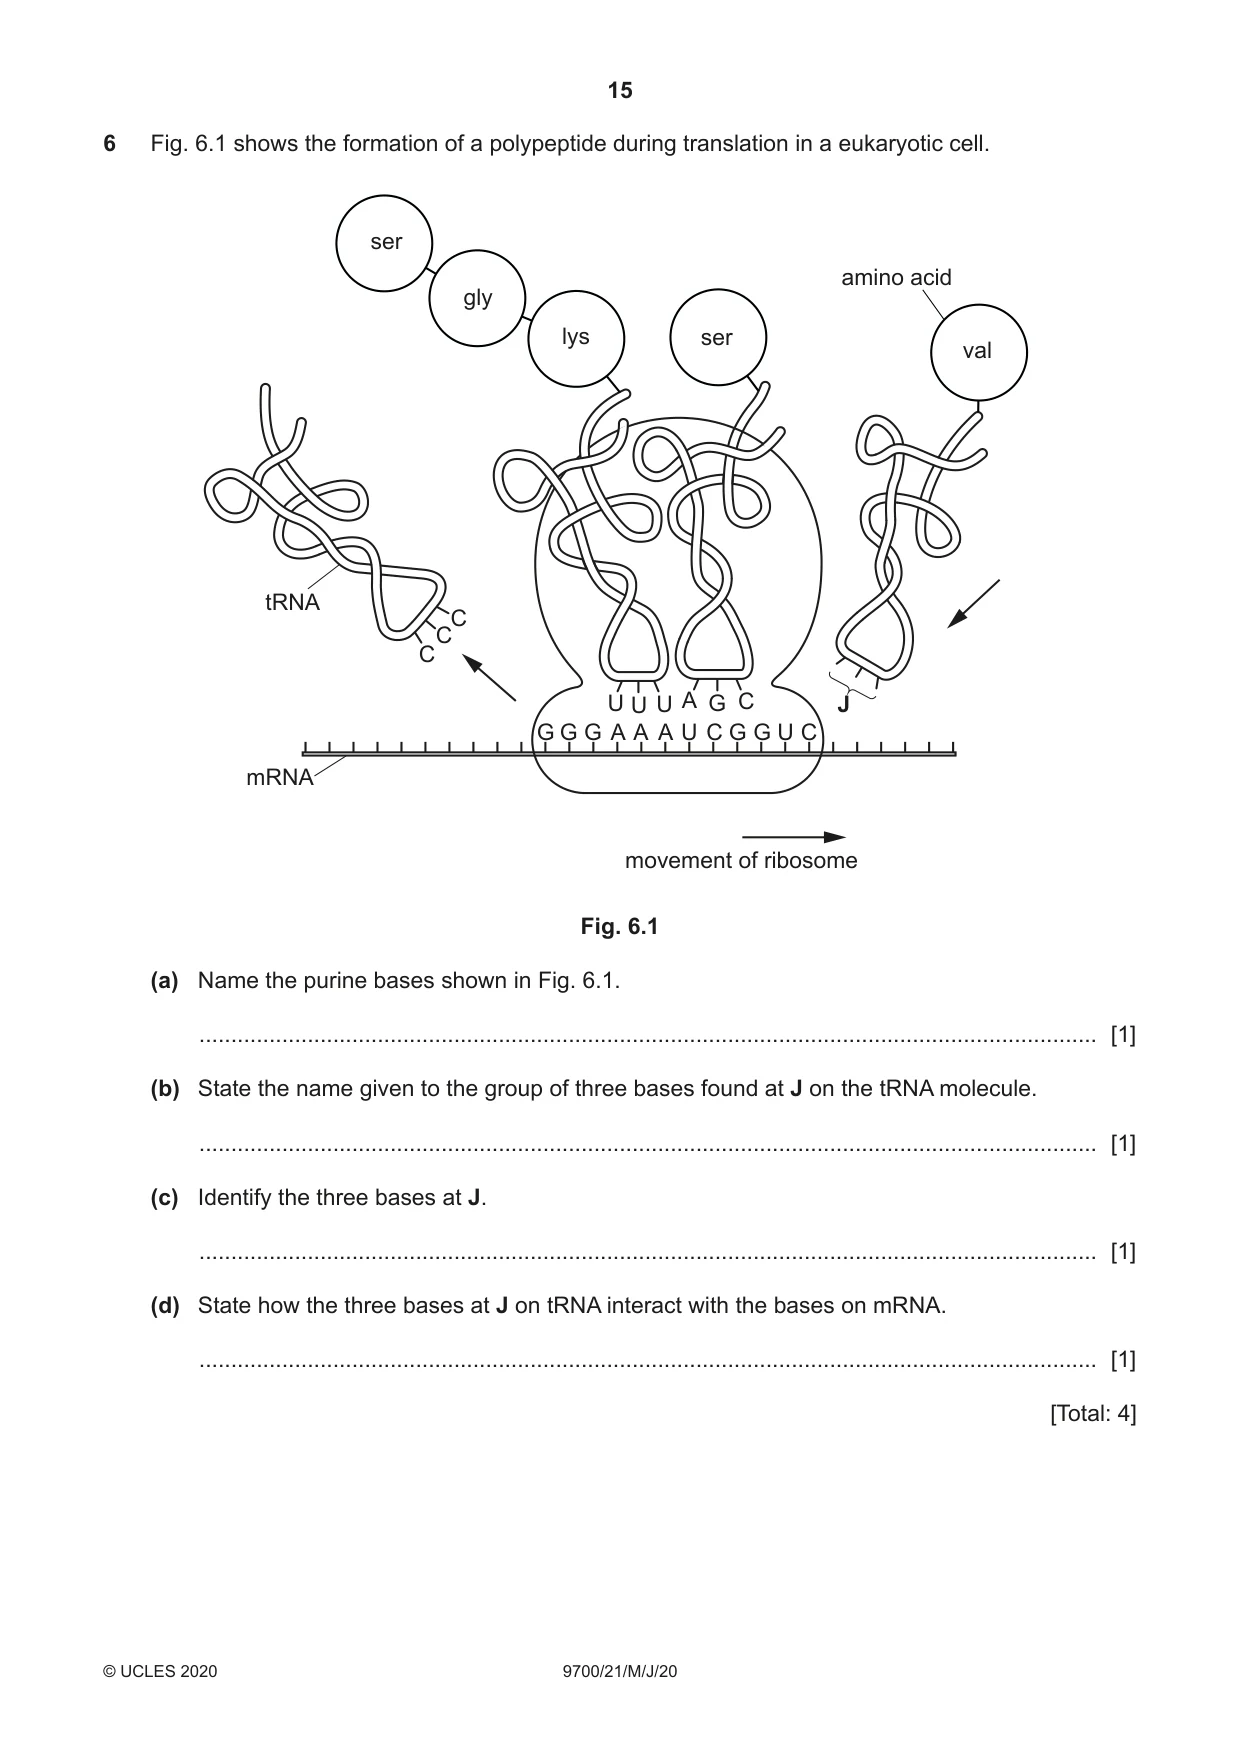
6 Fig. 6.1 shows the formation of a polypeptide during translation in a eukaryotic cell. ser amino acid gly lys ser val tRNA C C C U U U A G C J G G G A A A U C G G U C mRNA movement of ribosome Fig. 6.1 (a) Name the purine bases shown in Fig. 6.1. ............................................................................................................................................. [1] (b) State the name given to the group of three bases found at J on the tRNA molecule. ............................................................................................................................................. [1] (c) Identify the three bases at J. ............................................................................................................................................. [1] (d) State how the three bases at J on tRNA interact with the bases on mRNA. ............................................................................................................................................. [1] [Total: 4]
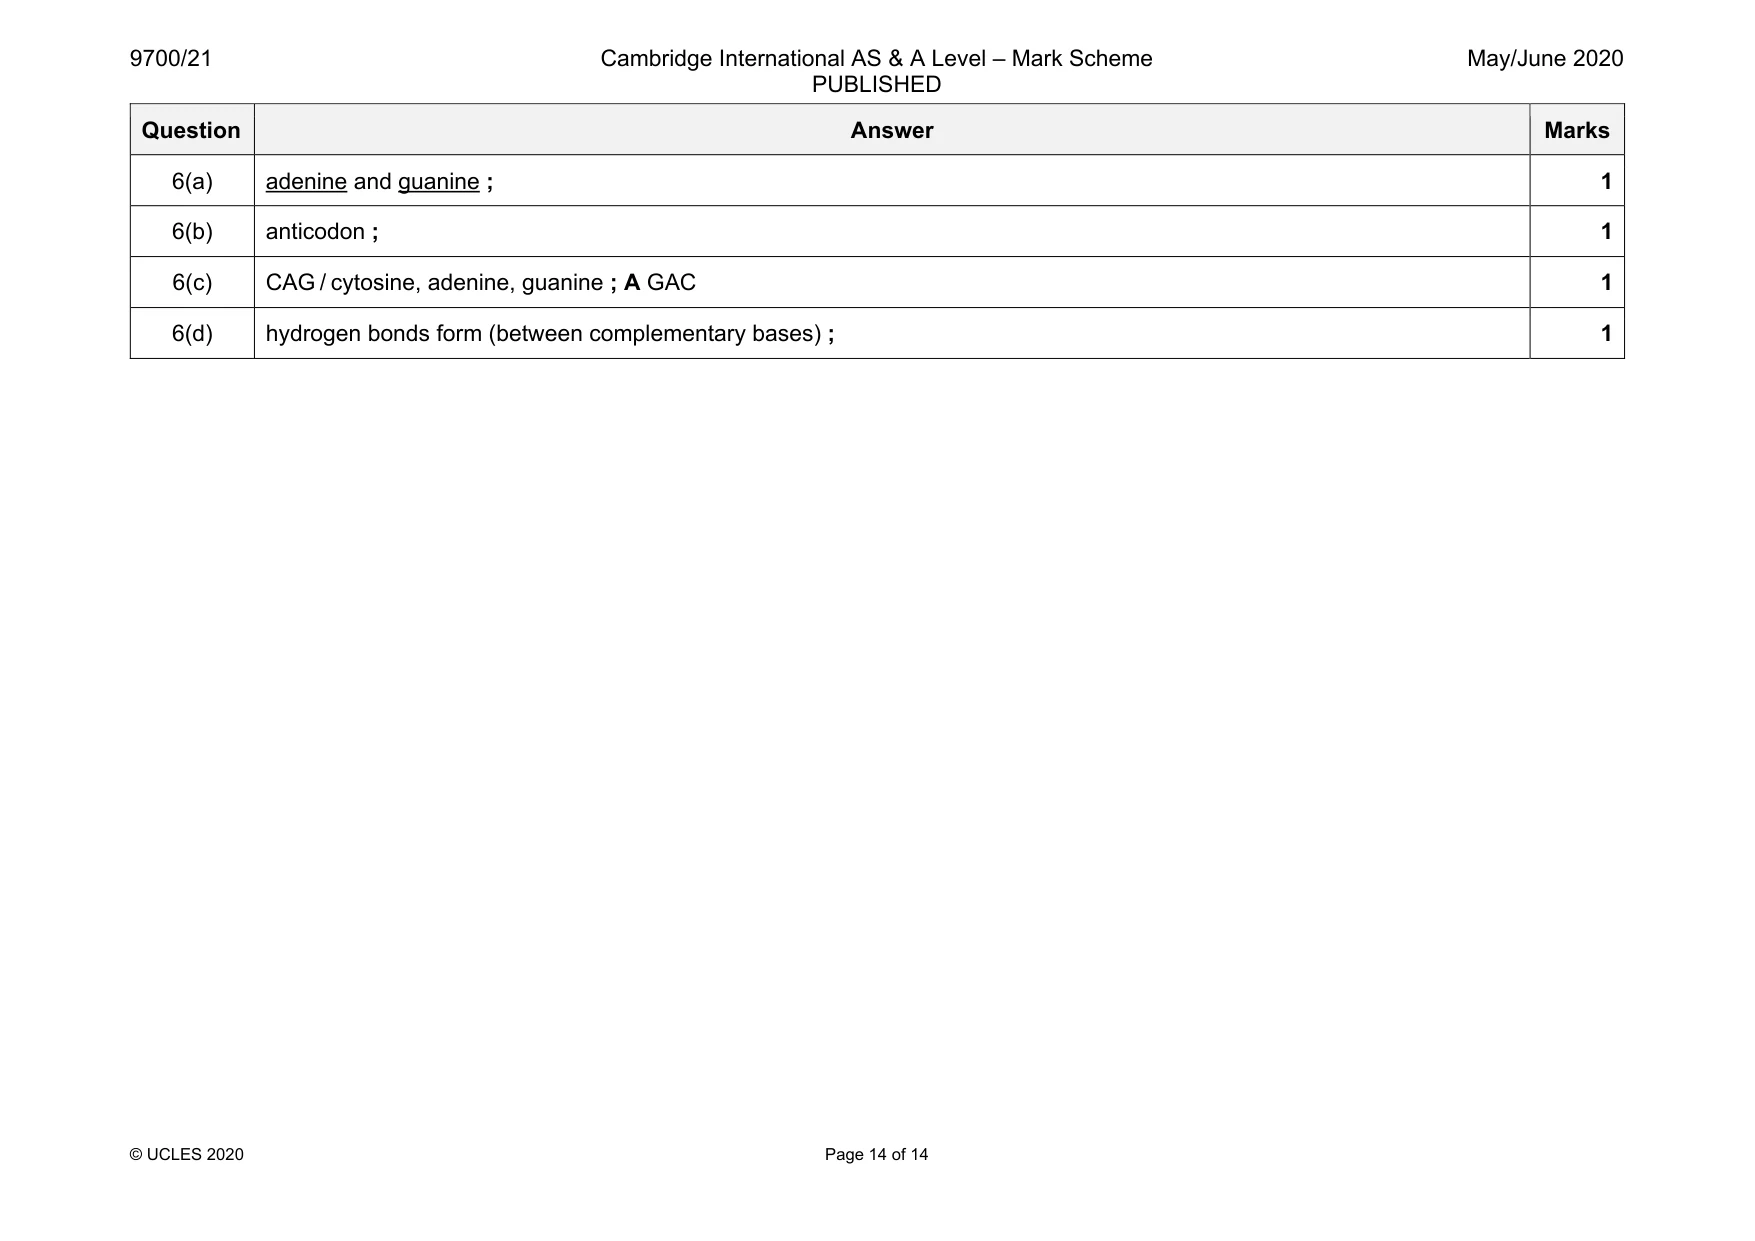
Mark scheme: 6(a) adenine and guanine ; 1 6(b) anticodon ; 1 6(c) CAG / cytosine, adenine, guanine ; A GAC 1 6(d) hydrogen bonds form (between complementary bases) ; 1
What was in this paper
The subtopics covered by these 6 questions, and how many questions each got. Open one in a new tab to see every Cambridge question on it.