Cambridge A Level Biology 9700 — 2018 May/June Paper 3 · Variant 4
9700/34/M/J/18 · 2 questions · 40 marks · ≈45 min
The question paper and its mark scheme, free to read here and free to download. This is Cambridge’s own paper, exactly as it was sat.
Question paper16 pages


Mark scheme7 pages
Answers below. Sit the paper first if you are practising.
Questions as text
Q1 · Yeast cells contain enzymes which catalyse the breakdown of glucose to produce ethanol…
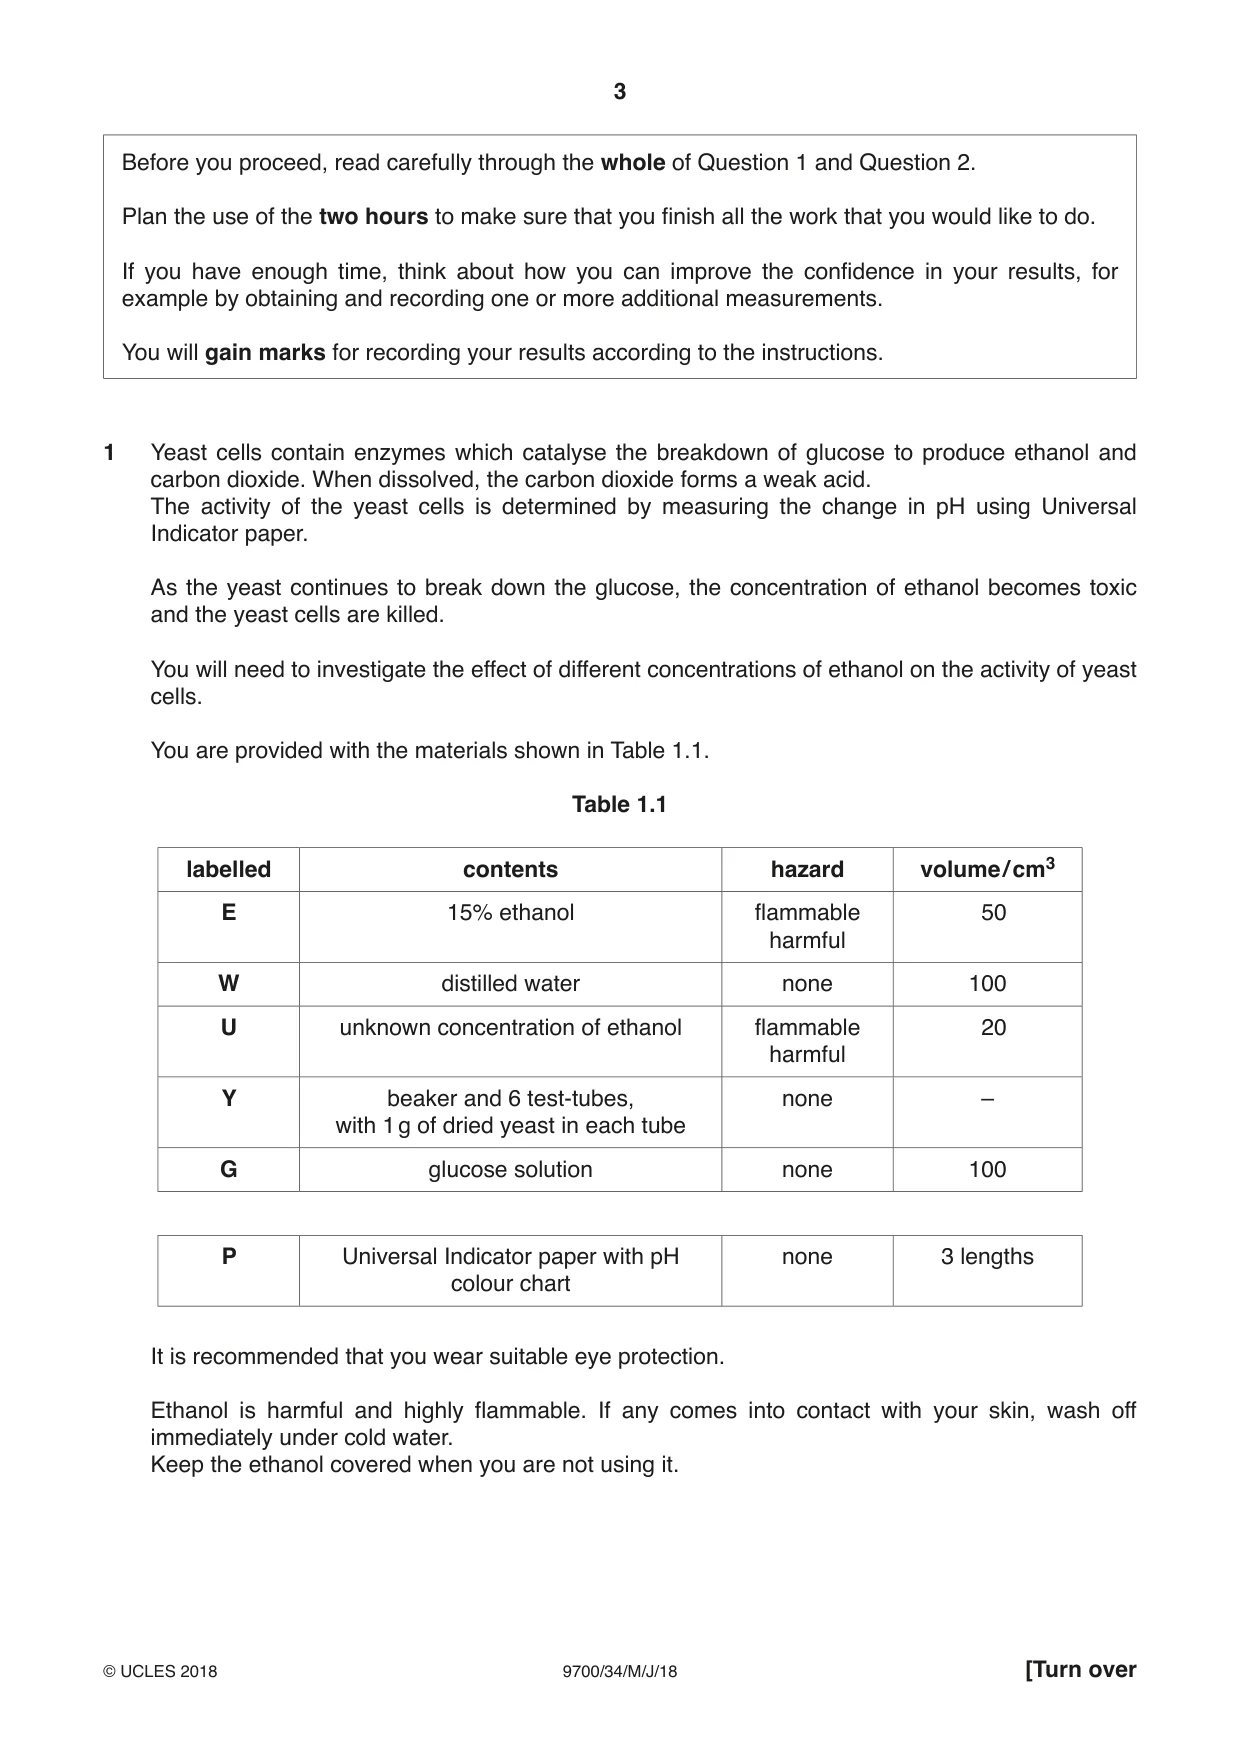
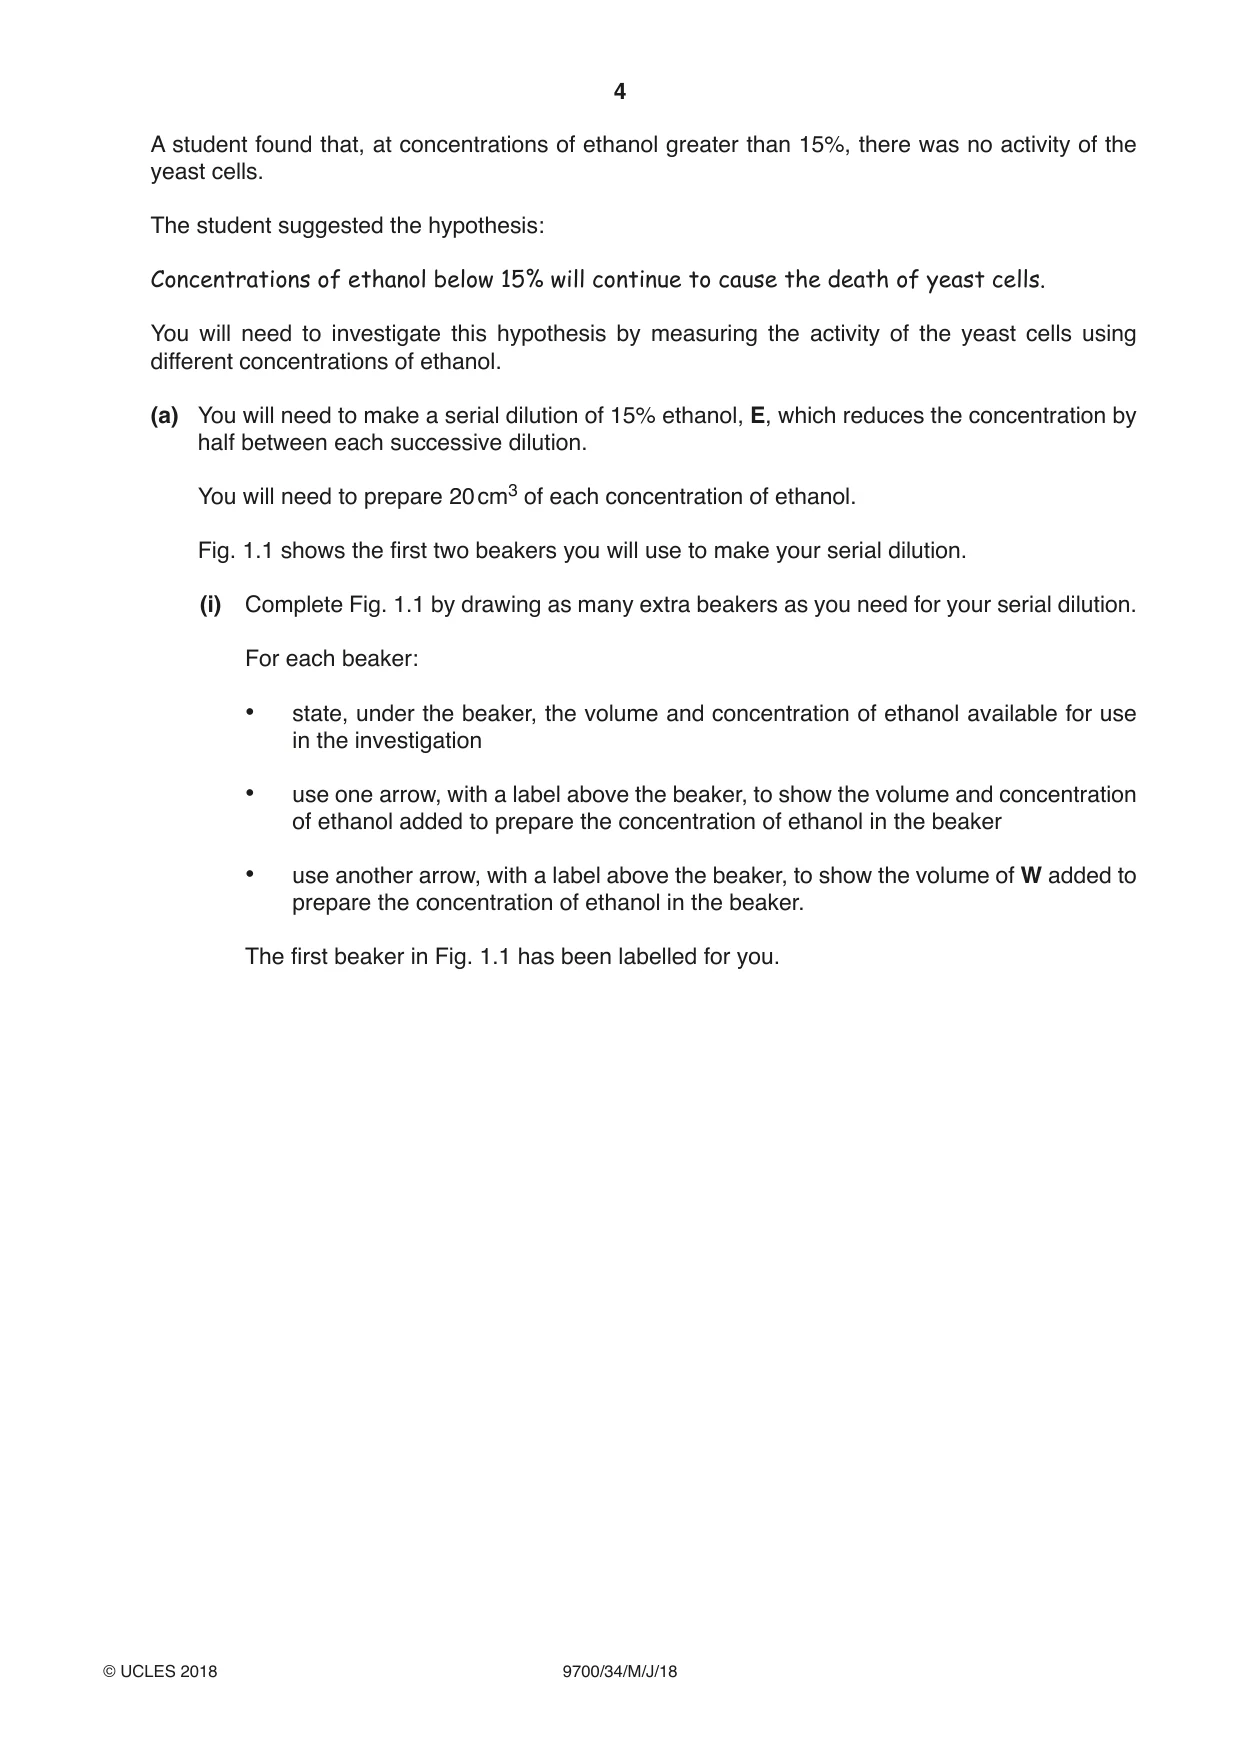
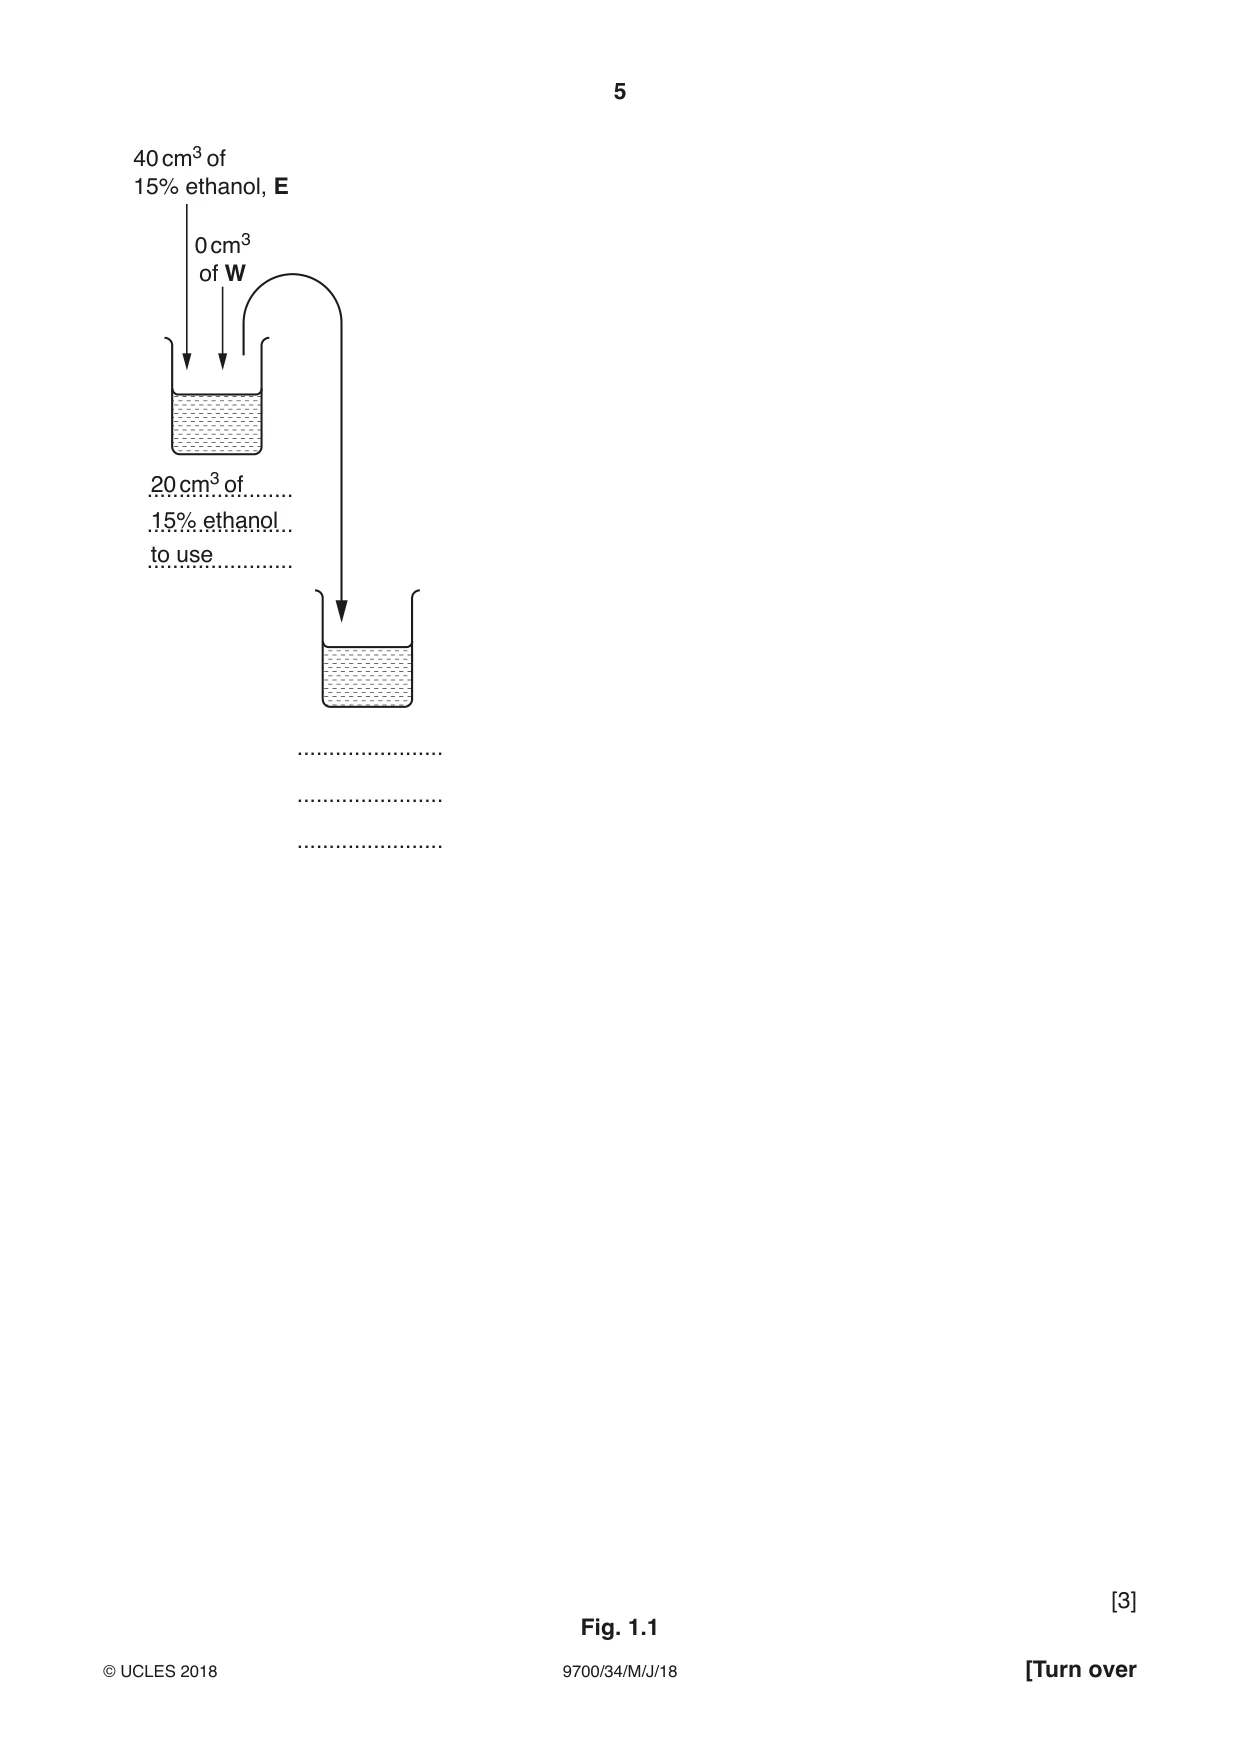
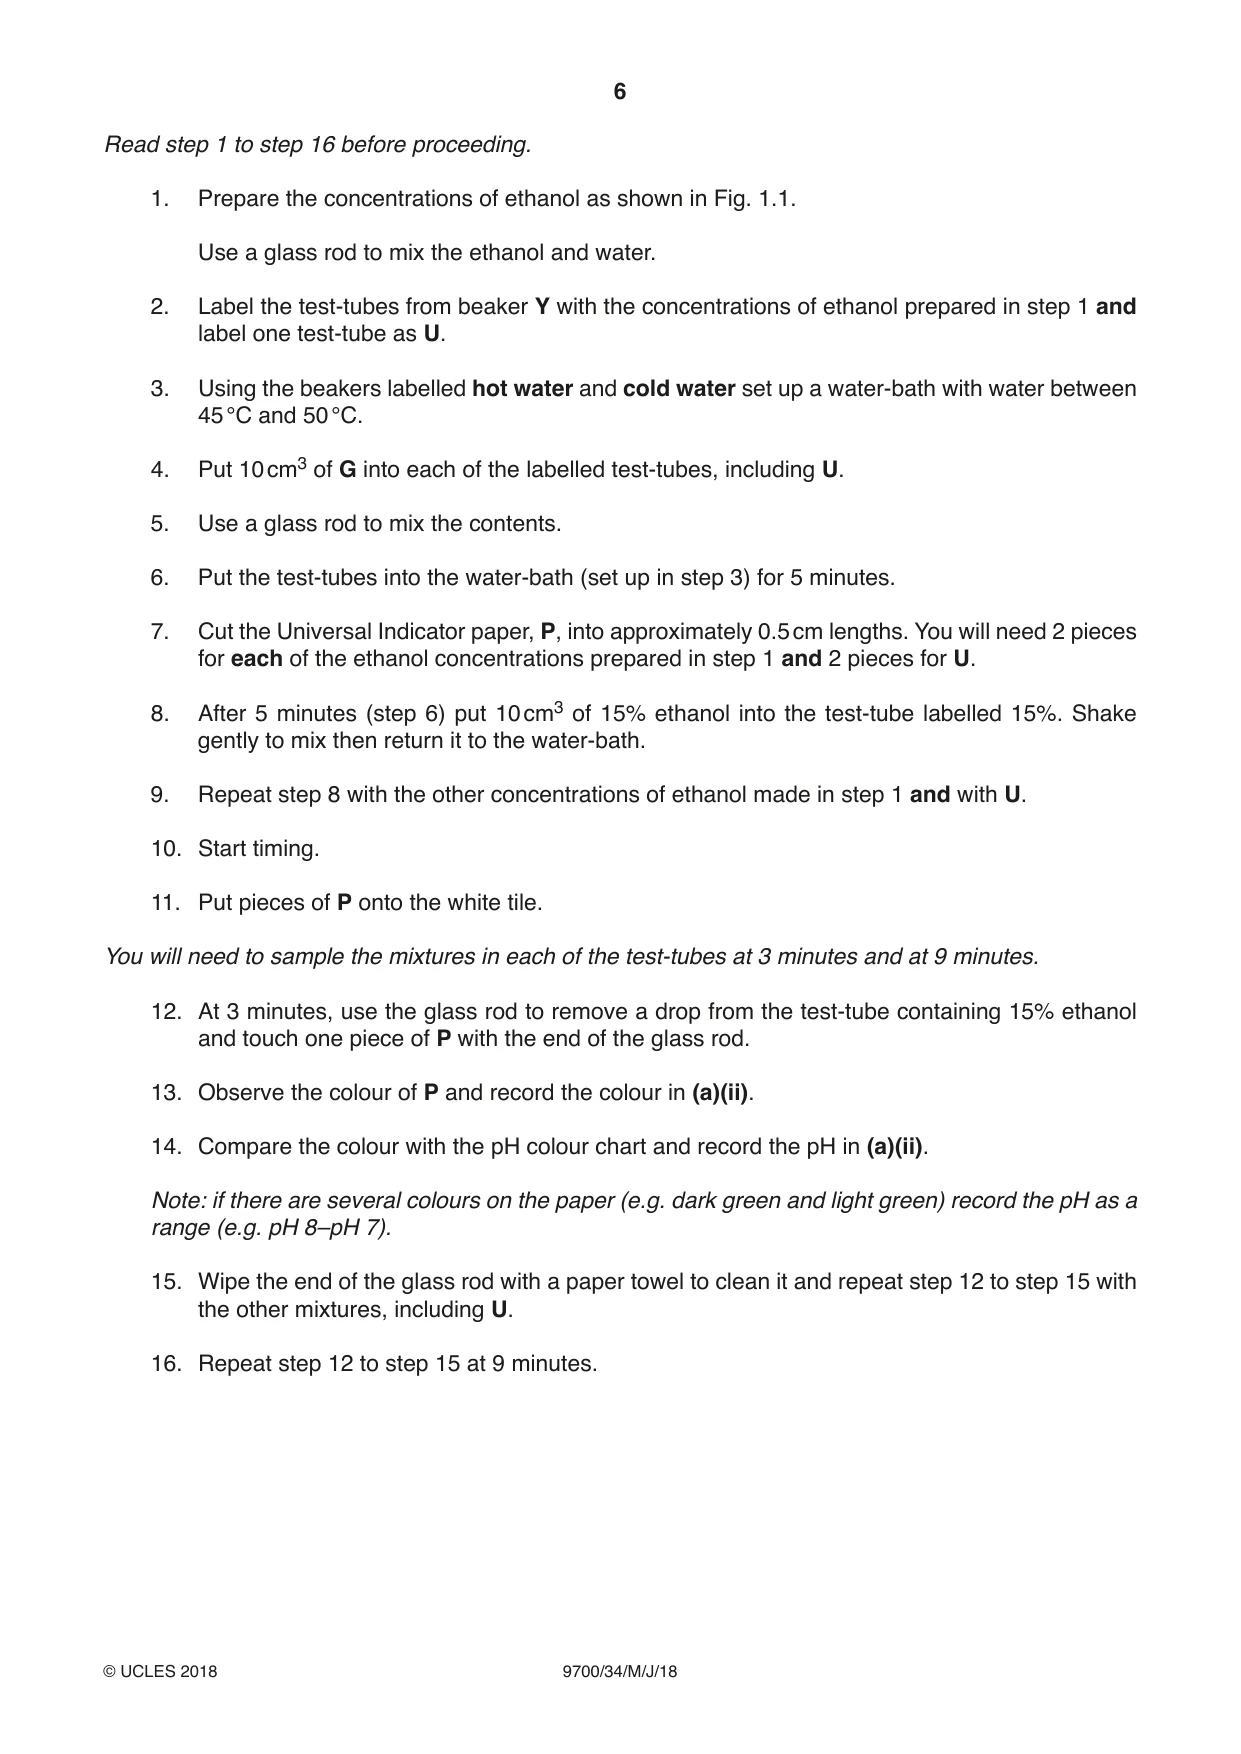
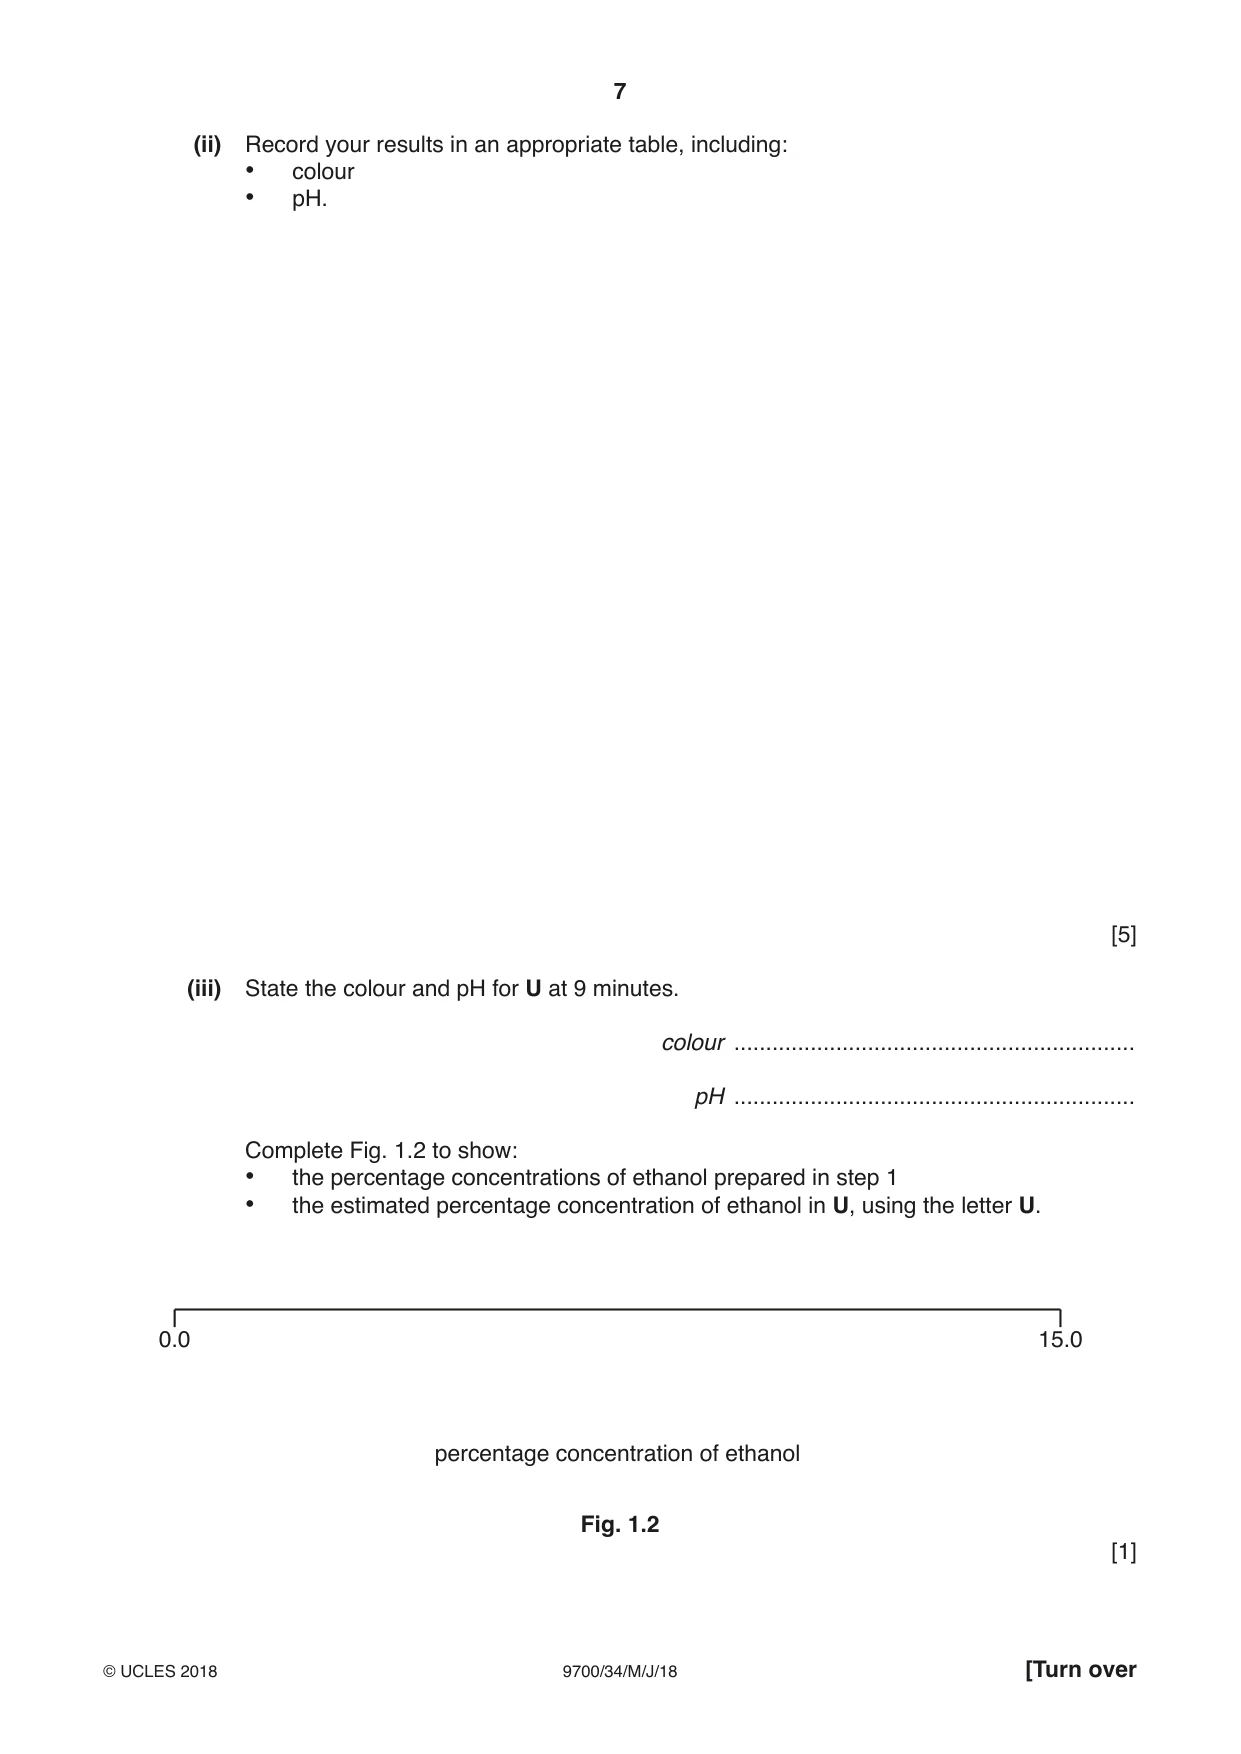
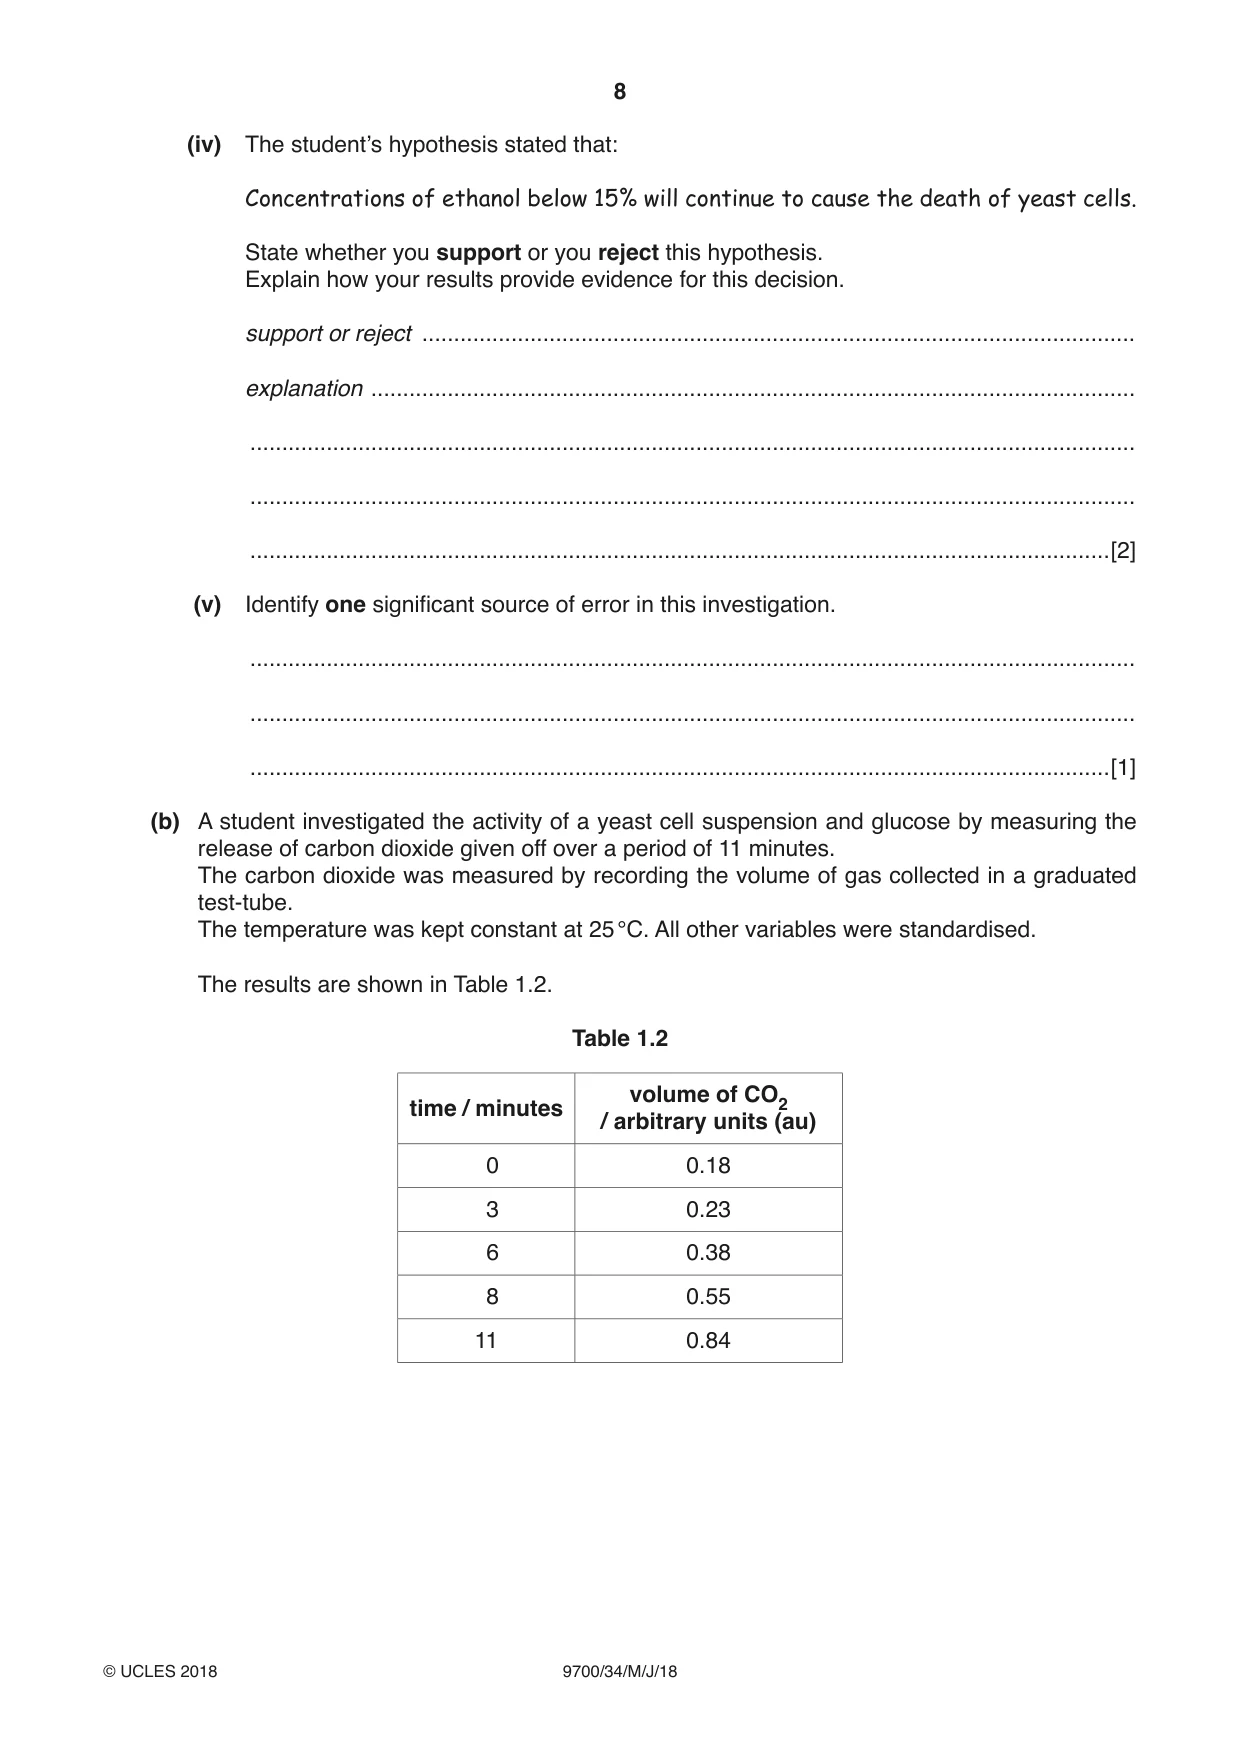
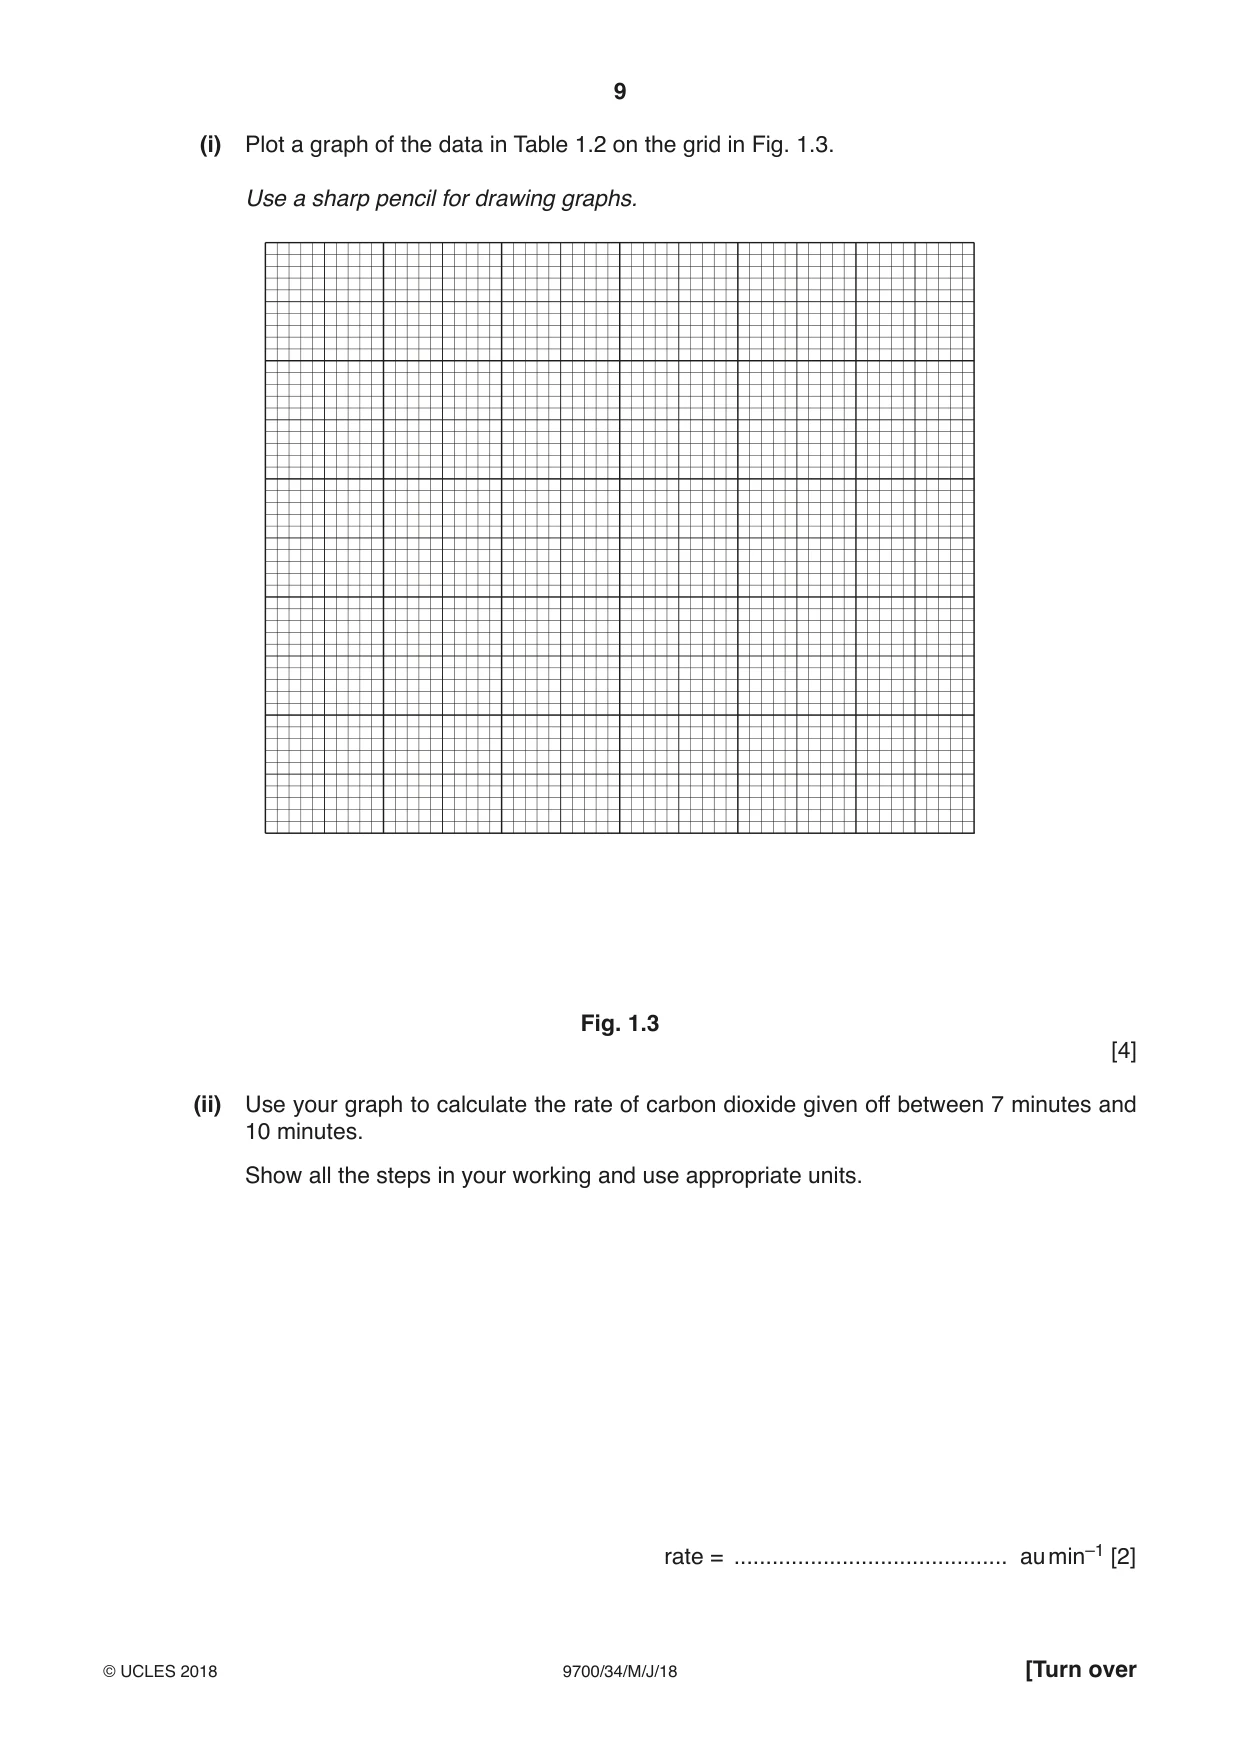
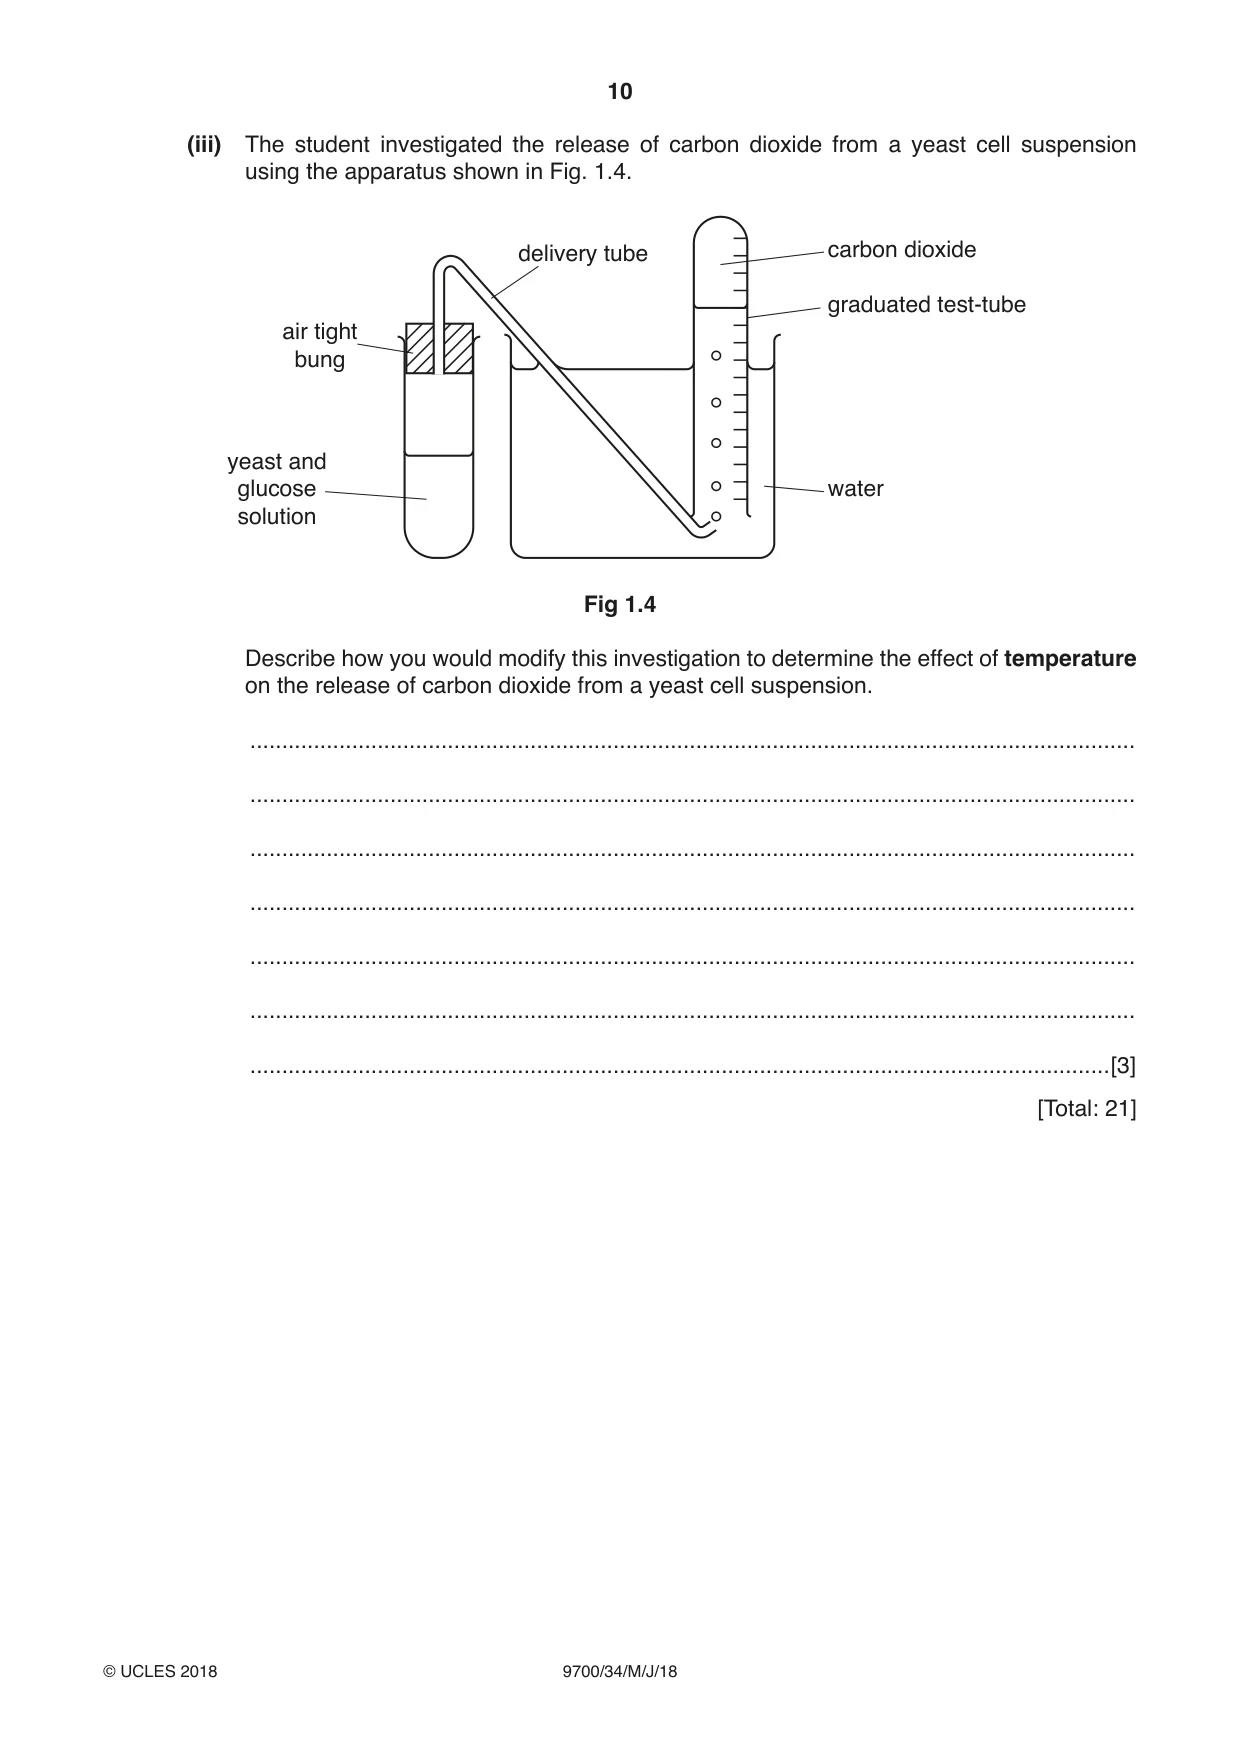
1 Yeast cells contain enzymes which catalyse the breakdown of glucose to produce ethanol and carbon dioxide. When dissolved, the carbon dioxide forms a weak acid. The activity of the yeast cells is determined by measuring the change in pH using Universal Indicator paper. As the yeast continues to break down the glucose, the concentration of ethanol becomes toxic and the yeast cells are killed. You will need to investigate the effect of different concentrations of ethanol on the activity of yeast cells. You are provided with the materials shown in Table 1.1. Table 1.1 labelled contents hazard volume / cm3 E 15% ethanol flammable 50 harmful W distilled water none 100 U unknown concentration of ethanol flammable 20 harmful Y beaker and 6 test-tubes, none – with 1 g of dried yeast in each tube G glucose solution none 100 P Universal Indicator paper with pH none 3 lengths colour chart It is recommended that you wear suitable eye protection. Ethanol is harmful and highly flammable. If any comes into contact with your skin, wash off immediately under cold water. Keep the ethanol covered when you are not using it. A student found that, at concentrations of ethanol greater than 15%, there was no activity of the yeast cells. The student suggested the hypothesis: Concentrations of ethanol below 15% will continue to cause the death of yeast cells. You will need to investigate this hypothesis by measuring the activity of the yeast cells using different concentrations of ethanol. (a) You will need to make a serial dilution of 15% ethanol, E, which reduces the concentration by half between each successive dilution. You will need to prepare 20 cm3 of each concentration of ethanol. Fig. 1.1 shows the first two beakers you will use to make your serial dilution. (i) Complete Fig. 1.1 by drawing as many extra beakers as you need for your serial dilution. For each beaker: • state, under the beaker, the volume and concentration of ethanol available for use in the investigation • use one arrow, with a label above the beaker, to show the volume and concentration of ethanol added to prepare the concentration of ethanol in the beaker • use another arrow, with a label above the beaker, to show the volume of W added to prepare the concentration of ethanol in the beaker. The first beaker in Fig. 1.1 has been labelled for you. 40 cm3 of 15% ethanol, E 0 cm3 of W .......................20 cm3 of .......................15% ethanol .......................to use ....................... ....................... ....................... [3] Fig. 1.1 Read step 1 to step 16 before proceeding. 1. Prepare the concentrations of ethanol as shown in Fig. 1.1. Use a glass rod to mix the ethanol and water. 2. Label the test-tubes from beaker Y with the concentrations of ethanol prepared in step 1 and label one test-tube as U. 3. Using the beakers labelled hot water and cold water set up a water-bath with water between 45 °C and 50 °C. 4. Put 10 cm3 of G into each of the labelled test-tubes, including U. 5. Use a glass rod to mix the contents. 6. Put the test-tubes into the water-bath (set up in step 3) for 5 minutes. 7. Cut the Universal Indicator paper, P, into approximately 0.5 cm lengths. You will need 2 pieces for each of the ethanol concentrations prepared in step 1 and 2 pieces for U. 8. After 5 minutes (step 6) put 10 cm3 of 15% ethanol into the test-tube labelled 15%. Shake gently to mix then return it to the water-bath. 9. Repeat step 8 with the other concentrations of ethanol made in step 1 and with U. 10. Start timing. 11. Put pieces of P onto the white tile. You will need to sample the mixtures in each of the test-tubes at 3 minutes and at 9 minutes. 12. At 3 minutes, use the glass rod to remove a drop from the test-tube containing 15% ethanol and touch one piece of P with the end of the glass rod. 13. Observe the colour of P and record the colour in (a)(ii). 14. Compare the colour with the pH colour chart and record the pH in (a)(ii). Note: if there are several colours on the paper (e.g. dark green and light green) record the pH as a range (e.g. pH 8–pH 7). 15. Wipe the end of the glass rod with a paper towel to clean it and repeat step 12 to step 15 with the other mixtures, including U. 16. Repeat step 12 to step 15 at 9 minutes. (ii) Record your results in an appropriate table, including: • colour • pH. [5] (iii) State the colour and pH for U at 9 minutes. colour ............................................................... pH ............................................................... Complete Fig. 1.2 to show: • the percentage concentrations of ethanol prepared in step 1 • the estimated percentage concentration of ethanol in U, using the letter U. 0.0 15.0 percentage concentration of ethanol Fig. 1.2 [1] (iv) The student’s hypothesis stated that: Concentrations of ethanol below 15% will continue to cause the death of yeast cells. State whether you support or you reject this hypothesis. Explain how your results provide evidence for this decision. support or reject ................................................................................................................ explanation ........................................................................................................................ ........................................................................................................................................... ........................................................................................................................................... .......................................................................................................................................[2] (v) Identify one significant source of error in this investigation. ........................................................................................................................................... ........................................................................................................................................... .......................................................................................................................................[1] (b) A student investigated the activity of a yeast cell suspension and glucose by measuring the release of carbon dioxide given off over a period of 11 minutes. The carbon dioxide was measured by recording the volume of gas collected in a graduated test-tube. The temperature was kept constant at 25 °C. All other variables were standardised. The results are shown in Table 1.2. Table 1.2 volume of CO2 time / minutes / arbitrary units (au) 0 0.18 3 0.23 6 0.38 8 0.55 11 0.84 (i) Plot a graph of the data in Table 1.2 on the grid in Fig. 1.3. Use a sharp pencil for drawing graphs. Fig. 1.3 [4] (ii) Use your graph to calculate the rate of carbon dioxide given off between 7 minutes and 10 minutes. Show all the steps in your working and use appropriate units. rate = ........................................... au min–1 [2] (iii) The student investigated the release of carbon dioxide from a yeast cell suspension using the apparatus shown in Fig. 1.4. delivery tube carbon dioxide graduated test-tube air tight bung yeast and glucose water solution Fig 1.4 Describe how you would modify this investigation to determine the effect of temperature on the release of carbon dioxide from a yeast cell suspension. ........................................................................................................................................... ........................................................................................................................................... ........................................................................................................................................... ........................................................................................................................................... ........................................................................................................................................... ........................................................................................................................................... .......................................................................................................................................[3] [Total: 21]
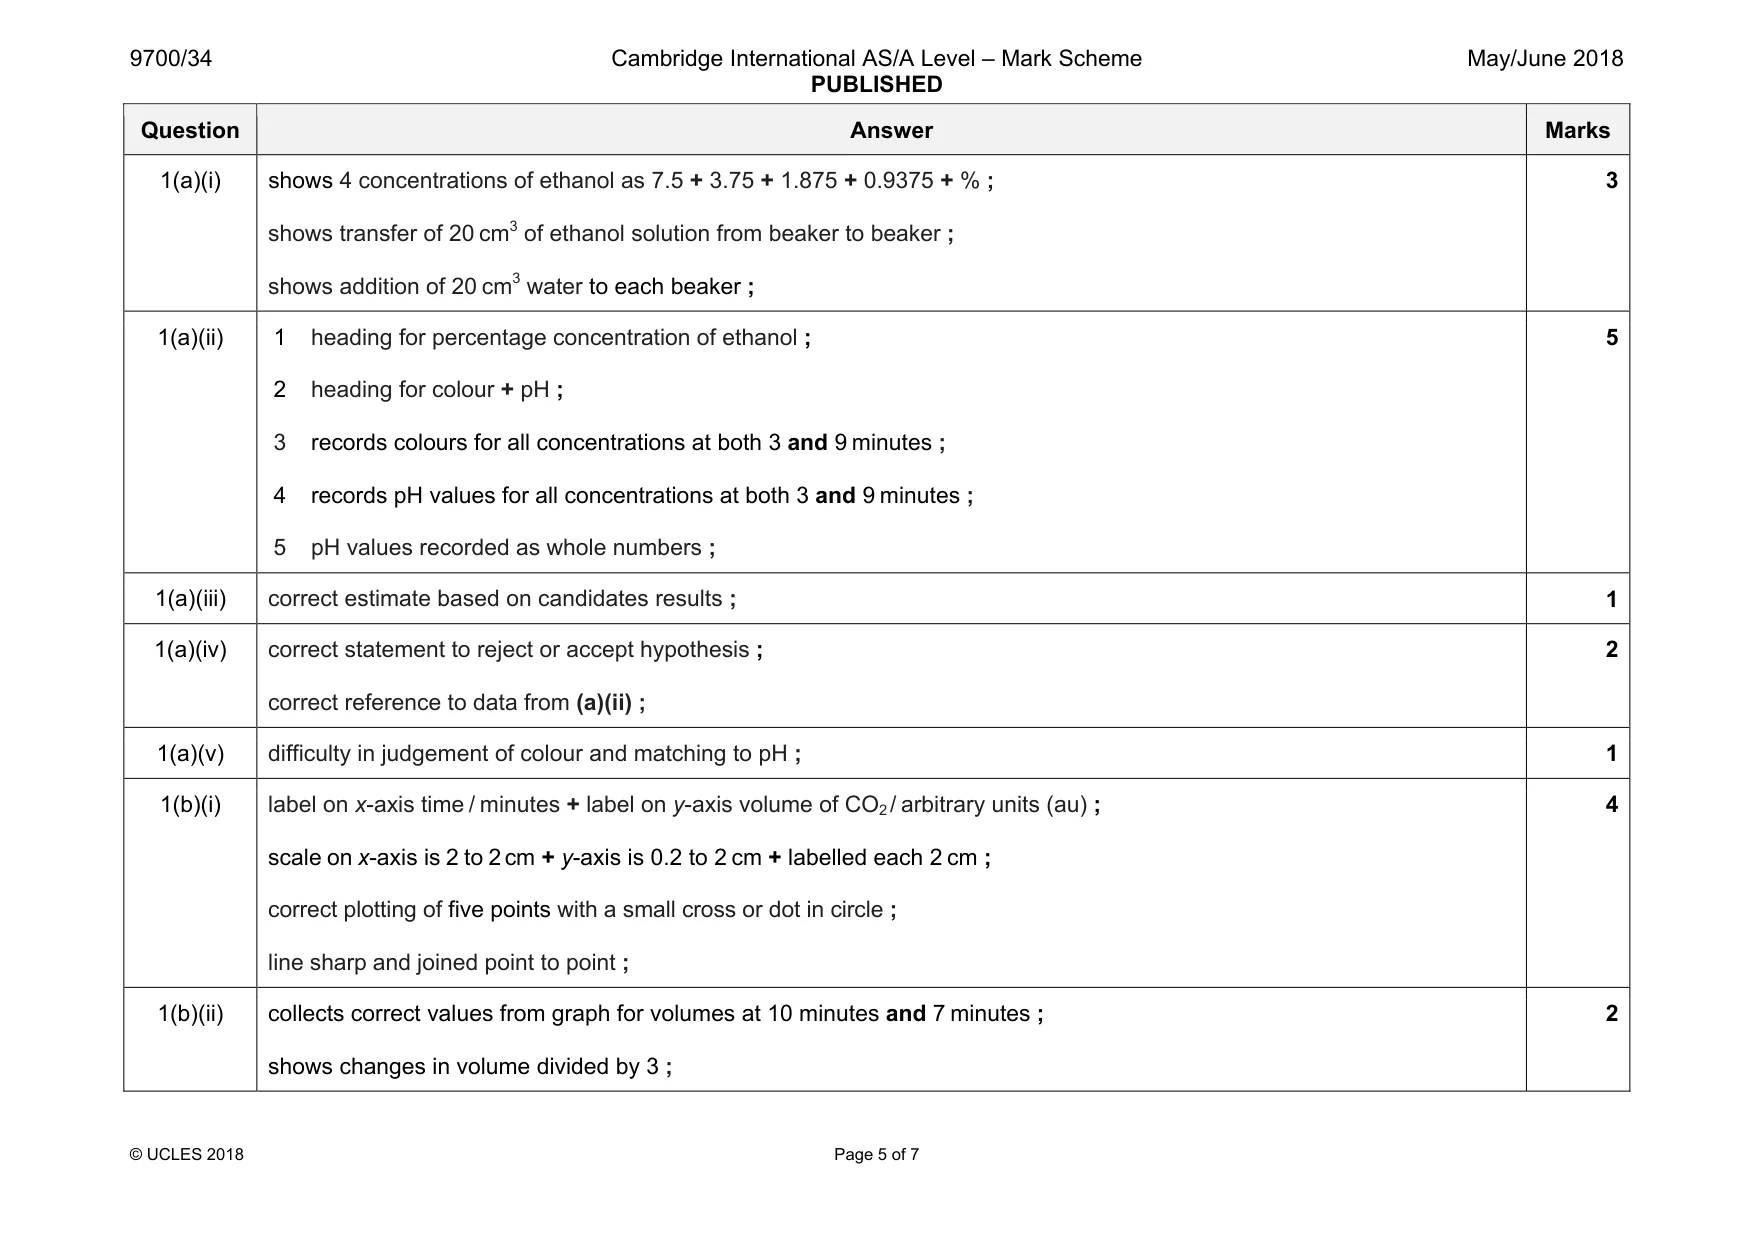
Mark scheme: 1(a)(i) shows 4 concentrations of ethanol as 7.5 + 3.75 + 1.875 + 0.9375 + % ; shows transfer of 20 cm3 of ethanol solution from beaker to beaker ; shows addition of 20 cm3 water to each beaker ; 3 1(a)(ii) 1 heading for percentage concentration of ethanol ; 2 heading for colour + pH ; 3 records colours for all concentrations at both 3 and 9 minutes ; 4 records pH values for all concentrations at both 3 and 9 minutes ; 5 pH values recorded as whole numbers ; 5 1(a)(iii) correct estimate based on candidates results ; 1 1(a)(iv) correct statement to reject or accept hypothesis ; correct reference to data from (a)(ii) ; 2 1(a)(v) difficulty in judgement of colour and matching to pH ; 1 1(b)(i) label on x-axis time / minutes + label on y-axis volume of CO2 / arbitrary units (au) ; scale on x-axis is 2 to 2 cm + y-axis is 0.2 to 2 cm + labelled each 2 cm ; correct plotting of five points with a small cross or dot in circle ; line sharp and joined point to point ; 4 1(b)(ii) collects correct values from graph for volumes at 10 minutes and 7 minutes ; shows changes in volume divided by 3 ; 2 Question Answer Marks 1(b)(iii) thermostatically controlled water-bath ; at least 5 temperatures ; mass / volume of yeast the same or concentration of glucose the same ; 3
Q2 · In order to observe yeast cells using a light microscope, they are often stained
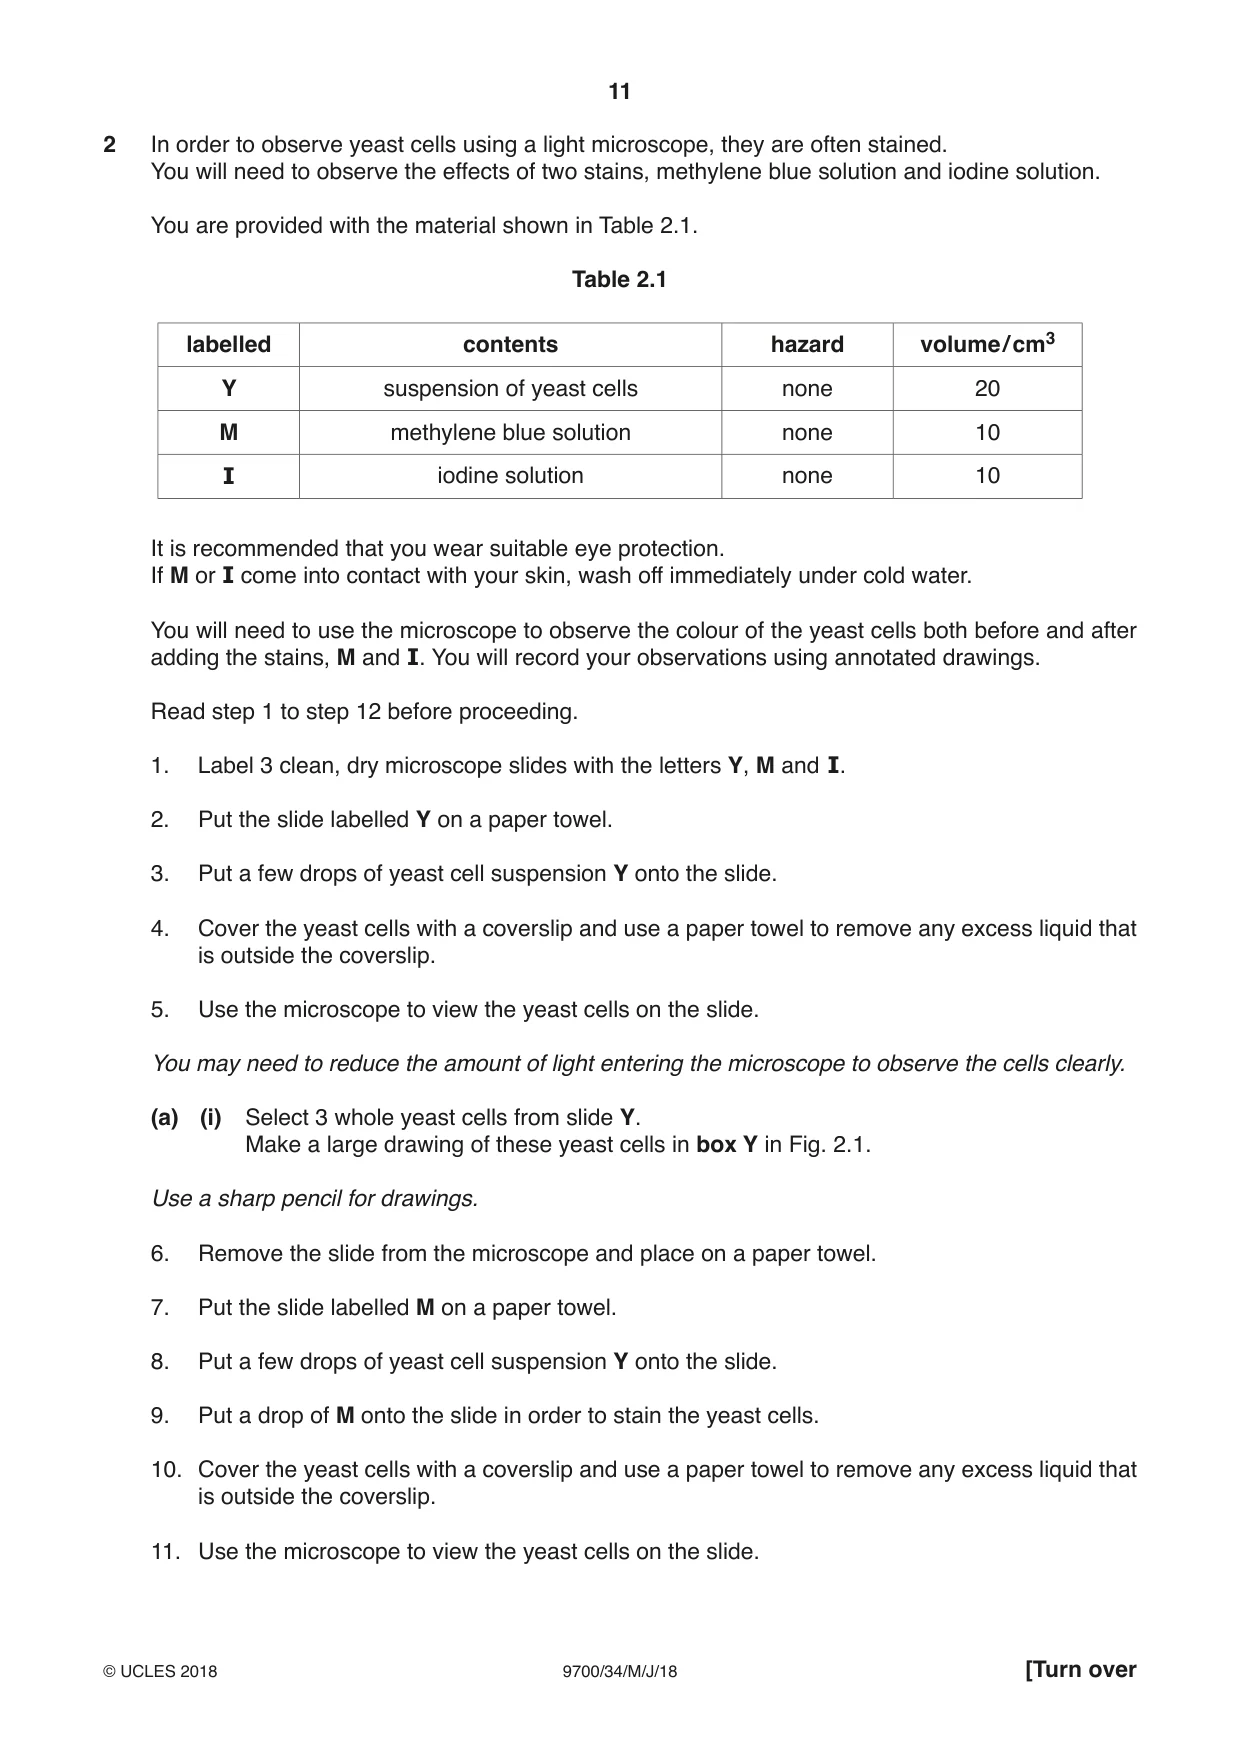
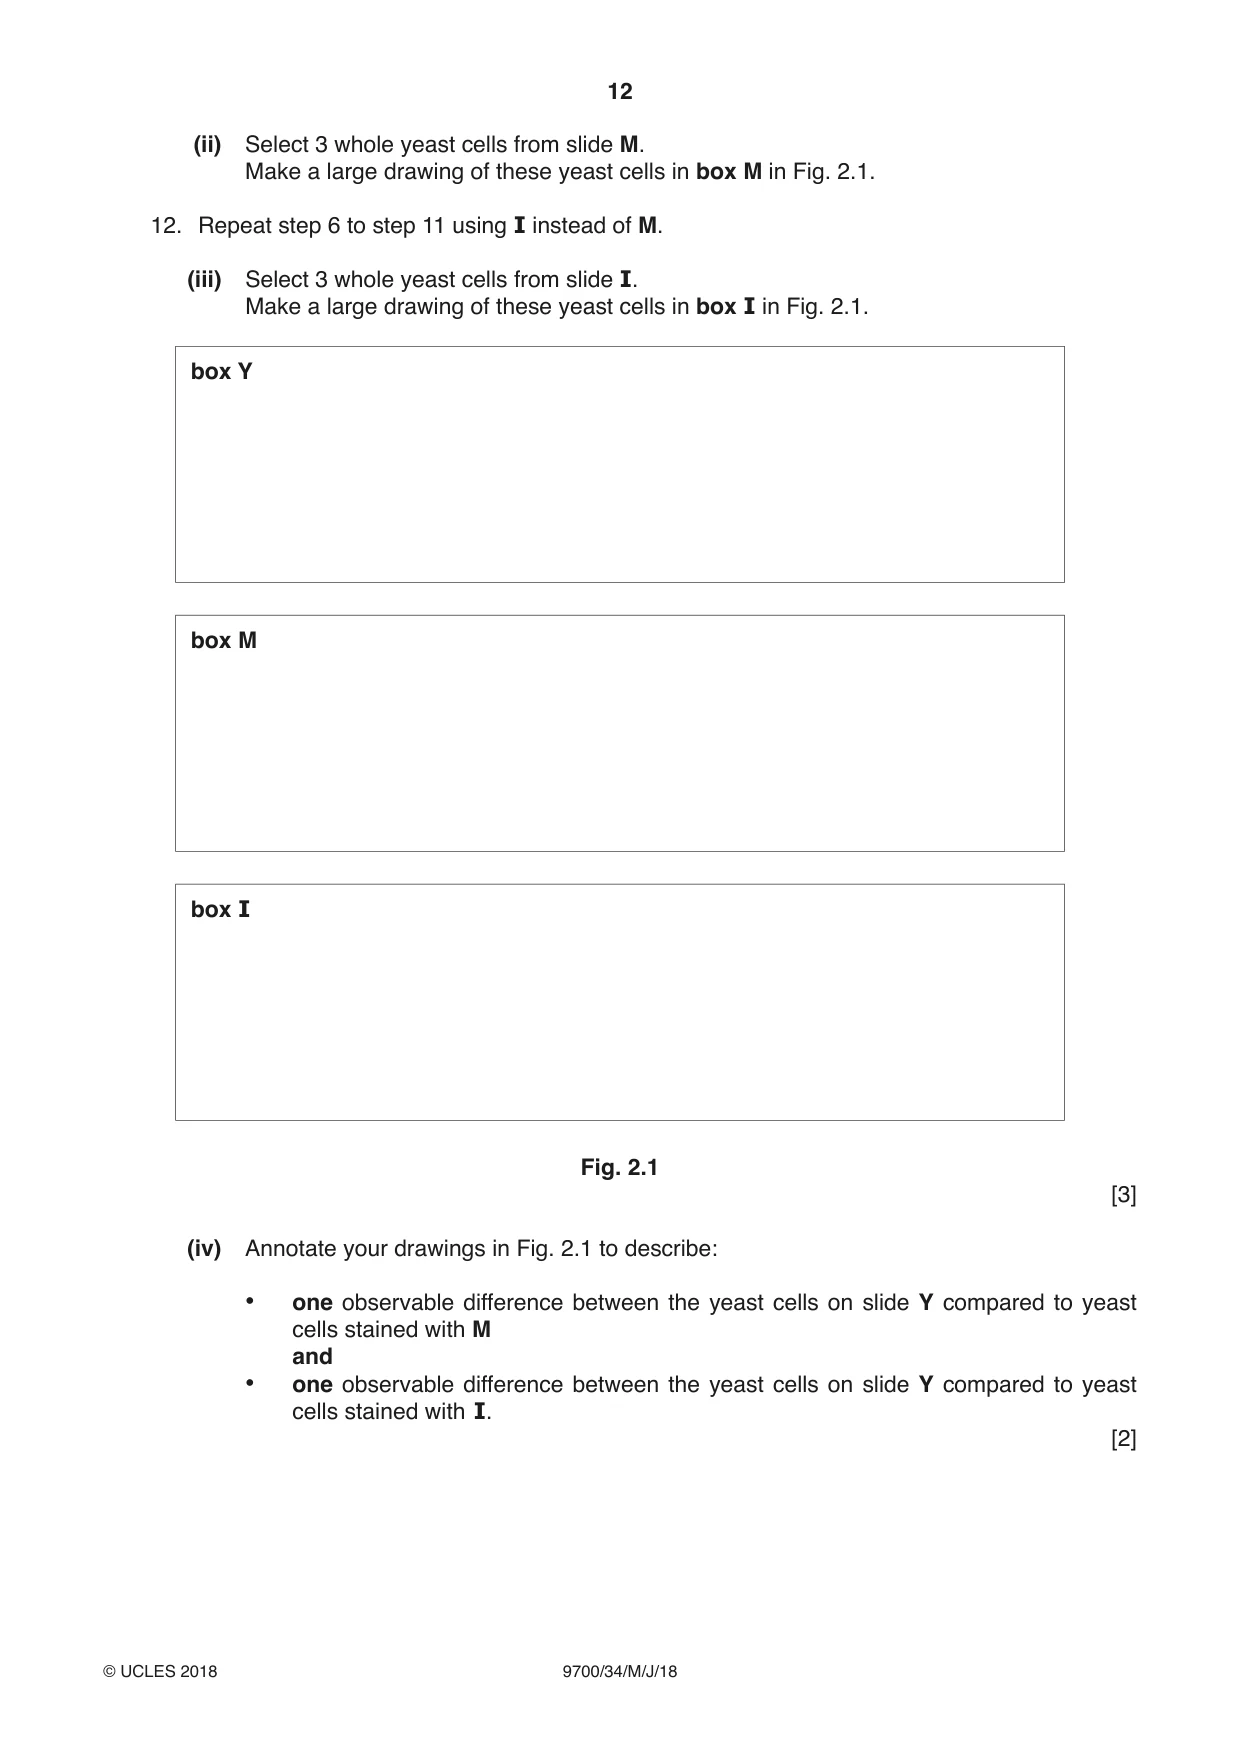
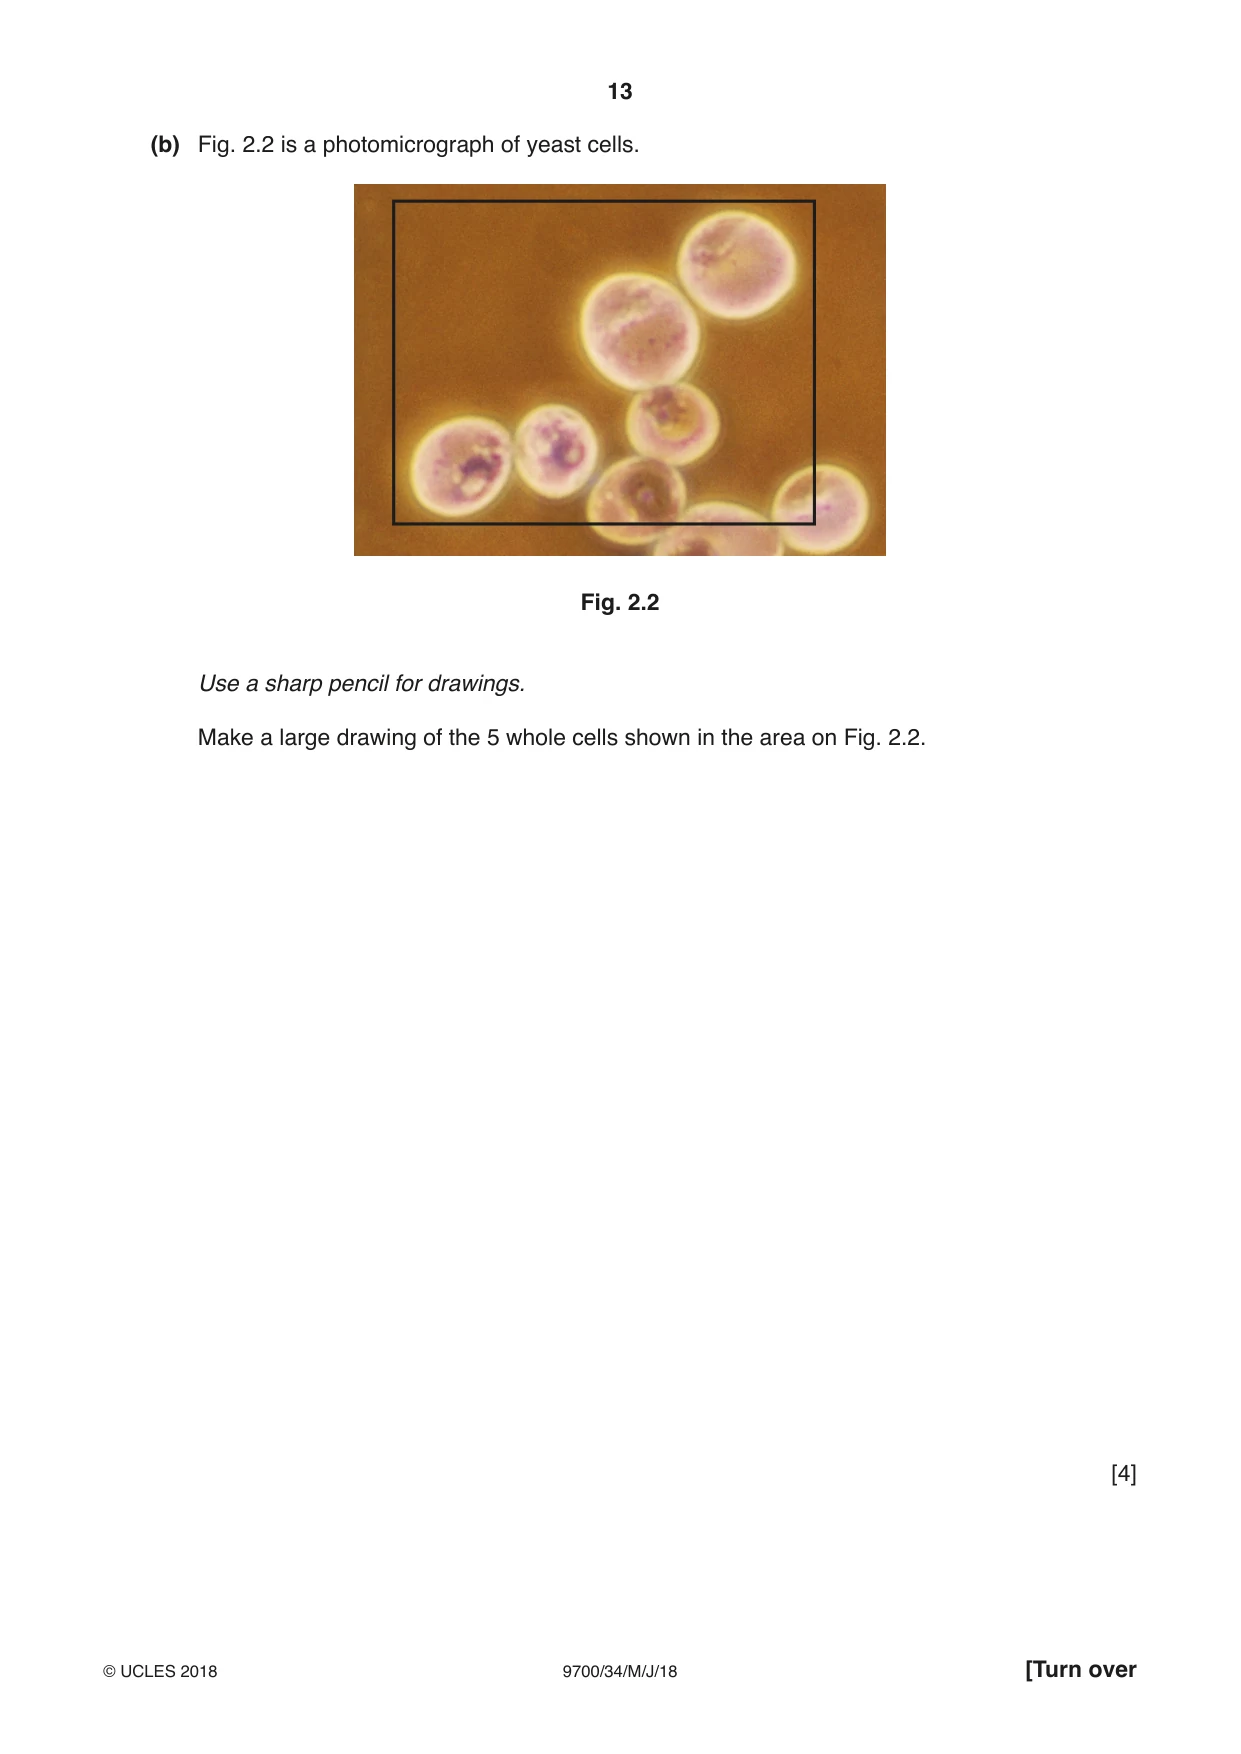
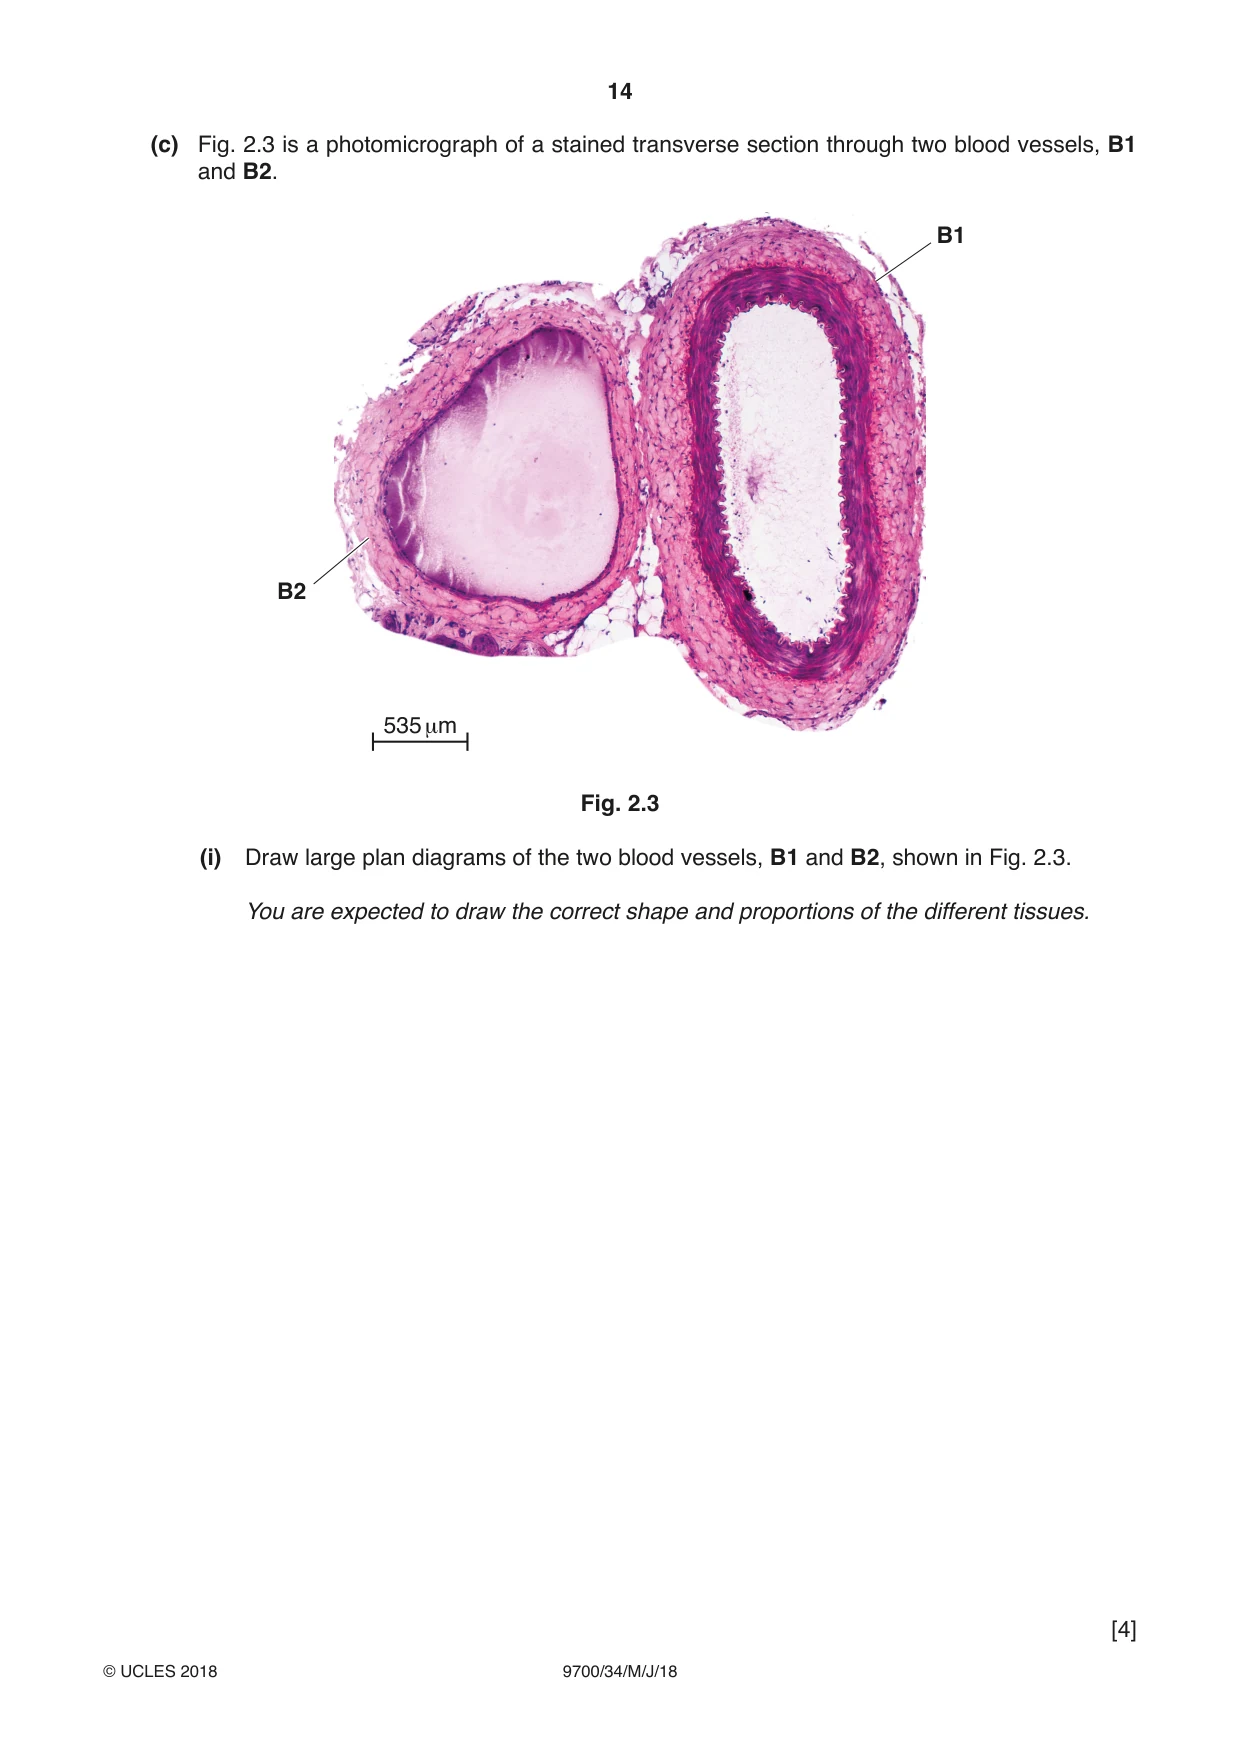
2 In order to observe yeast cells using a light microscope, they are often stained. You will need to observe the effects of two stains, methylene blue solution and iodine solution. You are provided with the material shown in Table 2.1. Table 2.1 labelled contents hazard volume / cm3 Y suspension of yeast cells none 20 M methylene blue solution none 10 I iodine solution none 10 It is recommended that you wear suitable eye protection. If M or I come into contact with your skin, wash off immediately under cold water. You will need to use the microscope to observe the colour of the yeast cells both before and after adding the stains, M and I. You will record your observations using annotated drawings. Read step 1 to step 12 before proceeding. 1. Label 3 clean, dry microscope slides with the letters Y, M and I. 2. Put the slide labelled Y on a paper towel. 3. Put a few drops of yeast cell suspension Y onto the slide. 4. Cover the yeast cells with a coverslip and use a paper towel to remove any excess liquid that is outside the coverslip. 5. Use the microscope to view the yeast cells on the slide. You may need to reduce the amount of light entering the microscope to observe the cells clearly. (a) (i) Select 3 whole yeast cells from slide Y. Make a large drawing of these yeast cells in box Y in Fig. 2.1. Use a sharp pencil for drawings. 6. Remove the slide from the microscope and place on a paper towel. 7. Put the slide labelled M on a paper towel. 8. Put a few drops of yeast cell suspension Y onto the slide. 9. Put a drop of M onto the slide in order to stain the yeast cells. 10. Cover the yeast cells with a coverslip and use a paper towel to remove any excess liquid that is outside the coverslip. 11. Use the microscope to view the yeast cells on the slide. (ii) Select 3 whole yeast cells from slide M. Make a large drawing of these yeast cells in box M in Fig. 2.1. 12. Repeat step 6 to step 11 using I instead of M. (iii) Select 3 whole yeast cells from slide I. Make a large drawing of these yeast cells in box I in Fig. 2.1. box Y box M box I Fig. 2.1 [3] (iv) Annotate your drawings in Fig. 2.1 to describe: • one observable difference between the yeast cells on slide Y compared to yeast cells stained with M and • one observable difference between the yeast cells on slide Y compared to yeast cells stained with I. [2] (b) Fig. 2.2 is a photomicrograph of yeast cells. Fig. 2.2 Use a sharp pencil for drawings. Make a large drawing of the 5 whole cells shown in the area on Fig. 2.2. [4]
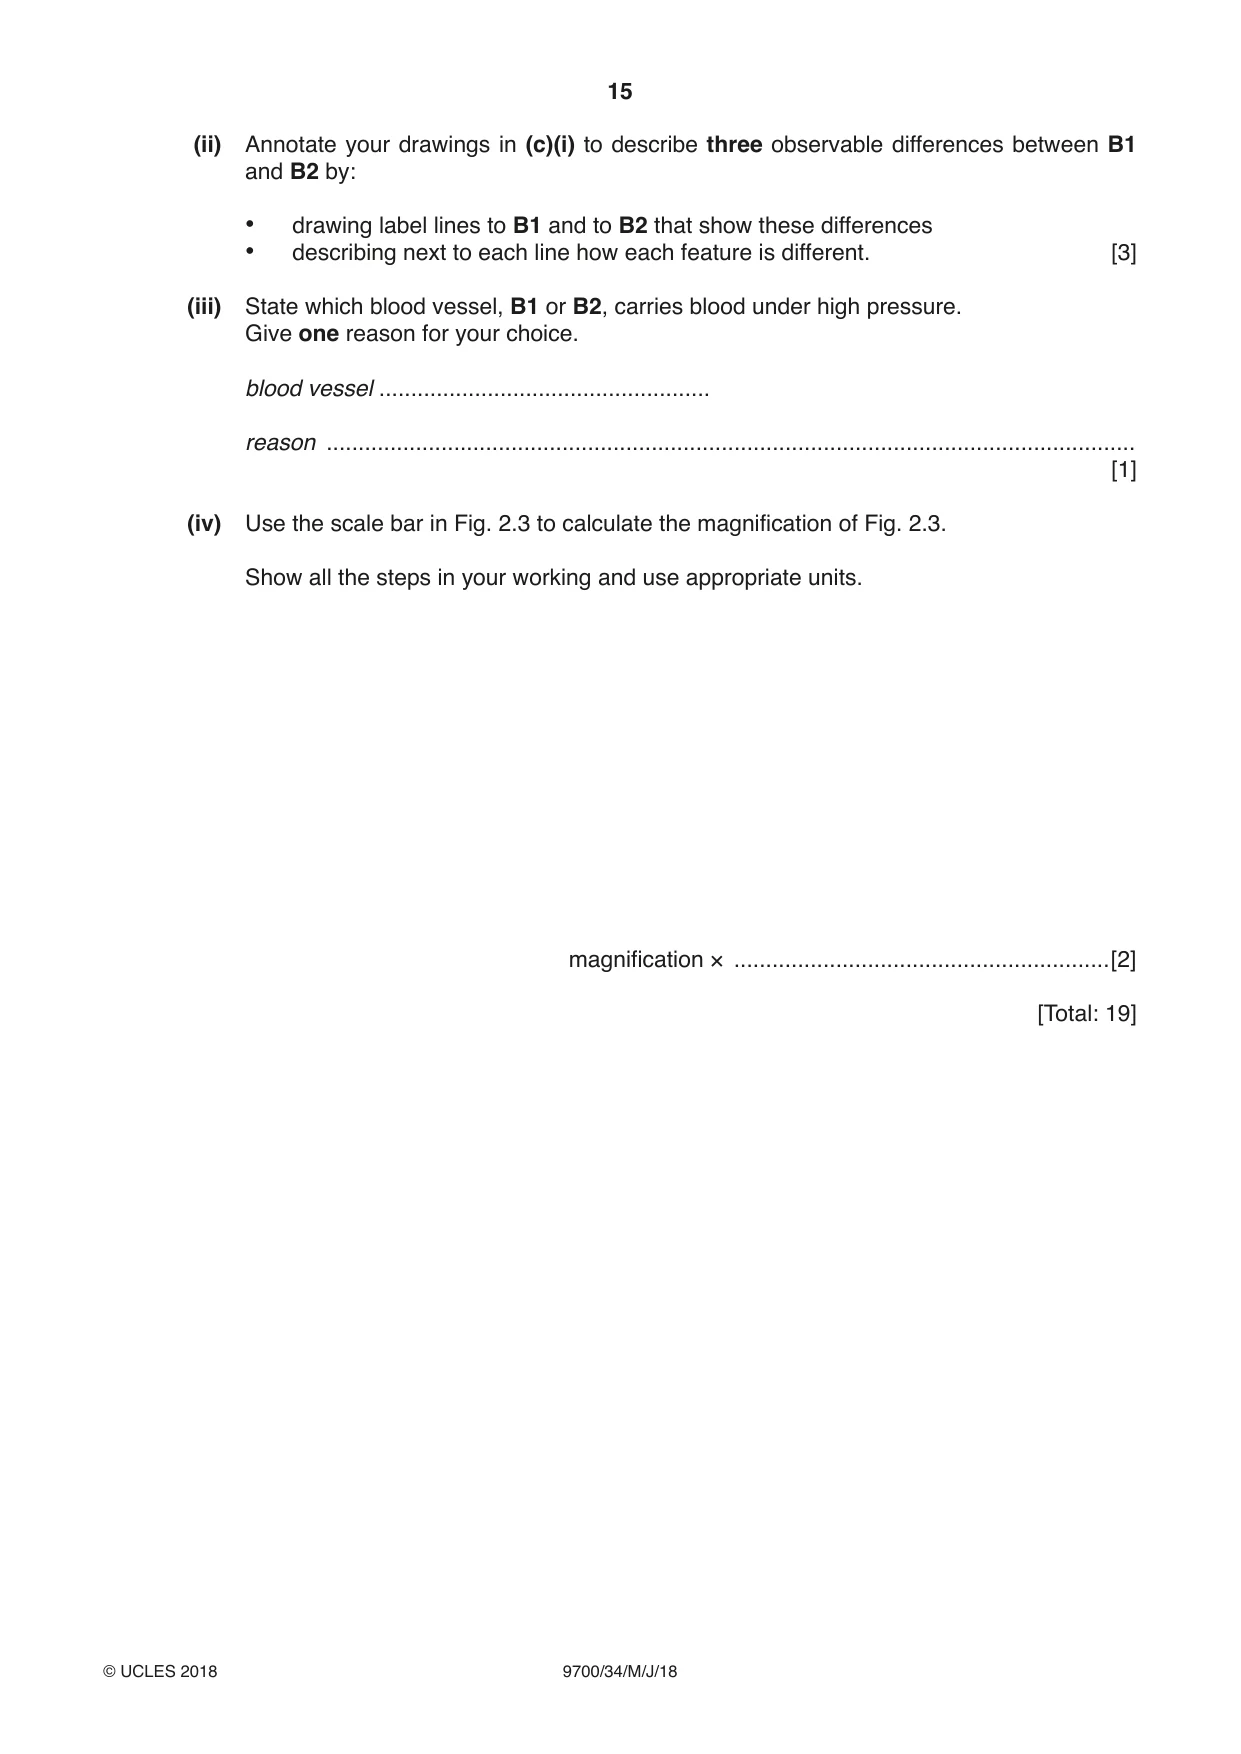
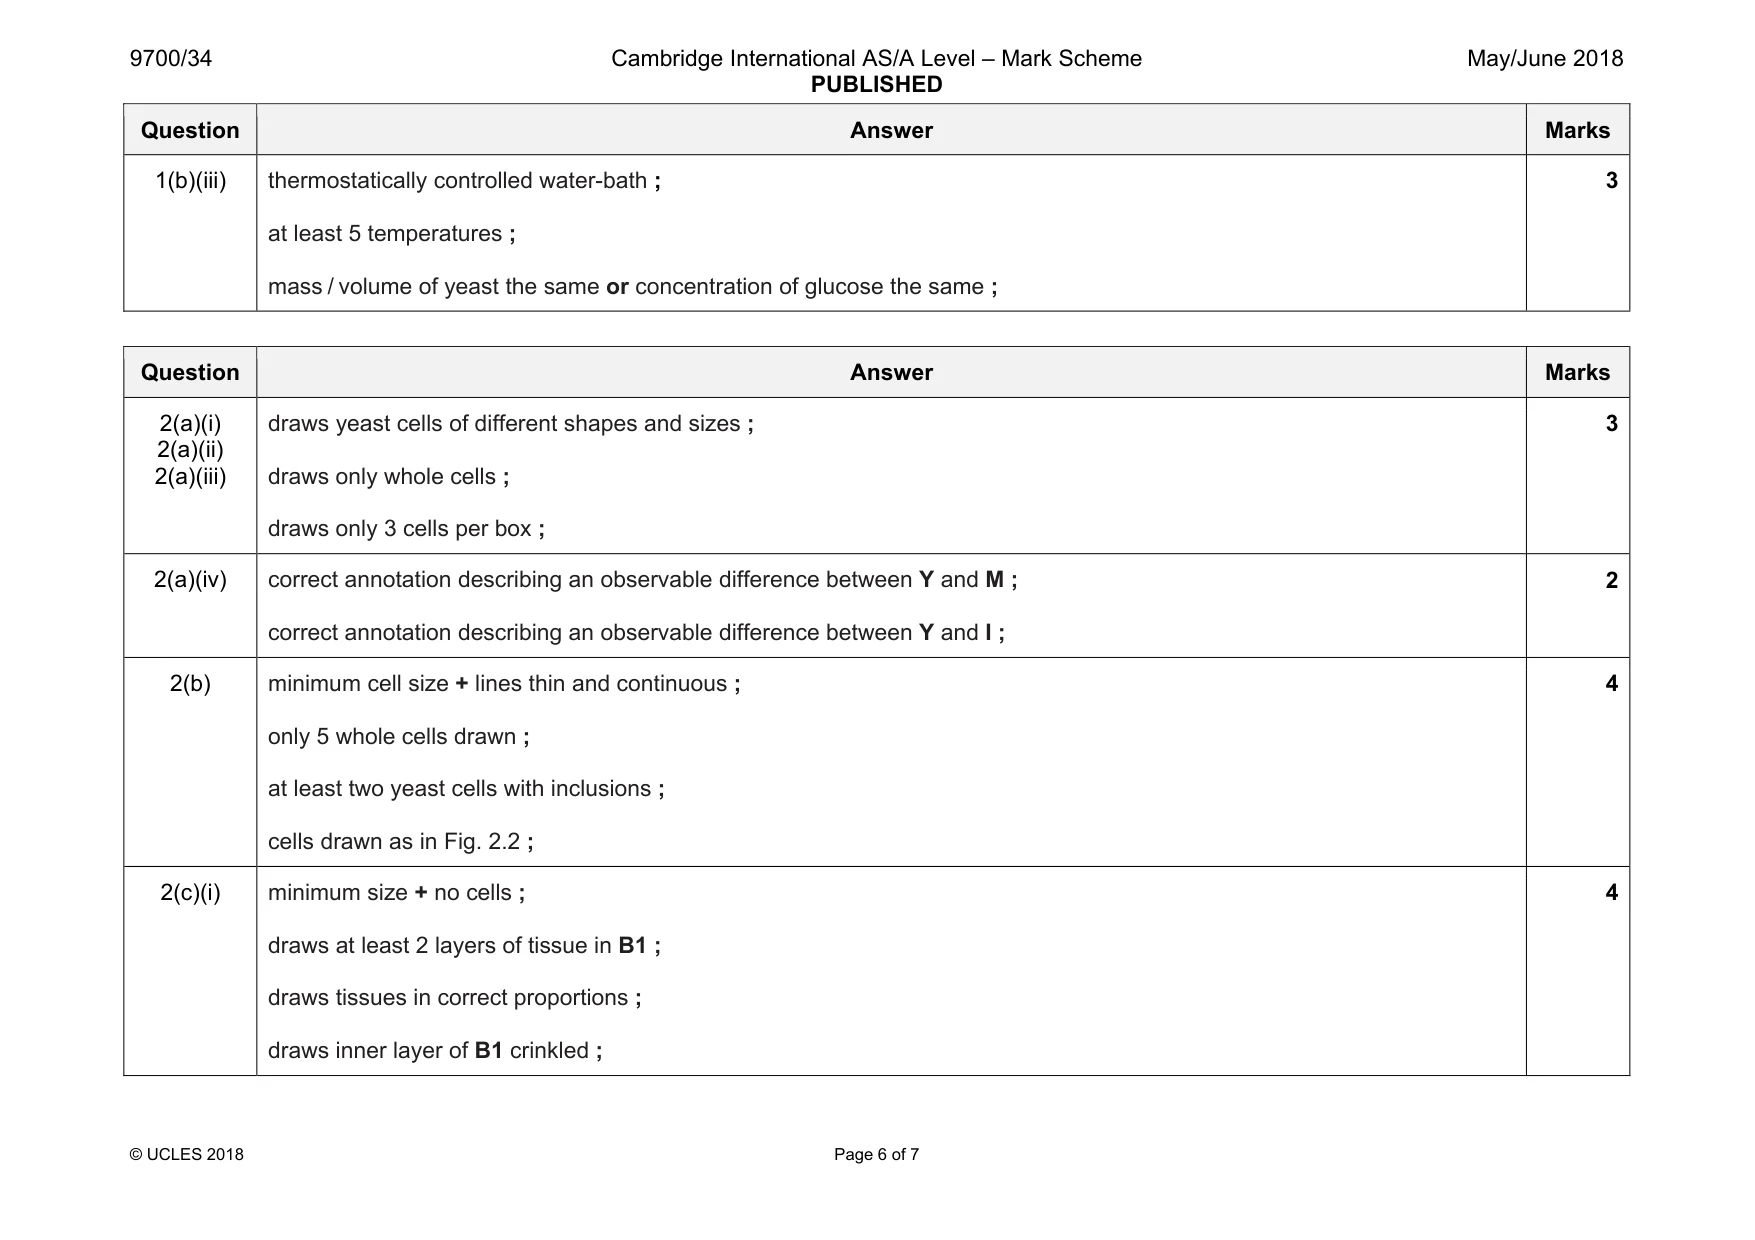
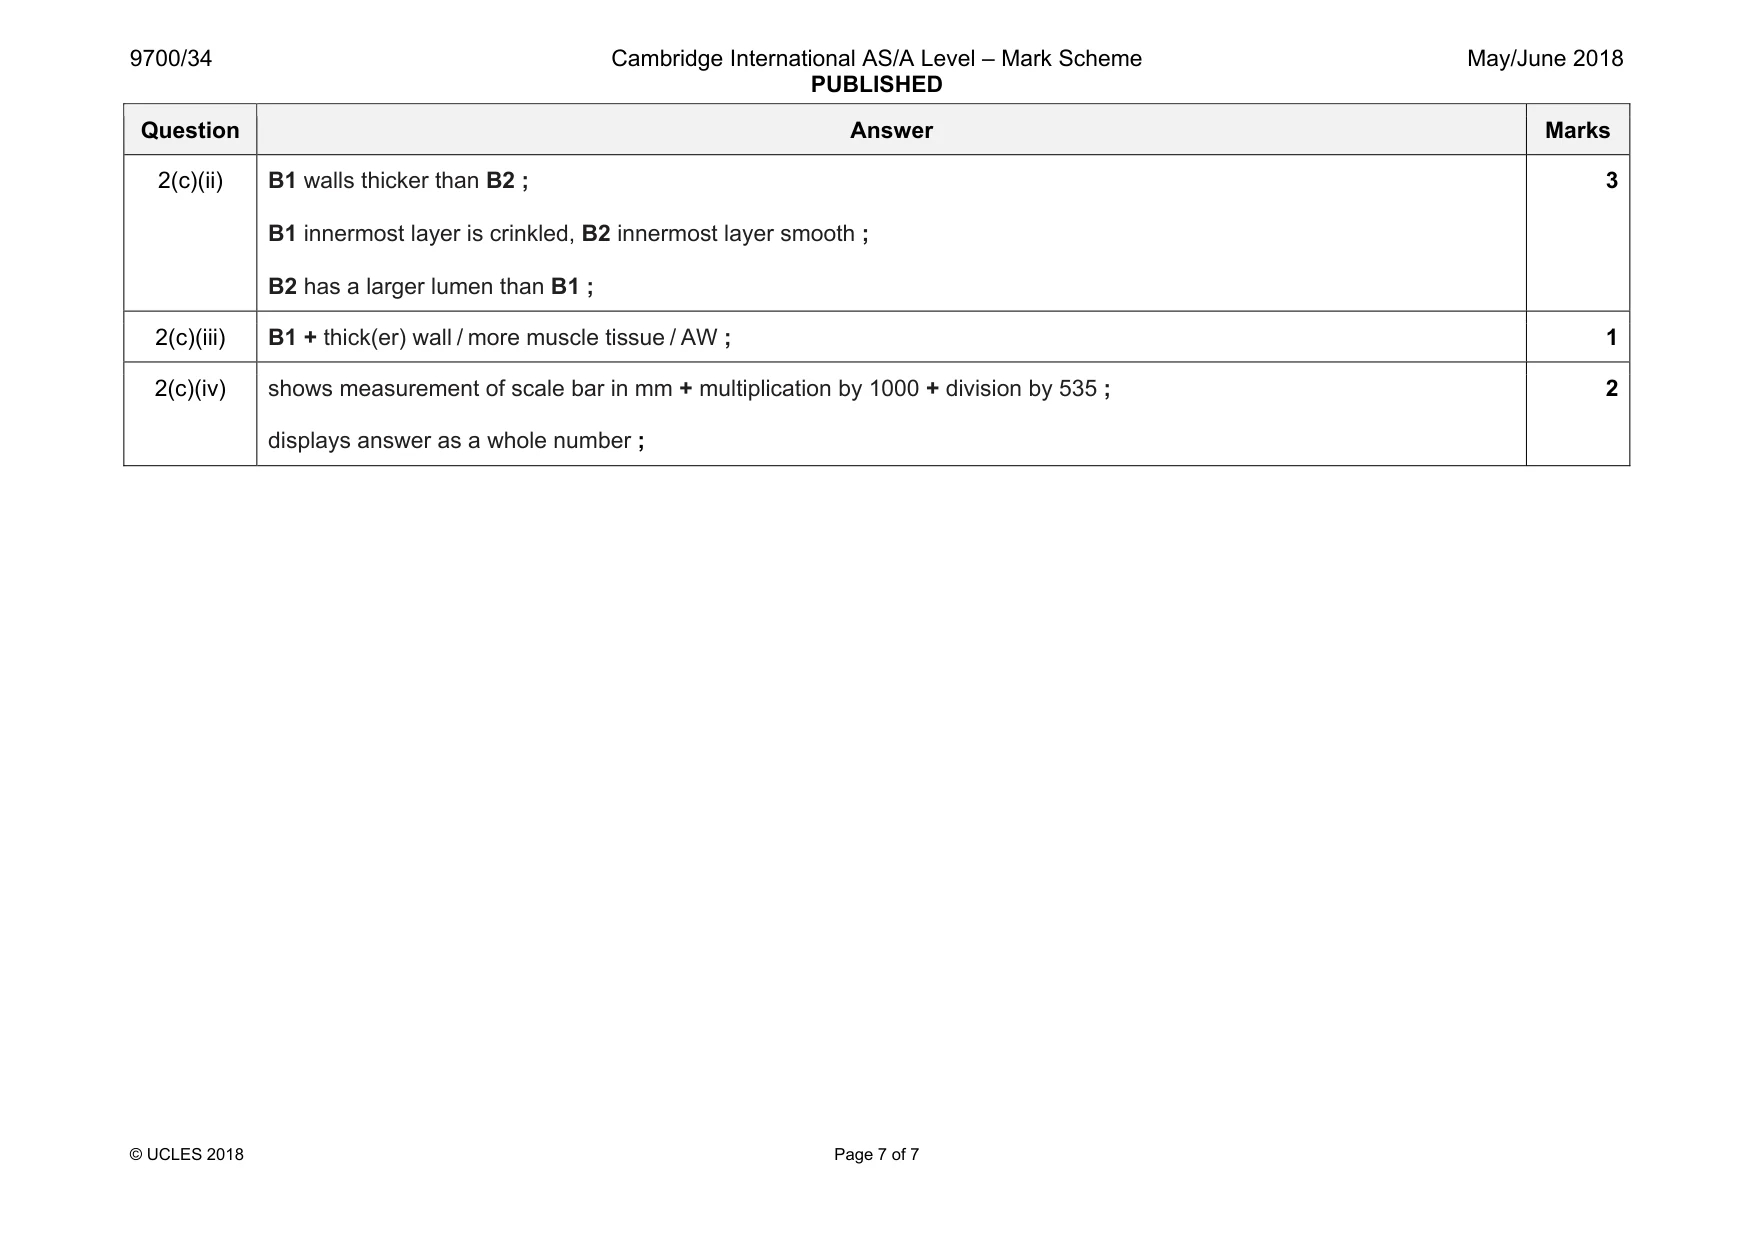
Mark scheme: 2(a)(i) 2(a)(ii) 2(a)(iii) draws yeast cells of different shapes and sizes ; draws only whole cells ; draws only 3 cells per box ; 3 2(a)(iv) correct annotation describing an observable difference between Y and M ; correct annotation describing an observable difference between Y and I ; 2 2(b) minimum cell size + lines thin and continuous ; only 5 whole cells drawn ; at least two yeast cells with inclusions ; cells drawn as in Fig. 2.2 ; 4 2(c)(i) minimum size + no cells ; draws at least 2 layers of tissue in B1 ; draws tissues in correct proportions ; draws inner layer of B1 crinkled ; 4 Question Answer Marks 2(c)(ii) B1 walls thicker than B2 ; B1 innermost layer is crinkled, B2 innermost layer smooth ; B2 has a larger lumen than B1 ; 3 2(c)(iii) B1 + thick(er) wall / more muscle tissue / AW ; 1 2(c)(iv) shows measurement of scale bar in mm + multiplication by 1000 + division by 535 ; displays answer as a whole number ; 2
What was in this paper
The subtopics covered by these 2 questions, and how many questions each got. Open one in a new tab to see every Cambridge question on it.
What you needed in this session
Cambridge’s own grade thresholds for 2018 May/June, Paper 3 · Variant 4. A higher threshold means an easier paper — the bar moves with how the cohort did.