Cambridge A Level Biology 9700 — 2018 May/June Paper 3 · Variant 5
9700/35/M/J/18 · 2 questions · 40 marks · ≈45 min
The question paper and its mark scheme, free to read here and free to download. This is Cambridge’s own paper, exactly as it was sat.
Question paper16 pages




Mark scheme7 pages
Answers below. Sit the paper first if you are practising.
Questions as text
Q1 · The enzyme E catalyses the hydrolysis (breakdown) of sucrose to fructose and glucose
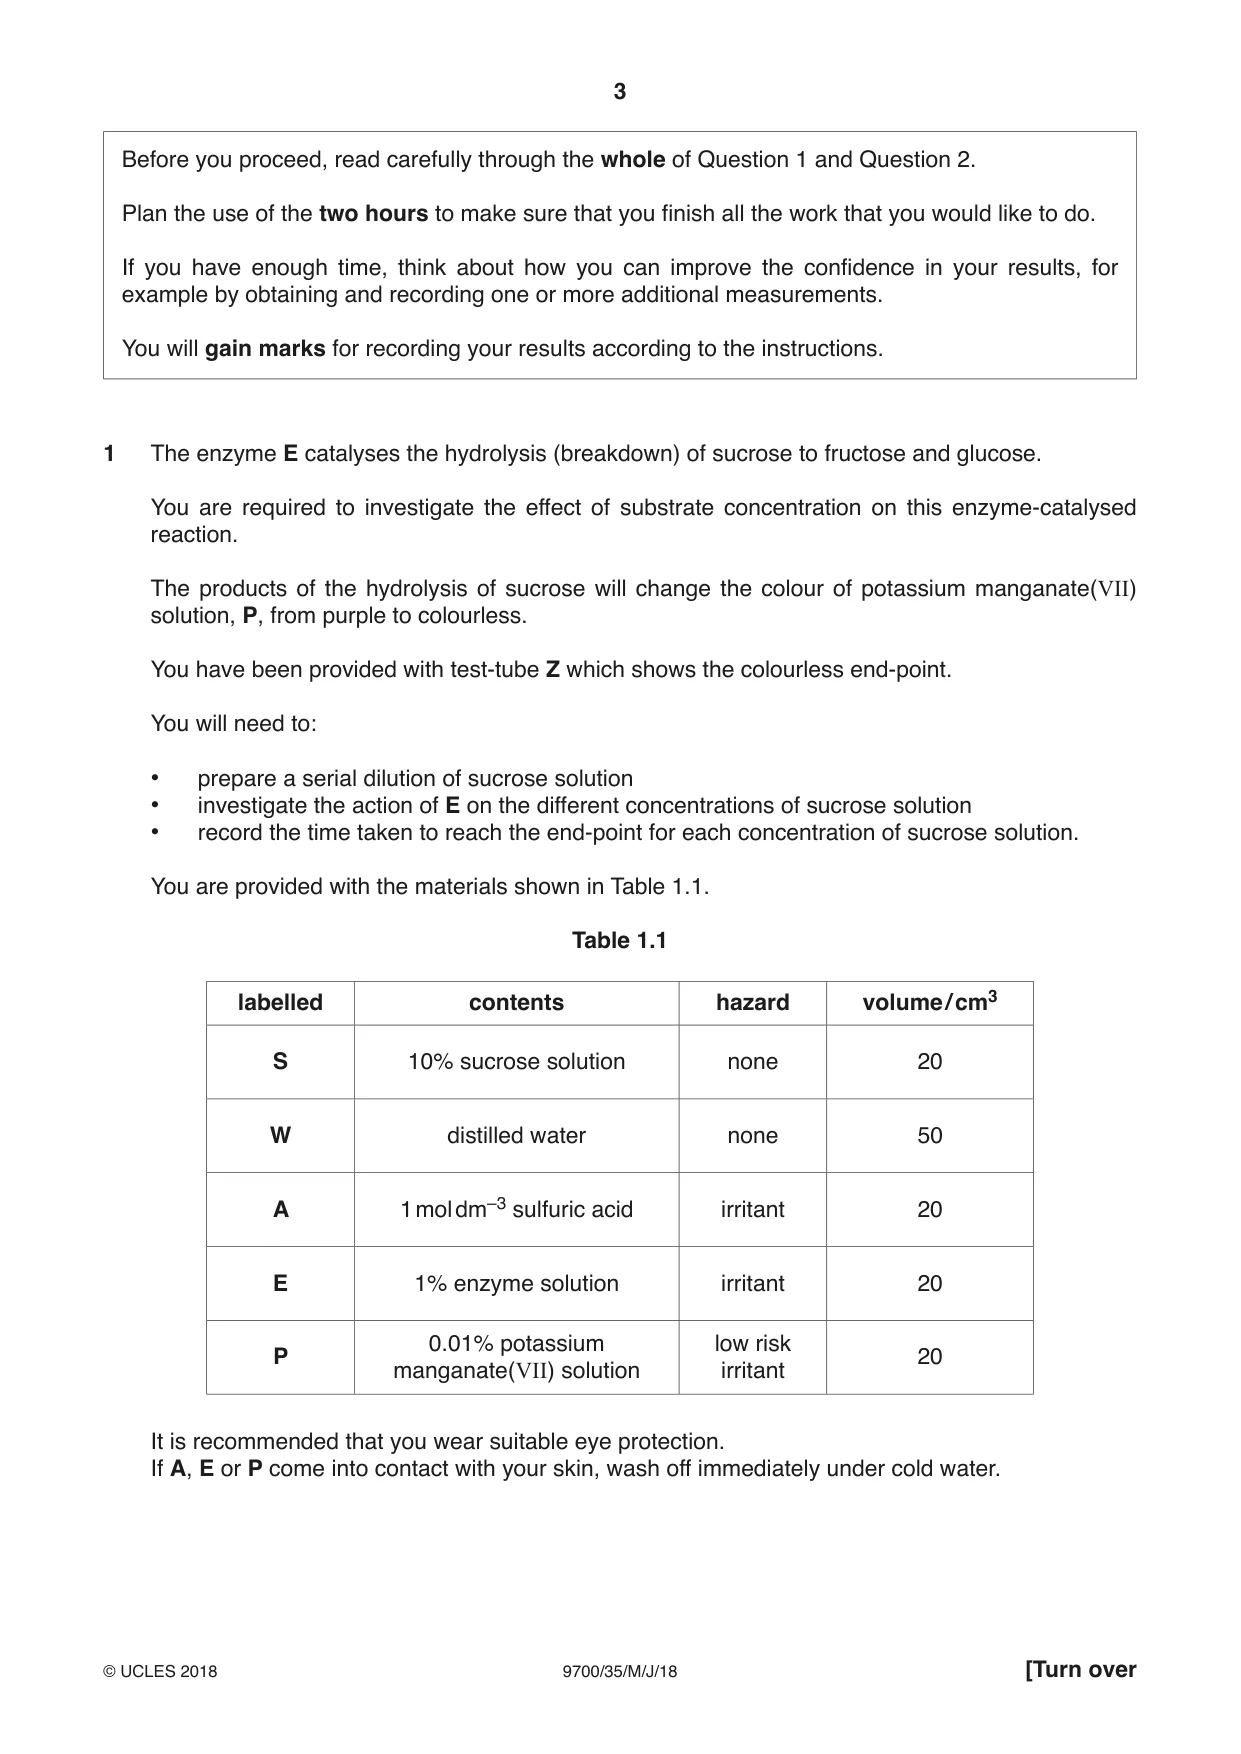
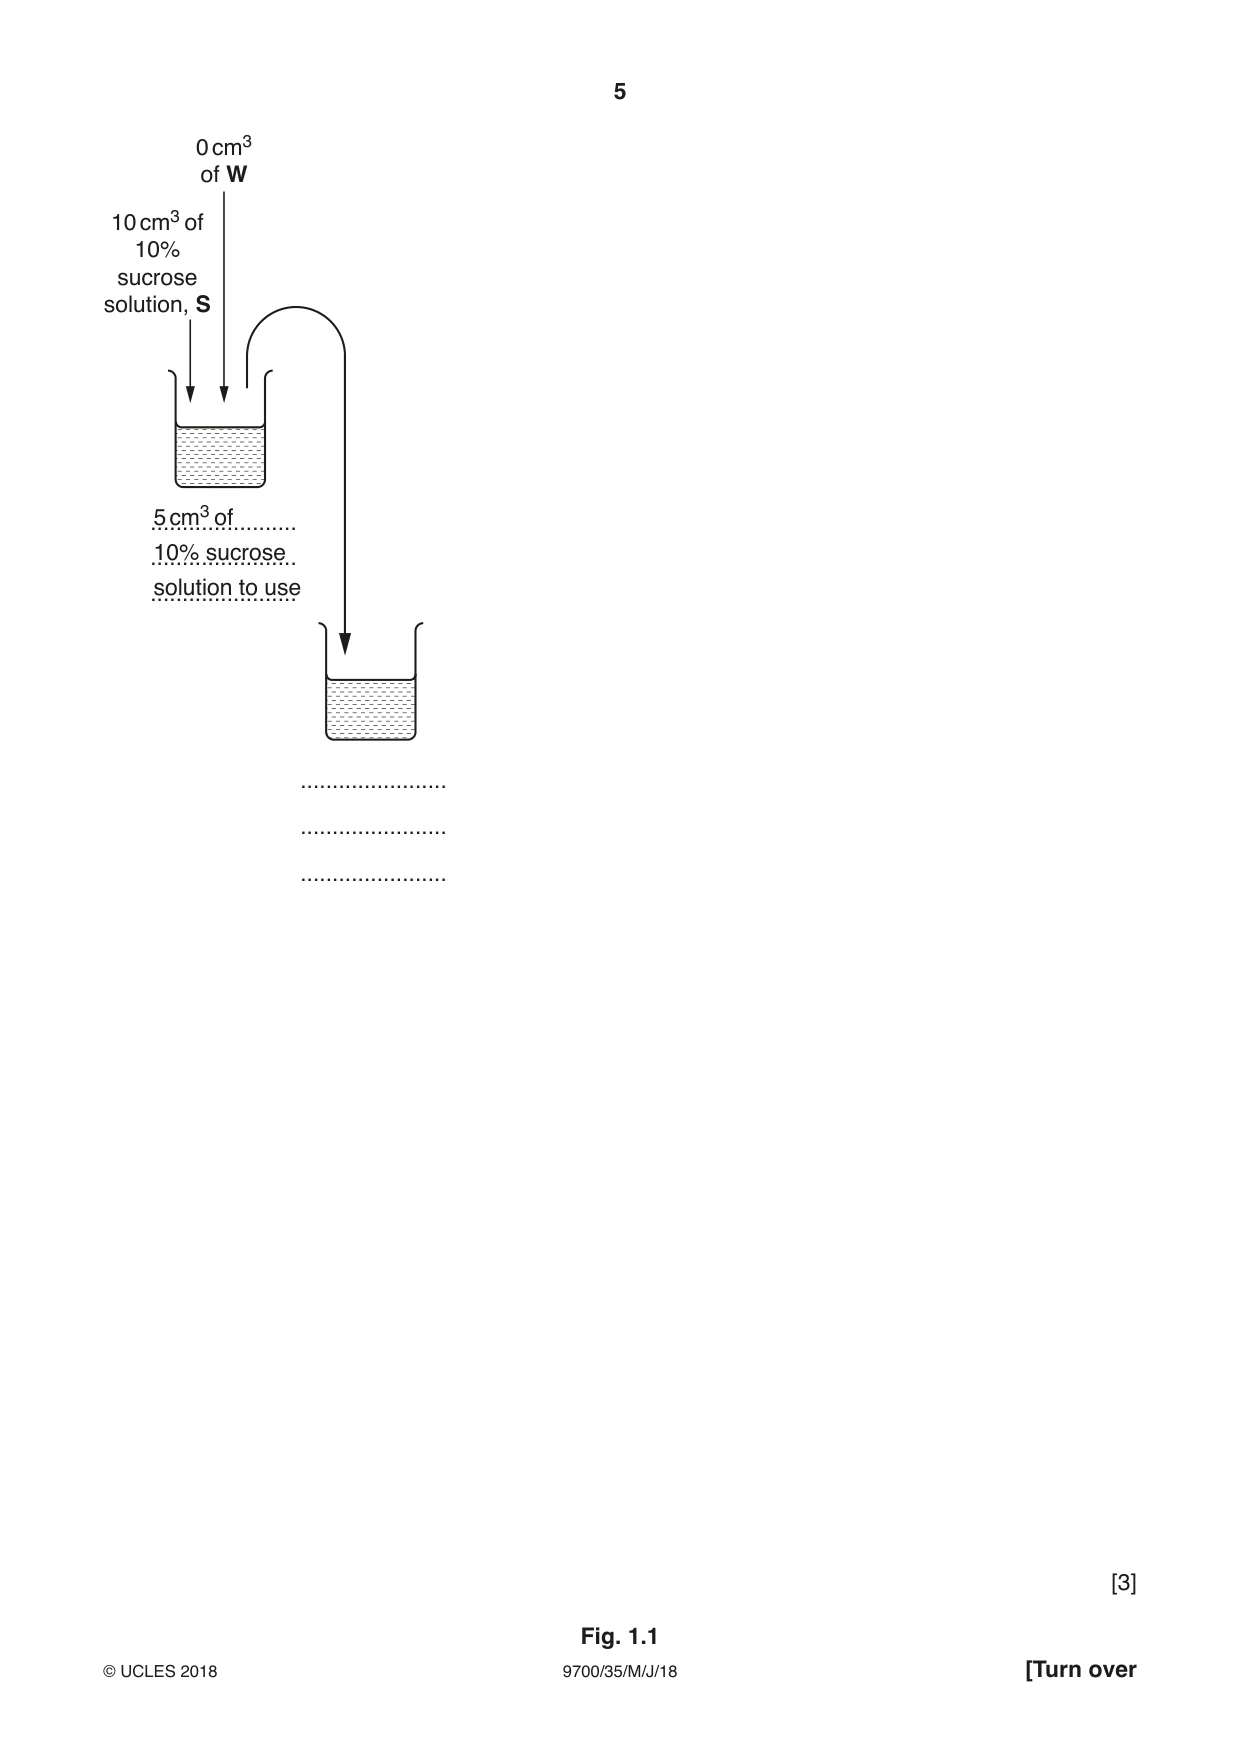
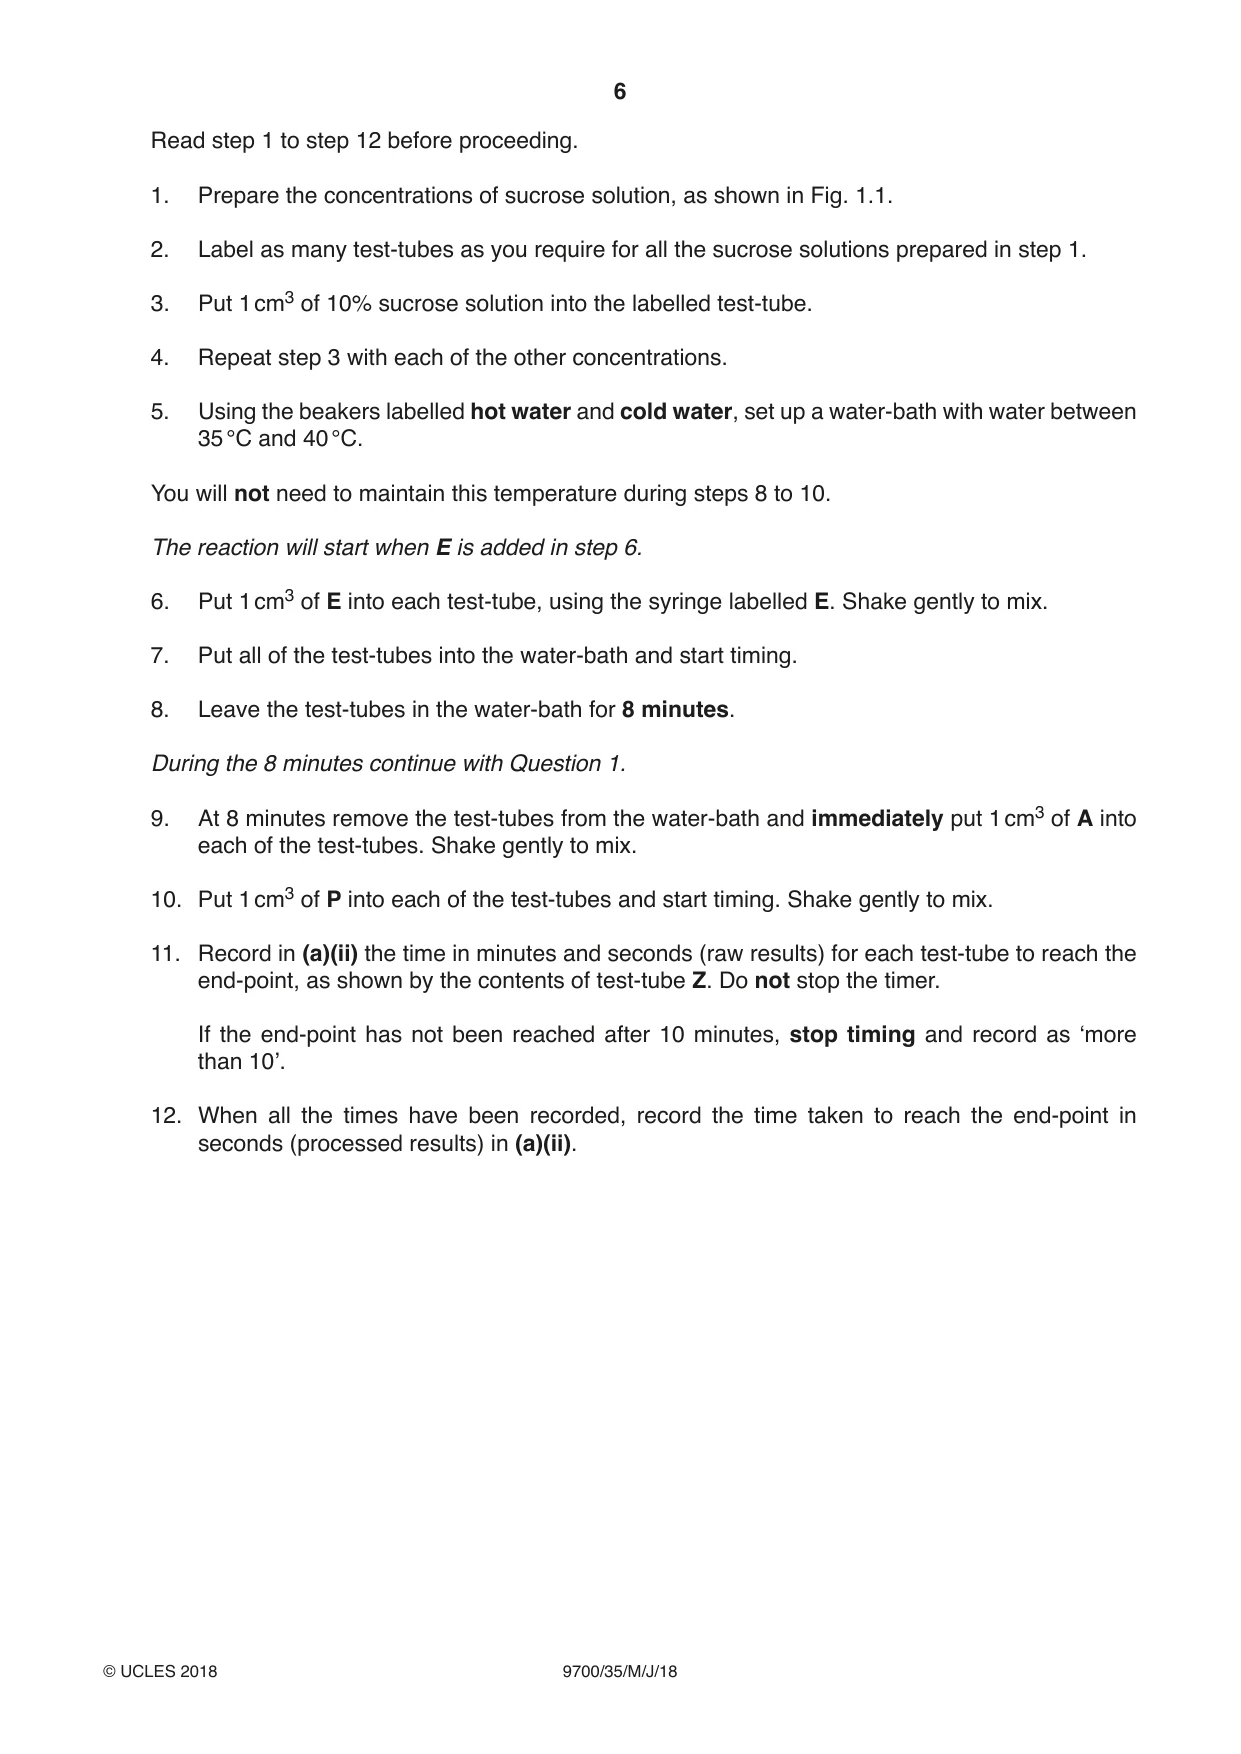
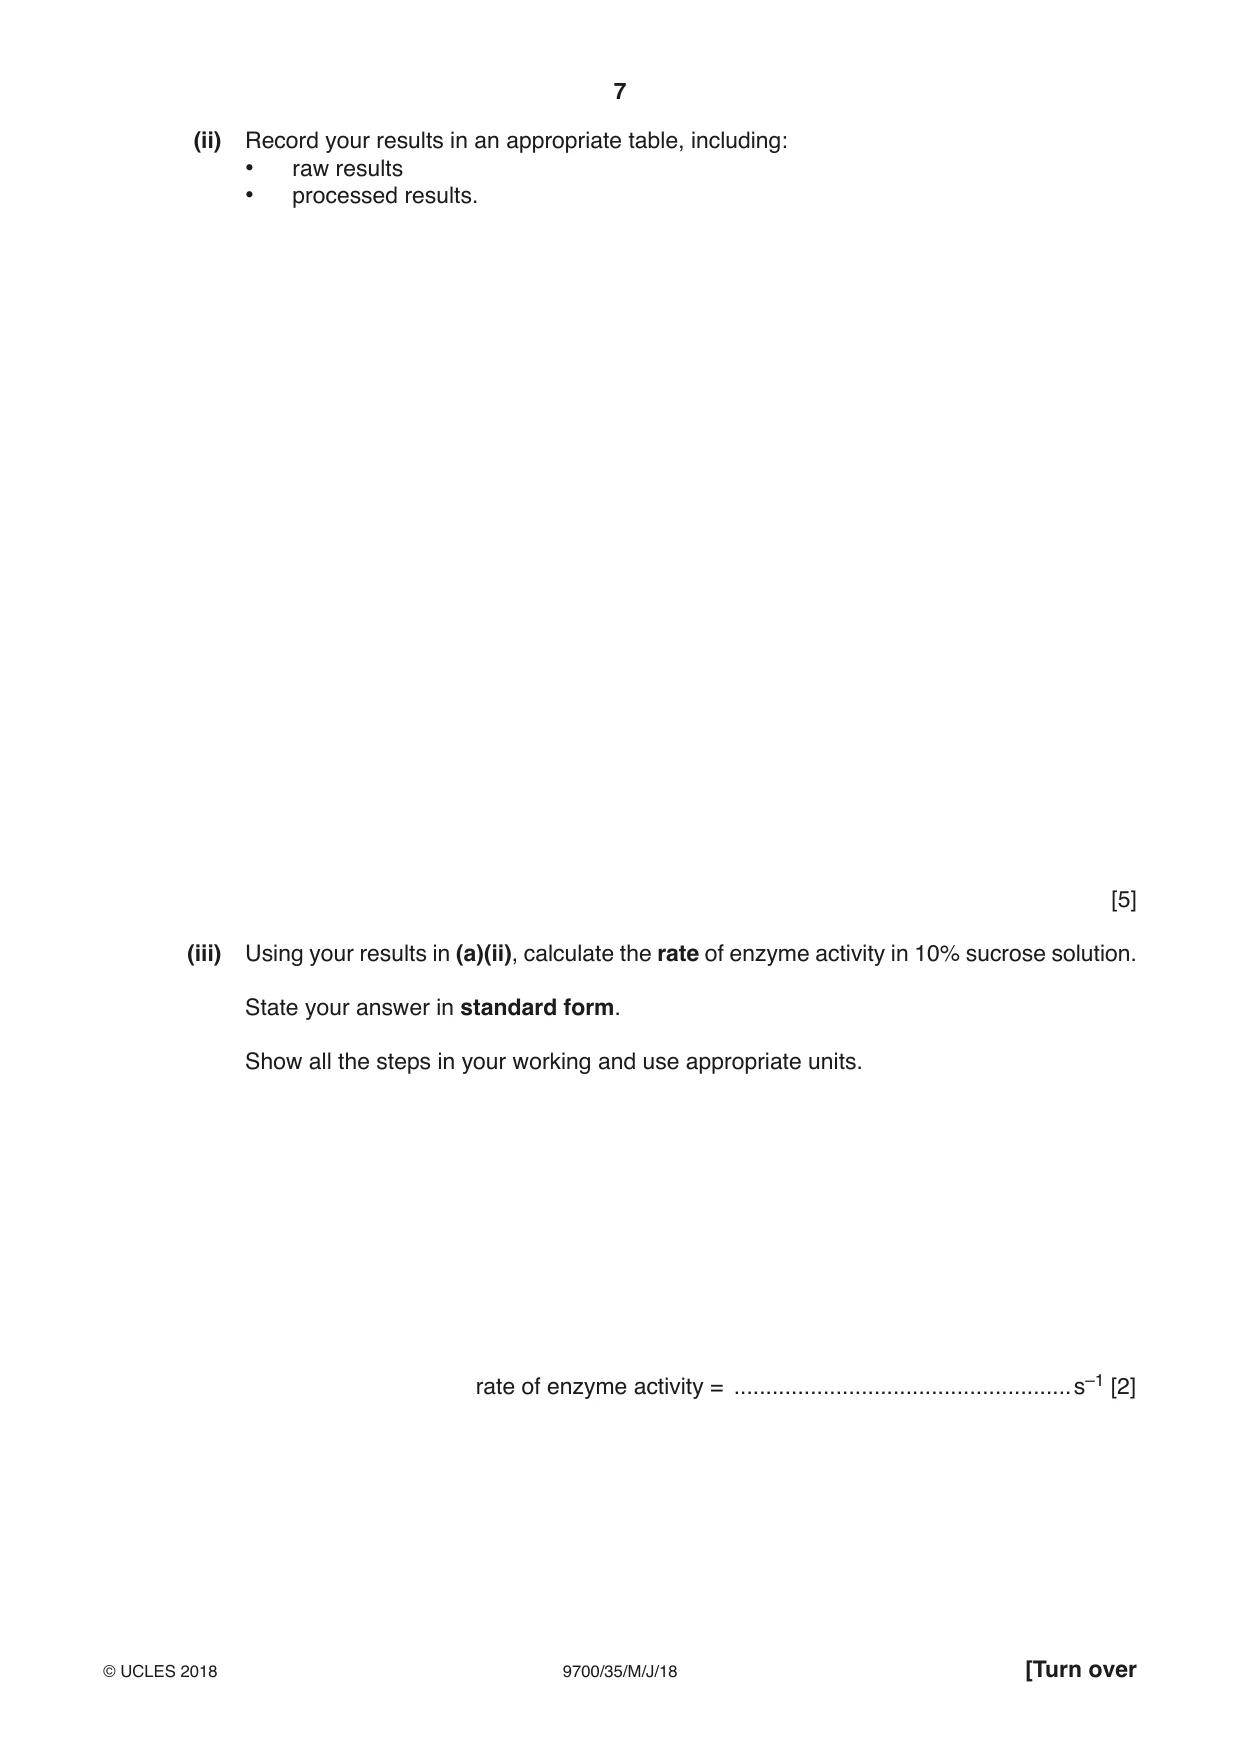
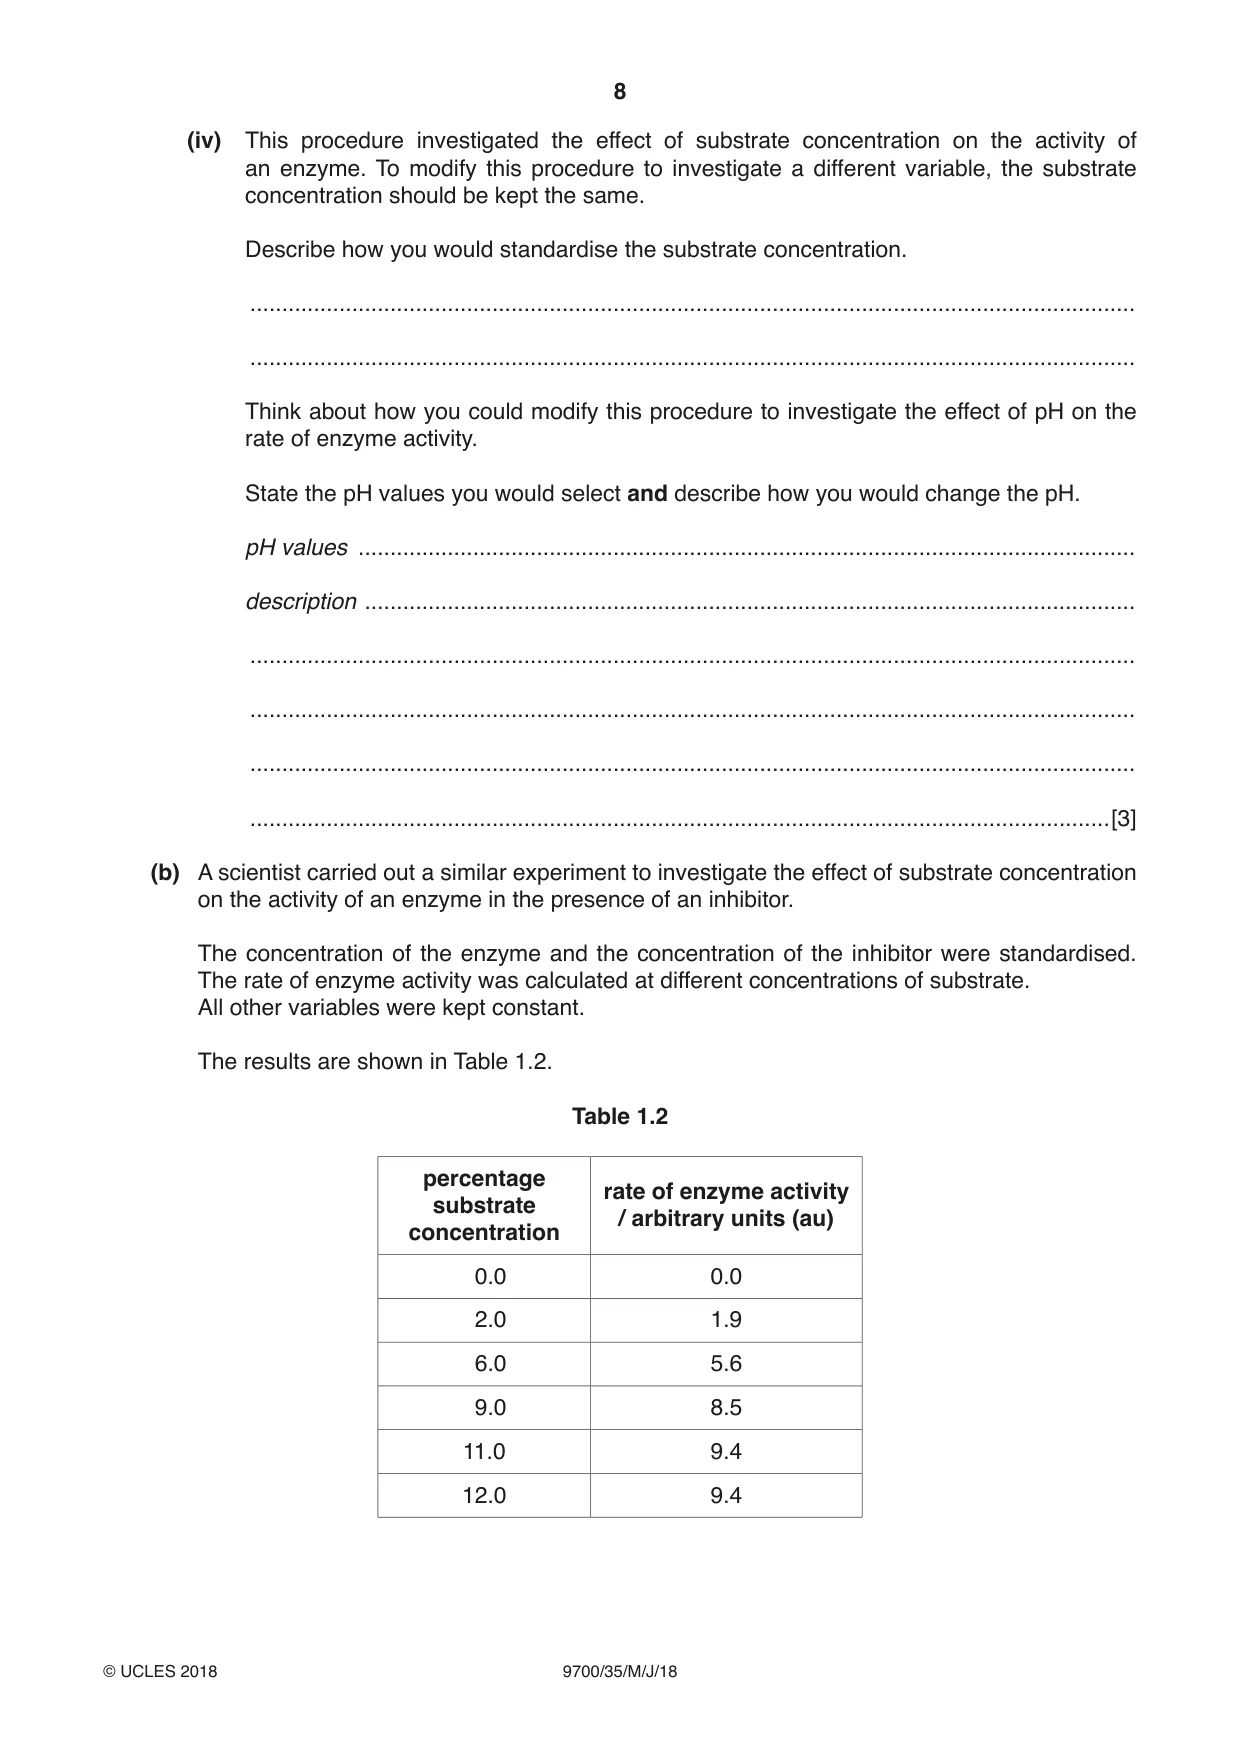
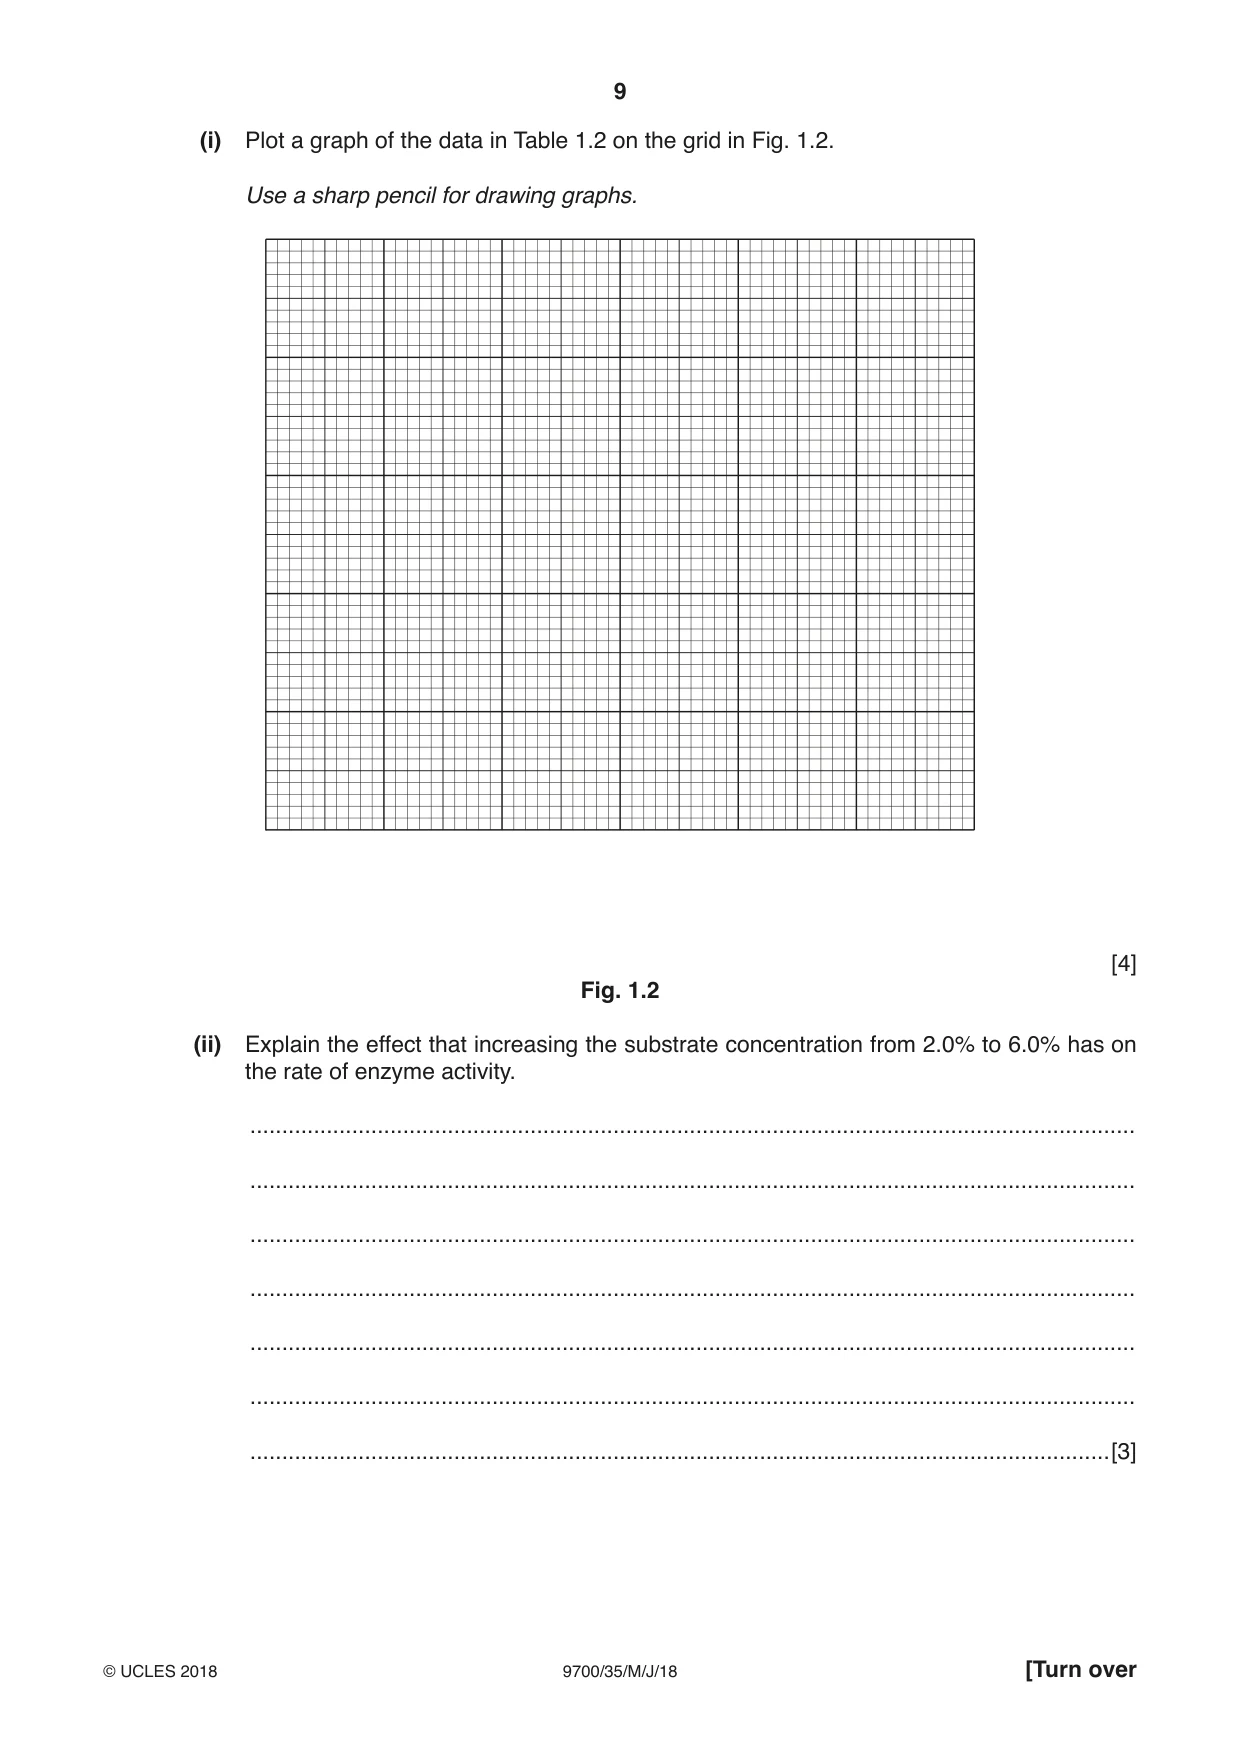
1 The enzyme E catalyses the hydrolysis (breakdown) of sucrose to fructose and glucose. You are required to investigate the effect of substrate concentration on this enzyme-catalysed reaction. The products of the hydrolysis of sucrose will change the colour of potassium manganate(VII) solution, P, from purple to colourless. You have been provided with test-tube Z which shows the colourless end-point. You will need to: • prepare a serial dilution of sucrose solution • investigate the action of E on the different concentrations of sucrose solution • record the time taken to reach the end-point for each concentration of sucrose solution. You are provided with the materials shown in Table 1.1. Table 1.1 labelled contents hazard volume / cm3 S 10% sucrose solution none 20 W distilled water none 50 A 1 mol dm–3 sulfuric acid irritant 20 E 1% enzyme solution irritant 20 0.01% potassium low risk P 20 manganate(VII) solution irritant It is recommended that you wear suitable eye protection. If A, E or P come into contact with your skin, wash off immediately under cold water. (a) You will need to make a serial dilution of the 10% sucrose solution, S, which reduces the concentration by half between each successive dilution. You will need to prepare 5 cm3 of each concentration of sucrose solution. Fig. 1.1 shows the first two beakers you will use to make your serial dilution. (i) Complete Fig. 1.1 by drawing as many extra beakers as you need for your serial dilution. For each beaker: • state, under the beaker, the volume and concentration of the sucrose solution available for use in the investigation • use one arrow, with a label above the beaker, to show the volume and concentration of the sucrose solution added to prepare the concentration of sucrose solution in the beaker • use another arrow, with a label above the beaker, to show the volume of W added to prepare the concentration of sucrose solution in the beaker. The first beaker in Fig. 1.1 has been labelled for you. 0 cm3 of W 10 cm3 of 10% sucrose solution, S .......................5 cm3 of .......................10% sucrose .......................solution to use ....................... ....................... ....................... [3] Read step 1 to step 12 before proceeding. 1. Prepare the concentrations of sucrose solution, as shown in Fig. 1.1. 2. Label as many test-tubes as you require for all the sucrose solutions prepared in step 1. 3. Put 1 cm3 of 10% sucrose solution into the labelled test-tube. 4. Repeat step 3 with each of the other concentrations. 5. Using the beakers labelled hot water and cold water, set up a water-bath with water between 35 °C and 40 °C. You will not need to maintain this temperature during steps 8 to 10. The reaction will start when E is added in step 6. 6. Put 1 cm3 of E into each test-tube, using the syringe labelled E. Shake gently to mix. 7. Put all of the test-tubes into the water-bath and start timing. 8. Leave the test-tubes in the water-bath for 8 minutes. During the 8 minutes continue with Question 1. 9. At 8 minutes remove the test-tubes from the water-bath and immediately put 1 cm3 of A into each of the test-tubes. Shake gently to mix. 10. Put 1 cm3 of P into each of the test-tubes and start timing. Shake gently to mix. 11. Record in (a)(ii) the time in minutes and seconds (raw results) for each test-tube to reach the end-point, as shown by the contents of test-tube Z. Do not stop the timer. If the end-point has not been reached after 10 minutes, stop timing and record as ‘more than 10’. 12. When all the times have been recorded, record the time taken to reach the end-point in seconds (processed results) in (a)(ii). (ii) Record your results in an appropriate table, including: • raw results • processed results. [5] (iii) Using your results in (a)(ii), calculate the rate of enzyme activity in 10% sucrose solution. State your answer in standard form. Show all the steps in your working and use appropriate units. rate of enzyme activity = .....................................................s–1 [2] (iv) This procedure investigated the effect of substrate concentration on the activity of an enzyme. To modify this procedure to investigate a different variable, the substrate concentration should be kept the same. Describe how you would standardise the substrate concentration. ........................................................................................................................................... ........................................................................................................................................... Think about how you could modify this procedure to investigate the effect of pH on the rate of enzyme activity. State the pH values you would select and describe how you would change the pH. pH values .......................................................................................................................... description ......................................................................................................................... ........................................................................................................................................... ........................................................................................................................................... ........................................................................................................................................... .......................................................................................................................................[3] (b) A scientist carried out a similar experiment to investigate the effect of substrate concentration on the activity of an enzyme in the presence of an inhibitor. The concentration of the enzyme and the concentration of the inhibitor were standardised. The rate of enzyme activity was calculated at different concentrations of substrate. All other variables were kept constant. The results are shown in Table 1.2. Table 1.2 percentage rate of enzyme activity substrate / arbitrary units (au) concentration 0.0 0.0 2.0 1.9 6.0 5.6 9.0 8.5 11.0 9.4 12.0 9.4 (i) Plot a graph of the data in Table 1.2 on the grid in Fig. 1.2. Use a sharp pencil for drawing graphs. [4] Fig. 1.2 (ii) Explain the effect that increasing the substrate concentration from 2.0% to 6.0% has on the rate of enzyme activity. ........................................................................................................................................... ........................................................................................................................................... ........................................................................................................................................... ........................................................................................................................................... ........................................................................................................................................... ........................................................................................................................................... .......................................................................................................................................[3] (iii) The scientist repeated the experiment but without an inhibitor. Vmax was reached at 4.5% substrate concentration and Vmax was the same in both experiments. State the type of inhibitor present. .......................................................................................................................................[1] [Total: 21] Check that you have completed Question 1 from step 9 on page 6.
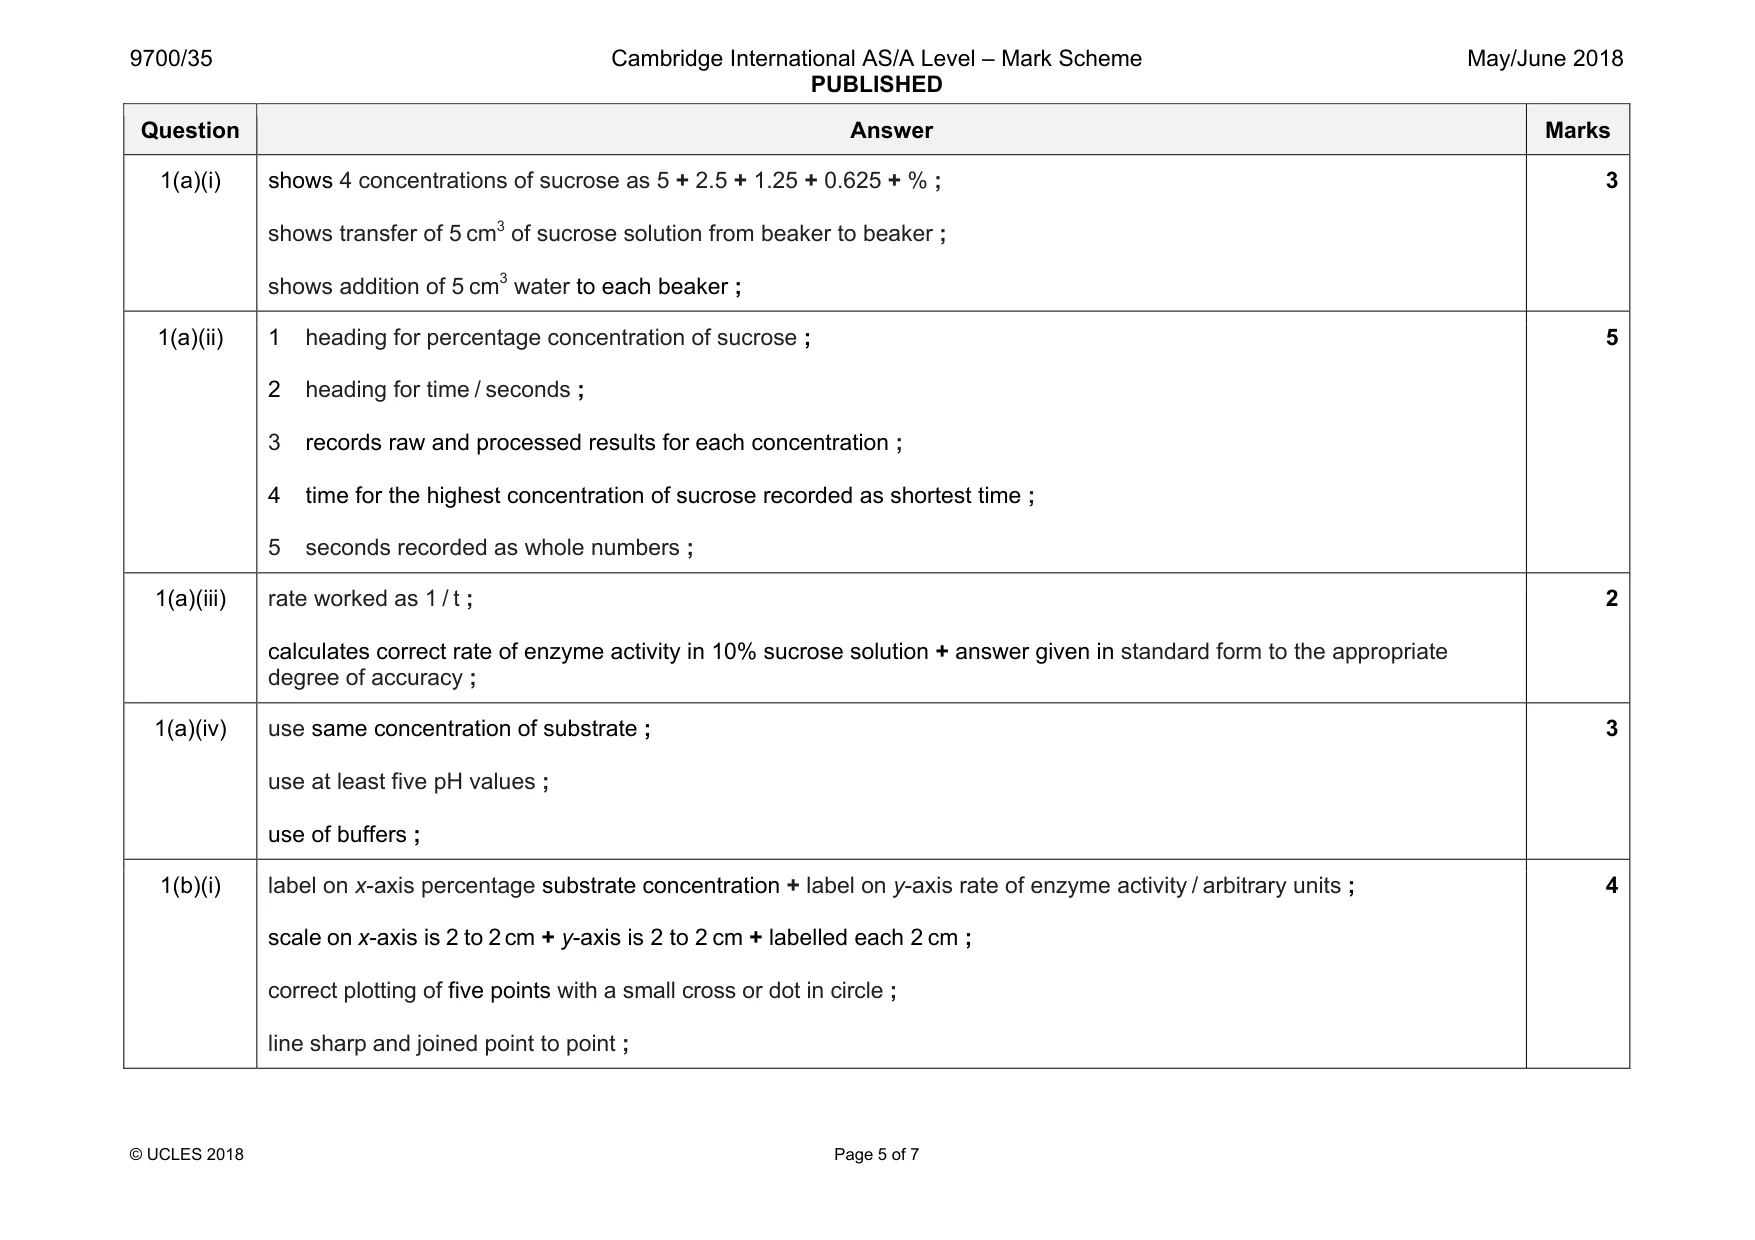
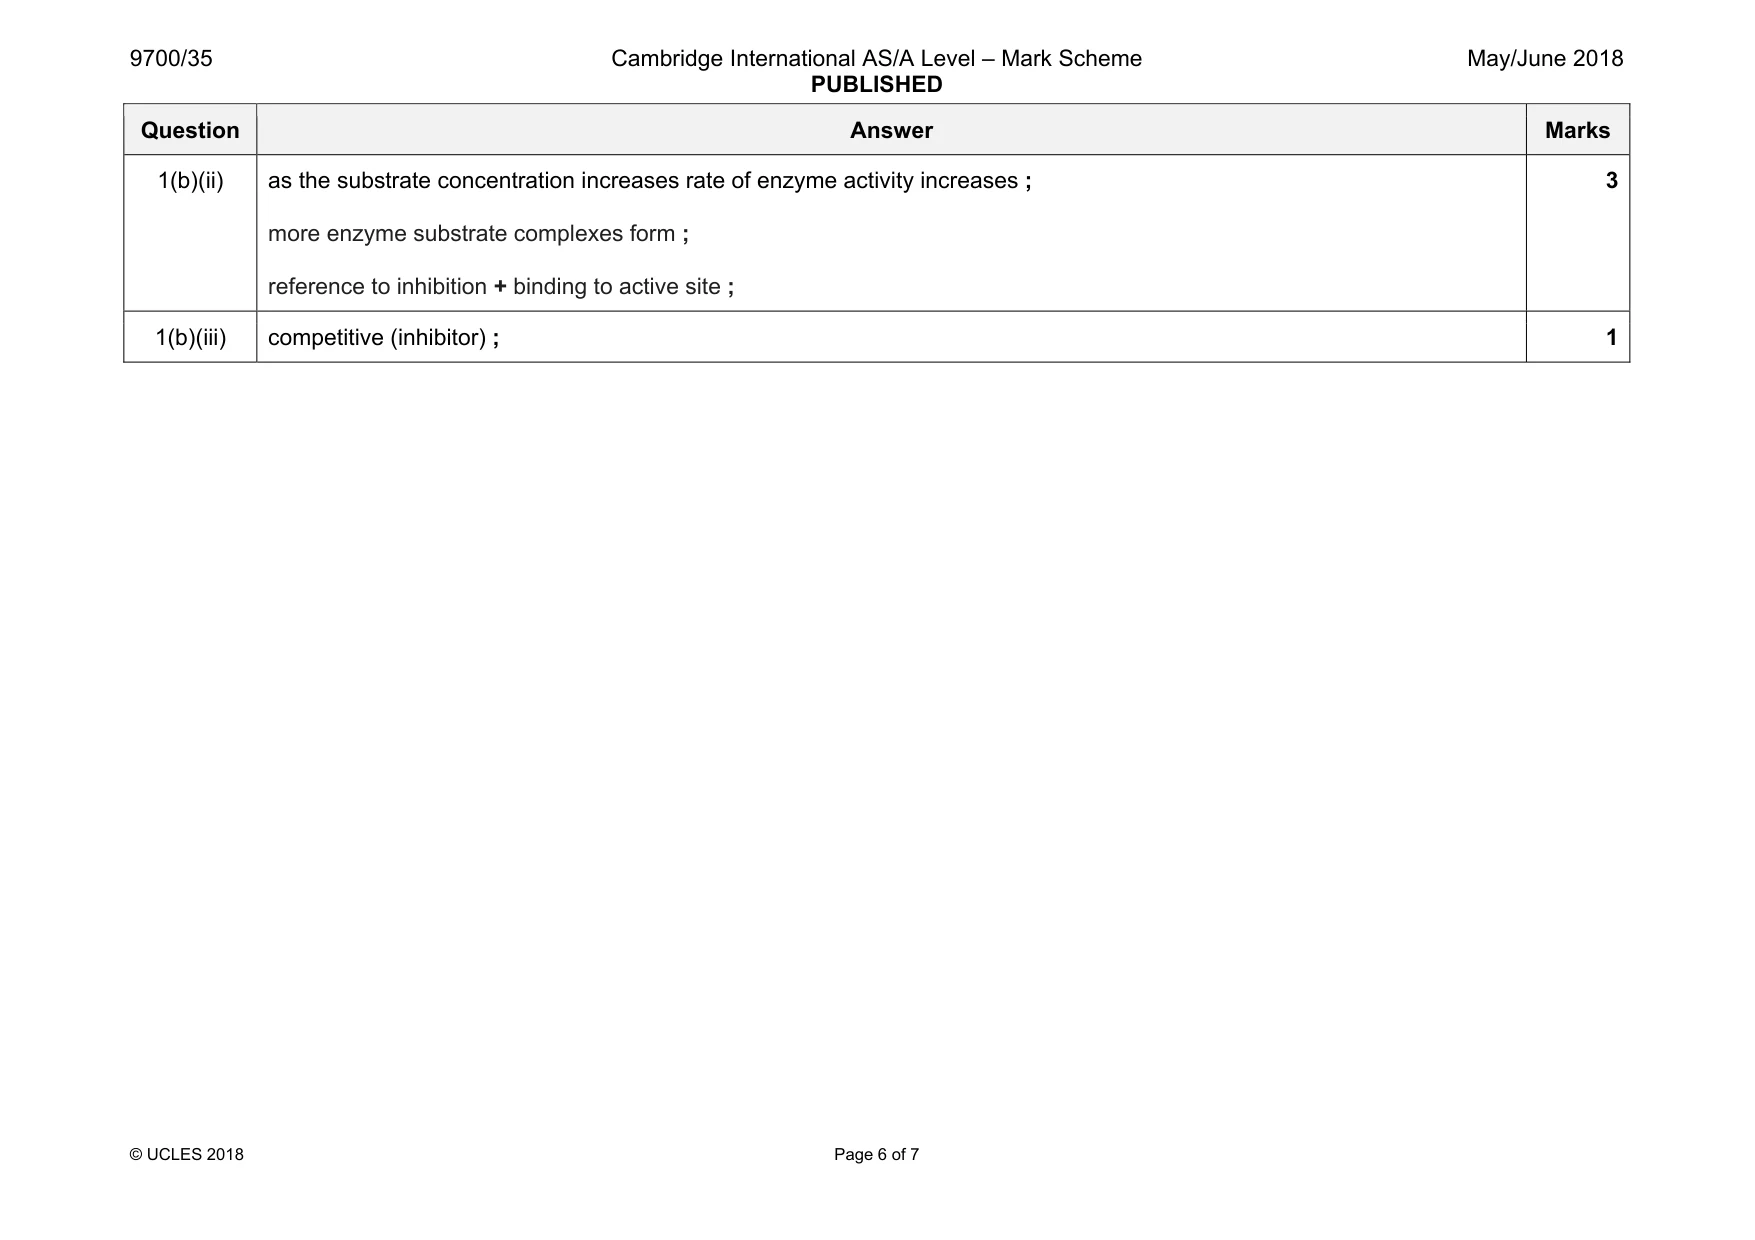
Mark scheme: 1(a)(i) shows 4 concentrations of sucrose as 5 + 2.5 + 1.25 + 0.625 + % ; shows transfer of 5 cm3 of sucrose solution from beaker to beaker ; shows addition of 5 cm3 water to each beaker ; 3 1(a)(ii) 1 heading for percentage concentration of sucrose ; 2 heading for time / seconds ; 3 records raw and processed results for each concentration ; 4 time for the highest concentration of sucrose recorded as shortest time ; 5 seconds recorded as whole numbers ; 5 1(a)(iii) rate worked as 1 / t ; calculates correct rate of enzyme activity in 10% sucrose solution + answer given in standard form to the appropriate degree of accuracy ; 2 1(a)(iv) use same concentration of substrate ; use at least five pH values ; use of buffers ; 3 1(b)(i) label on x-axis percentage substrate concentration + label on y-axis rate of enzyme activity / arbitrary units ; scale on x-axis is 2 to 2 cm + y-axis is 2 to 2 cm + labelled each 2 cm ; correct plotting of five points with a small cross or dot in circle ; line sharp and joined point to point ; 4 Question Answer Marks 1(b)(ii) as the substrate concentration increases rate of enzyme activity increases ; more enzyme substrate complexes form ; reference to inhibition + binding to active site ; 3 1(b)(iii) competitive (inhibitor) ; 1
Q2 · L1 is a slide of a stained transverse section through a plant stem
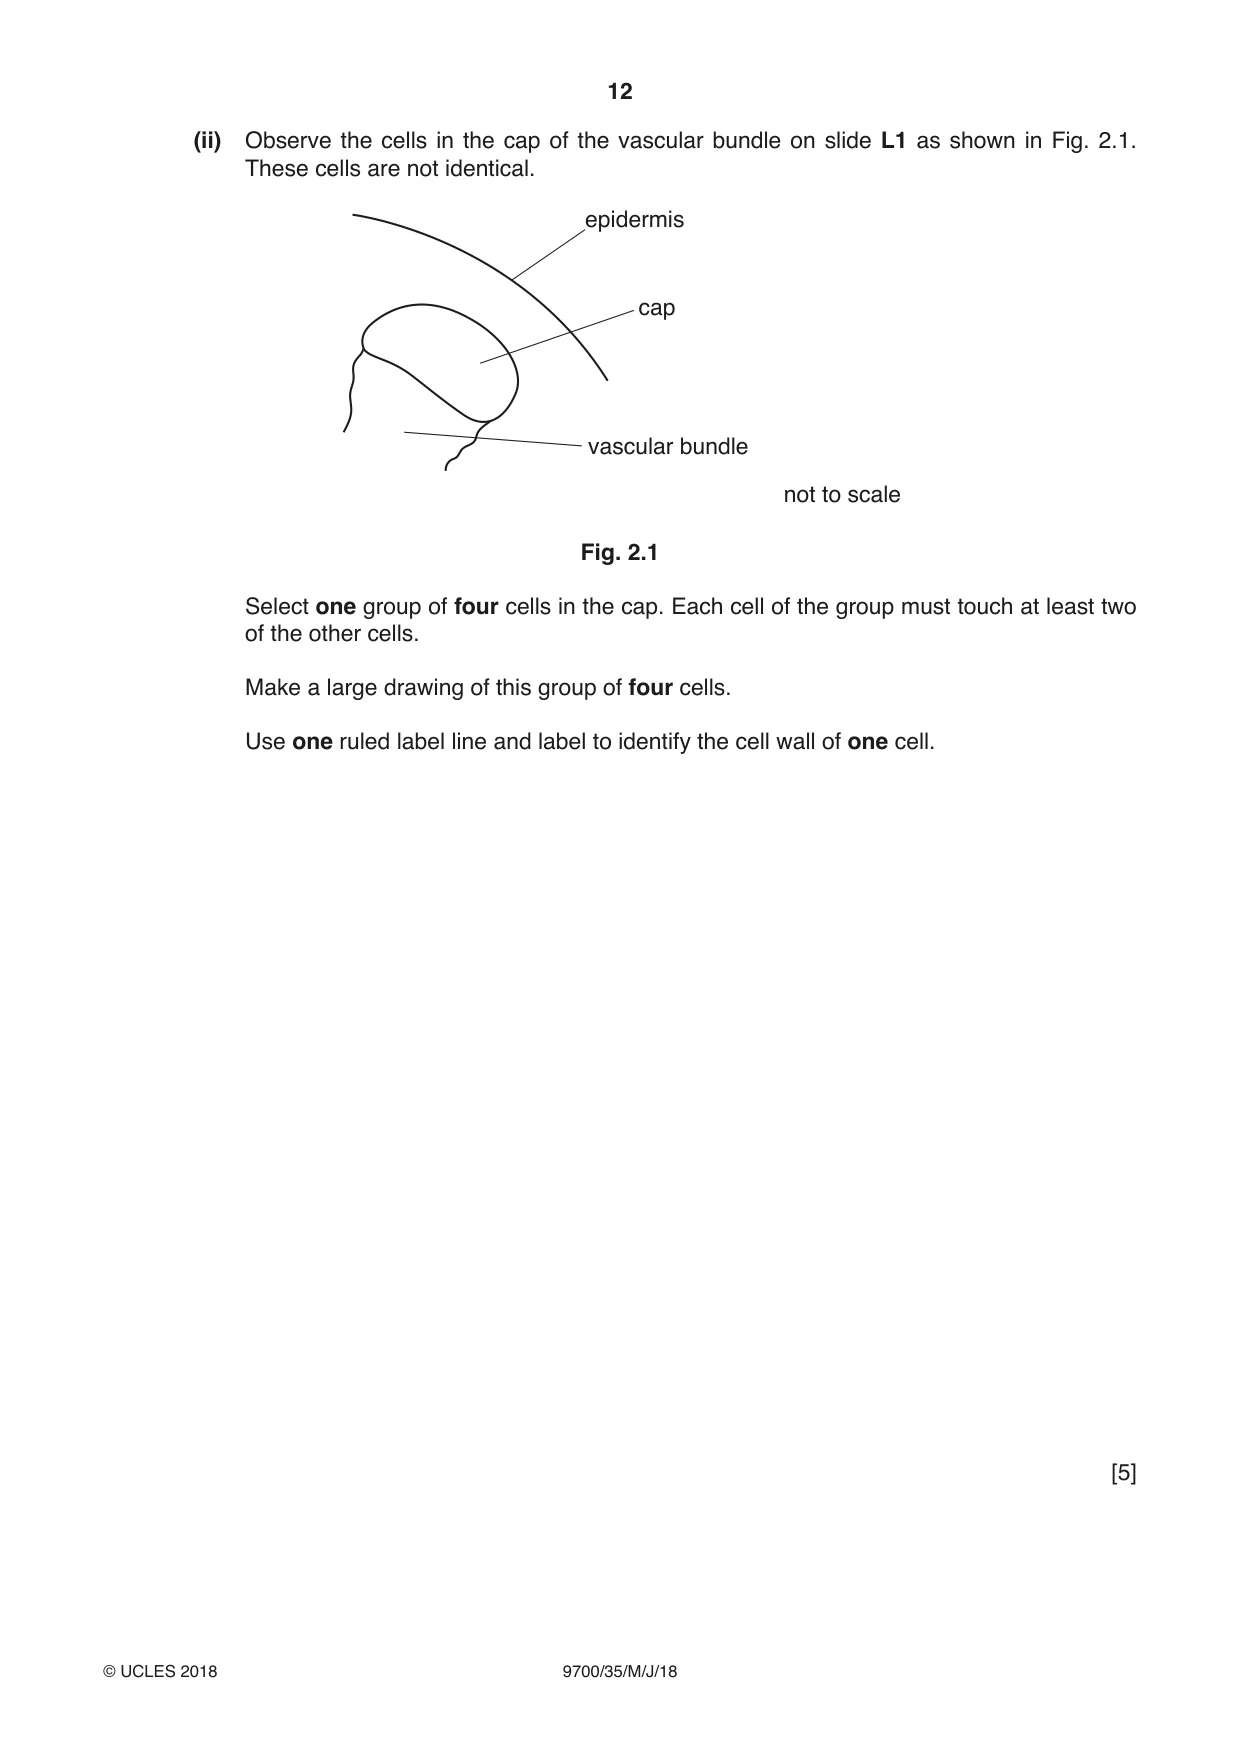
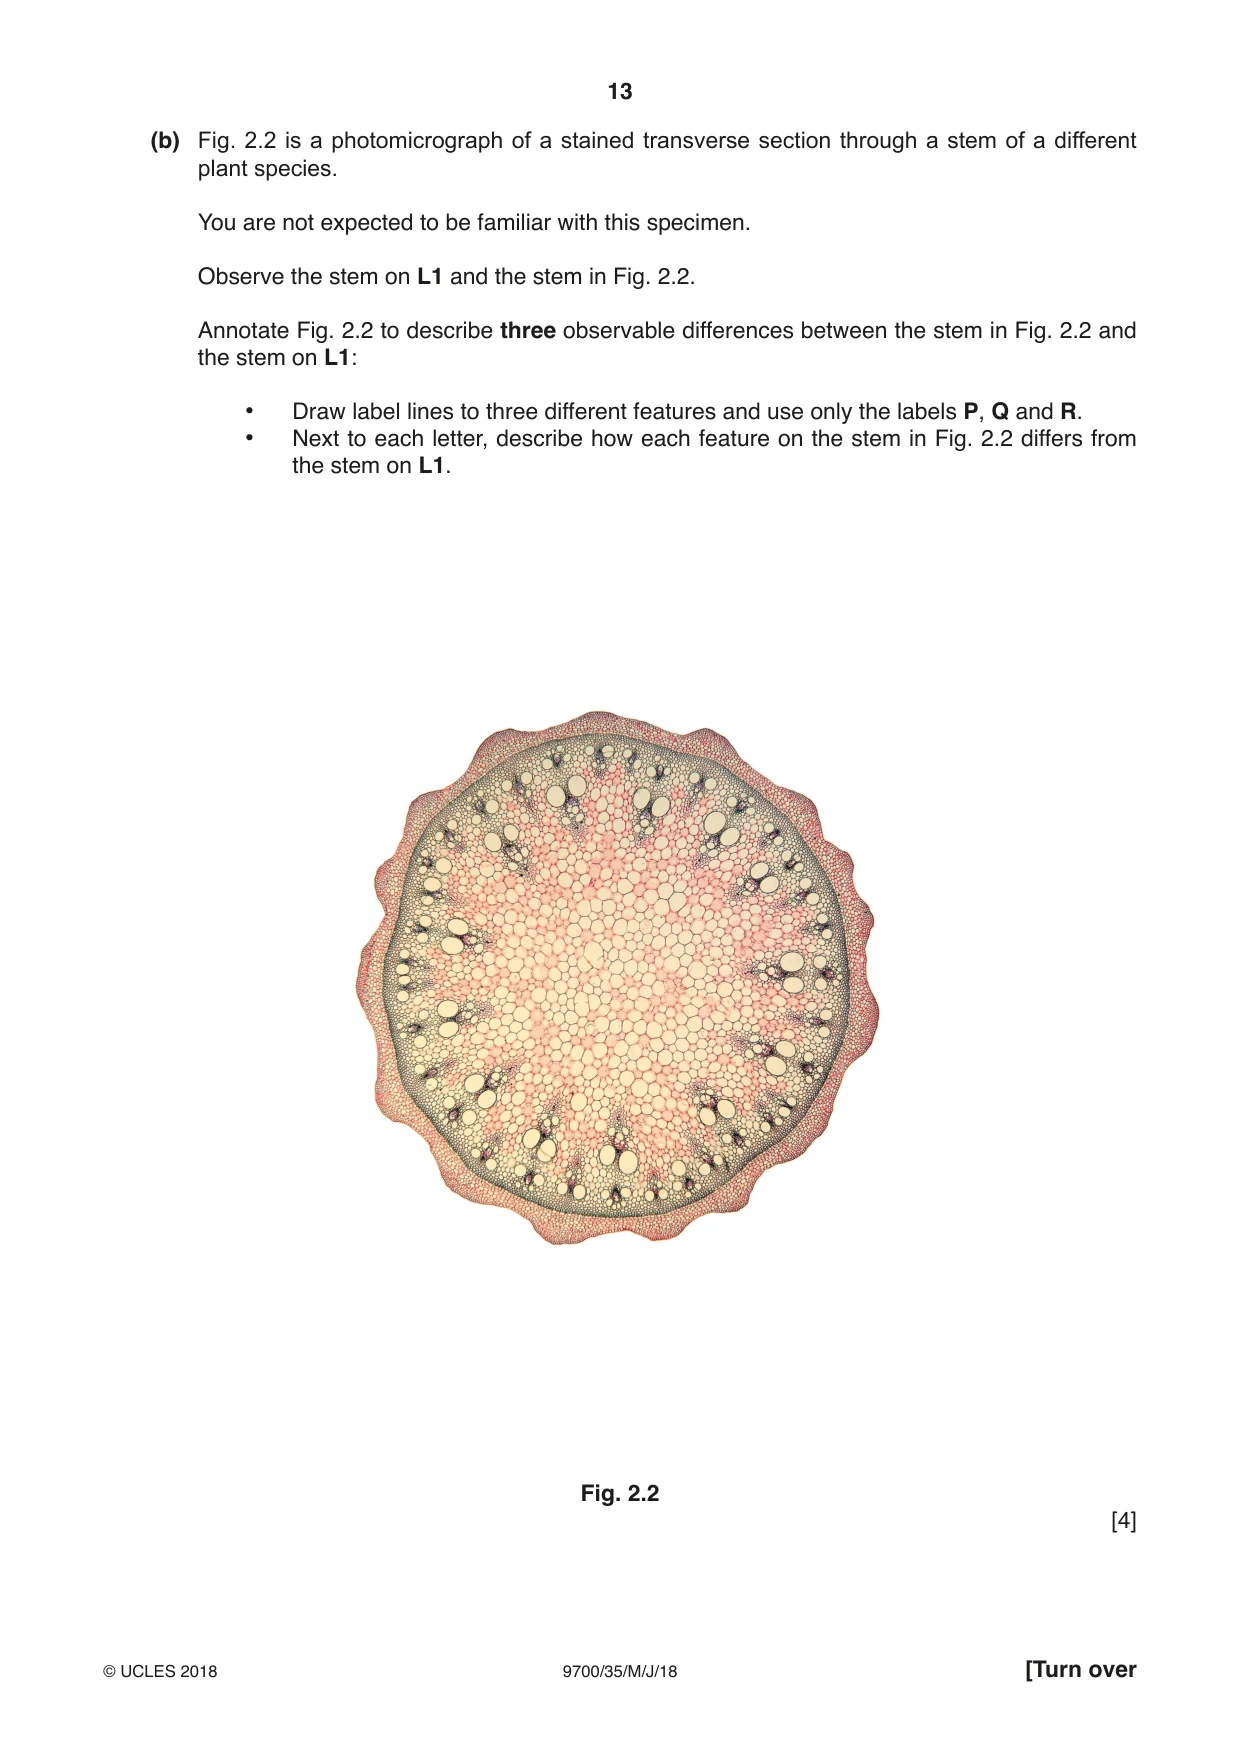
2 L1 is a slide of a stained transverse section through a plant stem. You are not expected to be familiar with this specimen. (a) (i) Observe all the different tissues in the stem on L1 and select an area that shows the epidermis and vascular bundles. Use a sharp pencil for drawing. Draw a large plan diagram of the area you have selected on L1 to include: • the epidermis • only three vascular bundles • any other observable tissues. Use one ruled label line and label to identify the phloem. You are expected to draw the correct shape and proportions of the different tissues. [6] (ii) Observe the cells in the cap of the vascular bundle on slide L1 as shown in Fig. 2.1. These cells are not identical. epidermis cap vascular bundle not to scale Fig. 2.1 Select one group of four cells in the cap. Each cell of the group must touch at least two of the other cells. Make a large drawing of this group of four cells. Use one ruled label line and label to identify the cell wall of one cell. [5] (b) Fig. 2.2 is a photomicrograph of a stained transverse section through a stem of a different plant species. You are not expected to be familiar with this specimen. Observe the stem on L1 and the stem in Fig. 2.2. Annotate Fig. 2.2 to describe three observable differences between the stem in Fig. 2.2 and the stem on L1: • Draw label lines to three different features and use only the labels P, Q and R. • Next to each letter, describe how each feature on the stem in Fig. 2.2 differs from the stem on L1. Fig. 2.2 [4]
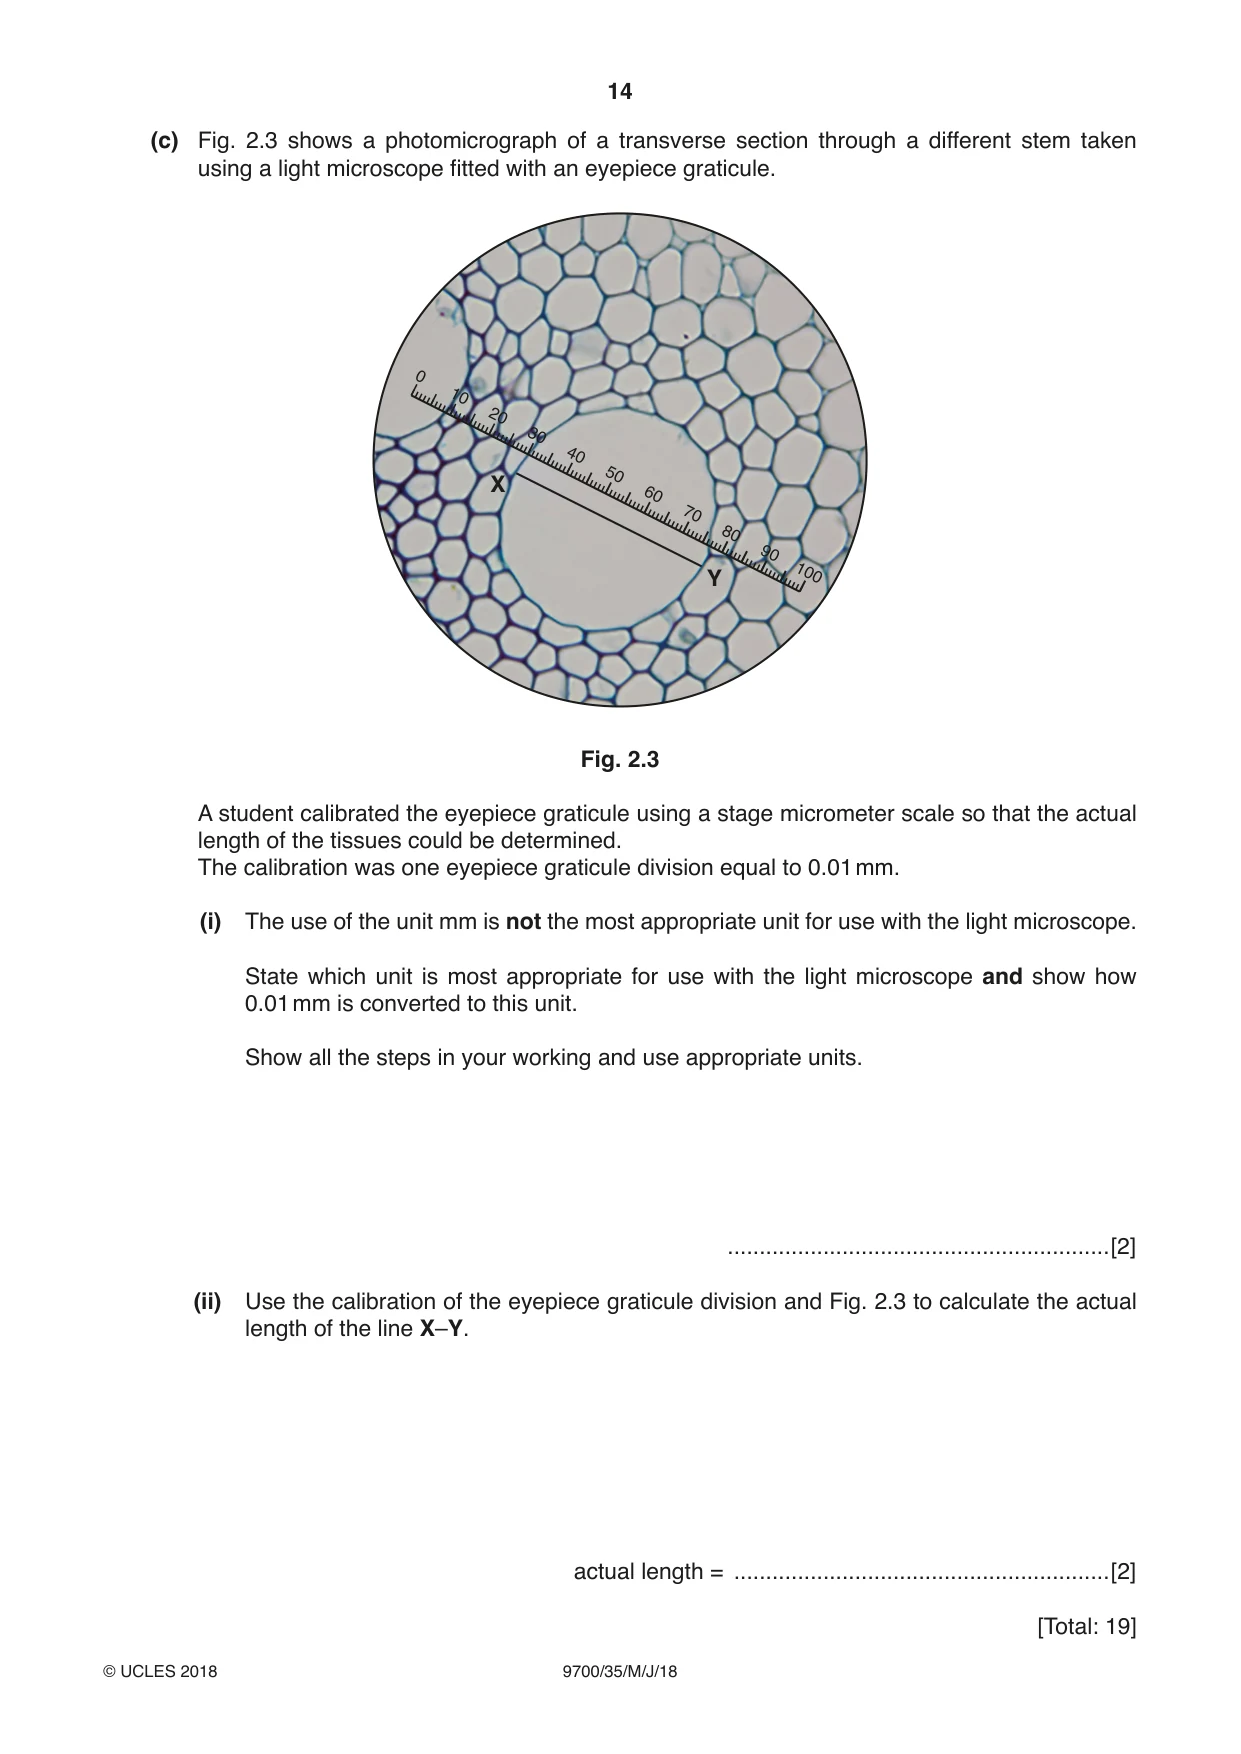
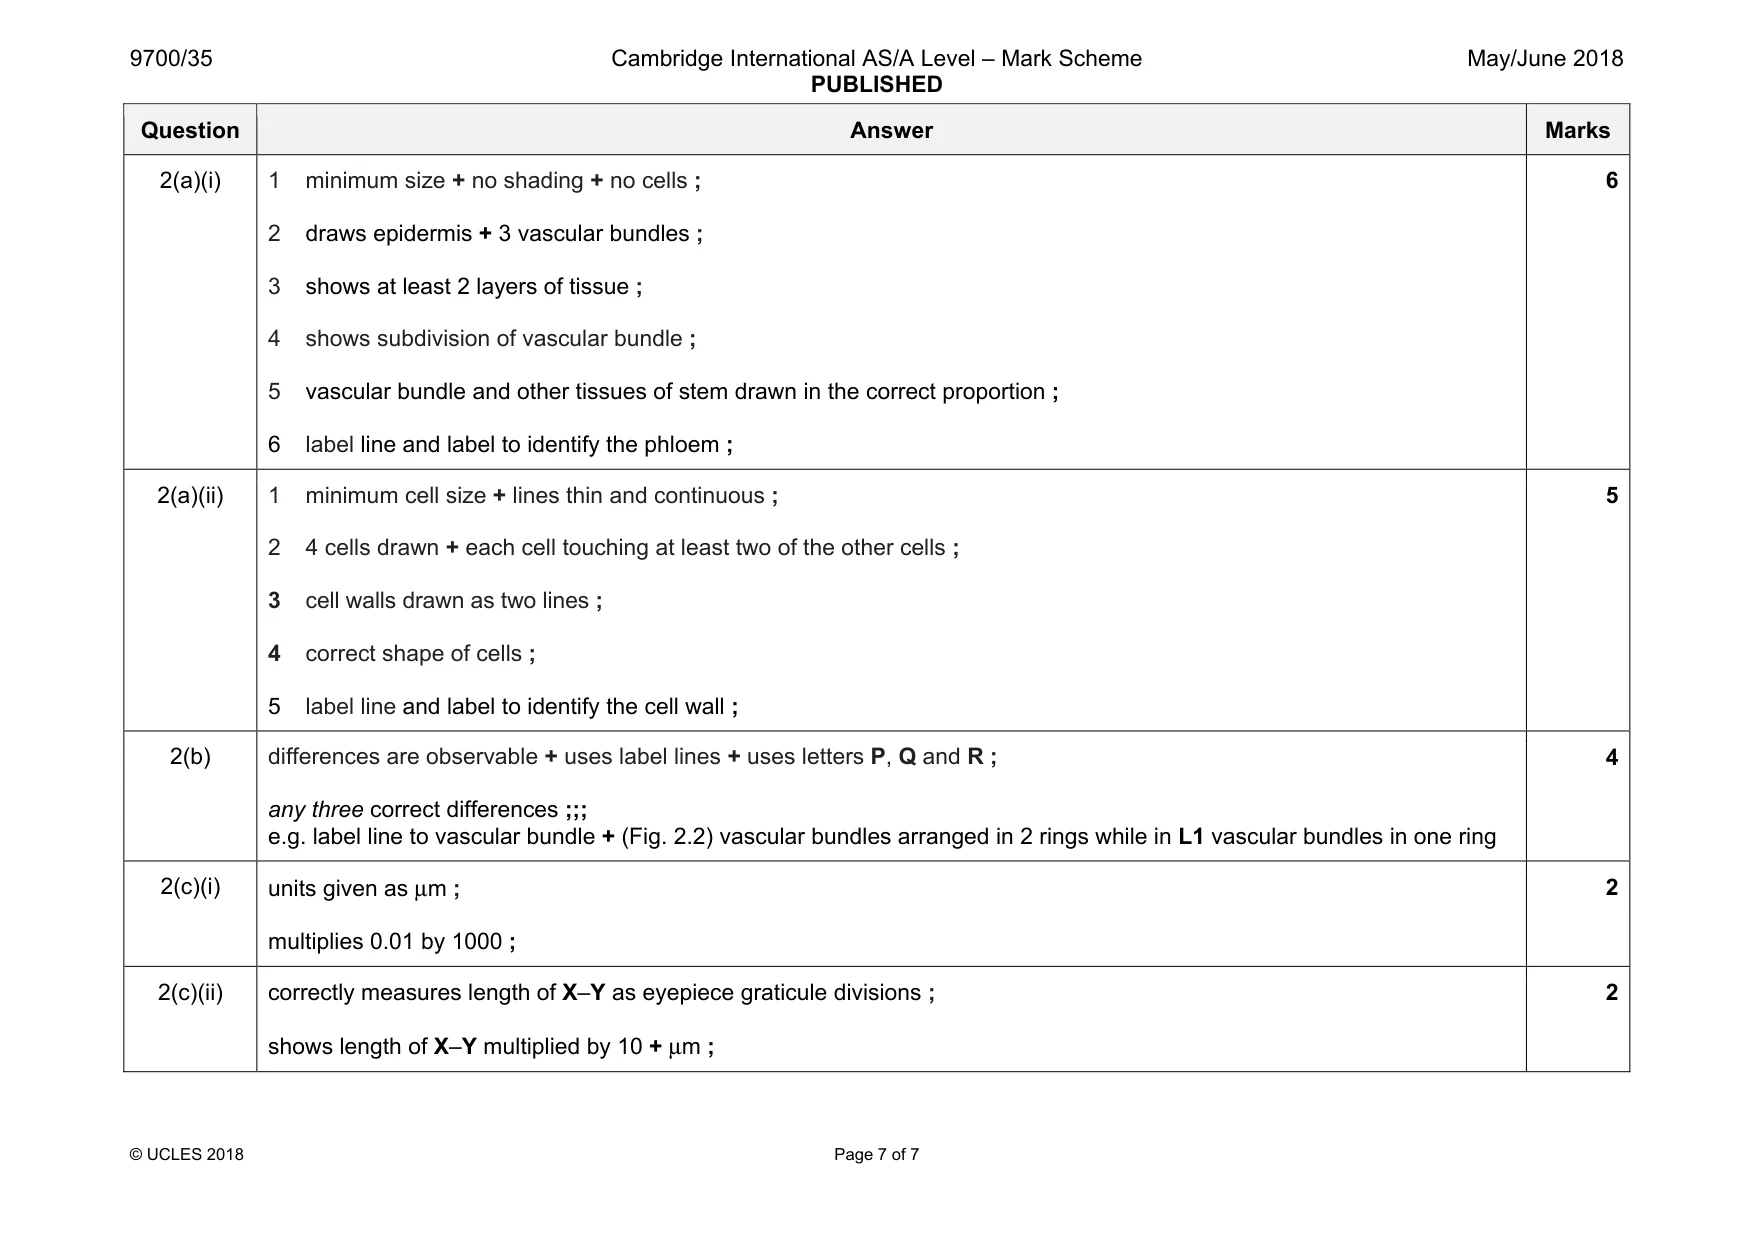
Mark scheme: 2(a)(i) 1 minimum size + no shading + no cells ; 2 draws epidermis + 3 vascular bundles ; 3 shows at least 2 layers of tissue ; 4 shows subdivision of vascular bundle ; 5 vascular bundle and other tissues of stem drawn in the correct proportion ; 6 label line and label to identify the phloem ; 6 2(a)(ii) 1 minimum cell size + lines thin and continuous ; 2 4 cells drawn + each cell touching at least two of the other cells ; 3 cell walls drawn as two lines ; 4 correct shape of cells ; 5 label line and label to identify the cell wall ; 5 2(b) differences are observable + uses label lines + uses letters P, Q and R ; any three correct differences ;;; e.g. label line to vascular bundle + (Fig. 2.2) vascular bundles arranged in 2 rings while in L1 vascular bundles in one ring 4 2(c)(i) units given as µm ; multiplies 0.01 by 1000 ; 2 2(c)(ii) correctly measures length of X–Y as eyepiece graticule divisions ; shows length of X–Y multiplied by 10 + µm ; 2
What was in this paper
The subtopics covered by these 2 questions, and how many questions each got. Open one in a new tab to see every Cambridge question on it.
What you needed in this session
Cambridge’s own grade thresholds for 2018 May/June, Paper 3 · Variant 5. A higher threshold means an easier paper — the bar moves with how the cohort did.