Cambridge A Level Biology 9700 — 2024 Oct/Nov Paper 3 · Variant 4
9700/34/O/N/24 · 2 questions · 40 marks · ≈45 min
The question paper and its mark scheme, free to read here and free to download. This is Cambridge’s own paper, exactly as it was sat.
Question paper12 pages
Mark scheme7 pages
Answers below. Sit the paper first if you are practising.
Questions as text
Q1 · Vegetables, such as carrots, contain sugars
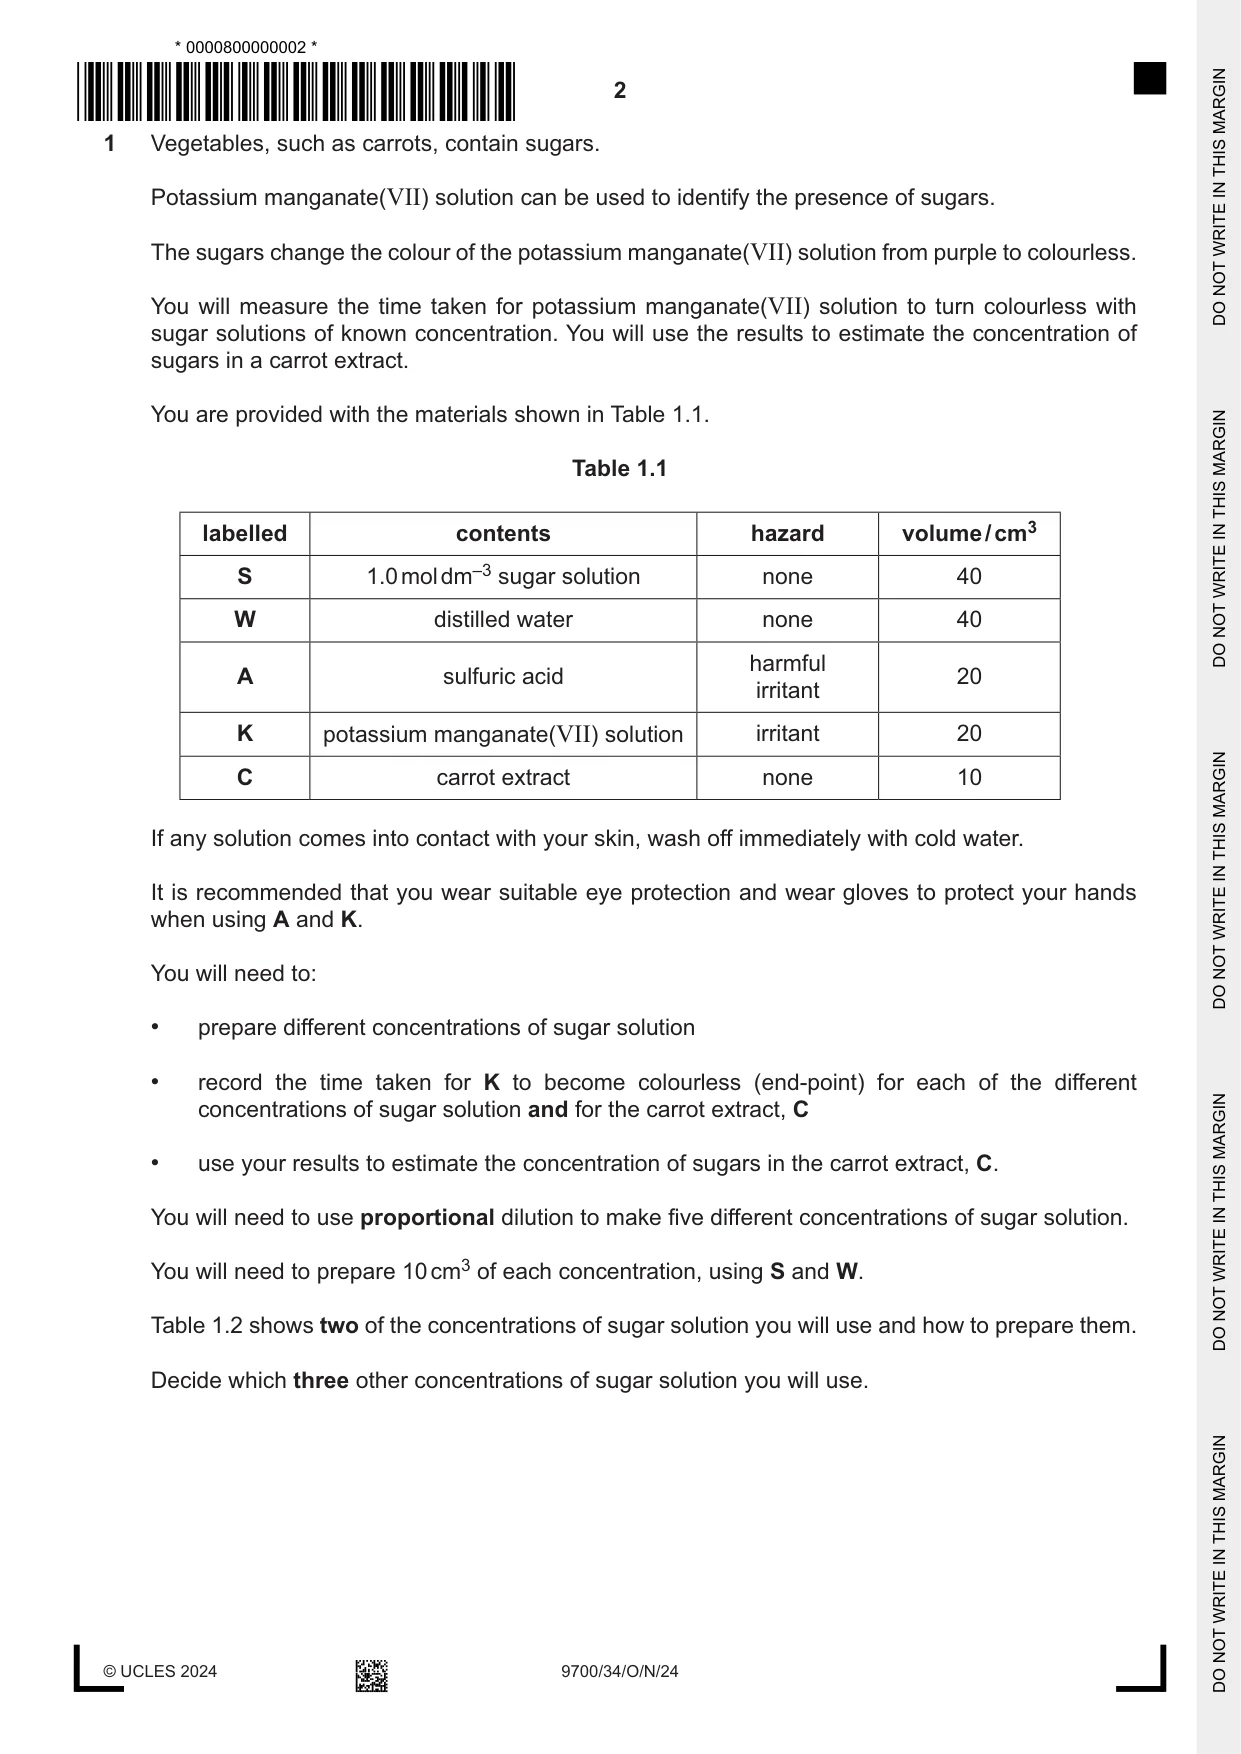
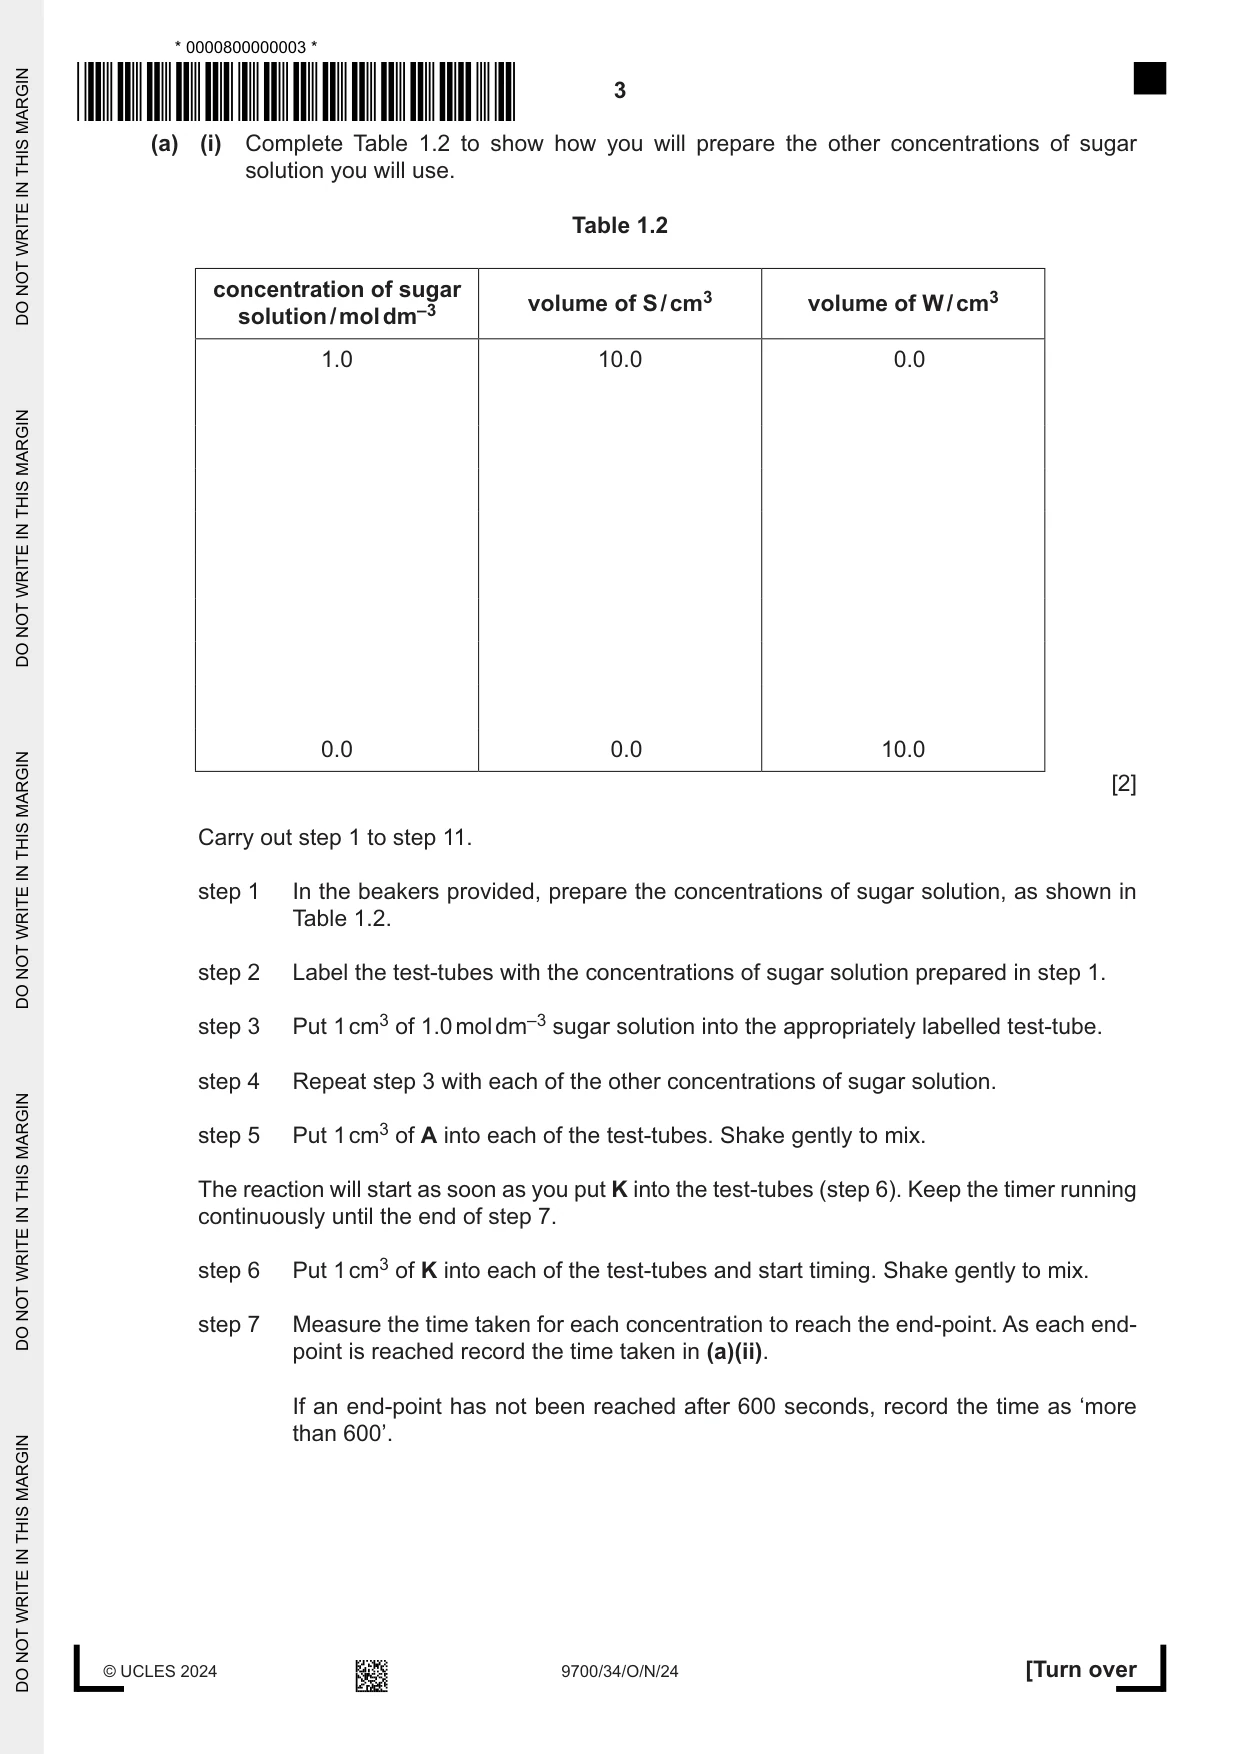
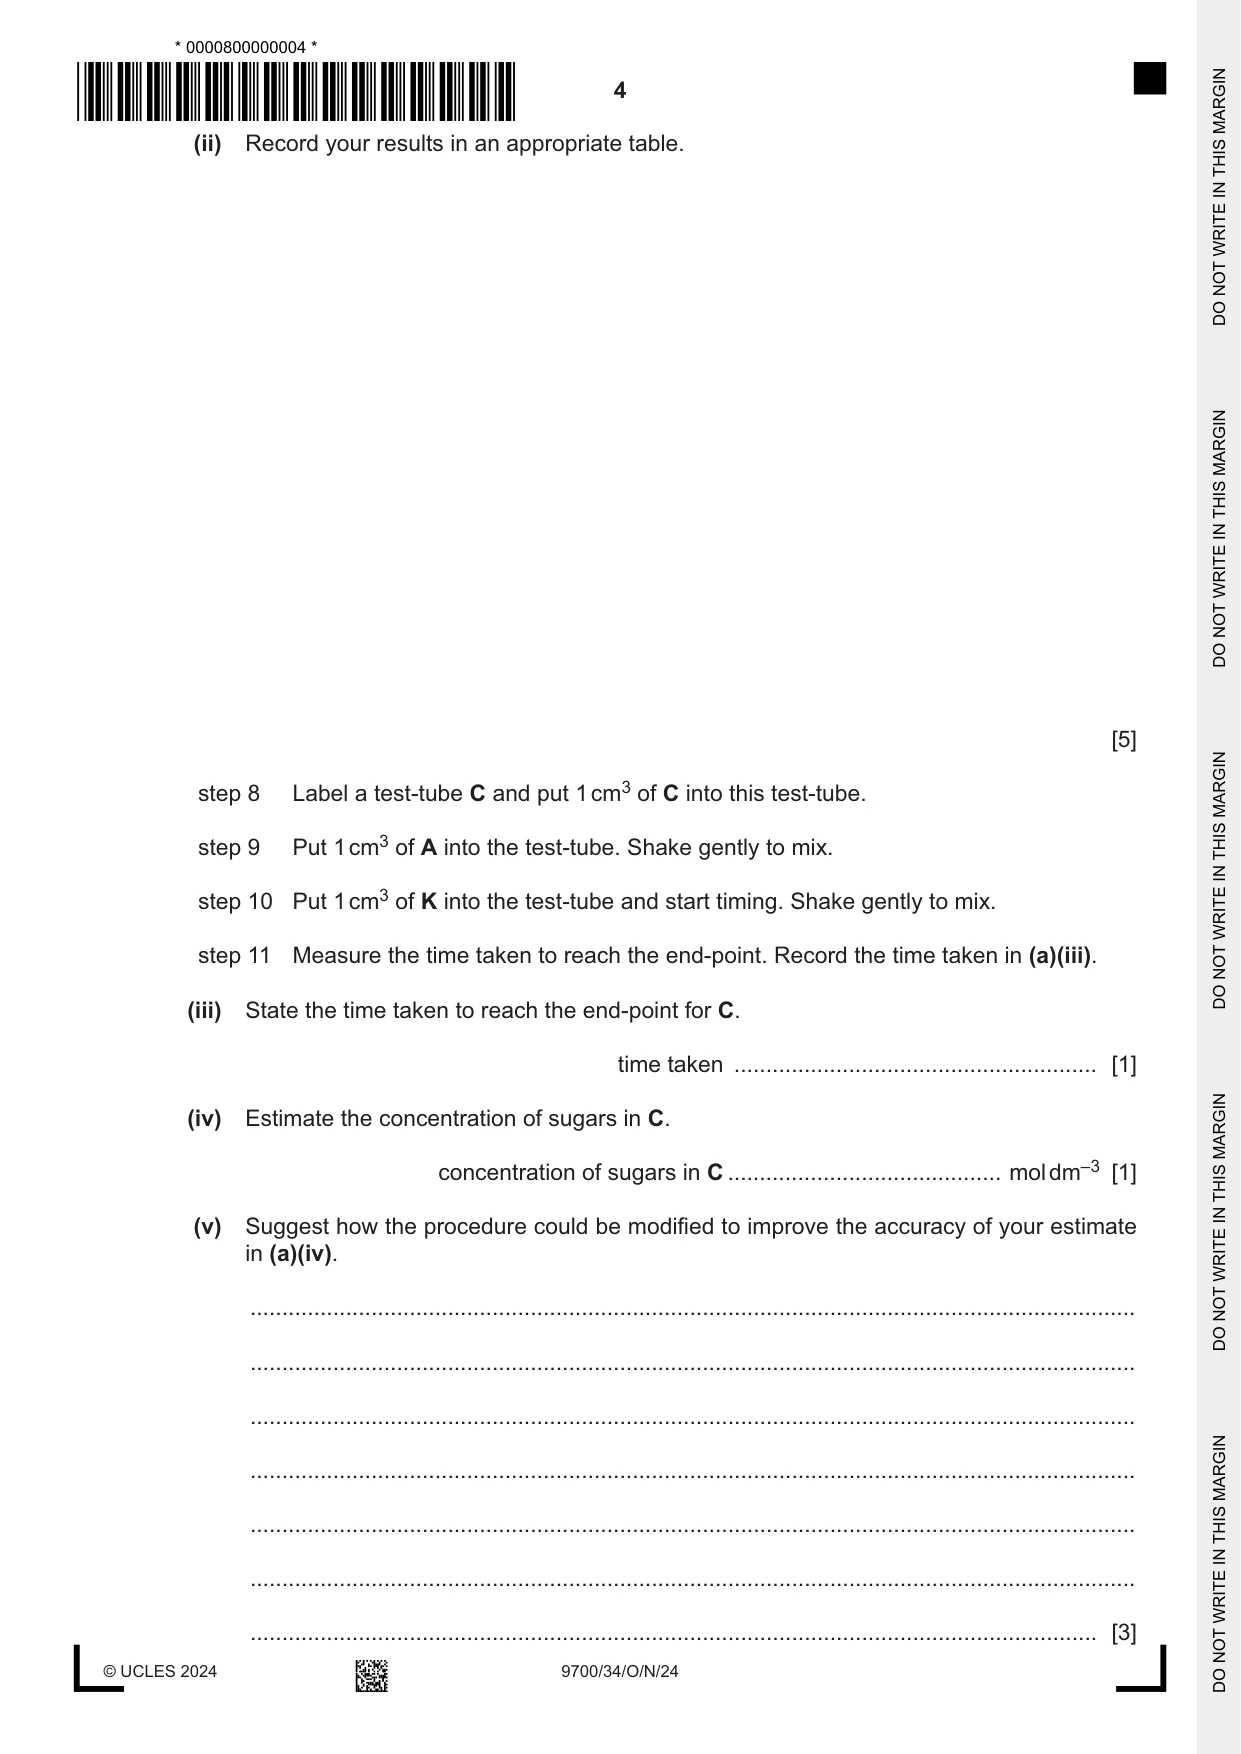
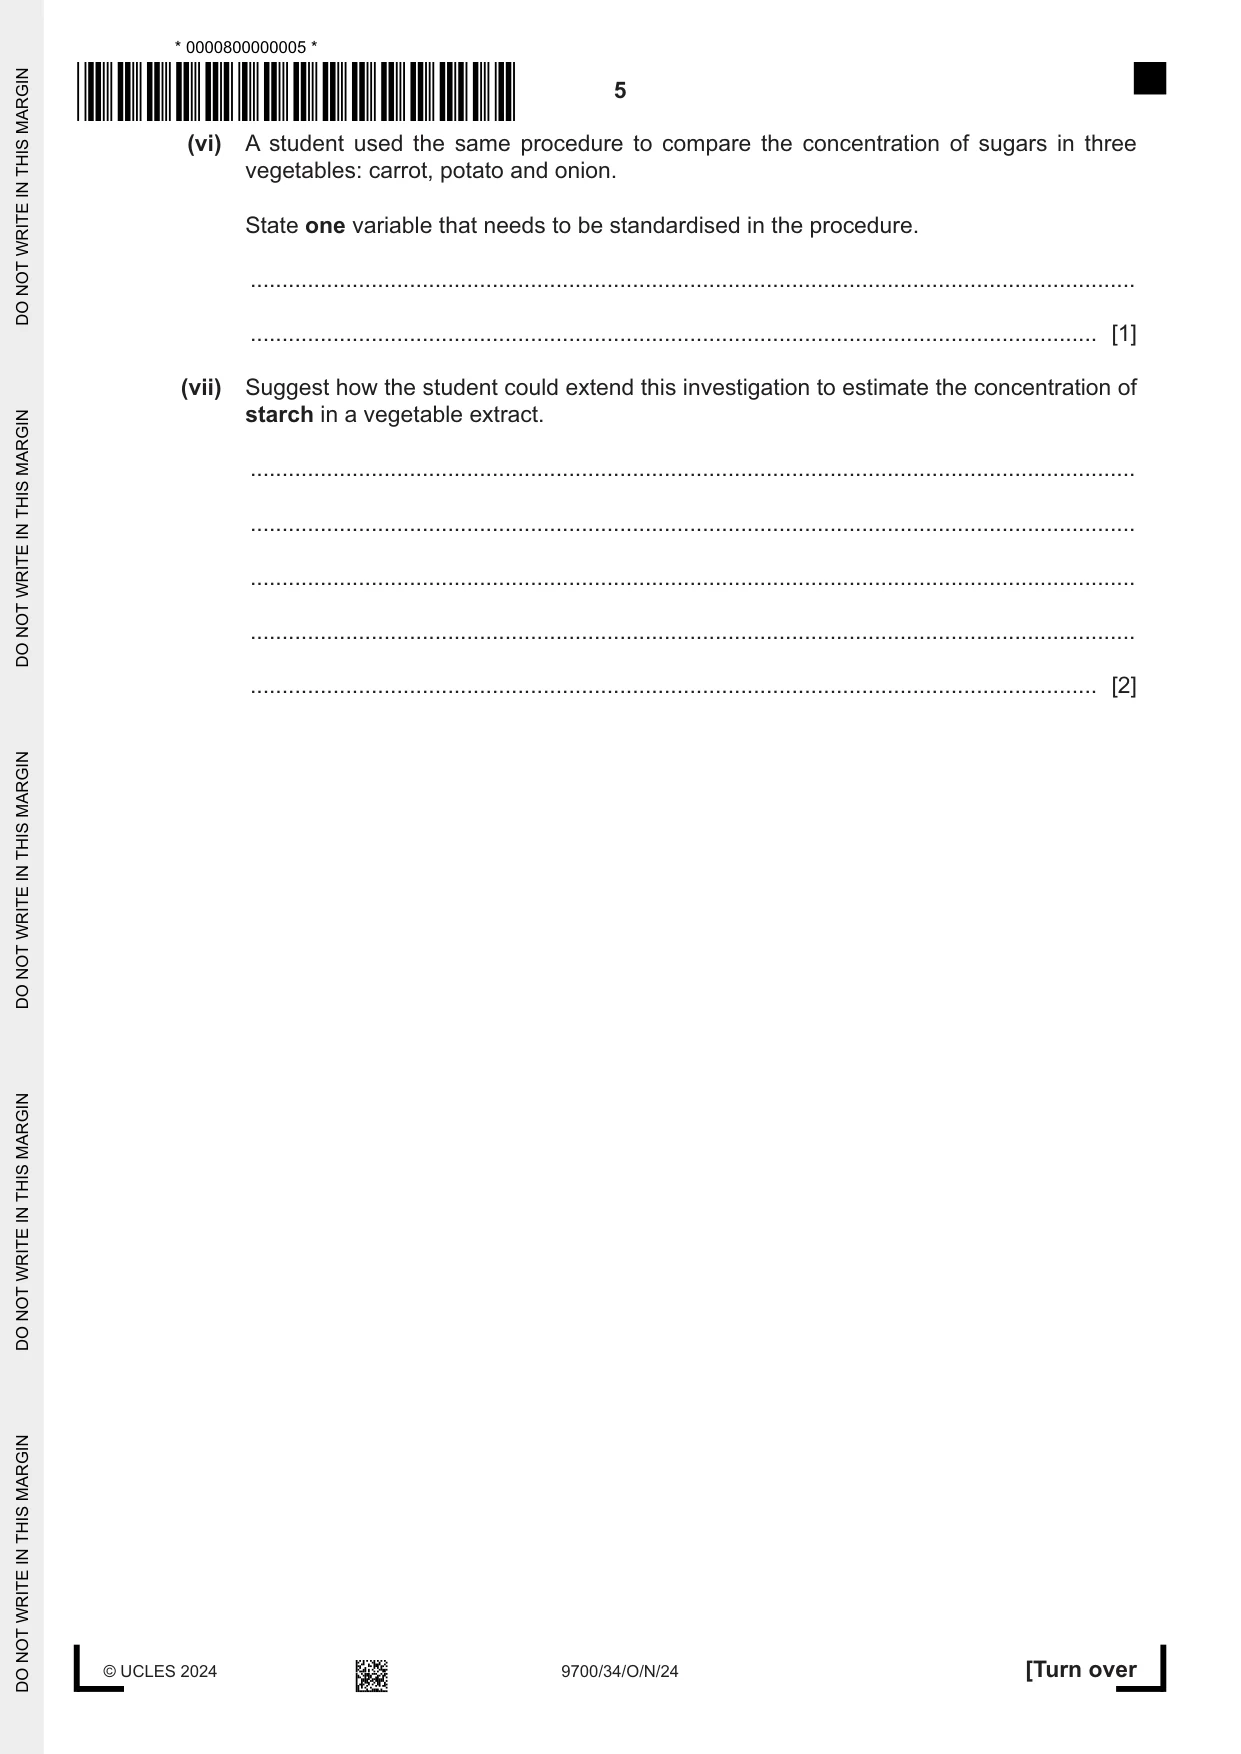
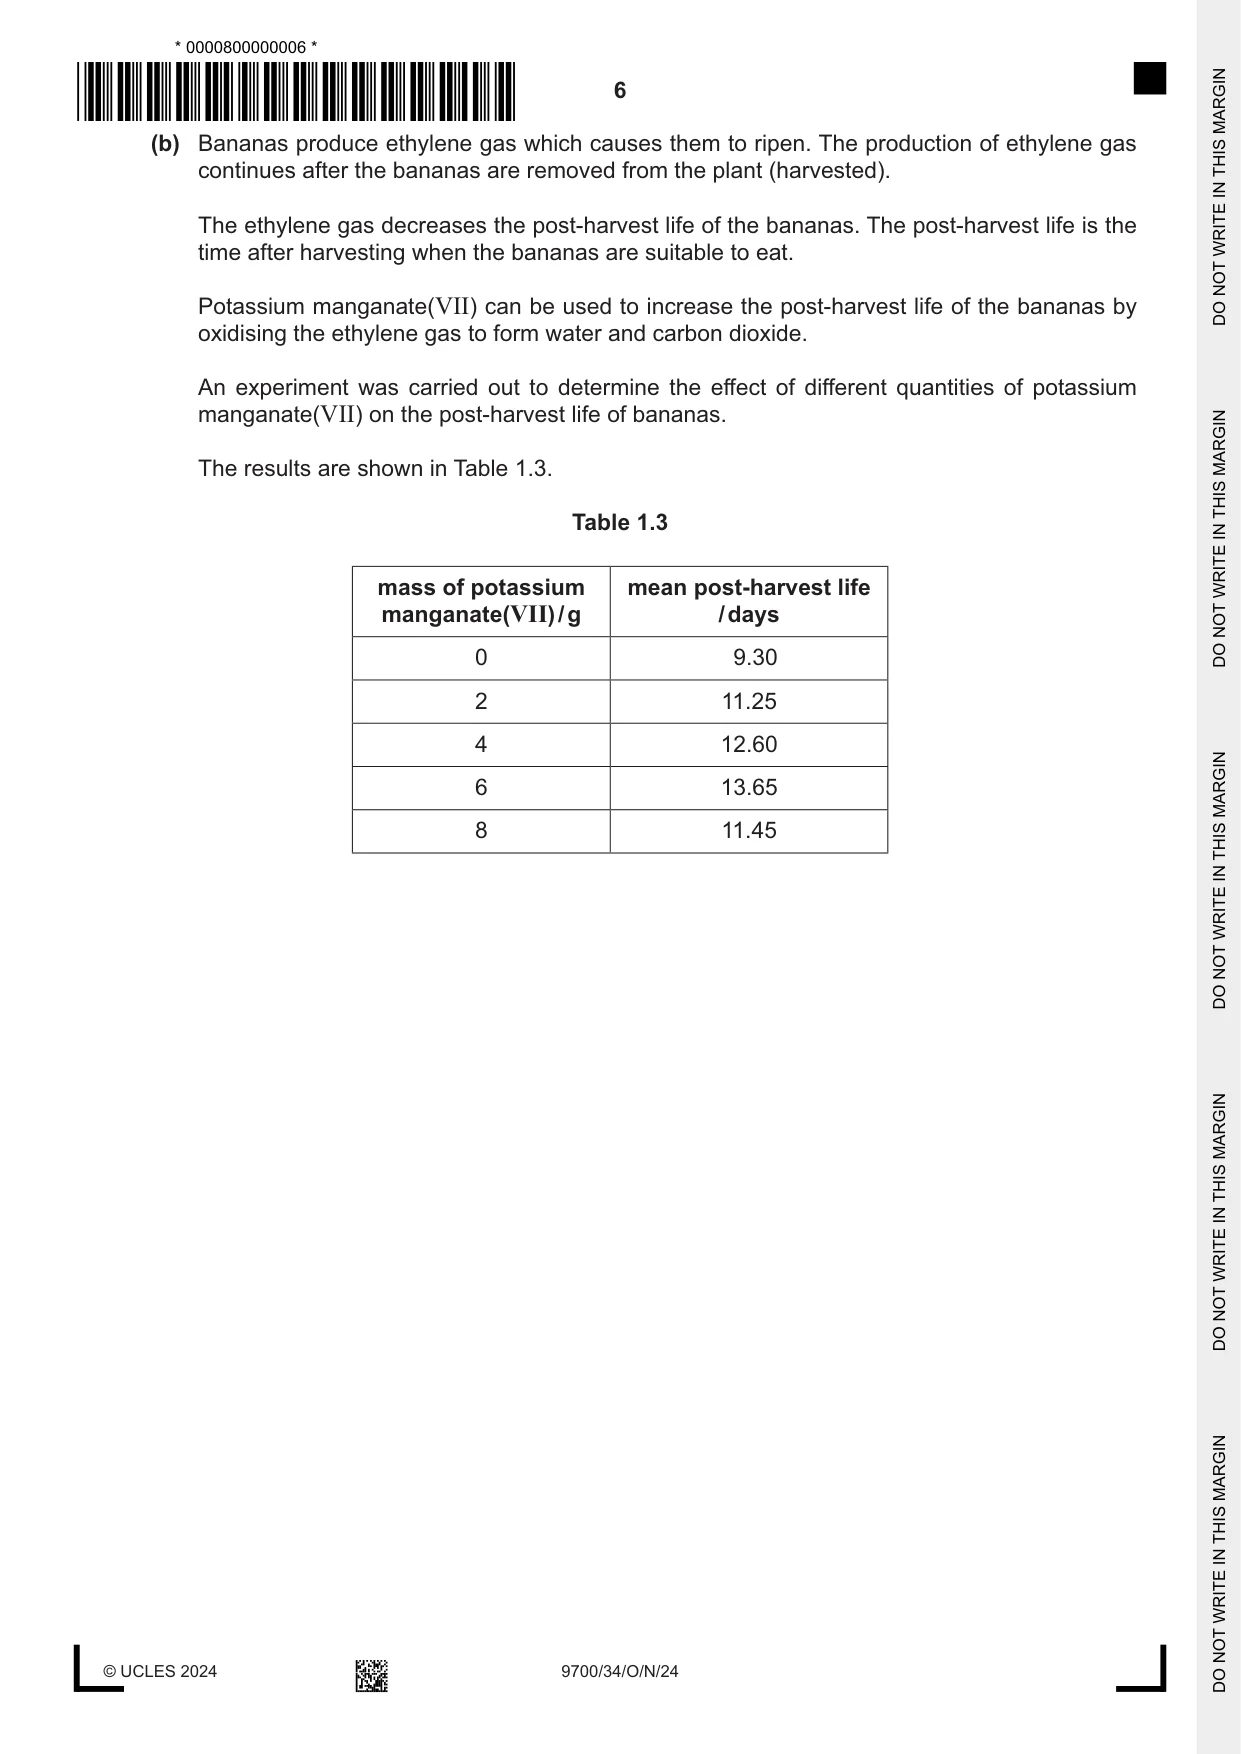
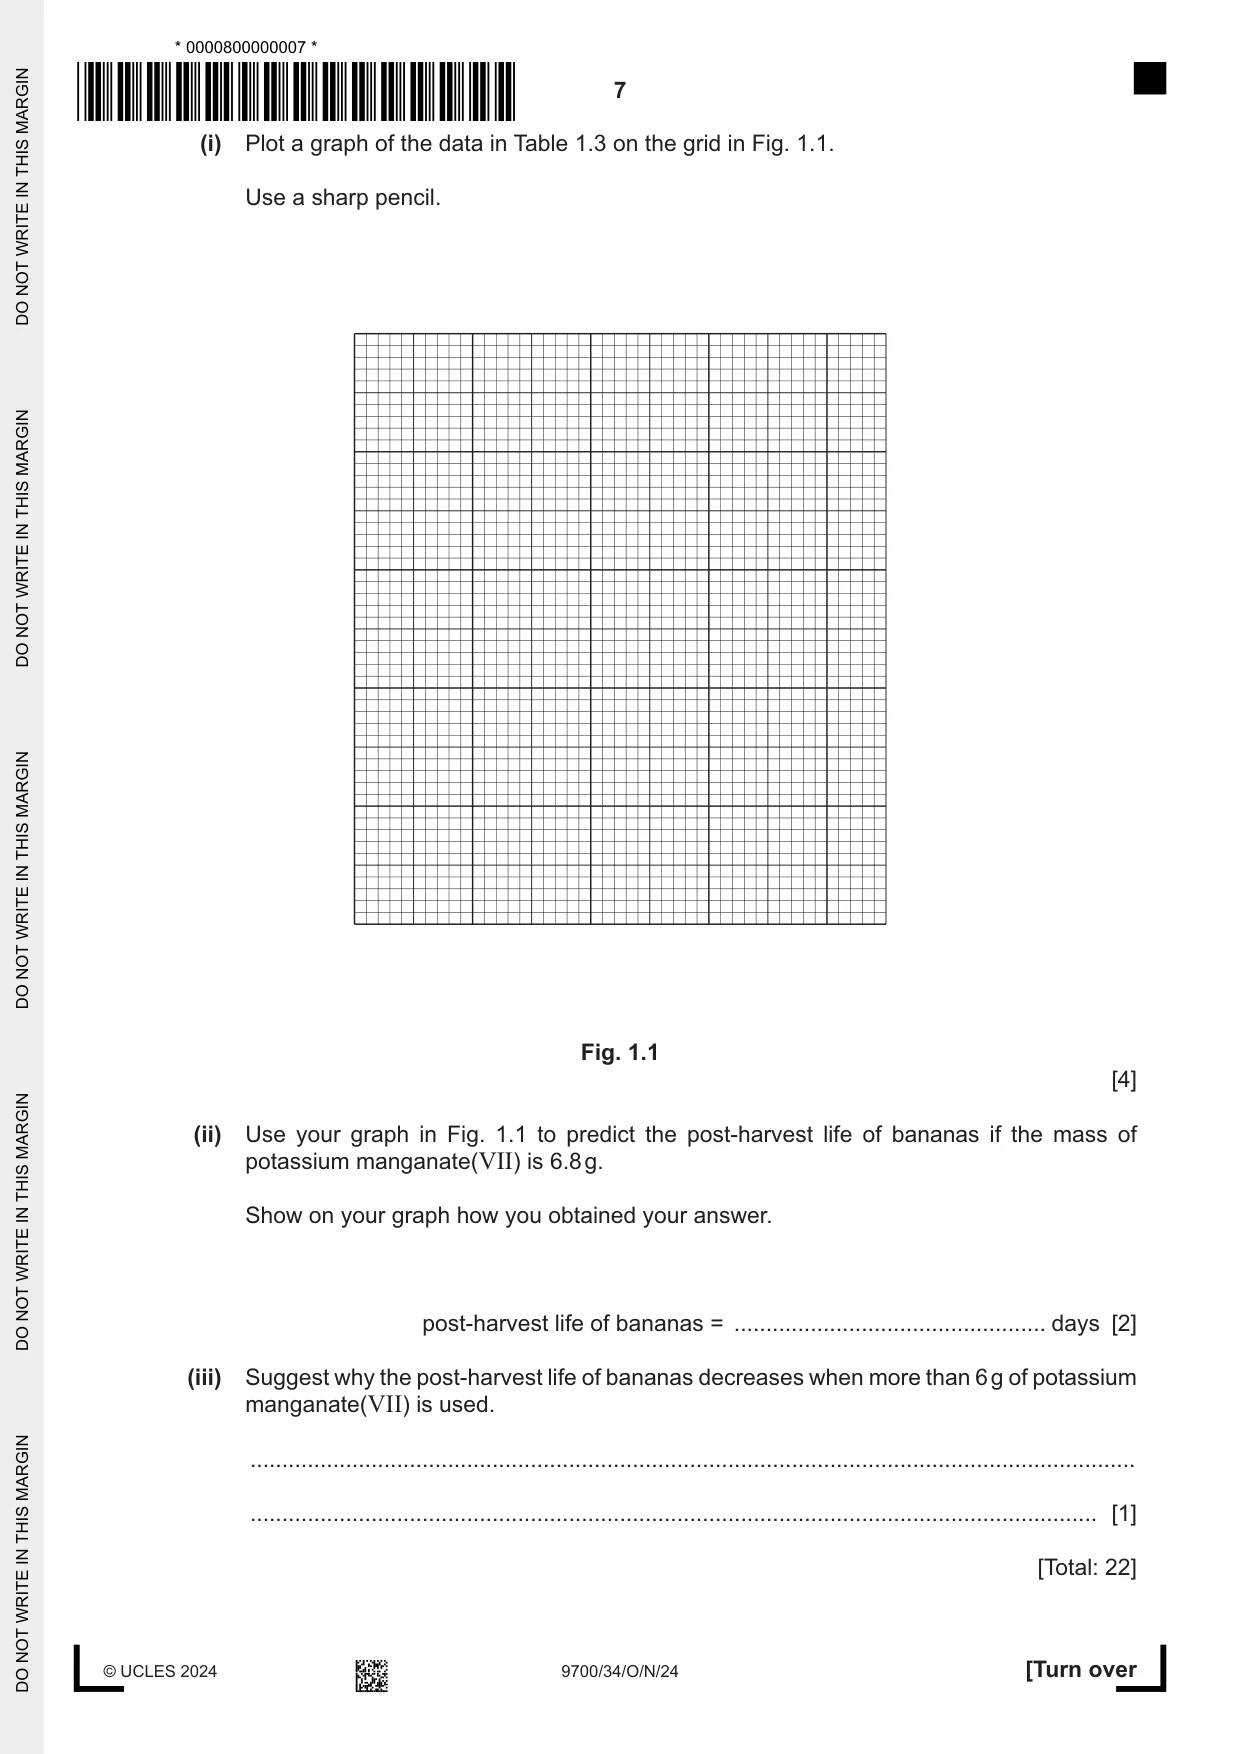
1 Vegetables, such as carrots, contain sugars. Potassium manganate(VII) solution can be used to identify the presence of sugars. The sugars change the colour of the potassium manganate(VII) solution from purple to colourless. You will measure the time taken for potassium manganate(VII) solution to turn colourless with sugar solutions of known concentration. You will use the results to estimate the concentration of sugars in a carrot extract. You are provided with the materials shown in Table 1.1. Table 1.1 labelled contents hazard volume / cm3 S 1.0 mol dm–3 sugar solution none 40 W distilled water none 40 harmful A sulfuric acid 20 irritant K potassium manganate(VII) solution irritant 20 C carrot extract none 10 If any solution comes into contact with your skin, wash off immediately with cold water. It is recommended that you wear suitable eye protection and wear gloves to protect your hands when using A and K. You will need to: • prepare different concentrations of sugar solution • record the time taken for K to become colourless (end-point) for each of the different concentrations of sugar solution and for the carrot extract, C • use your results to estimate the concentration of sugars in the carrot extract, C. You will need to use proportional dilution to make five different concentrations of sugar solution. You will need to prepare 10 cm3 of each concentration, using S and W. Table 1.2 shows two of the concentrations of sugar solution you will use and how to prepare them. Decide which three other concentrations of sugar solution you will use. (a) (i) Complete Table 1.2 to show how you will prepare the other concentrations of sugar solution you will use. Table 1.2 concentration of sugar volume of S / cm3 volume of W / cm3 solution / mol dm–3 1.0 10.0 0.0 0.0 0.0 10.0 [2] Carry out step 1 to step 11. step 1 In the beakers provided, prepare the concentrations of sugar solution, as shown in Table 1.2. step 2 Label the test-tubes with the concentrations of sugar solution prepared in step 1. step 3 Put 1 cm3 of 1.0 mol dm–3 sugar solution into the appropriately labelled test-tube. step 4 Repeat step 3 with each of the other concentrations of sugar solution. step 5 Put 1 cm3 of A into each of the test-tubes. Shake gently to mix. The reaction will start as soon as you put K into the test-tubes (step 6). Keep the timer running continuously until the end of step 7. step 6 Put 1 cm3 of K into each of the test-tubes and start timing. Shake gently to mix. step 7 Measure the time taken for each concentration to reach the end-point. As each end- point is reached record the time taken in (a)(ii). If an end-point has not been reached after 600 seconds, record the time as ‘more than 600’. (ii) Record your results in an appropriate table. [5] step 8 Label a test-tube C and put 1 cm3 of C into this test-tube. step 9 Put 1 cm3 of A into the test-tube. Shake gently to mix. step 10 Put 1 cm3 of K into the test-tube and start timing. Shake gently to mix. step 11 Measure the time taken to reach the end-point. Record the time taken in (a)(iii). (iii) State the time taken to reach the end-point for C. time taken ......................................................... [1] (iv) Estimate the concentration of sugars in C. concentration of sugars in C ........................................... mol dm–3 [1] (v) Suggest how the procedure could be modified to improve the accuracy of your estimate in (a)(iv). ........................................................................................................................................... ........................................................................................................................................... ........................................................................................................................................... ........................................................................................................................................... ........................................................................................................................................... ........................................................................................................................................... ..................................................................................................................................... [3] (vi) A student used the same procedure to compare the concentration of sugars in three vegetables: carrot, potato and onion. State one variable that needs to be standardised in the procedure. ........................................................................................................................................... ..................................................................................................................................... [1] (vii) Suggest how the student could extend this investigation to estimate the concentration of starch in a vegetable extract. ........................................................................................................................................... ........................................................................................................................................... ........................................................................................................................................... ........................................................................................................................................... ..................................................................................................................................... [2] (b) Bananas produce ethylene gas which causes them to ripen. The production of ethylene gas continues after the bananas are removed from the plant (harvested). The ethylene gas decreases the post-harvest life of the bananas. The post-harvest life is the time after harvesting when the bananas are suitable to eat. Potassium manganate(VII) can be used to increase the post-harvest life of the bananas by oxidising the ethylene gas to form water and carbon dioxide. An experiment was carried out to determine the effect of different quantities of potassium manganate(VII) on the post-harvest life of bananas. The results are shown in Table 1.3. Table 1.3 mass of potassium mean post-harvest life manganate(VII) / g / days 0 9.30 2 11.25 4 12.60 6 13.65 8 11.45 (i) Plot a graph of the data in Table 1.3 on the grid in Fig. 1.1. Use a sharp pencil. Fig. 1.1 [4] (ii) Use your graph in Fig. 1.1 to predict the post-harvest life of bananas if the mass of potassium manganate(VII) is 6.8 g. Show on your graph how you obtained your answer. post-harvest life of bananas = ................................................. days [2] (iii) Suggest why the post-harvest life of bananas decreases when more than 6 g of potassium manganate(VII) is used. ........................................................................................................................................... ..................................................................................................................................... [1] [Total: 22]
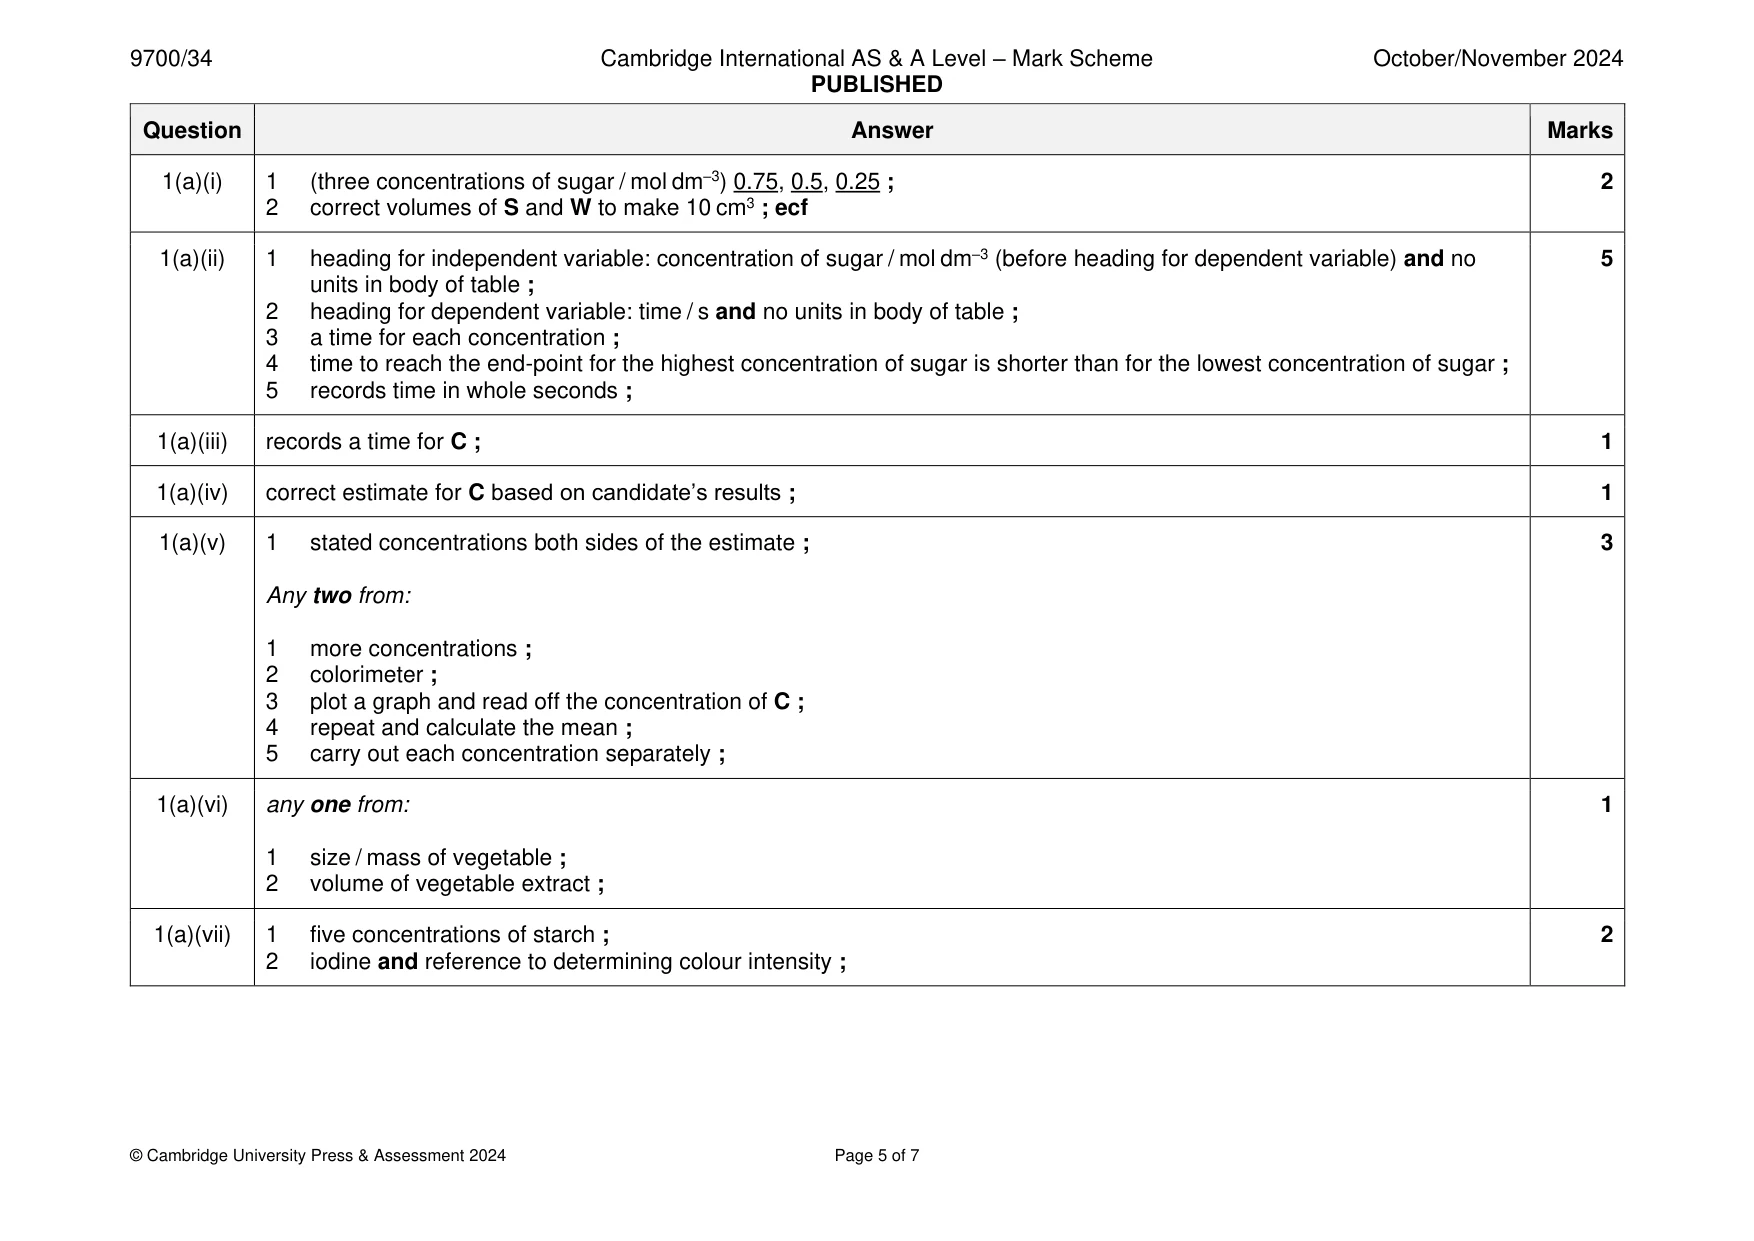
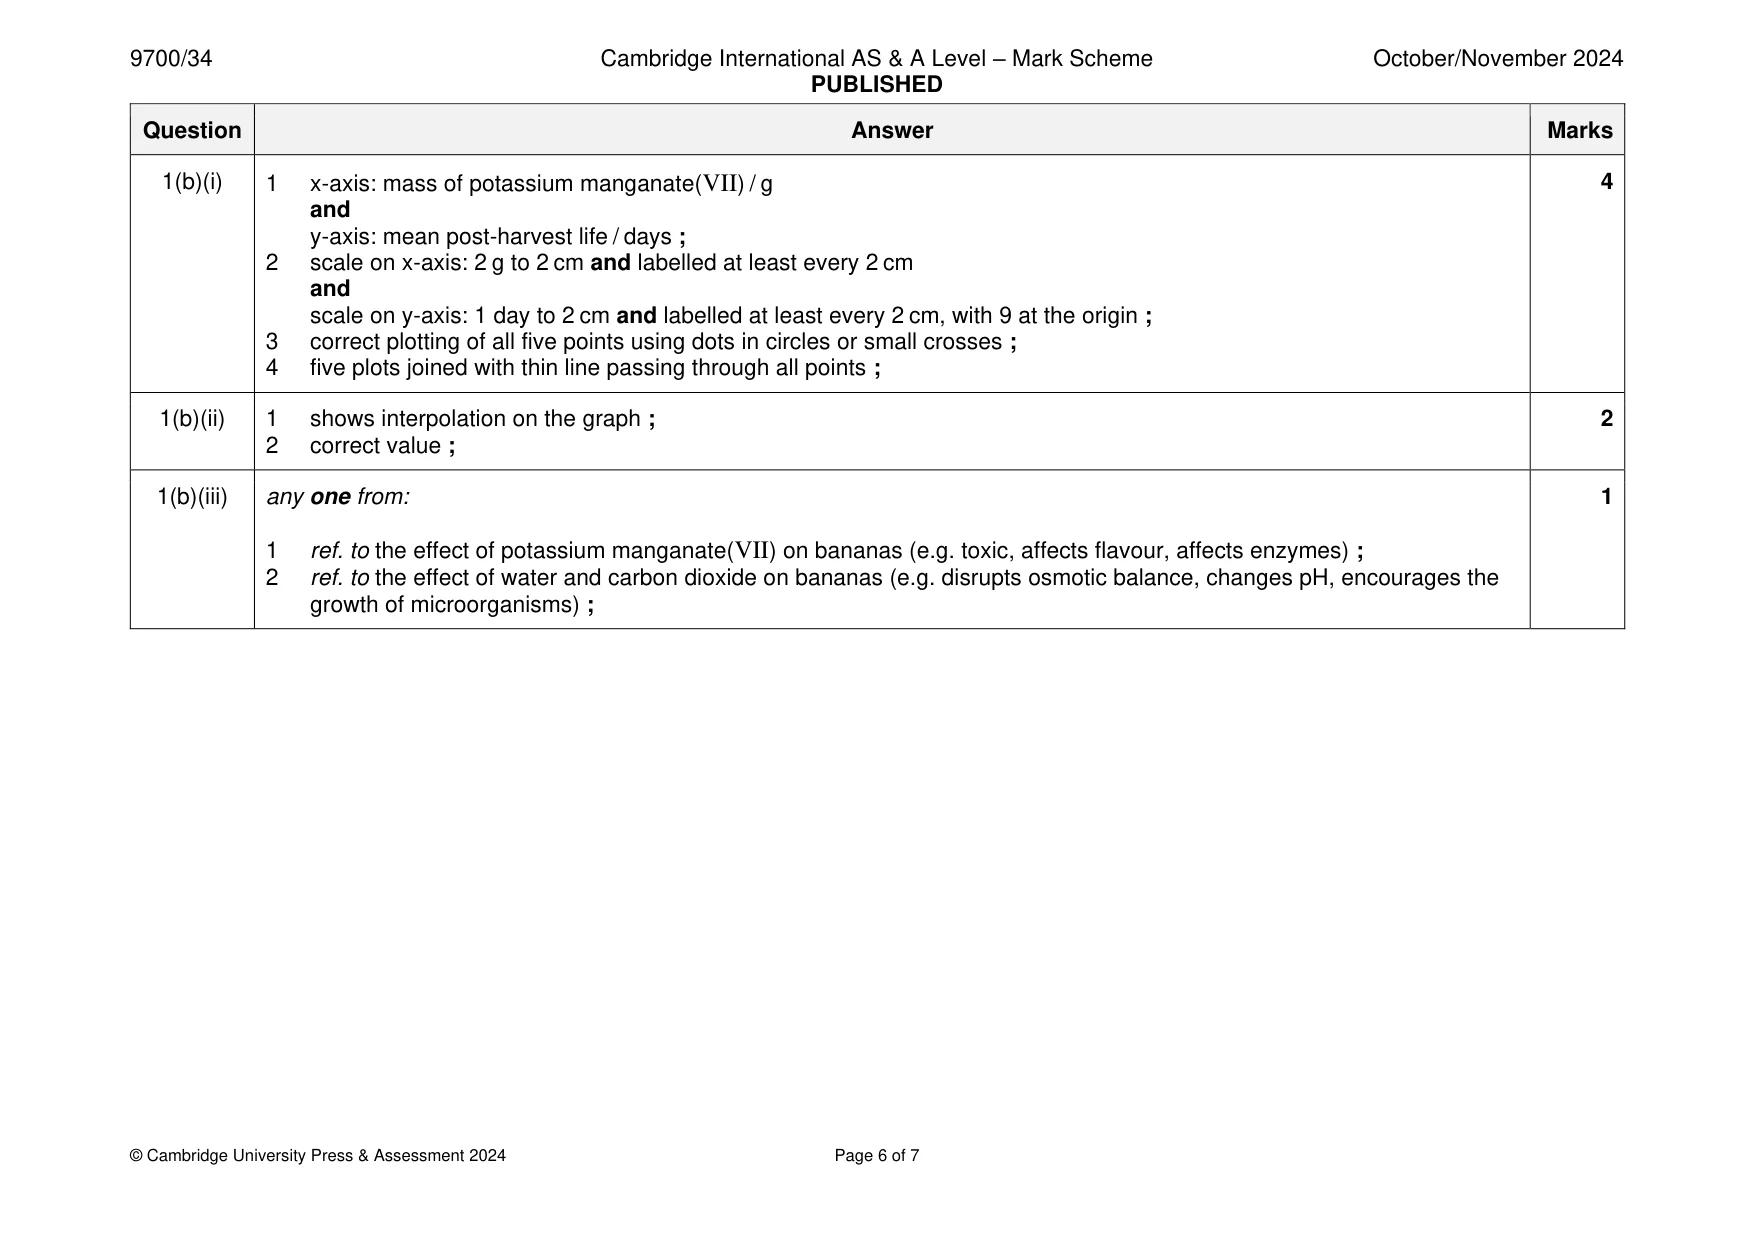
Mark scheme: Question Answer Marks 1(a)(i) 1 (three concentrations of sugar / mol dm–3) 0.75, 0.5, 0.25 ; 2 2 correct volumes of S and W to make 10 cm3 ; ecf 1(a)(ii) 1 heading for independent variable: concentration of sugar / mol dm–3 (before heading for dependent variable) and no 5 units in body of table ; 2 heading for dependent variable: time / s and no units in body of table ; 3 a time for each concentration ; 4 time to reach the end-point for the highest concentration of sugar is shorter than for the lowest concentration of sugar ; 5 records time in whole seconds ; 1(a)(iii) records a time for C ; 1 1(a)(iv) correct estimate for C based on candidate’s results ; 1 1(a)(v) 1 stated concentrations both sides of the estimate ; 3 Any two from: 1 more concentrations ; 2 colorimeter ; 3 plot a graph and read off the concentration of C ; 4 repeat and calculate the mean ; 5 carry out each concentration separately ; 1(a)(vi) any one from: 1 1 size / mass of vegetable ; 2 volume of vegetable extract ; 1(a)(vii) 1 five concentrations of starch ; 2 2 iodine and reference to determining colour intensity ; 1(b)(i) 1 x-axis: mass of potassium manganate(VII) / g 4 and y-axis: mean post-harvest life / days ; 2 scale on x-axis: 2 g to 2 cm and labelled at least every 2 cm and scale on y-axis: 1 day to 2 cm and labelled at least every 2 cm, with 9 at the origin ; 3 correct plotting of all five points using dots in circles or small crosses ; 4 five plots joined with thin line passing through all points ; 1(b)(ii) 1 shows interpolation on the graph ; 2 2 correct value ; 1(b)(iii) any one from: 1 1 ref. to the effect of potassium manganate(VII) on bananas (e.g. toxic, affects flavour, affects enzymes) ; 2 ref. to the effect of water and carbon dioxide on bananas (e.g. disrupts osmotic balance, changes pH, encourages the growth of microorganisms) ;
Q2 · L1 is a slide of a stained transverse section through a plant root
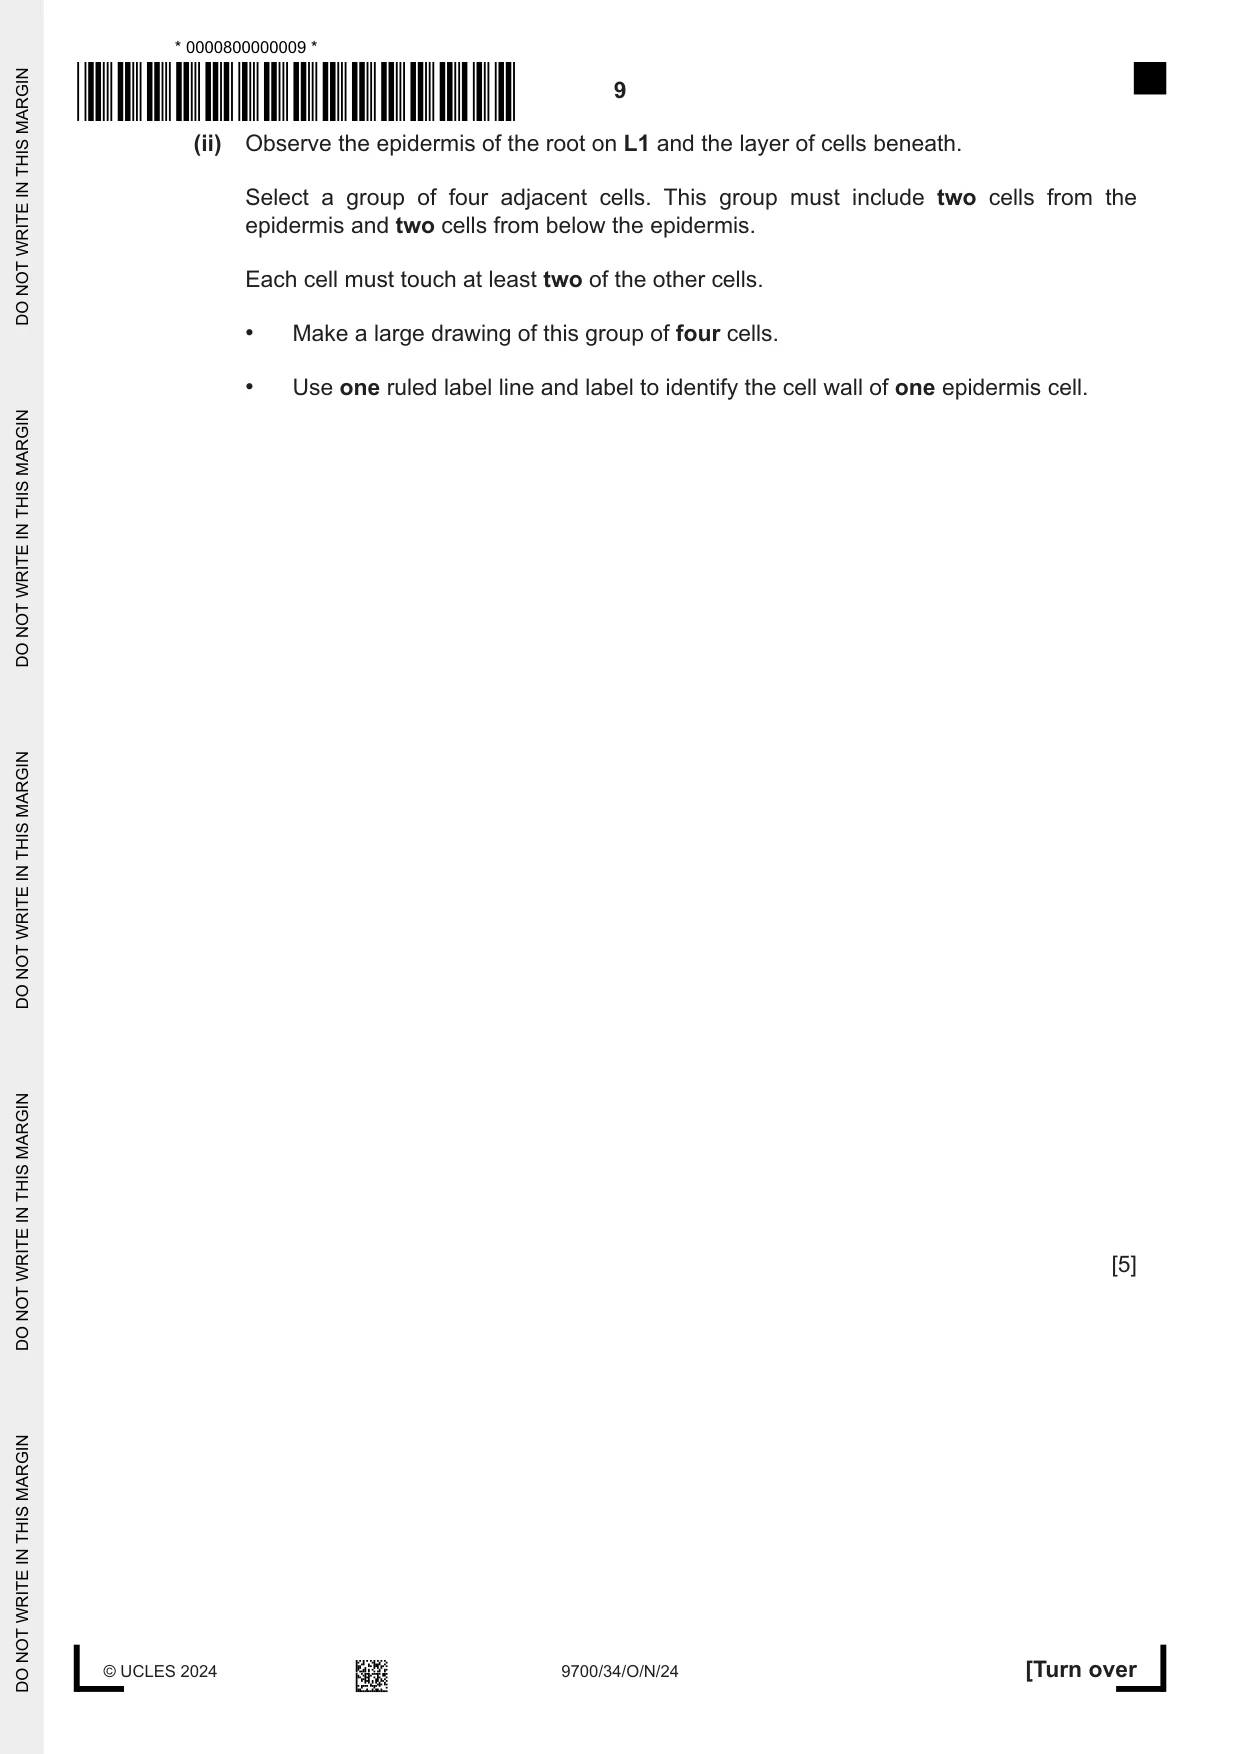
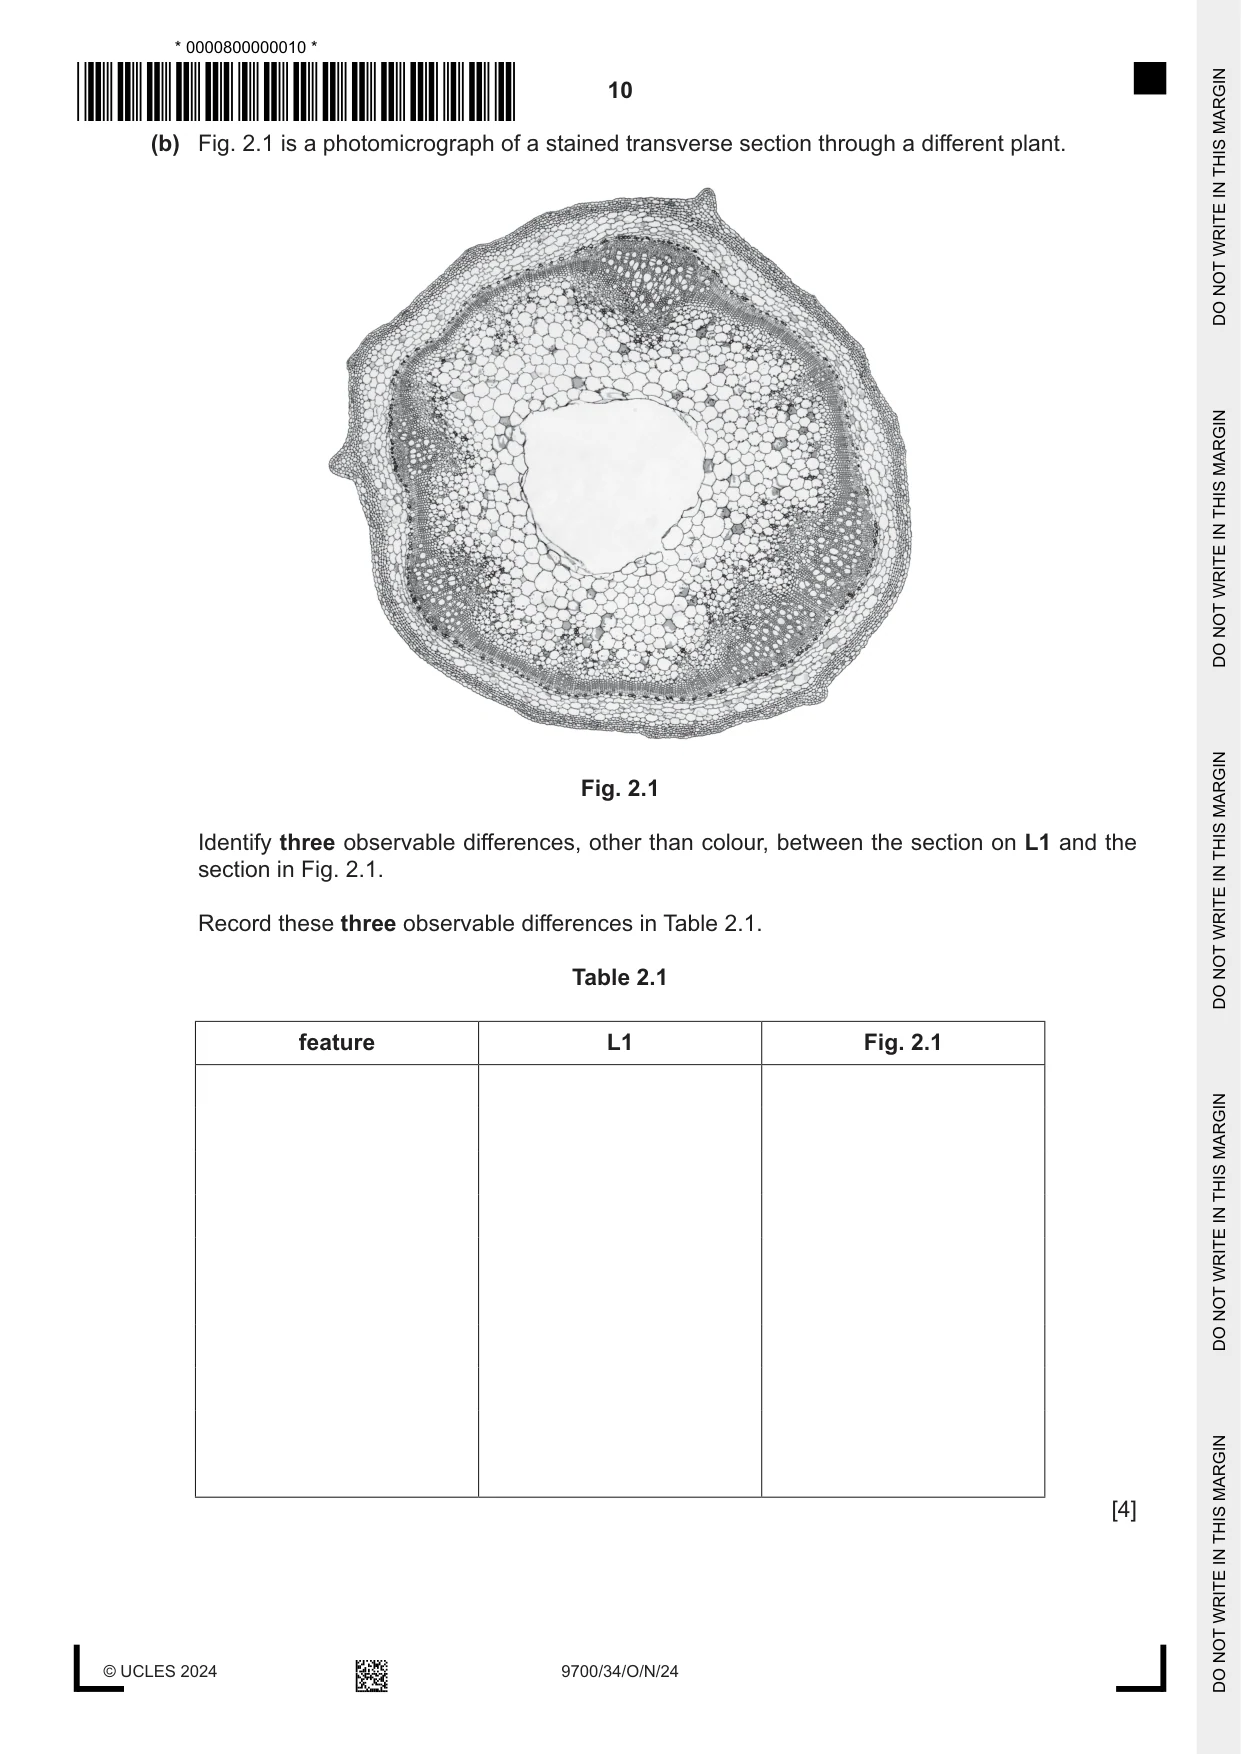
2 L1 is a slide of a stained transverse section through a plant root. (a) (i) Draw a large plan diagram of the whole section on L1. Use a sharp pencil. Use one ruled label line and label to identify the endodermis. [5] (ii) Observe the epidermis of the root on L1 and the layer of cells beneath. Select a group of four adjacent cells. This group must include two cells from the epidermis and two cells from below the epidermis. Each cell must touch at least two of the other cells. • Make a large drawing of this group of four cells. • Use one ruled label line and label to identify the cell wall of one epidermis cell. [5] (b) Fig. 2.1 is a photomicrograph of a stained transverse section through a different plant. Fig. 2.1 Identify three observable differences, other than colour, between the section on L1 and the section in Fig. 2.1. Record these three observable differences in Table 2.1. Table 2.1 feature L1 Fig. 2.1 [4]
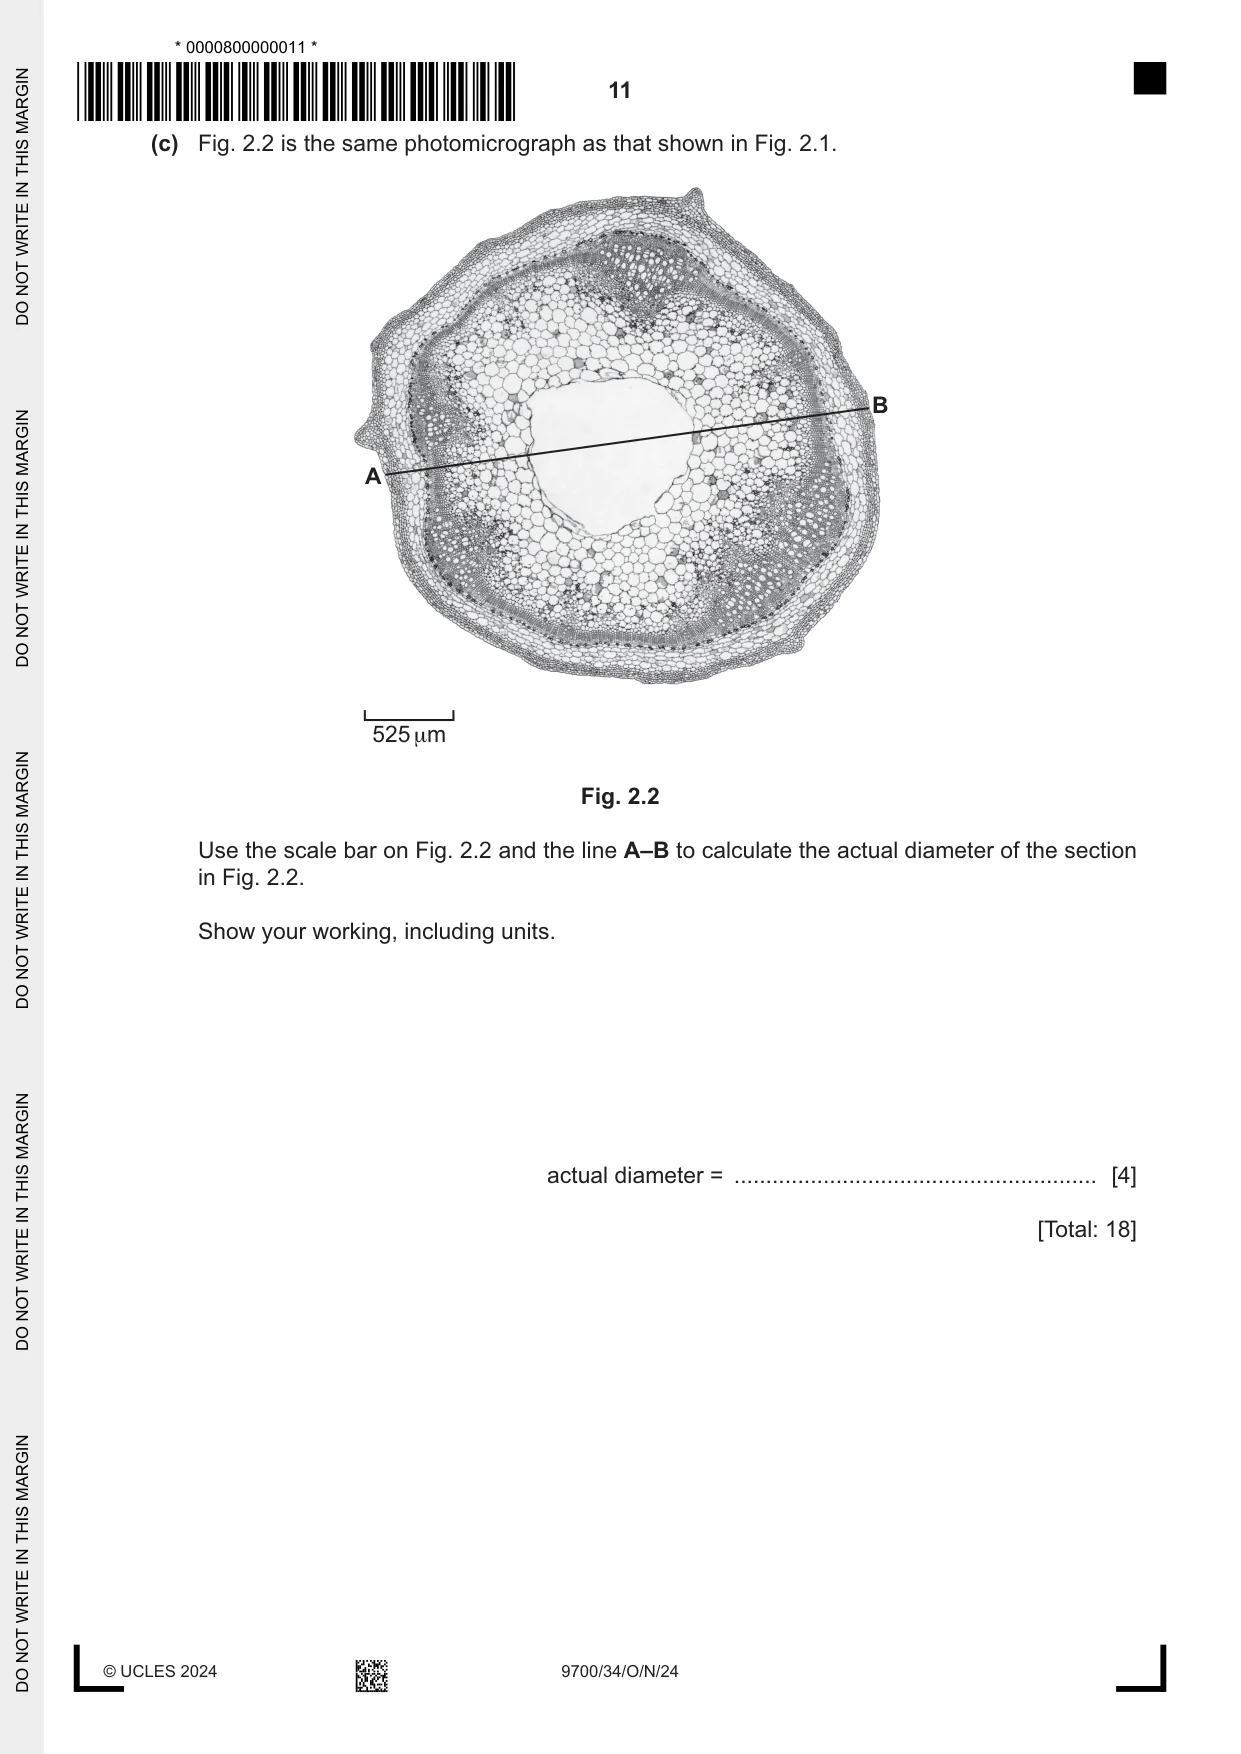
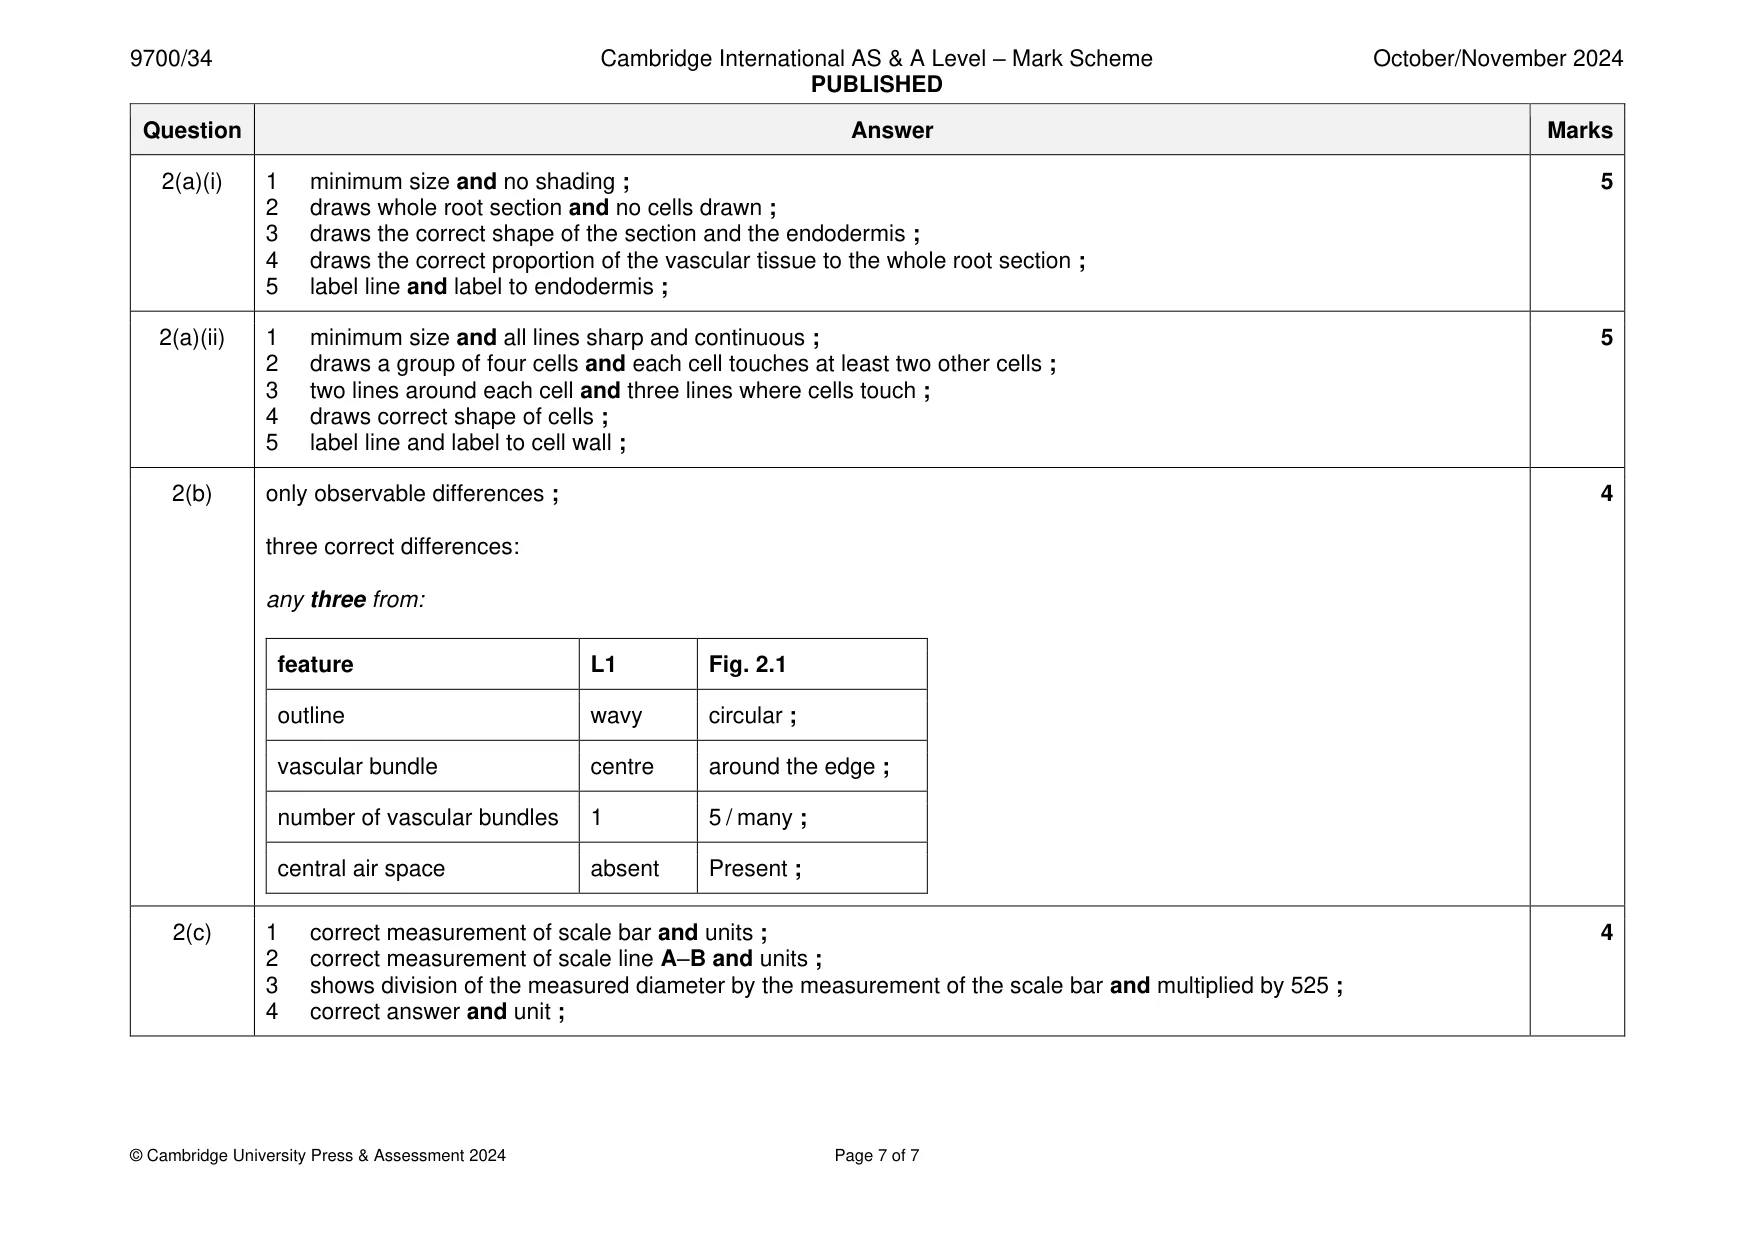
Mark scheme: 2(a)(i) 1 minimum size and no shading ; 5 2 draws whole root section and no cells drawn ; 3 draws the correct shape of the section and the endodermis ; 4 draws the correct proportion of the vascular tissue to the whole root section ; 5 label line and label to endodermis ; 2(a)(ii) 1 minimum size and all lines sharp and continuous ; 5 2 draws a group of four cells and each cell touches at least two other cells ; 3 two lines around each cell and three lines where cells touch ; 4 draws correct shape of cells ; 5 label line and label to cell wall ; 2(b) only observable differences ; 4 three correct differences: any three from: feature L1 Fig. 2.1 outline wavy circular ; vascular bundle centre around the edge ; number of vascular bundles 1 5 / many ; central air space absent Present ; 2(c) 1 correct measurement of scale bar and units ; 4 2 correct measurement of scale line A–B and units ; 3 shows division of the measured diameter by the measurement of the scale bar and multiplied by 525 ; 4 correct answer and unit ;
More questions on Cells as the basic units of living organisms
What was in this paper
The subtopics covered by these 2 questions, and how many questions each got. Open one in a new tab to see every Cambridge question on it.
What you needed in this session
Cambridge’s own grade thresholds for 2024 Oct/Nov, Paper 3 · Variant 4. A higher threshold means an easier paper — the bar moves with how the cohort did.