Cambridge A Level Biology 9700 — 2025 Oct/Nov Paper 3 · Variant 4
9700/34/O/N/25 · 2 questions · 40 marks · 120 min
The question paper and its mark scheme, free to read here and free to download. This is Cambridge’s own paper, exactly as it was sat.
Question paper16 pages




Mark scheme10 pages
Answers below. Sit the paper first if you are practising.

Questions as text
Q1 · A plant produces sugars in its leaves
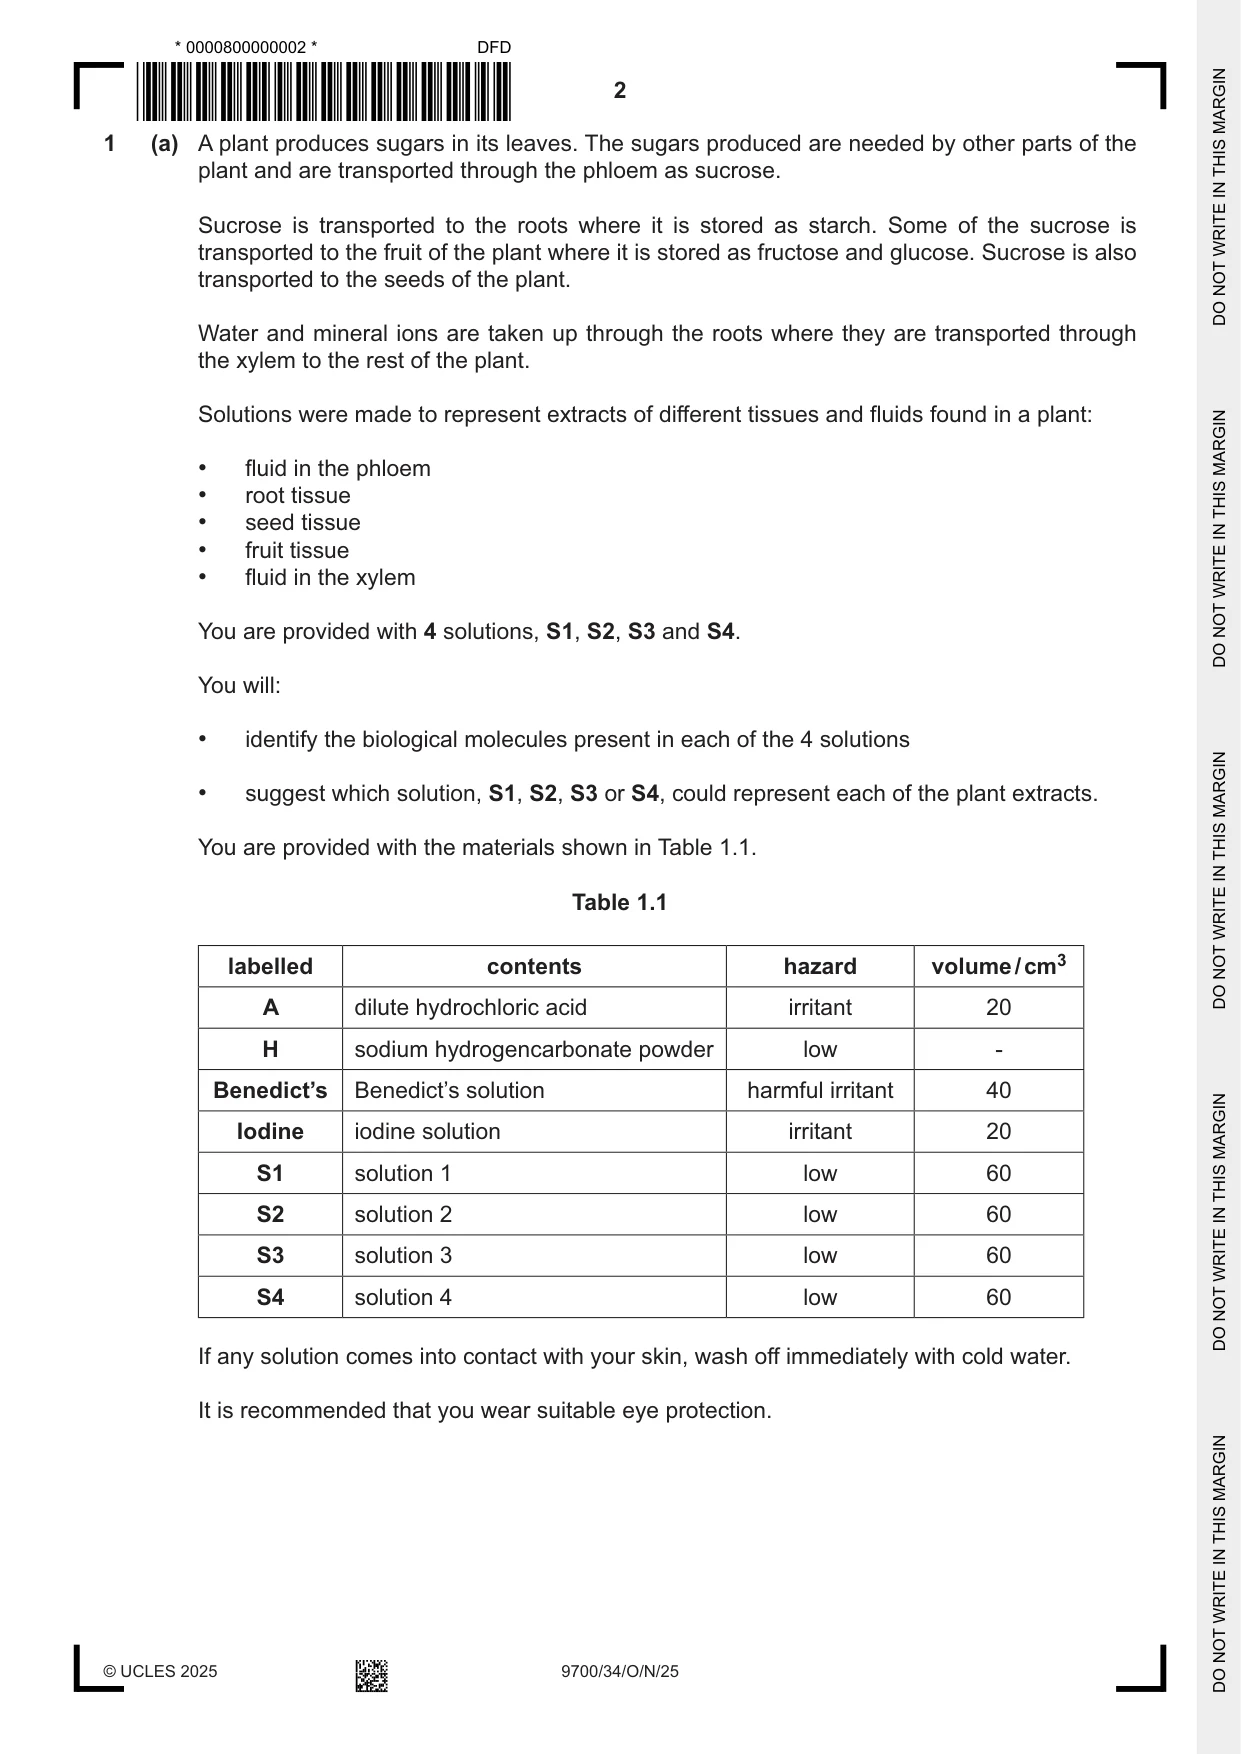
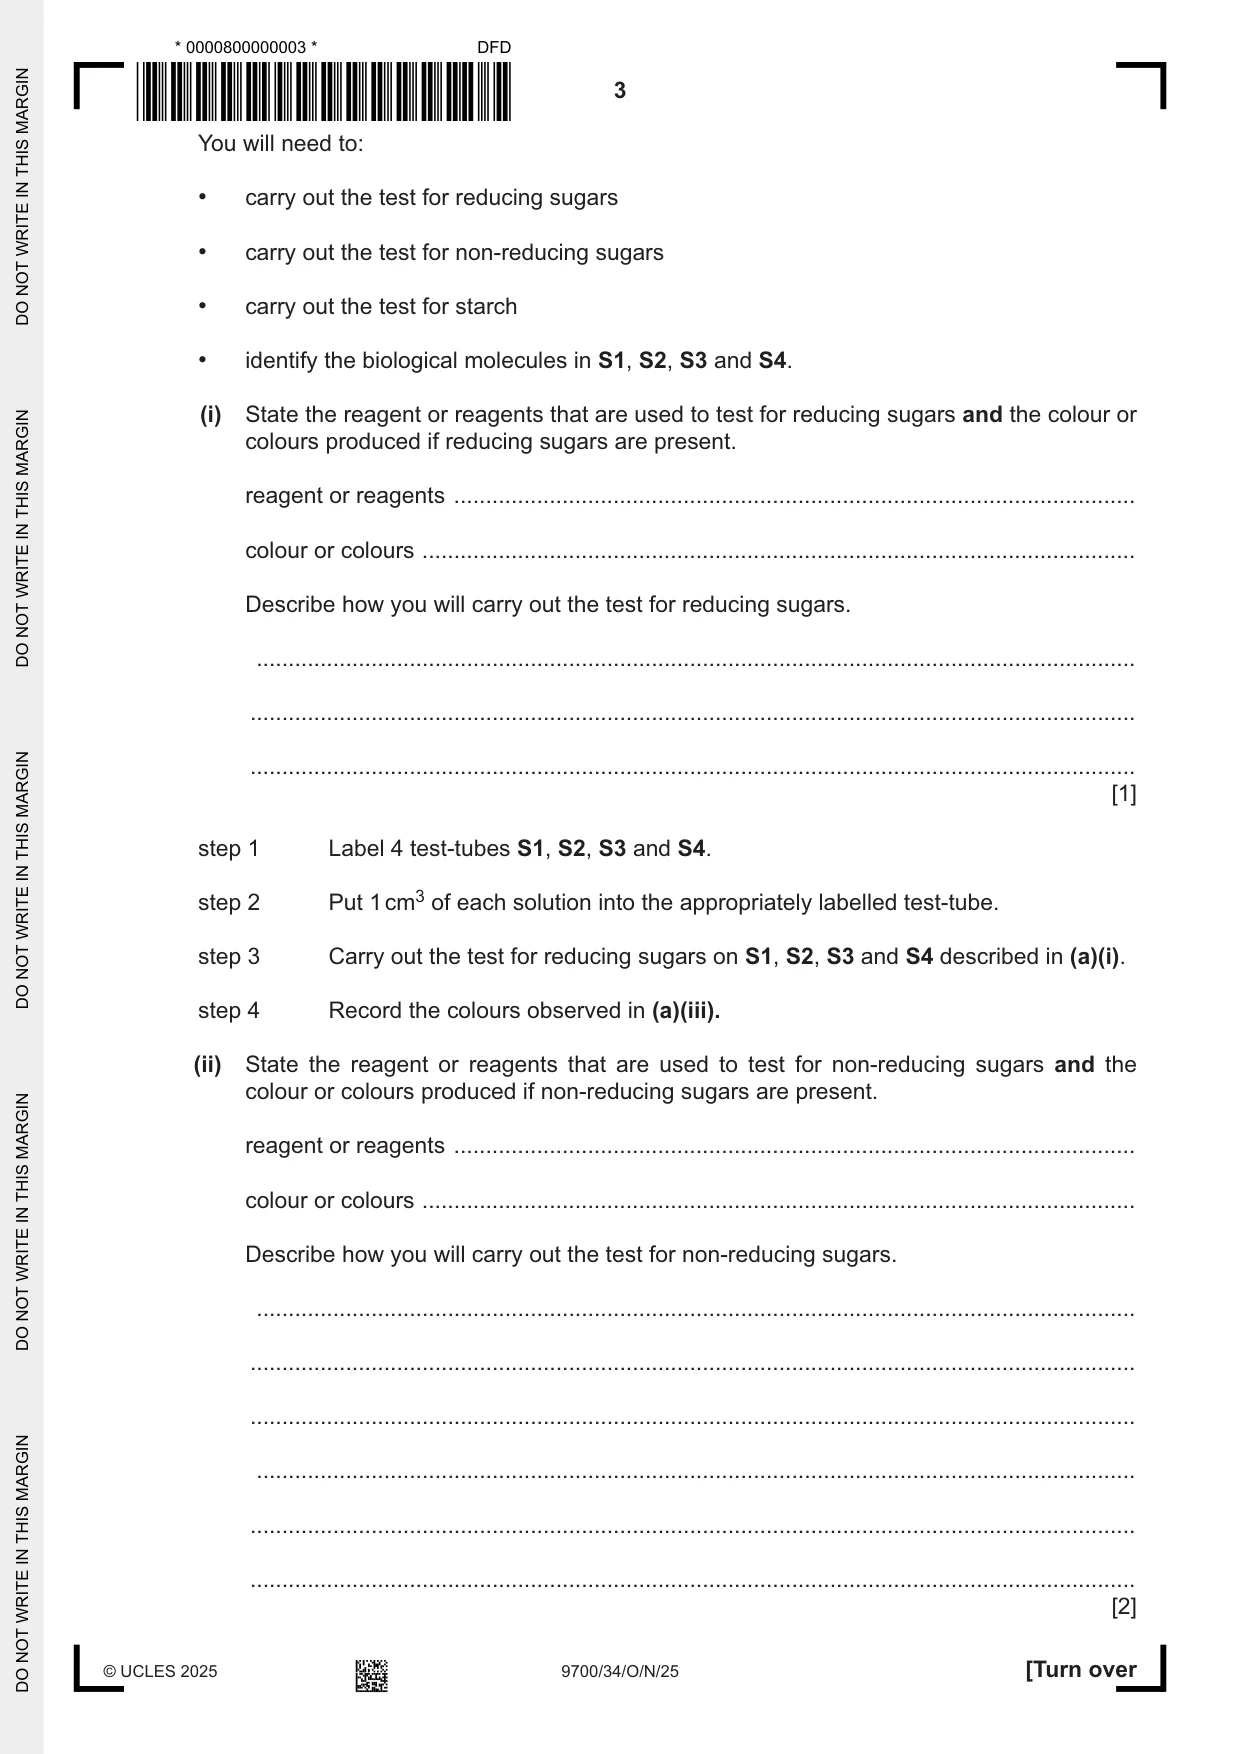
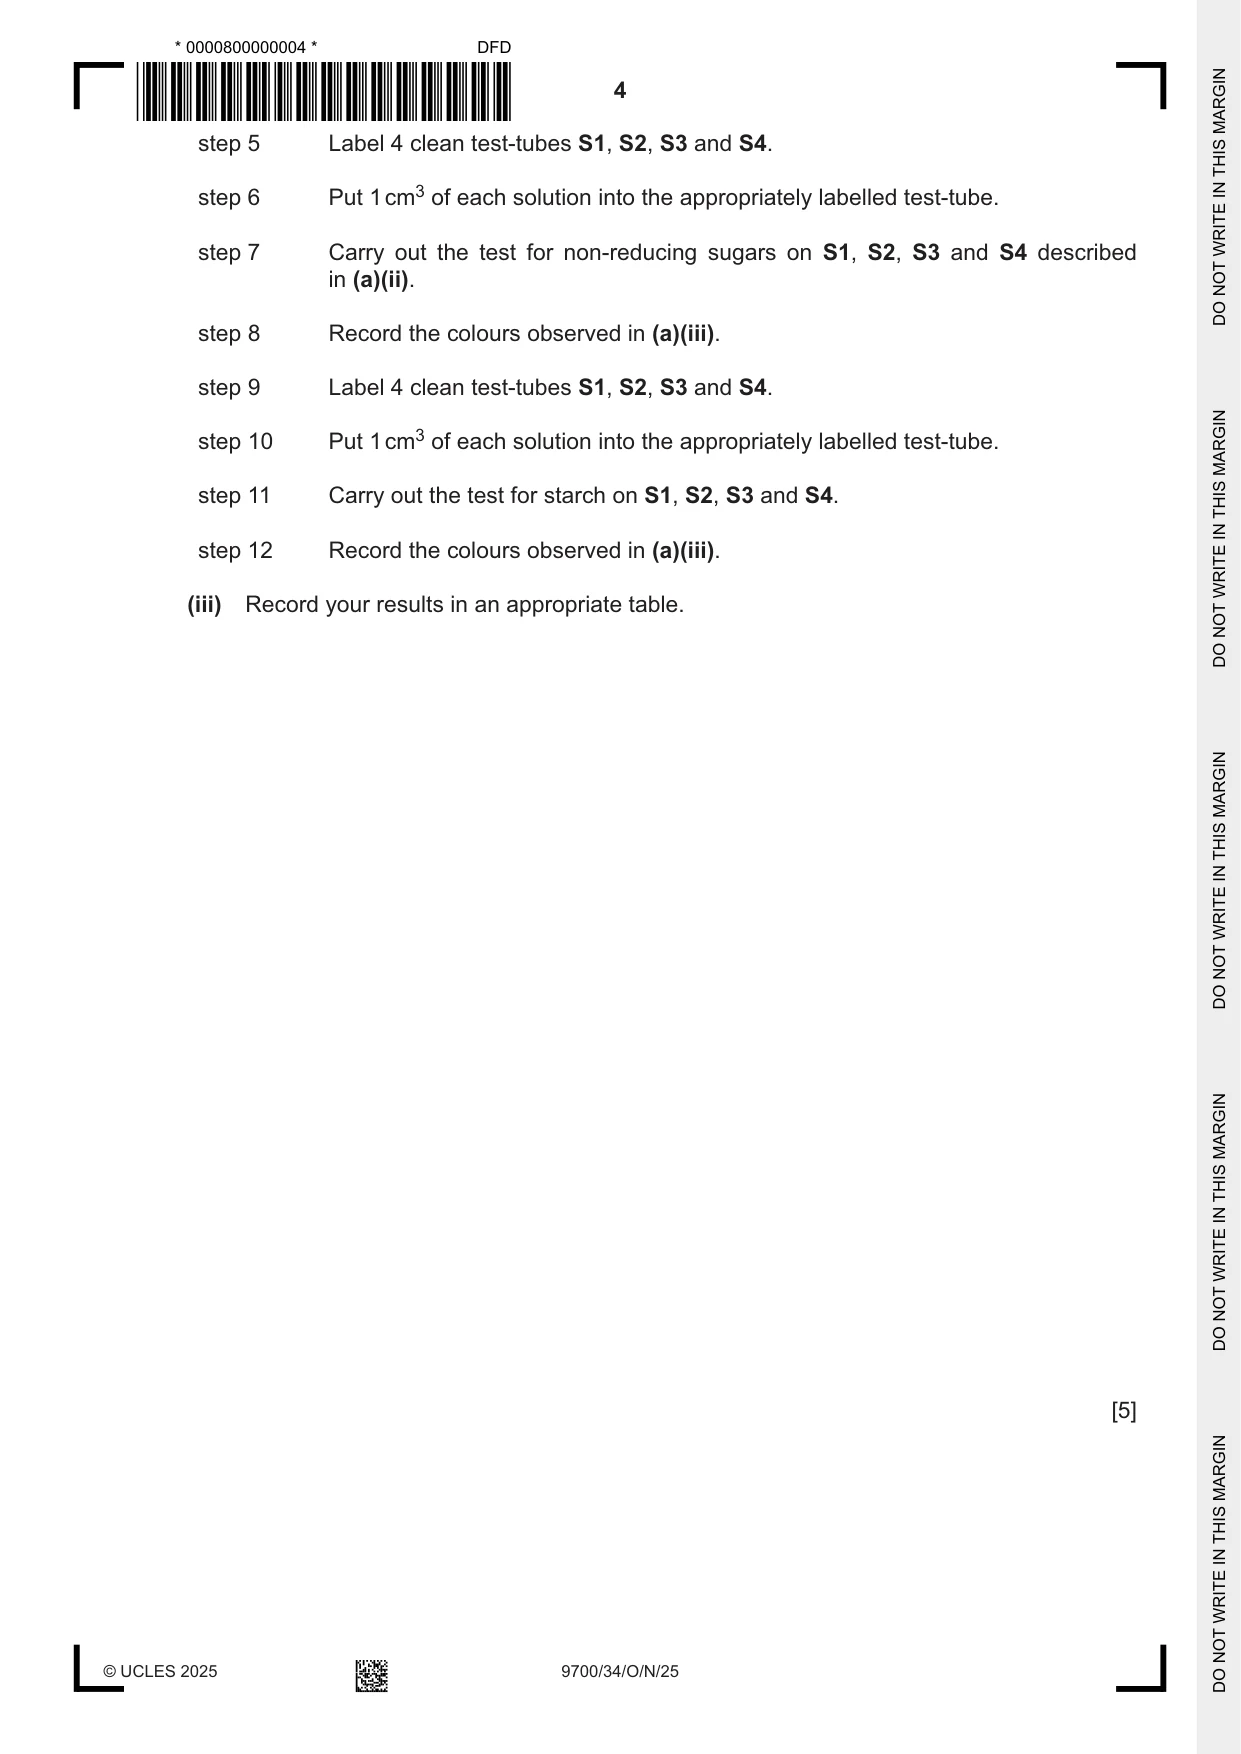
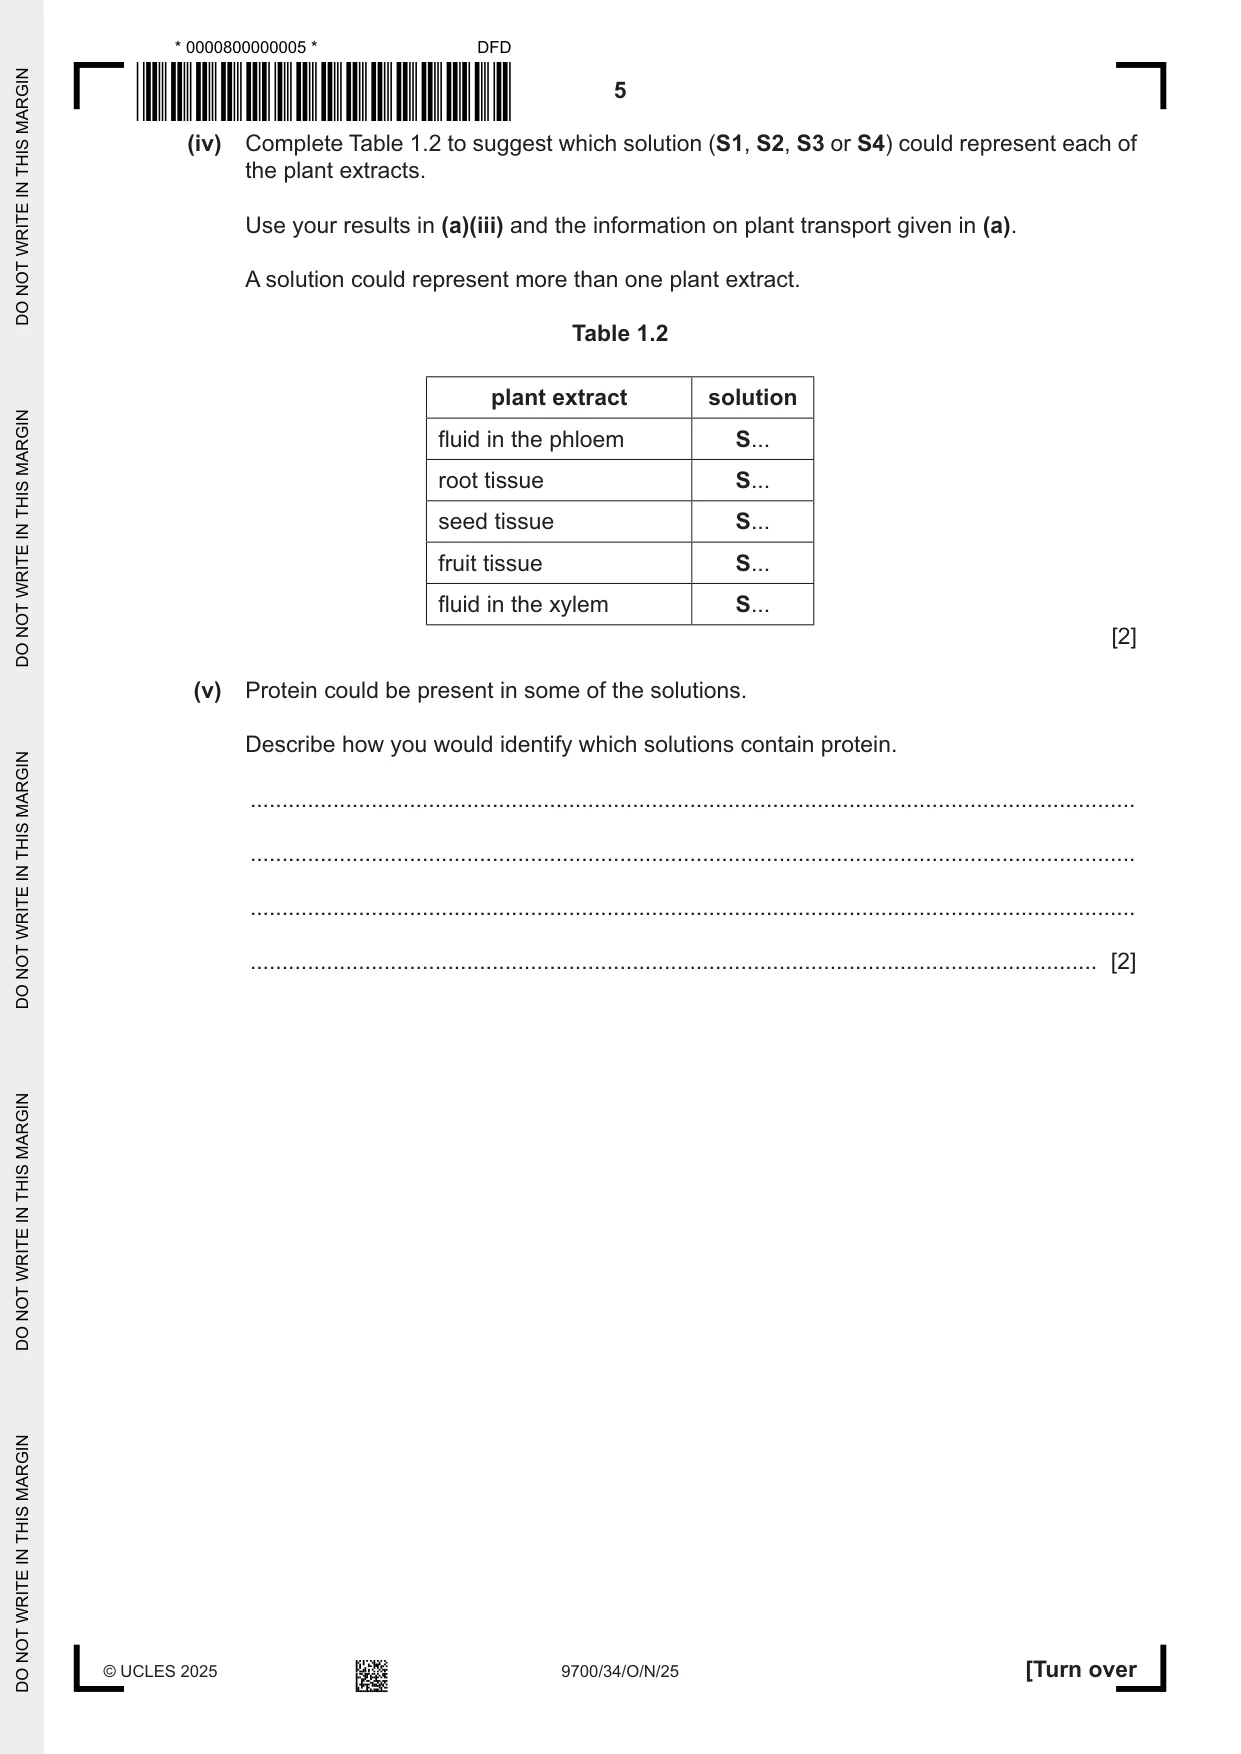
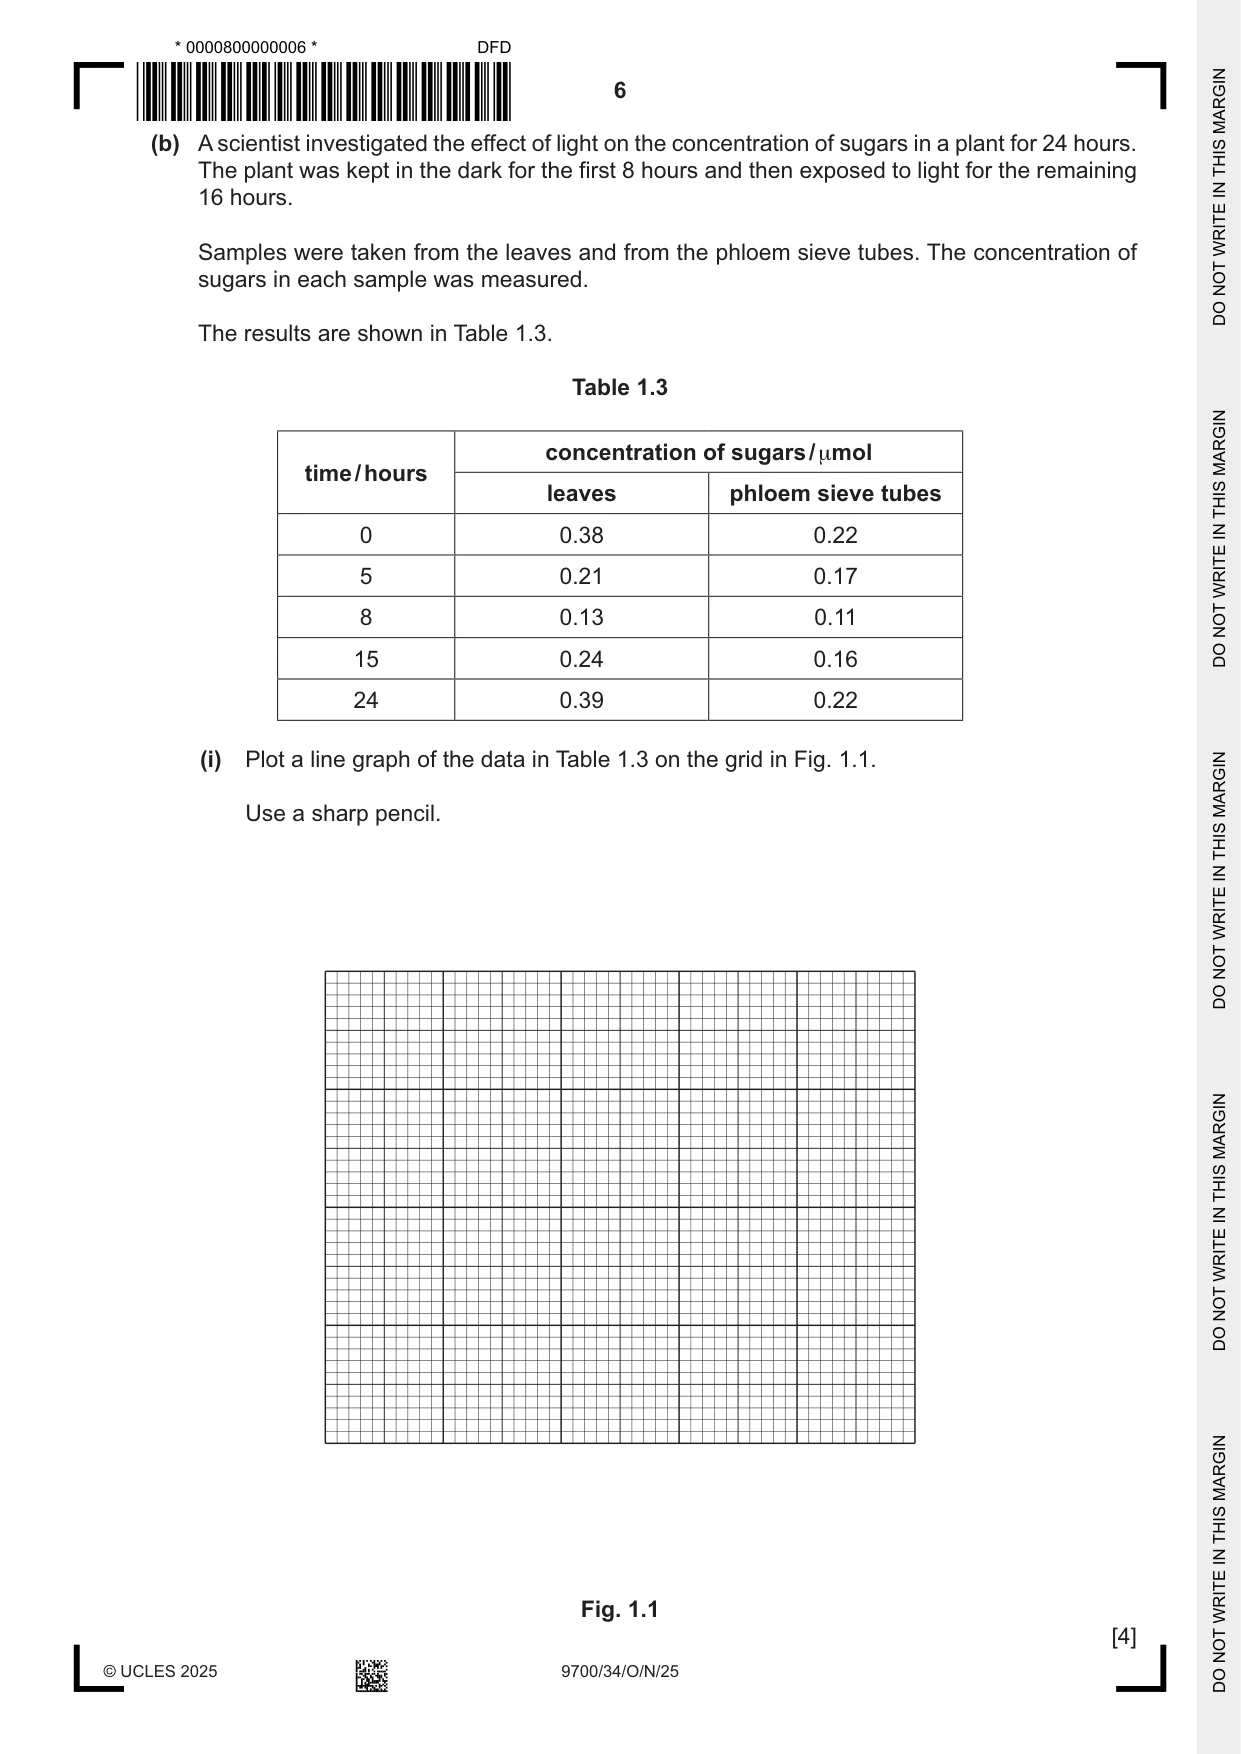
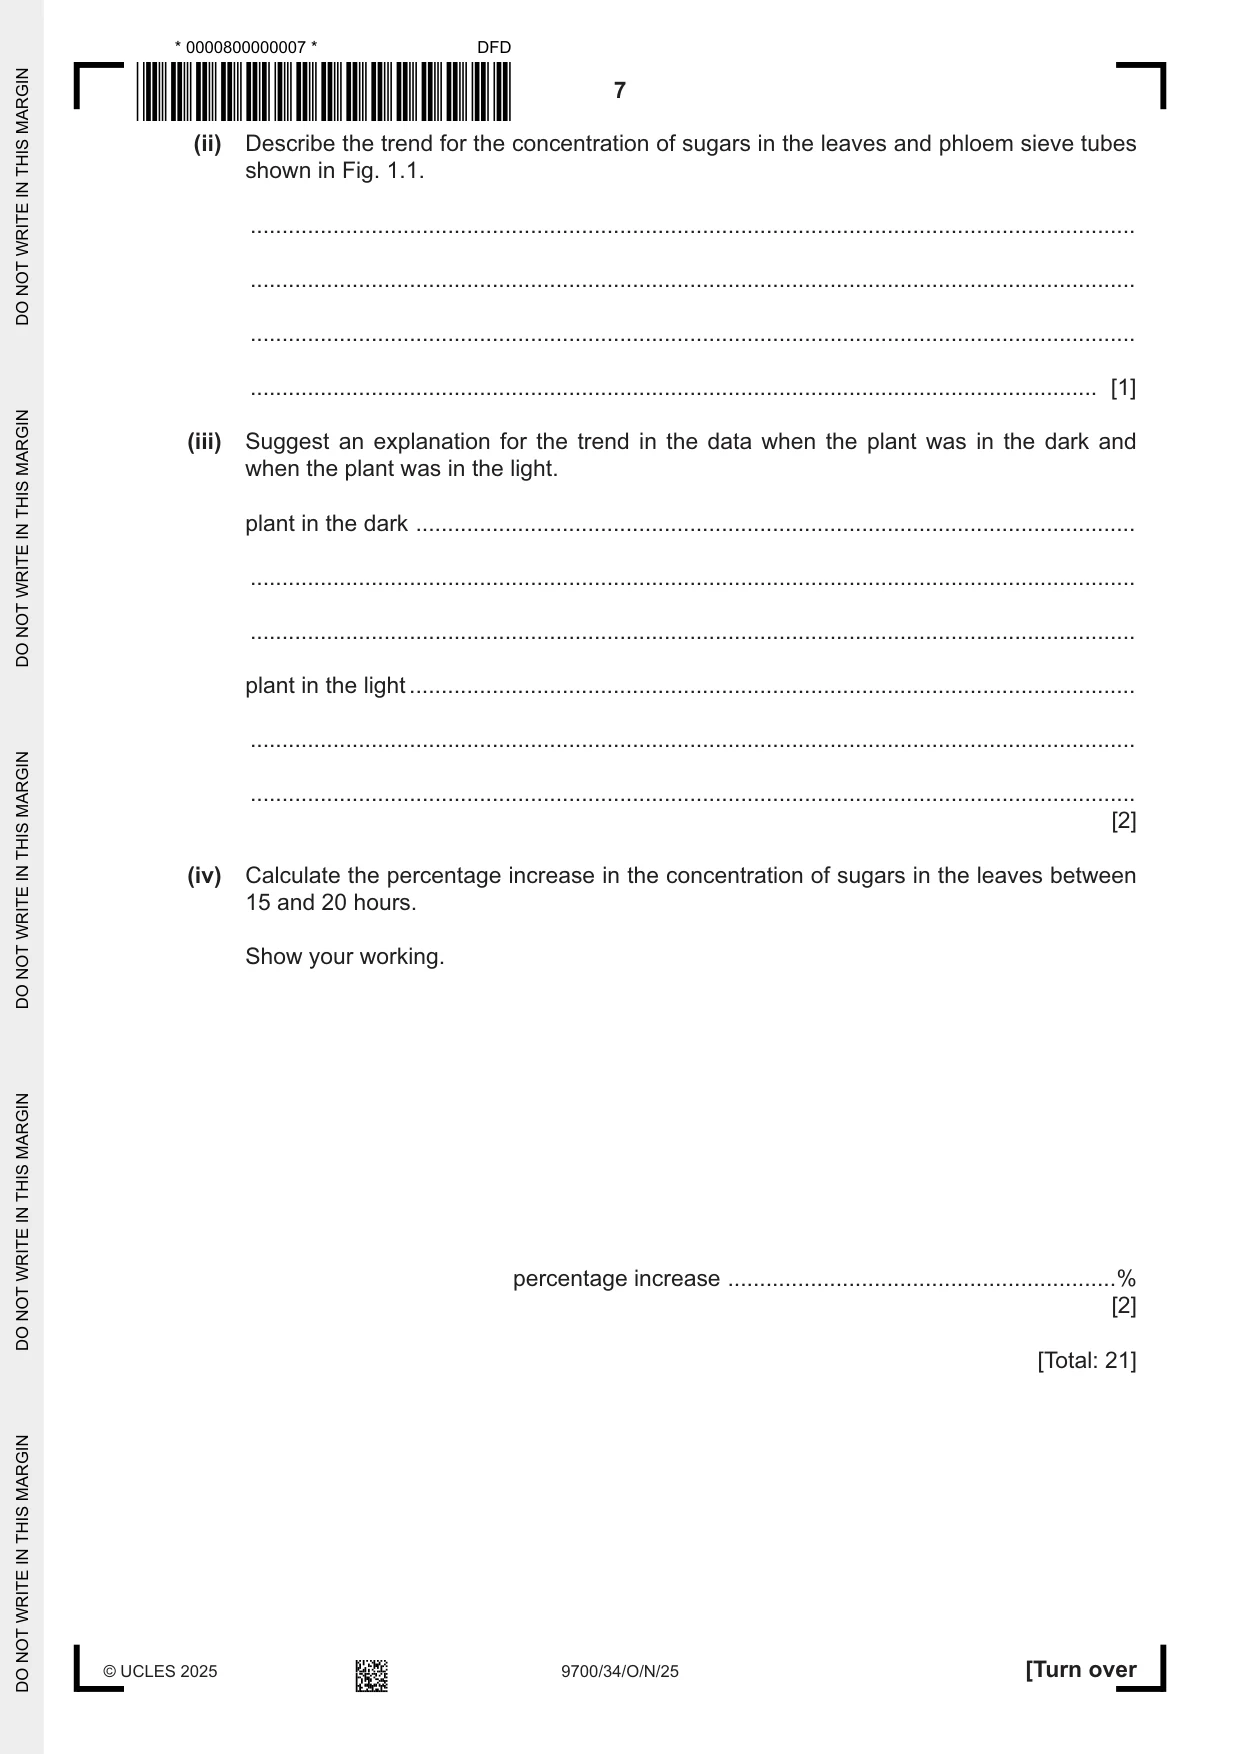
1 (a) A plant produces sugars in its leaves. The sugars produced are needed by other parts of the plant and are transported through the phloem as sucrose. Sucrose is transported to the roots where it is stored as starch. Some of the sucrose is transported to the fruit of the plant where it is stored as fructose and glucose. Sucrose is also transported to the seeds of the plant. Water and mineral ions are taken up through the roots where they are transported through the xylem to the rest of the plant. Solutions were made to represent extracts of different tissues and fluids found in a plant: • fluid in the phloem • root tissue • seed tissue • fruit tissue • fluid in the xylem You are provided with 4 solutions, S1, S2, S3 and S4. You will: • identify the biological molecules present in each of the 4 solutions • suggest which solution, S1, S2, S3 or S4, could represent each of the plant extracts. You are provided with the materials shown in Table 1.1. Table 1.1 labelled contents hazard volume / cm3 A dilute hydrochloric acid irritant 20 H sodium hydrogencarbonate powder low ‑ Benedict’s Benedict’s solution harmful irritant 40 Iodine iodine solution irritant 20 S1 solution 1 low 60 S2 solution 2 low 60 S3 solution 3 low 60 S4 solution 4 low 60 If any solution comes into contact with your skin, wash off immediately with cold water. It is recommended that you wear suitable eye protection. You will need to: • carry out the test for reducing sugars • carry out the test for non‑reducing sugars • carry out the test for starch • identify the biological molecules in S1, S2, S3 and S4. (i) State the reagent or reagents that are used to test for reducing sugars and the colour or colours produced if reducing sugars are present. reagent or reagents ........................................................................................................... colour or colours ................................................................................................................ Describe how you will carry out the test for reducing sugars. .......................................................................................................................................... ........................................................................................................................................... ........................................................................................................................................... [1] step 1 Label 4 test‑tubes S1, S2, S3 and S4. step 2 Put 1 cm3 of each solution into the appropriately labelled test‑tube. step 3 Carry out the test for reducing sugars on S1, S2, S3 and S4 described in (a)(i). step 4 Record the colours observed in (a)(iii). (ii) State the reagent or reagents that are used to test for non‑reducing sugars and the colour or colours produced if non‑reducing sugars are present. reagent or reagents ........................................................................................................... colour or colours ................................................................................................................ Describe how you will carry out the test for non‑reducing sugars. .......................................................................................................................................... ........................................................................................................................................... ........................................................................................................................................... .......................................................................................................................................... ........................................................................................................................................... ........................................................................................................................................... [2] step 5 Label 4 clean test‑tubes S1, S2, S3 and S4. step 6 Put 1 cm3 of each solution into the appropriately labelled test‑tube. step 7 Carry out the test for non‑reducing sugars on S1, S2, S3 and S4 described in (a)(ii). step 8 Record the colours observed in (a)(iii). step 9 Label 4 clean test‑tubes S1, S2, S3 and S4. step 10 Put 1 cm3 of each solution into the appropriately labelled test‑tube. step 11 Carry out the test for starch on S1, S2, S3 and S4. step 12 Record the colours observed in (a)(iii). (iii) Record your results in an appropriate table. [5] (iv) Complete Table 1.2 to suggest which solution (S1, S2, S3 or S4) could represent each of the plant extracts. Use your results in (a)(iii) and the information on plant transport given in (a). A solution could represent more than one plant extract. Table 1.2 plant extract solution fluid in the phloem S... root tissue S... seed tissue S... fruit tissue S... fluid in the xylem S... [2] (v) Protein could be present in some of the solutions. Describe how you would identify which solutions contain protein. ........................................................................................................................................... ........................................................................................................................................... ........................................................................................................................................... ..................................................................................................................................... [2] (b) A scientist investigated the effect of light on the concentration of sugars in a plant for 24 hours. The plant was kept in the dark for the first 8 hours and then exposed to light for the remaining 16 hours. Samples were taken from the leaves and from the phloem sieve tubes. The concentration of sugars in each sample was measured. The results are shown in Table 1.3. Table 1.3 concentration of sugars / µmol time / hours leaves phloem sieve tubes 0 0.38 0.22 5 0.21 0.17 8 0.13 0.11 15 0.24 0.16 24 0.39 0.22 (i) Plot a line graph of the data in Table 1.3 on the grid in Fig. 1.1. Use a sharp pencil. Fig. 1.1 [4] (ii) Describe the trend for the concentration of sugars in the leaves and phloem sieve tubes shown in Fig. 1.1. ........................................................................................................................................... ........................................................................................................................................... ........................................................................................................................................... ..................................................................................................................................... [1] (iii) Suggest an explanation for the trend in the data when the plant was in the dark and when the plant was in the light. plant in the dark ................................................................................................................. ........................................................................................................................................... ........................................................................................................................................... plant in the light .................................................................................................................. ........................................................................................................................................... ........................................................................................................................................... [2] (iv) Calculate the percentage increase in the concentration of sugars in the leaves between 15 and 20 hours. Show your working. percentage increase .............................................................% [2] [Total: 21]
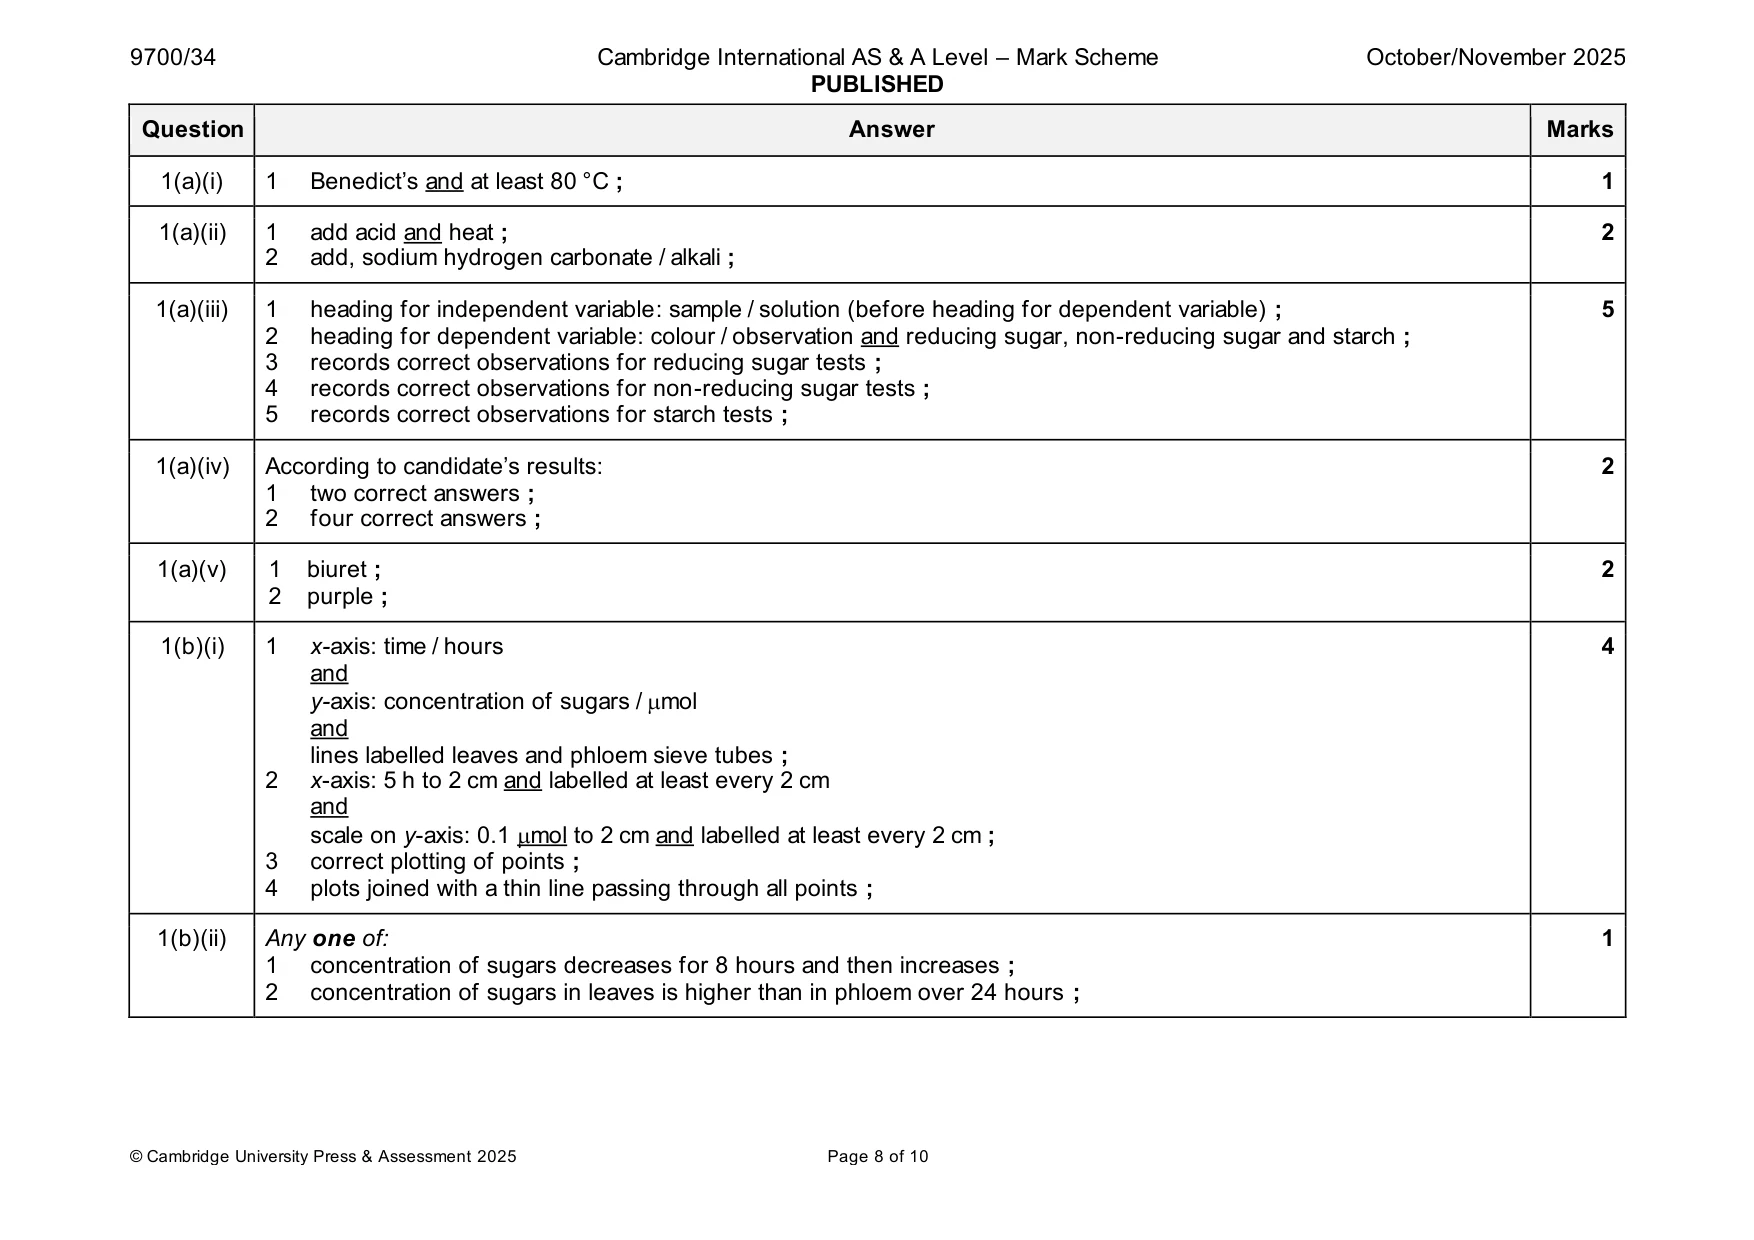
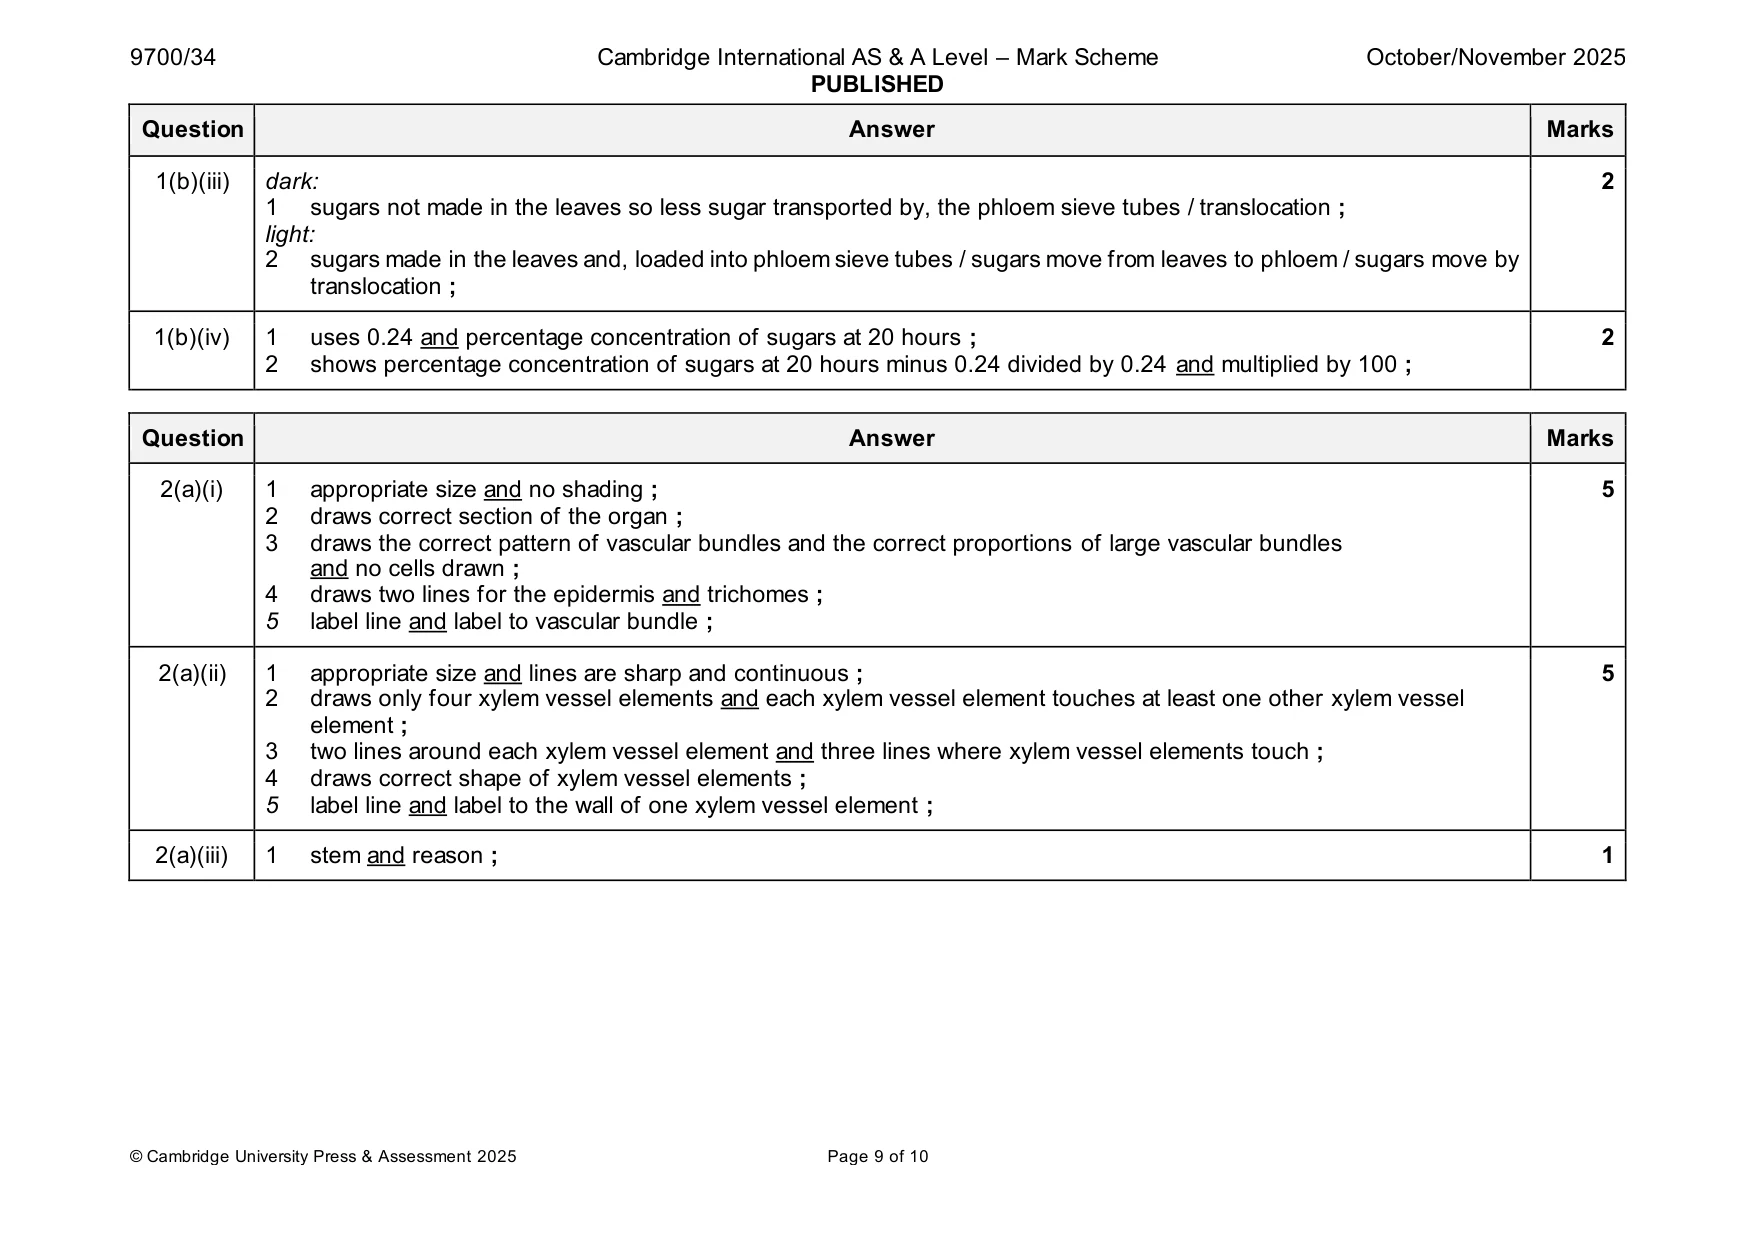
Mark scheme: Question Answer Marks 1(a)(i) 1 Benedict’s and at least 80 °C ; 1 1(a)(ii) 1 add acid and heat ; 2 2 add, sodium hydrogen carbonate / alkali ; 1(a)(iii) 1 heading for independent variable: sample / solution (before heading for dependent variable) ; 5 2 heading for dependent variable: colour / observation and reducing sugar, non-reducing sugar and starch ; 3 records correct observations for reducing sugar tests ; 4 records correct observations for non-reducing sugar tests ; 5 records correct observations for starch tests ; 1(a)(iv) According to candidate’s results: 2 1 two correct answers ; 2 four correct answers ; 1(a)(v) 1 biuret ; 2 2 purple ; 1(b)(i) 1 x-axis: time / hours 4 and y-axis: concentration of sugars / mol and lines labelled leaves and phloem sieve tubes ; 2 x-axis: 5 h to 2 cm and labelled at least every 2 cm and scale on y-axis: 0.1 mol to 2 cm and labelled at least every 2 cm ; 3 correct plotting of points ; 4 plots joined with a thin line passing through all points ; 1(b)(ii) Any one of: 1 1 concentration of sugars decreases for 8 hours and then increases ; 2 concentration of sugars in leaves is higher than in phloem over 24 hours ; 1(b)(iii) dark: 2 1 sugars not made in the leaves so less sugar transported by, the phloem sieve tubes / translocation ; light: 2 sugars made in the leaves and, loaded into phloem sieve tubes / sugars move from leaves to phloem / sugars move by translocation ; 1(b)(iv) 1 uses 0.24 and percentage concentration of sugars at 20 hours ; 2 2 shows percentage concentration of sugars at 20 hours minus 0.24 divided by 0.24 and multiplied by 100 ;
Q2 · L1 is a slide of a stained transverse section through a plant organ
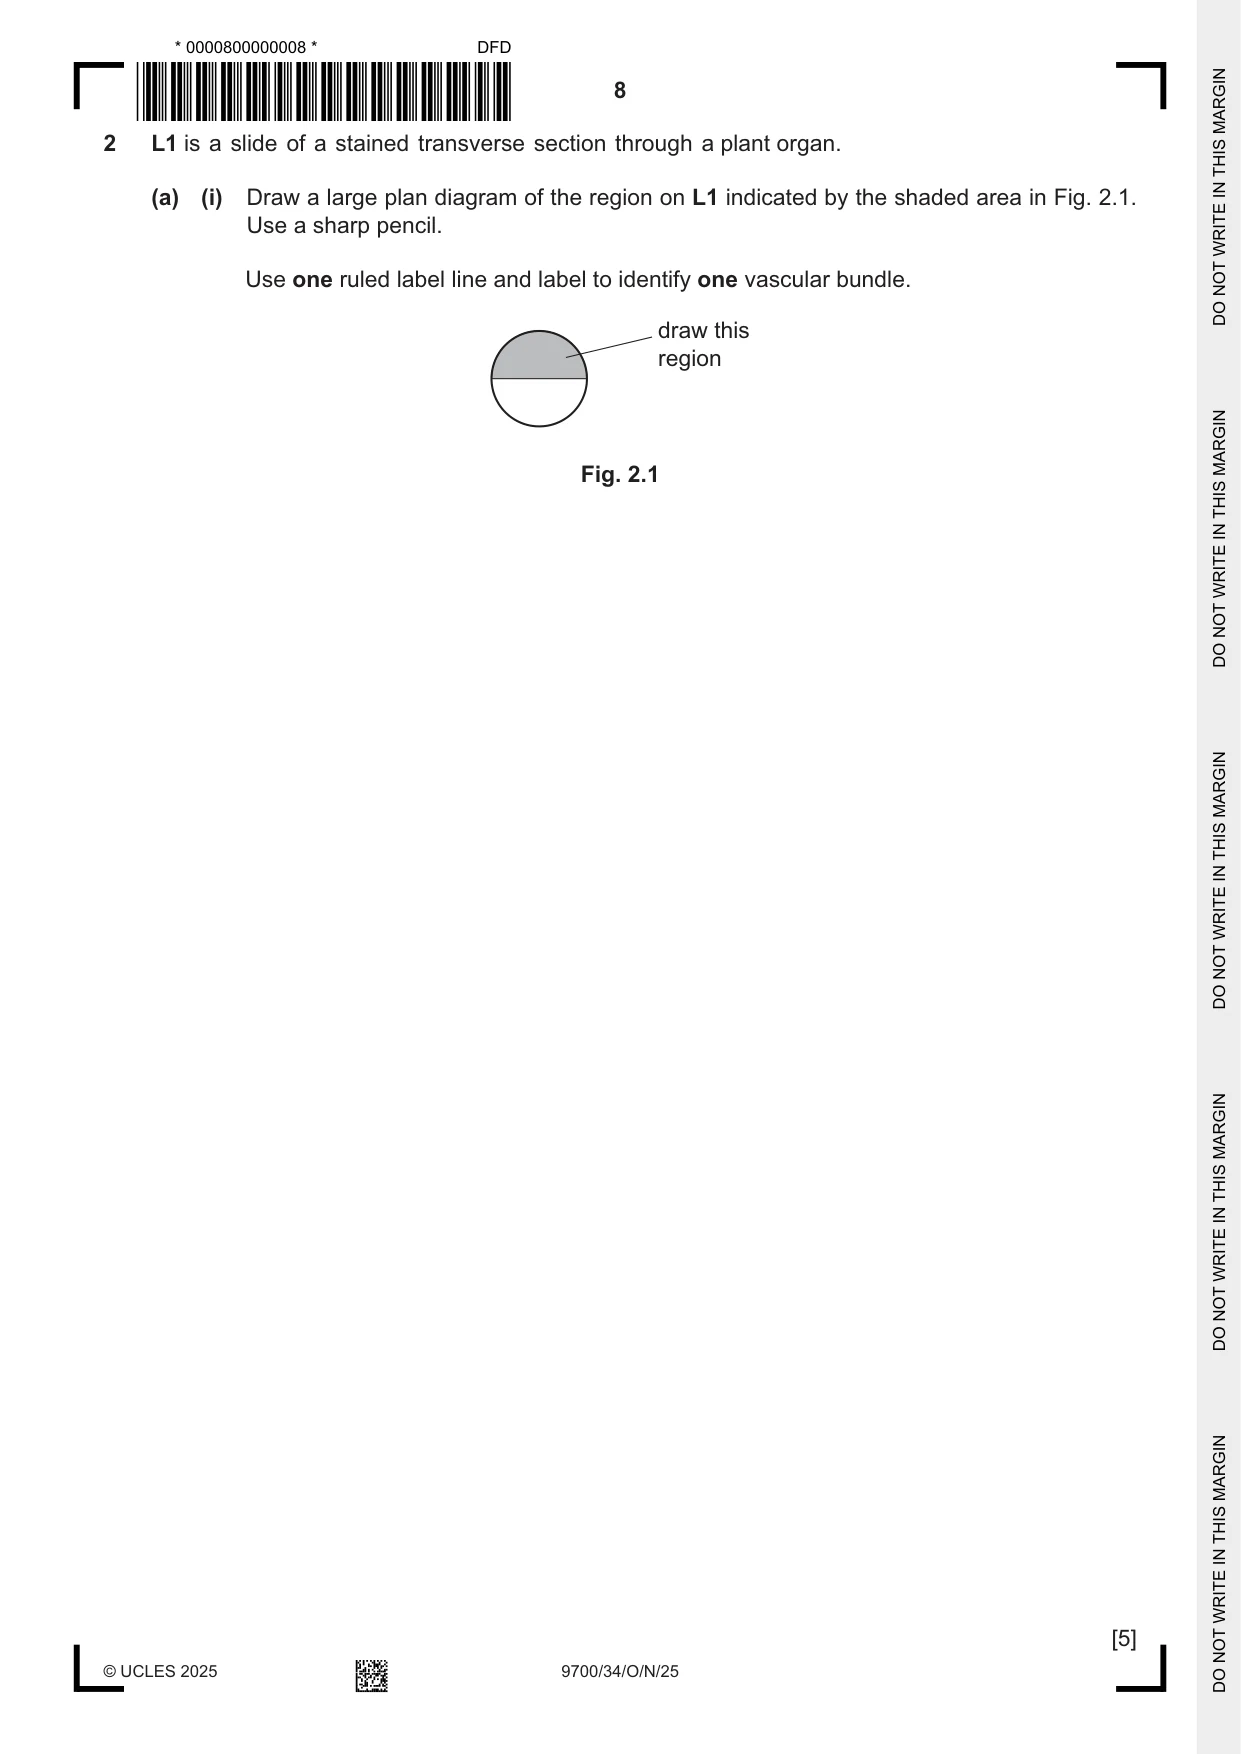
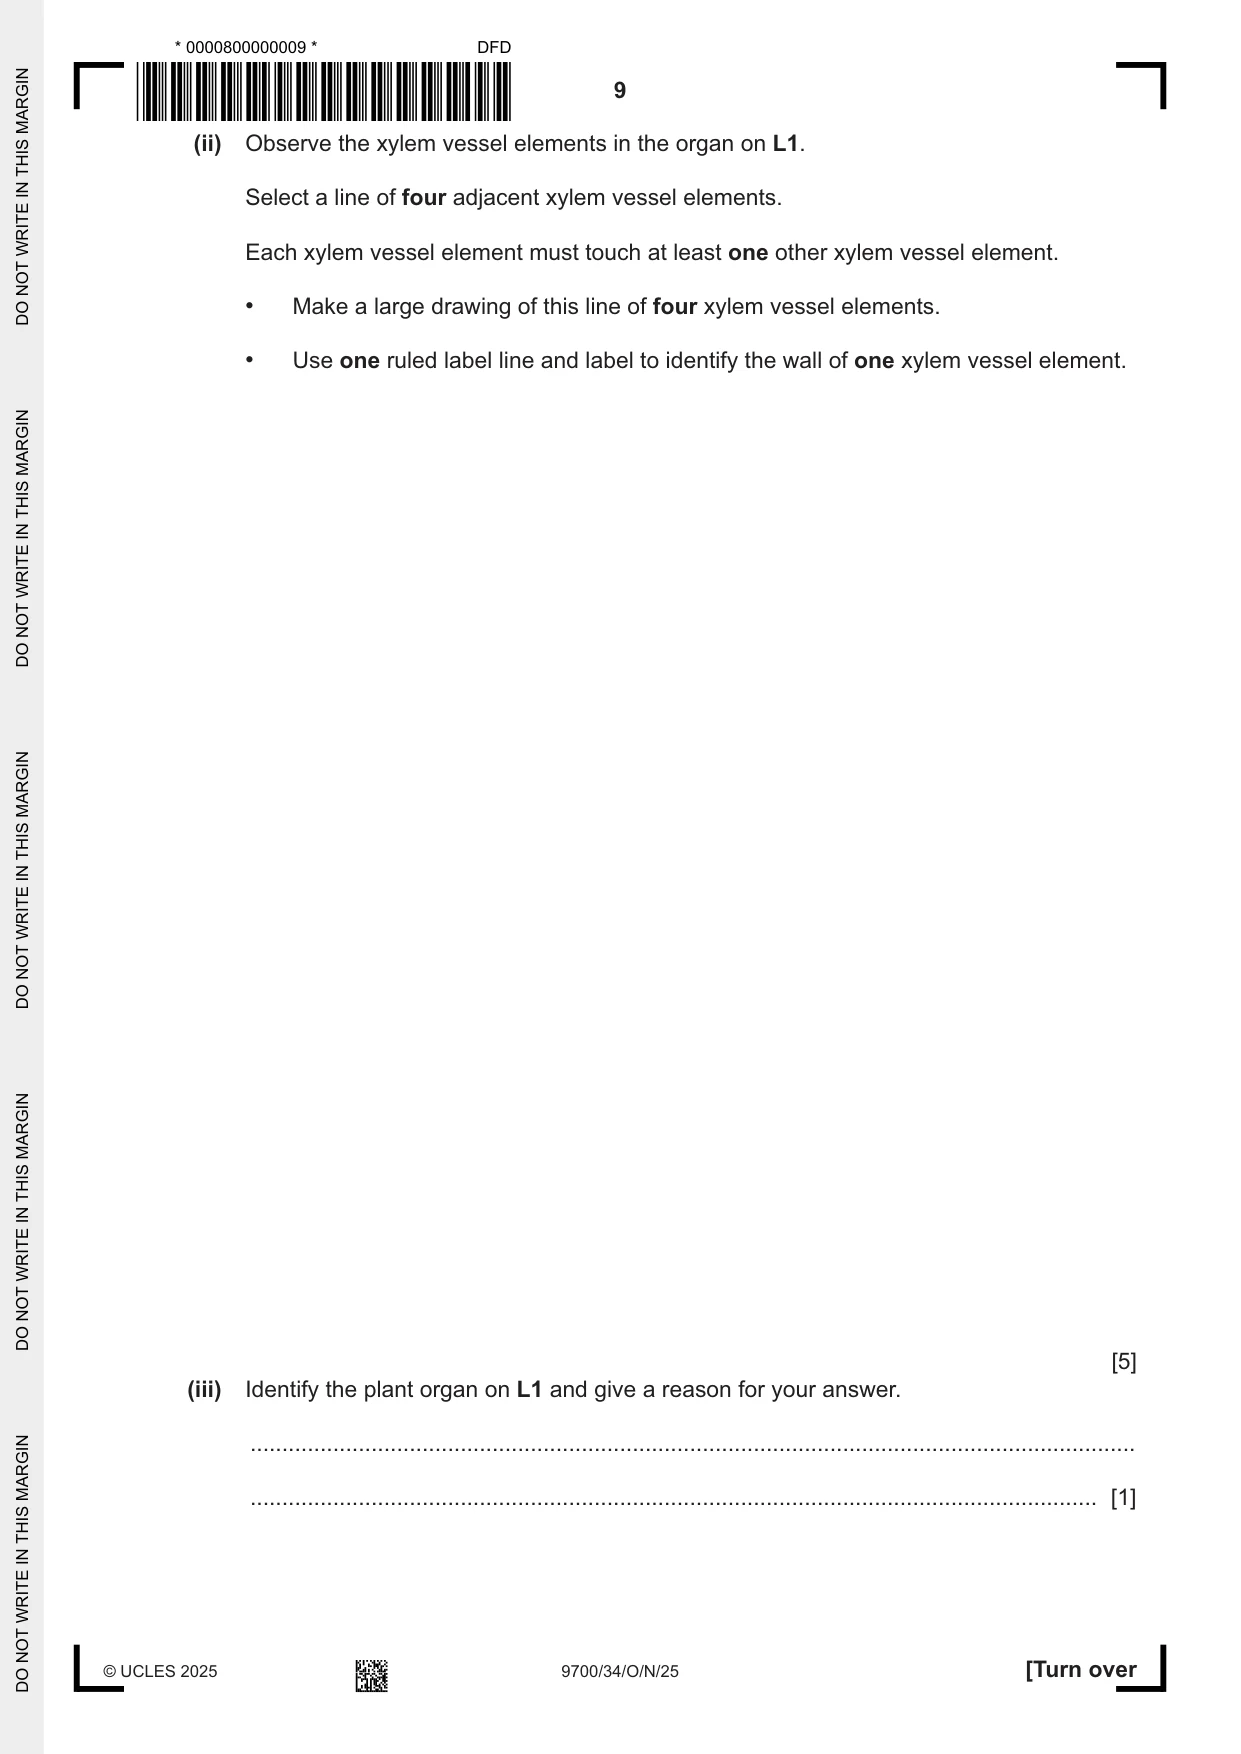
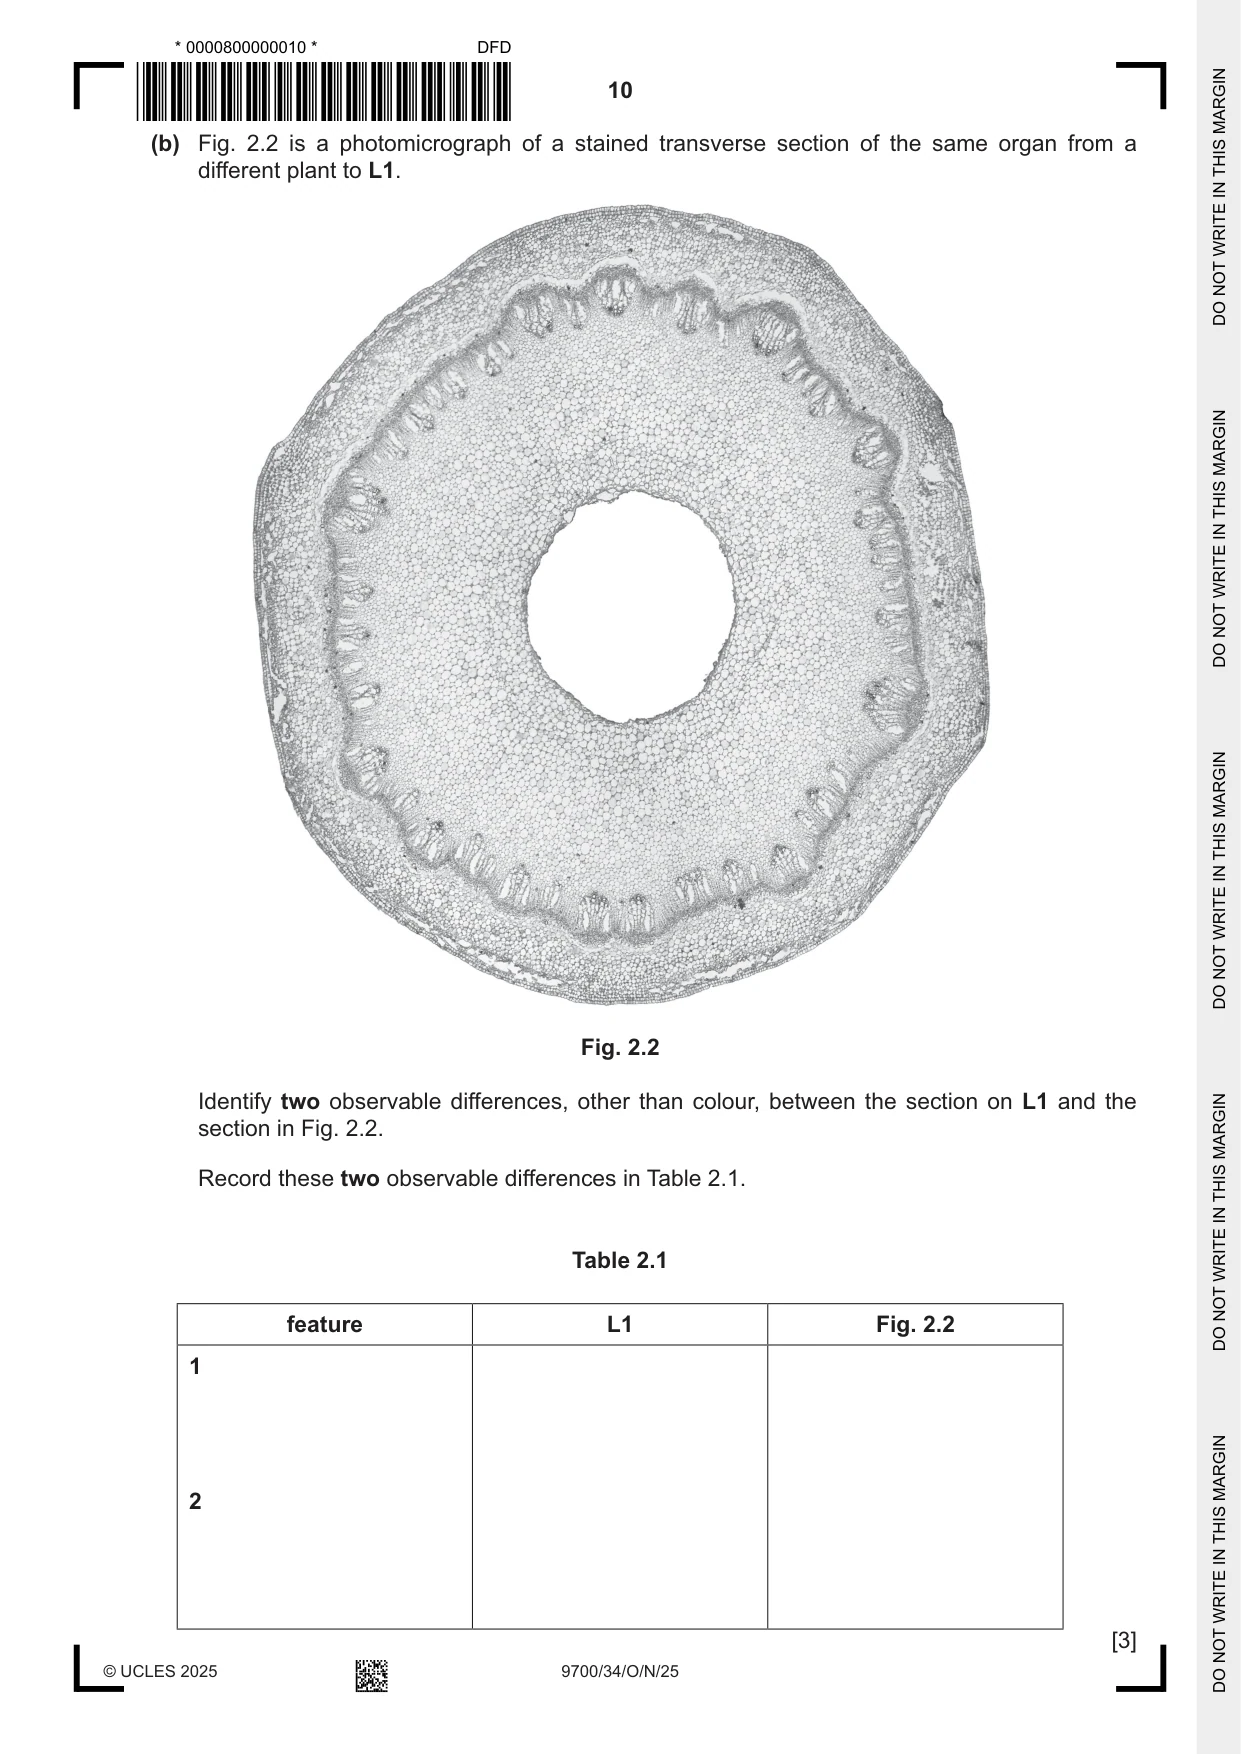
2 L1 is a slide of a stained transverse section through a plant organ. (a) (i) Draw a large plan diagram of the region on L1 indicated by the shaded area in Fig. 2.1. Use a sharp pencil. Use one ruled label line and label to identify one vascular bundle. draw this region Fig. 2.1 [5] (ii) Observe the xylem vessel elements in the organ on L1. Select a line of four adjacent xylem vessel elements. Each xylem vessel element must touch at least one other xylem vessel element. • Make a large drawing of this line of four xylem vessel elements. • Use one ruled label line and label to identify the wall of one xylem vessel element. [5] (iii) Identify the plant organ on L1 and give a reason for your answer. ........................................................................................................................................... ..................................................................................................................................... [1] (b) Fig. 2.2 is a photomicrograph of a stained transverse section of the same organ from a different plant to L1. Fig. 2.2 Identify two observable differences, other than colour, between the section on L1 and the section in Fig. 2.2. Record these two observable differences in Table 2.1. Table 2.1 feature L1 Fig. 2.2
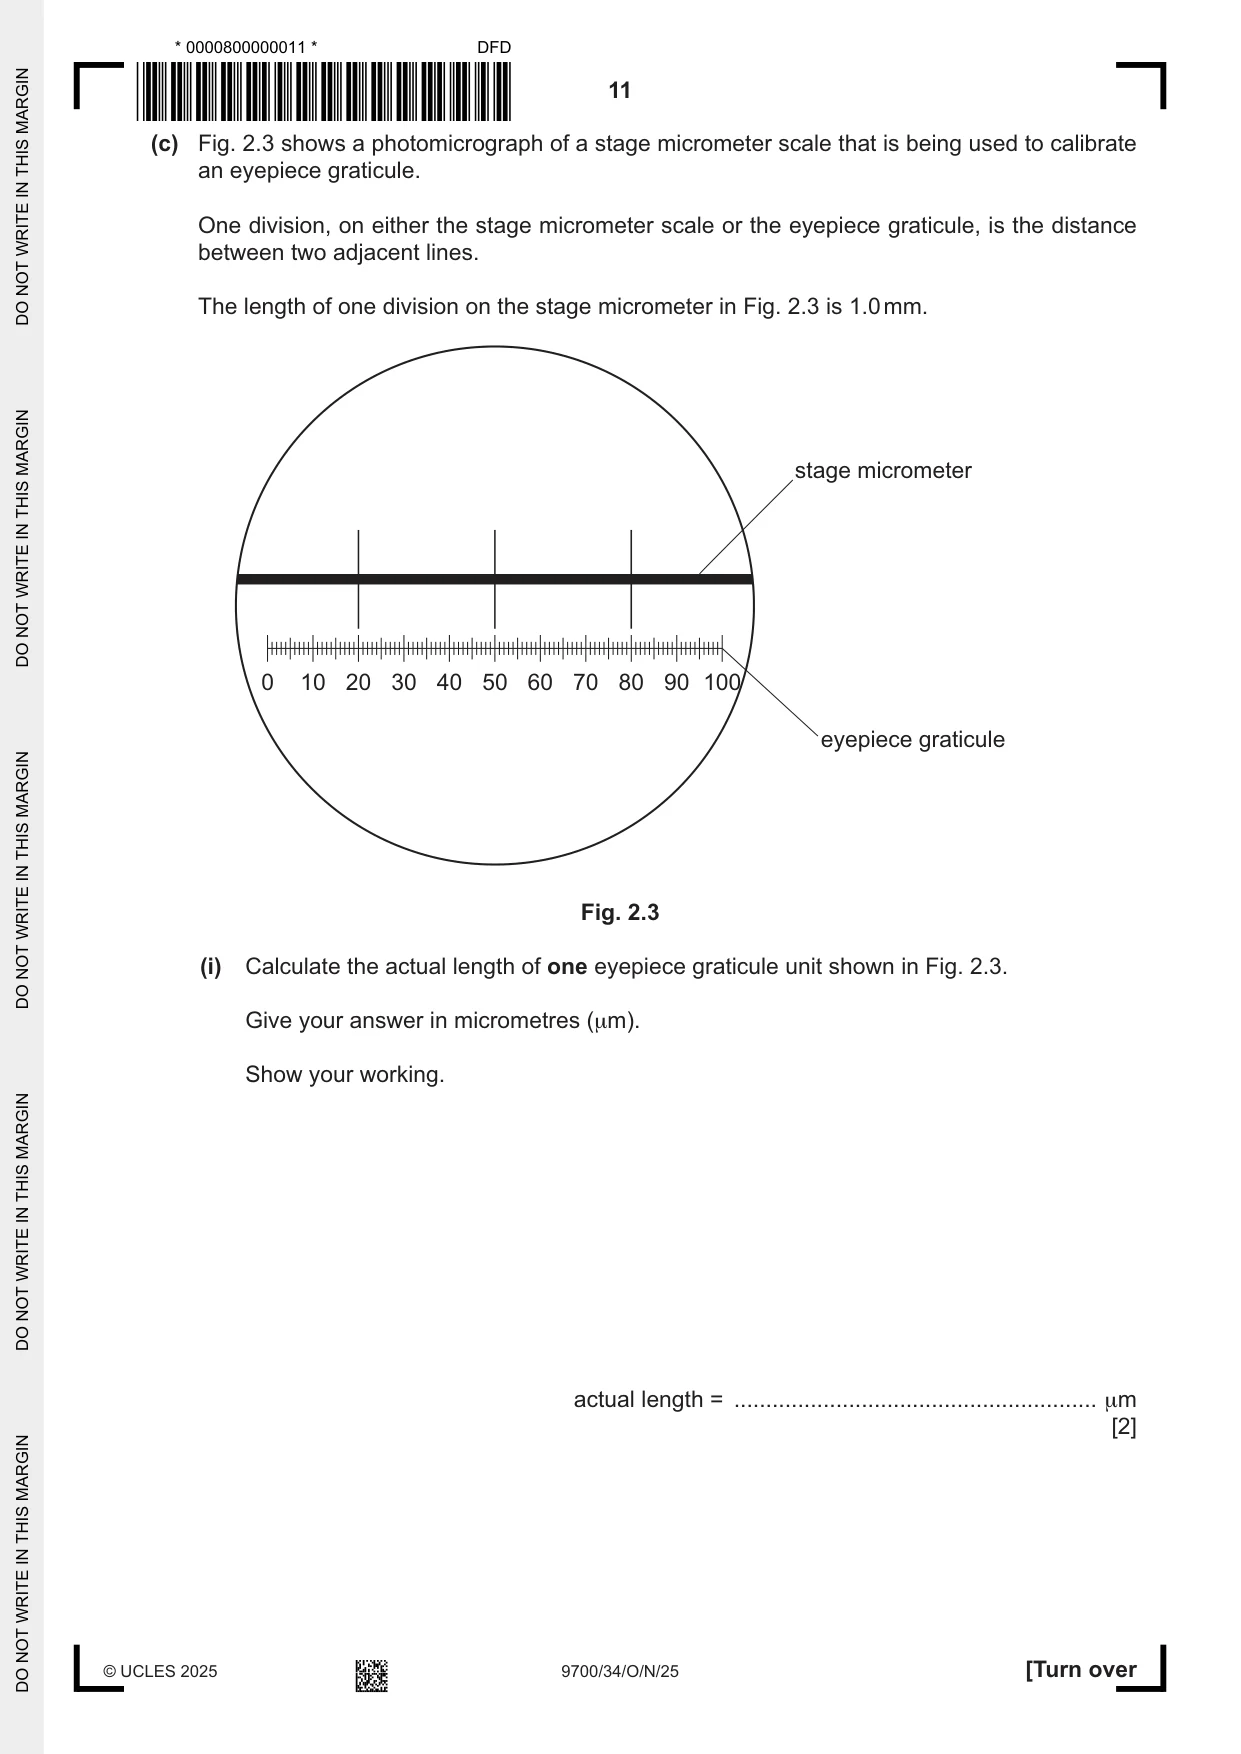
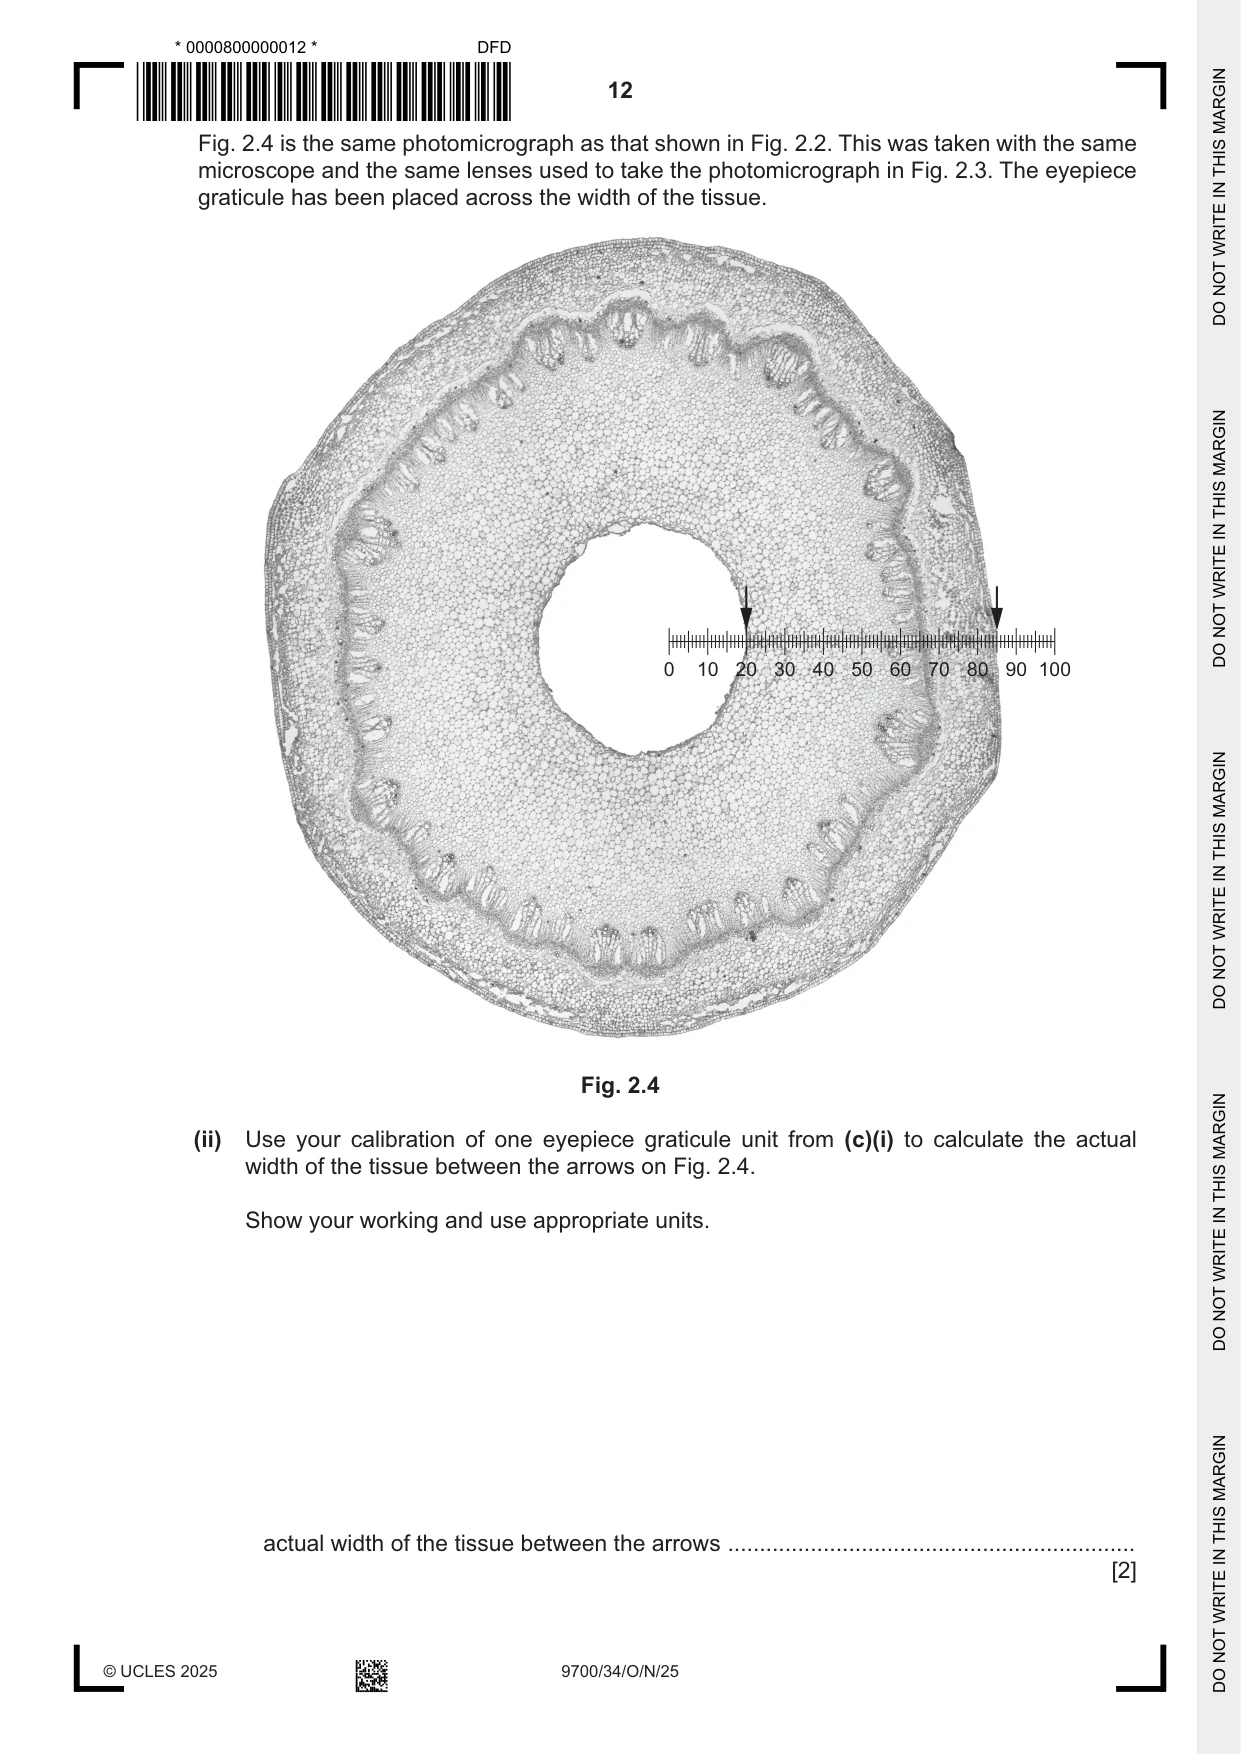
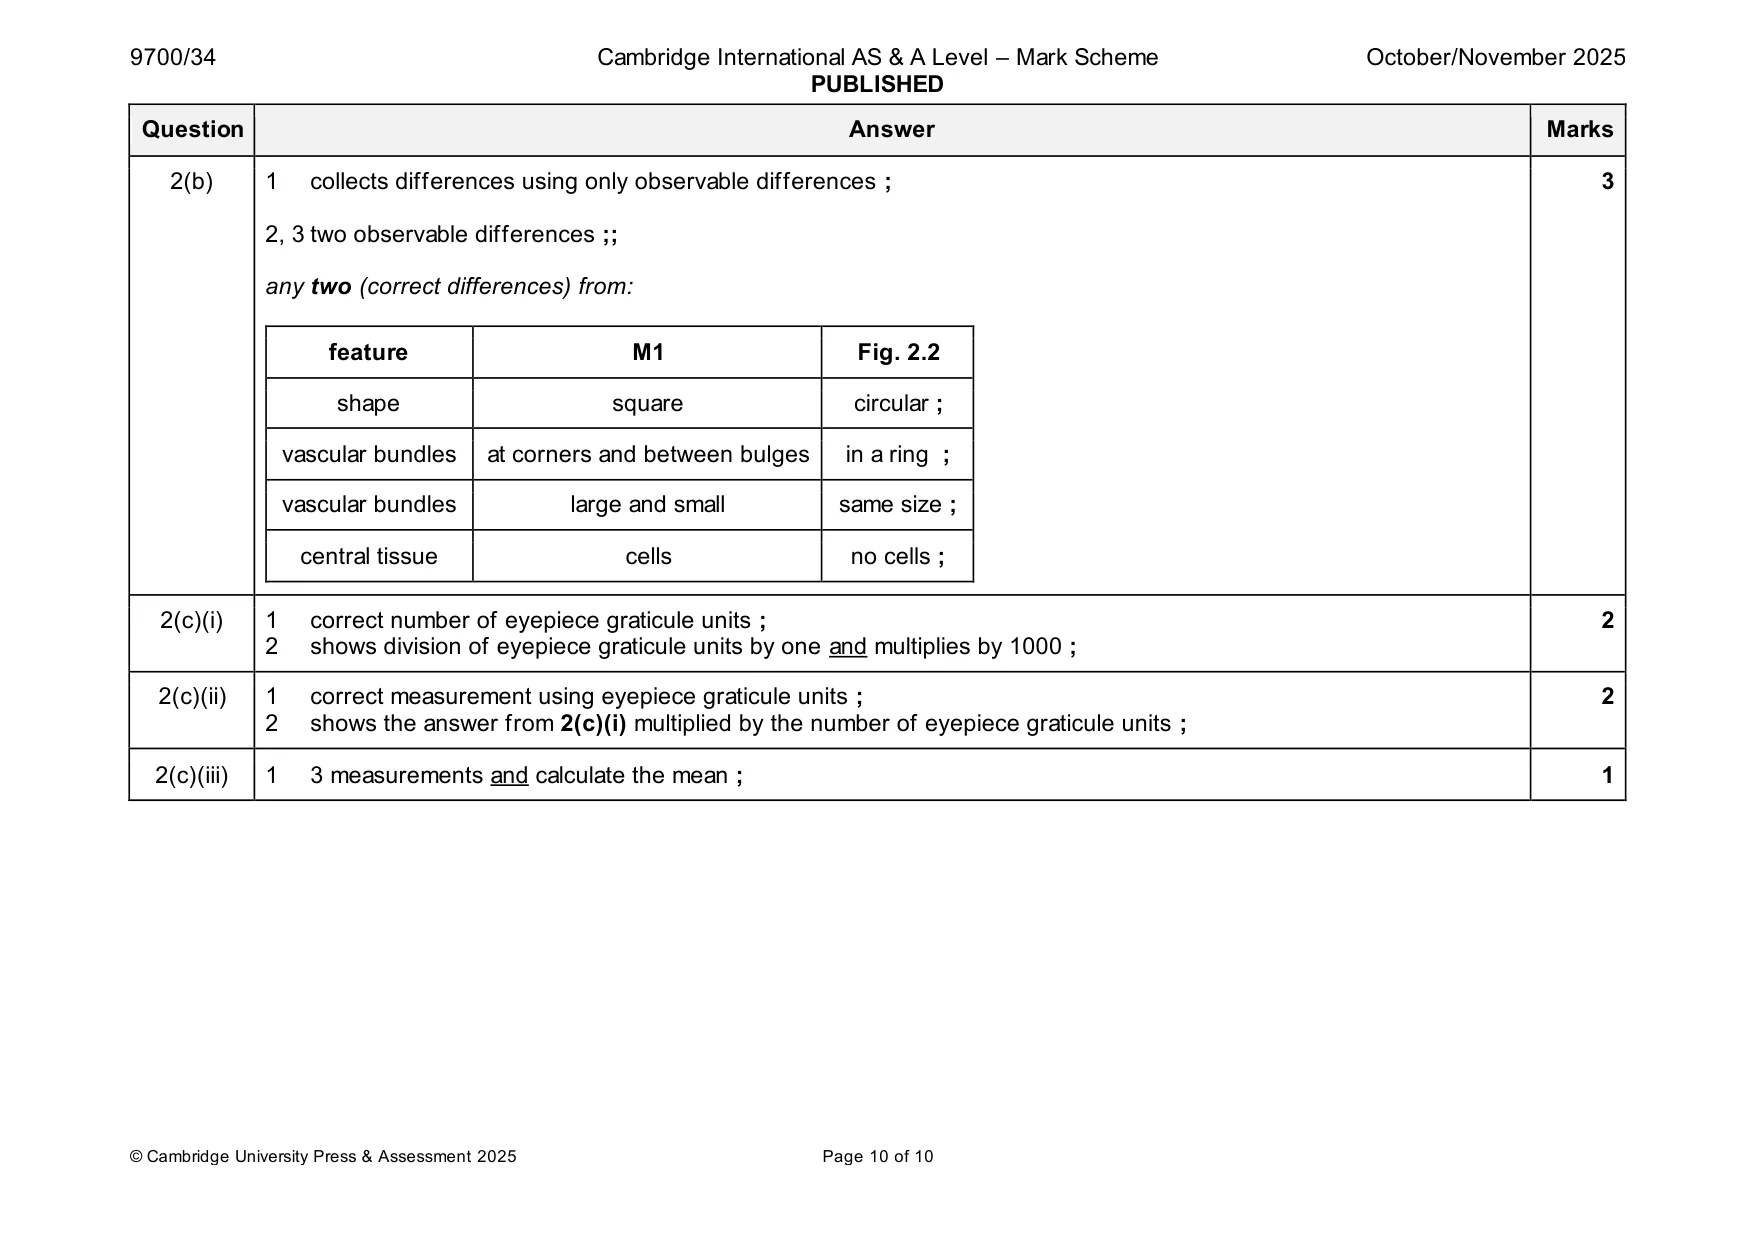
Mark scheme: 2(a)(i) 1 appropriate size and no shading ; 5 2 draws correct section of the organ ; 3 draws the correct pattern of vascular bundles and the correct proportions of large vascular bundles and no cells drawn ; 4 draws two lines for the epidermis and trichomes ; 5 label line and label to vascular bundle ; 2(a)(ii) 1 appropriate size and lines are sharp and continuous ; 5 2 draws only four xylem vessel elements and each xylem vessel element touches at least one other xylem vessel element ; 3 two lines around each xylem vessel element and three lines where xylem vessel elements touch ; 4 draws correct shape of xylem vessel elements ; 5 label line and label to the wall of one xylem vessel element ; 2(a)(iii) 1 stem and reason ; 1 2(b) 1 collects differences using only observable differences ; 3 2, 3 two observable differences ;; any two (correct differences) from: feature M1 Fig. 2.2 shape square circular ; vascular bundles at corners and between bulges in a ring ; vascular bundles large and small same size ; central tissue cells no cells ; 2(c)(i) 1 correct number of eyepiece graticule units ; 2 2 shows division of eyepiece graticule units by one and multiplies by 1000 ; 2(c)(ii) 1 correct measurement using eyepiece graticule units ; 2 2 shows the answer from 2(c)(i) multiplied by the number of eyepiece graticule units ; 2(c)(iii) 1 3 measurements and calculate the mean ; 1
What was in this paper
The subtopics covered by these 2 questions, and how many questions each got. Open one in a new tab to see every Cambridge question on it.
What you needed in this session
Cambridge’s own grade thresholds for 2025 Oct/Nov, Paper 3 · Variant 4. A higher threshold means an easier paper — the bar moves with how the cohort did.