Cambridge A Level Biology 9700 — 2018 May/June Paper 3 · Variant 1
9700/31/M/J/18 · 2 questions · 40 marks · ≈45 min
The question paper and its mark scheme, free to read here and free to download. This is Cambridge’s own paper, exactly as it was sat.
Question paper16 pages

Mark scheme7 pages
Answers below. Sit the paper first if you are practising.
Questions as text
Q1 · Milk contains proteins which are used to make cheese
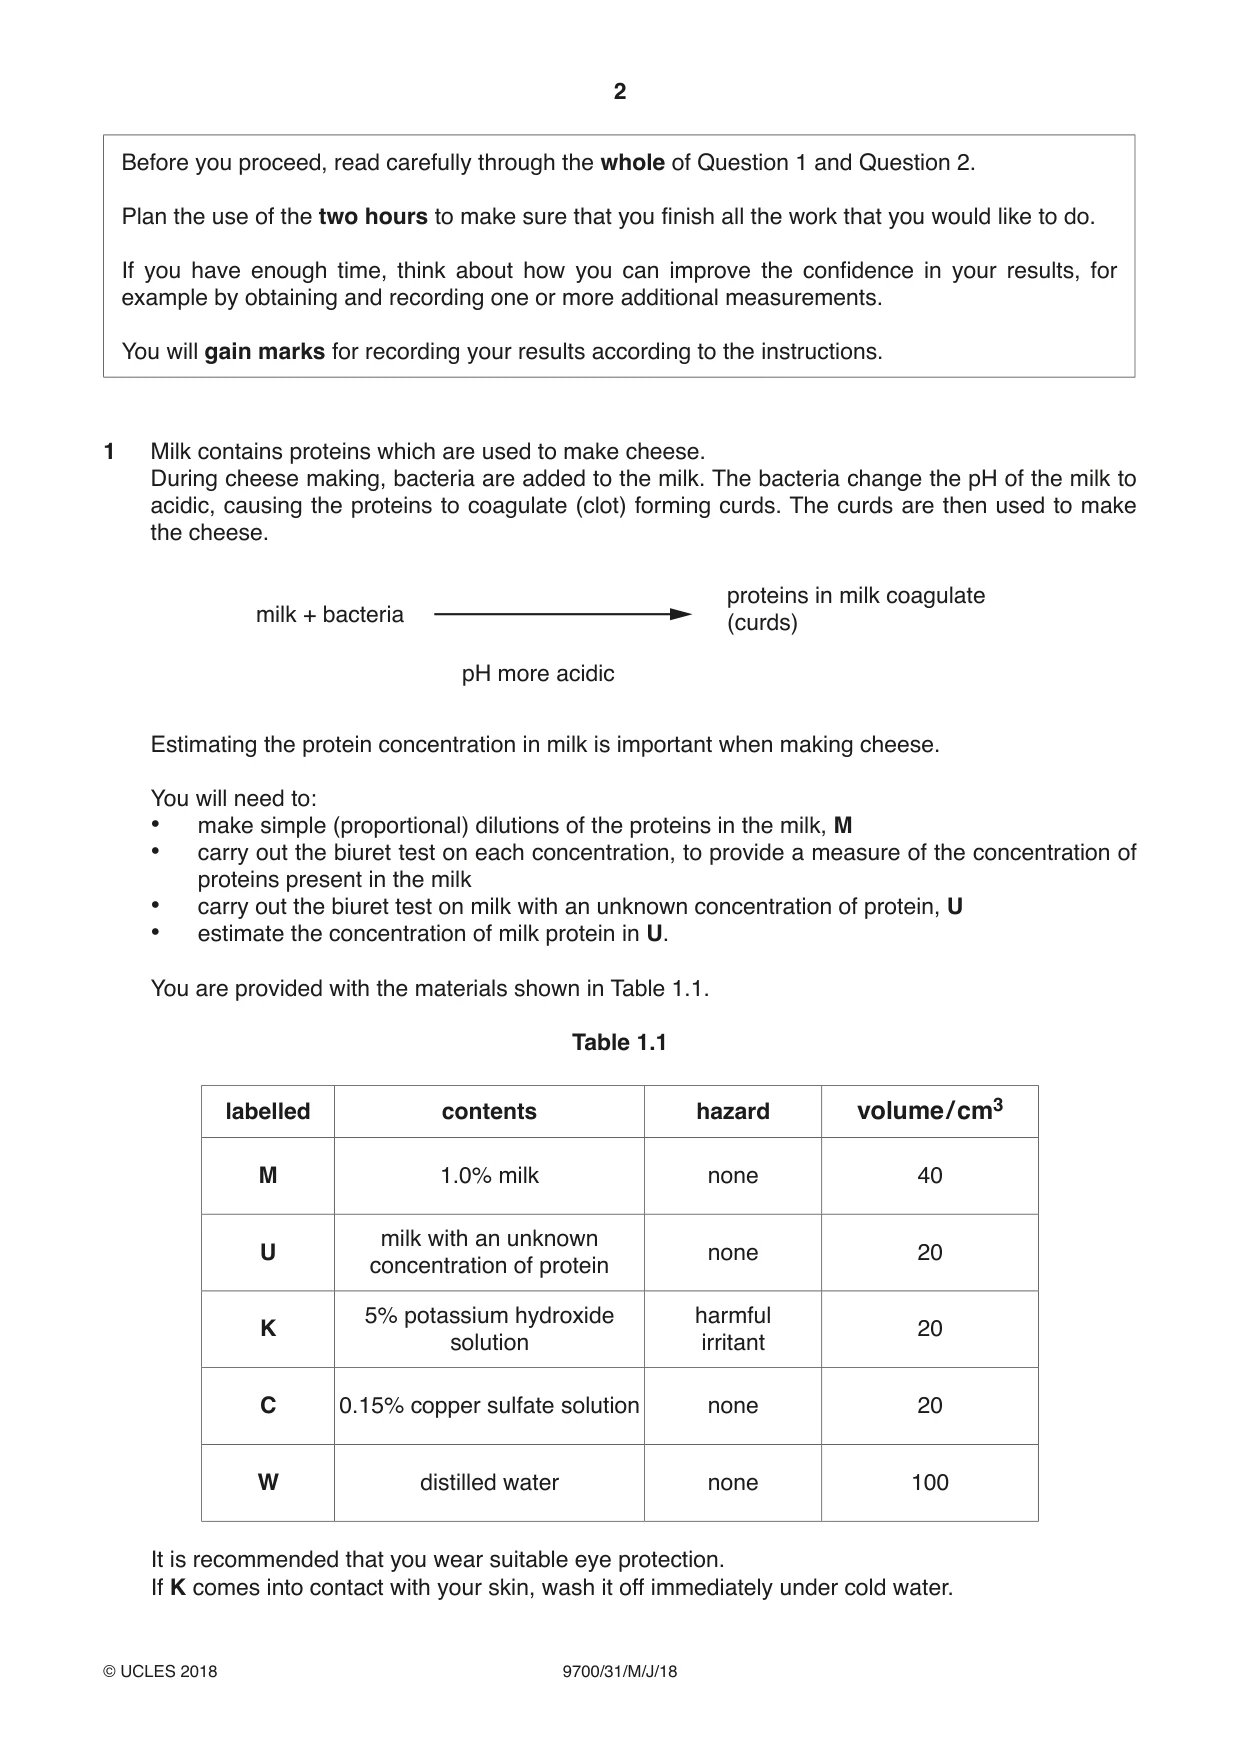
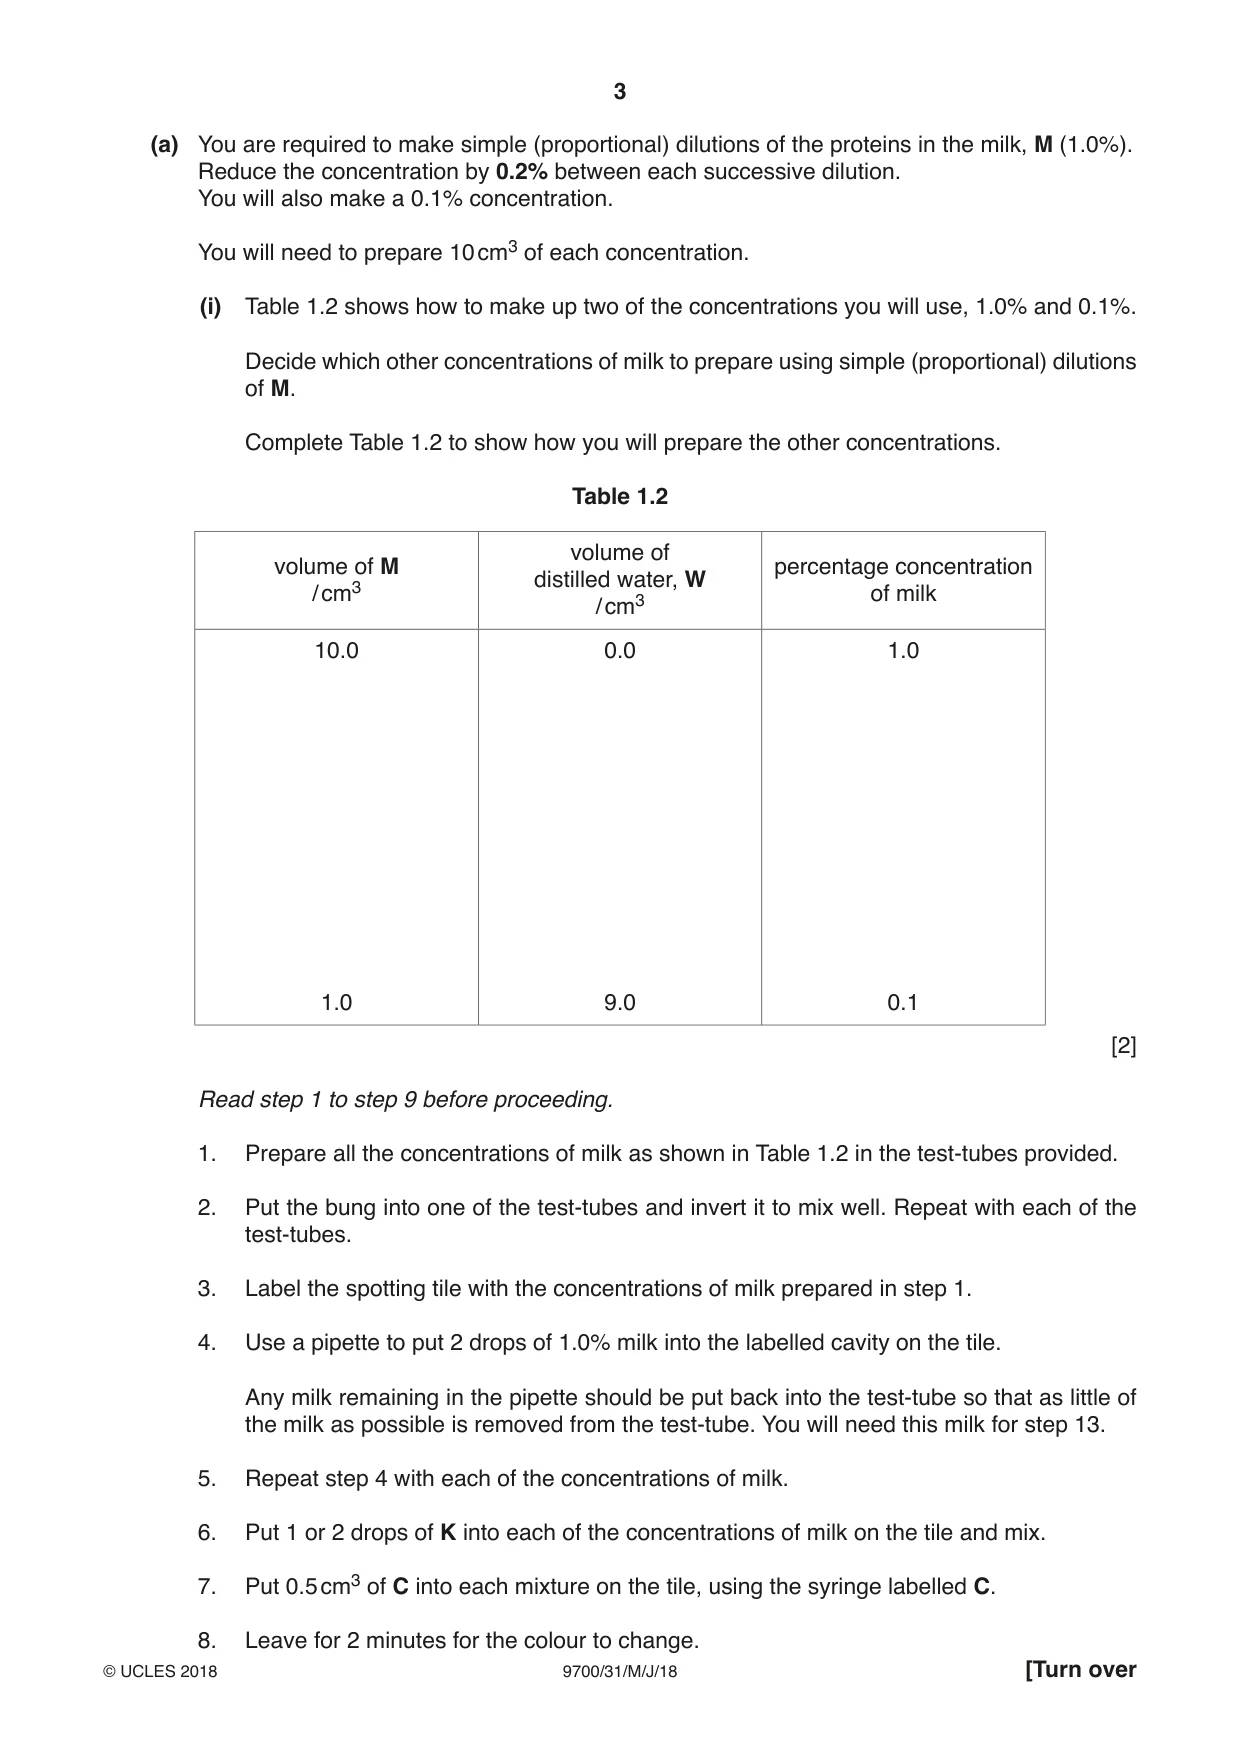
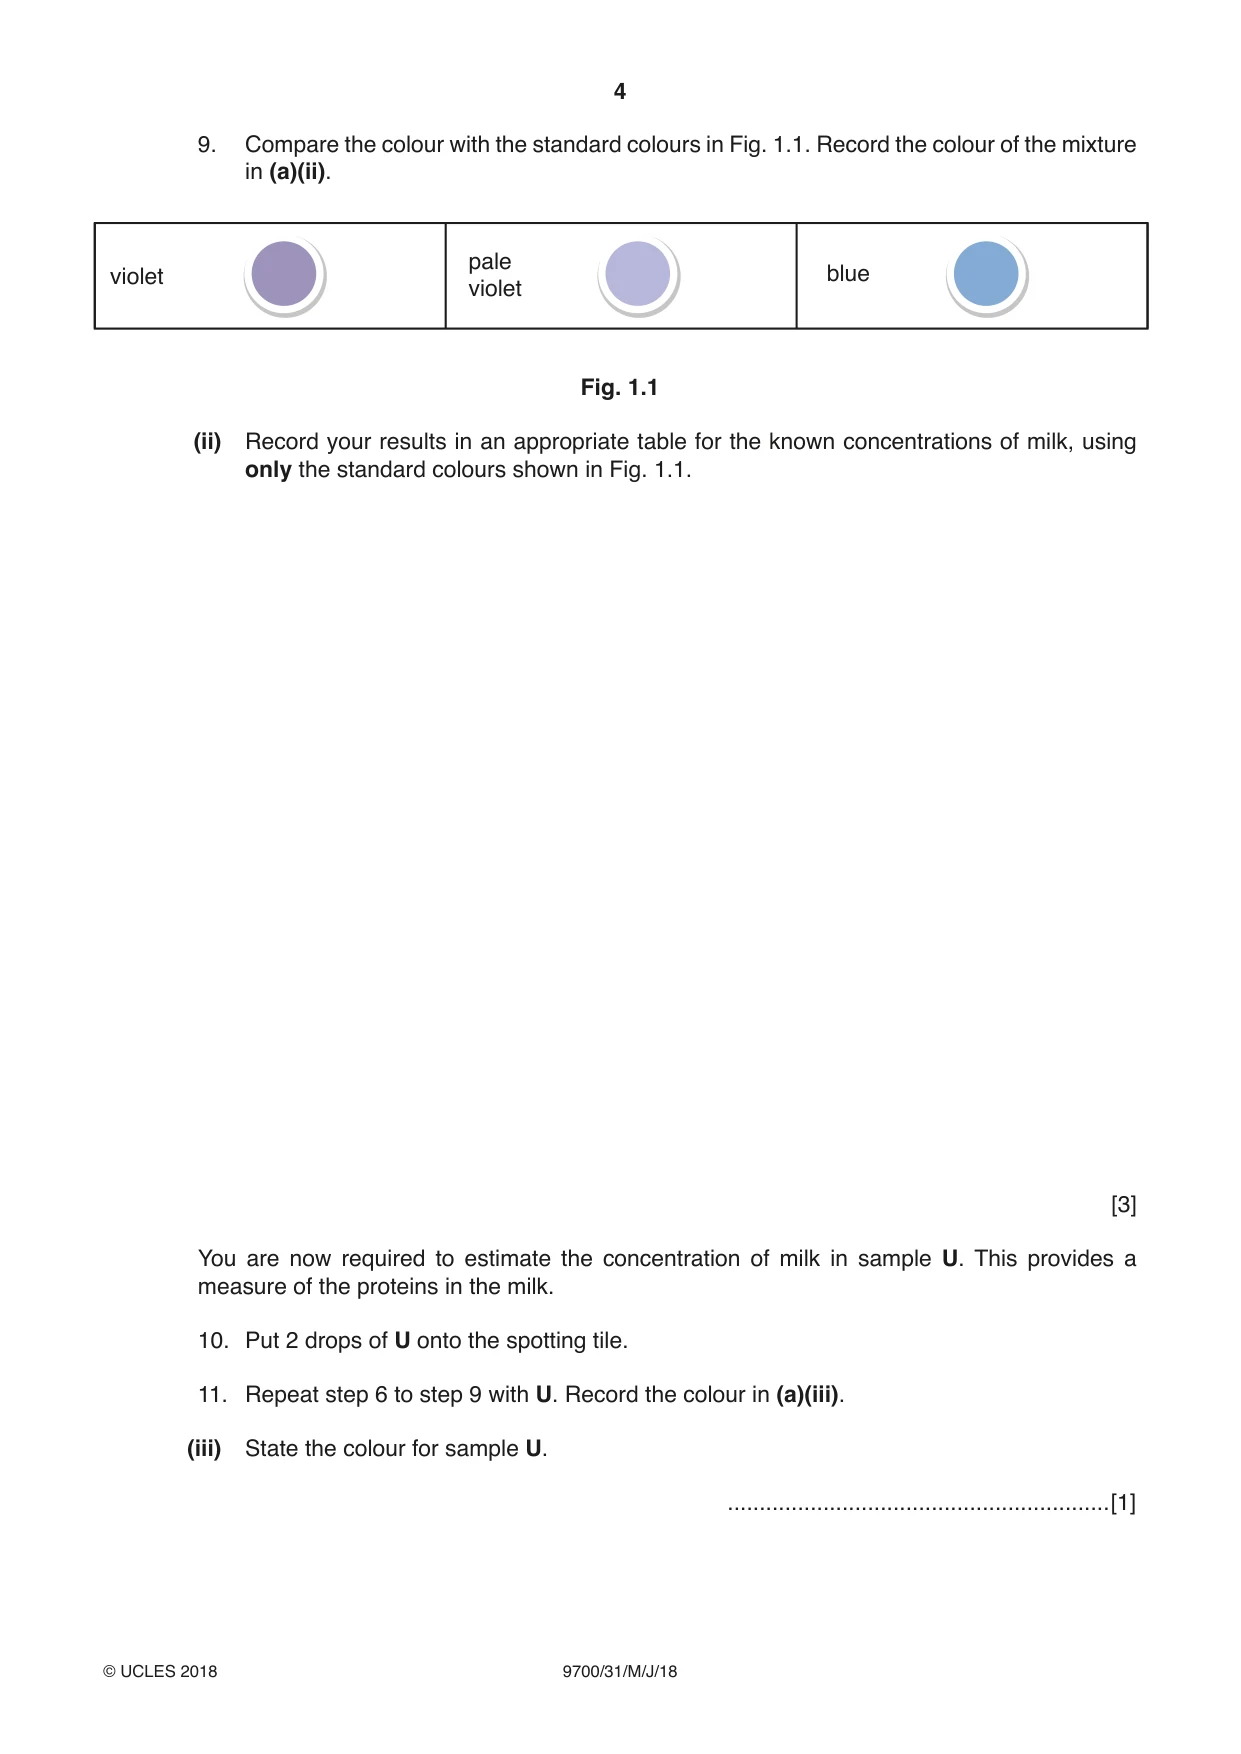
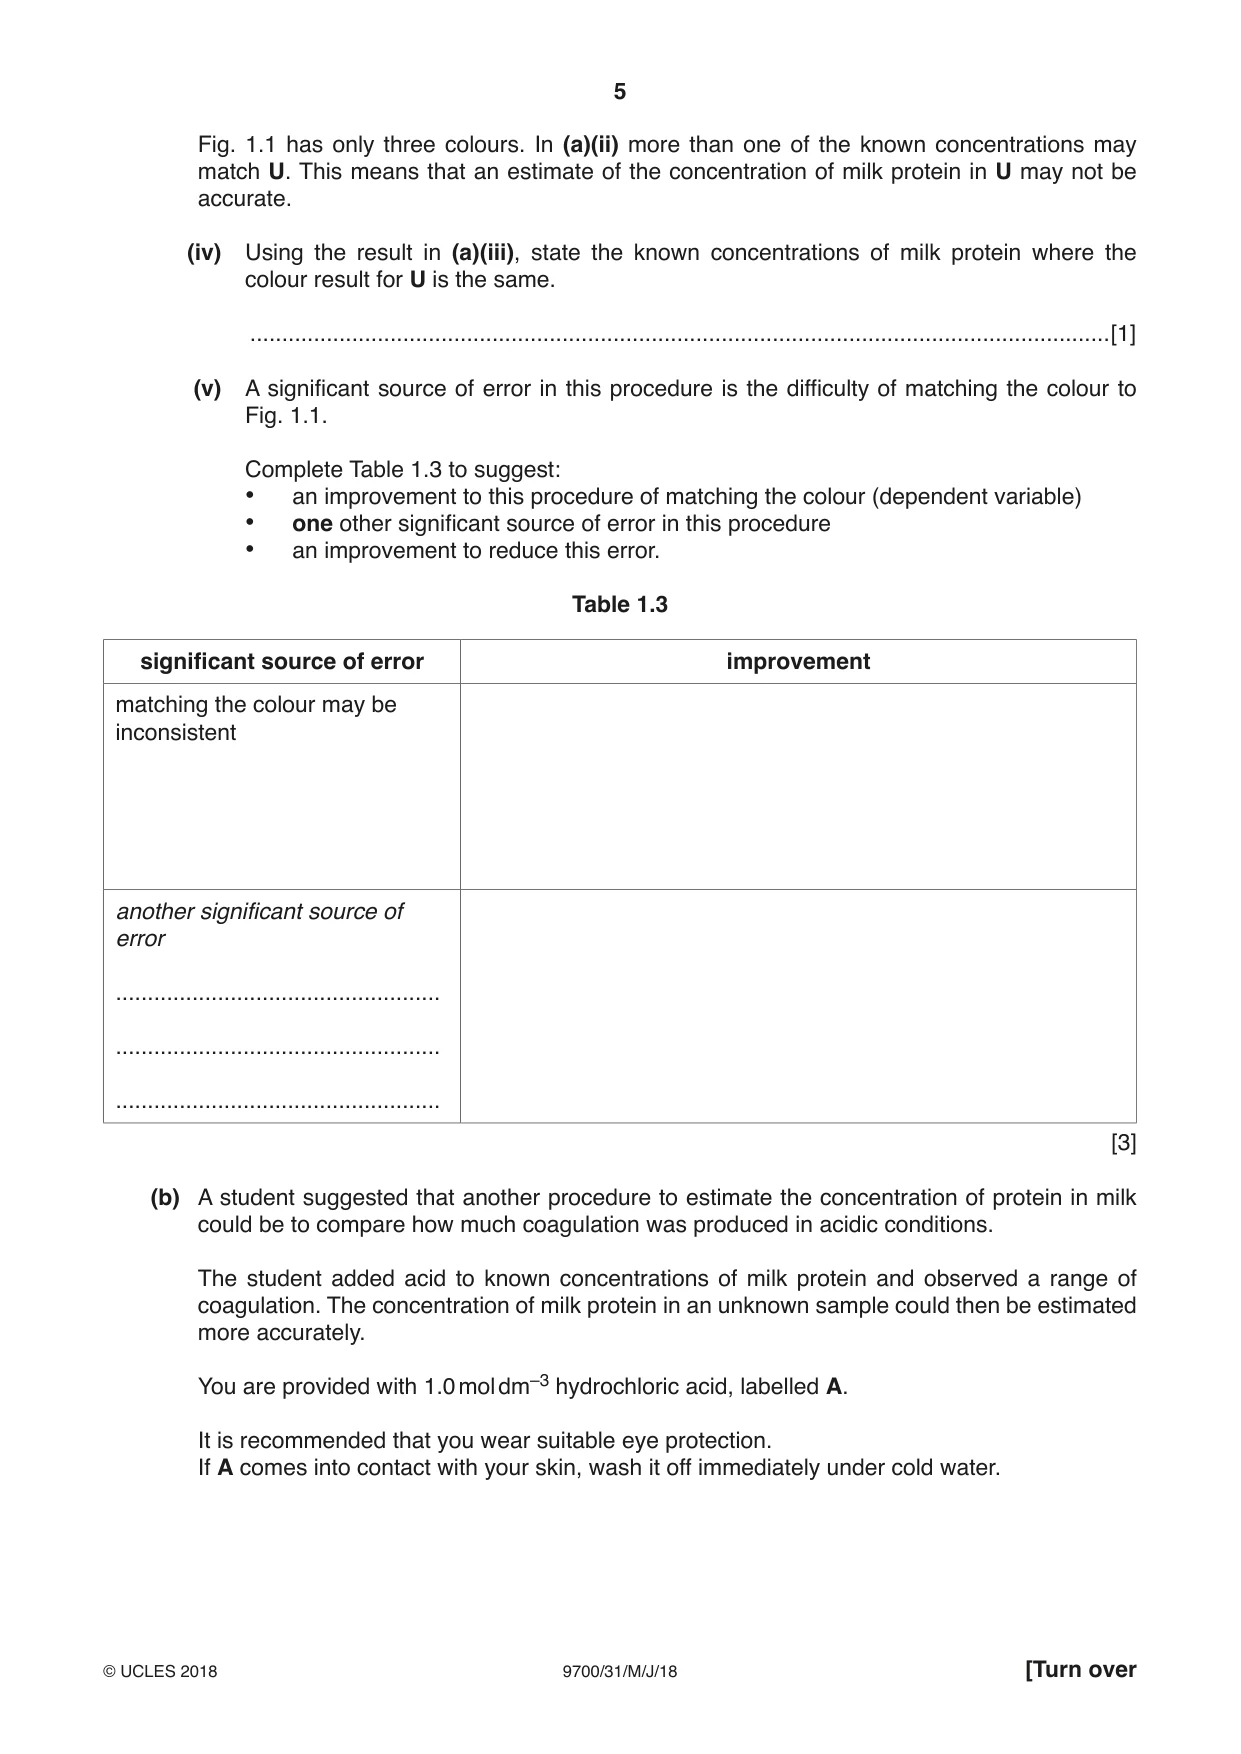
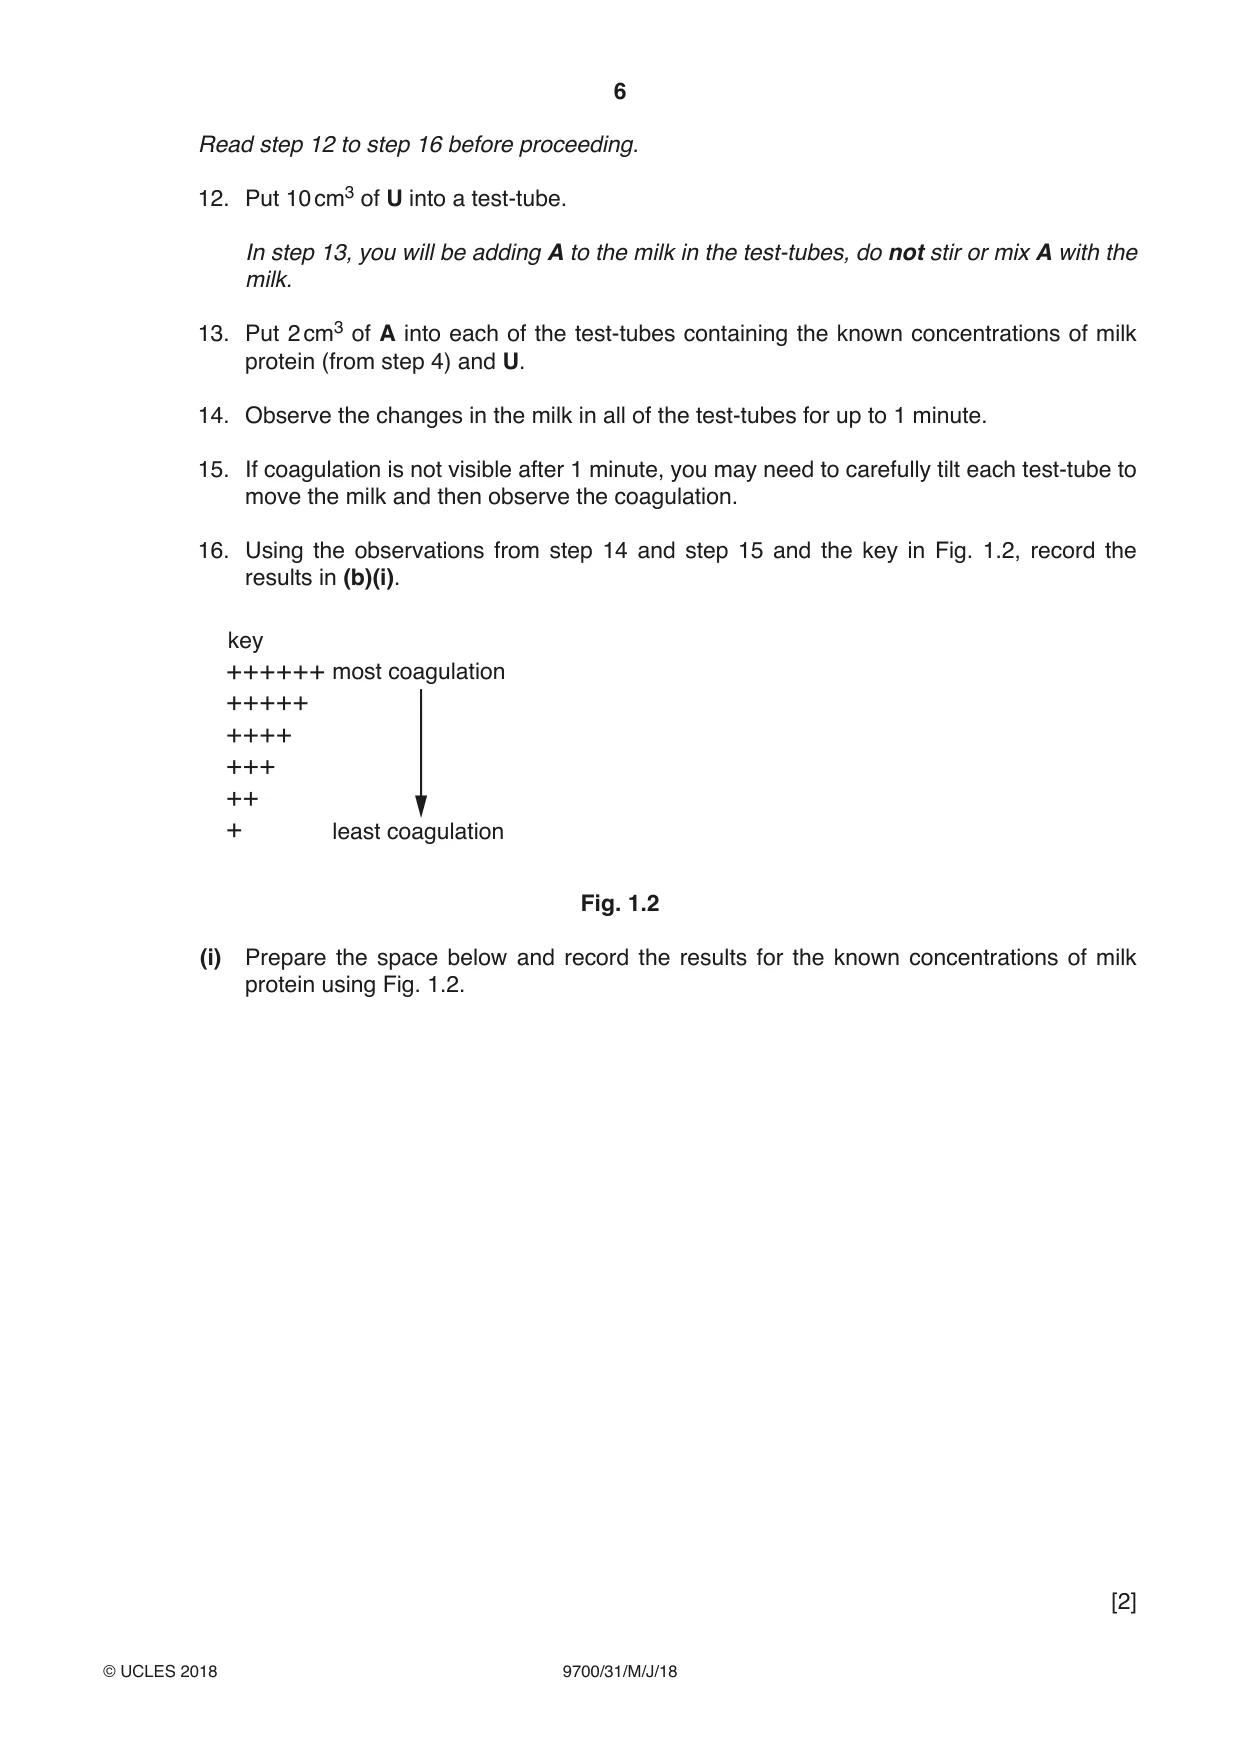
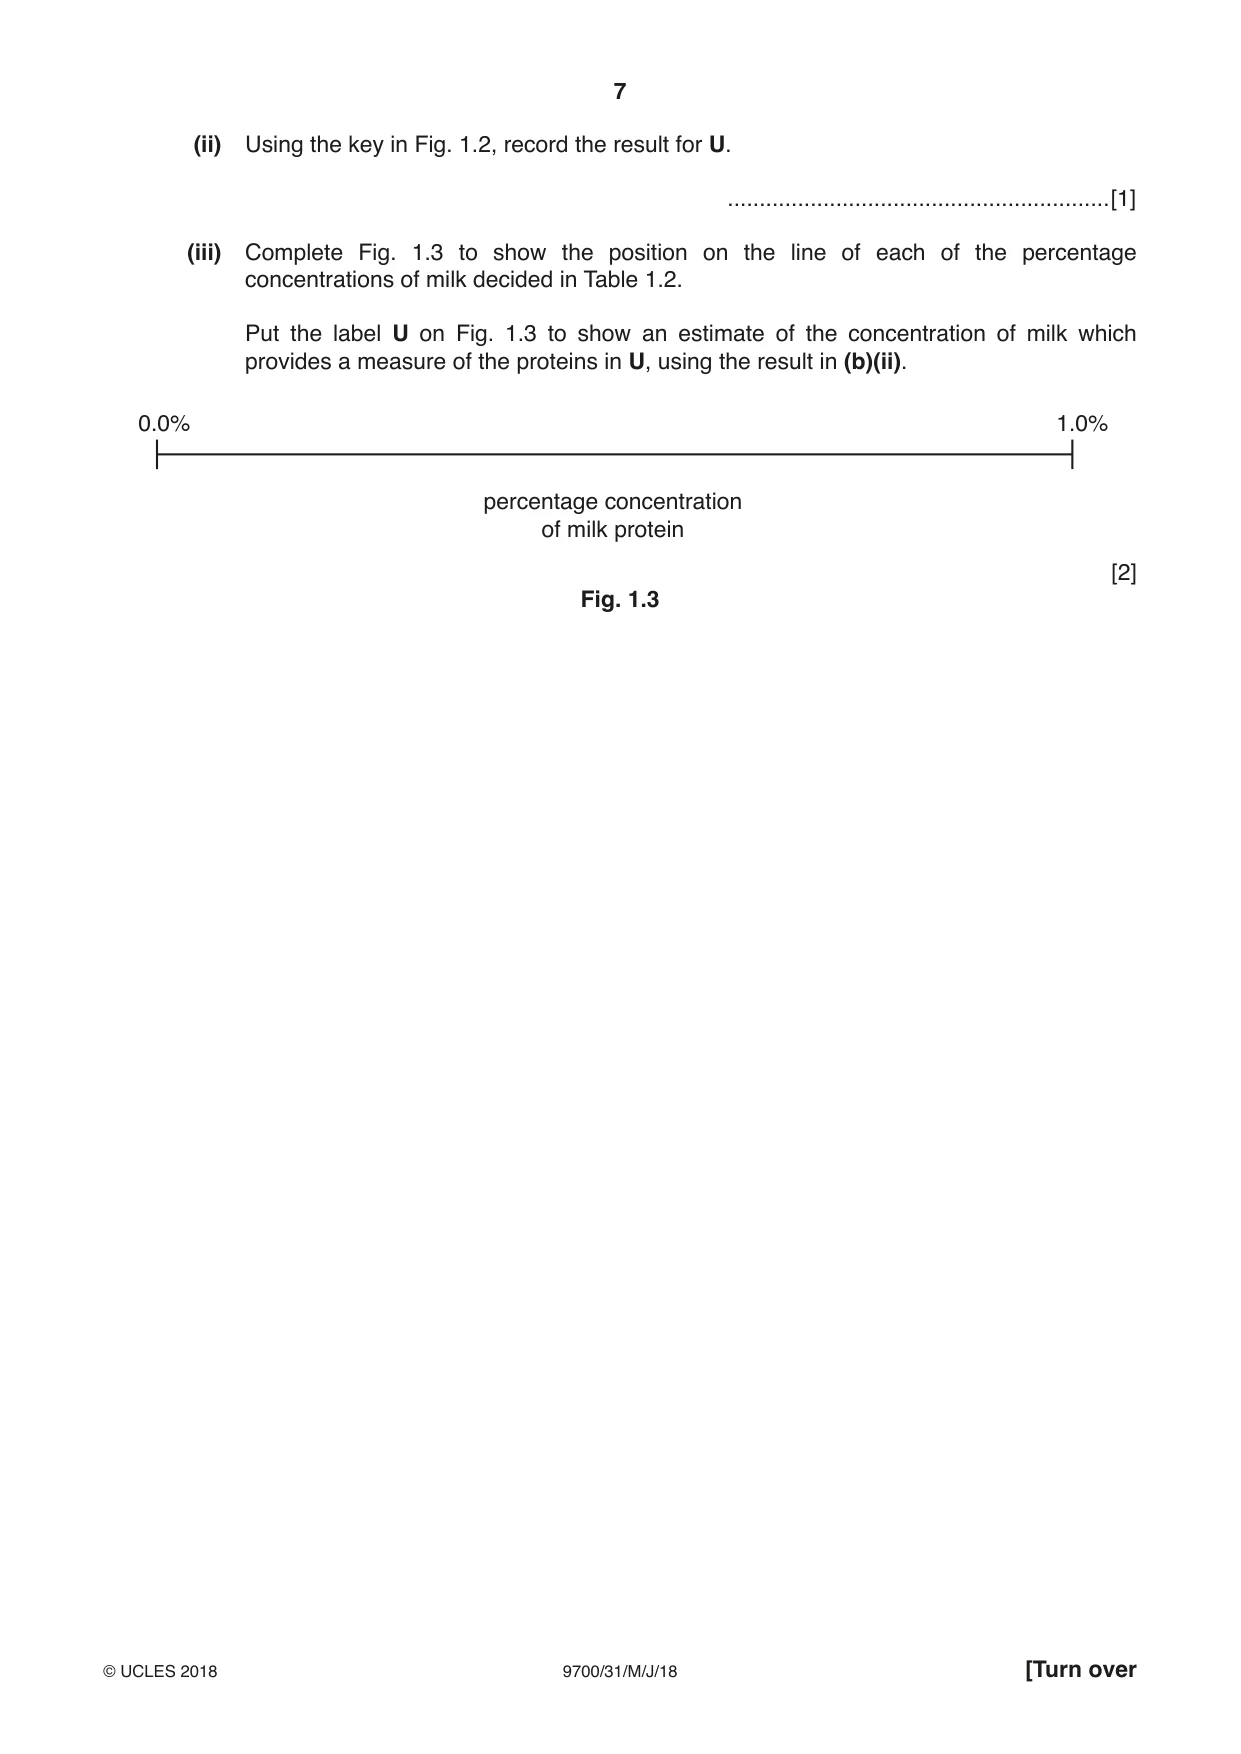
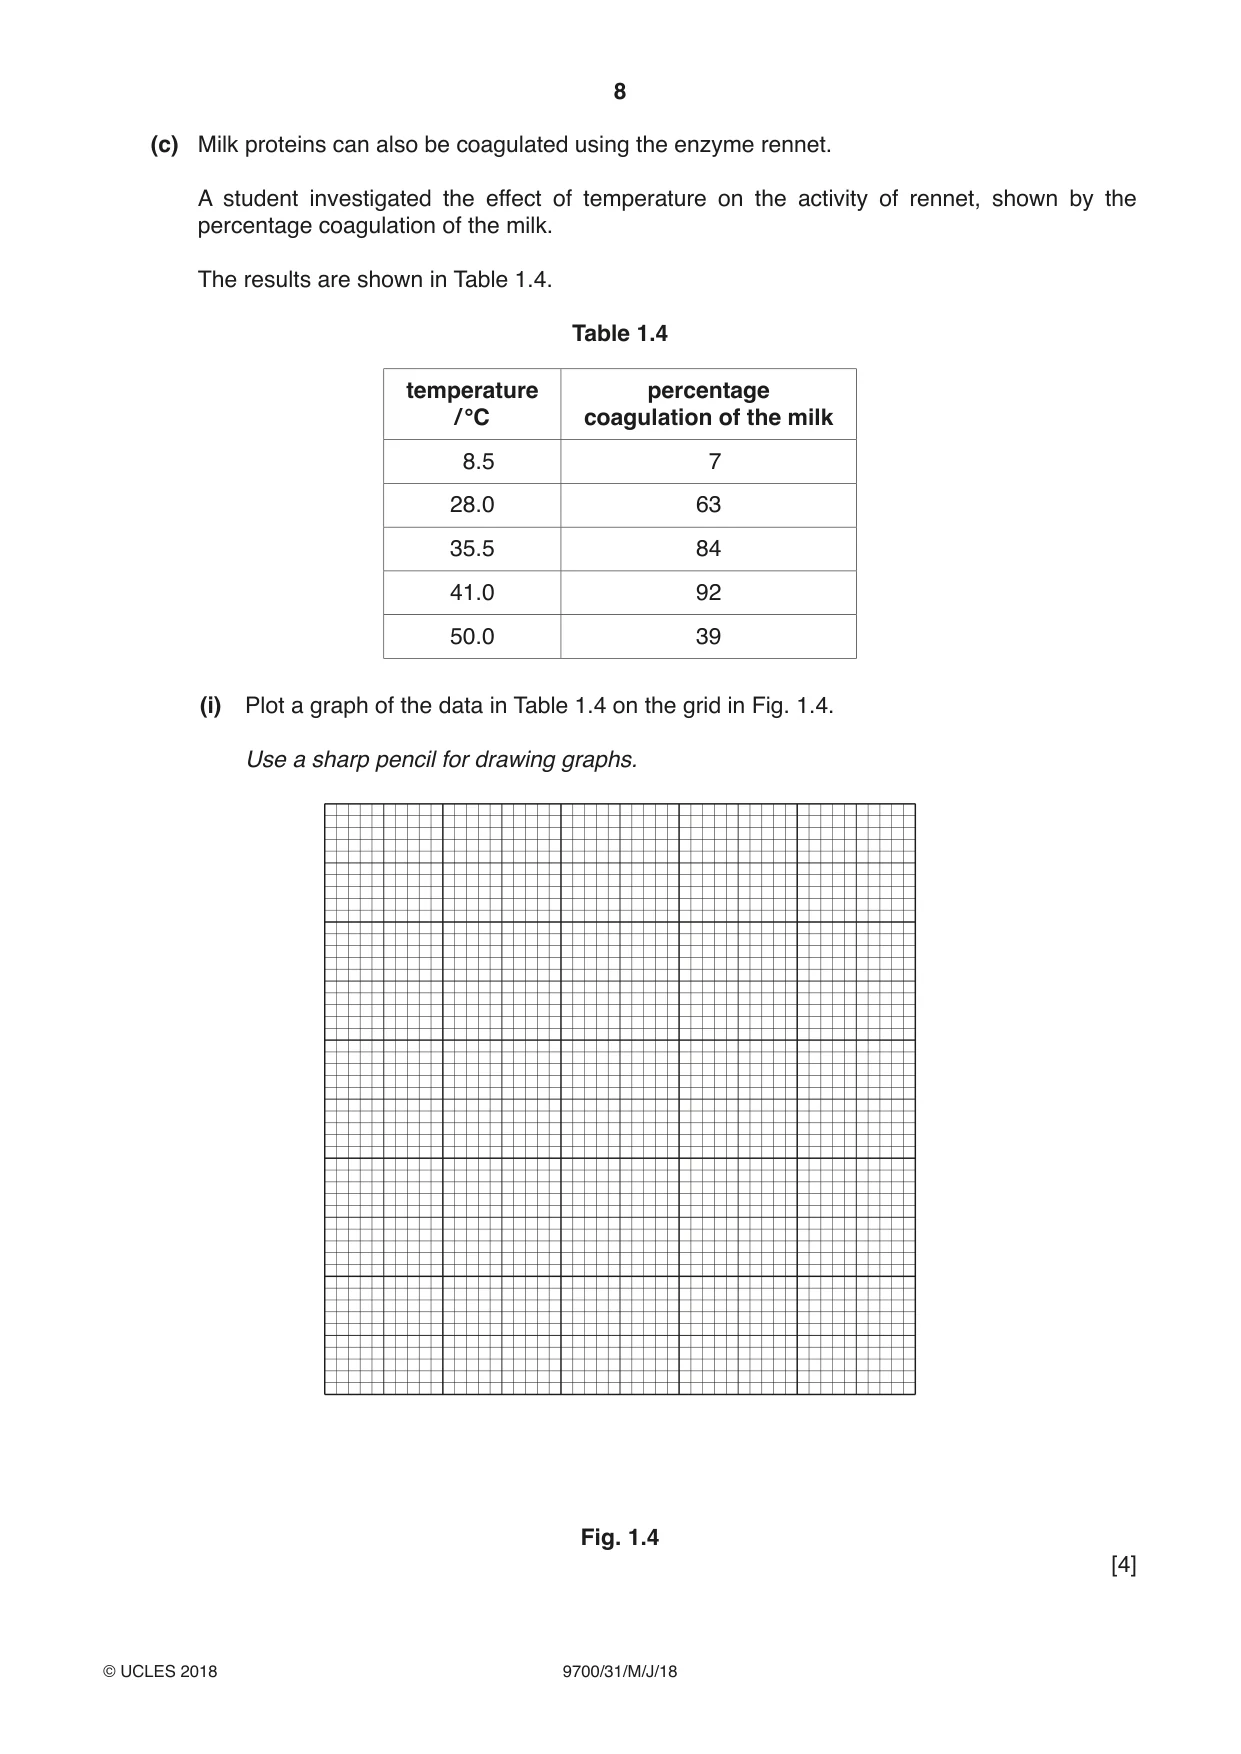
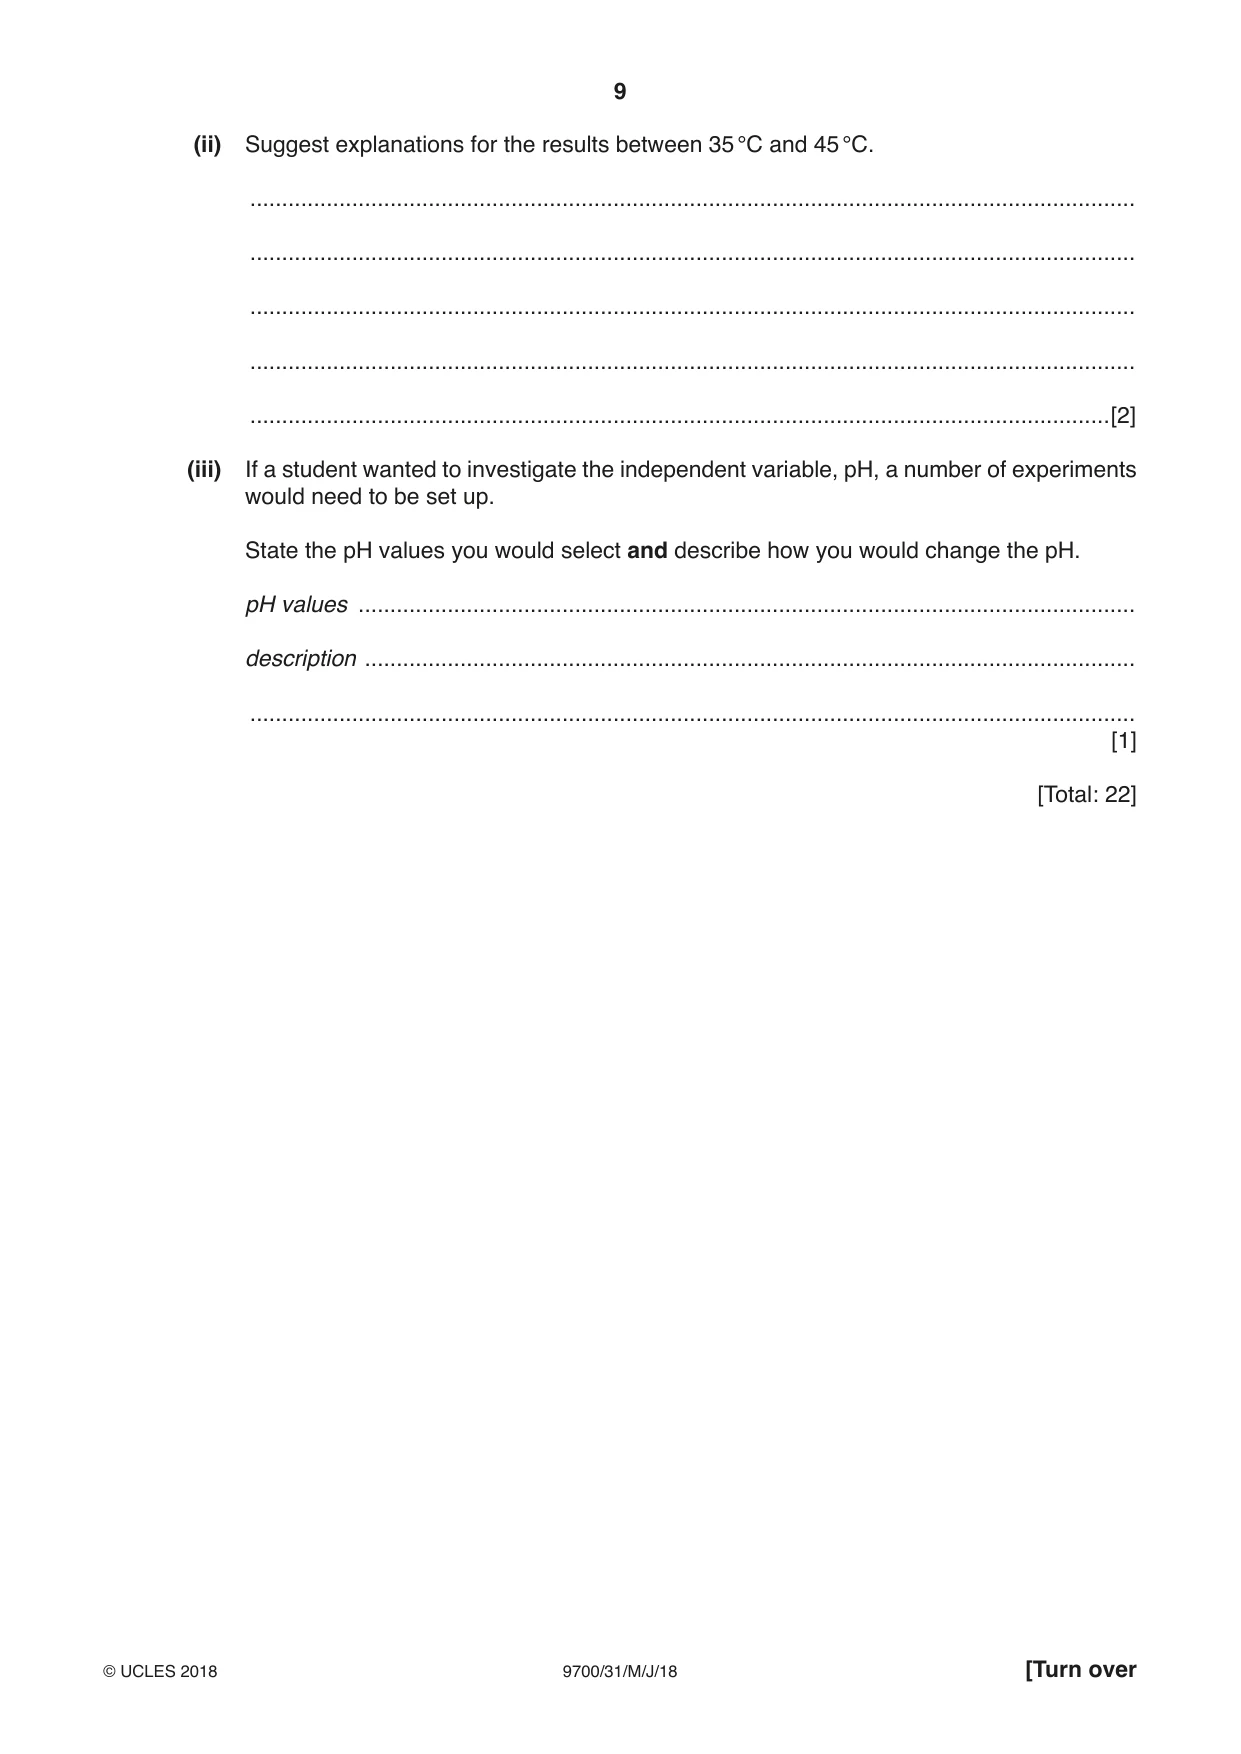
1 Milk contains proteins which are used to make cheese. During cheese making, bacteria are added to the milk. The bacteria change the pH of the milk to acidic, causing the proteins to coagulate (clot) forming curds. The curds are then used to make the cheese. proteins in milk coagulate milk + bacteria (curds) pH more acidic Estimating the protein concentration in milk is important when making cheese. You will need to: • make simple (proportional) dilutions of the proteins in the milk, M • carry out the biuret test on each concentration, to provide a measure of the concentration of proteins present in the milk • carry out the biuret test on milk with an unknown concentration of protein, U • estimate the concentration of milk protein in U. You are provided with the materials shown in Table 1.1. Table 1.1 labelled contents hazard volume / cm3 M 1.0% milk none 40 milk with an unknown U none 20 concentration of protein 5% potassium hydroxide harmful K 20 solution irritant C 0.15% copper sulfate solution none 20 W distilled water none 100 It is recommended that you wear suitable eye protection. If K comes into contact with your skin, wash it off immediately under cold water. (a) You are required to make simple (proportional) dilutions of the proteins in the milk, M (1.0%). Reduce the concentration by 0.2% between each successive dilution. You will also make a 0.1% concentration. You will need to prepare 10 cm3 of each concentration. (i) Table 1.2 shows how to make up two of the concentrations you will use, 1.0% and 0.1%. Decide which other concentrations of milk to prepare using simple (proportional) dilutions of M. Complete Table 1.2 to show how you will prepare the other concentrations. Table 1.2 volume of volume of M percentage concentration distilled water, W / cm3 of milk / cm3 10.0 0.0 1.0 1.0 9.0 0.1 [2] Read step 1 to step 9 before proceeding. 1. Prepare all the concentrations of milk as shown in Table 1.2 in the test-tubes provided. 2. Put the bung into one of the test-tubes and invert it to mix well. Repeat with each of the test-tubes. 3. Label the spotting tile with the concentrations of milk prepared in step 1. 4. Use a pipette to put 2 drops of 1.0% milk into the labelled cavity on the tile. Any milk remaining in the pipette should be put back into the test-tube so that as little of the milk as possible is removed from the test-tube. You will need this milk for step 13. 5. Repeat step 4 with each of the concentrations of milk. 6. Put 1 or 2 drops of K into each of the concentrations of milk on the tile and mix. 7. Put 0.5 cm3 of C into each mixture on the tile, using the syringe labelled C. 9. Compare the colour with the standard colours in Fig. 1.1. Record the colour of the mixture in (a)(ii). paleviolet blue violet Fig. 1.1 (ii) Record your results in an appropriate table for the known concentrations of milk, using only the standard colours shown in Fig. 1.1. [3] You are now required to estimate the concentration of milk in sample U. This provides a measure of the proteins in the milk. 10. Put 2 drops of U onto the spotting tile. 11. Repeat step 6 to step 9 with U. Record the colour in (a)(iii). (iii) State the colour for sample U. ............................................................[1] Fig. 1.1 has only three colours. In (a)(ii) more than one of the known concentrations may match U. This means that an estimate of the concentration of milk protein in U may not be accurate. (iv) Using the result in (a)(iii), state the known concentrations of milk protein where the colour result for U is the same. .......................................................................................................................................[1] (v) A significant source of error in this procedure is the difficulty of matching the colour to Fig. 1.1. Complete Table 1.3 to suggest: • an improvement to this procedure of matching the colour (dependent variable) • one other significant source of error in this procedure • an improvement to reduce this error. Table 1.3 significant source of error improvement matching the colour may be inconsistent another significant source of error ................................................... ................................................... ................................................... [3] (b) A student suggested that another procedure to estimate the concentration of protein in milk could be to compare how much coagulation was produced in acidic conditions. The student added acid to known concentrations of milk protein and observed a range of coagulation. The concentration of milk protein in an unknown sample could then be estimated more accurately. You are provided with 1.0 mol dm–3 hydrochloric acid, labelled A. It is recommended that you wear suitable eye protection. If A comes into contact with your skin, wash it off immediately under cold water. Read step 12 to step 16 before proceeding. 12. Put 10 cm3 of U into a test-tube. In step 13, you will be adding A to the milk in the test-tubes, do not stir or mix A with the milk. 13. Put 2 cm3 of A into each of the test-tubes containing the known concentrations of milk protein (from step 4) and U. 14. Observe the changes in the milk in all of the test-tubes for up to 1 minute. 15. If coagulation is not visible after 1 minute, you may need to carefully tilt each test-tube to move the milk and then observe the coagulation. 16. Using the observations from step 14 and step 15 and the key in Fig. 1.2, record the results in (b)(i). key most coagulation least coagulation Fig. 1.2 (i) Prepare the space below and record the results for the known concentrations of milk protein using Fig. 1.2. [2] (ii) Using the key in Fig. 1.2, record the result for U. ............................................................[1] (iii) Complete Fig. 1.3 to show the position on the line of each of the percentage concentrations of milk decided in Table 1.2. Put the label U on Fig. 1.3 to show an estimate of the concentration of milk which provides a measure of the proteins in U, using the result in (b)(ii). 0.0% 1.0% percentage concentration of milk protein [2] Fig. 1.3 (c) Milk proteins can also be coagulated using the enzyme rennet. A student investigated the effect of temperature on the activity of rennet, shown by the percentage coagulation of the milk. The results are shown in Table 1.4. Table 1.4 temperature percentage / °C coagulation of the milk 8.5 7 28.0 63 35.5 84 41.0 92 50.0 39 (i) Plot a graph of the data in Table 1.4 on the grid in Fig. 1.4. Use a sharp pencil for drawing graphs. Fig. 1.4 [4] (ii) Suggest explanations for the results between 35 °C and 45 °C. ........................................................................................................................................... ........................................................................................................................................... ........................................................................................................................................... ........................................................................................................................................... .......................................................................................................................................[2] (iii) If a student wanted to investigate the independent variable, pH, a number of experiments would need to be set up. State the pH values you would select and describe how you would change the pH. pH values .......................................................................................................................... description ......................................................................................................................... ........................................................................................................................................... [1] [Total: 22]
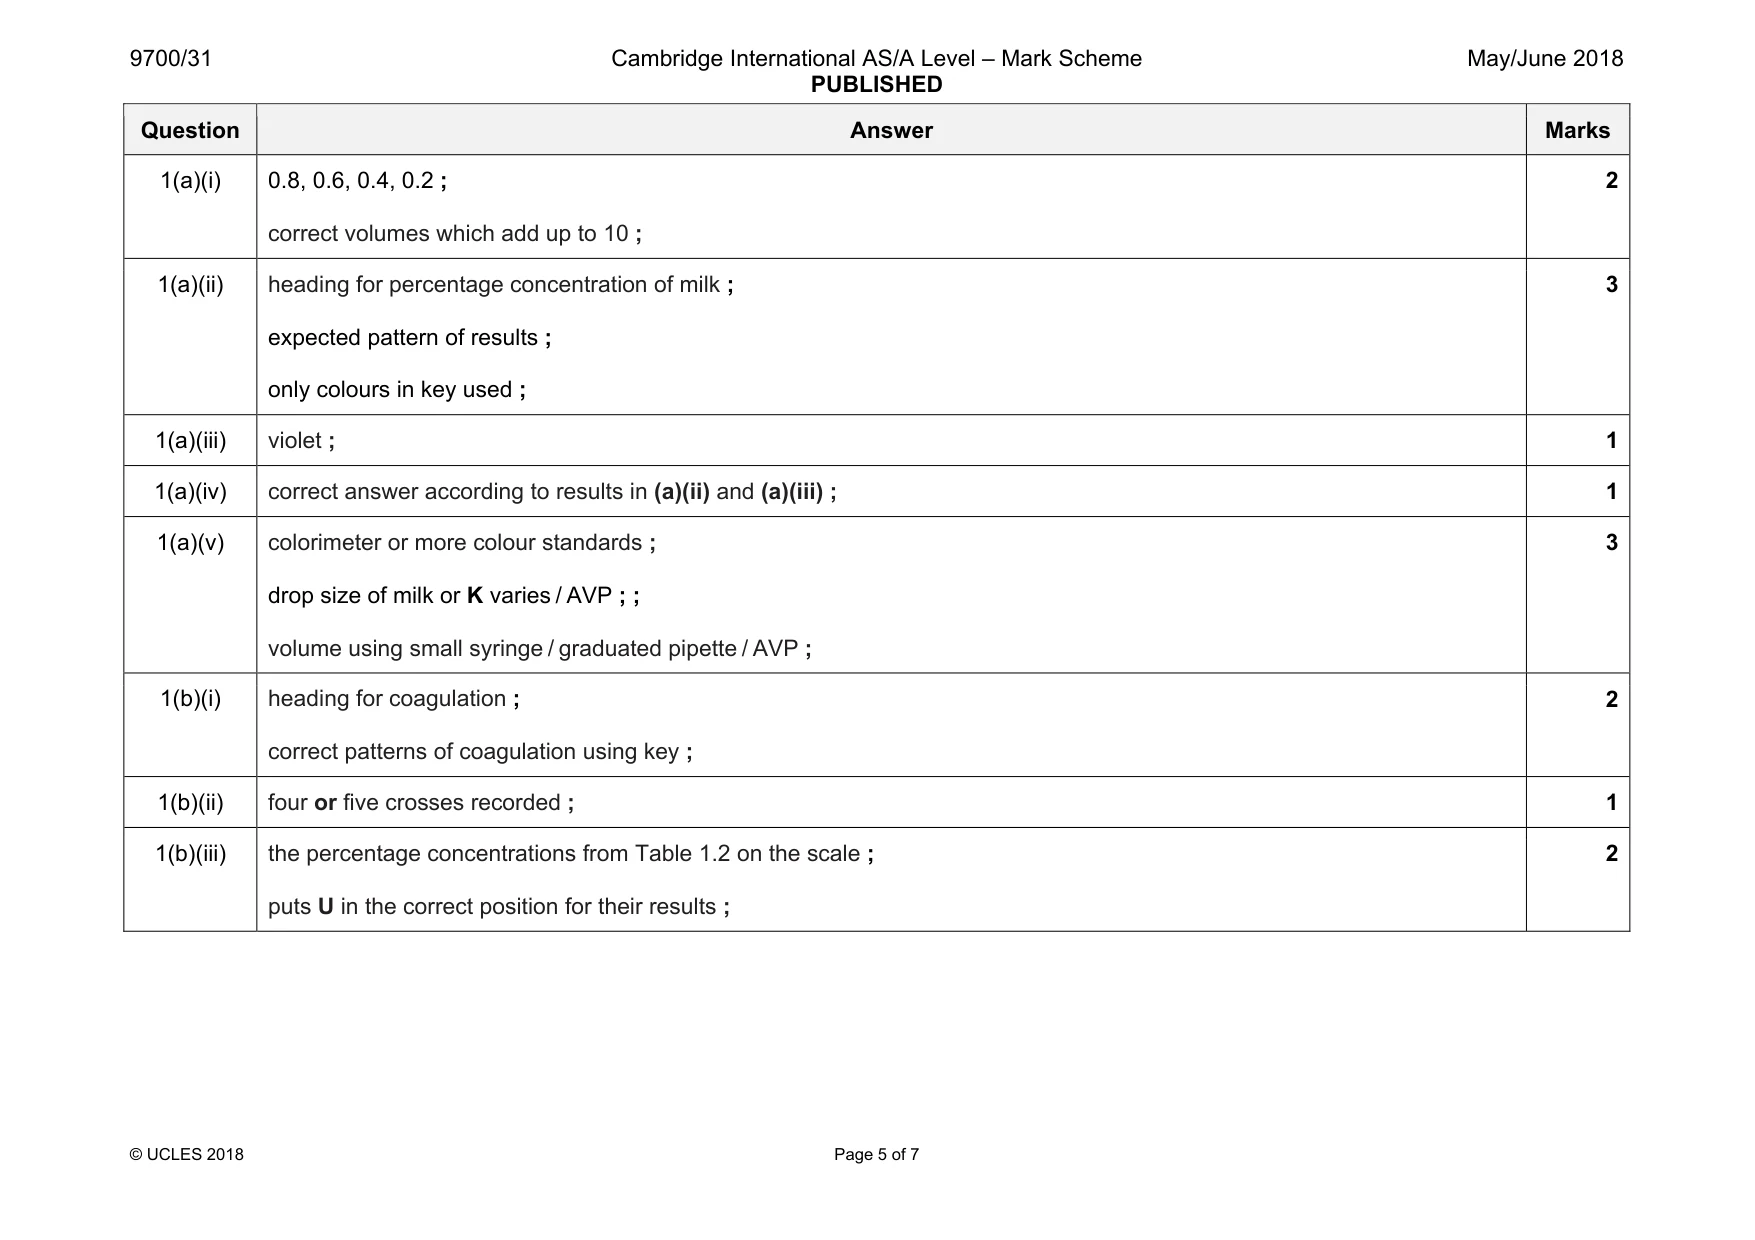
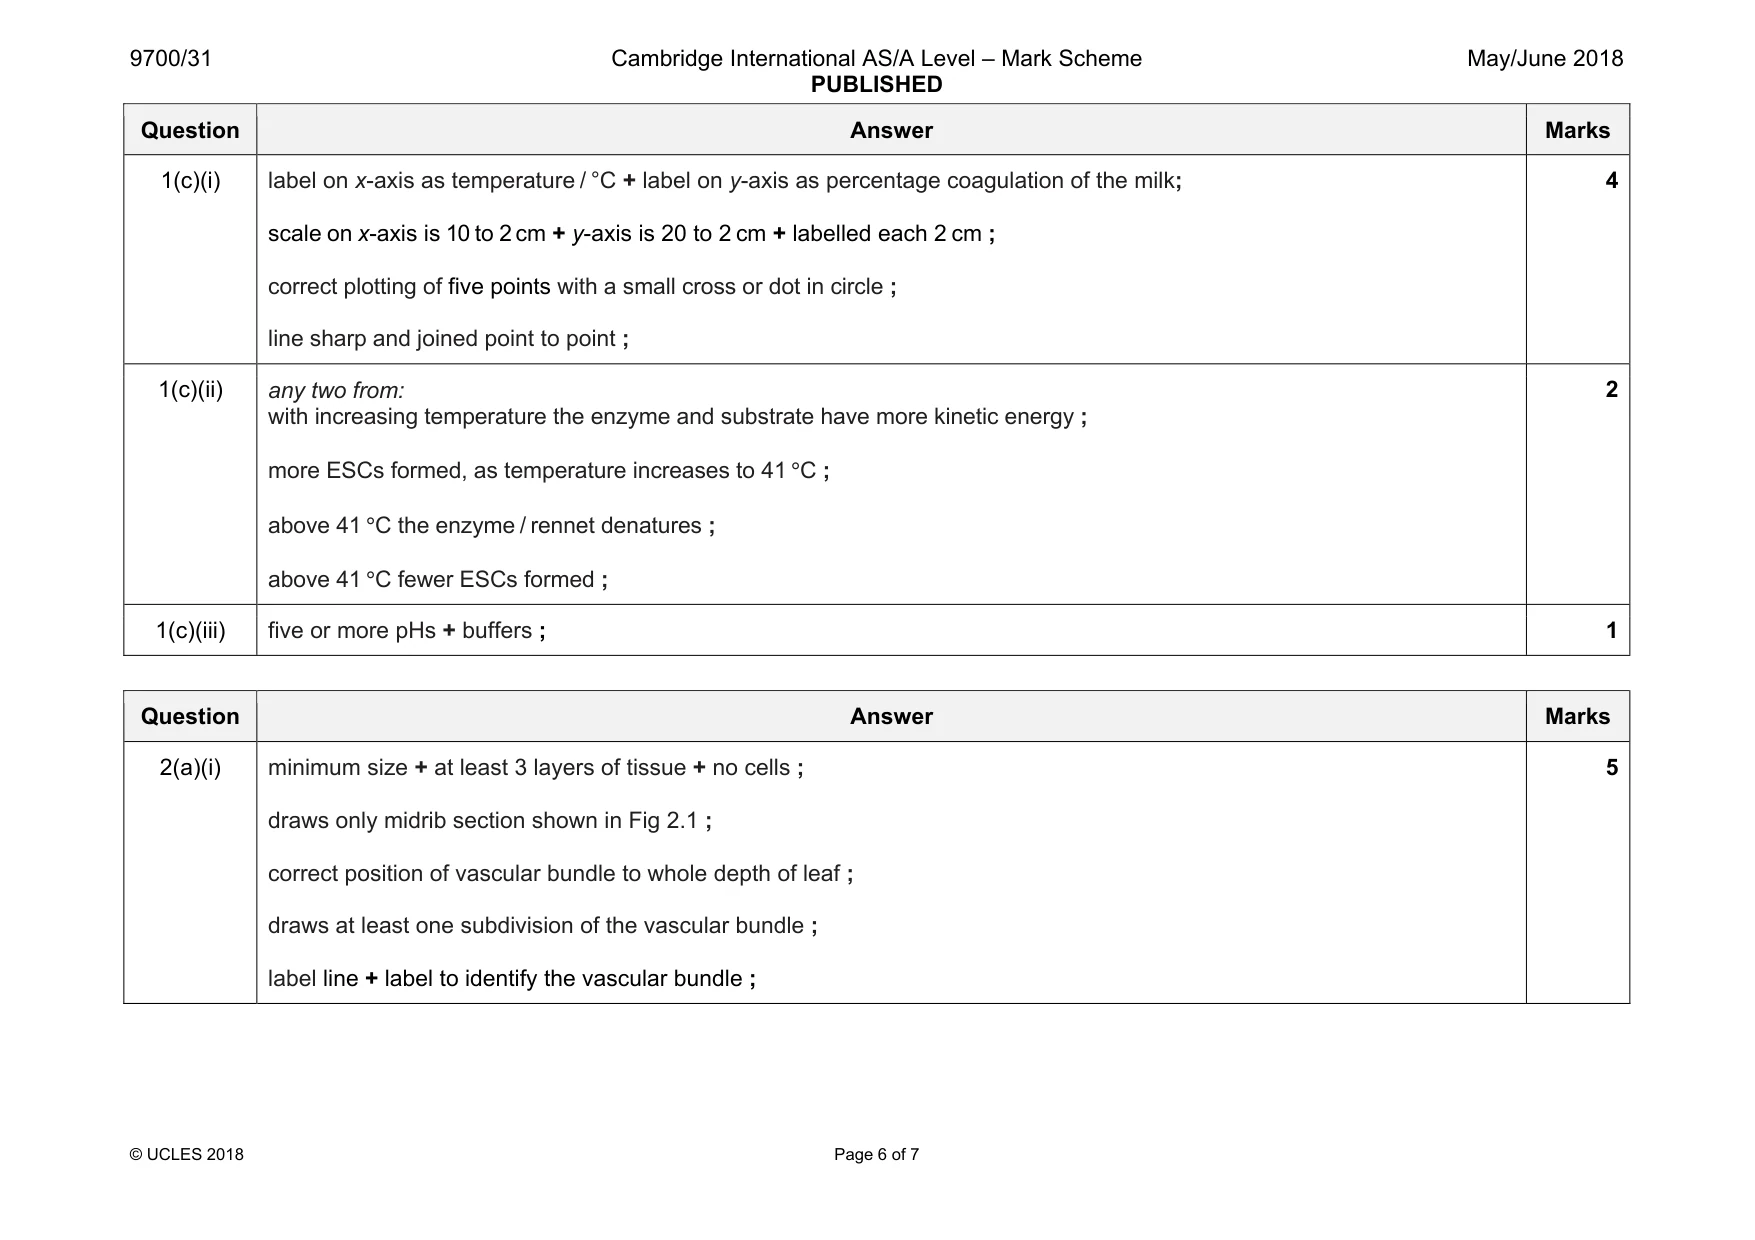
Mark scheme: 1(a)(i) 0.8, 0.6, 0.4, 0.2 ; correct volumes which add up to 10 ; 2 1(a)(ii) heading for percentage concentration of milk ; expected pattern of results ; only colours in key used ; 3 1(a)(iii) violet ; 1 1(a)(iv) correct answer according to results in (a)(ii) and (a)(iii) ; 1 1(a)(v) colorimeter or more colour standards ; drop size of milk or K varies / AVP ; ; volume using small syringe / graduated pipette / AVP ; 3 1(b)(i) heading for coagulation ; correct patterns of coagulation using key ; 2 1(b)(ii) four or five crosses recorded ; 1 1(b)(iii) the percentage concentrations from Table 1.2 on the scale ; puts U in the correct position for their results ; 2 Question Answer Marks 1(c)(i) label on x-axis as temperature / °C + label on y-axis as percentage coagulation of the milk; scale on x-axis is 10 to 2 cm + y-axis is 20 to 2 cm + labelled each 2 cm ; correct plotting of five points with a small cross or dot in circle ; line sharp and joined point to point ; 4 1(c)(ii) any two from: with increasing temperature the enzyme and substrate have more kinetic energy ; more ESCs formed, as temperature increases to 41 °C ; above 41 °C the enzyme / rennet denatures ; above 41 °C fewer ESCs formed ; 2 1(c)(iii) five or more pHs + buffers ; 1
Q2 · J1 is a slide of a stained transverse section through a plant leaf
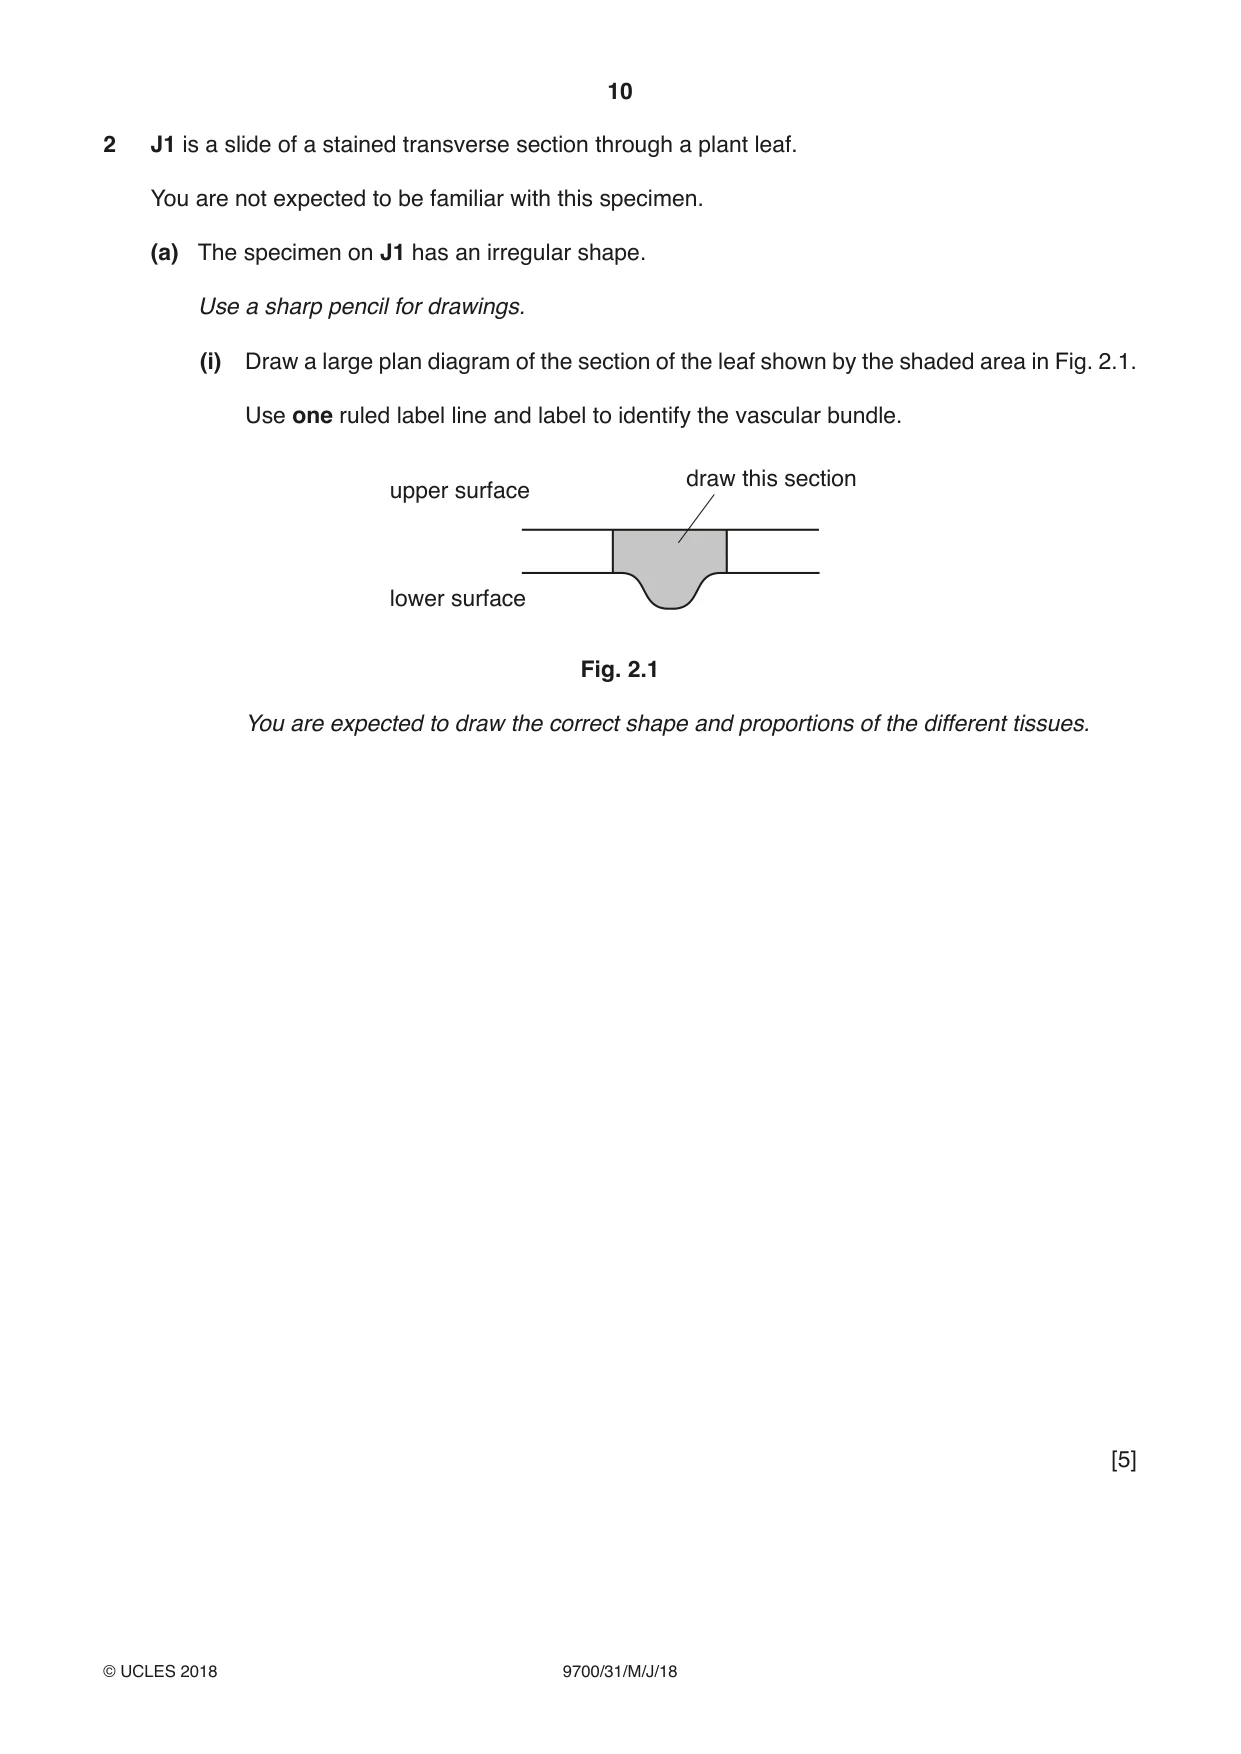
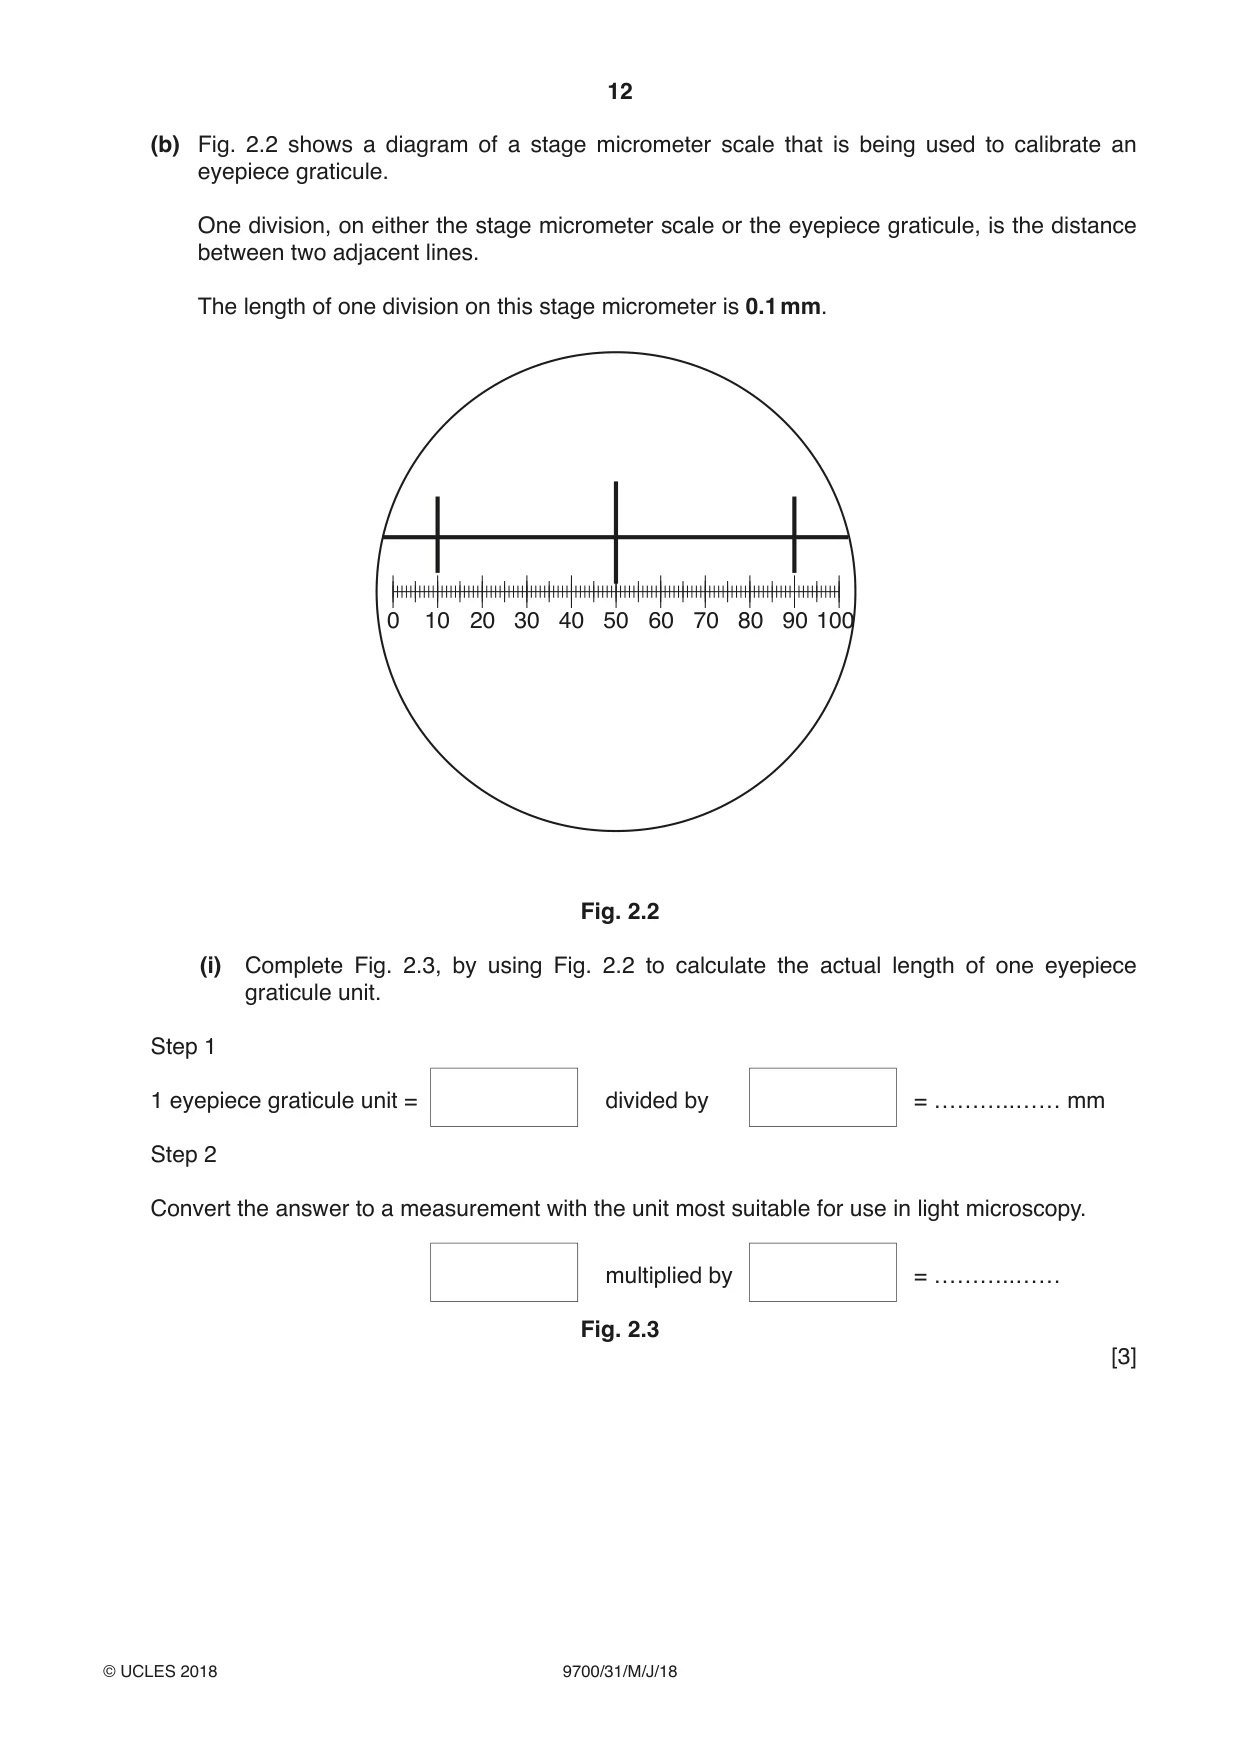
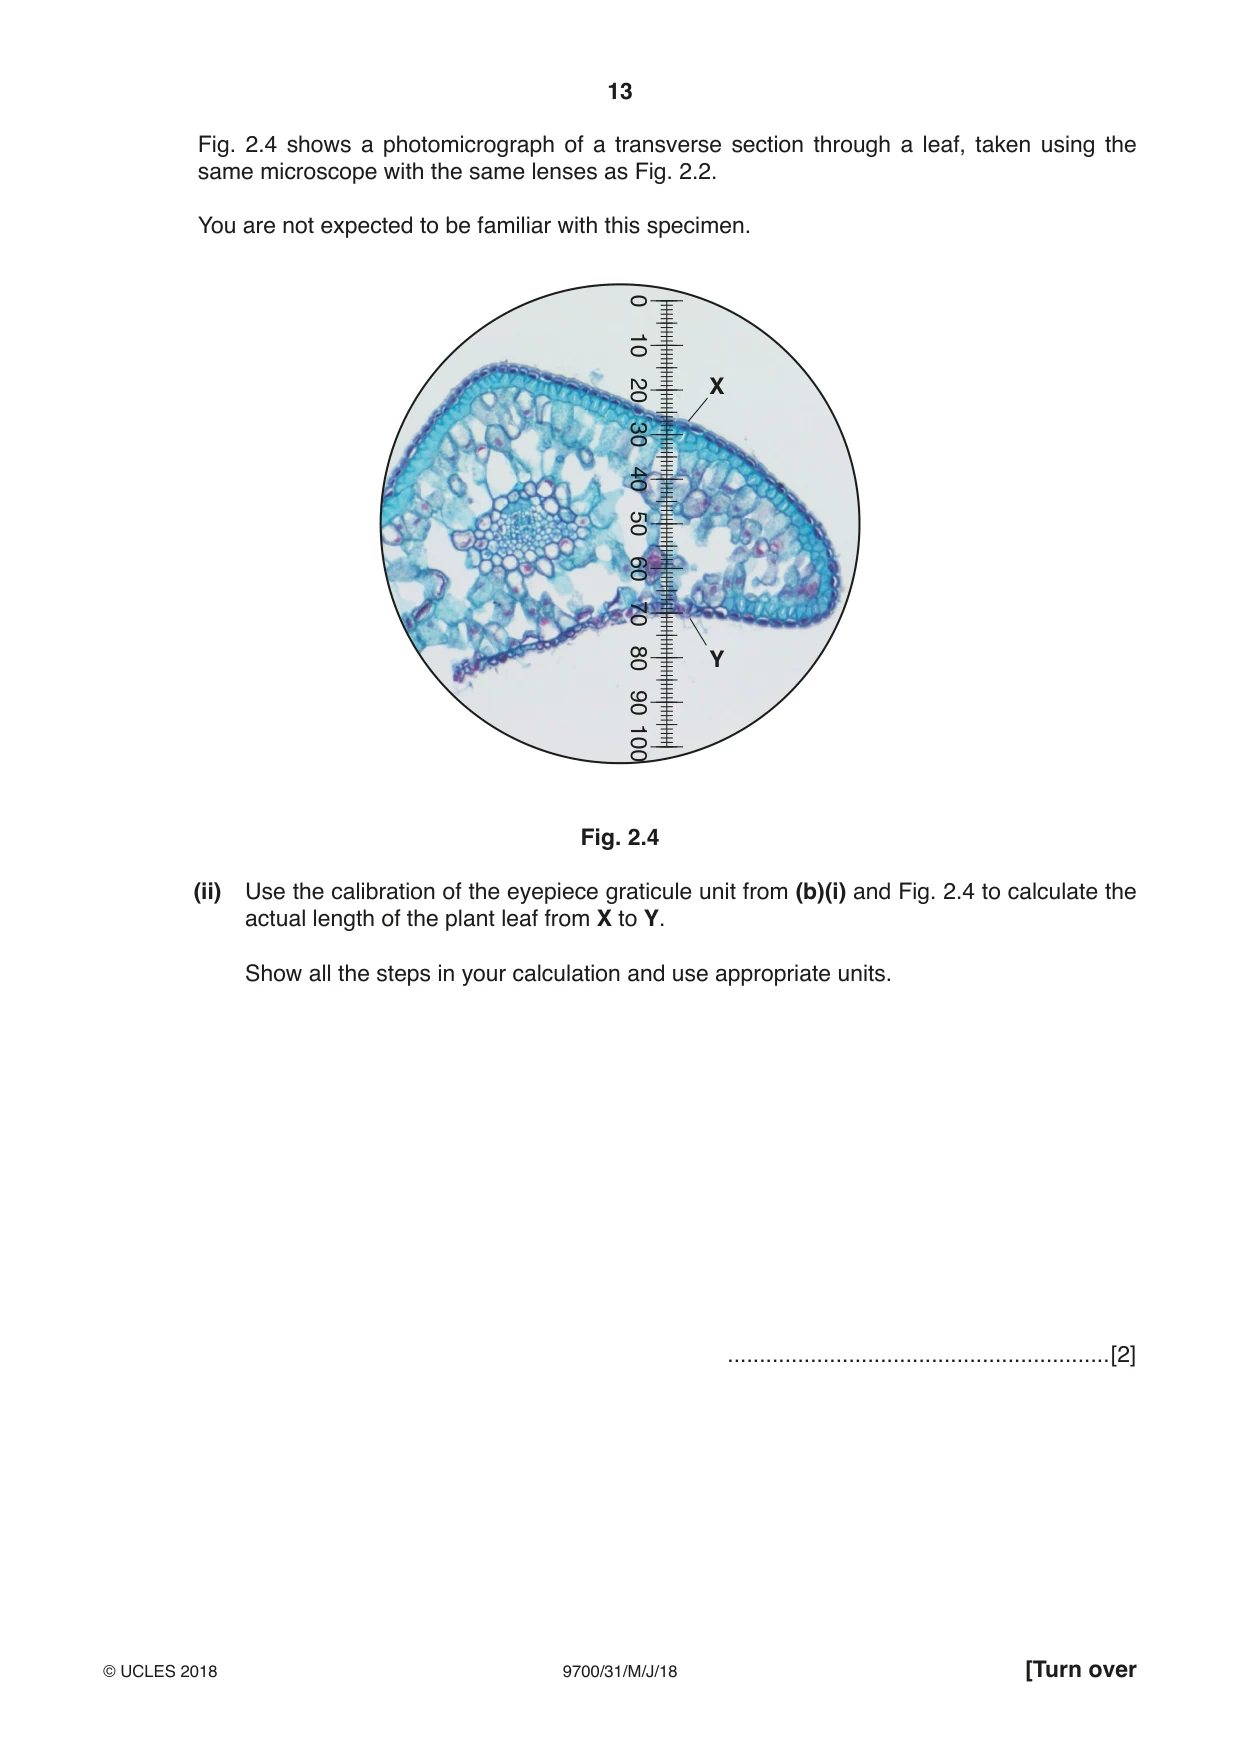
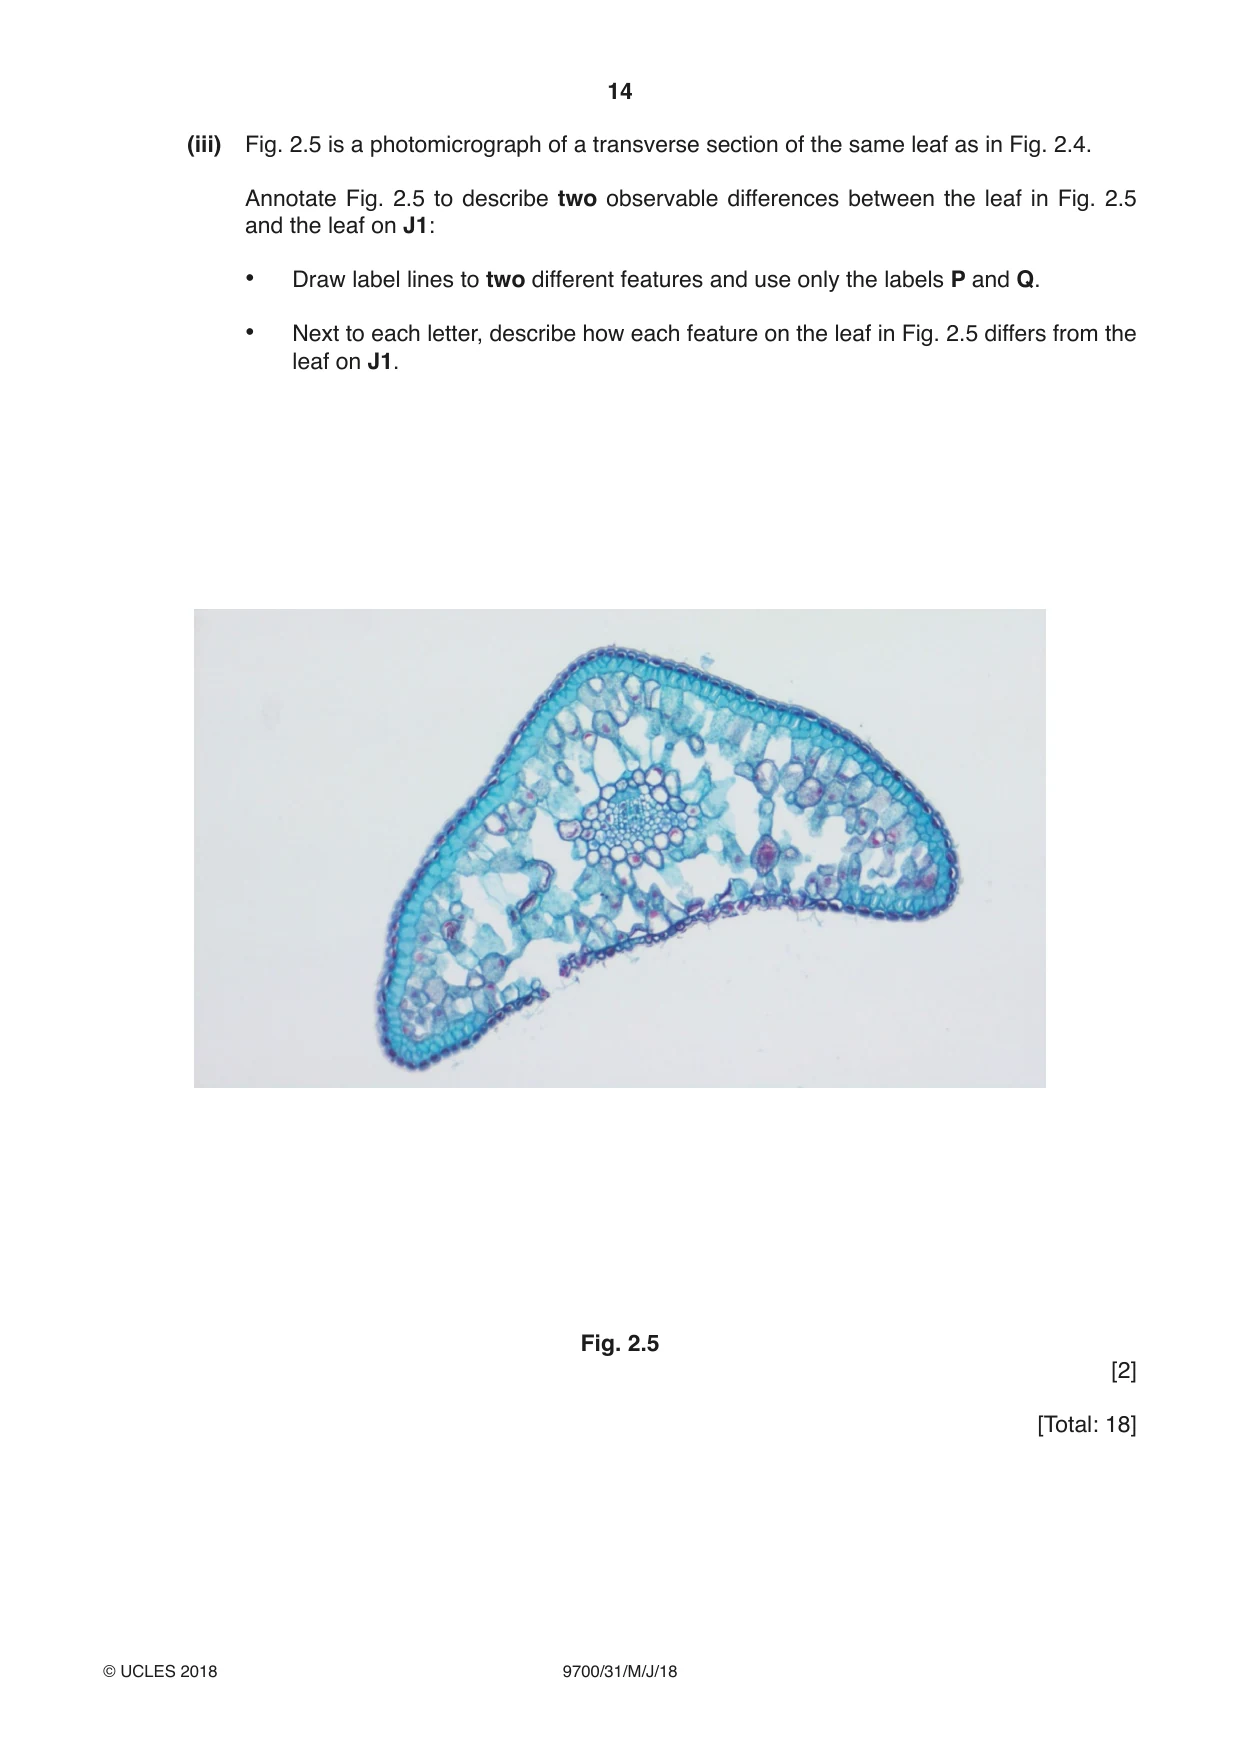
2 J1 is a slide of a stained transverse section through a plant leaf. You are not expected to be familiar with this specimen. (a) The specimen on J1 has an irregular shape. Use a sharp pencil for drawings. (i) Draw a large plan diagram of the section of the leaf shown by the shaded area in Fig. 2.1. Use one ruled label line and label to identify the vascular bundle. draw this section upper surface lower surface Fig. 2.1 You are expected to draw the correct shape and proportions of the different tissues. [5] (ii) Observe the upper epidermis and palisade layer in the leaf (see Fig. 2.1). Select one group of two adjacent, touching cells from the upper epidermis and one adjacent, touching cell from the palisade tissue below. Each cell must touch at least one of the other cells. Make a large drawing of this group of three cells. Use one ruled label line and label to identify the cell wall of one cell. [4] (iii) Observe the leaf on J1. Suggest one observable feature of J1 which supports the conclusion that this plant grows in a dry environment. Explain how this feature would prevent water loss. feature ............................................................................................................................... explanation ........................................................................................................................ ........................................................................................................................................... [2] (b) Fig. 2.2 shows a diagram of a stage micrometer scale that is being used to calibrate an eyepiece graticule. One division, on either the stage micrometer scale or the eyepiece graticule, is the distance between two adjacent lines. The length of one division on this stage micrometer is 0.1 mm. 0 10 20 30 40 50 60 70 80 90 100 Fig. 2.2 (i) Complete Fig. 2.3, by using Fig. 2.2 to calculate the actual length of one eyepiece graticule unit. Step 1 1 eyepiece graticule unit = divided by = ………..…… mm Step 2 Convert the answer to a measurement with the unit most suitable for use in light microscopy. multiplied by = ………..…… Fig. 2.3 [3]
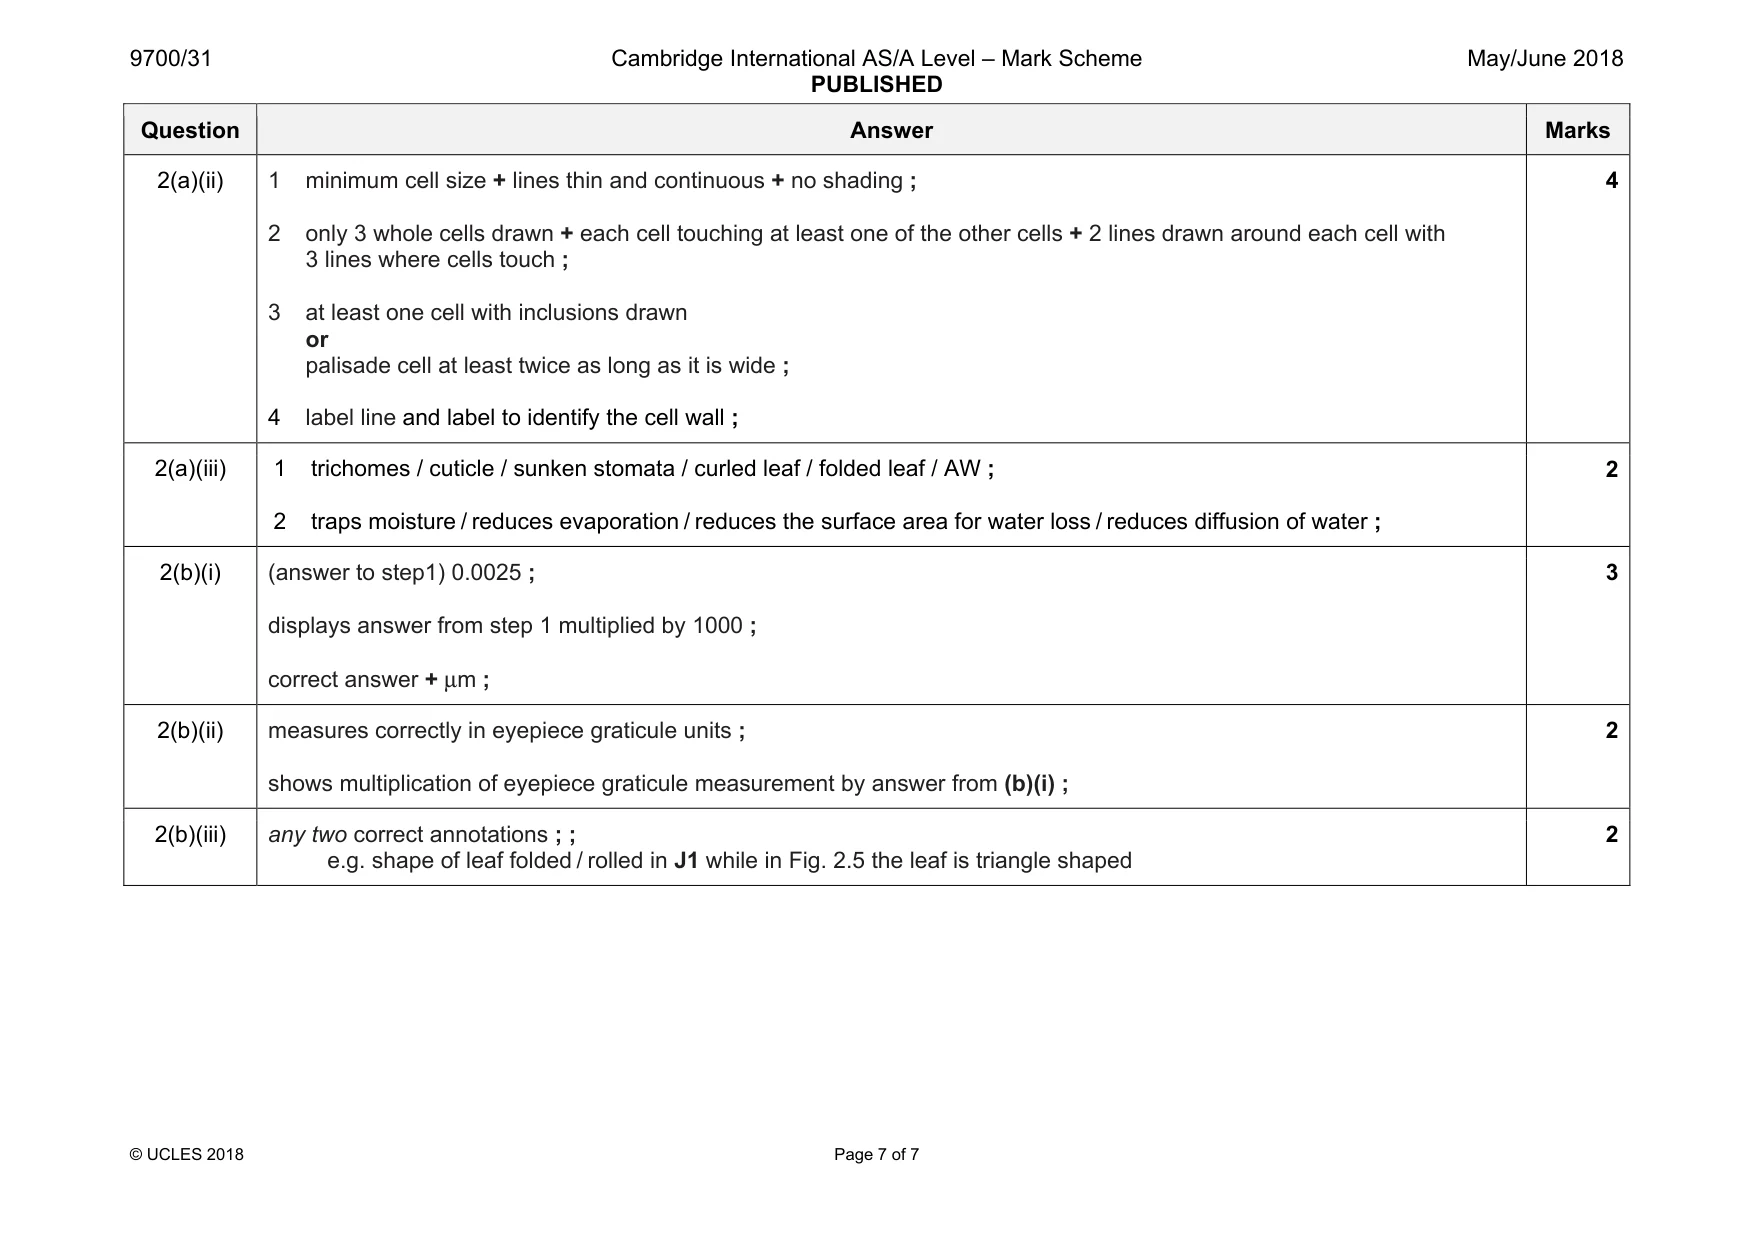
Mark scheme: 2(a)(i) minimum size + at least 3 layers of tissue + no cells ; draws only midrib section shown in Fig 2.1 ; correct position of vascular bundle to whole depth of leaf ; draws at least one subdivision of the vascular bundle ; label line + label to identify the vascular bundle ; 5 Question Answer Marks 2(a)(ii) 1 minimum cell size + lines thin and continuous + no shading ; 2 only 3 whole cells drawn + each cell touching at least one of the other cells + 2 lines drawn around each cell with 3 lines where cells touch ; 3 at least one cell with inclusions drawn or palisade cell at least twice as long as it is wide ; 4 label line and label to identify the cell wall ; 4 2(a)(iii) 1 trichomes / cuticle / sunken stomata / curled leaf / folded leaf / AW ; 2 traps moisture / reduces evaporation / reduces the surface area for water loss / reduces diffusion of water ; 2 2(b)(i) (answer to step1) 0.0025 ; displays answer from step 1 multiplied by 1000 ; correct answer + µm ; 3 2(b)(ii) measures correctly in eyepiece graticule units ; shows multiplication of eyepiece graticule measurement by answer from (b)(i) ; 2 2(b)(iii) any two correct annotations ; ; e.g. shape of leaf folded / rolled in J1 while in Fig. 2.5 the leaf is triangle shaped 2
What was in this paper
The subtopics covered by these 2 questions, and how many questions each got. Open one in a new tab to see every Cambridge question on it.
What you needed in this session
Cambridge’s own grade thresholds for 2018 May/June, Paper 3 · Variant 1. A higher threshold means an easier paper — the bar moves with how the cohort did.