Cambridge A Level Biology 9700 — 2018 May/June Paper 3 · Variant 2
9700/32/M/J/18 · 2 questions · 40 marks · ≈45 min
The question paper and its mark scheme, free to read here and free to download. This is Cambridge’s own paper, exactly as it was sat.
Question paper16 pages



Mark scheme7 pages
Answers below. Sit the paper first if you are practising.
Questions as text
Q1 · You are required to investigate the effect of concentration of hydrochloric acid…
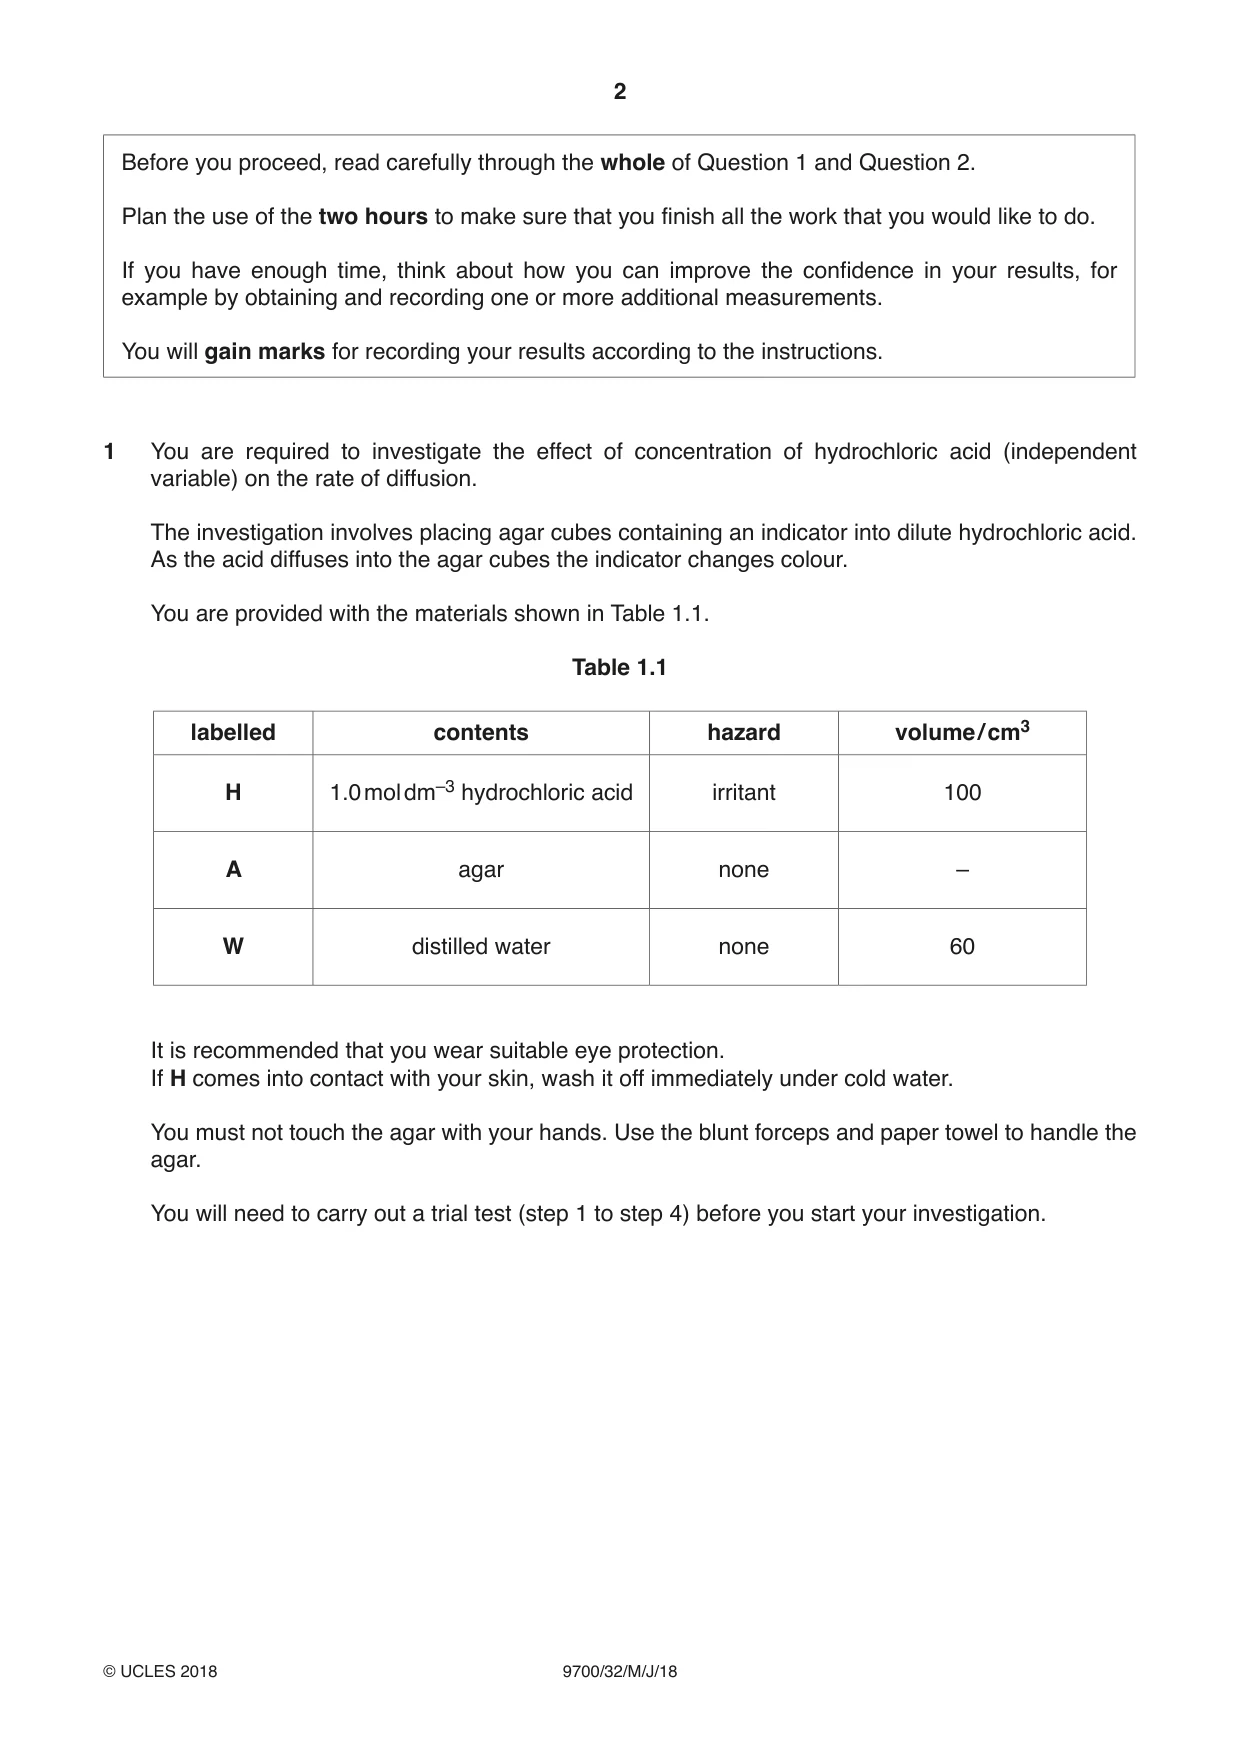
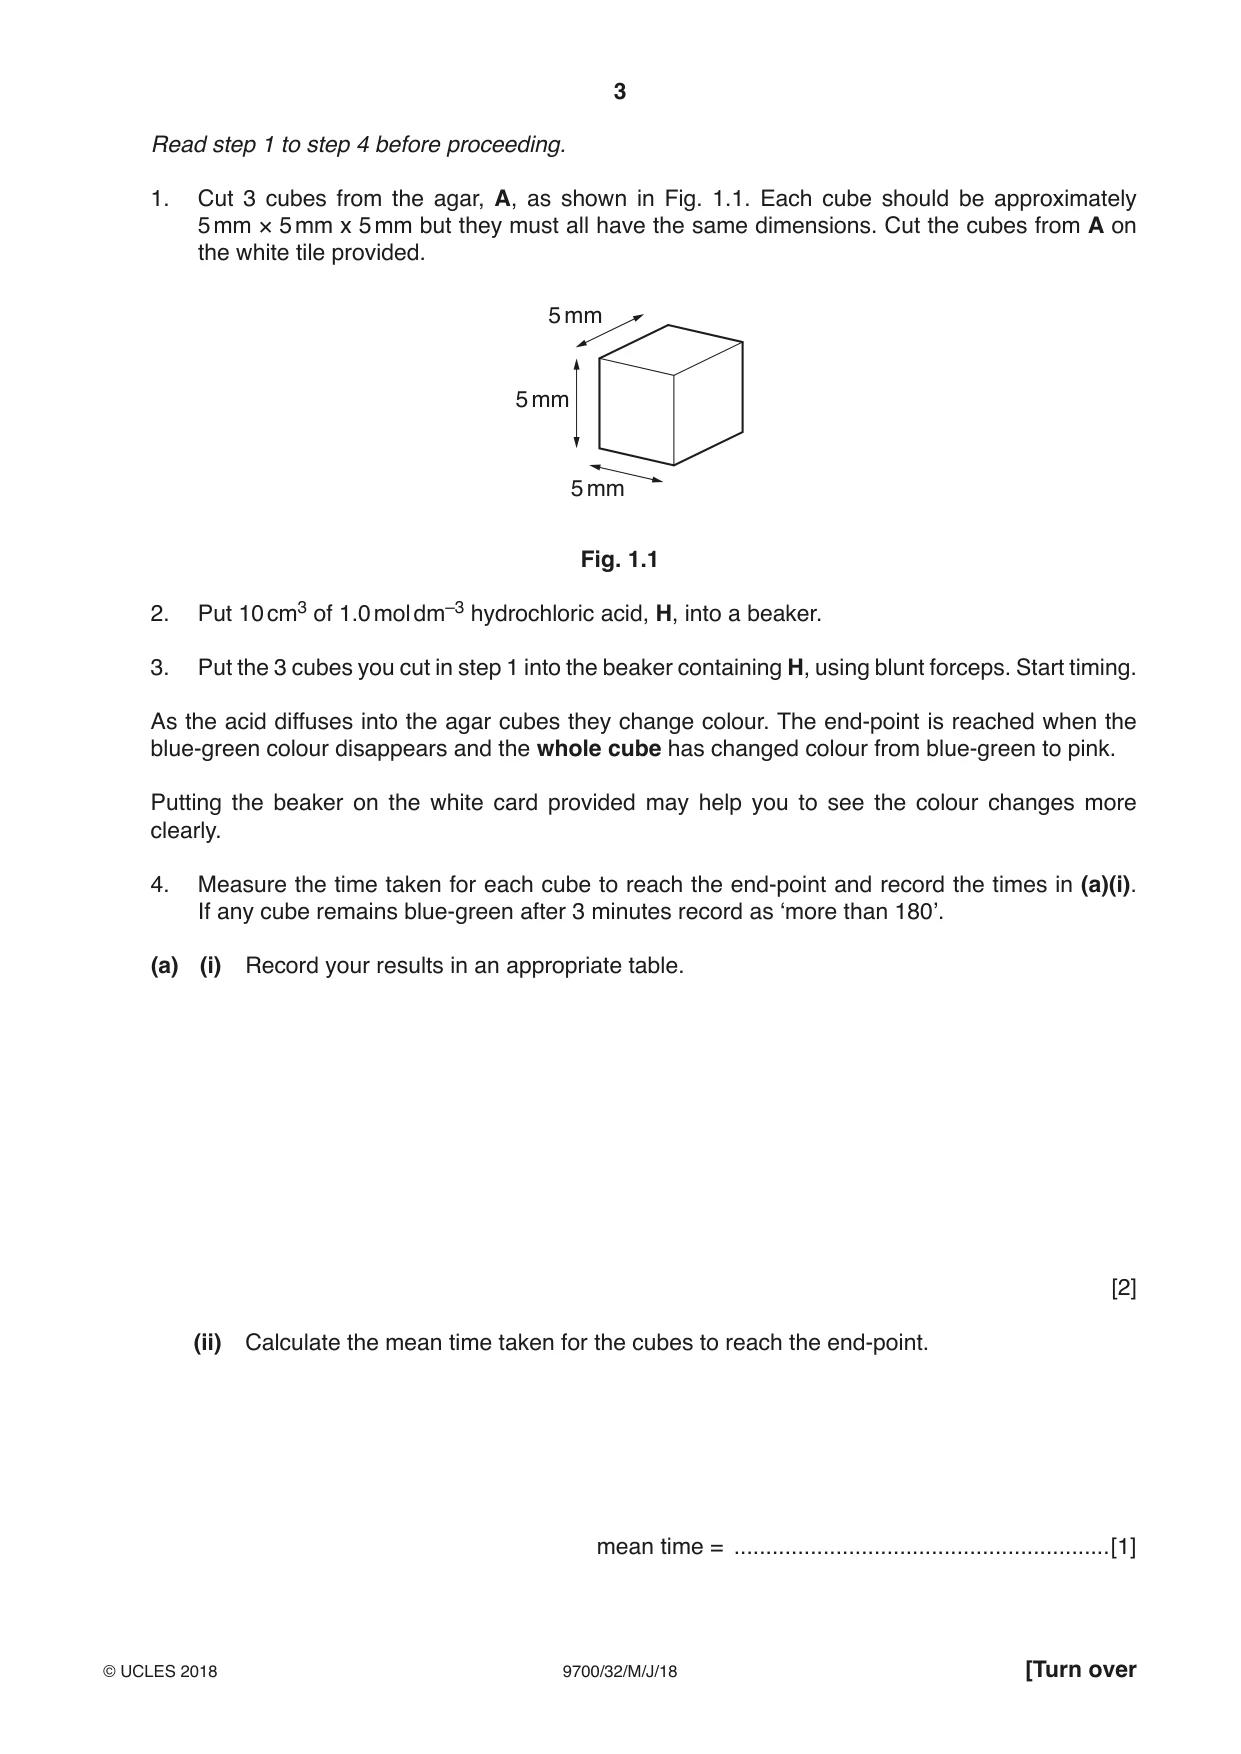
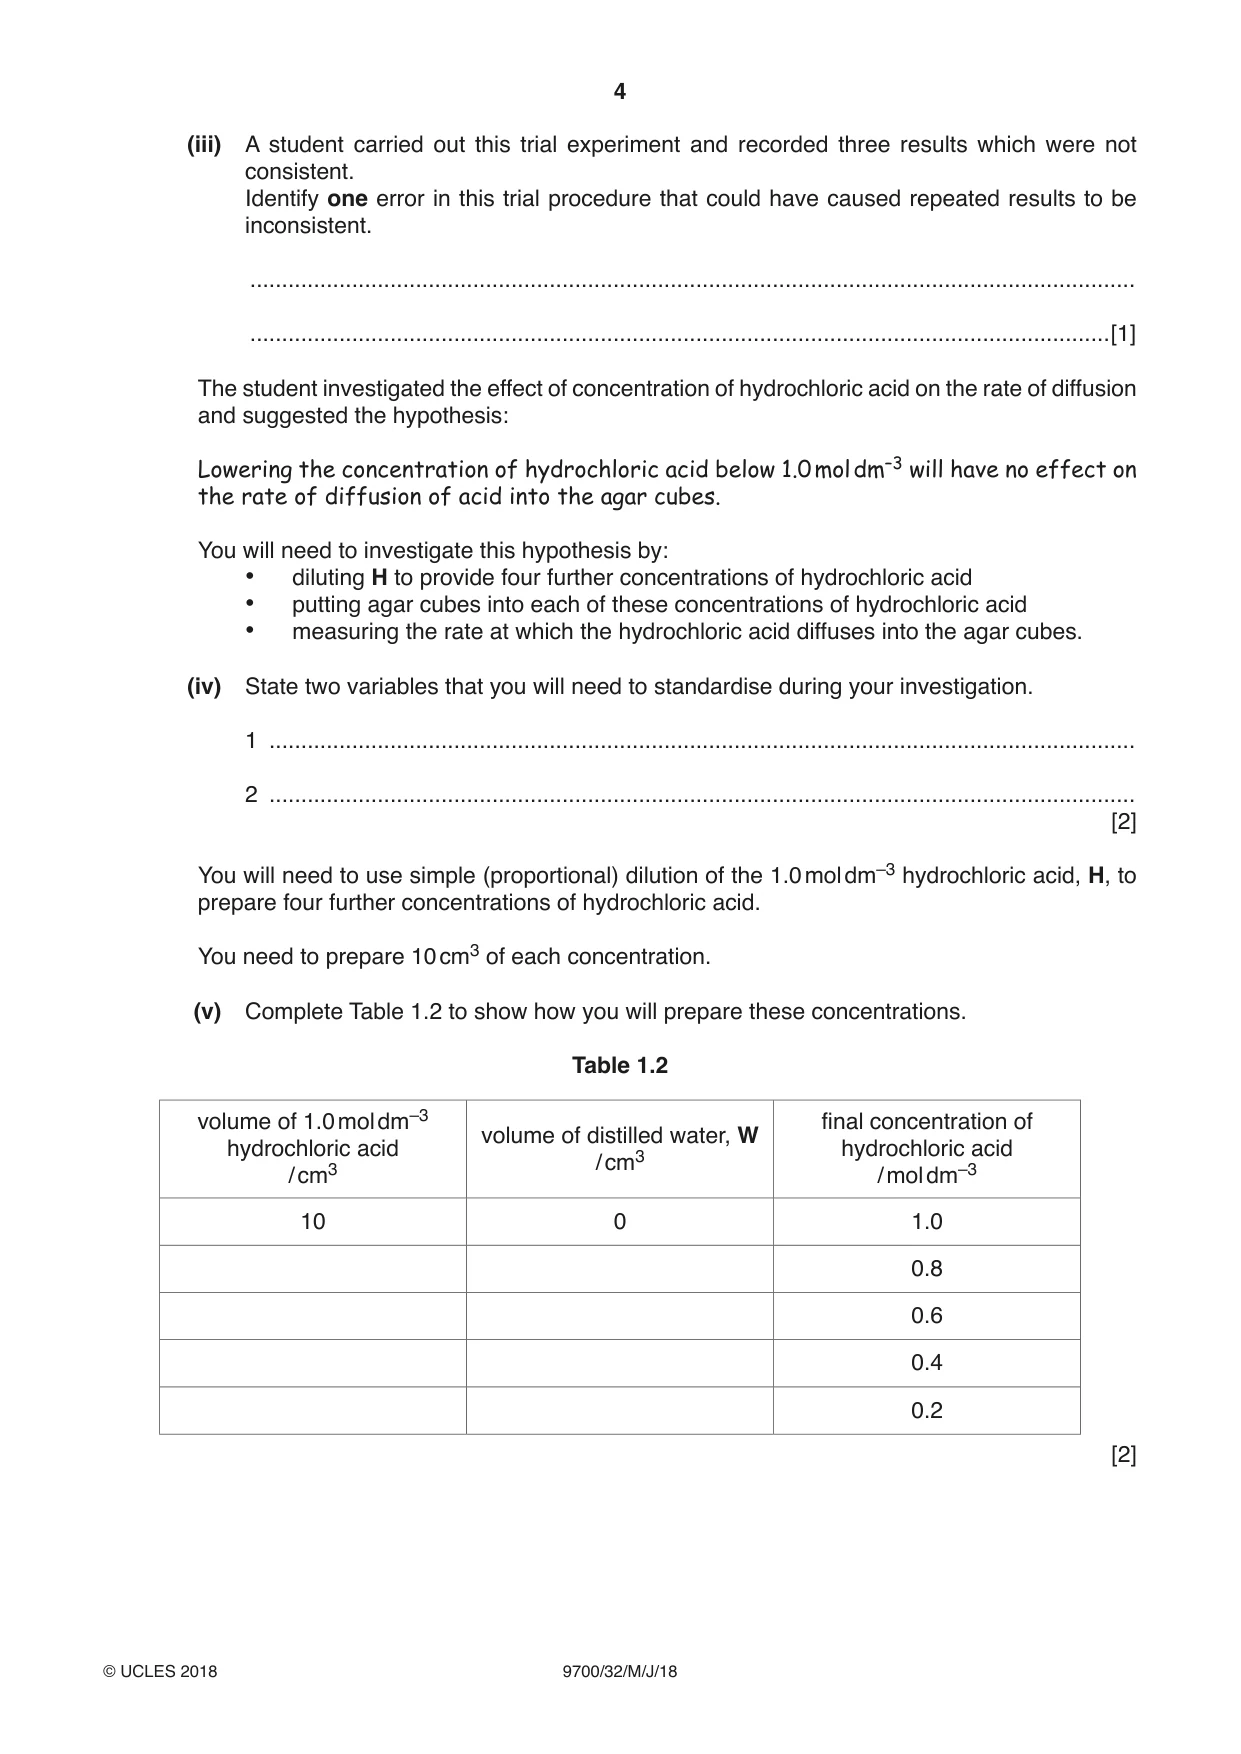
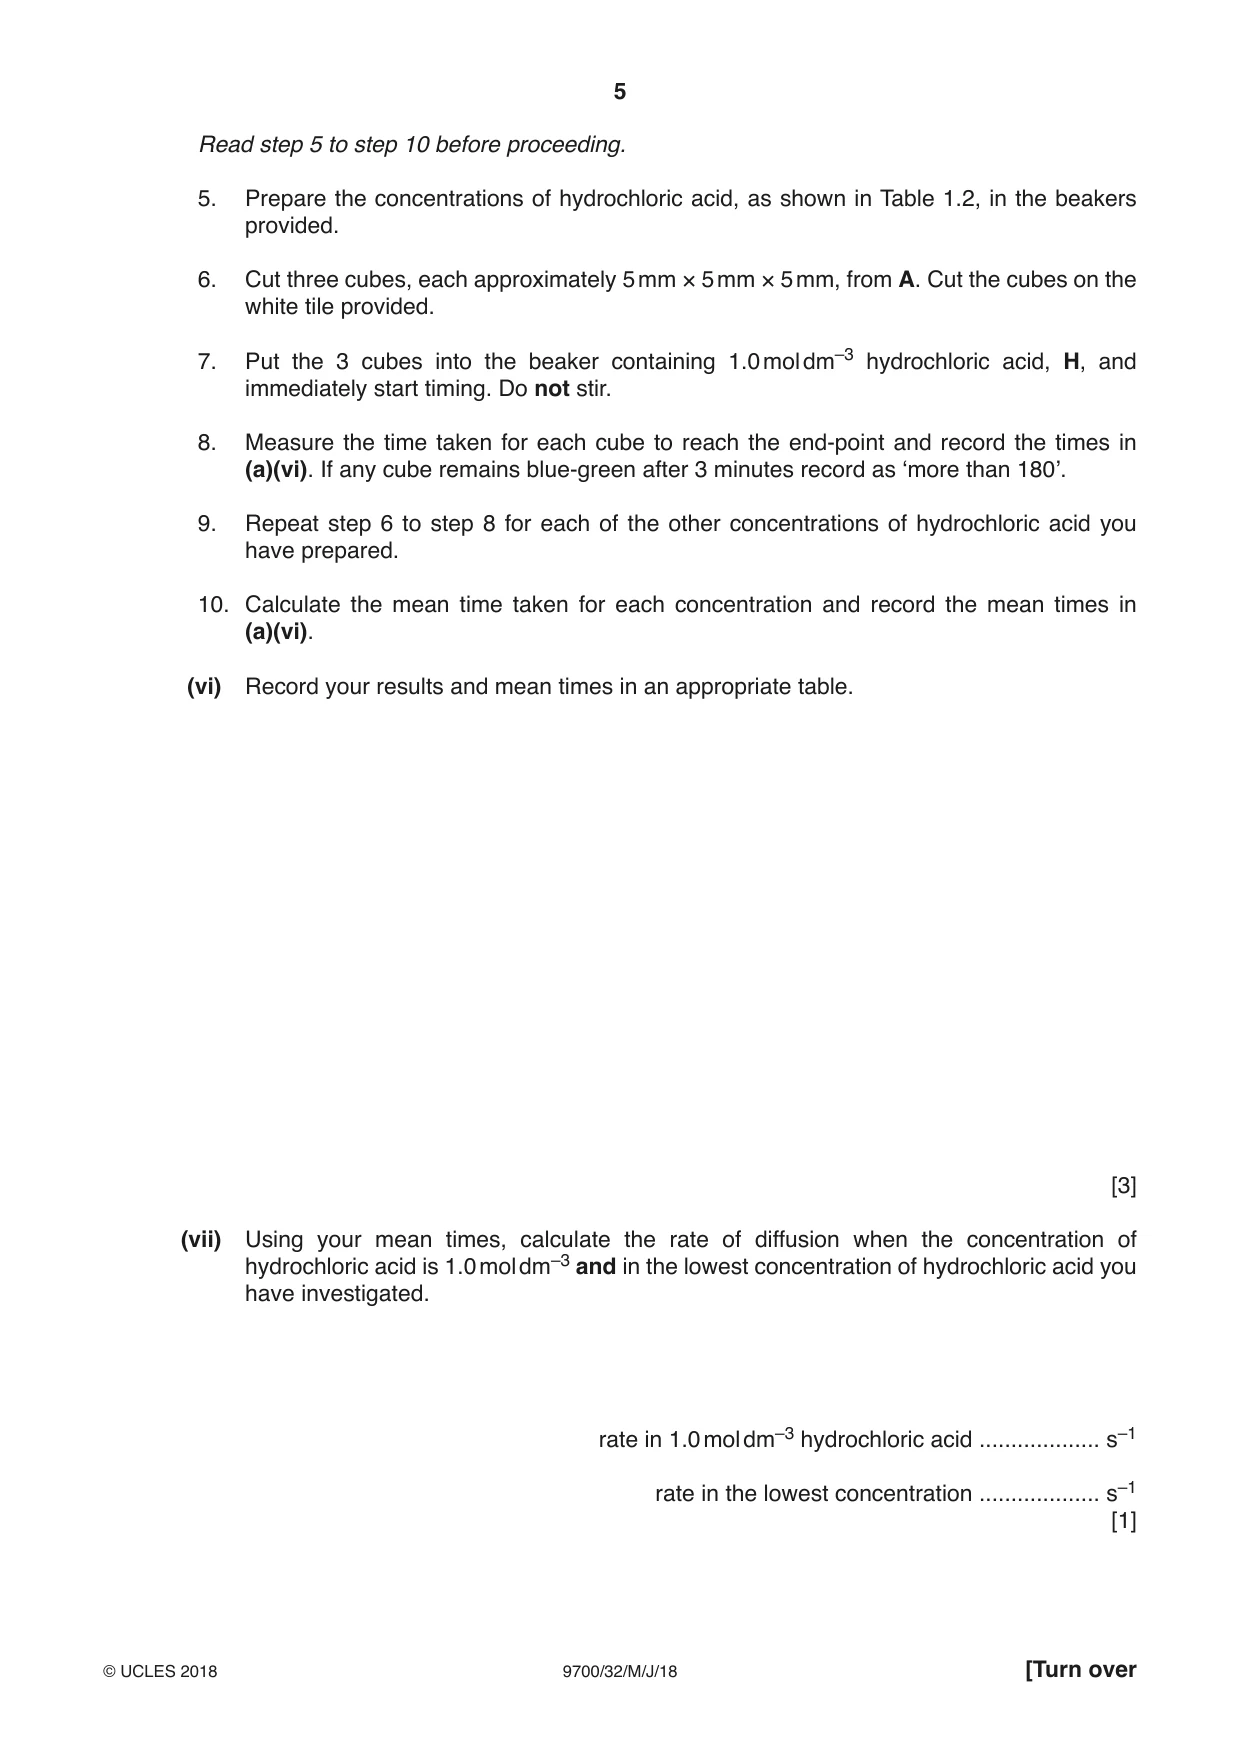
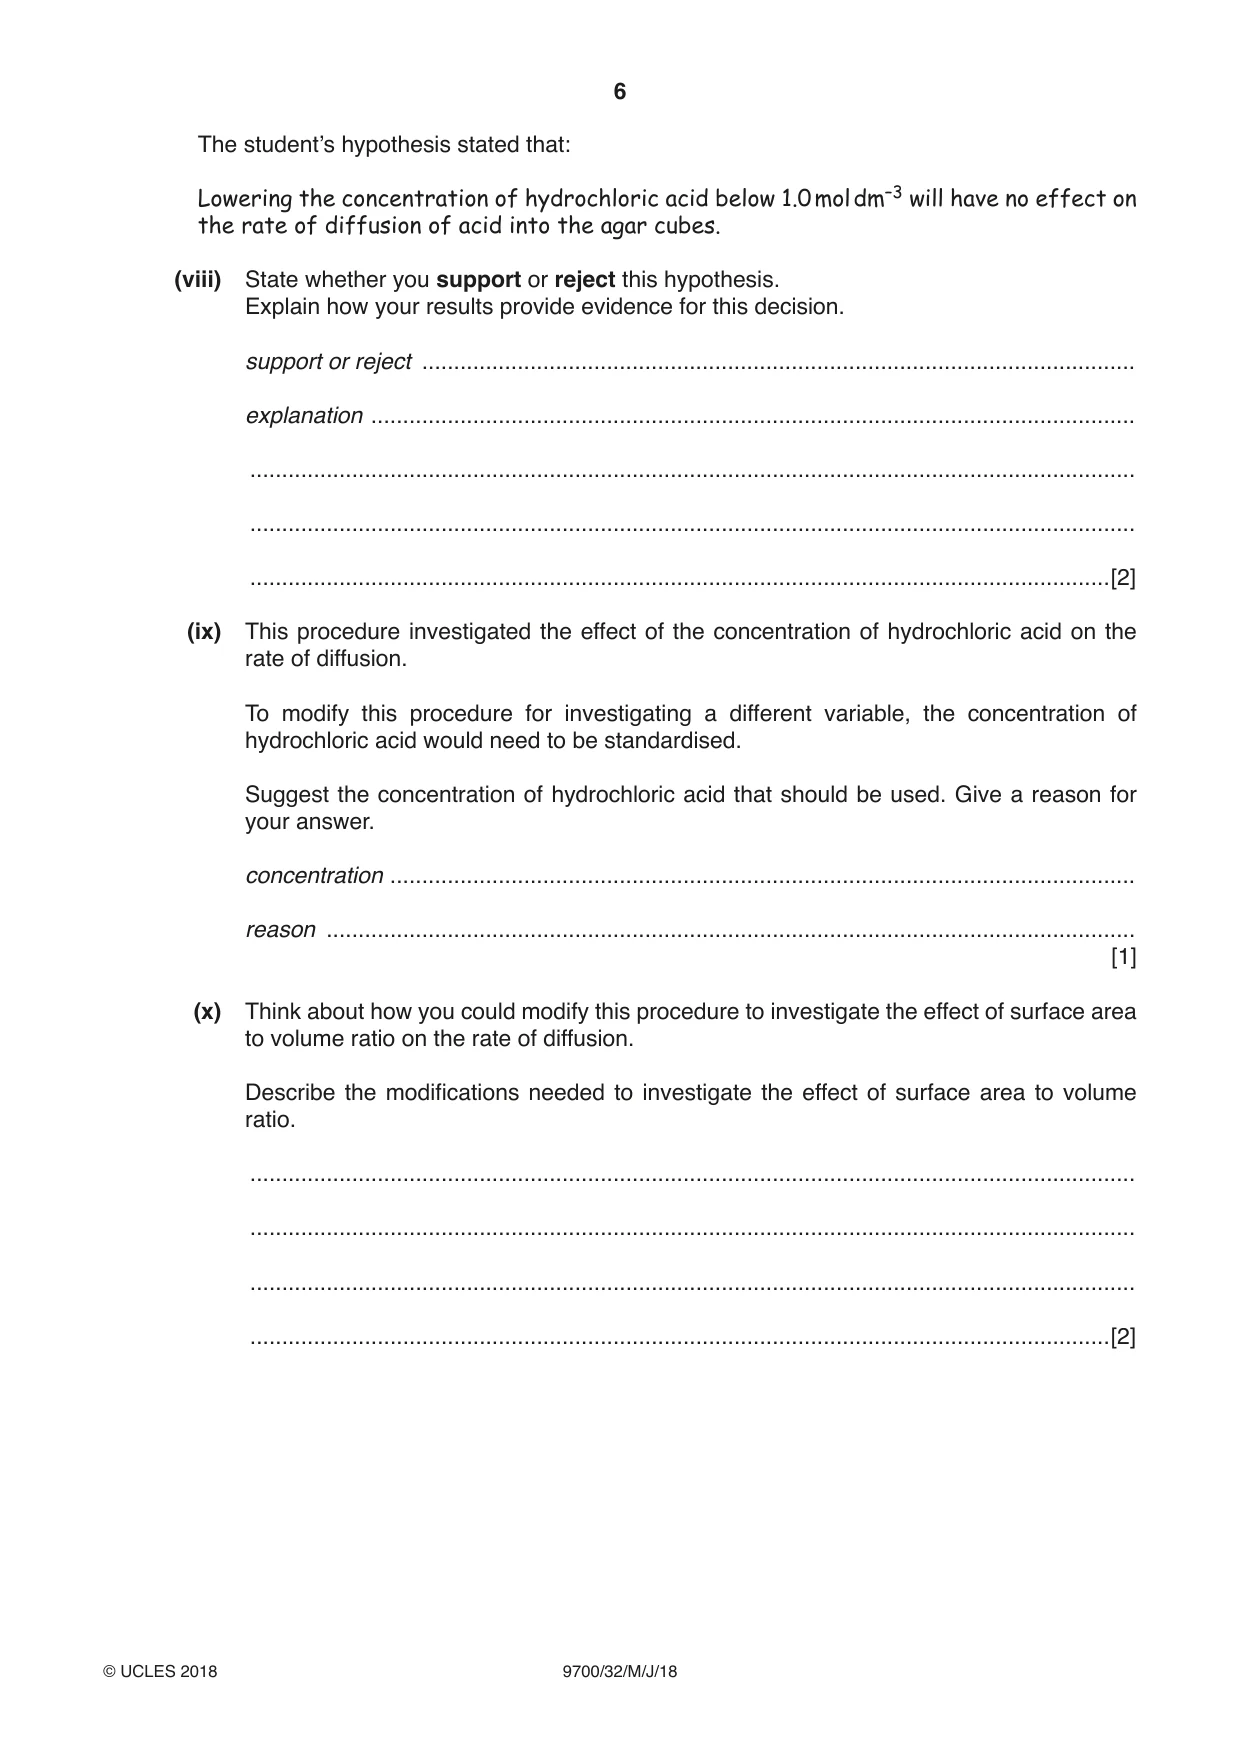
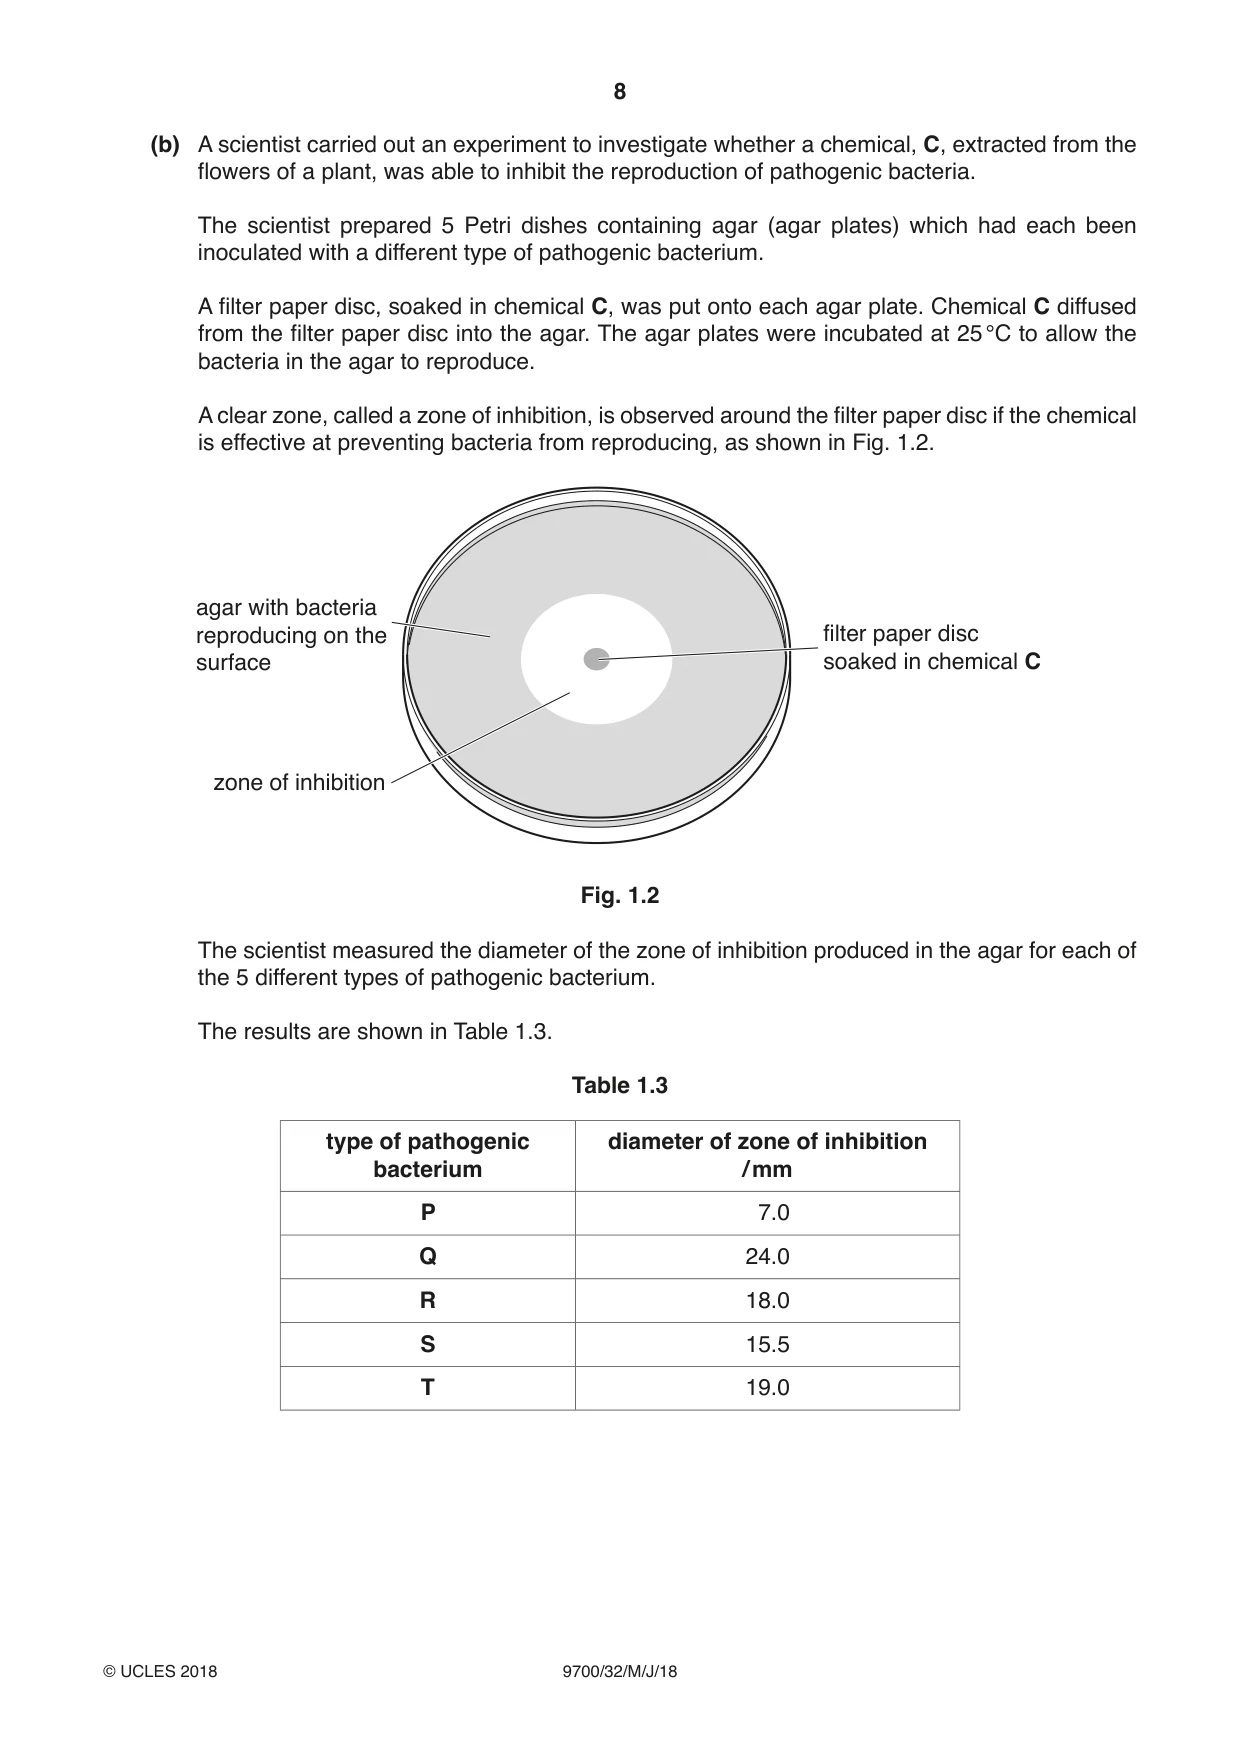
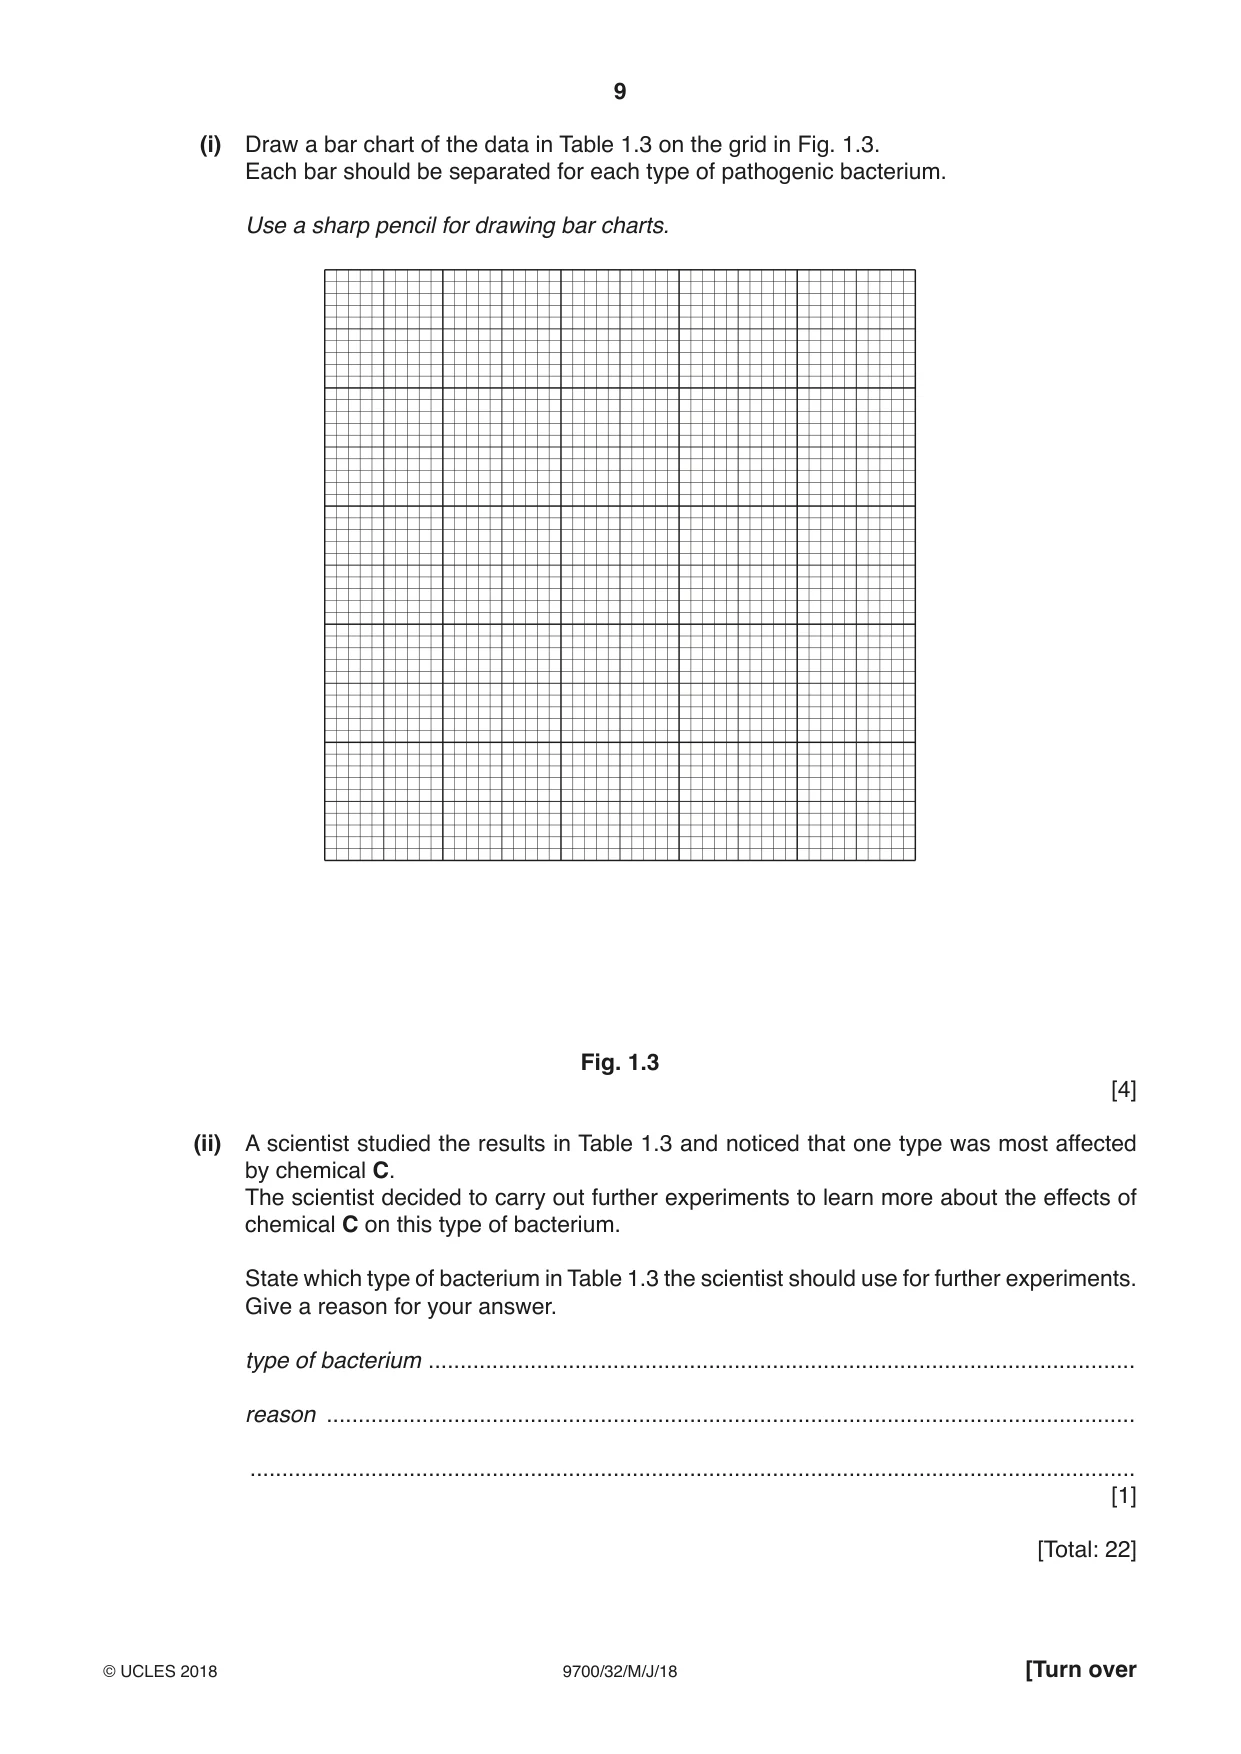
1 You are required to investigate the effect of concentration of hydrochloric acid (independent variable) on the rate of diffusion. The investigation involves placing agar cubes containing an indicator into dilute hydrochloric acid. As the acid diffuses into the agar cubes the indicator changes colour. You are provided with the materials shown in Table 1.1. Table 1.1 labelled contents hazard volume / cm3 H 1.0 mol dm–3 hydrochloric acid irritant 100 A agar none – W distilled water none 60 It is recommended that you wear suitable eye protection. If H comes into contact with your skin, wash it off immediately under cold water. You must not touch the agar with your hands. Use the blunt forceps and paper towel to handle the agar. You will need to carry out a trial test (step 1 to step 4) before you start your investigation. Read step 1 to step 4 before proceeding. 1. Cut 3 cubes from the agar, A, as shown in Fig. 1.1. Each cube should be approximately 5 mm × 5 mm x 5 mm but they must all have the same dimensions. Cut the cubes from A on the white tile provided. 5 mm 5 mm 5 mm Fig. 1.1 2. Put 10 cm3 of 1.0 mol dm–3 hydrochloric acid, H, into a beaker. 3. Put the 3 cubes you cut in step 1 into the beaker containing H, using blunt forceps. Start timing. As the acid diffuses into the agar cubes they change colour. The end-point is reached when the blue-green colour disappears and the whole cube has changed colour from blue-green to pink. Putting the beaker on the white card provided may help you to see the colour changes more clearly. 4. Measure the time taken for each cube to reach the end-point and record the times in (a)(i). If any cube remains blue-green after 3 minutes record as ‘more than 180’. (a) (i) Record your results in an appropriate table. [2] (ii) Calculate the mean time taken for the cubes to reach the end-point. mean time = ...........................................................[1] (iii) A student carried out this trial experiment and recorded three results which were not consistent. Identify one error in this trial procedure that could have caused repeated results to be inconsistent. ........................................................................................................................................... .......................................................................................................................................[1] The student investigated the effect of concentration of hydrochloric acid on the rate of diffusion and suggested the hypothesis: Lowering the concentration of hydrochloric acid below 1.0 mol dm–3 will have no effect on the rate of diffusion of acid into the agar cubes. You will need to investigate this hypothesis by: • diluting H to provide four further concentrations of hydrochloric acid • putting agar cubes into each of these concentrations of hydrochloric acid • measuring the rate at which the hydrochloric acid diffuses into the agar cubes. (iv) State two variables that you will need to standardise during your investigation. 1 ........................................................................................................................................ 2 ........................................................................................................................................ [2] You will need to use simple (proportional) dilution of the 1.0 mol dm–3 hydrochloric acid, H, to prepare four further concentrations of hydrochloric acid. You need to prepare 10 cm3 of each concentration. (v) Complete Table 1.2 to show how you will prepare these concentrations. Table 1.2 volume of 1.0 mol dm–3 final concentration of volume of distilled water, W hydrochloric acid hydrochloric acid / cm3 / cm3 / mol dm–3 10 0 1.0 0.8 0.6 0.4 0.2 [2] Read step 5 to step 10 before proceeding. 5. Prepare the concentrations of hydrochloric acid, as shown in Table 1.2, in the beakers provided. 6. Cut three cubes, each approximately 5 mm × 5 mm × 5 mm, from A. Cut the cubes on the white tile provided. 7. Put the 3 cubes into the beaker containing 1.0 mol dm–3 hydrochloric acid, H, and immediately start timing. Do not stir. 8. Measure the time taken for each cube to reach the end-point and record the times in (a)(vi). If any cube remains blue-green after 3 minutes record as ‘more than 180’. 9. Repeat step 6 to step 8 for each of the other concentrations of hydrochloric acid you have prepared. 10. Calculate the mean time taken for each concentration and record the mean times in (a)(vi). (vi) Record your results and mean times in an appropriate table. [3] (vii) Using your mean times, calculate the rate of diffusion when the concentration of hydrochloric acid is 1.0 mol dm–3 and in the lowest concentration of hydrochloric acid you have investigated. rate in 1.0 mol dm–3 hydrochloric acid ................... s–1 rate in the lowest concentration ................... s–1 [1] The student’s hypothesis stated that: Lowering the concentration of hydrochloric acid below 1.0 mol dm–3 will have no effect on the rate of diffusion of acid into the agar cubes. (viii) State whether you support or reject this hypothesis. Explain how your results provide evidence for this decision. support or reject ................................................................................................................ explanation ........................................................................................................................ ........................................................................................................................................... ........................................................................................................................................... .......................................................................................................................................[2] (ix) This procedure investigated the effect of the concentration of hydrochloric acid on the rate of diffusion. To modify this procedure for investigating a different variable, the concentration of hydrochloric acid would need to be standardised. Suggest the concentration of hydrochloric acid that should be used. Give a reason for your answer. concentration ..................................................................................................................... reason ............................................................................................................................... [1] (x) Think about how you could modify this procedure to investigate the effect of surface area to volume ratio on the rate of diffusion. Describe the modifications needed to investigate the effect of surface area to volume ratio. ........................................................................................................................................... ........................................................................................................................................... ........................................................................................................................................... .......................................................................................................................................[2] Question 1 continues on page 8 (b) A scientist carried out an experiment to investigate whether a chemical, C, extracted from the flowers of a plant, was able to inhibit the reproduction of pathogenic bacteria. The scientist prepared 5 Petri dishes containing agar (agar plates) which had each been inoculated with a different type of pathogenic bacterium. A filter paper disc, soaked in chemical C, was put onto each agar plate. Chemical C diffused from the filter paper disc into the agar. The agar plates were incubated at 25 °C to allow the bacteria in the agar to reproduce. A clear zone, called a zone of inhibition, is observed around the filter paper disc if the chemical is effective at preventing bacteria from reproducing, as shown in Fig. 1.2. agar with bacteria reproducing on the filter paper disc surface soaked in chemical C zone of inhibition Fig. 1.2 The scientist measured the diameter of the zone of inhibition produced in the agar for each of the 5 different types of pathogenic bacterium. The results are shown in Table 1.3. Table 1.3 type of pathogenic diameter of zone of inhibition bacterium / mm P 7.0 Q 24.0 R 18.0 S 15.5 T 19.0 (i) Draw a bar chart of the data in Table 1.3 on the grid in Fig. 1.3. Each bar should be separated for each type of pathogenic bacterium. Use a sharp pencil for drawing bar charts. Fig. 1.3 [4] (ii) A scientist studied the results in Table 1.3 and noticed that one type was most affected by chemical C. The scientist decided to carry out further experiments to learn more about the effects of chemical C on this type of bacterium. State which type of bacterium in Table 1.3 the scientist should use for further experiments. Give a reason for your answer. type of bacterium ............................................................................................................... reason ............................................................................................................................... ........................................................................................................................................... [1] [Total: 22]
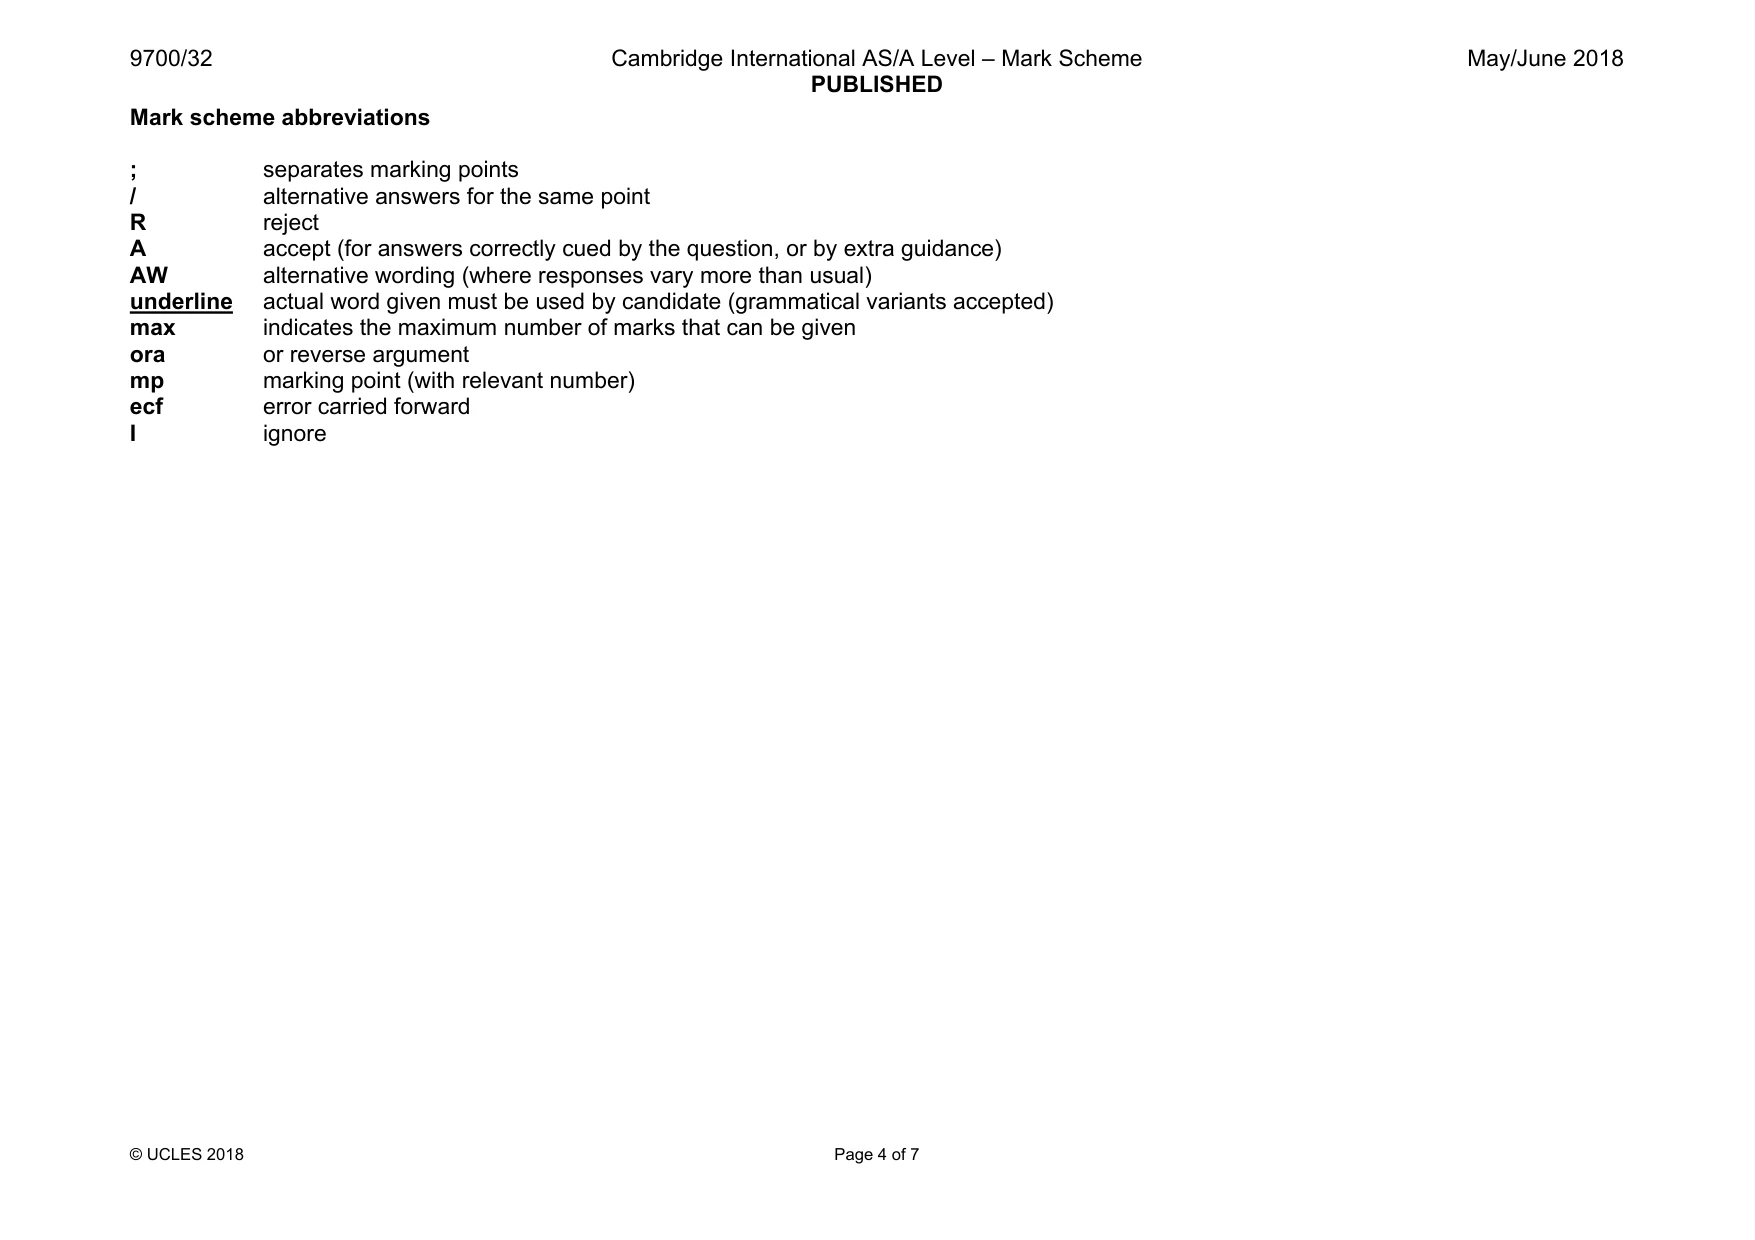
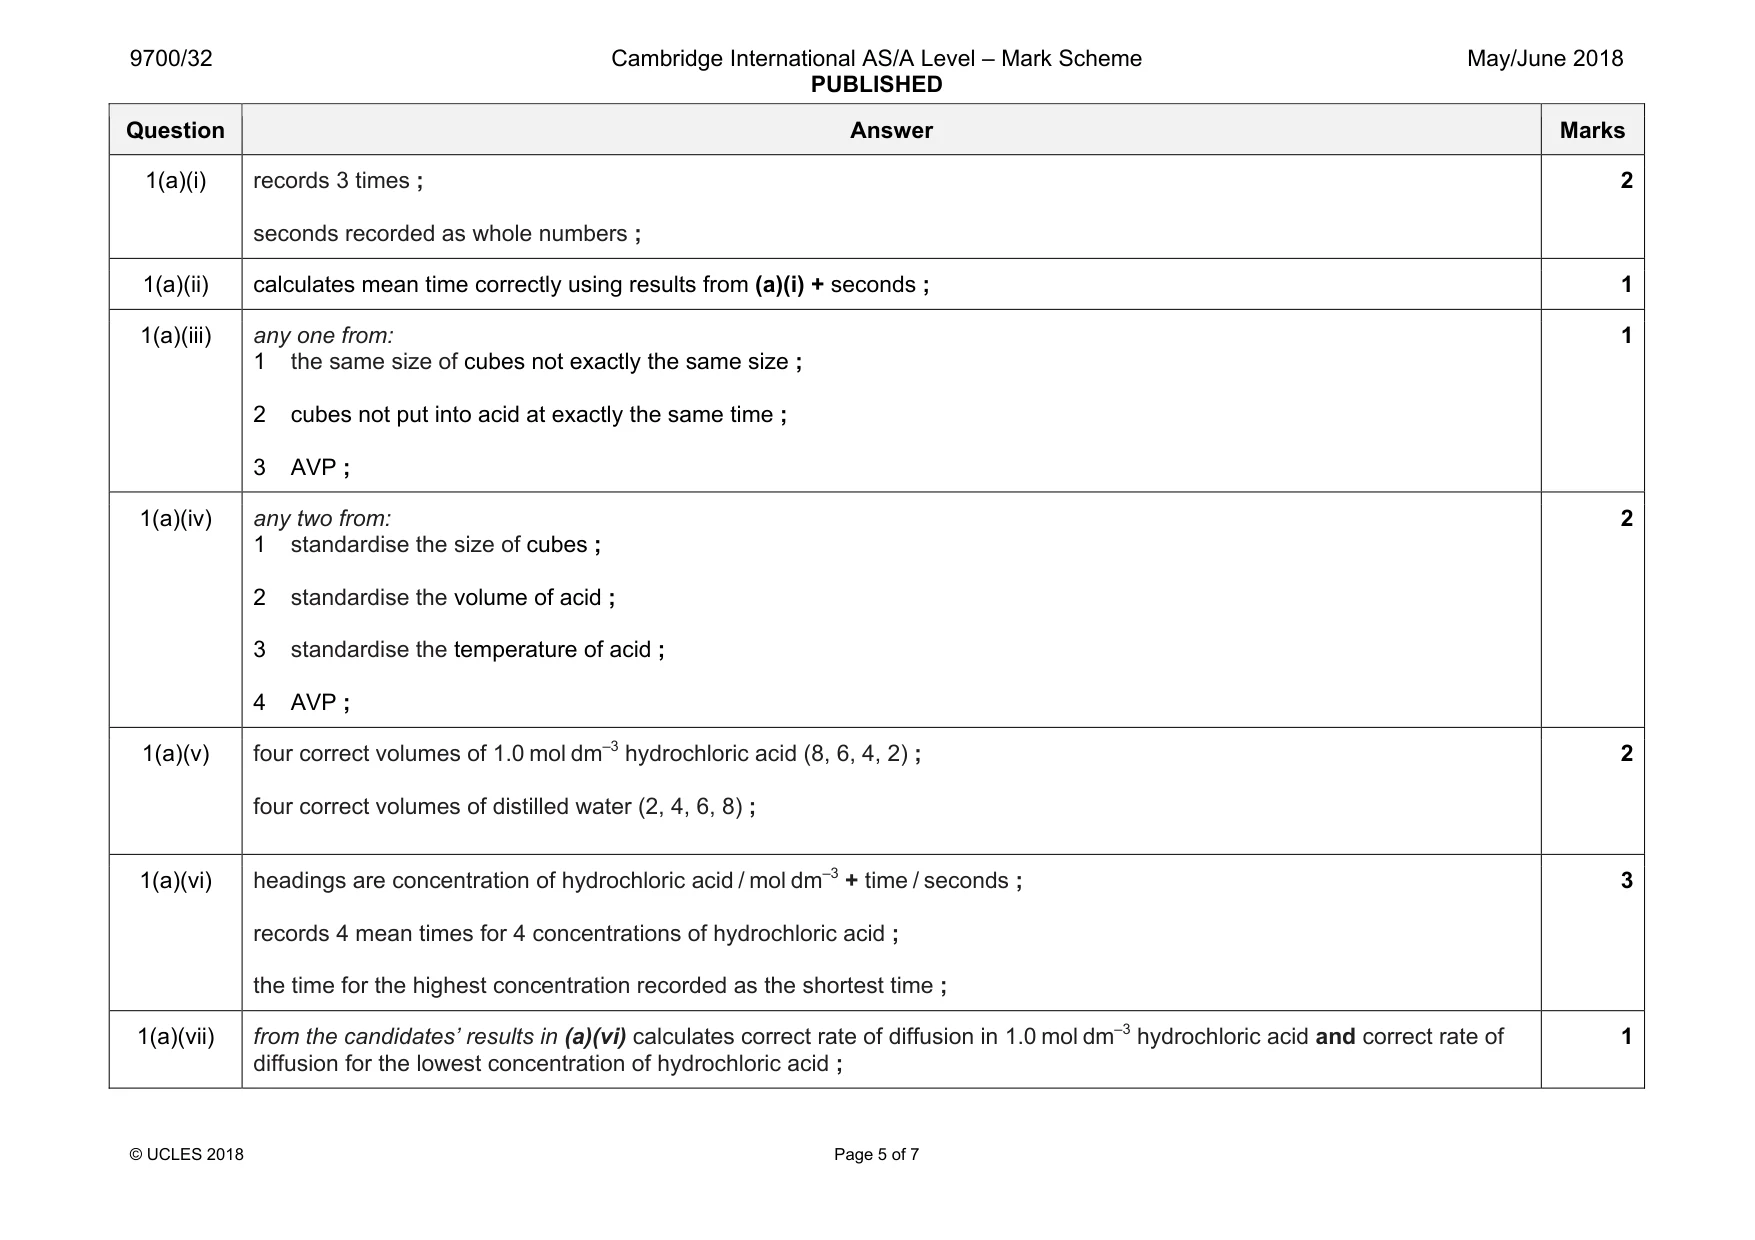
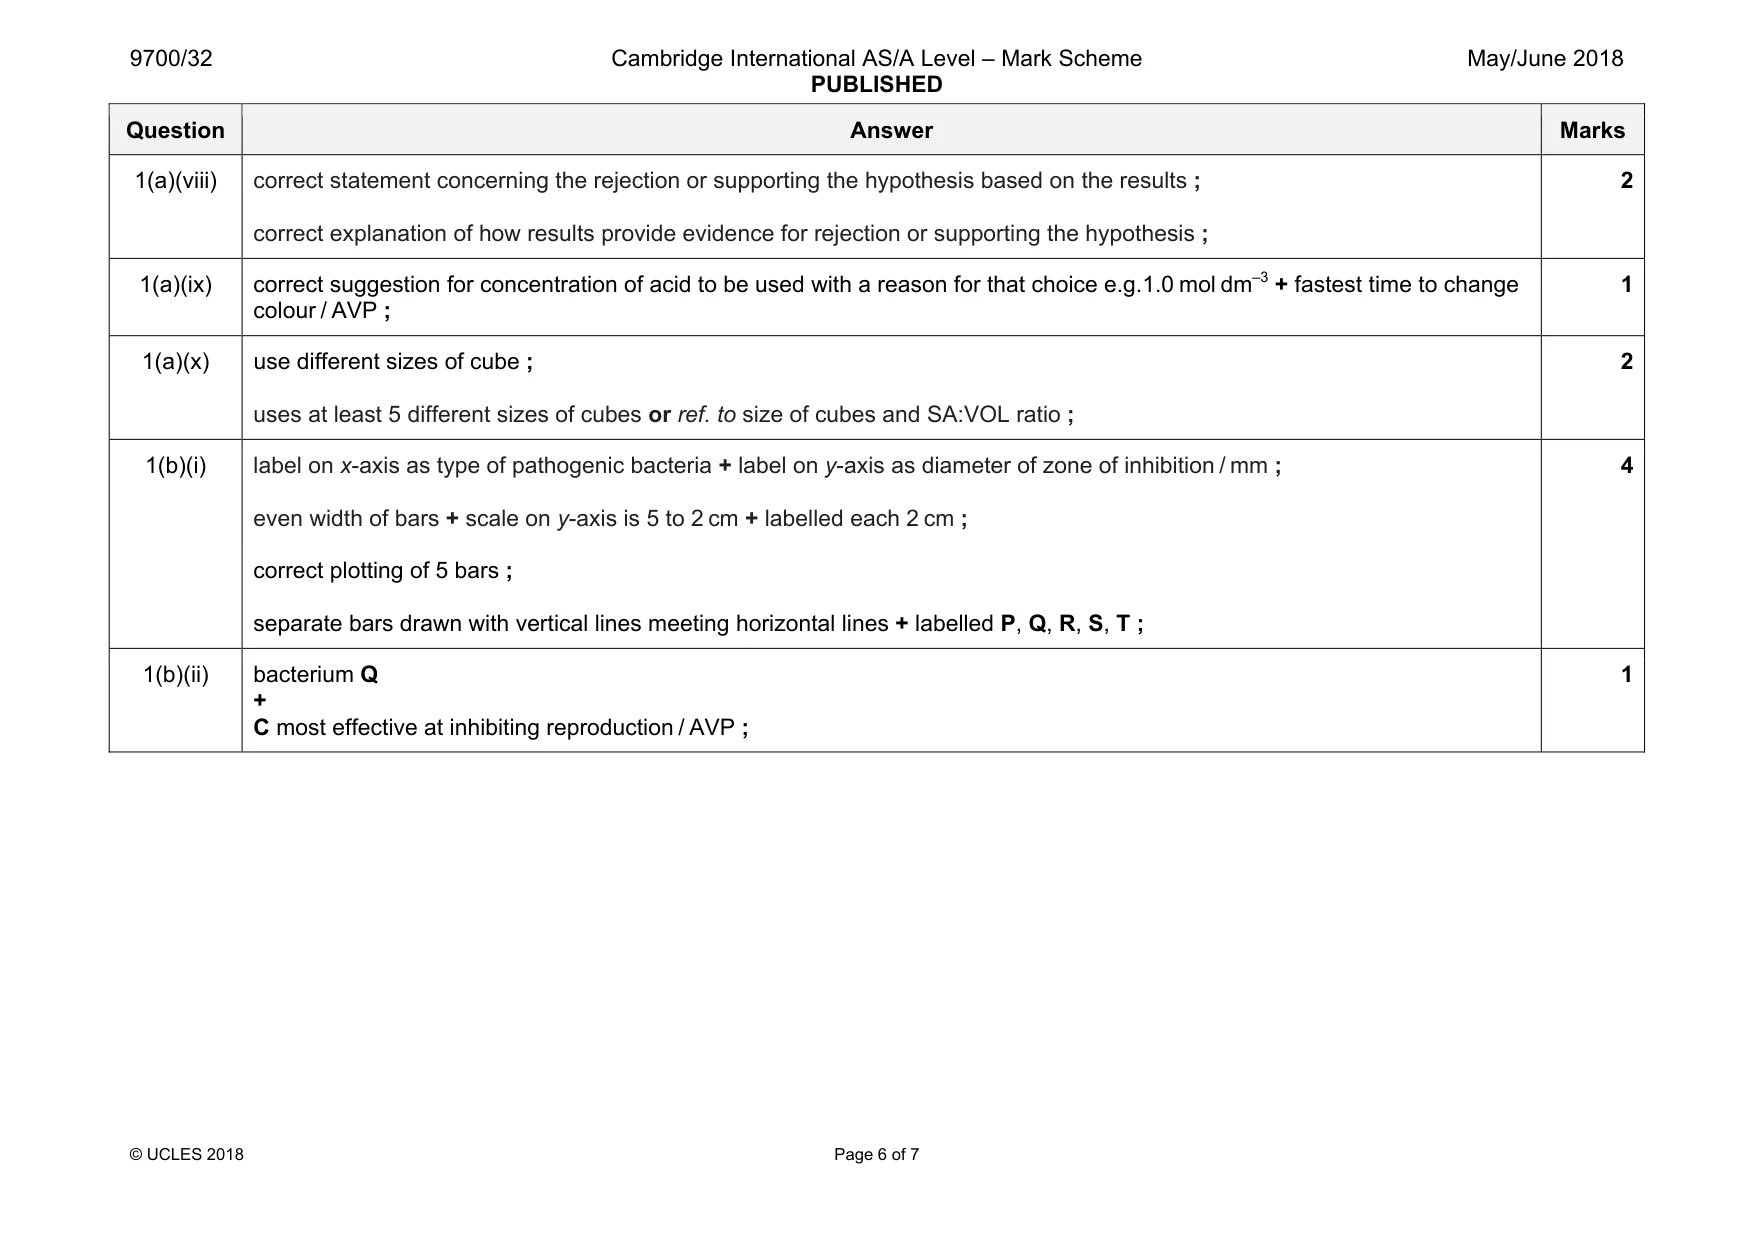
Mark scheme: 1(a)(i) records 3 times ; seconds recorded as whole numbers ; 2 1(a)(ii) calculates mean time correctly using results from (a)(i) + seconds ; 1 1(a)(iii) any one from: 1 the same size of cubes not exactly the same size ; 2 cubes not put into acid at exactly the same time ; 3 AVP ; 1 1(a)(iv) any two from: 1 standardise the size of cubes ; 2 standardise the volume of acid ; 3 standardise the temperature of acid ; 4 AVP ; 2 1(a)(v) four correct volumes of 1.0 mol dm–3 hydrochloric acid (8, 6, 4, 2) ; four correct volumes of distilled water (2, 4, 6, 8) ; 2 1(a)(vi) headings are concentration of hydrochloric acid / mol dm–3 + time / seconds ; records 4 mean times for 4 concentrations of hydrochloric acid ; the time for the highest concentration recorded as the shortest time ; 3 1(a)(vii) from the candidates’ results in (a)(vi) calculates correct rate of diffusion in 1.0 mol dm–3 hydrochloric acid and correct rate of diffusion for the lowest concentration of hydrochloric acid ; 1 Question Answer Marks 1(a)(viii) correct statement concerning the rejection or supporting the hypothesis based on the results ; correct explanation of how results provide evidence for rejection or supporting the hypothesis ; 2 1(a)(ix) correct suggestion for concentration of acid to be used with a reason for that choice e.g.1.0 mol dm–3 + fastest time to change colour / AVP ; 1 1(a)(x) use different sizes of cube ; uses at least 5 different sizes of cubes or ref. to size of cubes and SA:VOL ratio ; 2 1(b)(i) label on x-axis as type of pathogenic bacteria + label on y-axis as diameter of zone of inhibition / mm ; even width of bars + scale on y-axis is 5 to 2 cm + labelled each 2 cm ; correct plotting of 5 bars ; separate bars drawn with vertical lines meeting horizontal lines + labelled P, Q, R, S, T ; 4 1(b)(ii) bacterium Q + C most effective at inhibiting reproduction / AVP ; 1
Q2 · M1 is a slide of a stained transverse section through a plant leaf
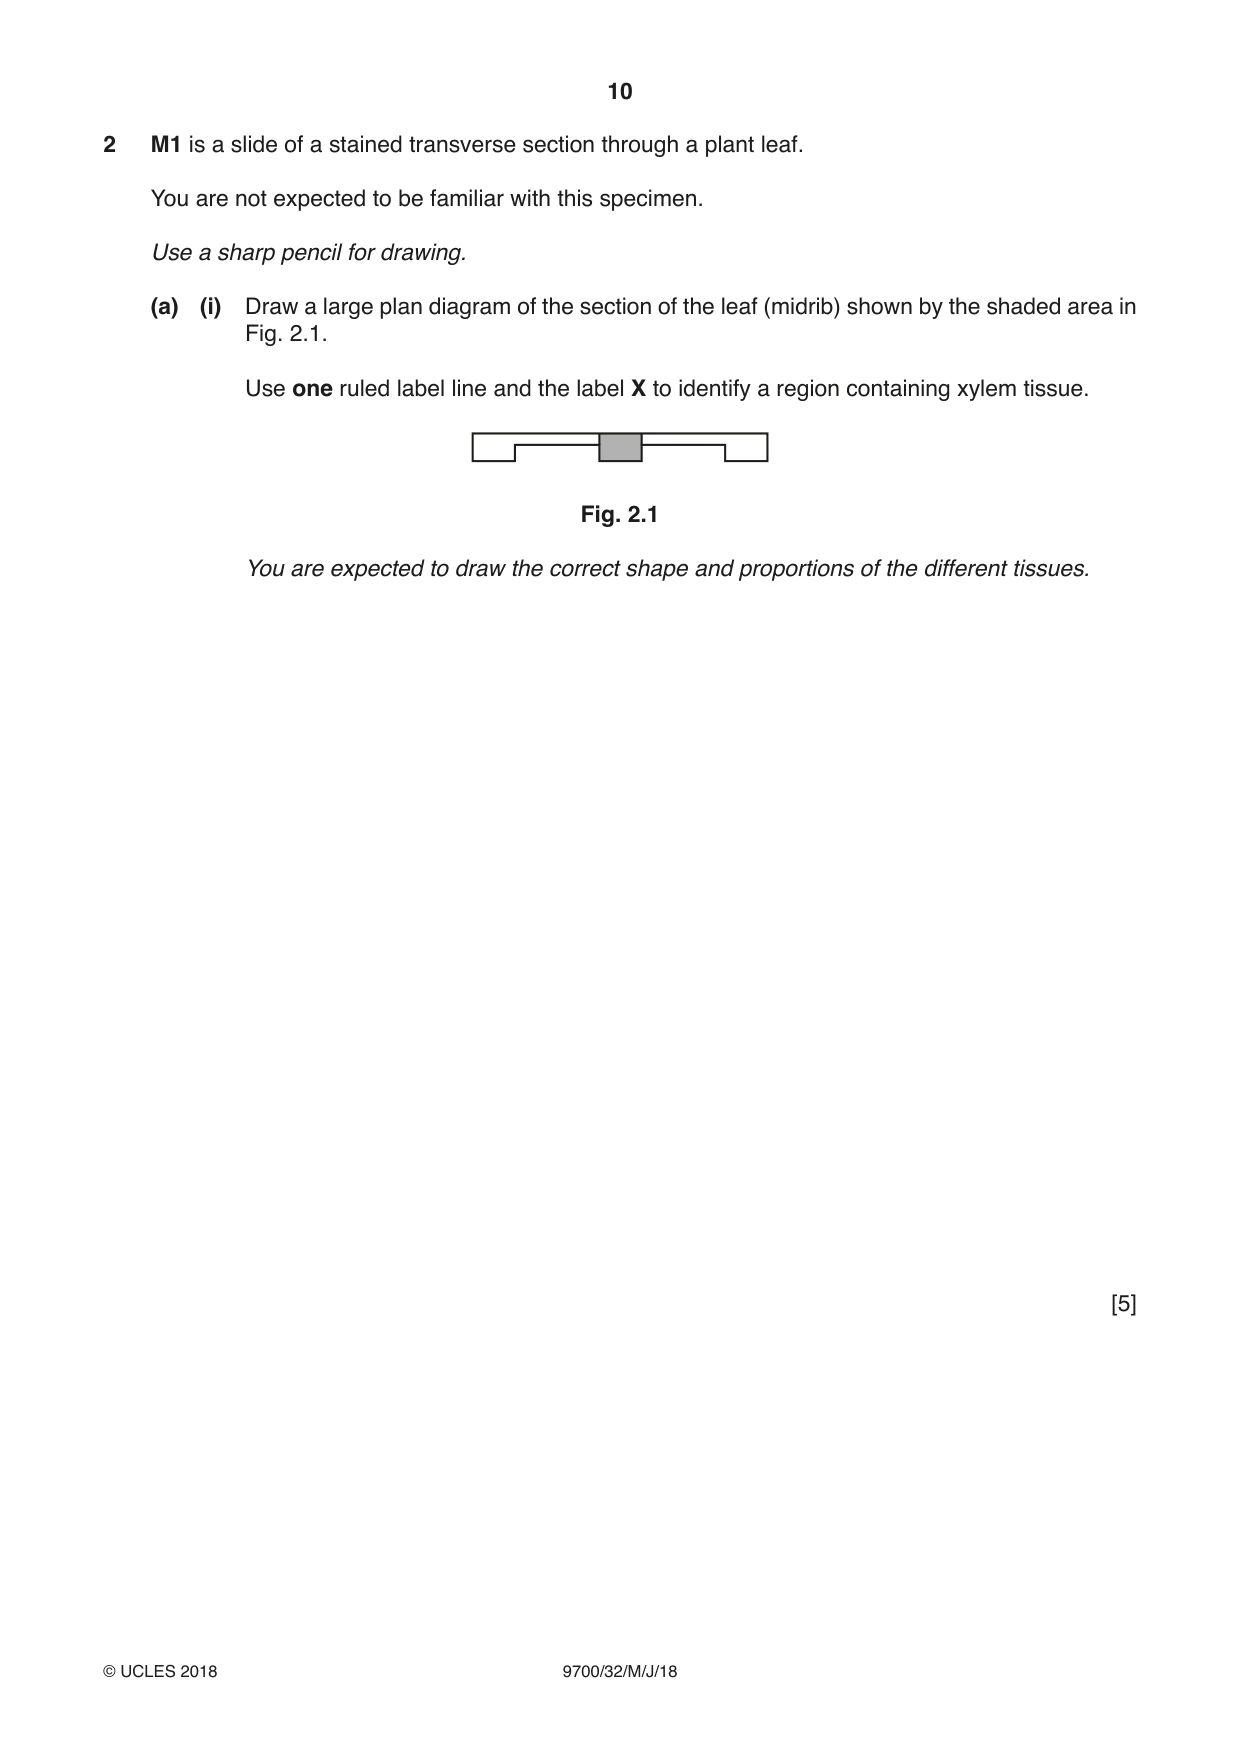
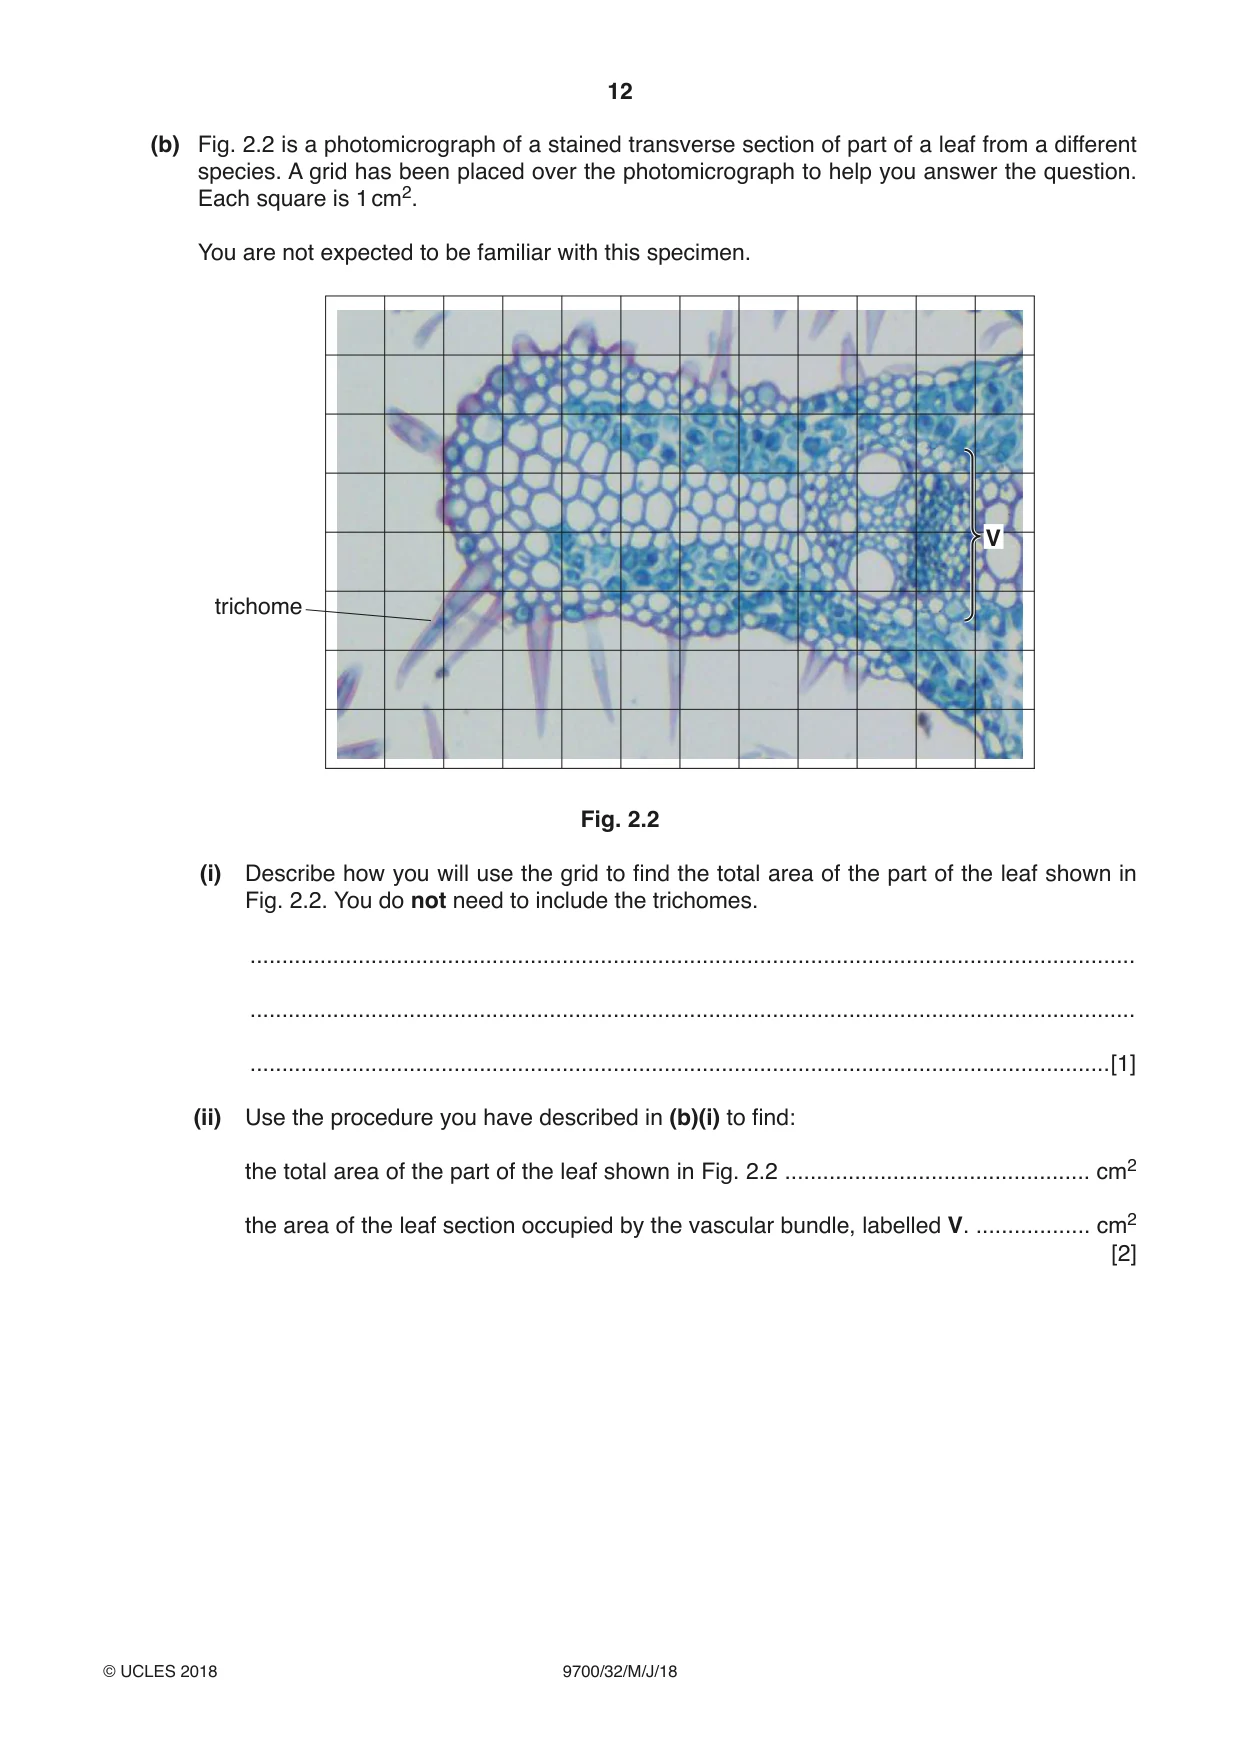
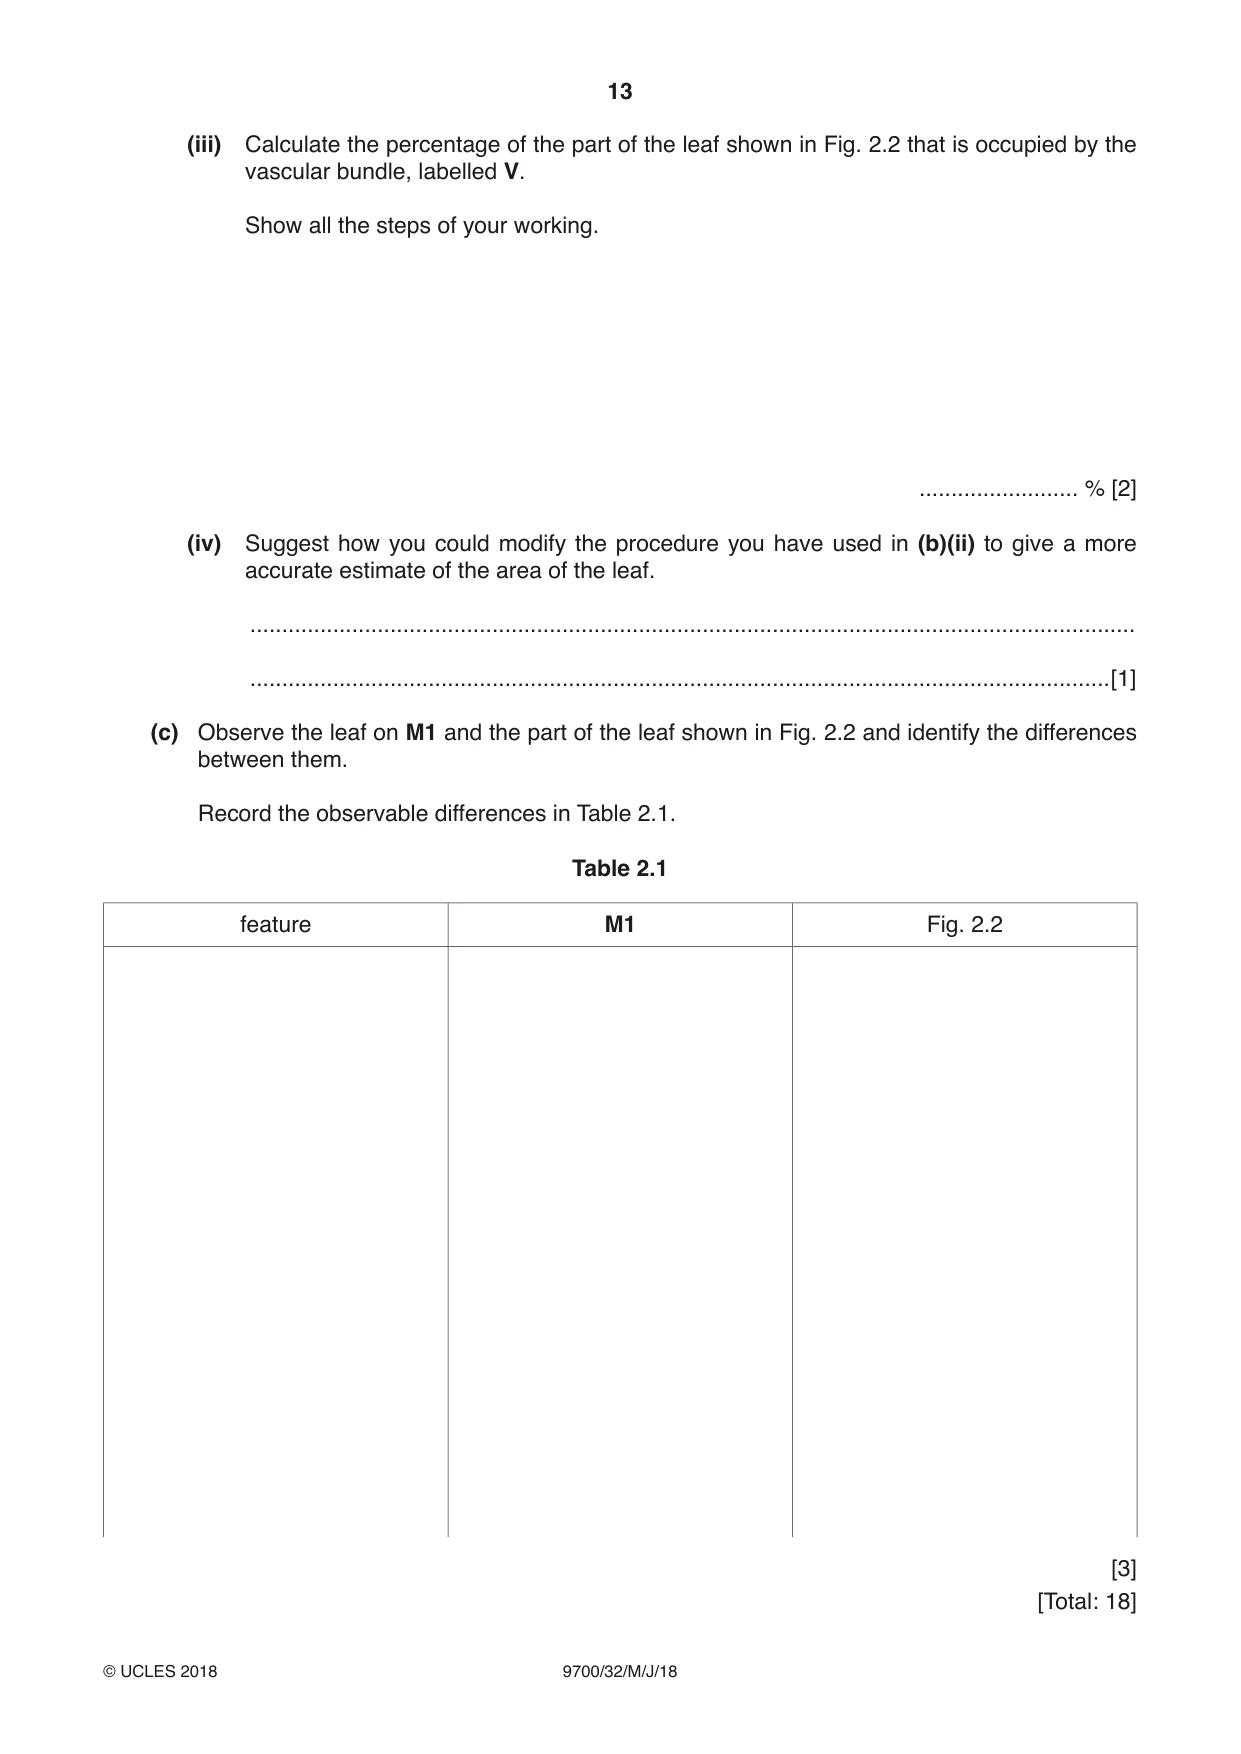
2 M1 is a slide of a stained transverse section through a plant leaf. You are not expected to be familiar with this specimen. Use a sharp pencil for drawing. (a) (i) Draw a large plan diagram of the section of the leaf (midrib) shown by the shaded area in Fig. 2.1. Use one ruled label line and the label X to identify a region containing xylem tissue. Fig. 2.1 You are expected to draw the correct shape and proportions of the different tissues. [5] (ii) Observe the upper epidermis of the leaf on M1. The upper epidermis has no guard cells. Select one group of two adjacent, touching cells from the upper epidermis and one adjacent, touching cell from the palisade tissue below. Each cell must touch at least one of the other cells. Make a large drawing of this group of three cells. Use one ruled label line and the label P to identify a structure that produces ATP. [4] (b) Fig. 2.2 is a photomicrograph of a stained transverse section of part of a leaf from a different species. A grid has been placed over the photomicrograph to help you answer the question. Each square is 1 cm2. You are not expected to be familiar with this specimen. V trichome Fig. 2.2 (i) Describe how you will use the grid to find the total area of the part of the leaf shown in Fig. 2.2. You do not need to include the trichomes. ........................................................................................................................................... ........................................................................................................................................... .......................................................................................................................................[1] (ii) Use the procedure you have described in (b)(i) to find: the total area of the part of the leaf shown in Fig. 2.2 ................................................ cm2 the area of the leaf section occupied by the vascular bundle, labelled V. .................. cm2 [2]
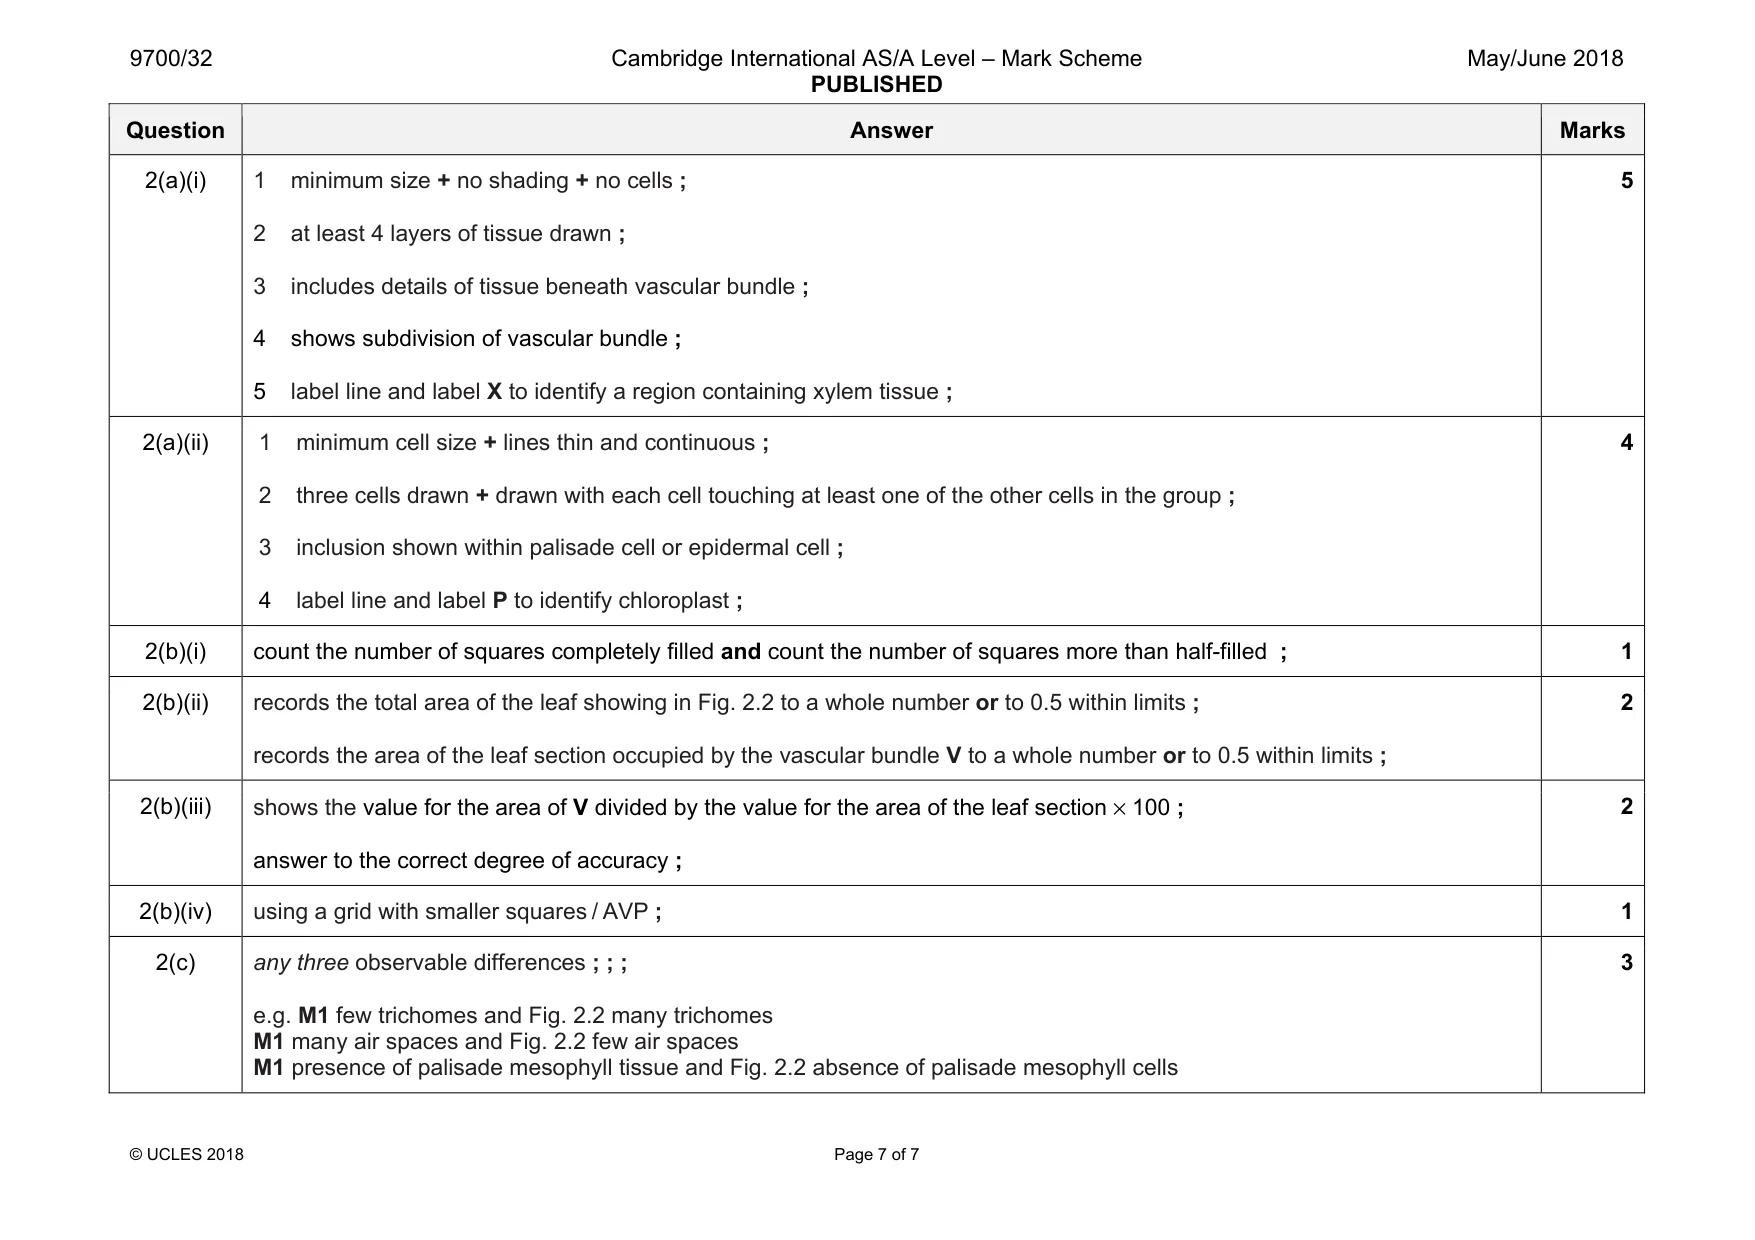
Mark scheme: 2(a)(i) 1 minimum size + no shading + no cells ; 2 at least 4 layers of tissue drawn ; 3 includes details of tissue beneath vascular bundle ; 4 shows subdivision of vascular bundle ; 5 label line and label X to identify a region containing xylem tissue ; 5 2(a)(ii) 1 minimum cell size + lines thin and continuous ; 2 three cells drawn + drawn with each cell touching at least one of the other cells in the group ; 3 inclusion shown within palisade cell or epidermal cell ; 4 label line and label P to identify chloroplast ; 4 2(b)(i) count the number of squares completely filled and count the number of squares more than half-filled ; 1 2(b)(ii) records the total area of the leaf showing in Fig. 2.2 to a whole number or to 0.5 within limits ; records the area of the leaf section occupied by the vascular bundle V to a whole number or to 0.5 within limits ; 2 2(b)(iii) shows the value for the area of V divided by the value for the area of the leaf section × 100 ; answer to the correct degree of accuracy ; 2 2(b)(iv) using a grid with smaller squares / AVP ; 1 2(c) any three observable differences ; ; ; e.g. M1 few trichomes and Fig. 2.2 many trichomes M1 many air spaces and Fig. 2.2 few air spaces M1 presence of palisade mesophyll tissue and Fig. 2.2 absence of palisade mesophyll cells 3
More questions on Cells as the basic units of living organisms
What was in this paper
The subtopics covered by these 2 questions, and how many questions each got. Open one in a new tab to see every Cambridge question on it.
What you needed in this session
Cambridge’s own grade thresholds for 2018 May/June, Paper 3 · Variant 2. A higher threshold means an easier paper — the bar moves with how the cohort did.