Cambridge A Level Biology 9700 — 2024 May/June Paper 3 · Variant 4
9700/34/M/J/24 · 2 questions · 40 marks · ≈45 min
The question paper and its mark scheme, free to read here and free to download. This is Cambridge’s own paper, exactly as it was sat.
Question paper12 pages
Mark scheme8 pages
Answers below. Sit the paper first if you are practising.
Questions as text
Q1 · Salicylic acid acts as a painkiller and is the active ingredient in aspirin
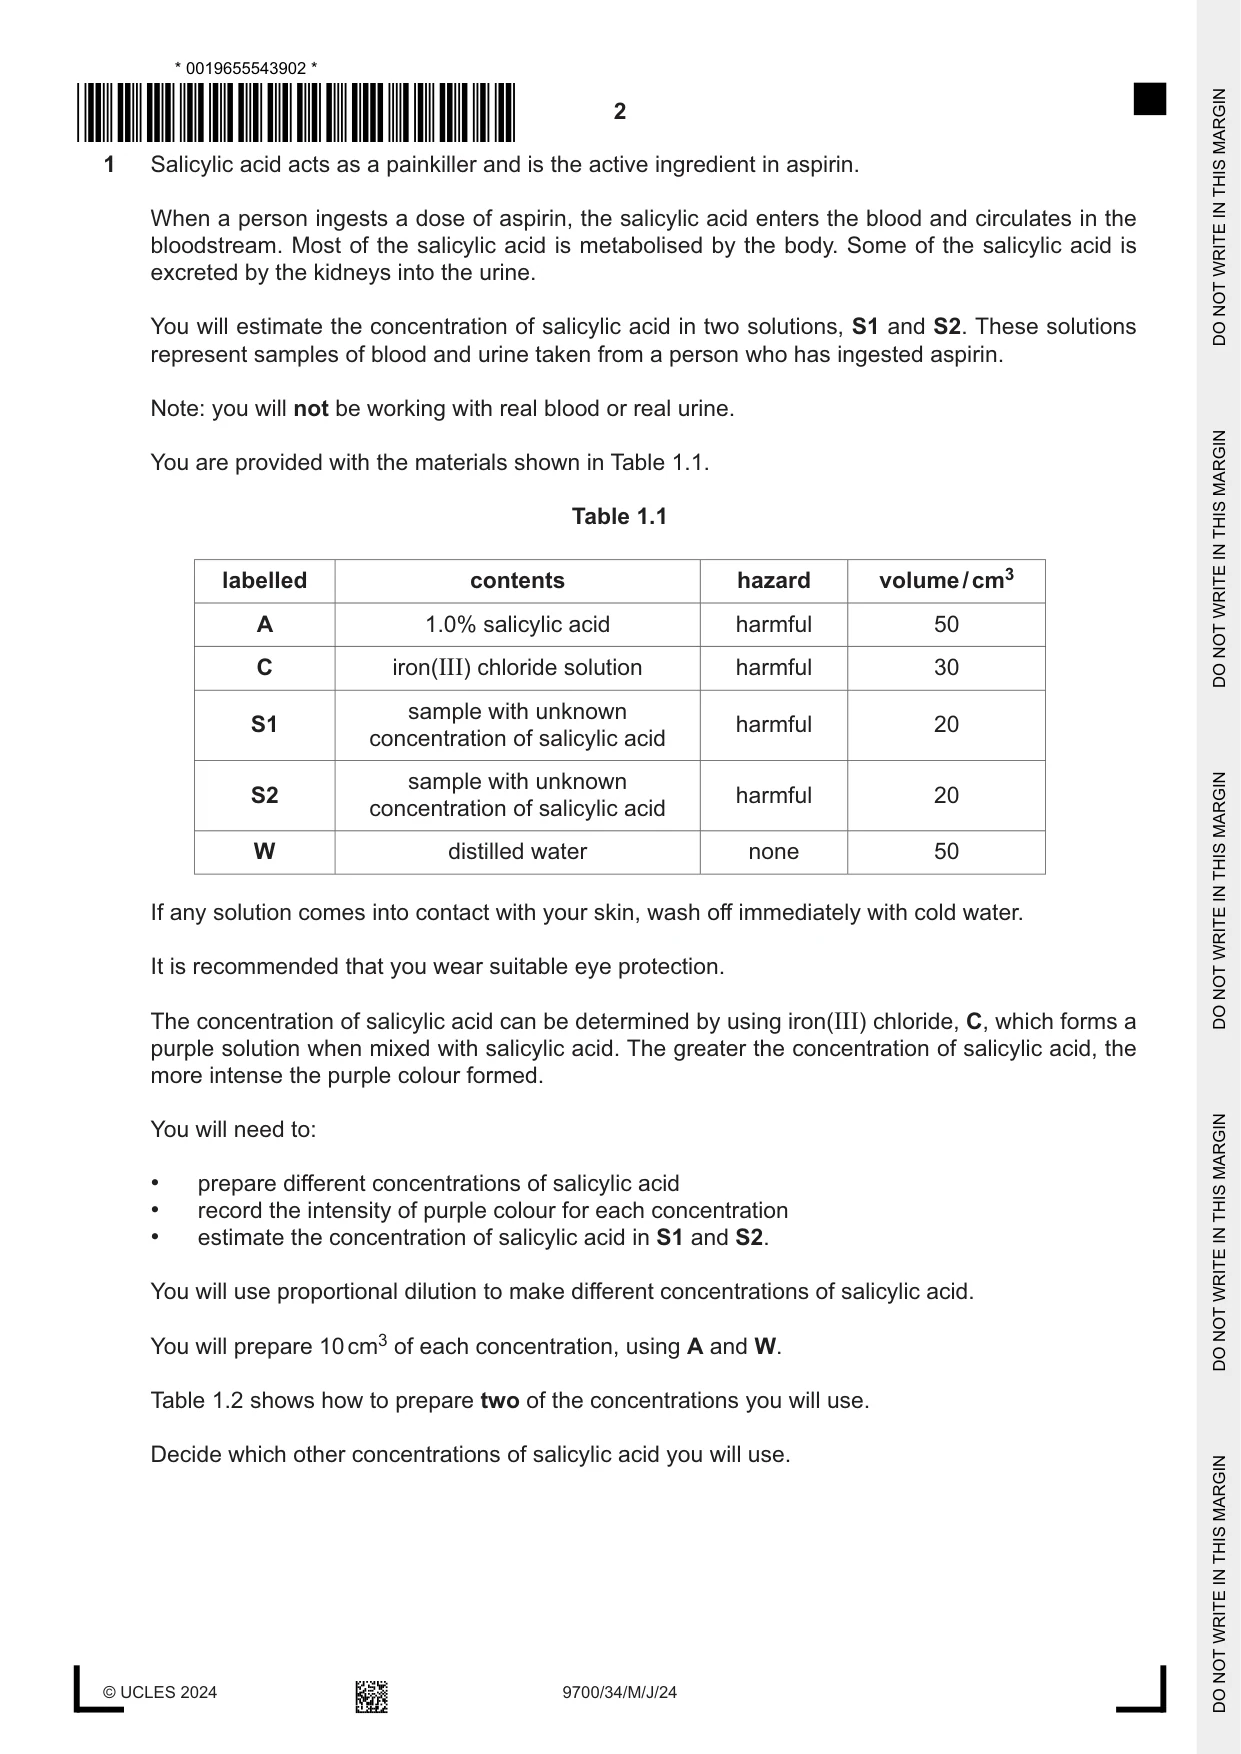
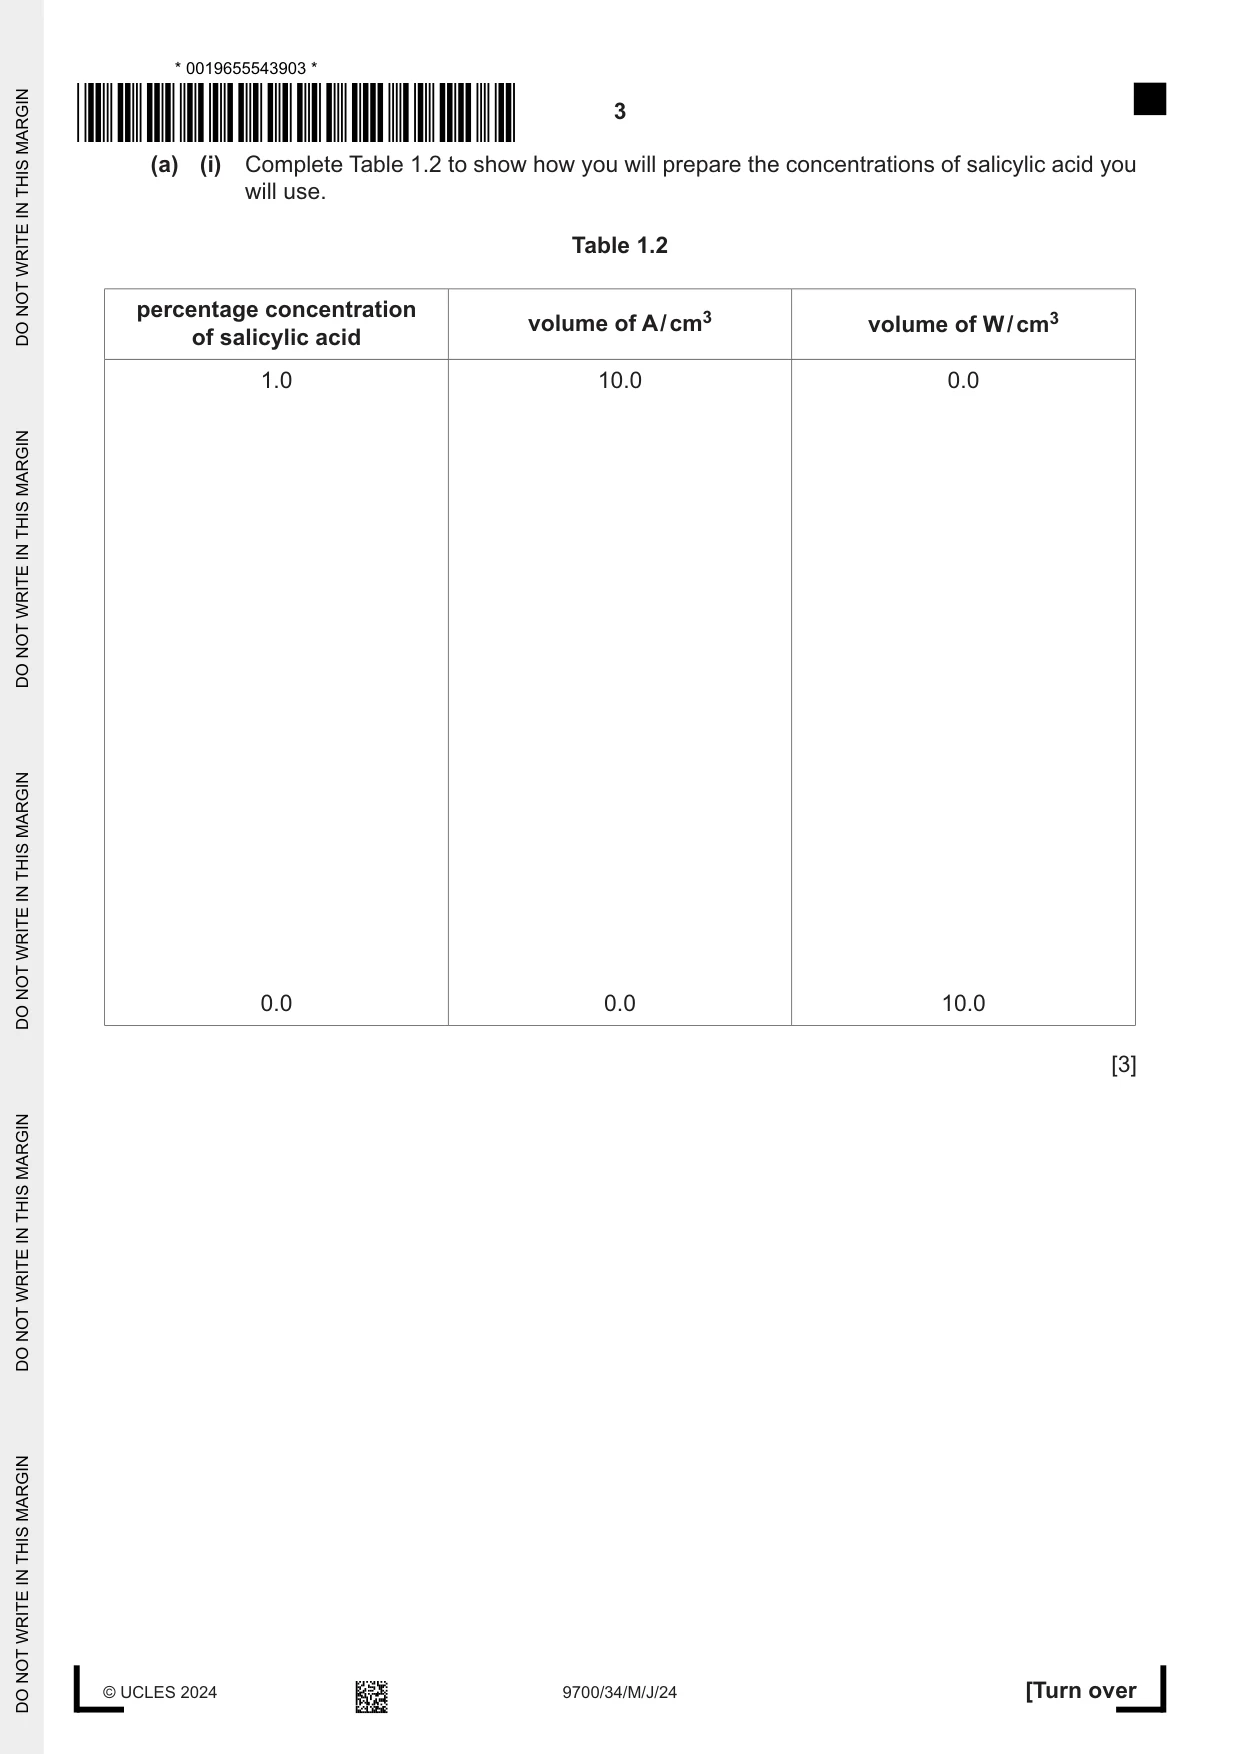
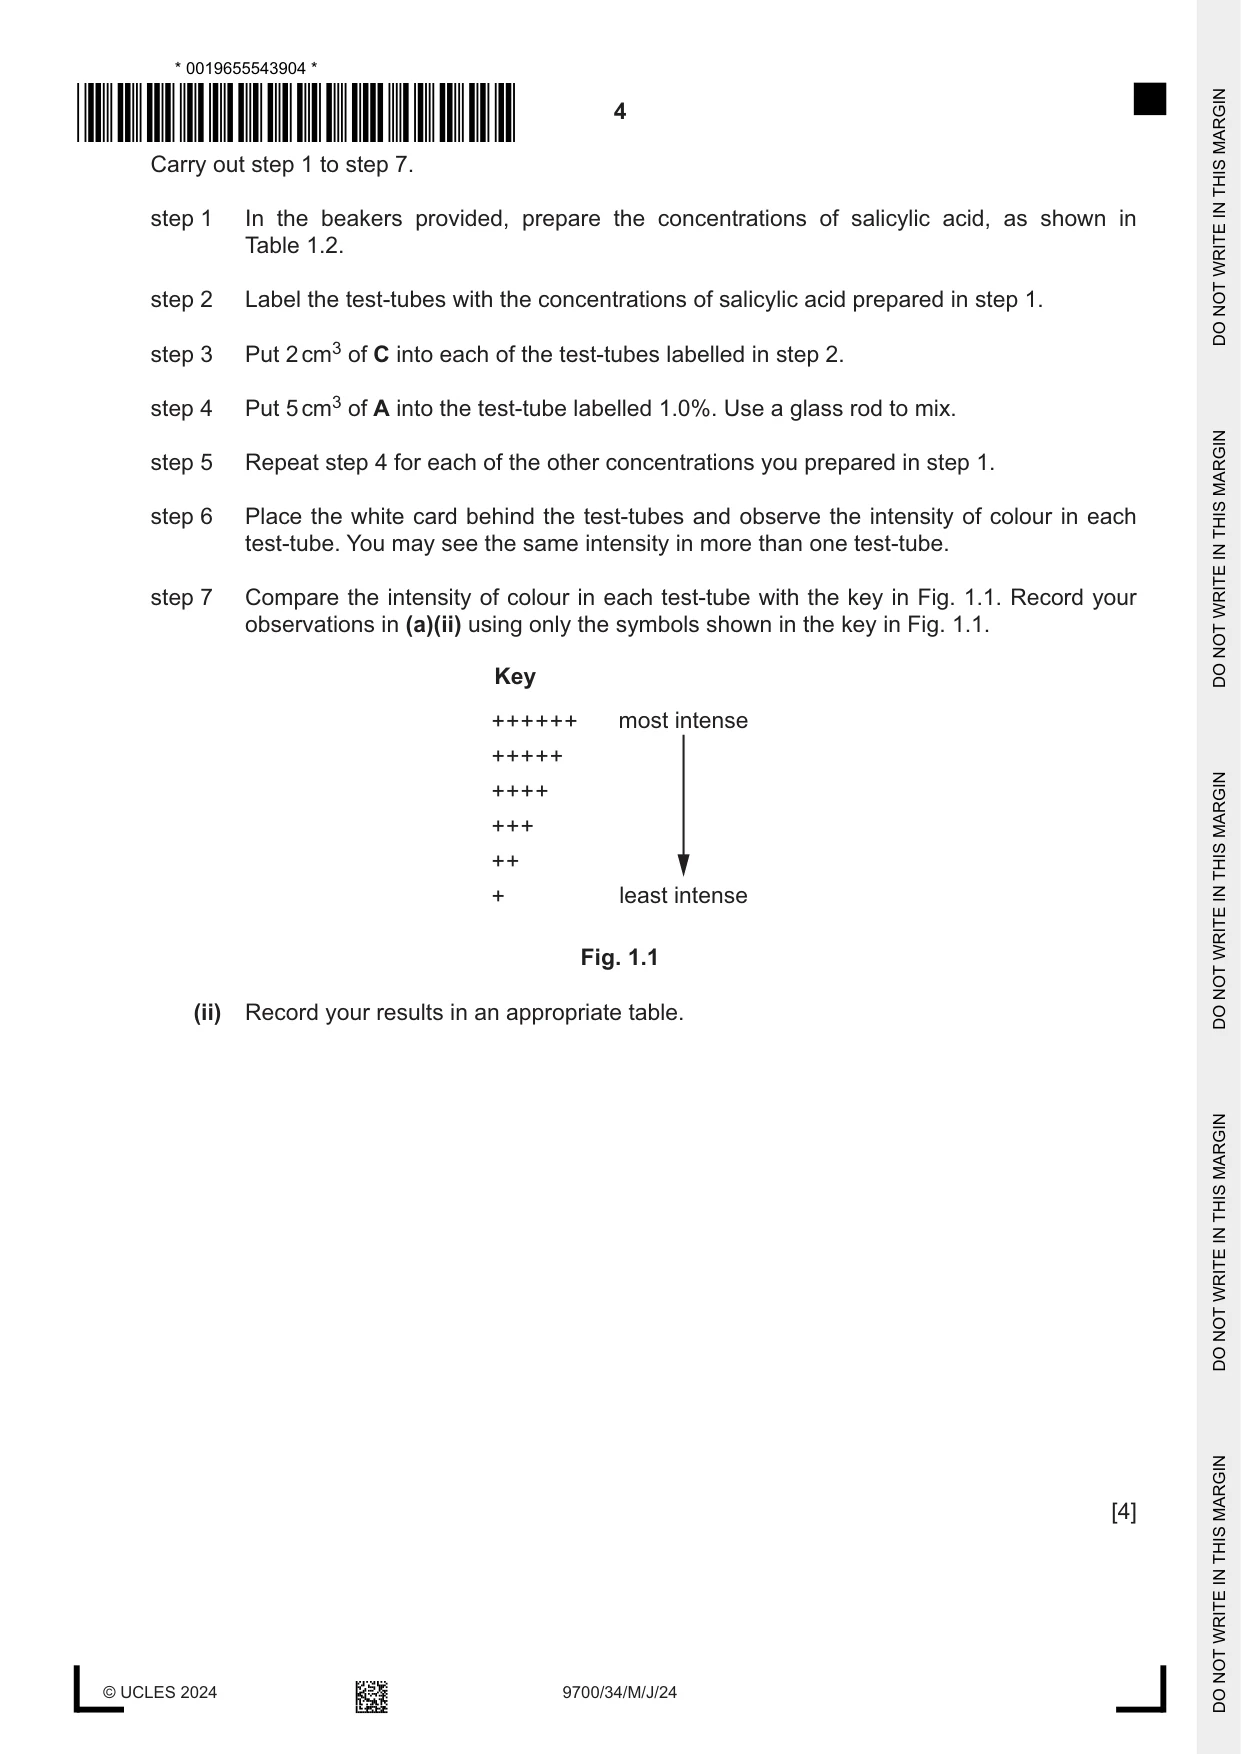
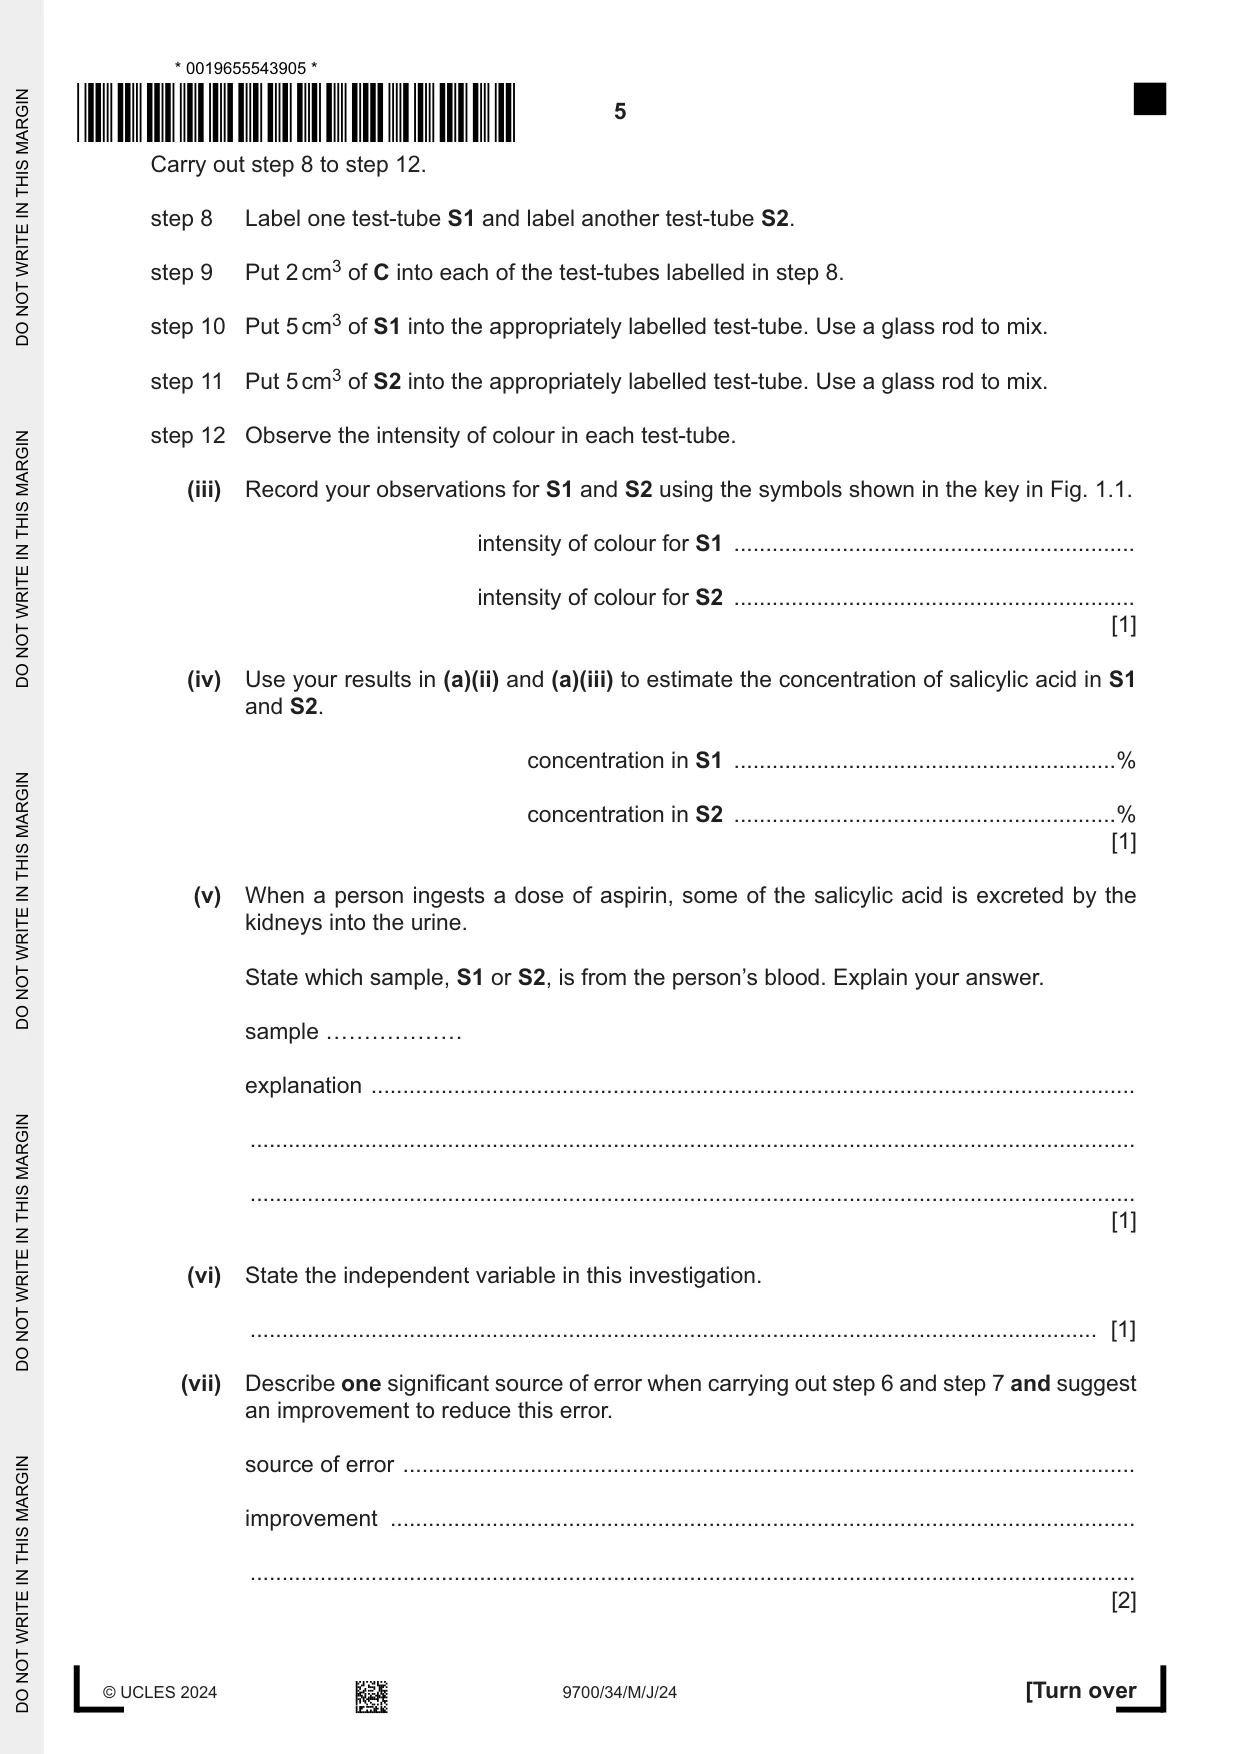
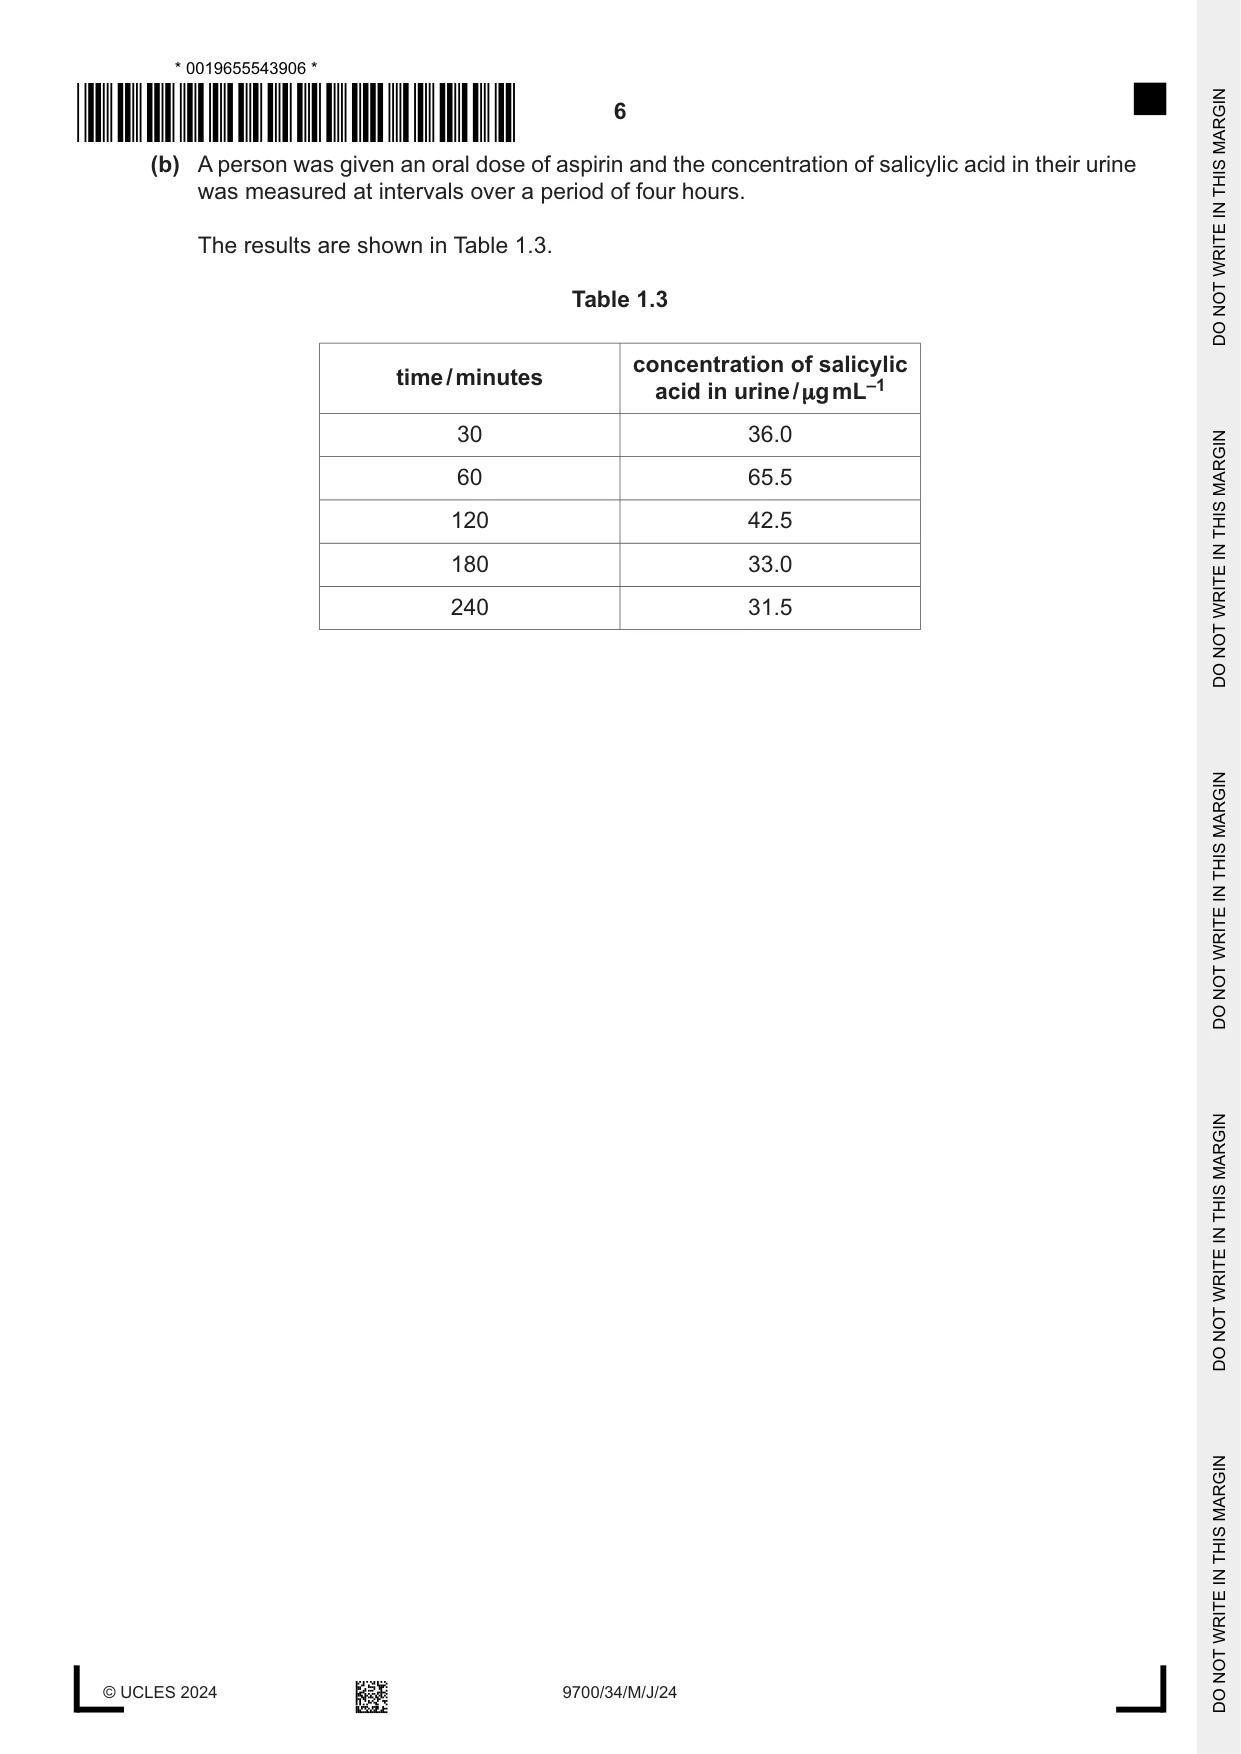
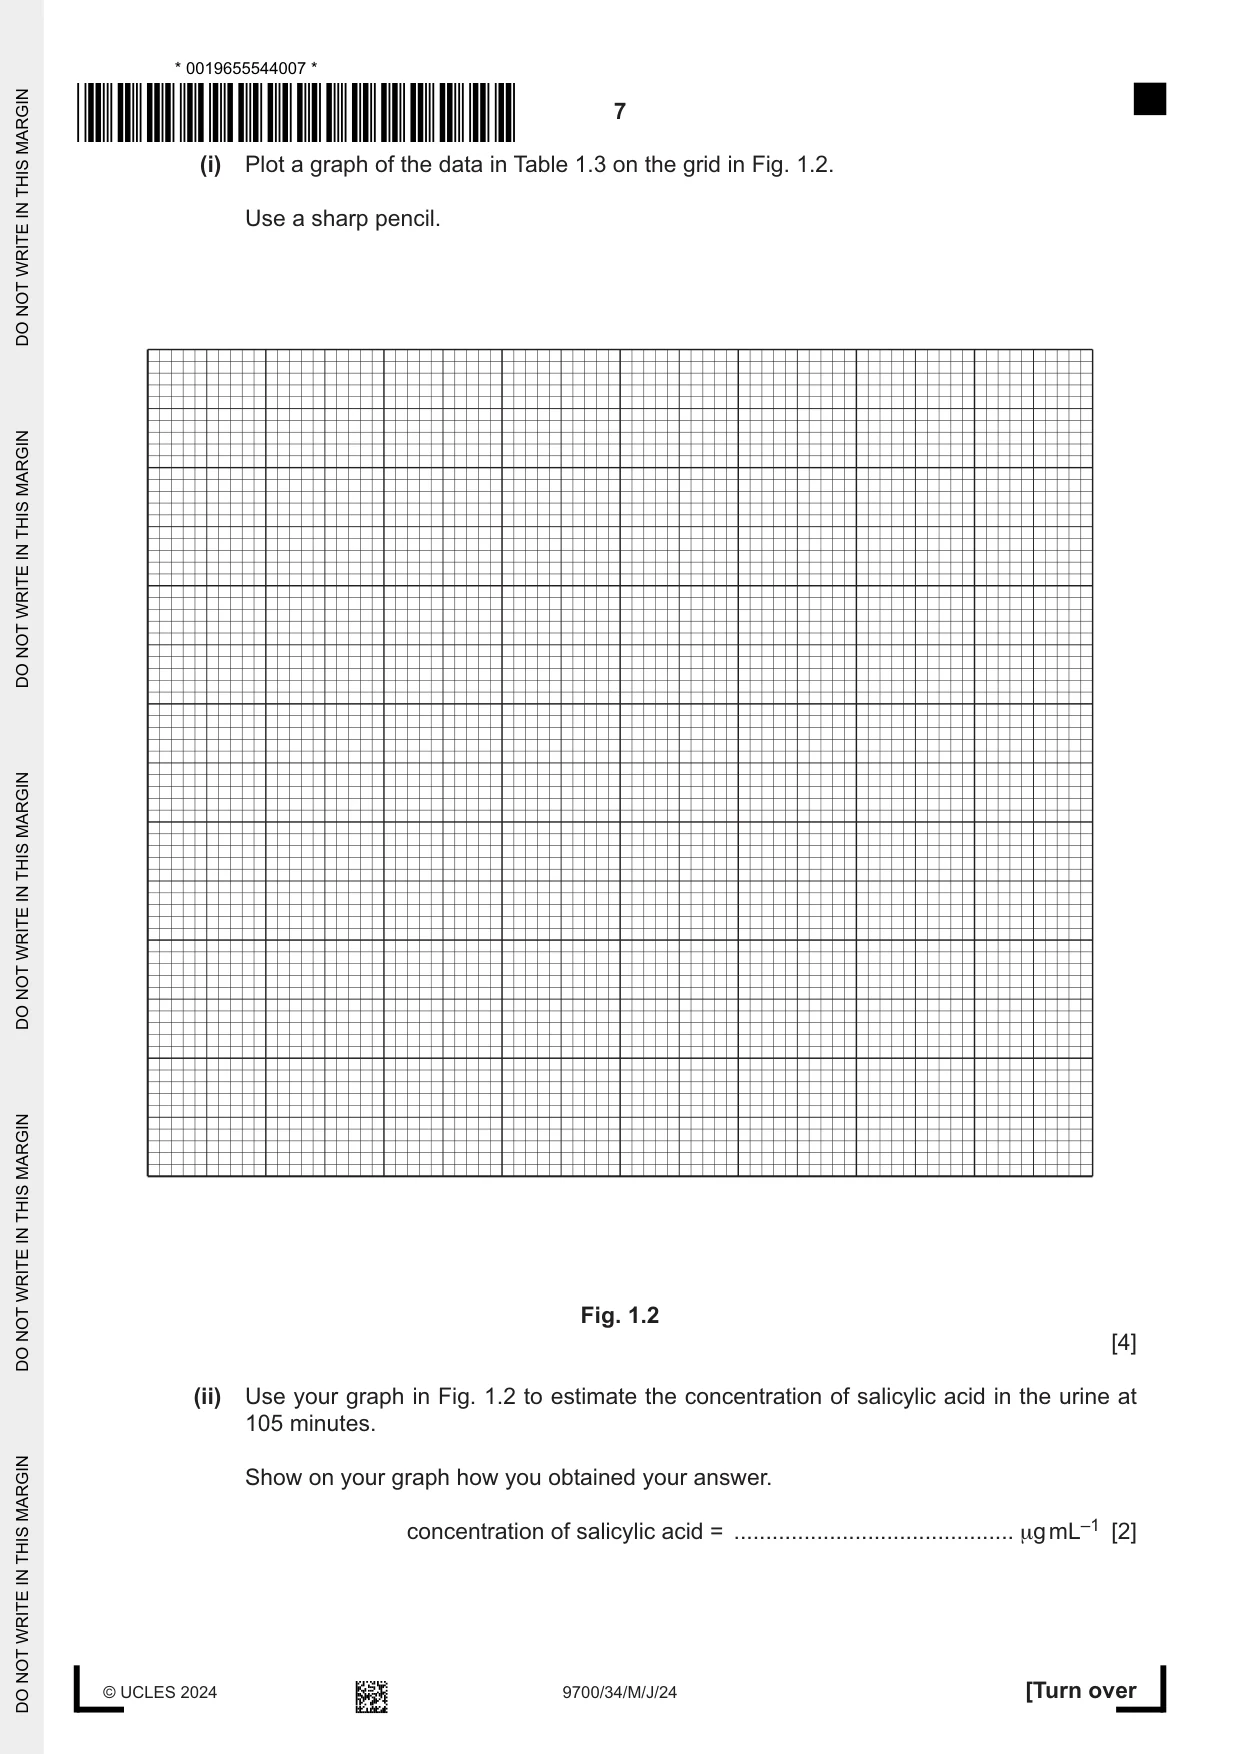
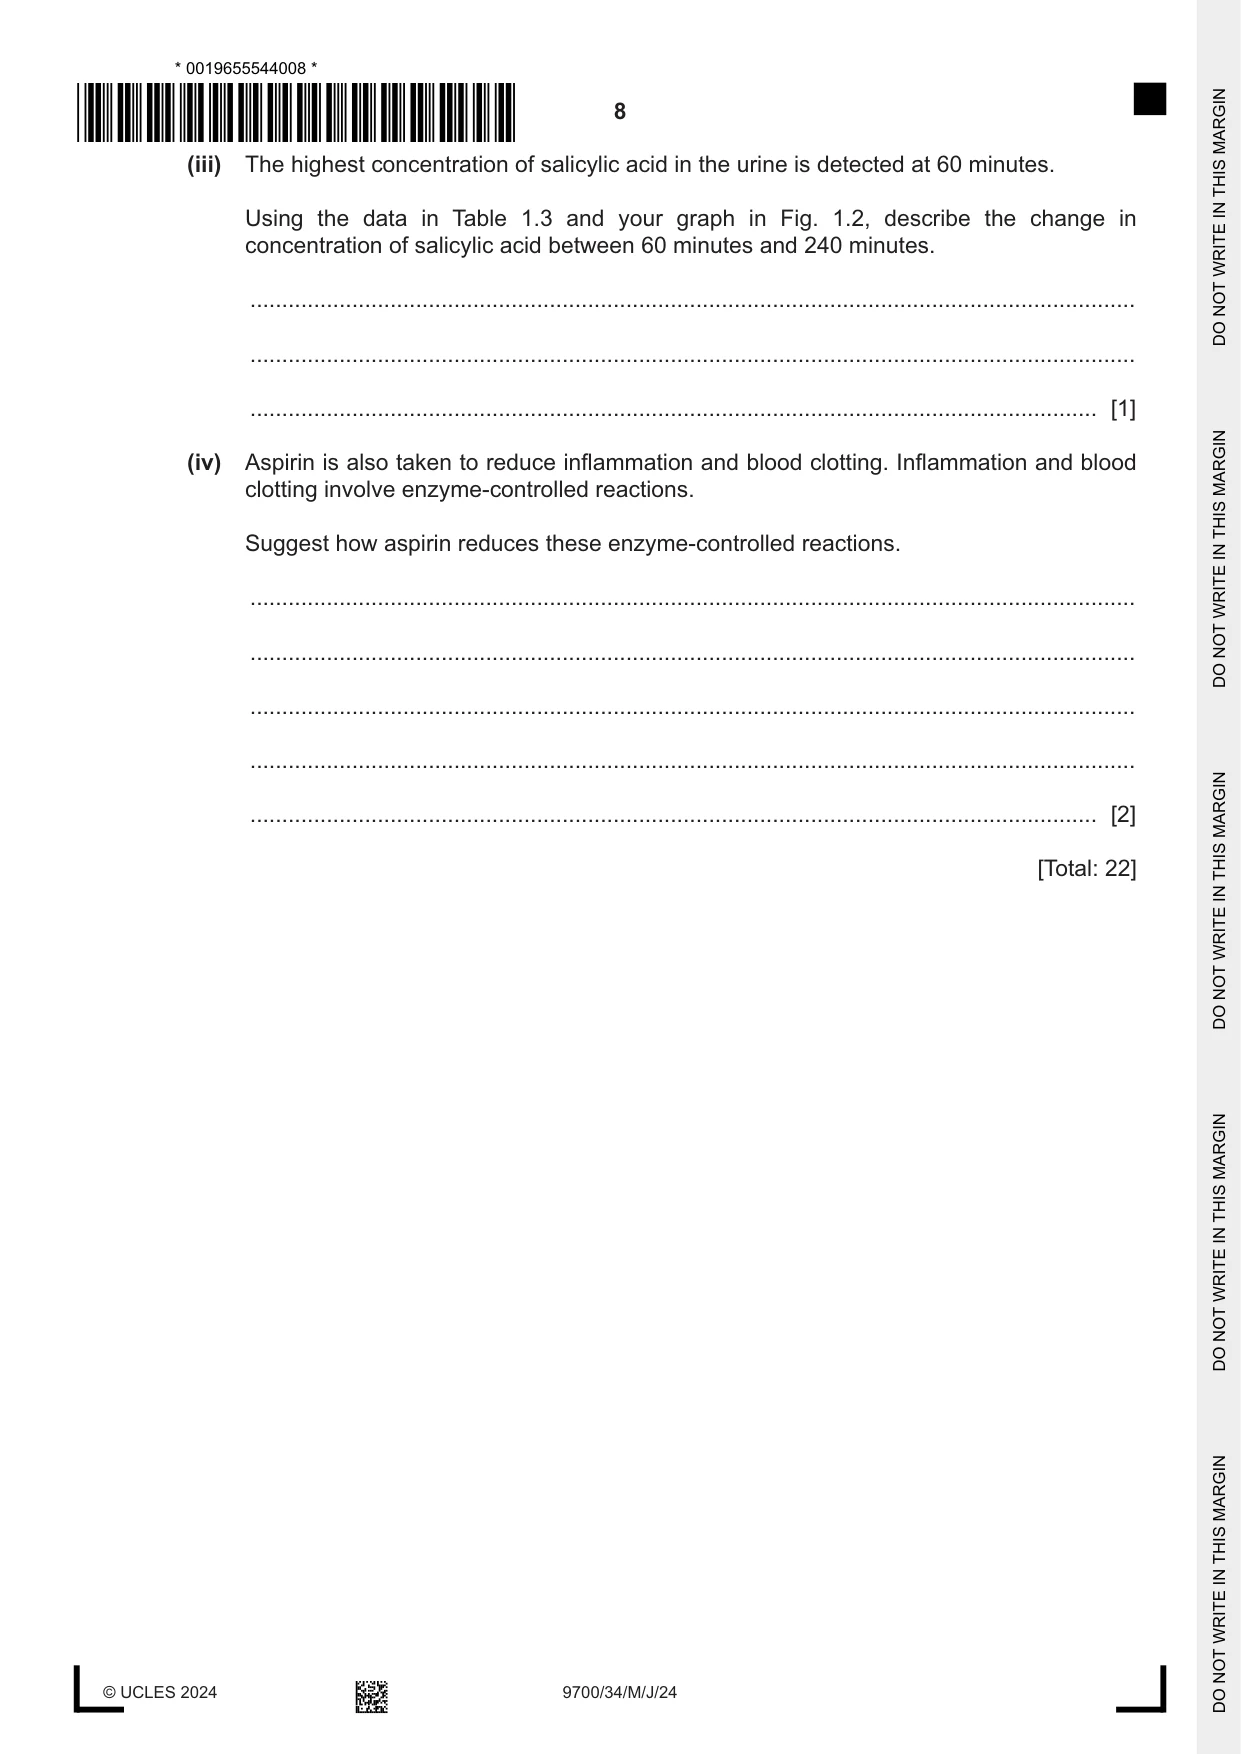
1 Salicylic acid acts as a painkiller and is the active ingredient in aspirin. When a person ingests a dose of aspirin, the salicylic acid enters the blood and circulates in the bloodstream. Most of the salicylic acid is metabolised by the body. Some of the salicylic acid is excreted by the kidneys into the urine. You will estimate the concentration of salicylic acid in two solutions, S1 and S2. These solutions represent samples of blood and urine taken from a person who has ingested aspirin. Note: you will not be working with real blood or real urine. You are provided with the materials shown in Table 1.1. Table 1.1 labelled contents hazard volume / cm3 A 1.0% salicylic acid harmful 50 C iron(III) chloride solution harmful 30 sample with unknown S1 harmful 20 concentration of salicylic acid sample with unknown S2 harmful 20 concentration of salicylic acid W distilled water none 50 If any solution comes into contact with your skin, wash off immediately with cold water. It is recommended that you wear suitable eye protection. The concentration of salicylic acid can be determined by using iron(III) chloride, C, which forms a purple solution when mixed with salicylic acid. The greater the concentration of salicylic acid, the more intense the purple colour formed. You will need to: • prepare different concentrations of salicylic acid • record the intensity of purple colour for each concentration • estimate the concentration of salicylic acid in S1 and S2. You will use proportional dilution to make different concentrations of salicylic acid. You will prepare 10 cm3 of each concentration, using A and W. Table 1.2 shows how to prepare two of the concentrations you will use. Decide which other concentrations of salicylic acid you will use. (a) (i) Complete Table 1.2 to show how you will prepare the concentrations of salicylic acid you will use. Table 1.2 percentage concentration volume of A / cm3 volume of W / cm3 of salicylic acid 1.0 10.0 0.0 0.0 0.0 10.0 [3] Carry out step 1 to step 7. step 1 In the beakers provided, prepare the concentrations of salicylic acid, as shown in Table 1.2. step 2 Label the test-tubes with the concentrations of salicylic acid prepared in step 1. step 3 Put 2 cm3 of C into each of the test-tubes labelled in step 2. step 4 Put 5 cm3 of A into the test-tube labelled 1.0%. Use a glass rod to mix. step 5 Repeat step 4 for each of the other concentrations you prepared in step 1. step 6 Place the white card behind the test-tubes and observe the intensity of colour in each test-tube. You may see the same intensity in more than one test-tube. step 7 Compare the intensity of colour in each test-tube with the key in Fig. 1.1. Record your observations in (a)(ii) using only the symbols shown in the key in Fig. 1.1. Key ++++++ most intense +++++ ++++ +++ ++ + least intense Fig. 1.1 (ii) Record your results in an appropriate table. [4] Carry out step 8 to step 12. step 8 Label one test-tube S1 and label another test-tube S2. step 9 Put 2 cm3 of C into each of the test-tubes labelled in step 8. step 10 Put 5 cm3 of S1 into the appropriately labelled test-tube. Use a glass rod to mix. step 11 Put 5 cm3 of S2 into the appropriately labelled test-tube. Use a glass rod to mix. step 12 Observe the intensity of colour in each test-tube. (iii) Record your observations for S1 and S2 using the symbols shown in the key in Fig. 1.1. intensity of colour for S1 ............................................................... intensity of colour for S2 ............................................................... [1] (iv) Use your results in (a)(ii) and (a)(iii) to estimate the concentration of salicylic acid in S1 and S2. concentration in S1 ............................................................% concentration in S2 ............................................................% [1] (v) When a person ingests a dose of aspirin, some of the salicylic acid is excreted by the kidneys into the urine. State which sample, S1 or S2, is from the person’s blood. Explain your answer. sample ……………… explanation ........................................................................................................................ ........................................................................................................................................... ........................................................................................................................................... [1] (vi) State the independent variable in this investigation. ..................................................................................................................................... [1] (vii) Describe one significant source of error when carrying out step 6 and step 7 and suggest an improvement to reduce this error. source of error ................................................................................................................... improvement ..................................................................................................................... ........................................................................................................................................... [2] (b) A person was given an oral dose of aspirin and the concentration of salicylic acid in their urine was measured at intervals over a period of four hours. The results are shown in Table 1.3. Table 1.3 concentration of salicylic time / minutes acid in urine / μg mL–1 30 36.0 60 65.5 120 42.5 180 33.0 240 31.5 (i) Plot a graph of the data in Table 1.3 on the grid in Fig. 1.2. Use a sharp pencil. Fig. 1.2 [4] (ii) Use your graph in Fig. 1.2 to estimate the concentration of salicylic acid in the urine at 105 minutes. Show on your graph how you obtained your answer. concentration of salicylic acid = ............................................ μg mL–1 [2] (iii) The highest concentration of salicylic acid in the urine is detected at 60 minutes. Using the data in Table 1.3 and your graph in Fig. 1.2, describe the change in concentration of salicylic acid between 60 minutes and 240 minutes. ........................................................................................................................................... ........................................................................................................................................... ..................................................................................................................................... [1] (iv) Aspirin is also taken to reduce inflammation and blood clotting. Inflammation and blood clotting involve enzyme-controlled reactions. Suggest how aspirin reduces these enzyme-controlled reactions. ........................................................................................................................................... ........................................................................................................................................... ........................................................................................................................................... ........................................................................................................................................... ..................................................................................................................................... [2] [Total: 22]
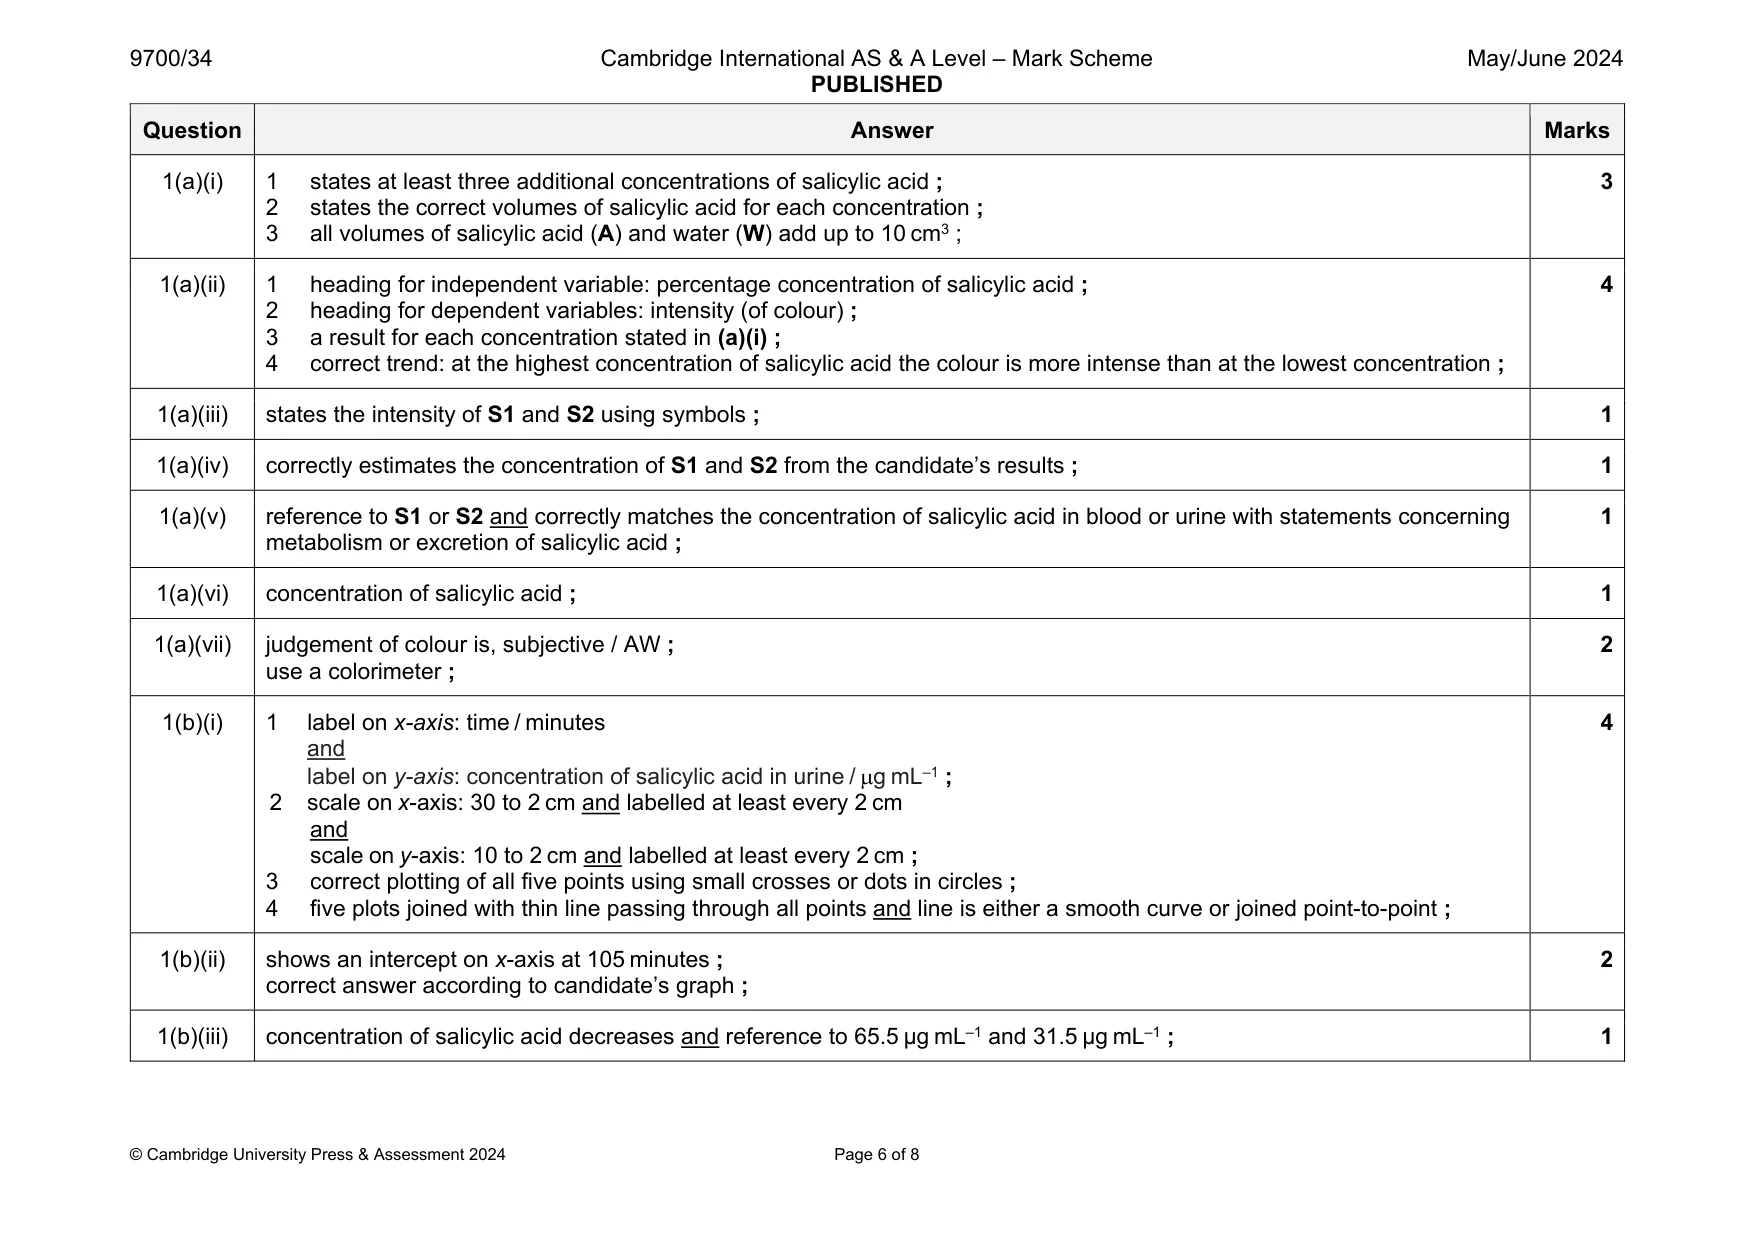
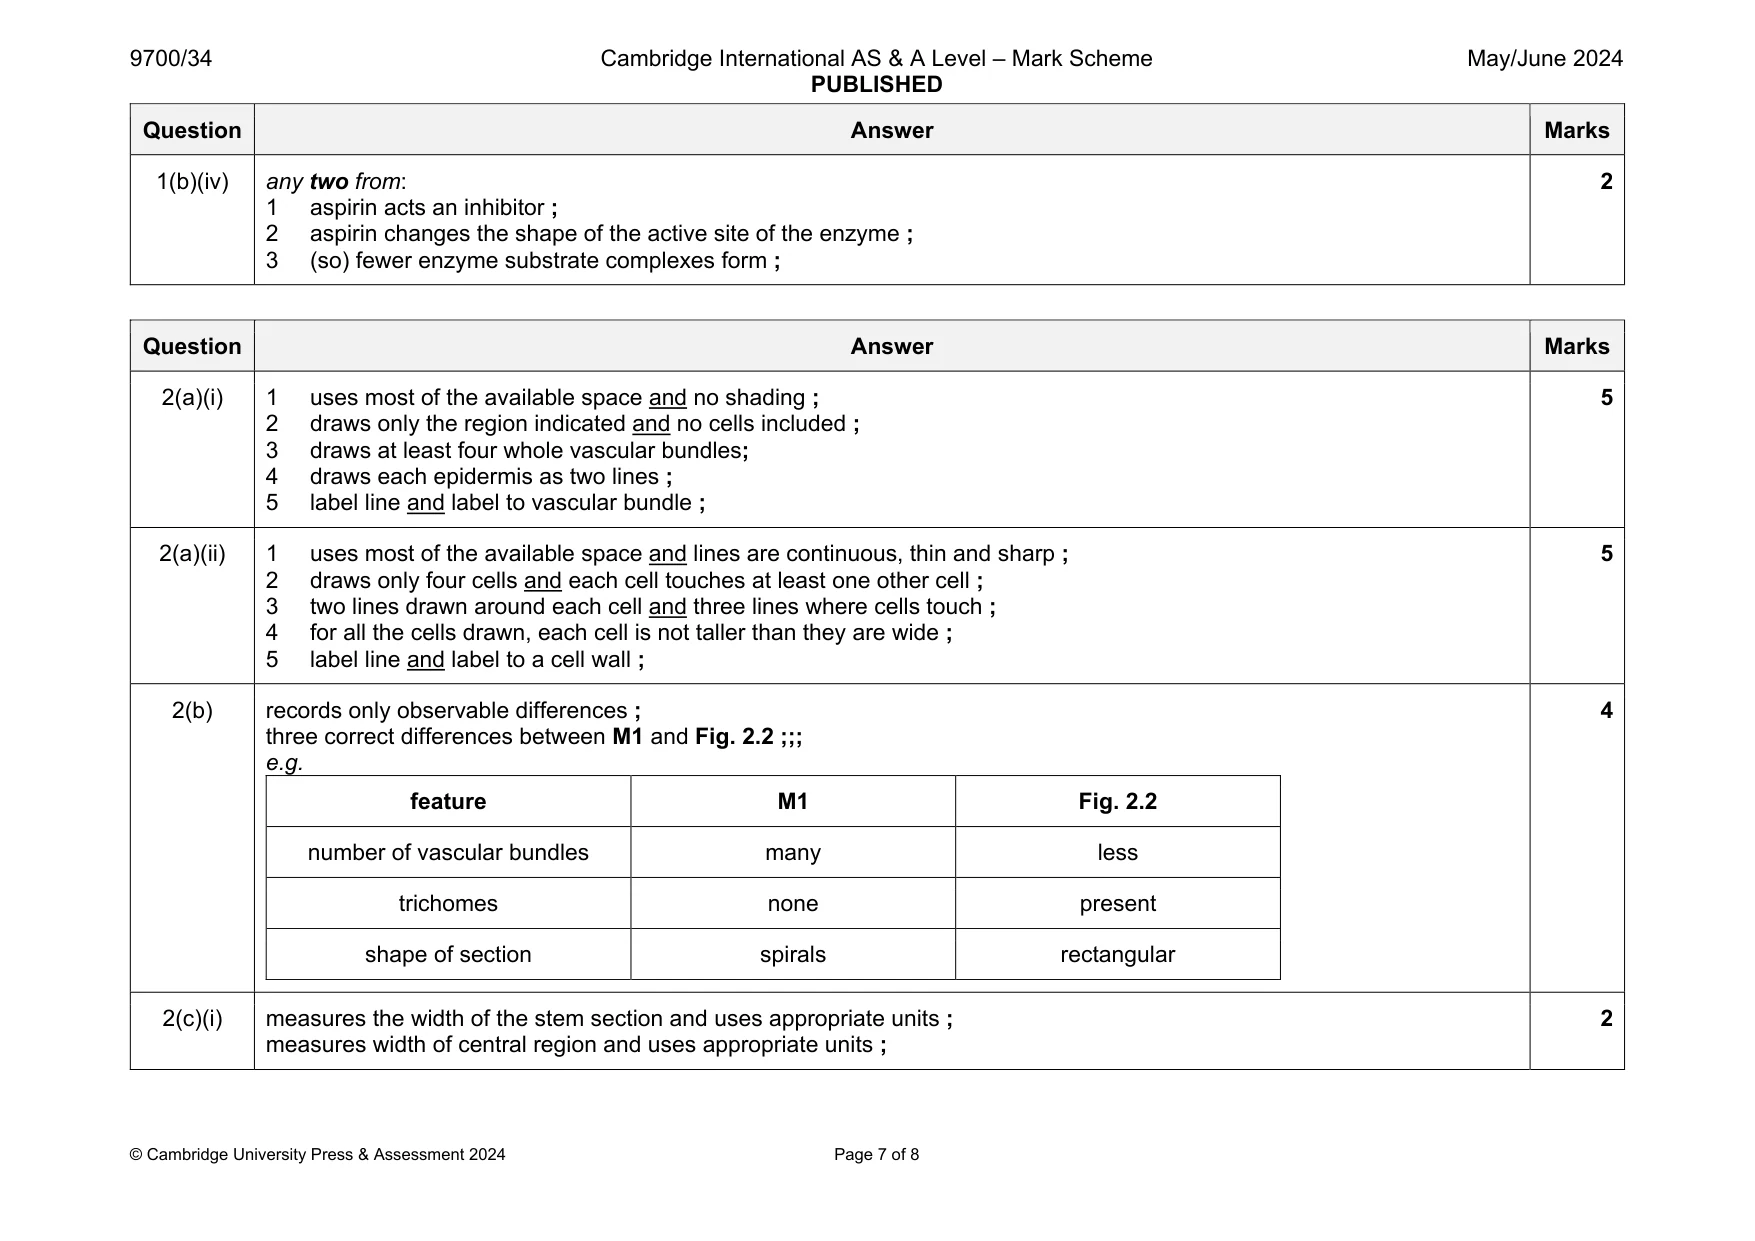
Mark scheme: 1(a)(i) 1 states at least three additional concentrations of salicylic acid ; 2 states the correct volumes of salicylic acid for each concentration ; 3 all volumes of salicylic acid (A) and water (W) add up to 10 cm3 ; 3 1(a)(ii) 1 heading for independent variable: percentage concentration of salicylic acid ; 2 heading for dependent variables: intensity (of colour) ; 3 a result for each concentration stated in (a)(i) ; 4 correct trend: at the highest concentration of salicylic acid the colour is more intense than at the lowest concentration ; 4 1(a)(iii) states the intensity of S1 and S2 using symbols ; 1 1(a)(iv) correctly estimates the concentration of S1 and S2 from the candidate’s results ; 1 1(a)(v) reference to S1 or S2 and correctly matches the concentration of salicylic acid in blood or urine with statements concerning metabolism or excretion of salicylic acid ; 1 1(a)(vi) concentration of salicylic acid ; 1 1(a)(vii) judgement of colour is, subjective / AW ; use a colorimeter ; 2 1(b)(i) 1 label on x-axis: time / minutes and label on y-axis: concentration of salicylic acid in urine / g mL–1 ; 2 scale on x-axis: 30 to 2 cm and labelled at least every 2 cm and scale on y-axis: 10 to 2 cm and labelled at least every 2 cm ; 3 correct plotting of all five points using small crosses or dots in circles ; 4 five plots joined with thin line passing through all points and line is either a smooth curve or joined point-to-point ; 4 1(b)(ii) shows an intercept on x-axis at 105 minutes ; correct answer according to candidate’s graph ; 2 1(b)(iii) concentration of salicylic acid decreases and reference to 65.5 µg mL–1 and 31.5 µg mL–1 ; 1 Question Answer Marks 1(b)(iv) any two from: 1 aspirin acts an inhibitor ; 2 aspirin changes the shape of the active site of the enzyme ; 3 (so) fewer enzyme substrate complexes form ; 2
Q2 · M1 is a slide of a stained transverse section through a plant structure made up of leaves…
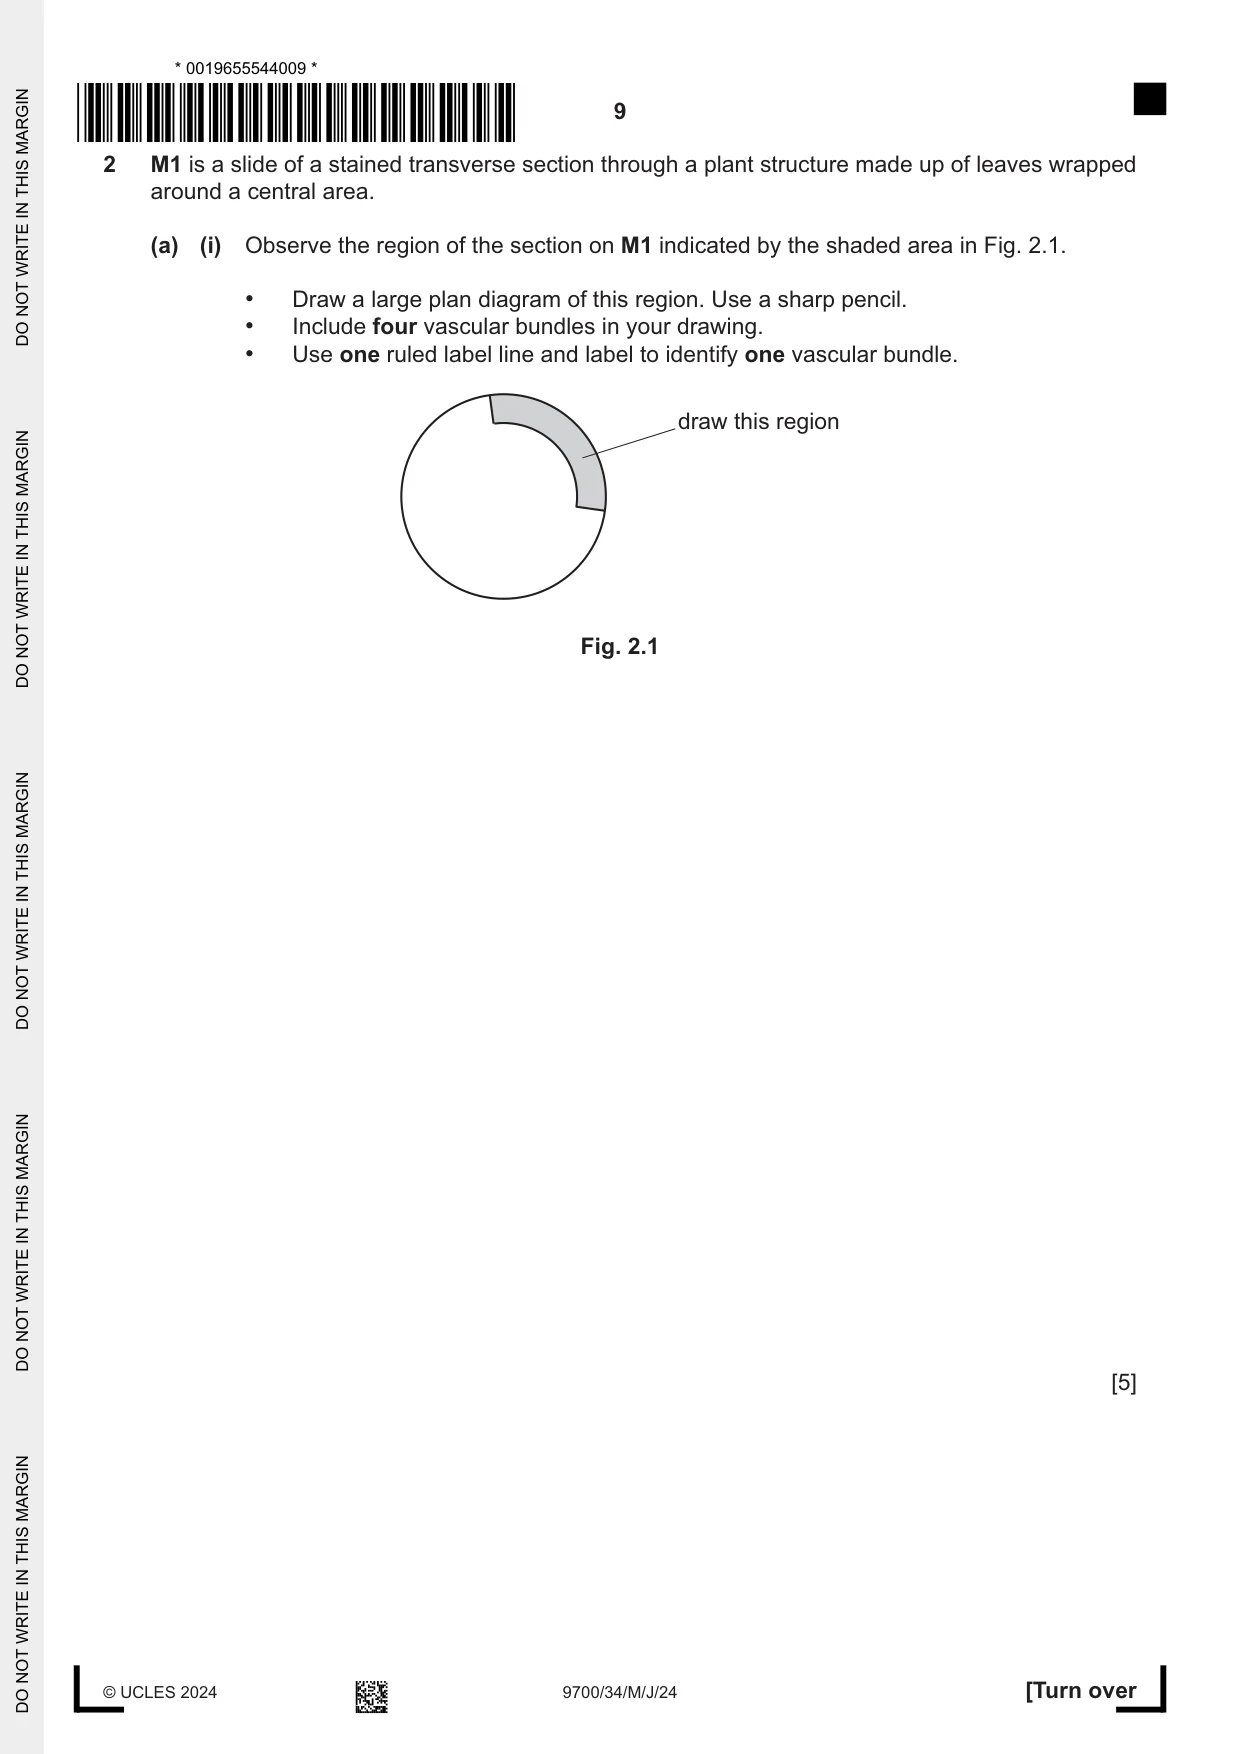
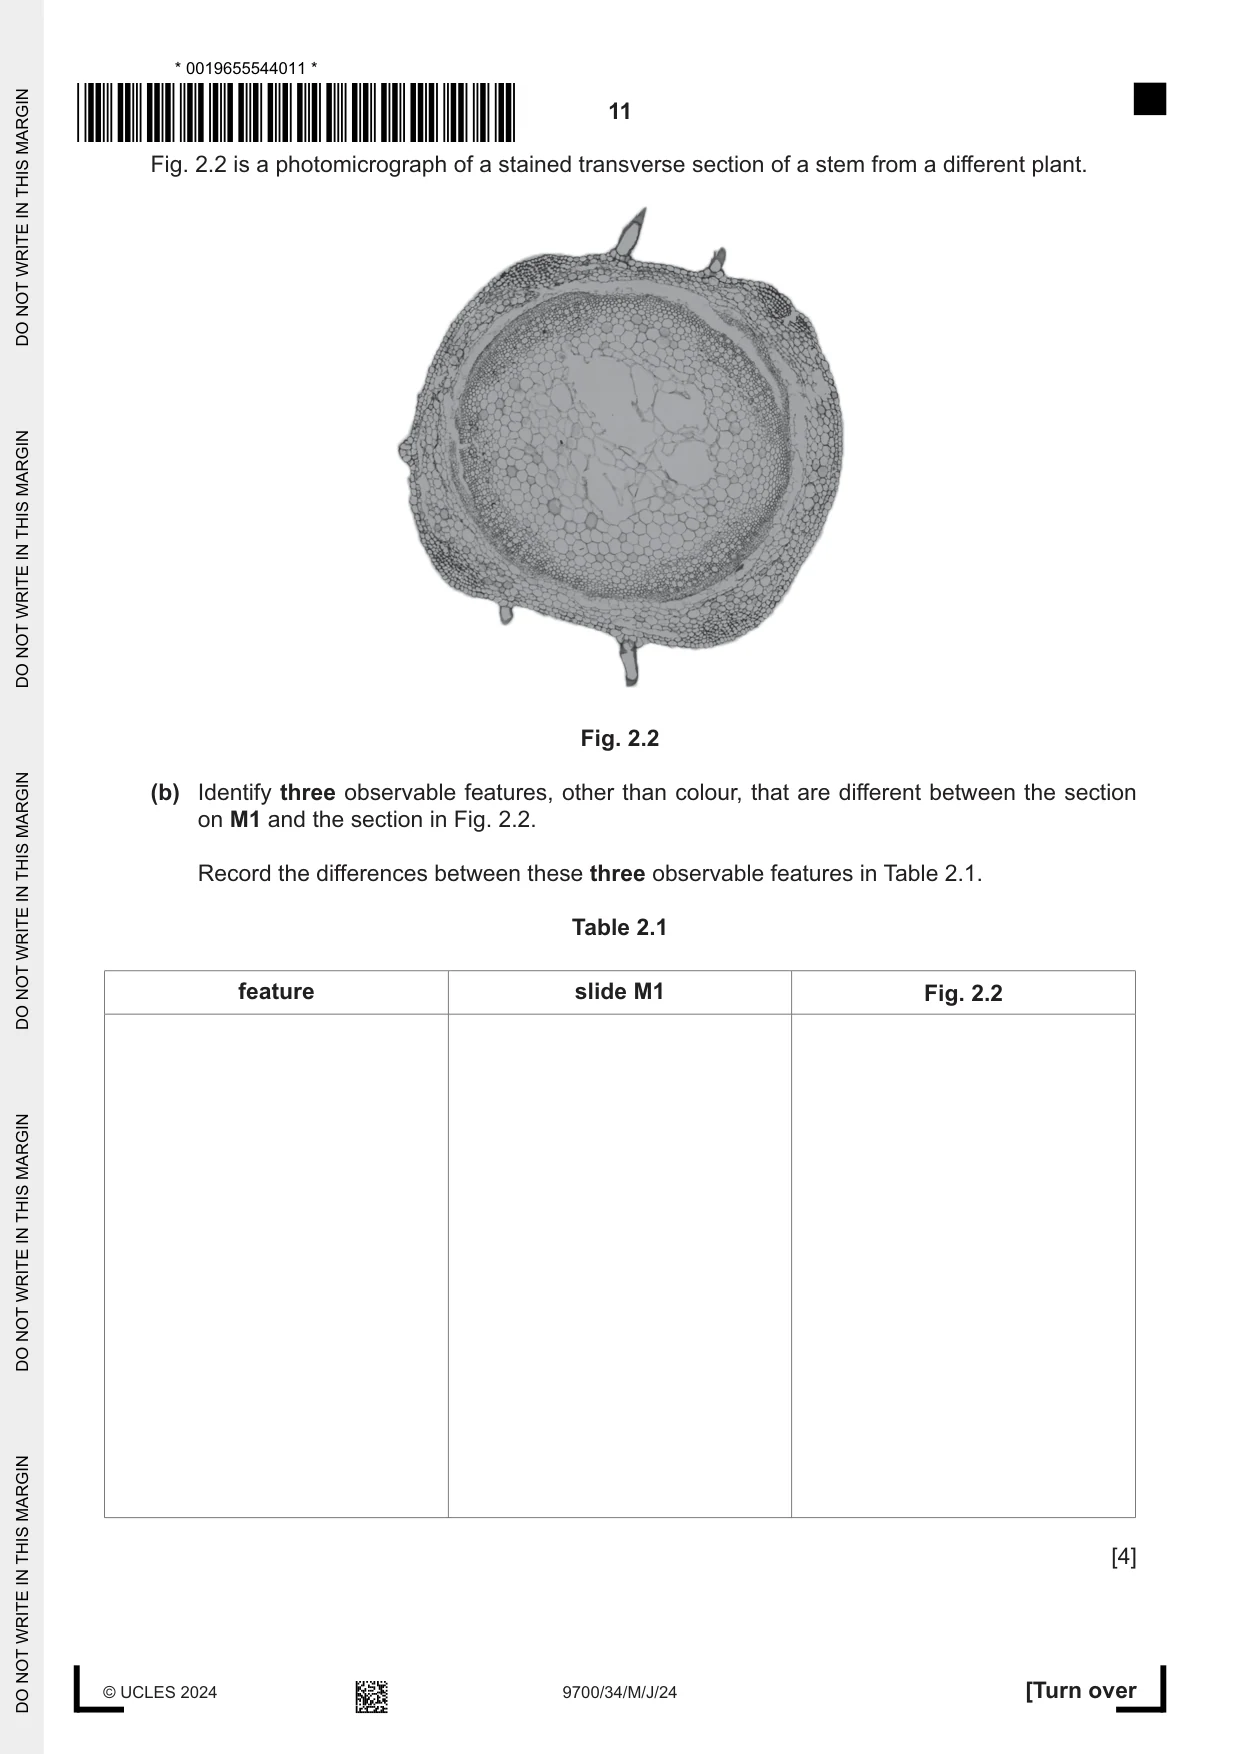
2 M1 is a slide of a stained transverse section through a plant structure made up of leaves wrapped around a central area. (a) (i) Observe the region of the section on M1 indicated by the shaded area in Fig. 2.1. • Draw a large plan diagram of this region. Use a sharp pencil. • Include four vascular bundles in your drawing. • Use one ruled label line and label to identify one vascular bundle. draw this region Fig. 2.1 [5] (ii) Observe the cells in the lower epidermis of the region indicated by the shaded area in Fig. 2.1. Select a line of four adjacent cells. Each cell must touch at least one of the other cells. • Make a large drawing of this line of four cells. • Use one ruled label line and label to identify a cell wall. [5] Fig. 2.2 is a photomicrograph of a stained transverse section of a stem from a different plant. Fig. 2.2 (b) Identify three observable features, other than colour, that are different between the section on M1 and the section in Fig. 2.2. Record the differences between these three observable features in Table 2.1. Table 2.1 feature slide M1 Fig. 2.2 [4]
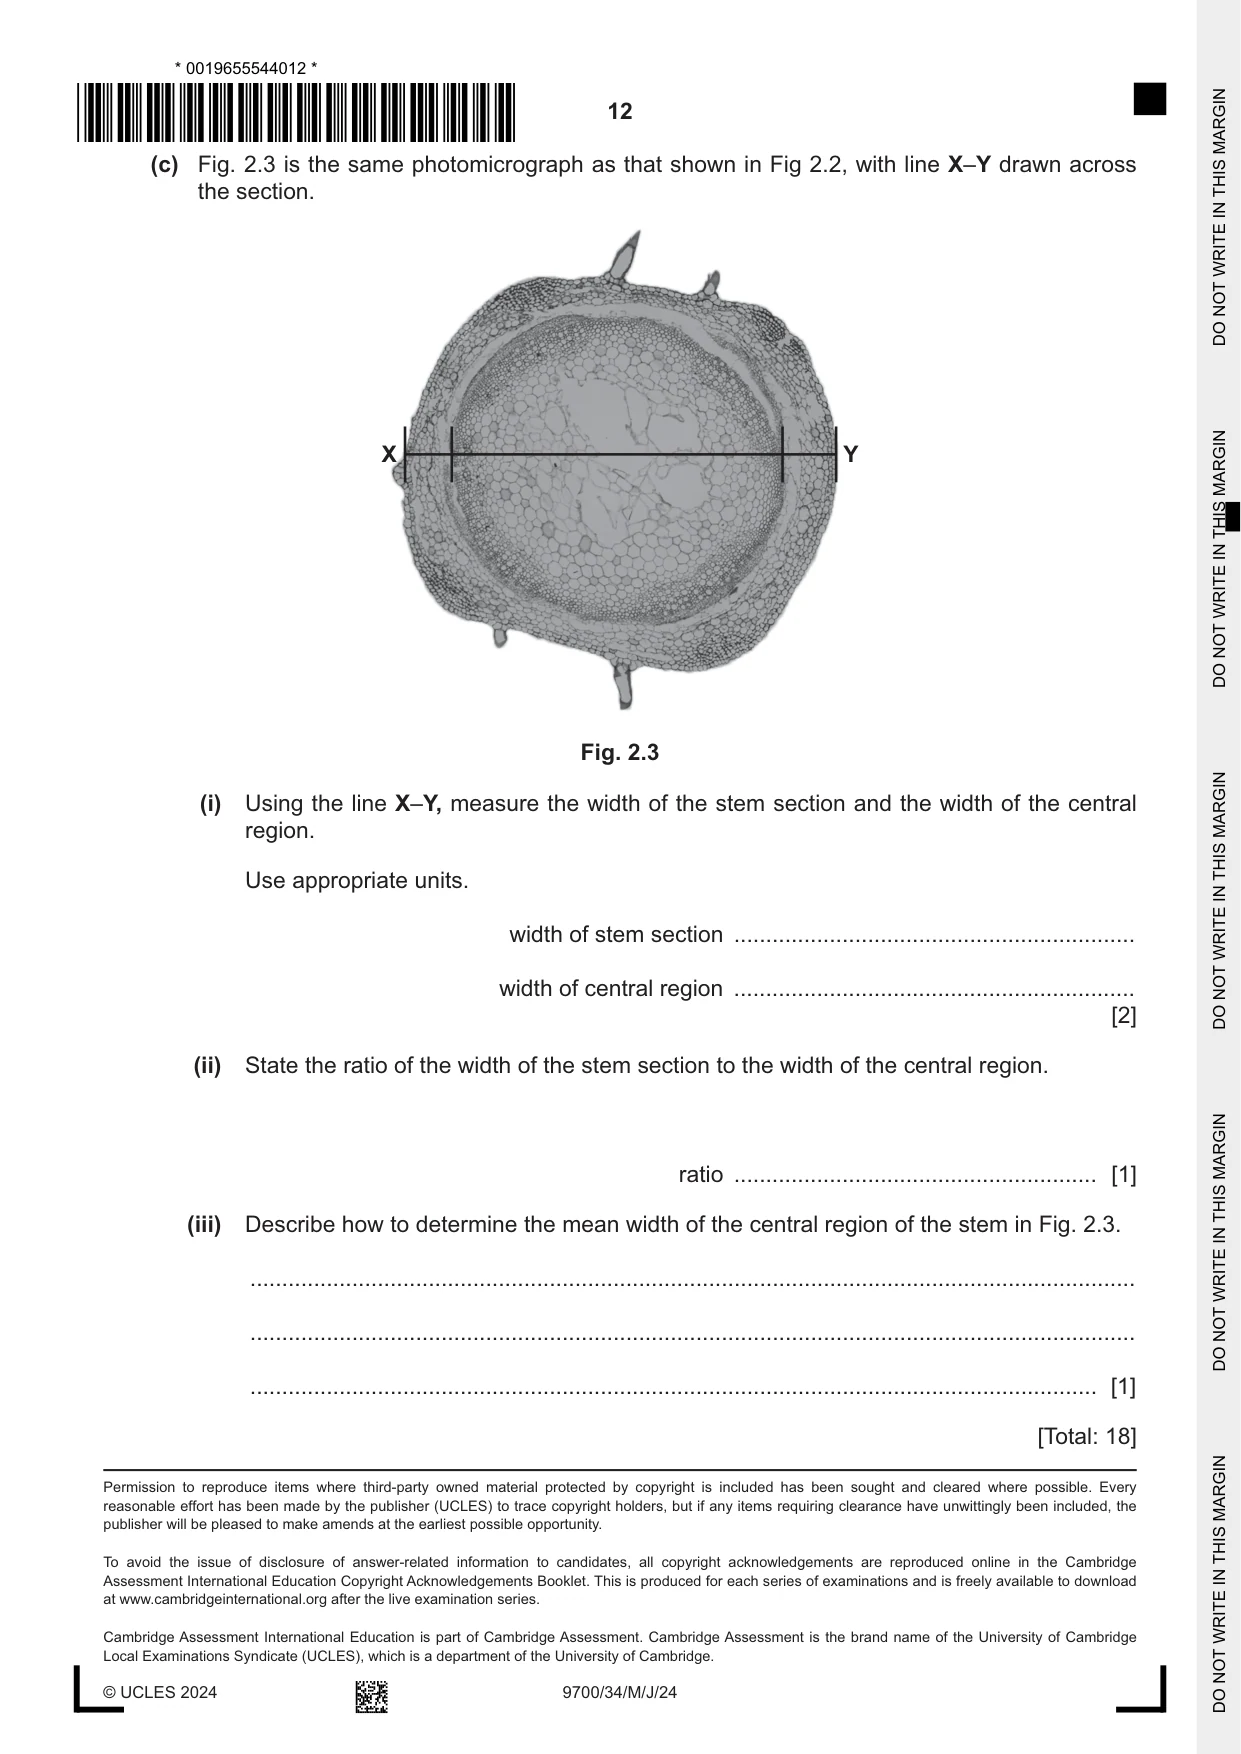
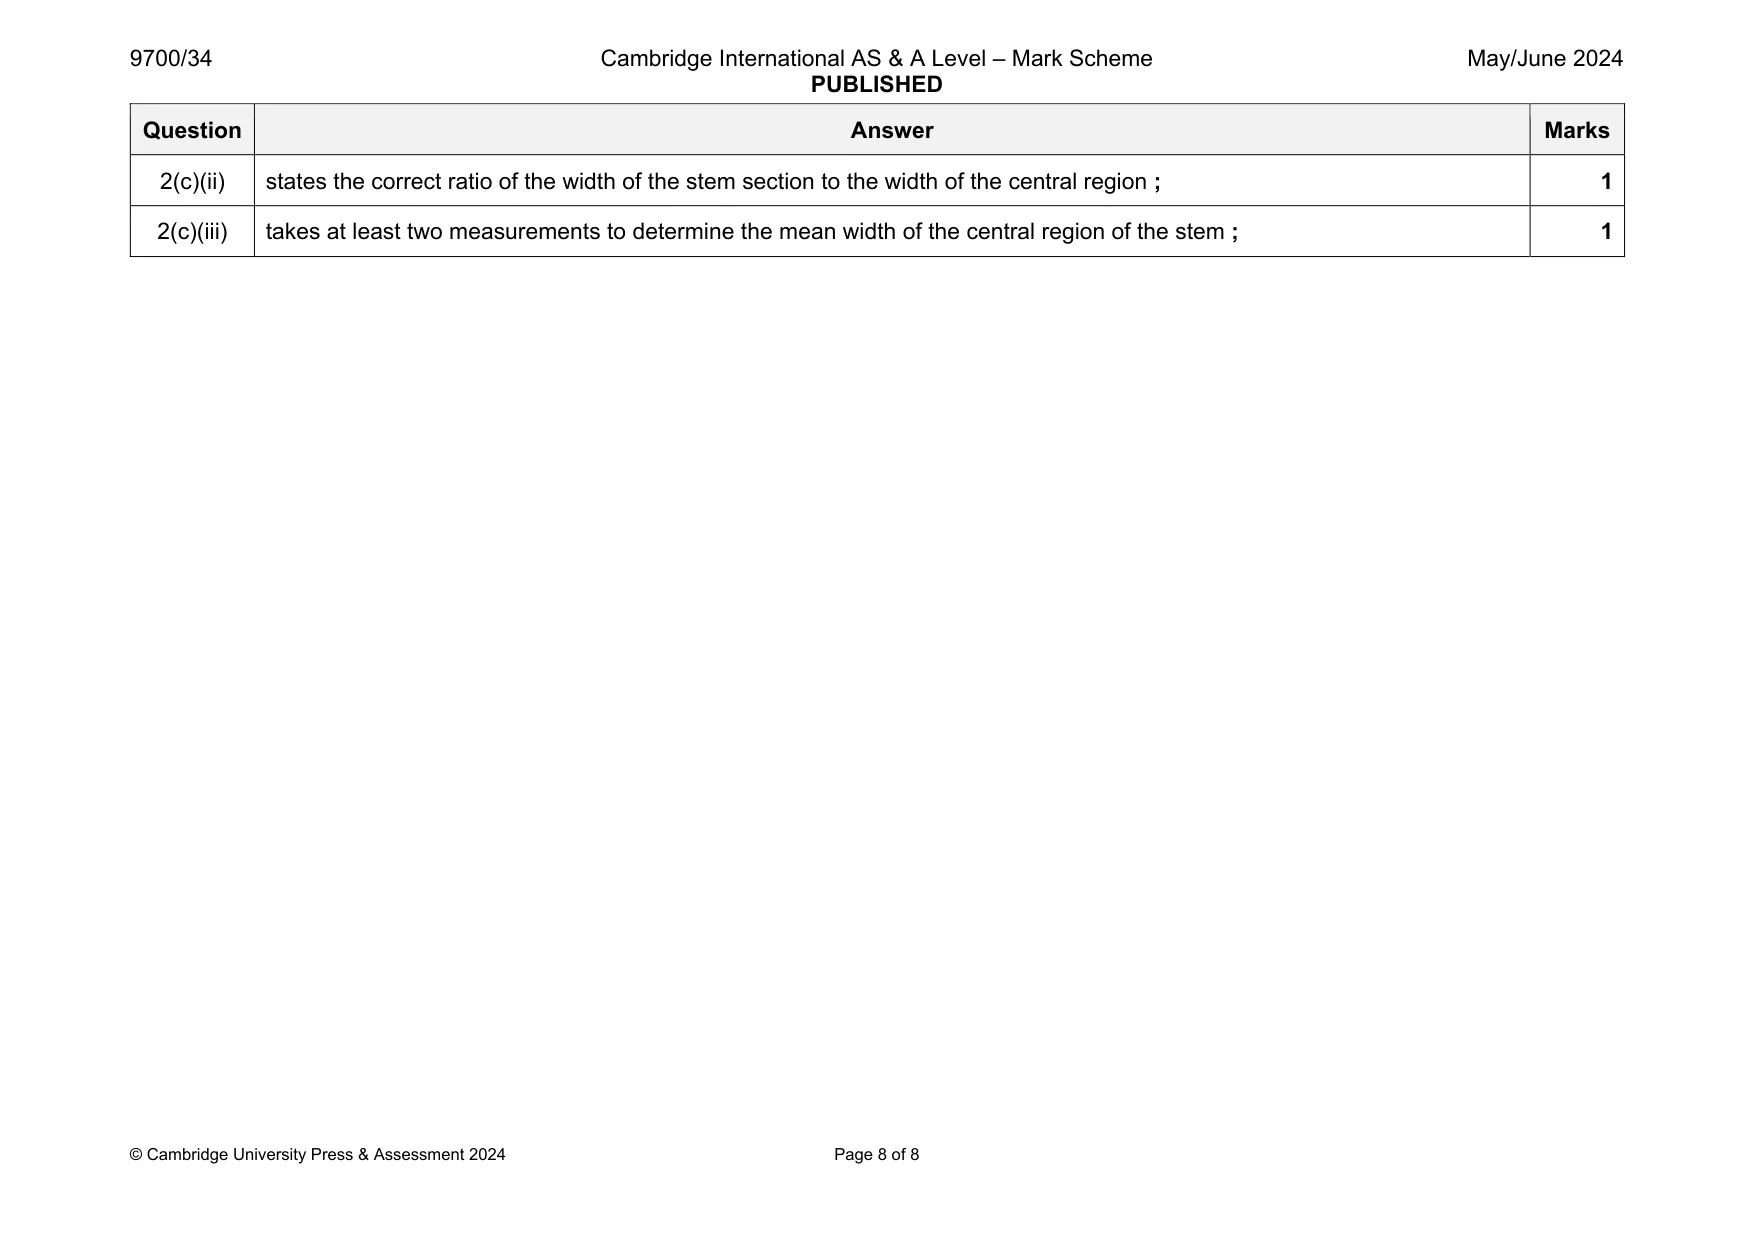
Mark scheme: 2(a)(i) 1 uses most of the available space and no shading ; 2 draws only the region indicated and no cells included ; 3 draws at least four whole vascular bundles; 4 draws each epidermis as two lines ; 5 label line and label to vascular bundle ; 5 2(a)(ii) 1 uses most of the available space and lines are continuous, thin and sharp ; 2 draws only four cells and each cell touches at least one other cell ; 3 two lines drawn around each cell and three lines where cells touch ; 4 for all the cells drawn, each cell is not taller than they are wide ; 5 label line and label to a cell wall ; 5 2(b) records only observable differences ; three correct differences between M1 and Fig. 2.2 ;;; e.g. feature M1 Fig. 2.2 number of vascular bundles many less trichomes none present shape of section spirals rectangular 4 2(c)(i) measures the width of the stem section and uses appropriate units ; measures width of central region and uses appropriate units ; 2 Question Answer Marks 2(c)(ii) states the correct ratio of the width of the stem section to the width of the central region ; 1 2(c)(iii) takes at least two measurements to determine the mean width of the central region of the stem ; 1
More questions on Cells as the basic units of living organisms
What was in this paper
The subtopics covered by these 2 questions, and how many questions each got. Open one in a new tab to see every Cambridge question on it.
What you needed in this session
Cambridge’s own grade thresholds for 2024 May/June, Paper 3 · Variant 4. A higher threshold means an easier paper — the bar moves with how the cohort did.