Cambridge A Level Biology 9700 — 2018 May/June Paper 3 · Variant 3
9700/33/M/J/18 · 2 questions · 40 marks · ≈45 min
The question paper and its mark scheme, free to read here and free to download. This is Cambridge’s own paper, exactly as it was sat.
Question paper12 pages


Mark scheme7 pages
Answers below. Sit the paper first if you are practising.
Questions as text
Q1 · Fruit growers need to know the concentration of sugars, such as sucrose, in the fruit so…
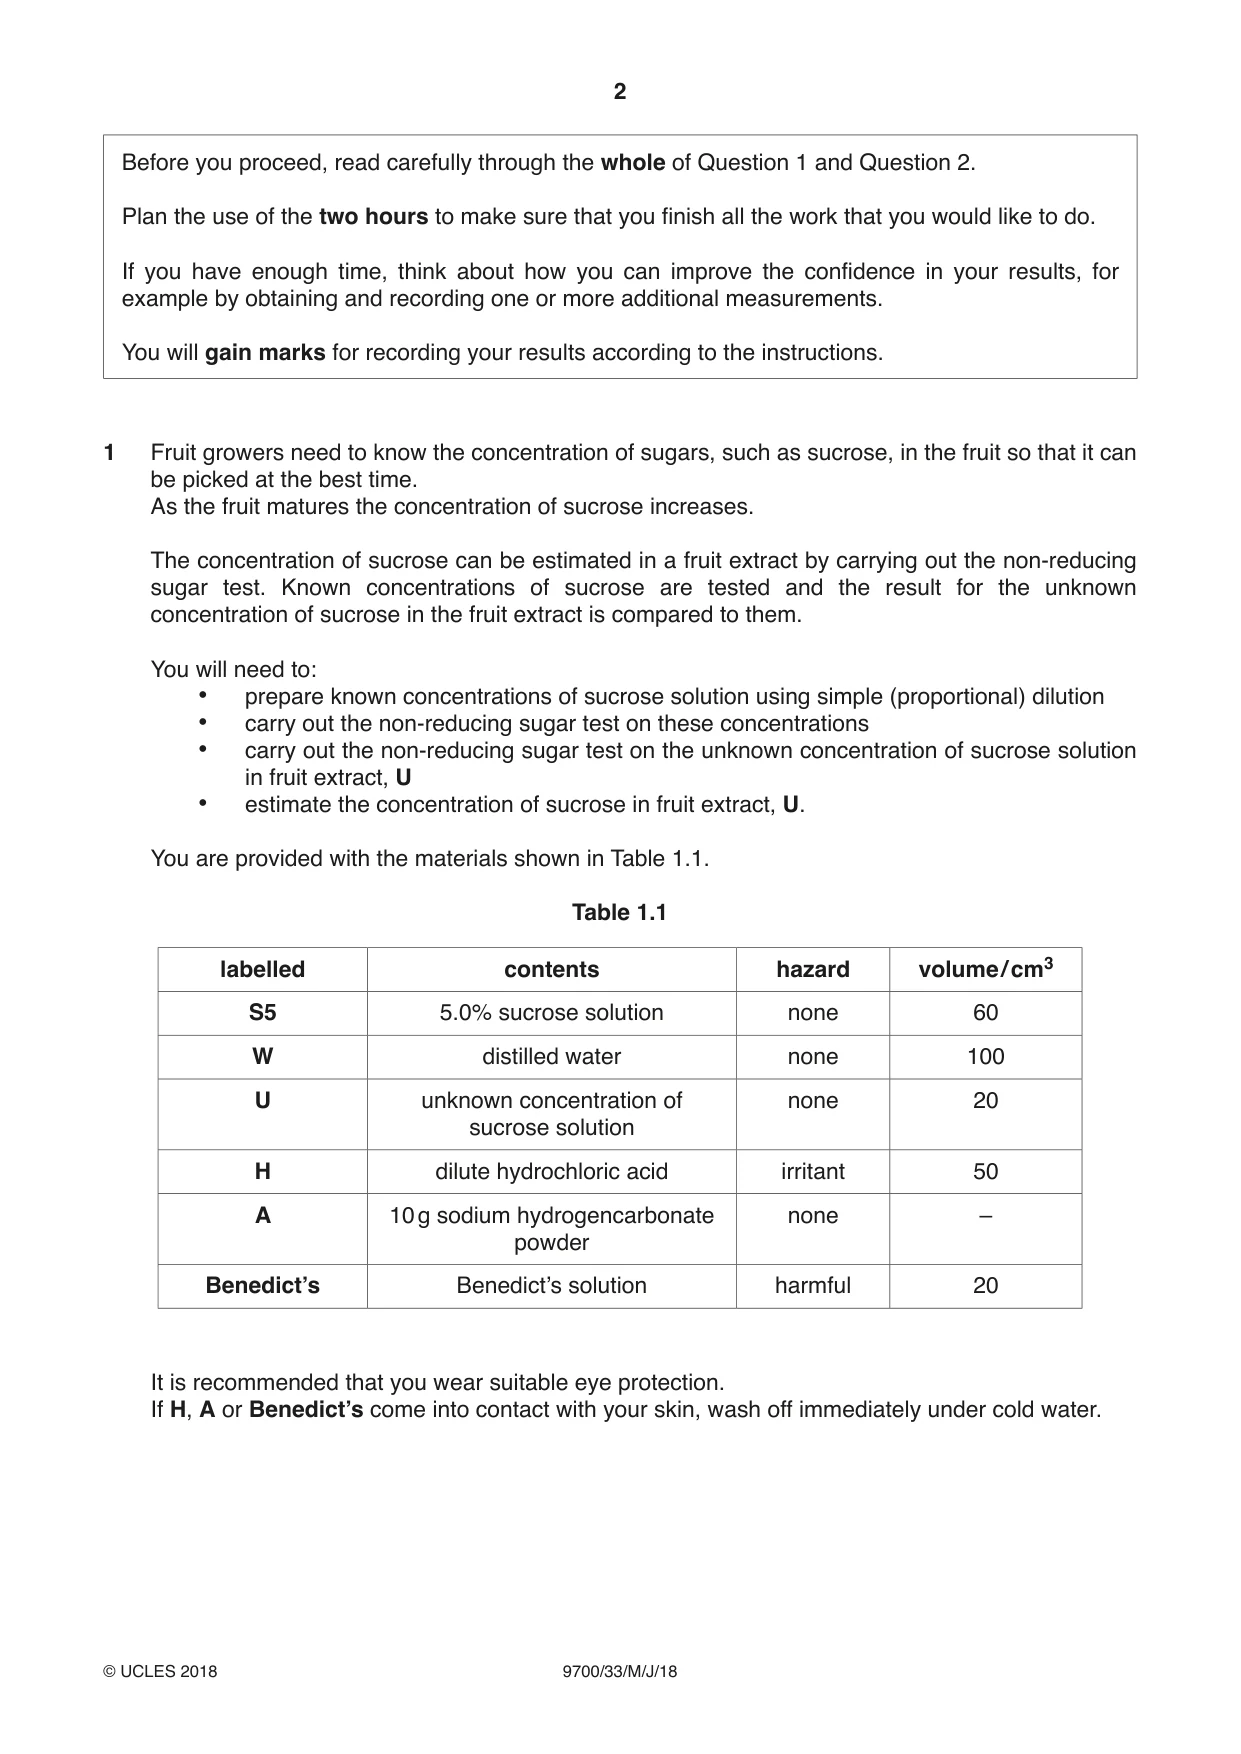
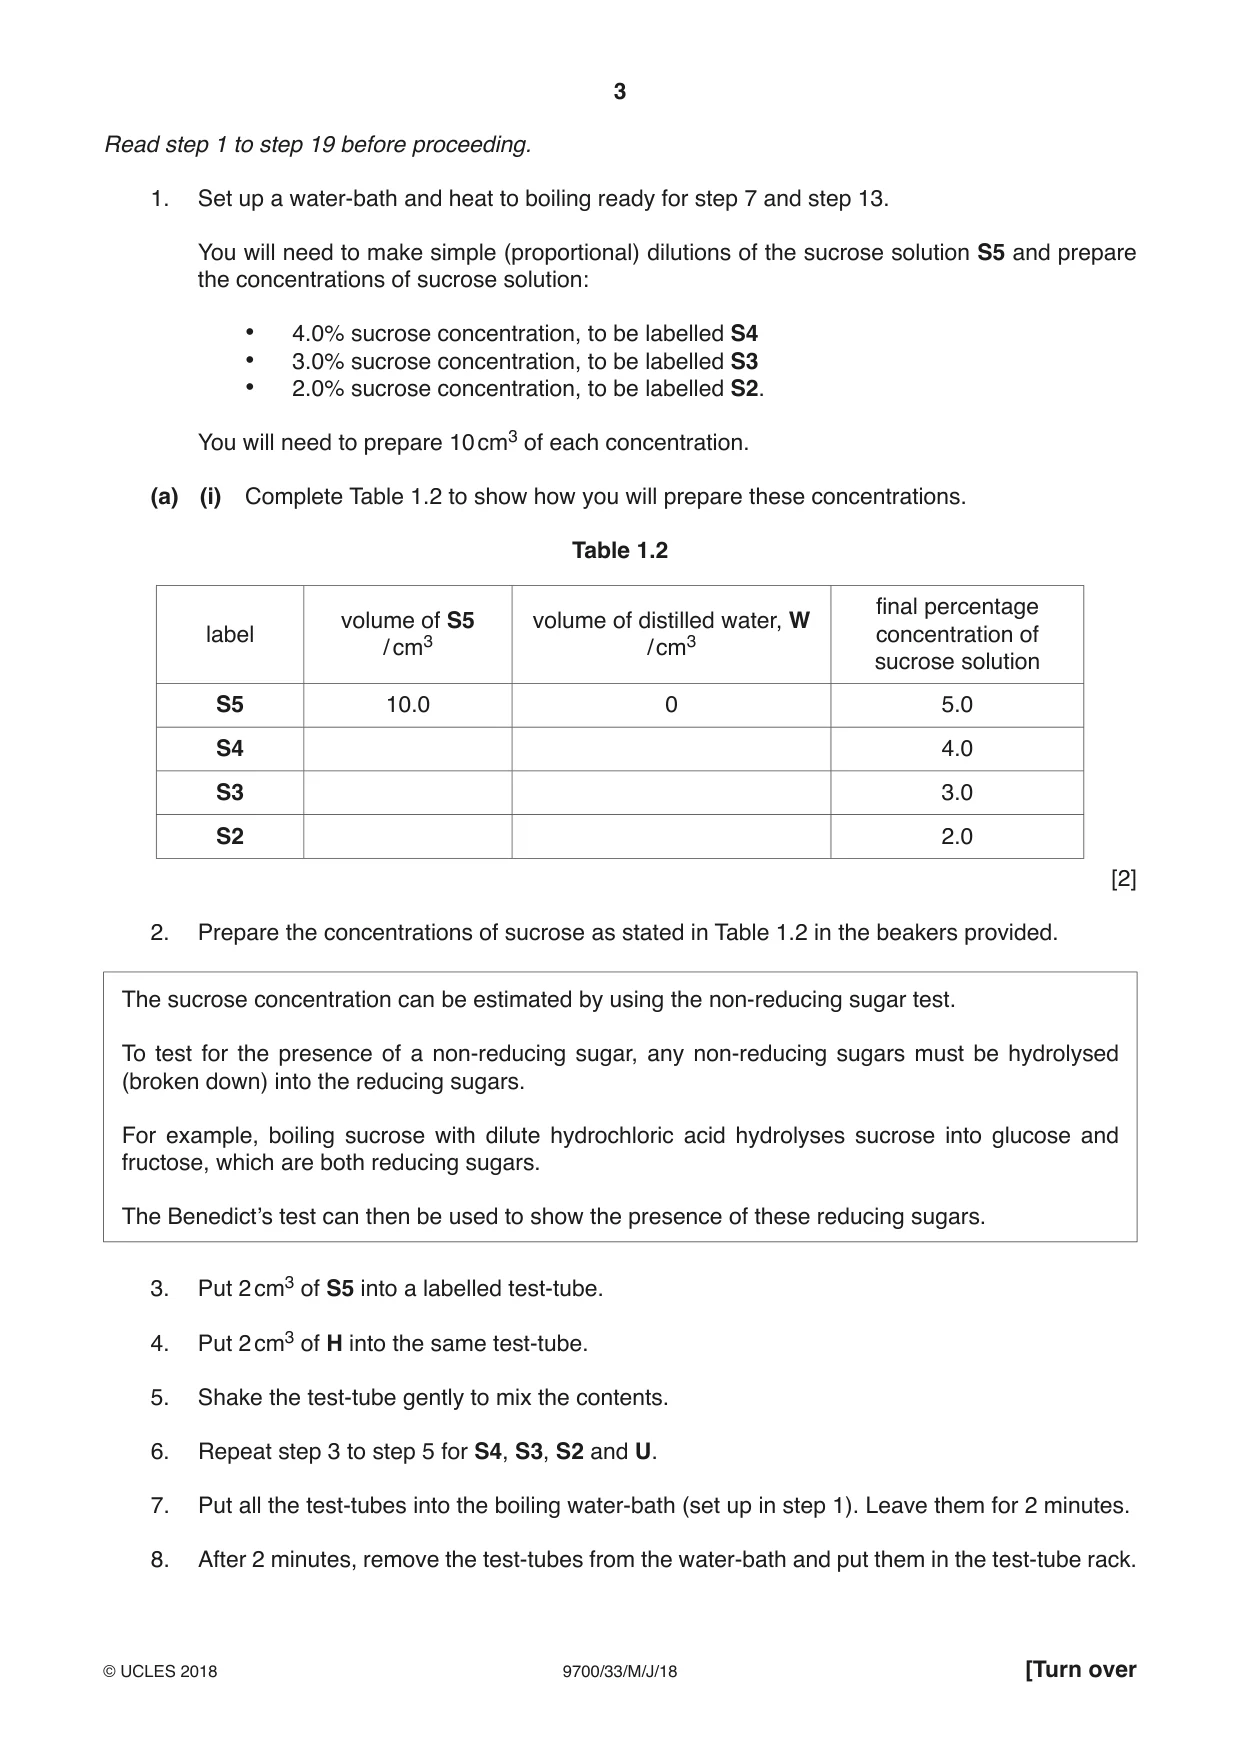
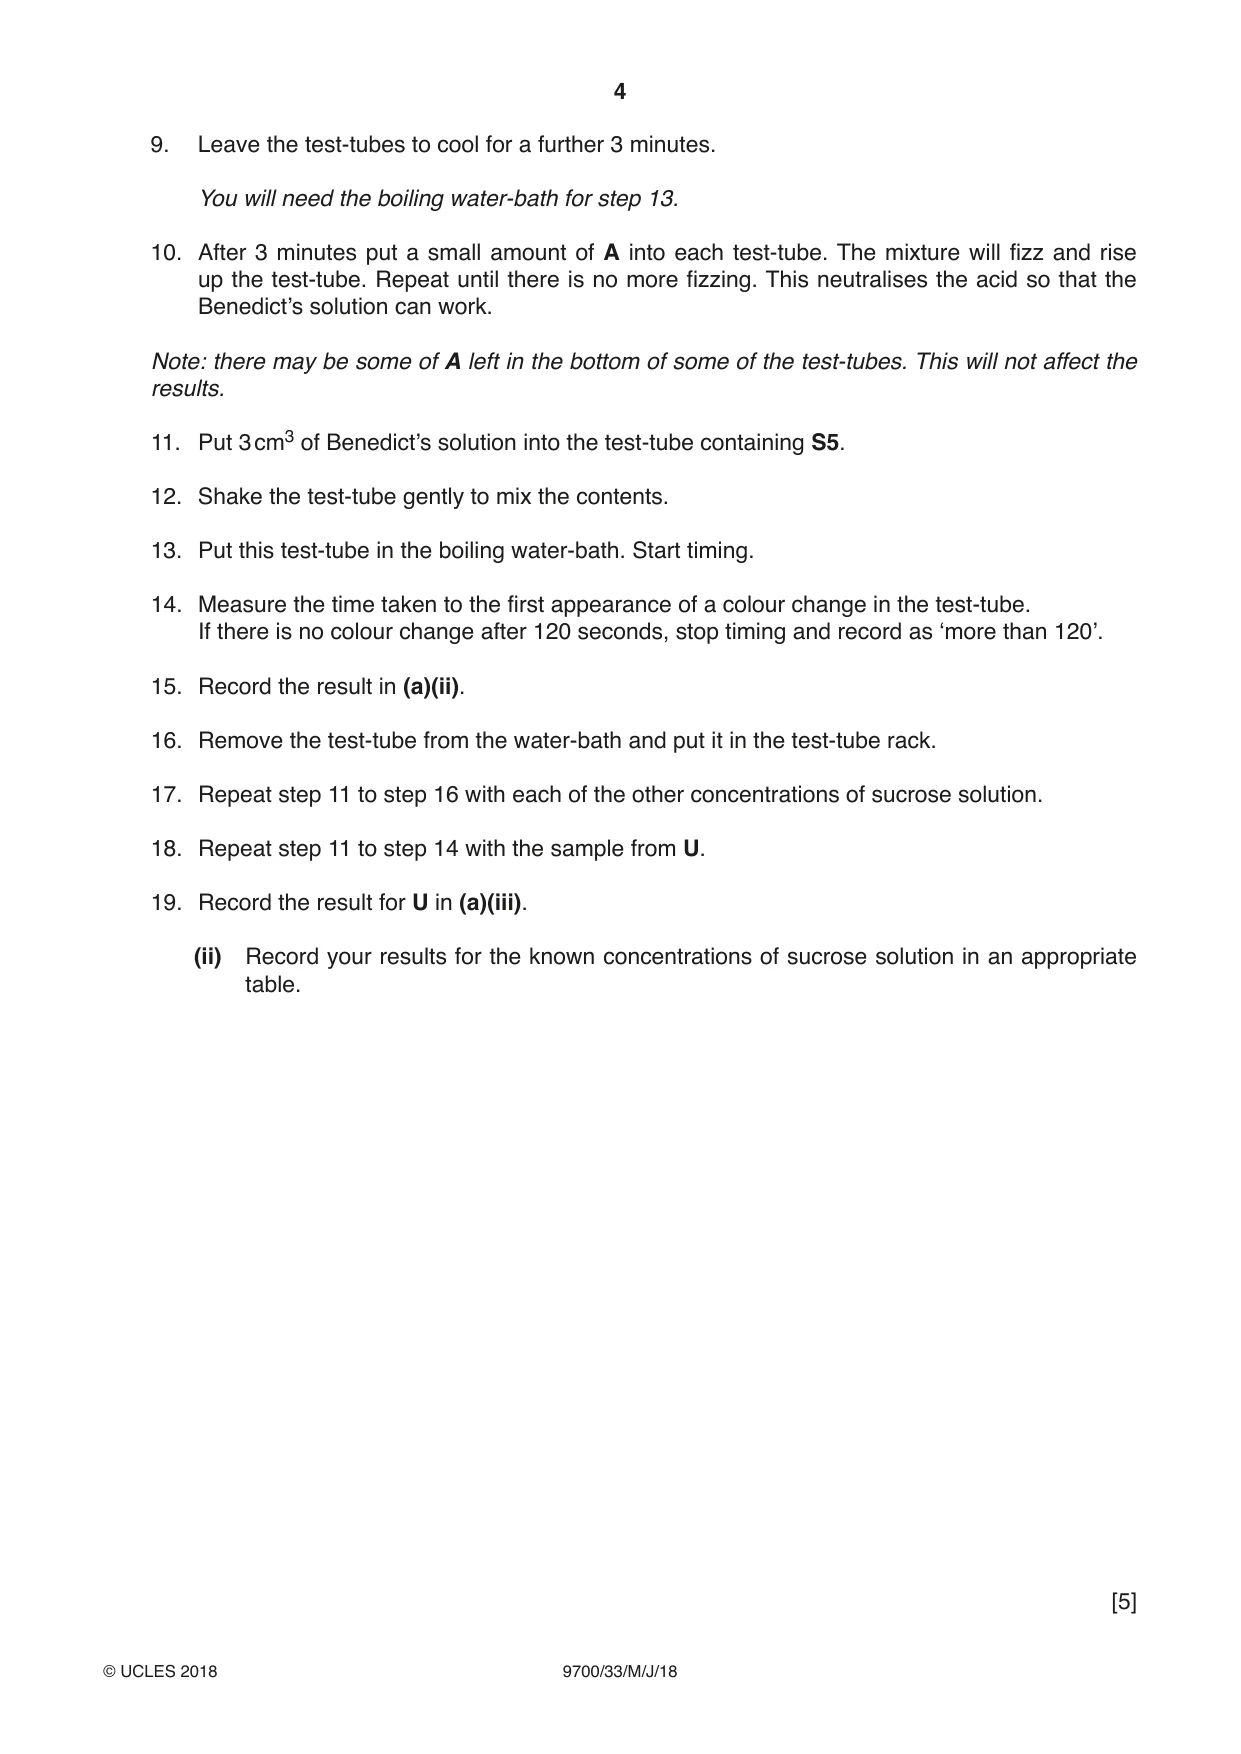
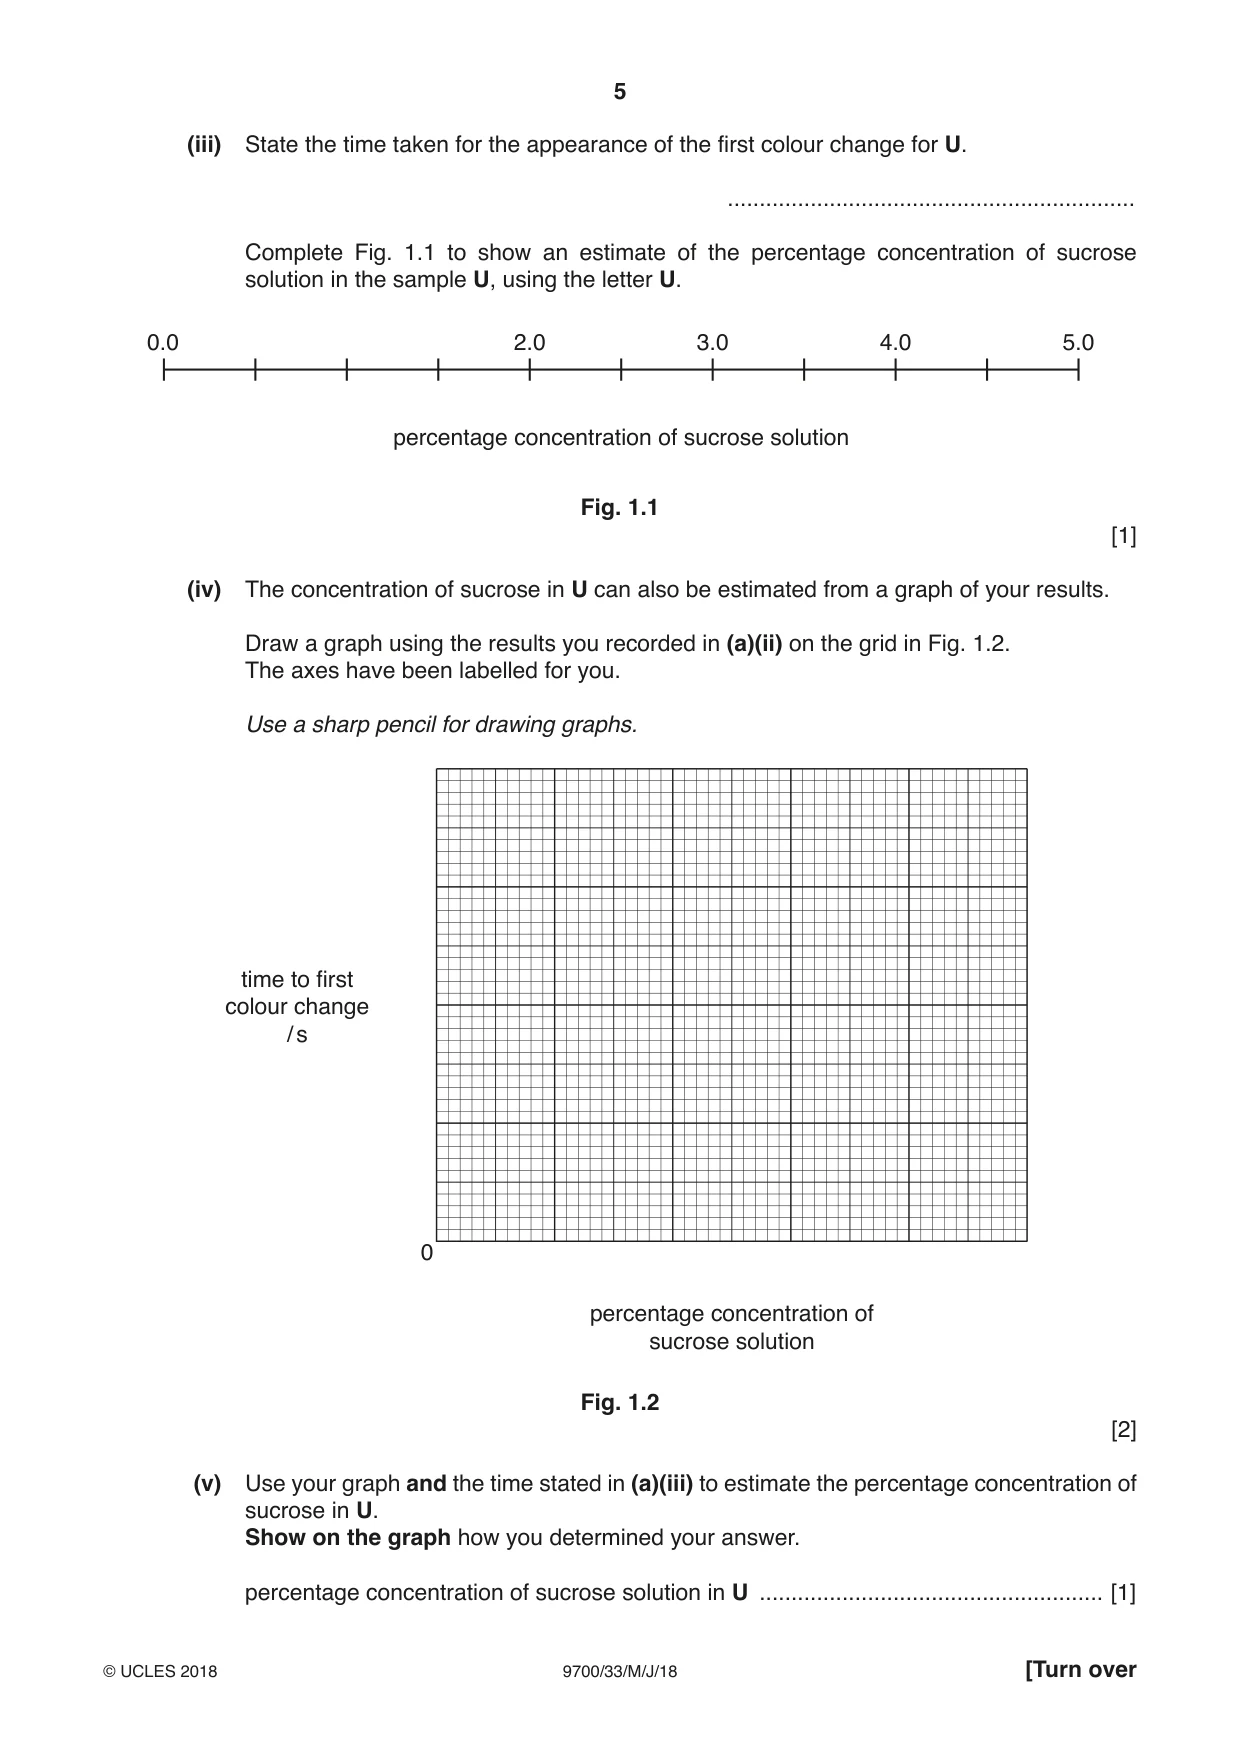
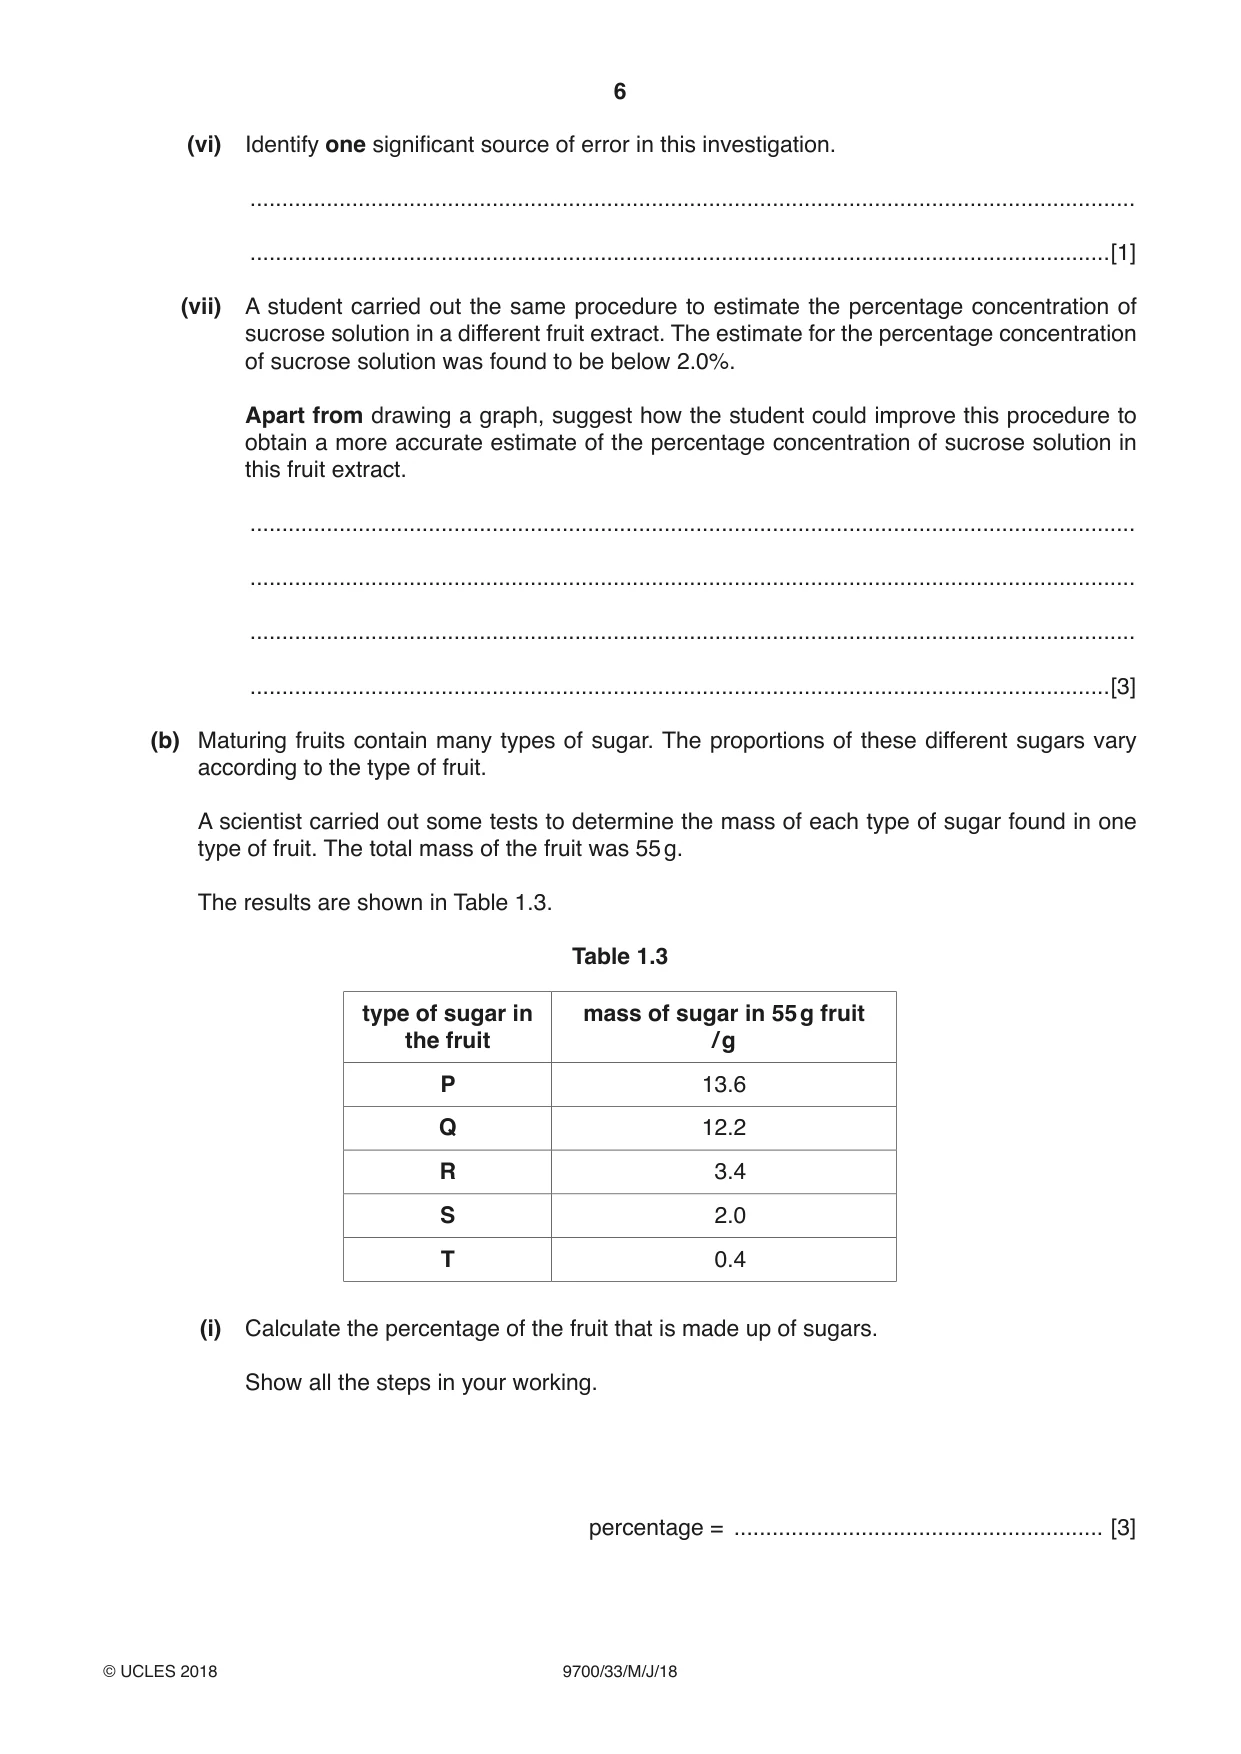
1 Fruit growers need to know the concentration of sugars, such as sucrose, in the fruit so that it can be picked at the best time. As the fruit matures the concentration of sucrose increases. The concentration of sucrose can be estimated in a fruit extract by carrying out the non‑reducing sugar test. Known concentrations of sucrose are tested and the result for the unknown concentration of sucrose in the fruit extract is compared to them. You will need to: • prepare known concentrations of sucrose solution using simple (proportional) dilution • carry out the non‑reducing sugar test on these concentrations • carry out the non‑reducing sugar test on the unknown concentration of sucrose solution in fruit extract, U • estimate the concentration of sucrose in fruit extract, U. You are provided with the materials shown in Table 1.1. Table 1.1 labelled contents hazard volume / cm3 S5 5.0% sucrose solution none 60 W distilled water none 100 U unknown concentration of none 20 sucrose solution H dilute hydrochloric acid irritant 50 A 10 g sodium hydrogencarbonate none – powder Benedict’s Benedict’s solution harmful 20 It is recommended that you wear suitable eye protection. If H, A or Benedict’s come into contact with your skin, wash off immediately under cold water. Read step 1 to step 19 before proceeding. 1. Set up a water‑bath and heat to boiling ready for step 7 and step 13. You will need to make simple (proportional) dilutions of the sucrose solution S5 and prepare the concentrations of sucrose solution: • 4.0% sucrose concentration, to be labelled S4 • 3.0% sucrose concentration, to be labelled S3 • 2.0% sucrose concentration, to be labelled S2. You will need to prepare 10 cm3 of each concentration. (a) (i) Complete Table 1.2 to show how you will prepare these concentrations. Table 1.2 final percentage volume of S5 volume of distilled water, W label concentration of / cm3 / cm3 sucrose solution S5 10.0 0 5.0 S4 4.0 S3 3.0 S2 2.0 [2] 2. Prepare the concentrations of sucrose as stated in Table 1.2 in the beakers provided. The sucrose concentration can be estimated by using the non‑reducing sugar test. To test for the presence of a non‑reducing sugar, any non‑reducing sugars must be hydrolysed (broken down) into the reducing sugars. For example, boiling sucrose with dilute hydrochloric acid hydrolyses sucrose into glucose and fructose, which are both reducing sugars. The Benedict’s test can then be used to show the presence of these reducing sugars. 3. Put 2 cm3 of S5 into a labelled test‑tube. 4. Put 2 cm3 of H into the same test‑tube. 5. Shake the test‑tube gently to mix the contents. 6. Repeat step 3 to step 5 for S4, S3, S2 and U. 7. Put all the test‑tubes into the boiling water‑bath (set up in step 1). Leave them for 2 minutes. 8. After 2 minutes, remove the test‑tubes from the water‑bath and put them in the test‑tube rack. 9. Leave the test‑tubes to cool for a further 3 minutes. You will need the boiling water-bath for step 13. 10. After 3 minutes put a small amount of A into each test‑tube. The mixture will fizz and rise up the test‑tube. Repeat until there is no more fizzing. This neutralises the acid so that the Benedict’s solution can work. Note: there may be some of A left in the bottom of some of the test-tubes. This will not affect the results. 11. Put 3 cm3 of Benedict’s solution into the test-tube containing S5. 12. Shake the test‑tube gently to mix the contents. 13. Put this test‑tube in the boiling water‑bath. Start timing. 14. Measure the time taken to the first appearance of a colour change in the test‑tube. If there is no colour change after 120 seconds, stop timing and record as ‘more than 120’. 15. Record the result in (a)(ii). 16. Remove the test‑tube from the water‑bath and put it in the test‑tube rack. 17. Repeat step 11 to step 16 with each of the other concentrations of sucrose solution. 18. Repeat step 11 to step 14 with the sample from U. 19. Record the result for U in (a)(iii). (ii) Record your results for the known concentrations of sucrose solution in an appropriate table. [5] (iii) State the time taken for the appearance of the first colour change for U. ................................................................ Complete Fig. 1.1 to show an estimate of the percentage concentration of sucrose solution in the sample U, using the letter U. 0.0 2.0 3.0 4.0 5.0 percentage concentration of sucrose solution Fig. 1.1 [1] (iv) The concentration of sucrose in U can also be estimated from a graph of your results. Draw a graph using the results you recorded in (a)(ii) on the grid in Fig. 1.2. The axes have been labelled for you. Use a sharp pencil for drawing graphs. time to first colour change / s 0 percentage concentration of sucrose solution Fig. 1.2 [2] (v) Use your graph and the time stated in (a)(iii) to estimate the percentage concentration of sucrose in U. Show on the graph how you determined your answer. percentage concentration of sucrose solution in U ...................................................... [1] (vi) Identify one significant source of error in this investigation. ........................................................................................................................................... .......................................................................................................................................[1] (vii) A student carried out the same procedure to estimate the percentage concentration of sucrose solution in a different fruit extract. The estimate for the percentage concentration of sucrose solution was found to be below 2.0%. Apart from drawing a graph, suggest how the student could improve this procedure to obtain a more accurate estimate of the percentage concentration of sucrose solution in this fruit extract. ........................................................................................................................................... ........................................................................................................................................... ........................................................................................................................................... .......................................................................................................................................[3] (b) Maturing fruits contain many types of sugar. The proportions of these different sugars vary according to the type of fruit. A scientist carried out some tests to determine the mass of each type of sugar found in one type of fruit. The total mass of the fruit was 55 g. The results are shown in Table 1.3. Table 1.3 type of sugar in mass of sugar in 55 g fruit the fruit / g P 13.6 Q 12.2 R 3.4 S 2.0 T 0.4 (i) Calculate the percentage of the fruit that is made up of sugars. Show all the steps in your working. percentage = .......................................................... [3] (ii) Draw a bar chart of the data shown in Table 1.3 on the grid in Fig. 1.3. Each bar should be separated for each type of sugar. Use a sharp pencil for drawing bar charts. Fig. 1.3 [2] (iii) Name one source of the sucrose in the plant and the process used for loading the sucrose into the phloem tissue. source ............................................................... process ............................................................... [2] [Total: 22]
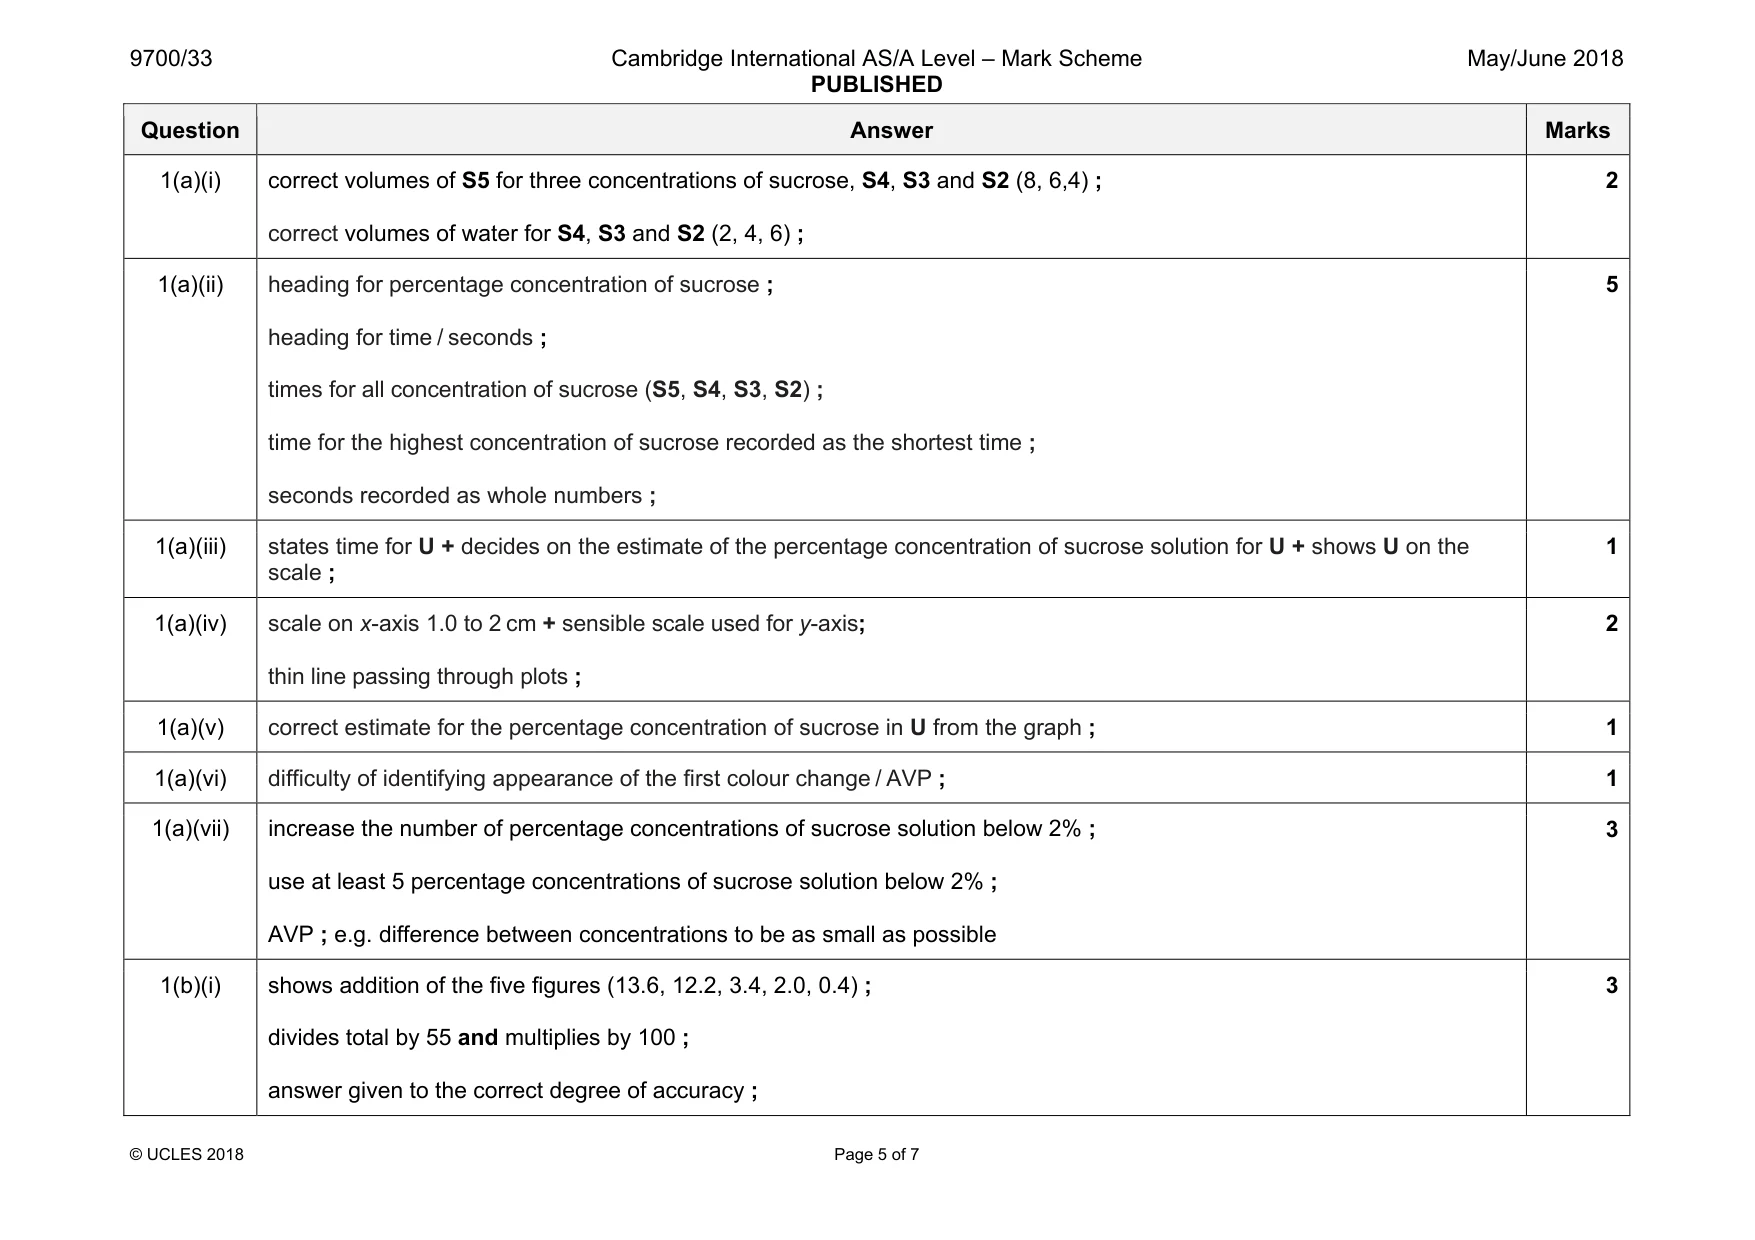
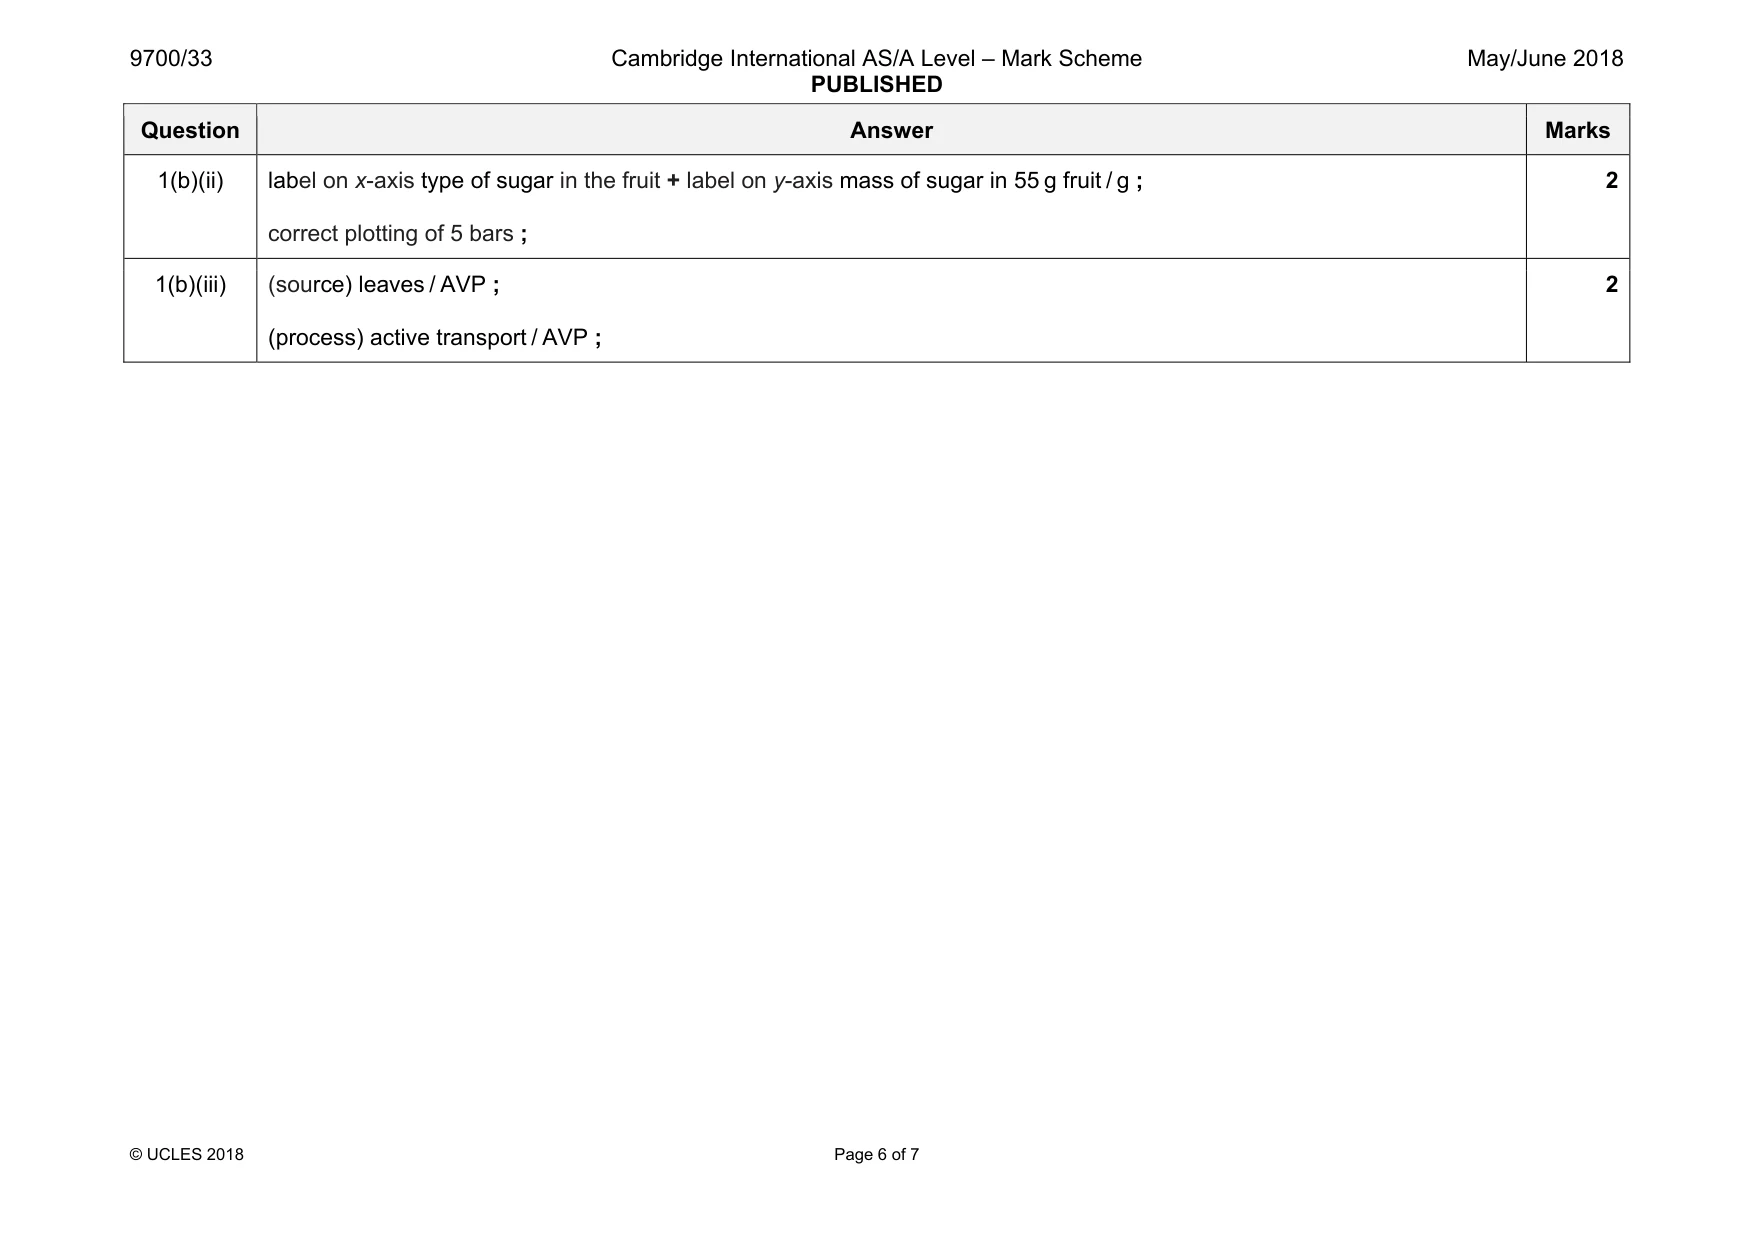
Mark scheme: 1(a)(i) correct volumes of S5 for three concentrations of sucrose, S4, S3 and S2 (8, 6,4) ; correct volumes of water for S4, S3 and S2 (2, 4, 6) ; 2 1(a)(ii) heading for percentage concentration of sucrose ; heading for time / seconds ; times for all concentration of sucrose (S5, S4, S3, S2) ; time for the highest concentration of sucrose recorded as the shortest time ; seconds recorded as whole numbers ; 5 1(a)(iii) states time for U + decides on the estimate of the percentage concentration of sucrose solution for U + shows U on the scale ; 1 1(a)(iv) scale on x-axis 1.0 to 2 cm + sensible scale used for y-axis; thin line passing through plots ; 2 1(a)(v) correct estimate for the percentage concentration of sucrose in U from the graph ; 1 1(a)(vi) difficulty of identifying appearance of the first colour change / AVP ; 1 1(a)(vii) increase the number of percentage concentrations of sucrose solution below 2% ; use at least 5 percentage concentrations of sucrose solution below 2% ; AVP ; e.g. difference between concentrations to be as small as possible 3 1(b)(i) shows addition of the five figures (13.6, 12.2, 3.4, 2.0, 0.4) ; divides total by 55 and multiplies by 100 ; answer given to the correct degree of accuracy ; 3 Question Answer Marks 1(b)(ii) label on x-axis type of sugar in the fruit + label on y-axis mass of sugar in 55 g fruit / g ; correct plotting of 5 bars ; 2 1(b)(iii) (source) leaves / AVP ; (process) active transport / AVP ; 2
Q2 · K1 is a slide of a stained transverse section through a plant stem
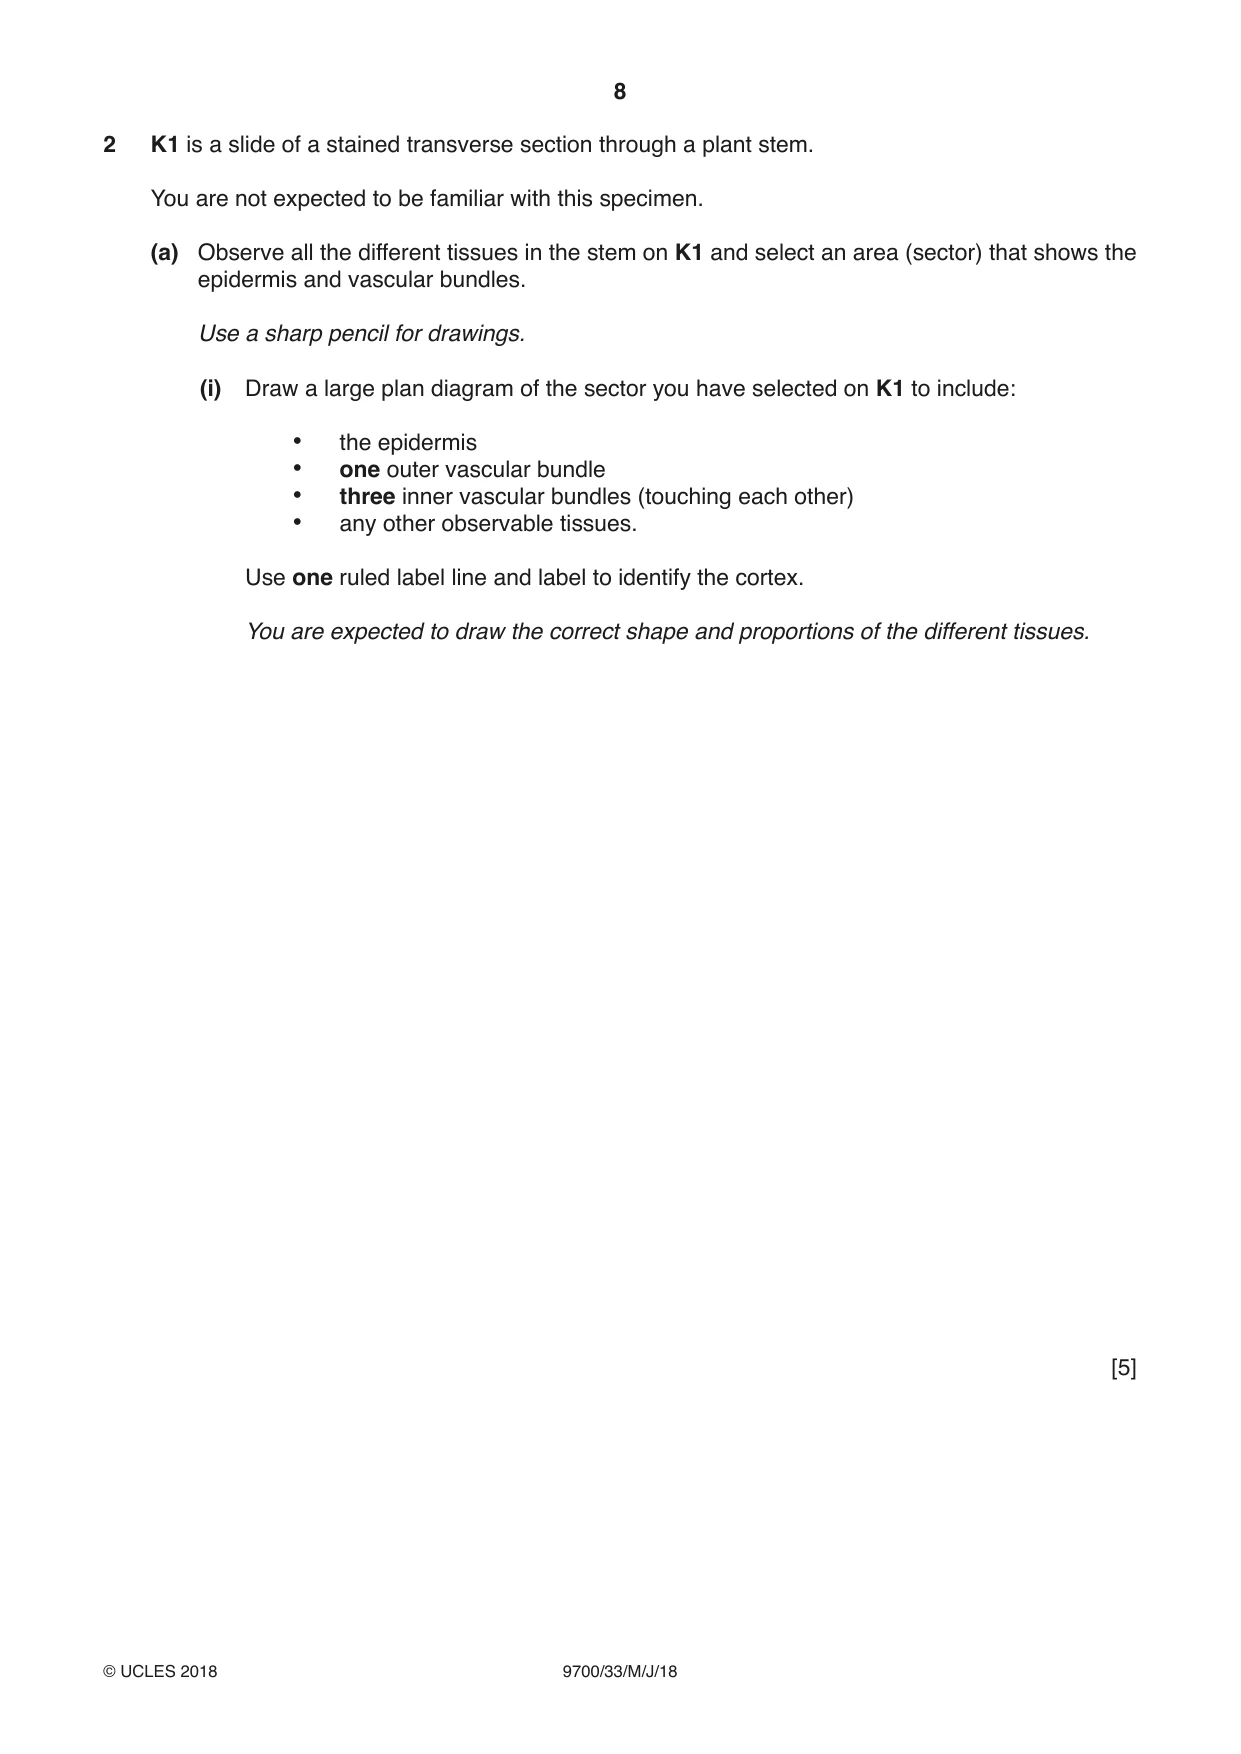
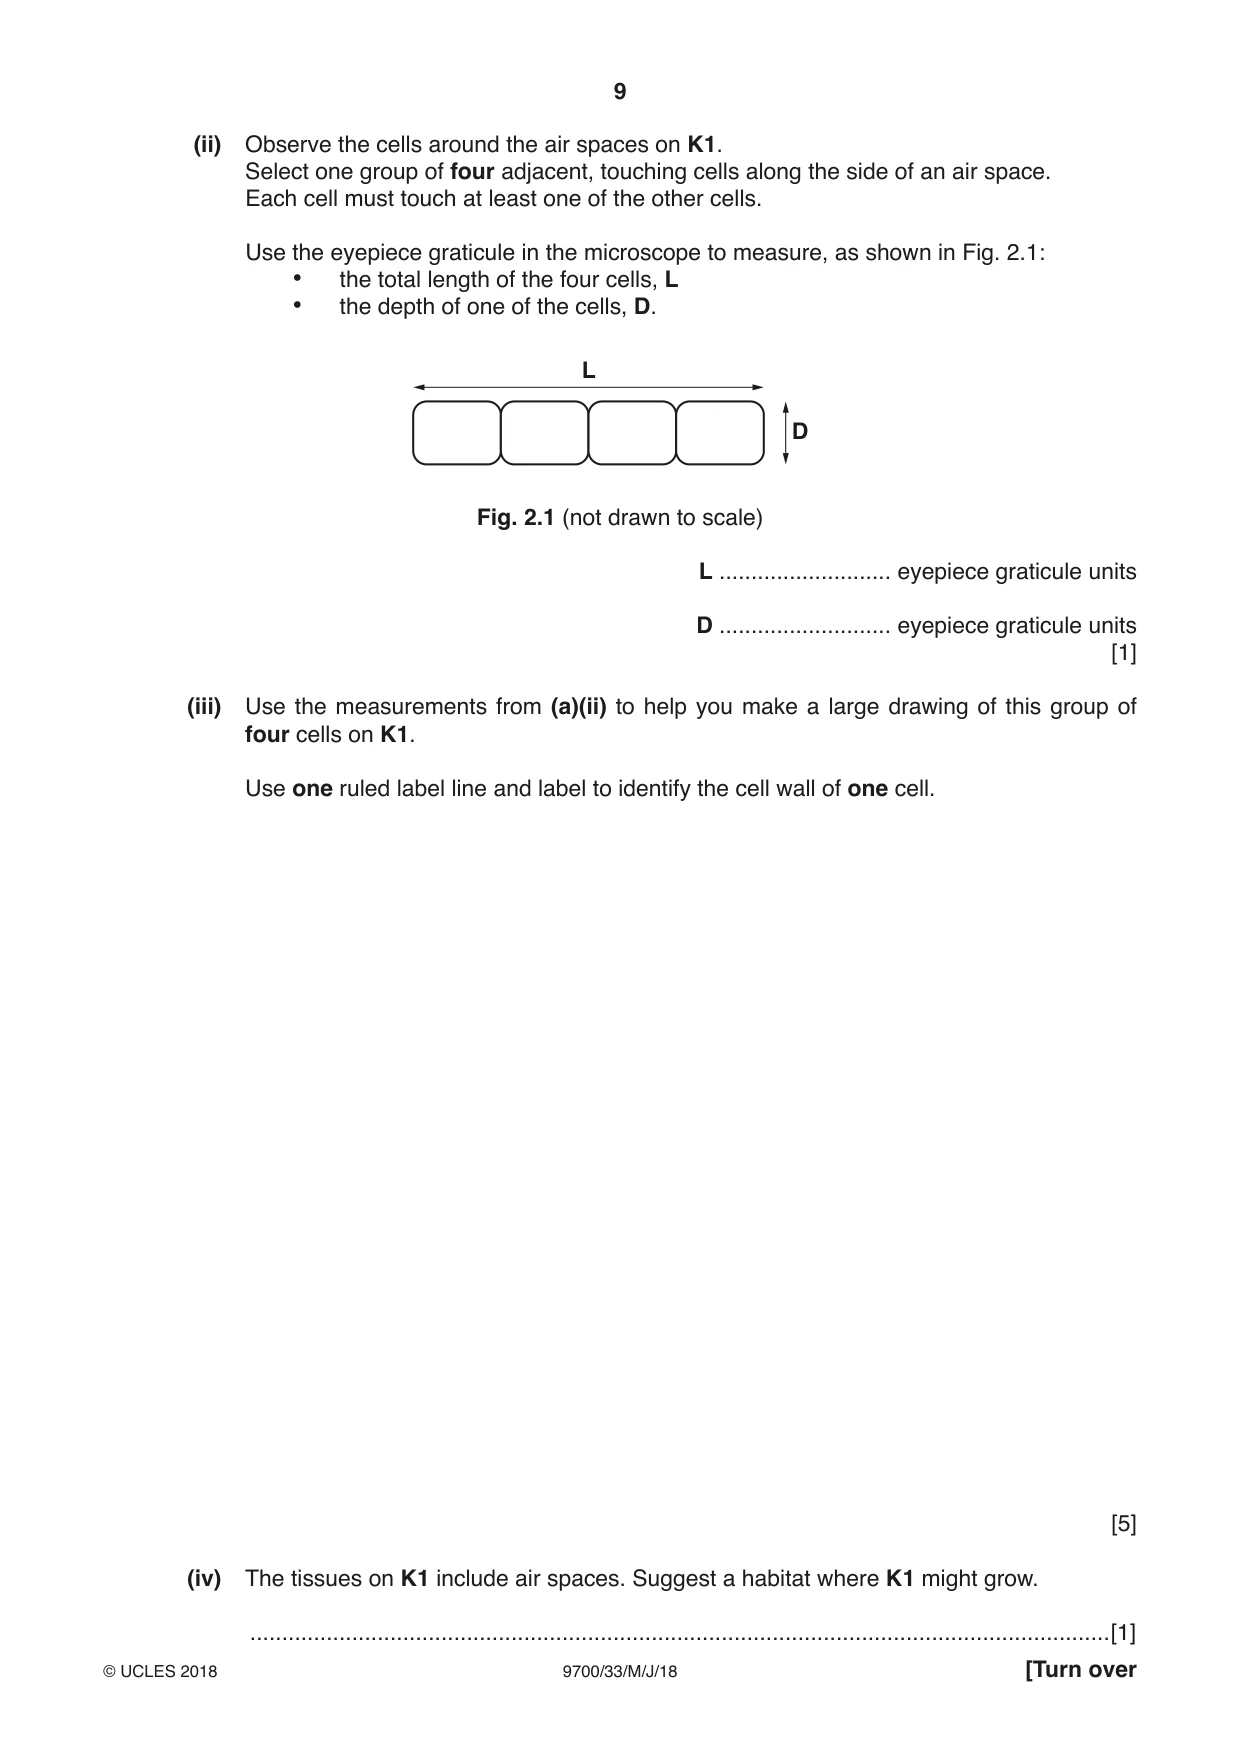
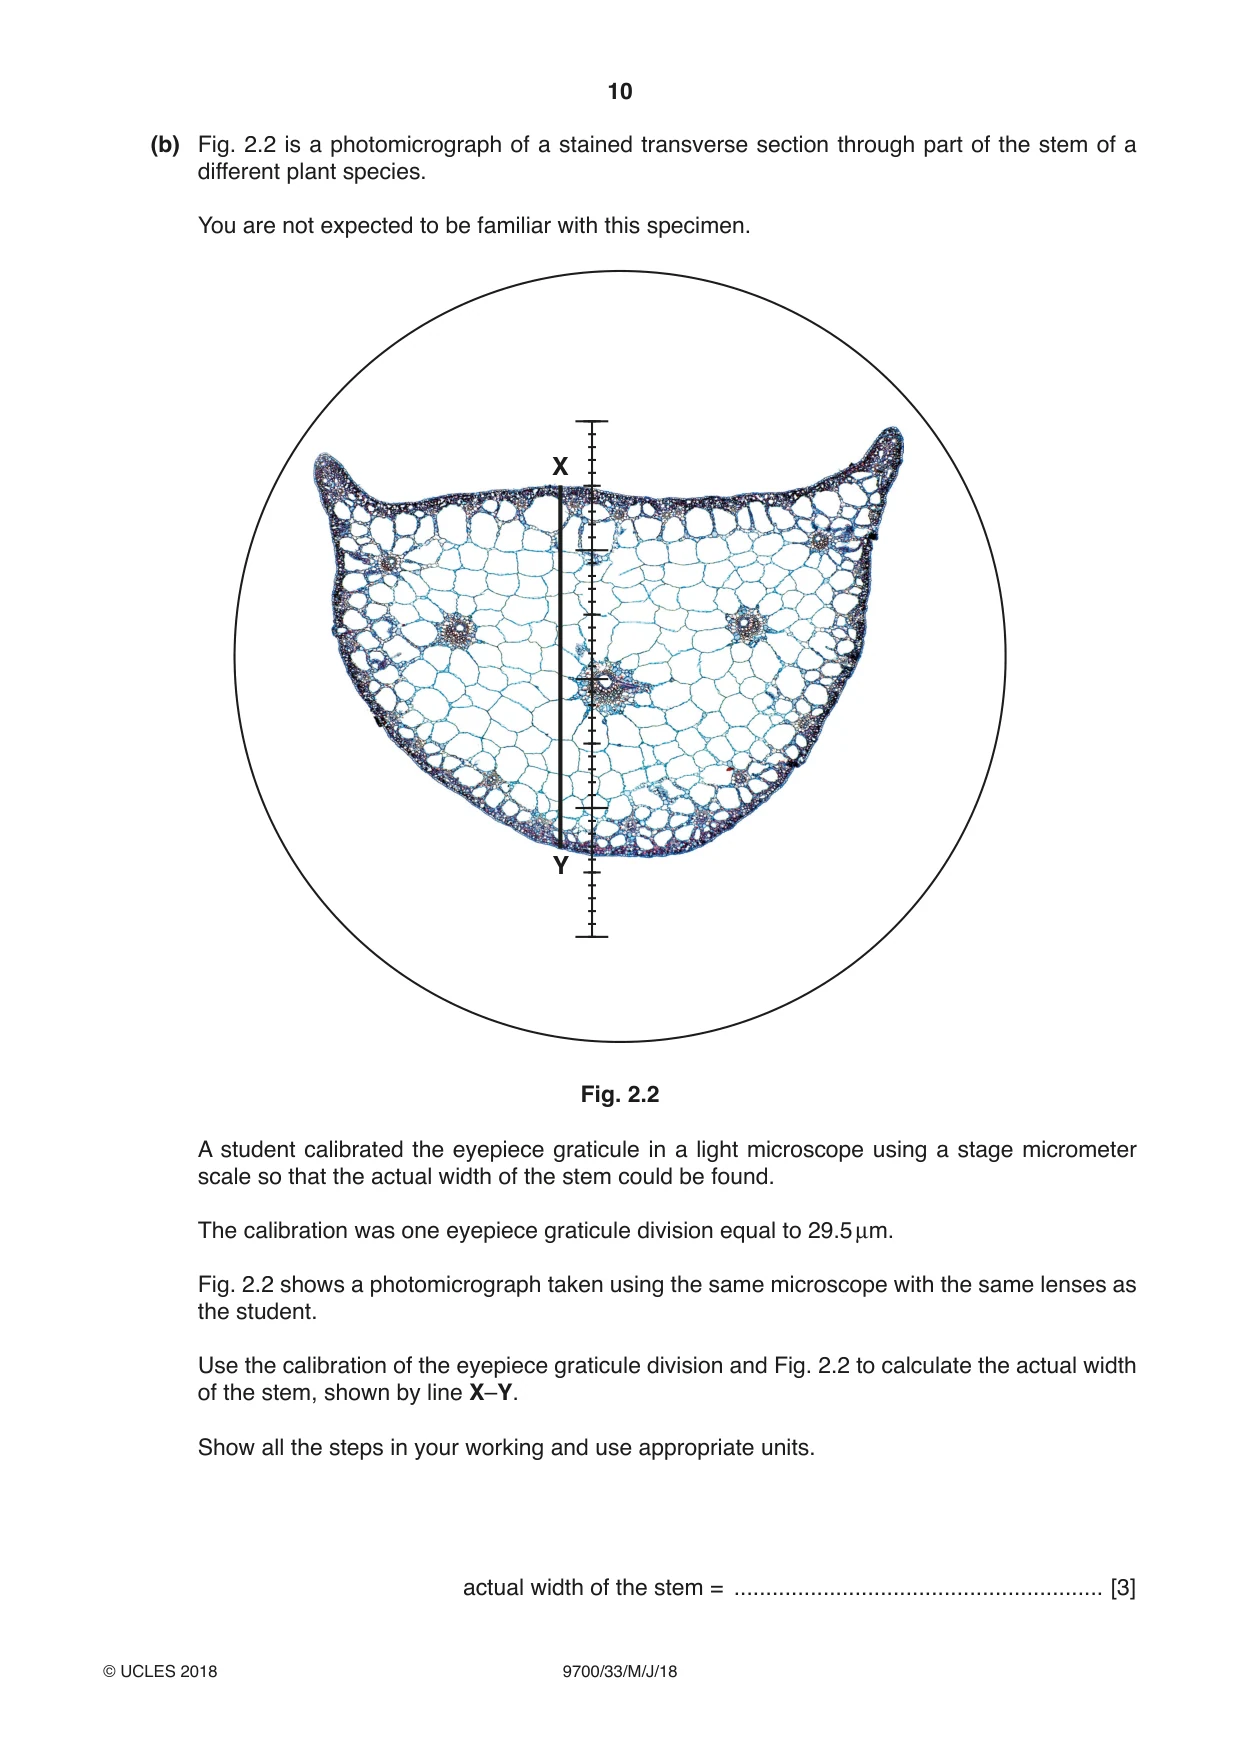
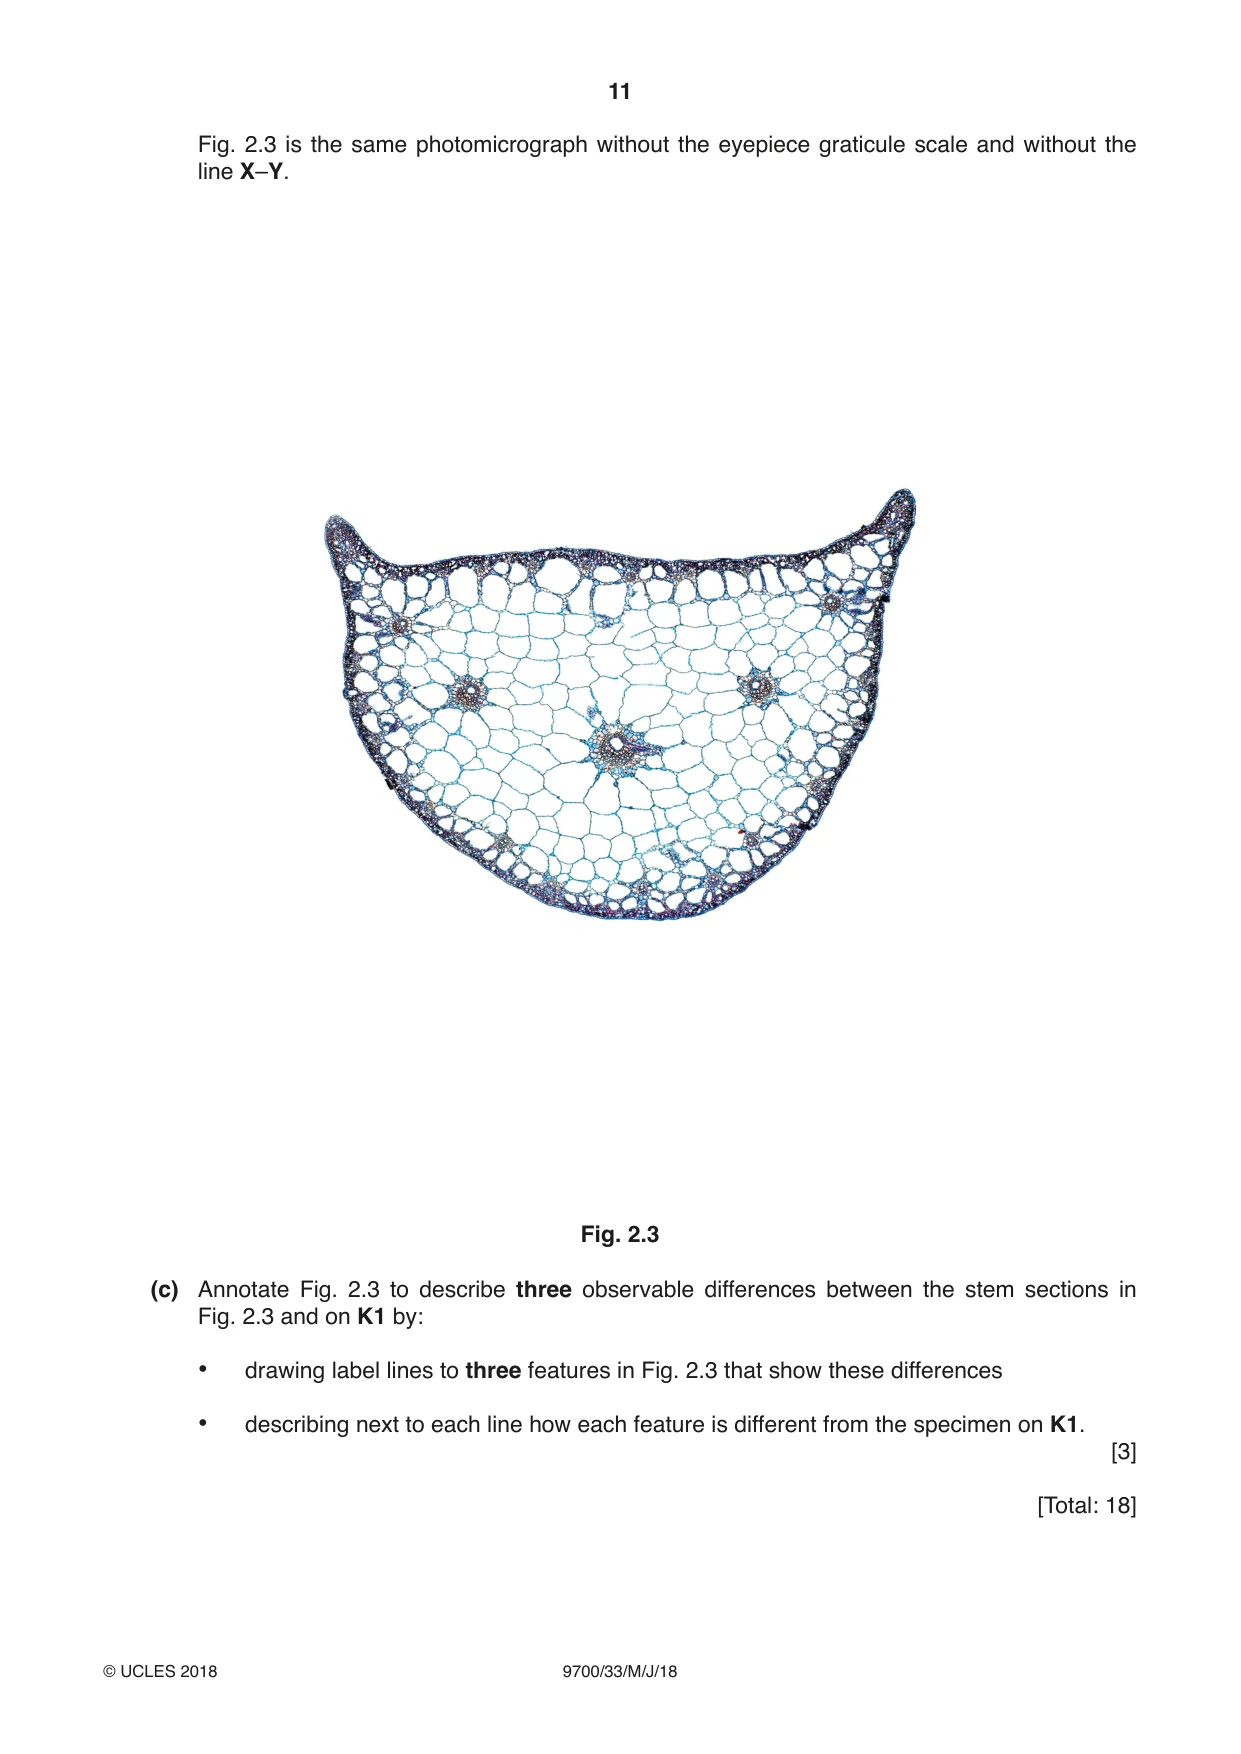
2 K1 is a slide of a stained transverse section through a plant stem. You are not expected to be familiar with this specimen. (a) Observe all the different tissues in the stem on K1 and select an area (sector) that shows the epidermis and vascular bundles. Use a sharp pencil for drawings. (i) Draw a large plan diagram of the sector you have selected on K1 to include: • the epidermis • one outer vascular bundle • three inner vascular bundles (touching each other) • any other observable tissues. Use one ruled label line and label to identify the cortex. You are expected to draw the correct shape and proportions of the different tissues. [5] (ii) Observe the cells around the air spaces on K1. Select one group of four adjacent, touching cells along the side of an air space. Each cell must touch at least one of the other cells. Use the eyepiece graticule in the microscope to measure, as shown in Fig. 2.1: • the total length of the four cells, L • the depth of one of the cells, D. L D Fig. 2.1 (not drawn to scale) L ........................... eyepiece graticule units D ........................... eyepiece graticule units [1] (iii) Use the measurements from (a)(ii) to help you make a large drawing of this group of four cells on K1. Use one ruled label line and label to identify the cell wall of one cell. [5] (iv) The tissues on K1 include air spaces. Suggest a habitat where K1 might grow. .......................................................................................................................................[1] (b) Fig. 2.2 is a photomicrograph of a stained transverse section through part of the stem of a different plant species. You are not expected to be familiar with this specimen. X Y Fig. 2.2 A student calibrated the eyepiece graticule in a light microscope using a stage micrometer scale so that the actual width of the stem could be found. The calibration was one eyepiece graticule division equal to 29.5 µm. Fig. 2.2 shows a photomicrograph taken using the same microscope with the same lenses as the student. Use the calibration of the eyepiece graticule division and Fig. 2.2 to calculate the actual width of the stem, shown by line X–Y. Show all the steps in your working and use appropriate units. actual width of the stem = .......................................................... [3]
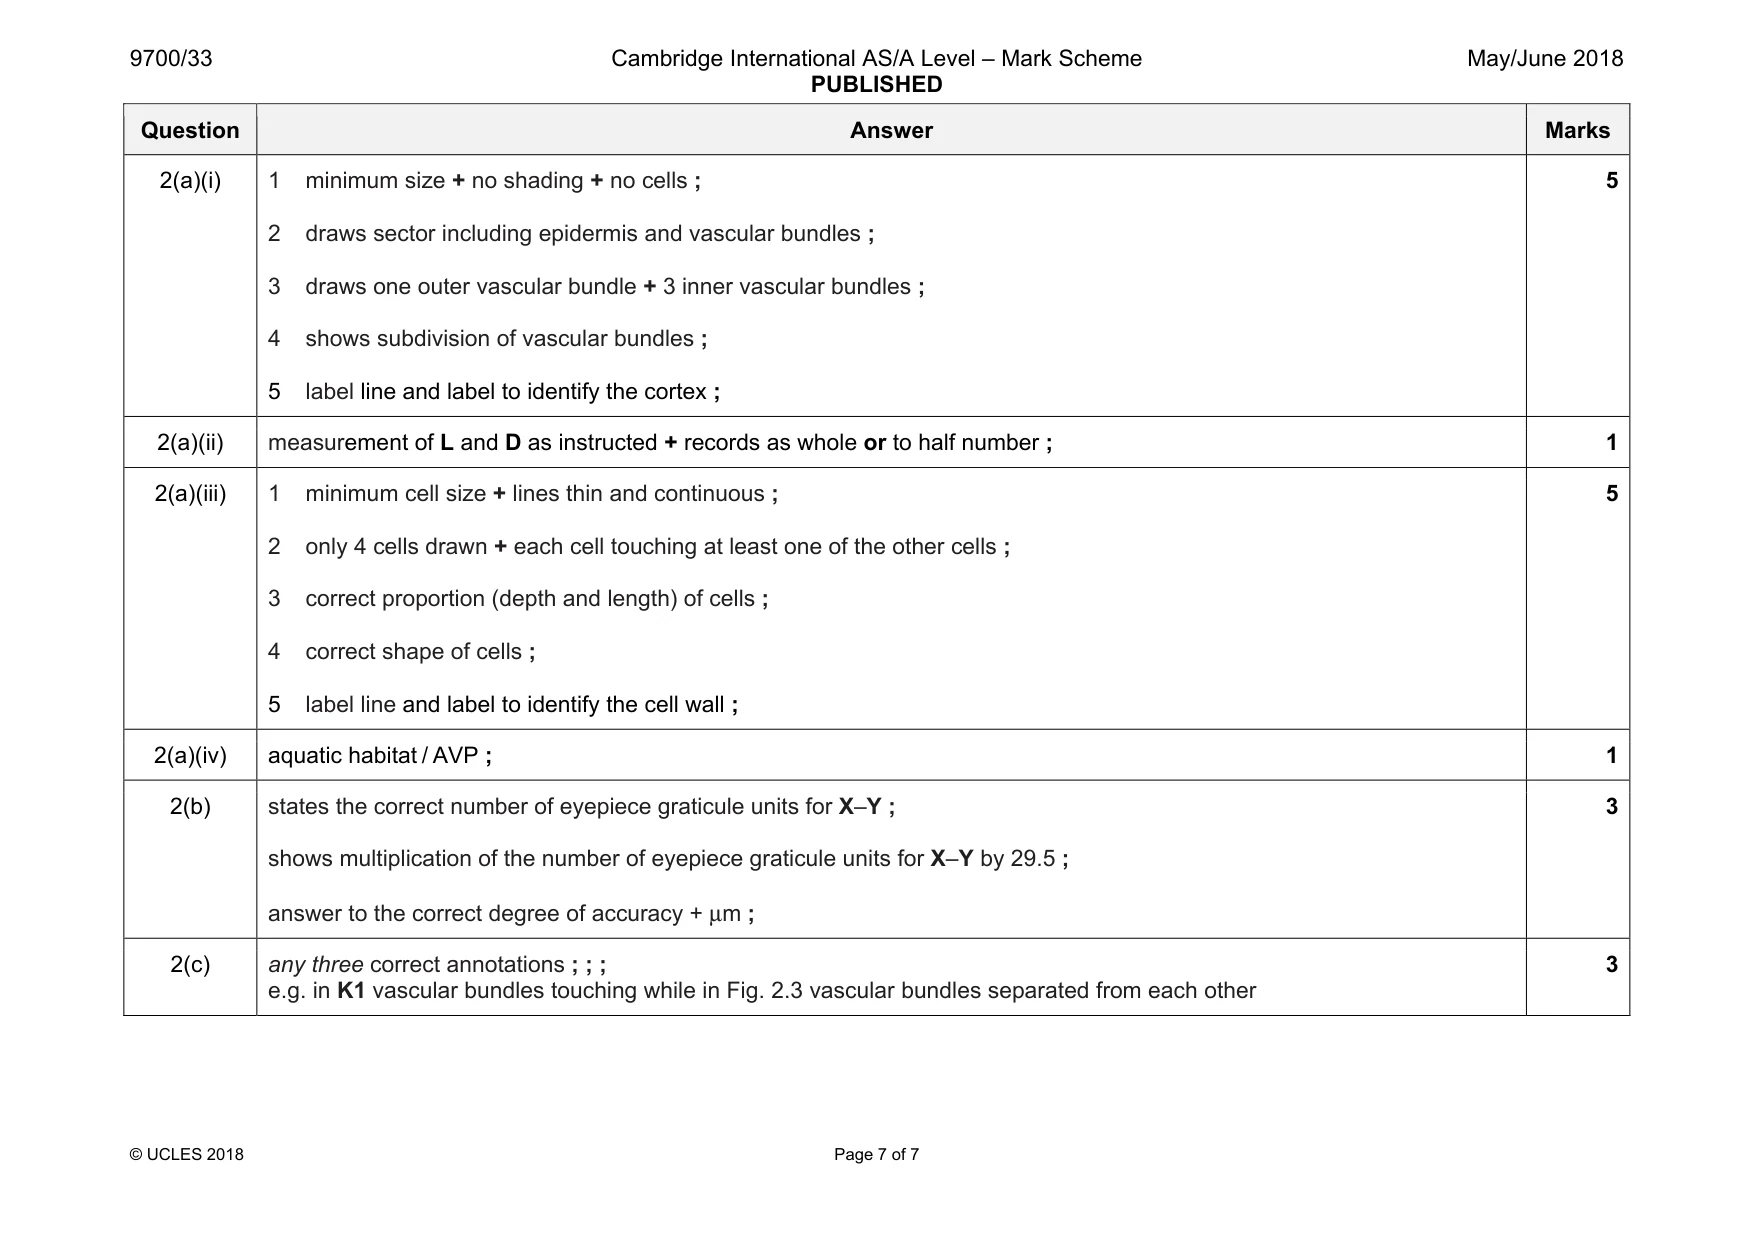
Mark scheme: 2(a)(i) 1 minimum size + no shading + no cells ; 2 draws sector including epidermis and vascular bundles ; 3 draws one outer vascular bundle + 3 inner vascular bundles ; 4 shows subdivision of vascular bundles ; 5 label line and label to identify the cortex ; 5 2(a)(ii) measurement of L and D as instructed + records as whole or to half number ; 1 2(a)(iii) 1 minimum cell size + lines thin and continuous ; 2 only 4 cells drawn + each cell touching at least one of the other cells ; 3 correct proportion (depth and length) of cells ; 4 correct shape of cells ; 5 label line and label to identify the cell wall ; 5 2(a)(iv) aquatic habitat / AVP ; 1 2(b) states the correct number of eyepiece graticule units for X–Y ; shows multiplication of the number of eyepiece graticule units for X–Y by 29.5 ; answer to the correct degree of accuracy + µm ; 3 2(c) any three correct annotations ; ; ; e.g. in K1 vascular bundles touching while in Fig. 2.3 vascular bundles separated from each other 3
What was in this paper
The subtopics covered by these 2 questions, and how many questions each got. Open one in a new tab to see every Cambridge question on it.
What you needed in this session
Cambridge’s own grade thresholds for 2018 May/June, Paper 3 · Variant 3. A higher threshold means an easier paper — the bar moves with how the cohort did.