Cambridge A Level Biology 9700 — 2017 Oct/Nov Paper 3 · Variant 6
9700/36/O/N/17 · 2 questions · 40 marks · ≈45 min
The question paper and its mark scheme, free to read here and free to download. This is Cambridge’s own paper, exactly as it was sat.
Question paper16 pages
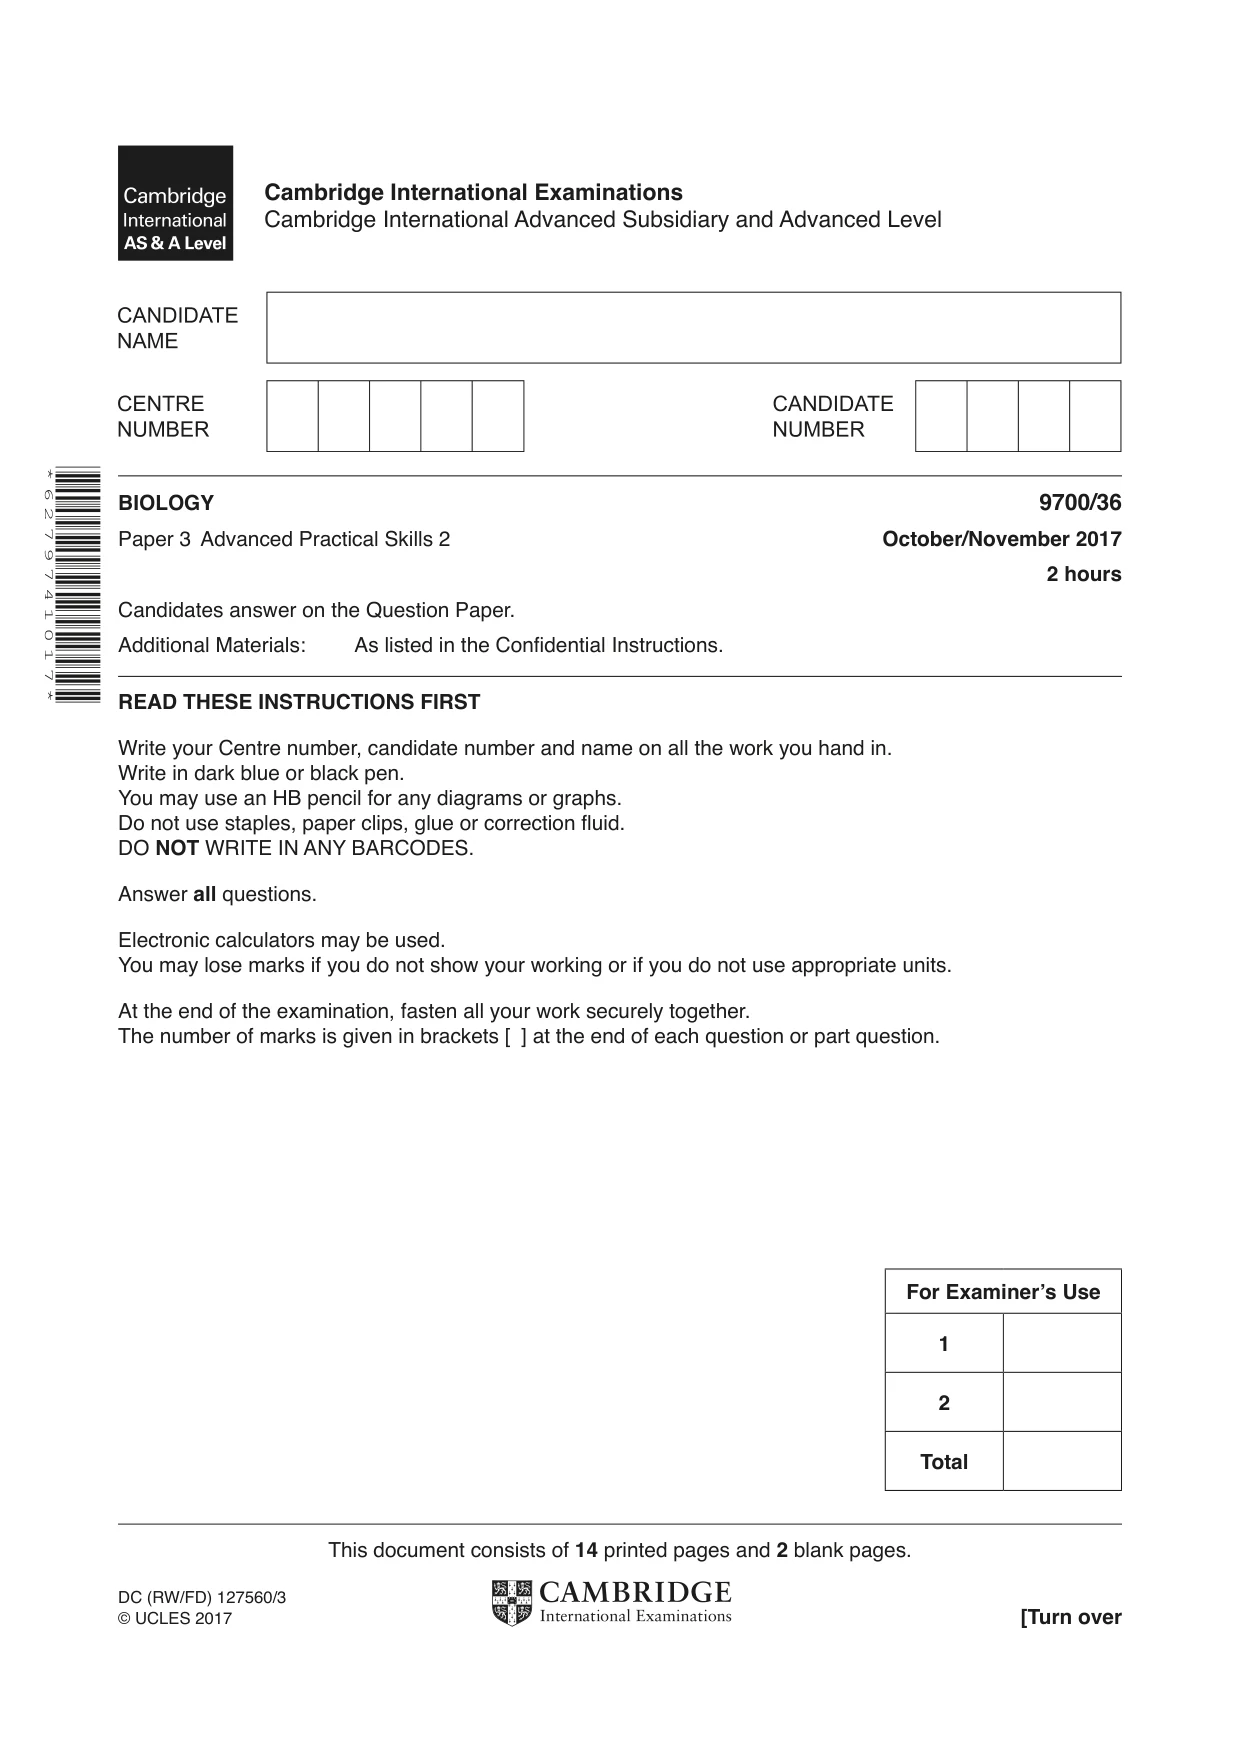


Mark scheme4 pages
Answers below. Sit the paper first if you are practising.
Questions as text
Q1 · You are provided with a solution, labelled E, containing an enzyme which coagulates…
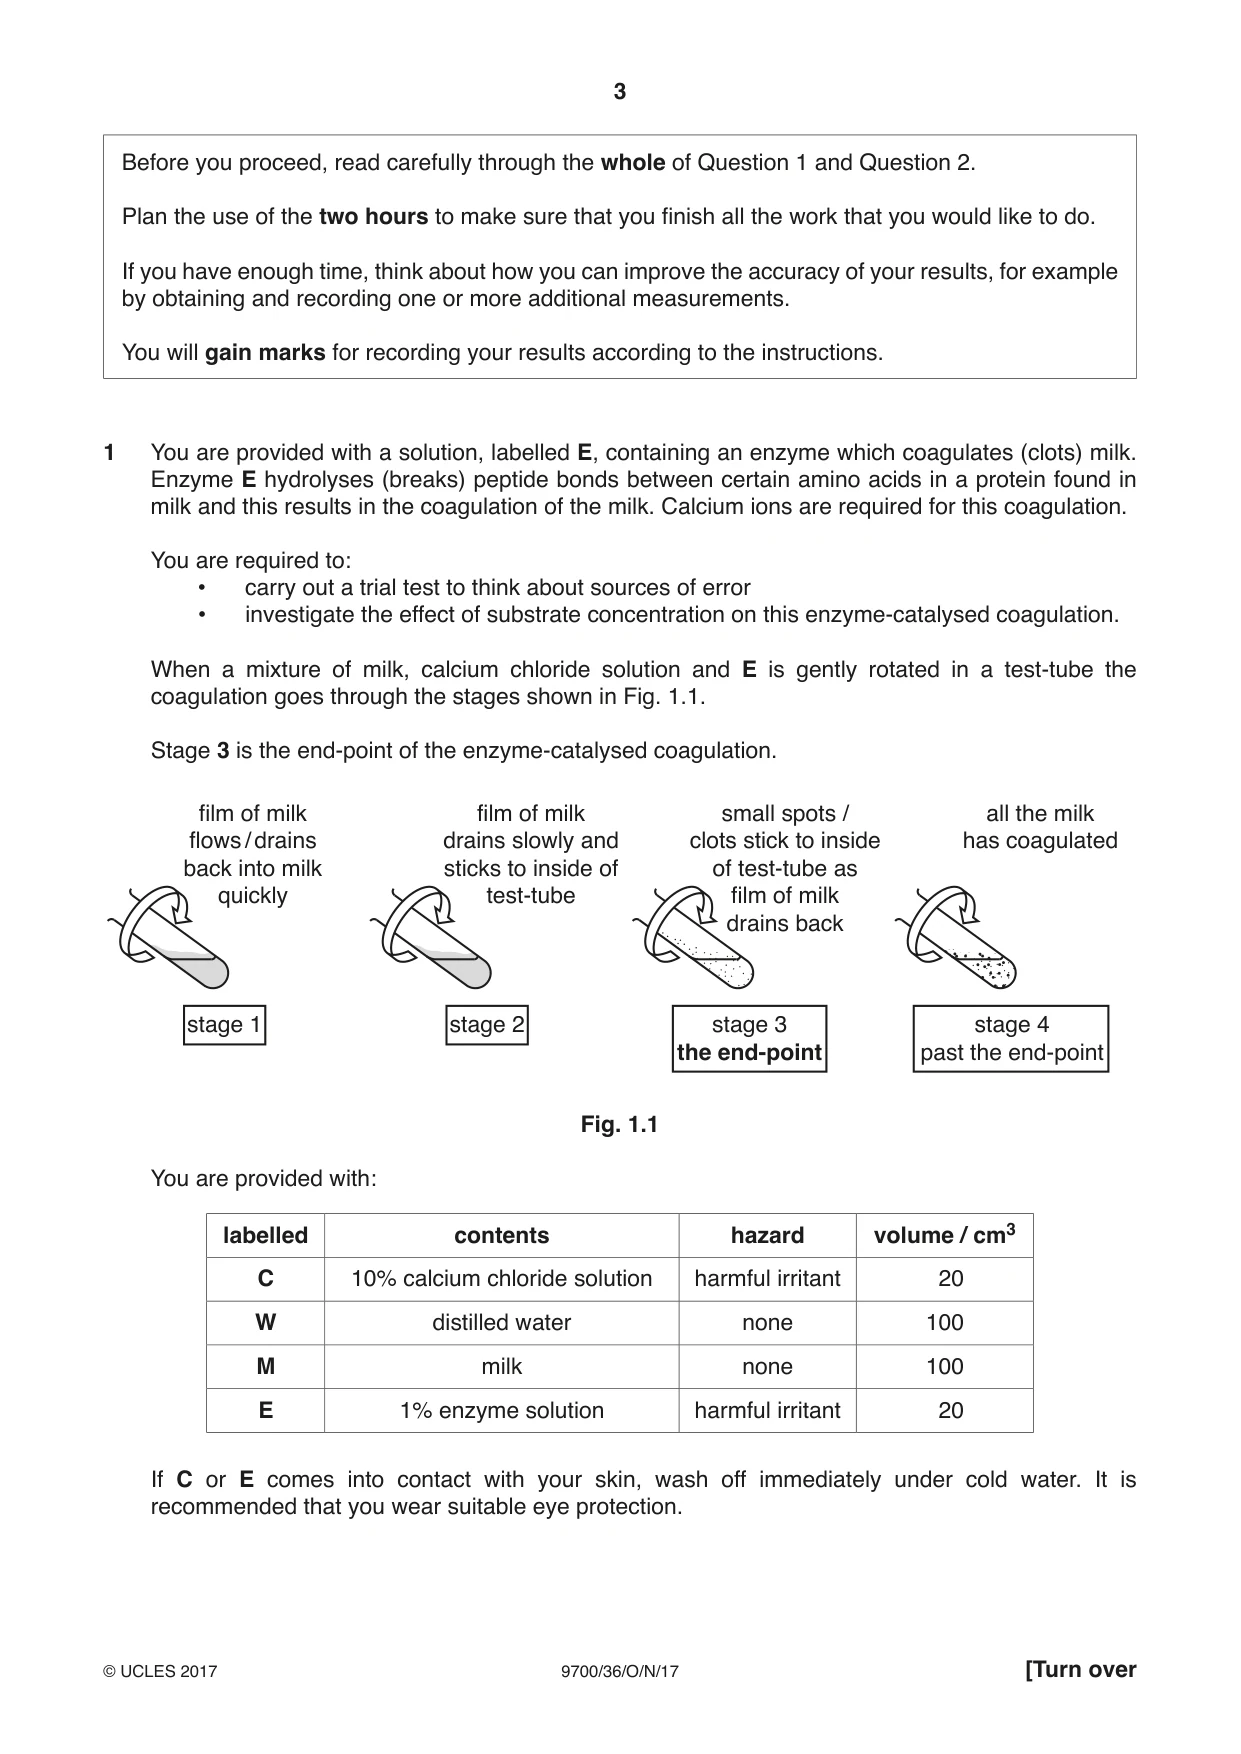
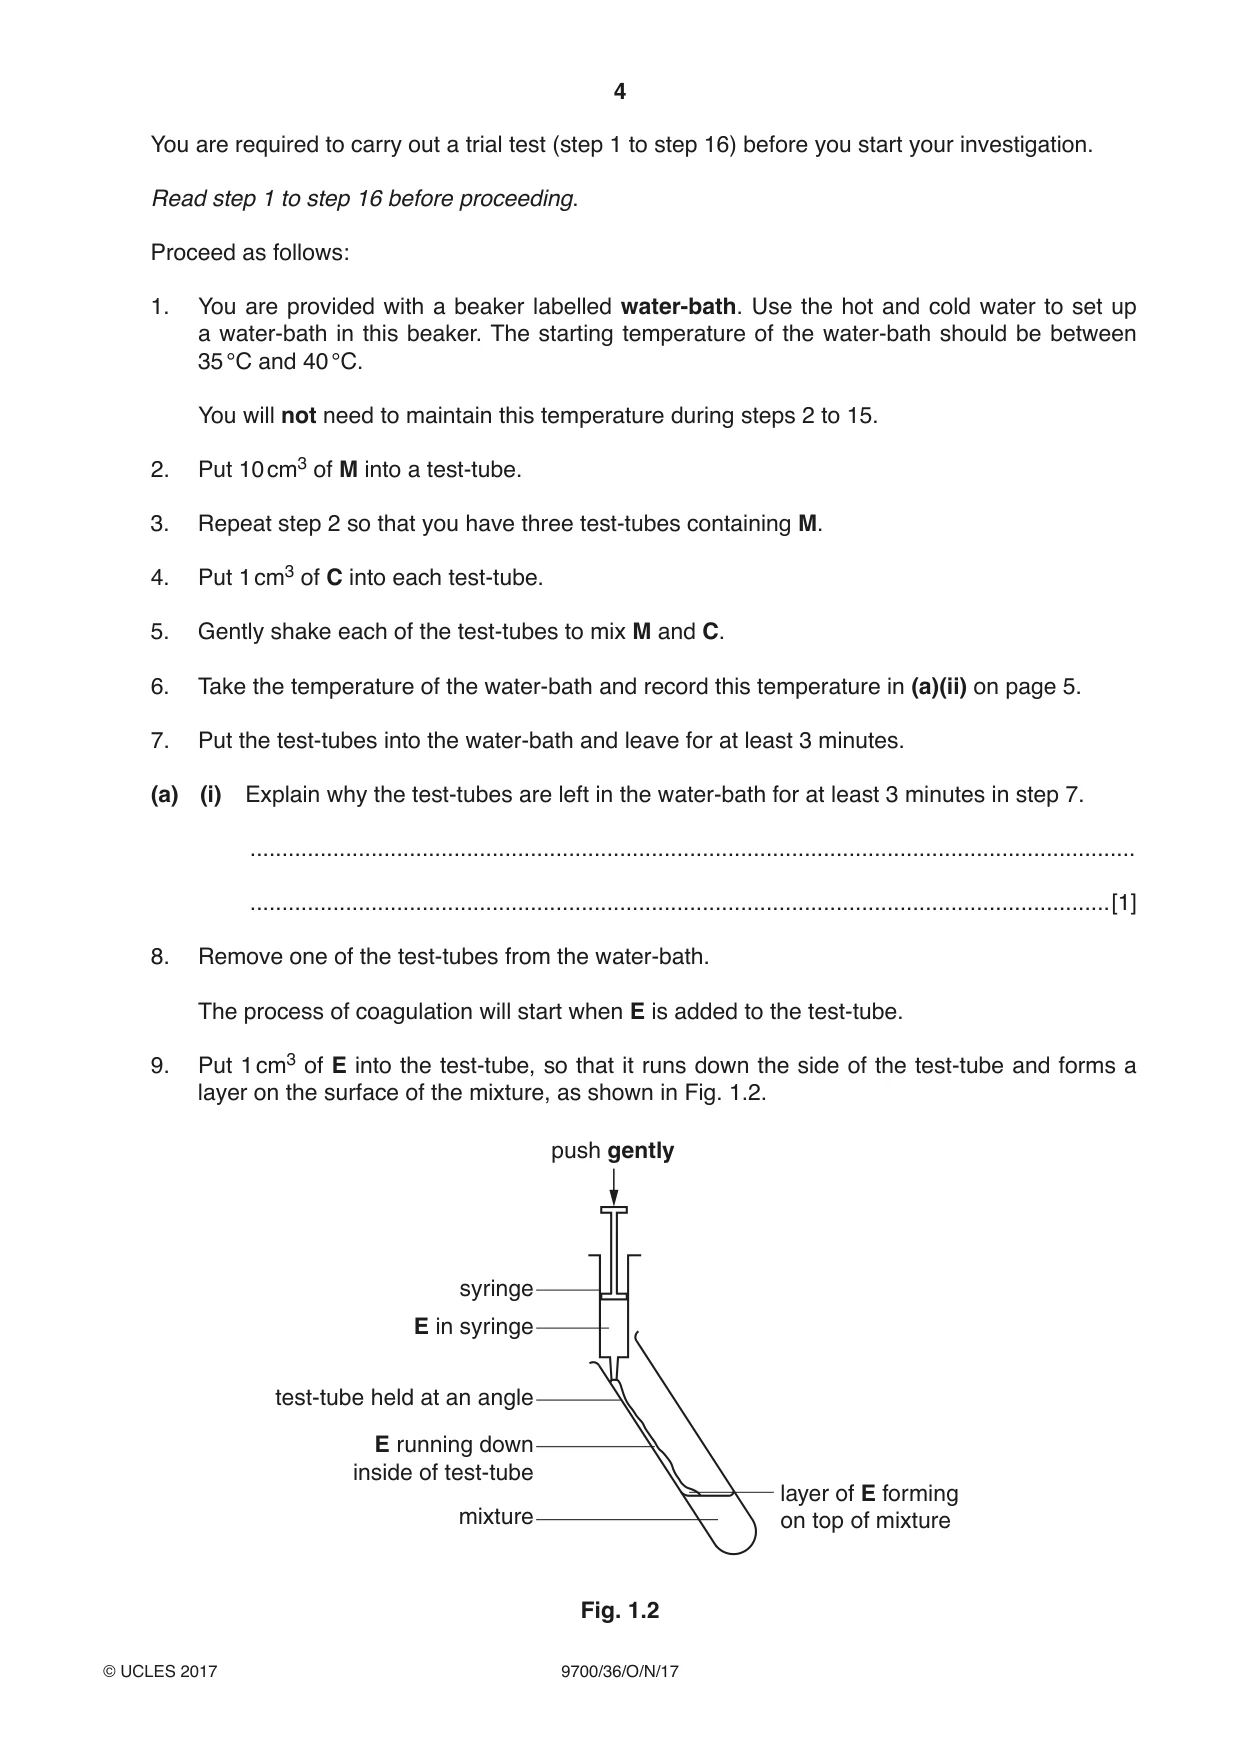
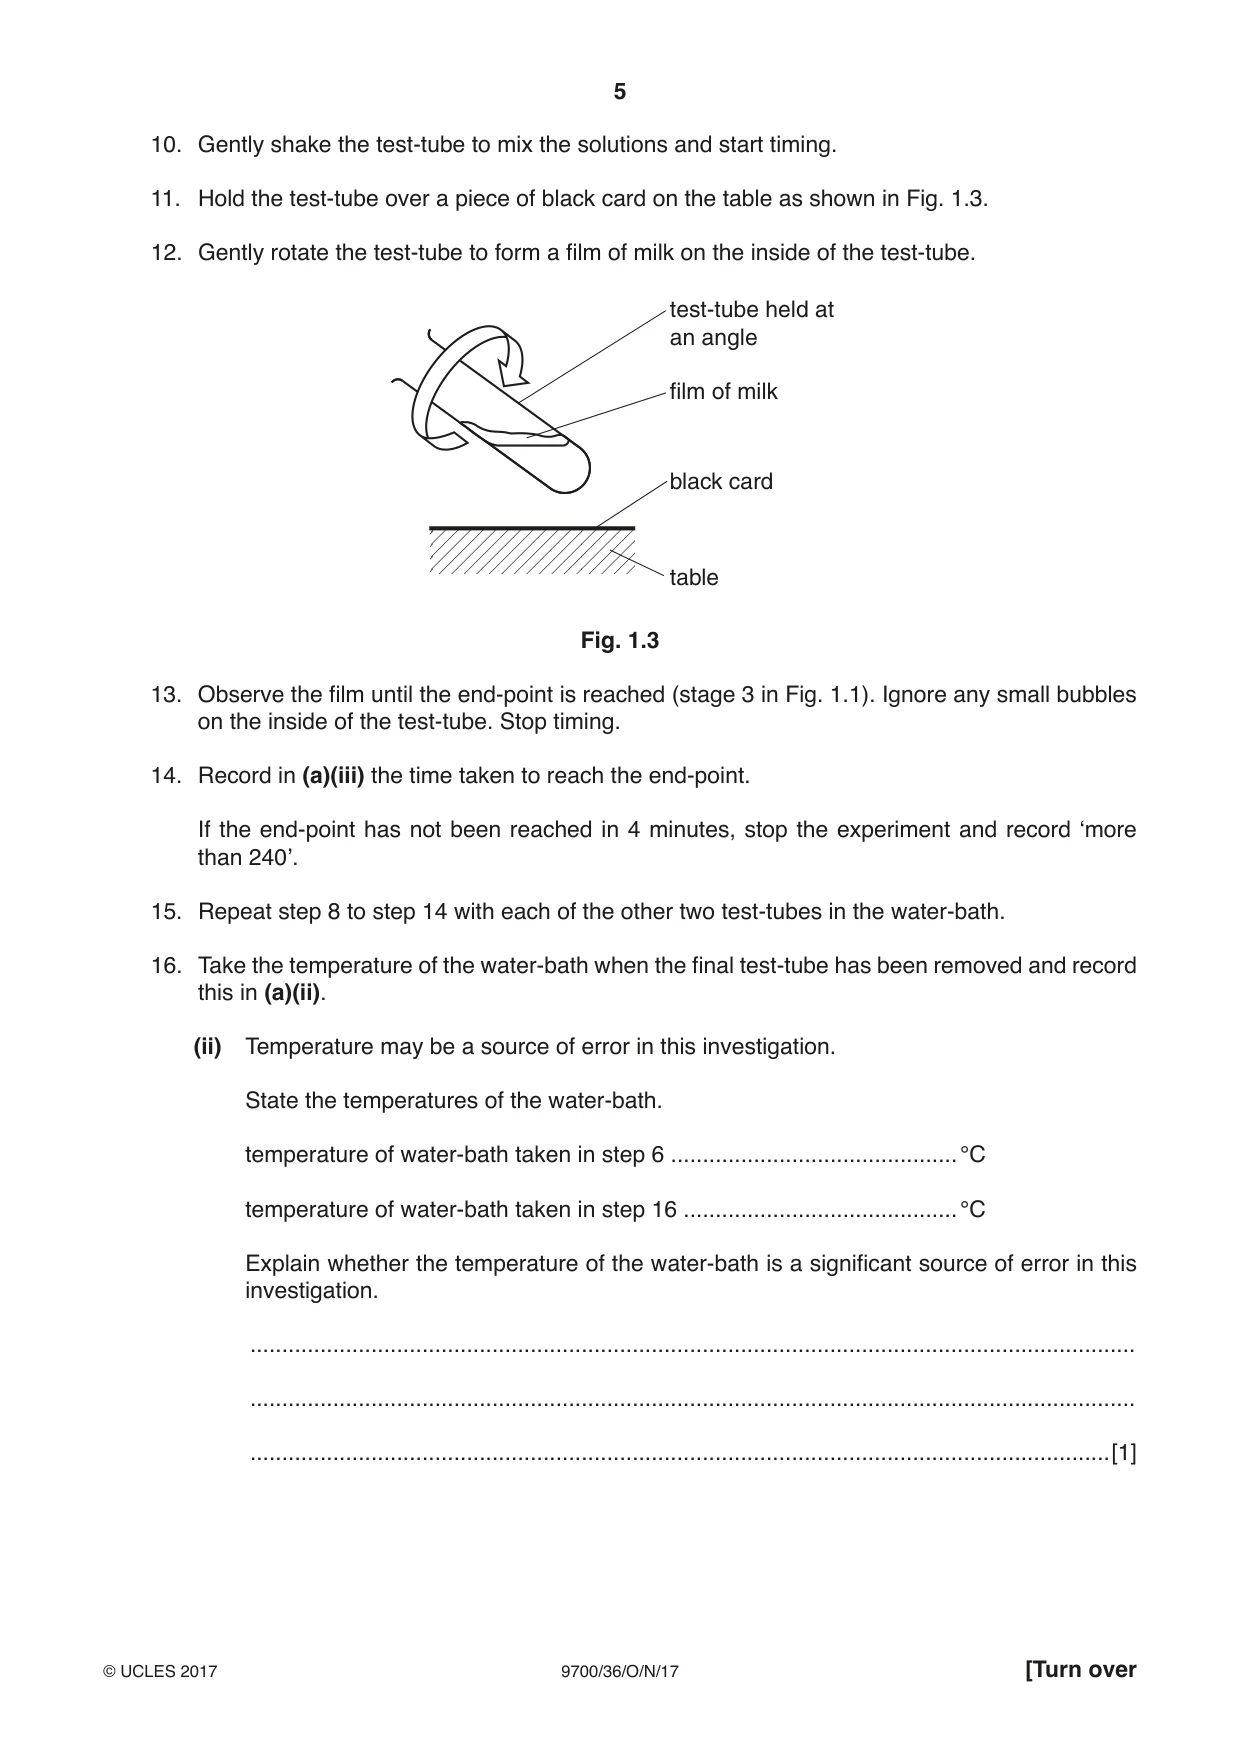
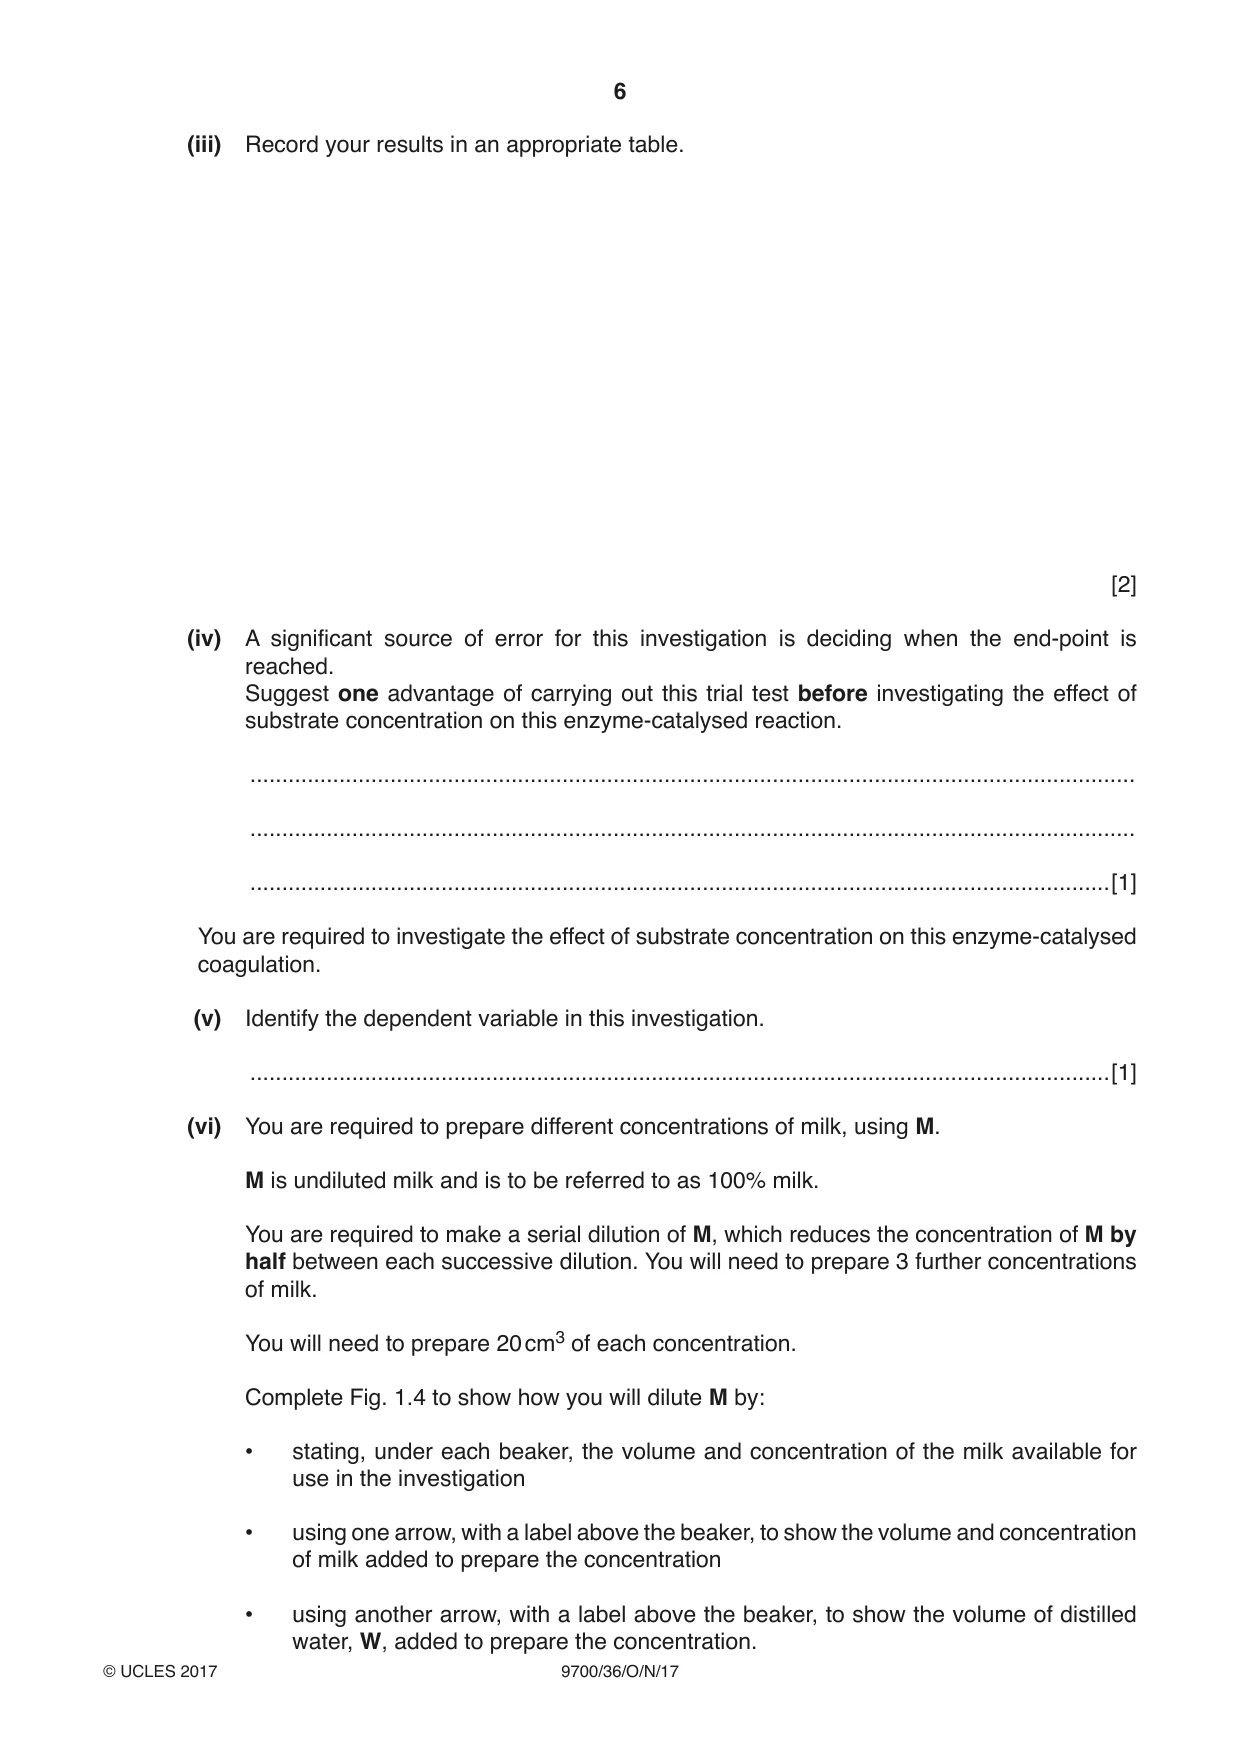
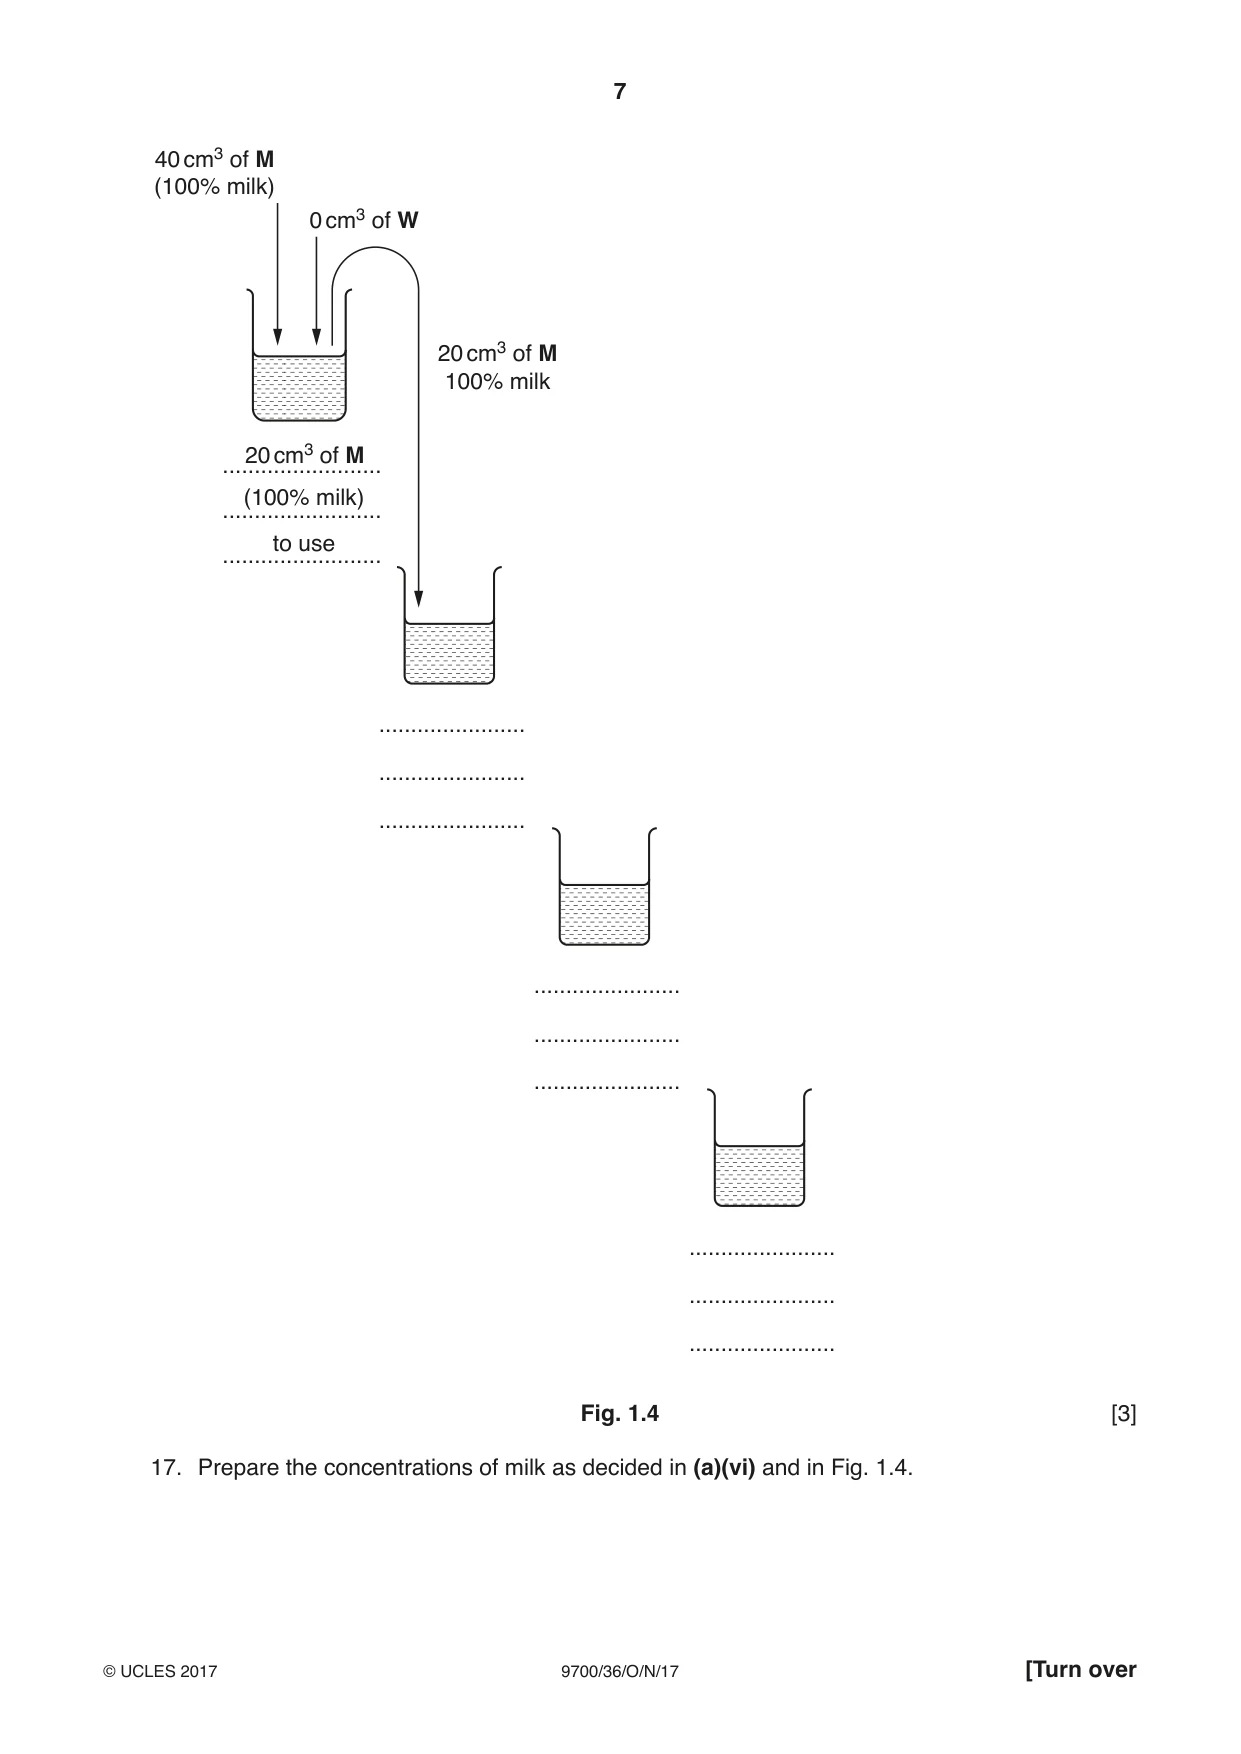
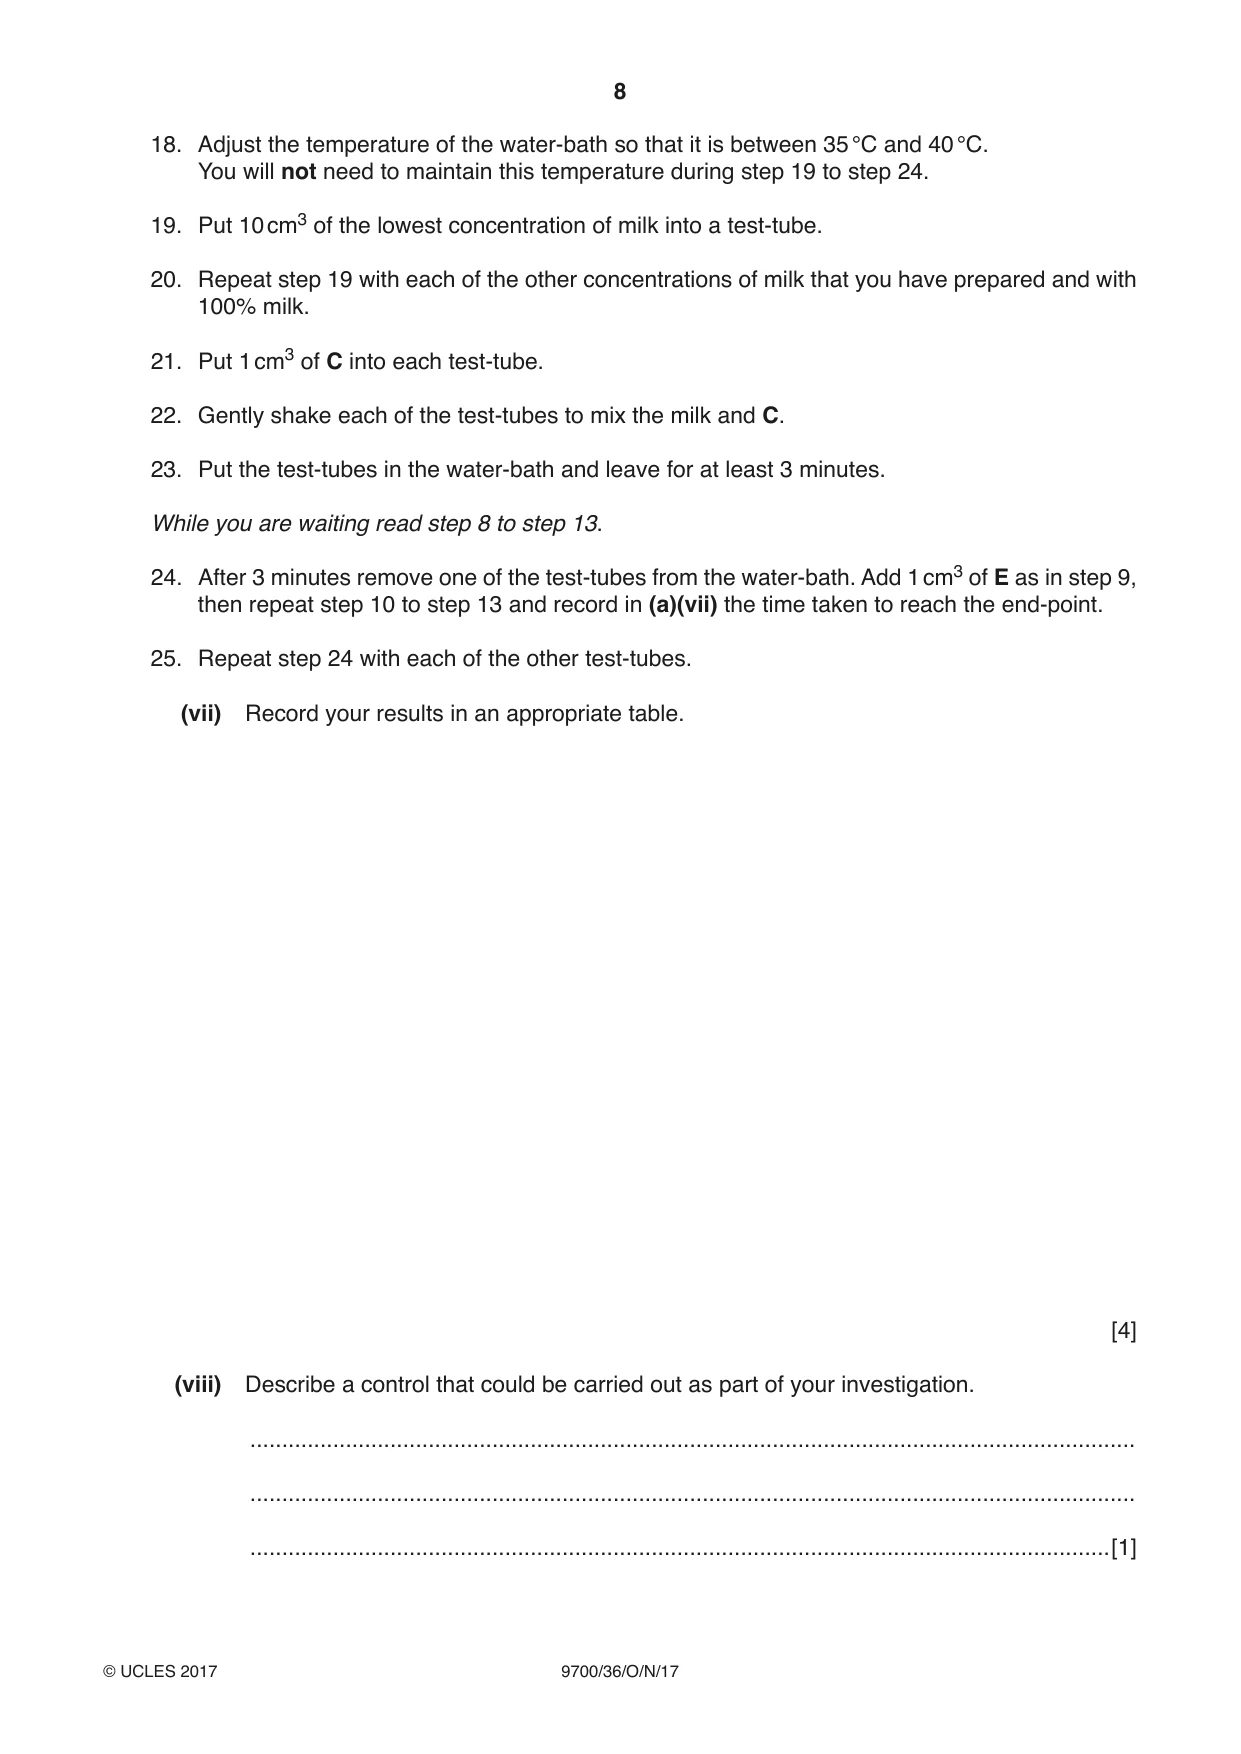
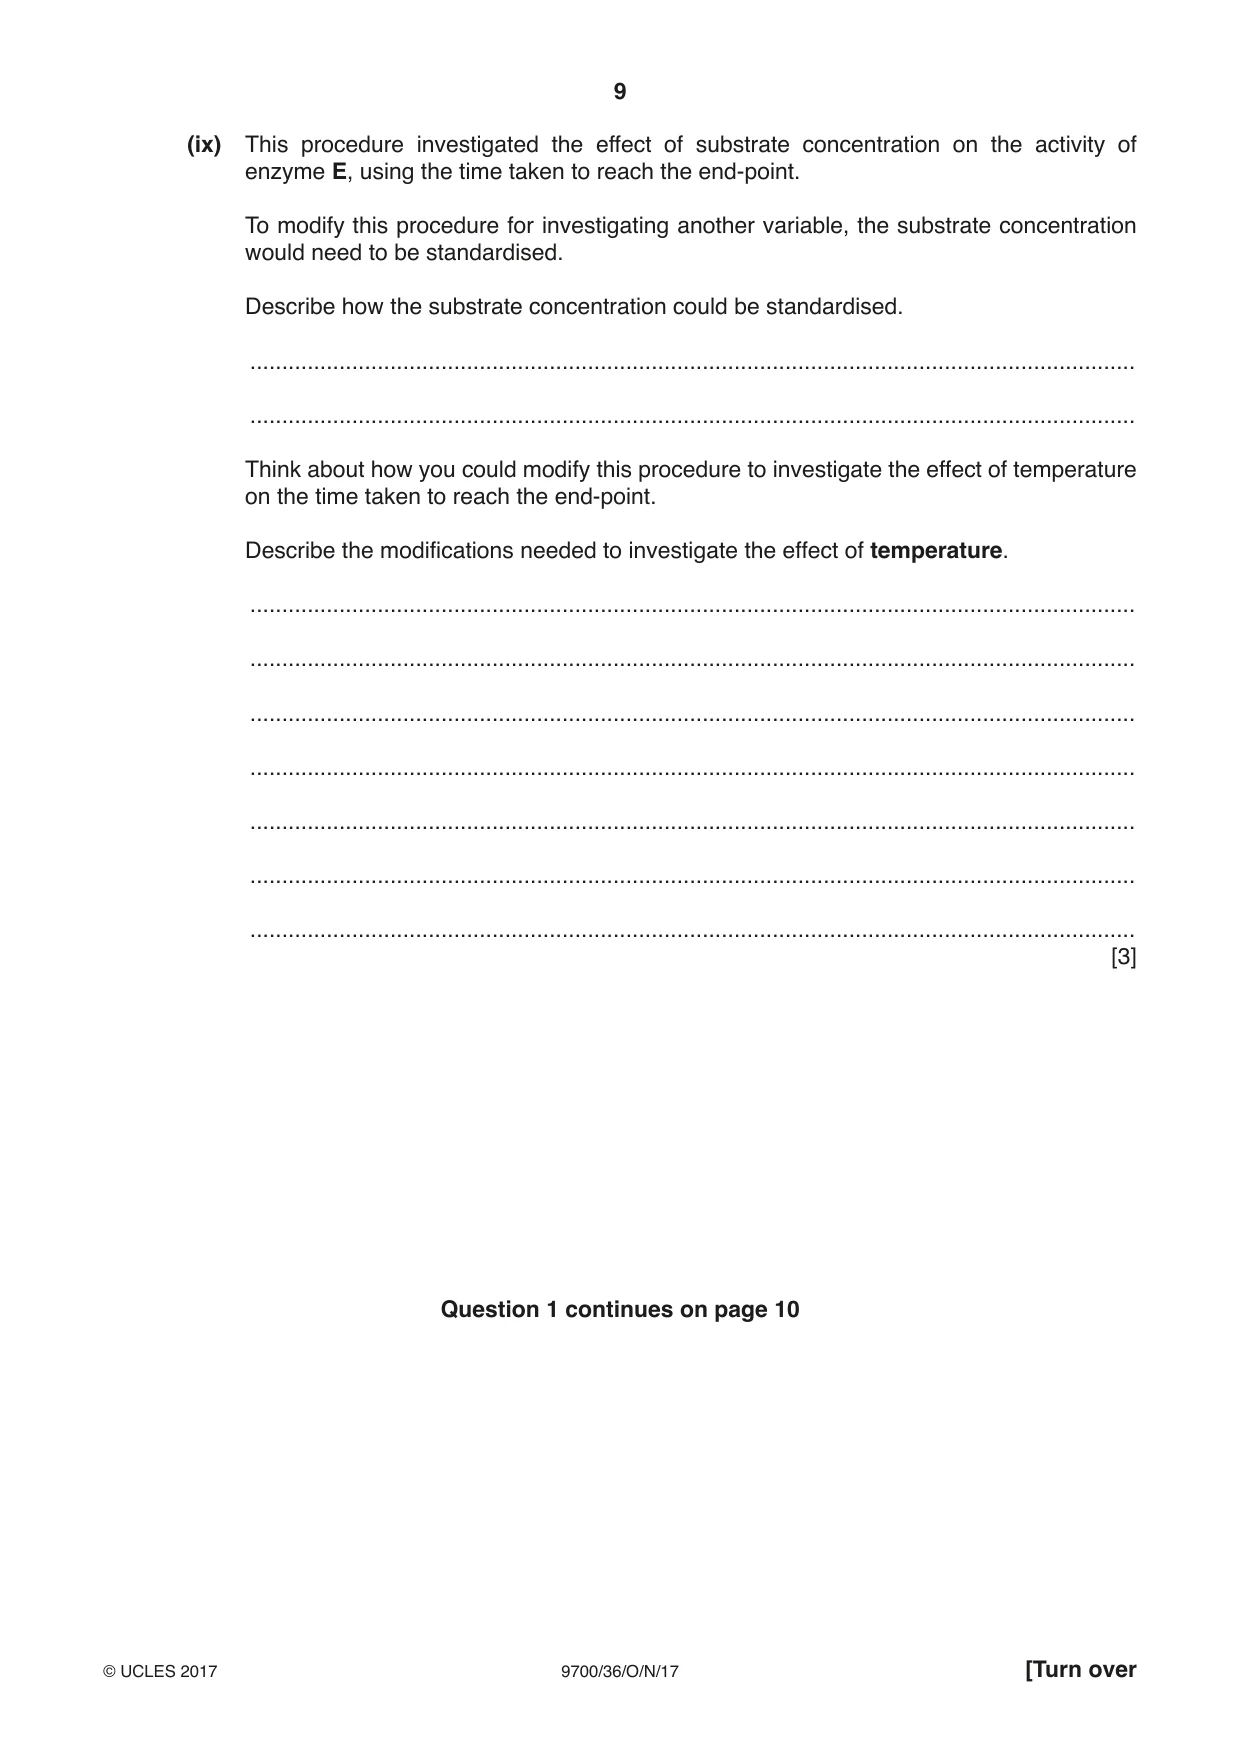
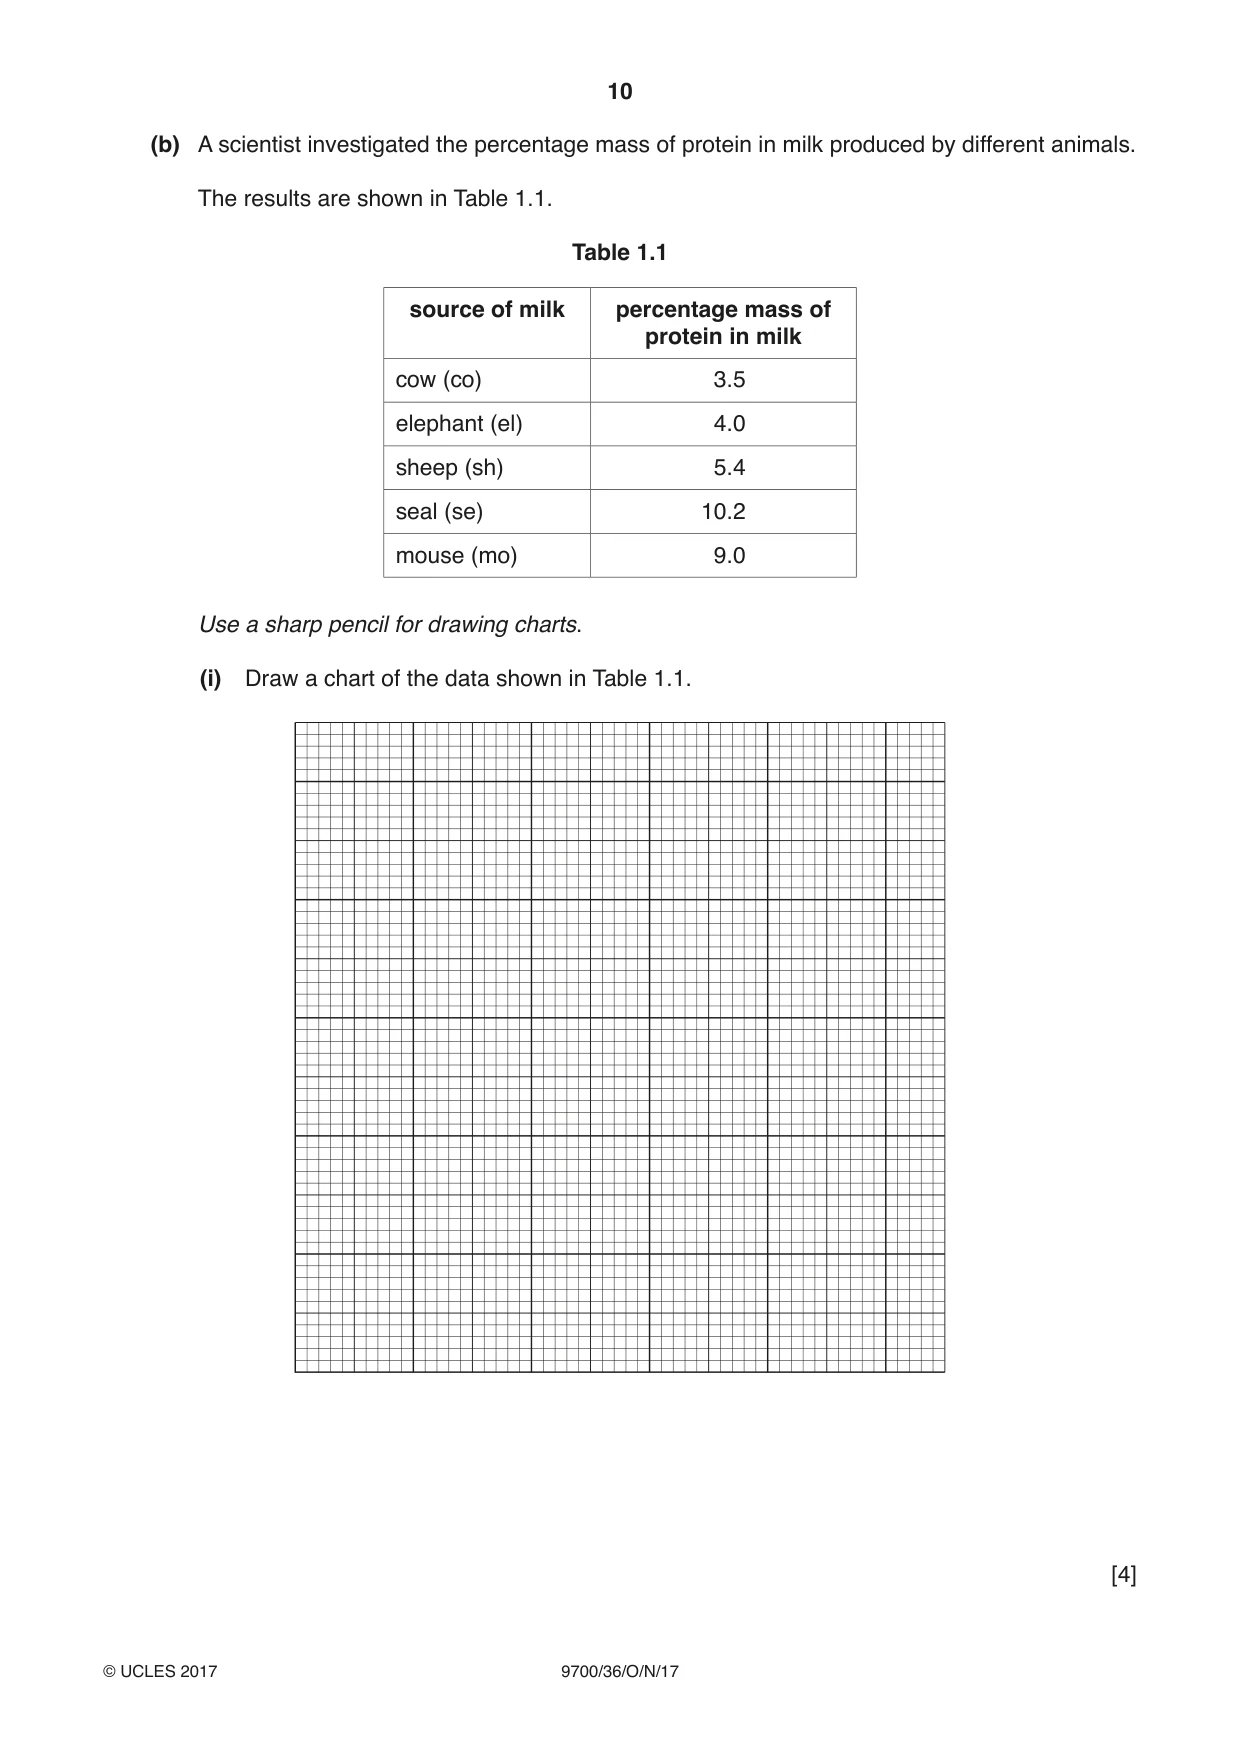
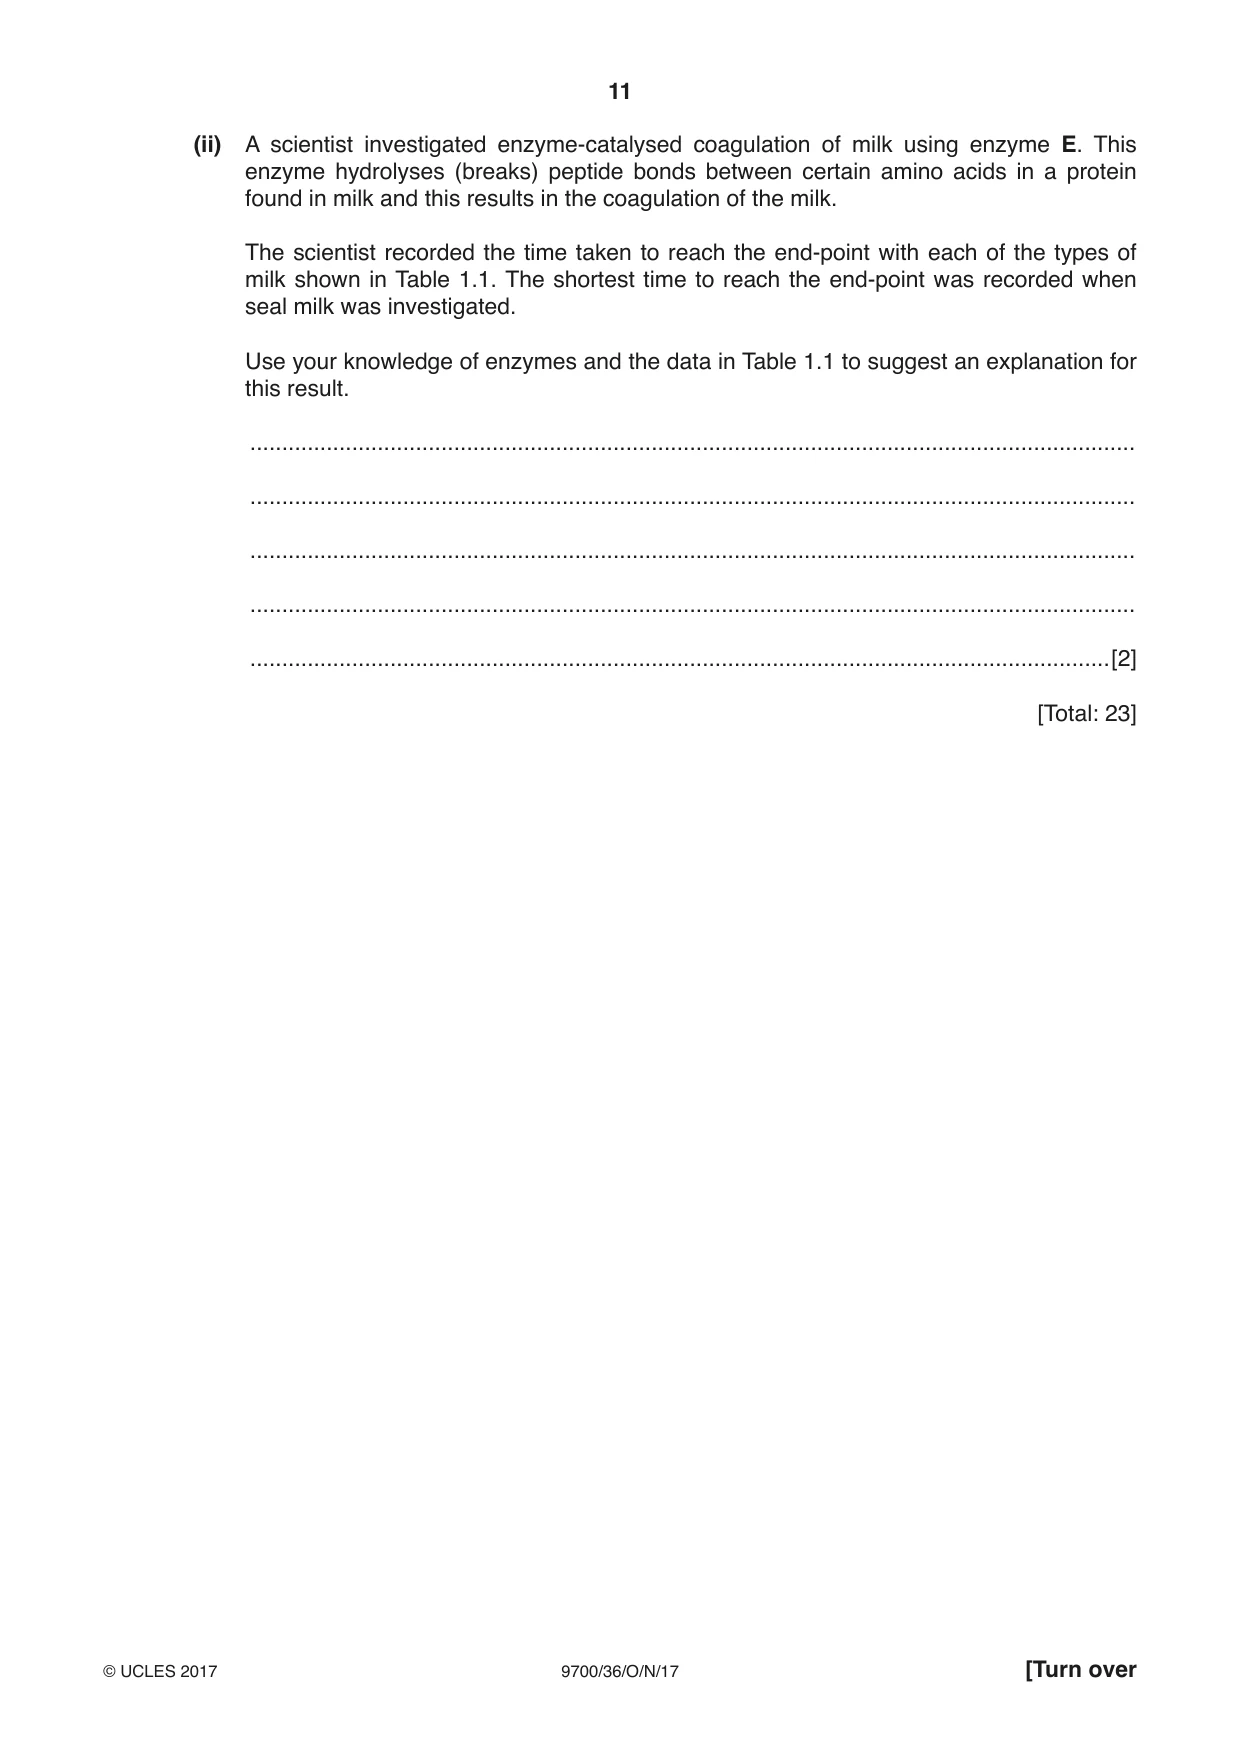
1 You are provided with a solution, labelled E, containing an enzyme which coagulates (clots) milk. Enzyme E hydrolyses (breaks) peptide bonds between certain amino acids in a protein found in milk and this results in the coagulation of the milk. Calcium ions are required for this coagulation. You are required to: • carry out a trial test to think about sources of error • investigate the effect of substrate concentration on this enzyme-catalysed coagulation. When a mixture of milk, calcium chloride solution and E is gently rotated in a test-tube the coagulation goes through the stages shown in Fig. 1.1. Stage 3 is the end-point of the enzyme-catalysed coagulation. film of milk film of milk small spots / all the milk flows / drains drains slowly and clots stick to inside has coagulated back into milk sticks to inside of of test-tube as quickly test-tube film of milk drains back stage 1 stage 2 stage 3 stage 4 the end-point past the end-point Fig. 1.1 You are provided with: labelled contents hazard volume / cm3 C 10% calcium chloride solution harmful irritant 20 W distilled water none 100 M milk none 100 E 1% enzyme solution harmful irritant 20 If C or E comes into contact with your skin, wash off immediately under cold water. It is recommended that you wear suitable eye protection. You are required to carry out a trial test (step 1 to step 16) before you start your investigation. Read step 1 to step 16 before proceeding. Proceed as follows: 1. You are provided with a beaker labelled water-bath. Use the hot and cold water to set up a water-bath in this beaker. The starting temperature of the water-bath should be between 35 °C and 40 °C. You will not need to maintain this temperature during steps 2 to 15. 2. Put 10 cm3 of M into a test-tube. 3. Repeat step 2 so that you have three test-tubes containing M. 4. Put 1 cm3 of C into each test-tube. 5. Gently shake each of the test-tubes to mix M and C. 6. Take the temperature of the water-bath and record this temperature in (a)(ii) on page 5. 7. Put the test-tubes into the water-bath and leave for at least 3 minutes. (a) (i) Explain why the test-tubes are left in the water-bath for at least 3 minutes in step 7. ........................................................................................................................................... .......................................................................................................................................[1] 8. Remove one of the test-tubes from the water-bath. The process of coagulation will start when E is added to the test-tube. 9. Put 1 cm3 of E into the test-tube, so that it runs down the side of the test-tube and forms a layer on the surface of the mixture, as shown in Fig. 1.2. push gently syringe E in syringe test-tube held at an angle E running down inside of test-tube layer of E forming mixture on top of mixture Fig. 1.2 10. Gently shake the test-tube to mix the solutions and start timing. 11. Hold the test-tube over a piece of black card on the table as shown in Fig. 1.3. 12. Gently rotate the test-tube to form a film of milk on the inside of the test-tube. test-tube held at an angle film of milk black card table Fig. 1.3 13. Observe the film until the end-point is reached (stage 3 in Fig. 1.1). Ignore any small bubbles on the inside of the test-tube. Stop timing. 14. Record in (a)(iii) the time taken to reach the end-point. If the end-point has not been reached in 4 minutes, stop the experiment and record ‘more than 240’. 15. Repeat step 8 to step 14 with each of the other two test-tubes in the water-bath. 16. Take the temperature of the water-bath when the final test-tube has been removed and record this in (a)(ii). (ii) Temperature may be a source of error in this investigation. State the temperatures of the water-bath. temperature of water-bath taken in step 6 ............................................. °C temperature of water-bath taken in step 16 ........................................... °C Explain whether the temperature of the water-bath is a significant source of error in this investigation. ........................................................................................................................................... ........................................................................................................................................... .......................................................................................................................................[1] (iii) Record your results in an appropriate table. [2] (iv) A significant source of error for this investigation is deciding when the end-point is reached. Suggest one advantage of carrying out this trial test before investigating the effect of substrate concentration on this enzyme-catalysed reaction. ........................................................................................................................................... ........................................................................................................................................... .......................................................................................................................................[1] You are required to investigate the effect of substrate concentration on this enzyme-catalysed coagulation. (v) Identify the dependent variable in this investigation. .......................................................................................................................................[1] (vi) You are required to prepare different concentrations of milk, using M. M is undiluted milk and is to be referred to as 100% milk. You are required to make a serial dilution of M, which reduces the concentration of M by half between each successive dilution. You will need to prepare 3 further concentrations of milk. You will need to prepare 20 cm3 of each concentration. Complete Fig. 1.4 to show how you will dilute M by: • stating, under each beaker, the volume and concentration of the milk available for use in the investigation • using one arrow, with a label above the beaker, to show the volume and concentration of milk added to prepare the concentration • using another arrow, with a label above the beaker, to show the volume of distilled water, W, added to prepare the concentration. 40 cm3 of M (100% milk) 0 cm3 of W 20 cm3 of M 100% milk 20 cm3 of M ......................... (100% milk) ......................... to use ......................... ....................... ....................... ....................... ....................... ....................... ....................... ....................... ....................... ....................... Fig. 1.4 [3] 17. Prepare the concentrations of milk as decided in (a)(vi) and in Fig. 1.4. 18. Adjust the temperature of the water-bath so that it is between 35 °C and 40 °C. You will not need to maintain this temperature during step 19 to step 24. 19. Put 10 cm3 of the lowest concentration of milk into a test-tube. 20. Repeat step 19 with each of the other concentrations of milk that you have prepared and with 100% milk. 21. Put 1 cm3 of C into each test-tube. 22. Gently shake each of the test-tubes to mix the milk and C. 23. Put the test-tubes in the water-bath and leave for at least 3 minutes. While you are waiting read step 8 to step 13. 24. After 3 minutes remove one of the test-tubes from the water-bath. Add 1 cm3 of E as in step 9, then repeat step 10 to step 13 and record in (a)(vii) the time taken to reach the end-point. 25. Repeat step 24 with each of the other test-tubes. (vii) Record your results in an appropriate table. [4] (viii) Describe a control that could be carried out as part of your investigation. ........................................................................................................................................... ........................................................................................................................................... .......................................................................................................................................[1] (ix) This procedure investigated the effect of substrate concentration on the activity of enzyme E, using the time taken to reach the end-point. To modify this procedure for investigating another variable, the substrate concentration would need to be standardised. Describe how the substrate concentration could be standardised. ........................................................................................................................................... ........................................................................................................................................... Think about how you could modify this procedure to investigate the effect of temperature on the time taken to reach the end-point. Describe the modifications needed to investigate the effect of temperature. ........................................................................................................................................... ........................................................................................................................................... ........................................................................................................................................... ........................................................................................................................................... ........................................................................................................................................... ........................................................................................................................................... ........................................................................................................................................... [3] Question 1 continues on page 10 (b) A scientist investigated the percentage mass of protein in milk produced by different animals. The results are shown in Table 1.1. Table 1.1 source of milk percentage mass of protein in milk cow (co) 3.5 elephant (el) 4.0 sheep (sh) 5.4 seal (se) 10.2 mouse (mo) 9.0 Use a sharp pencil for drawing charts. (i) Draw a chart of the data shown in Table 1.1. [4] (ii) A scientist investigated enzyme-catalysed coagulation of milk using enzyme E. This enzyme hydrolyses (breaks) peptide bonds between certain amino acids in a protein found in milk and this results in the coagulation of the milk. The scientist recorded the time taken to reach the end-point with each of the types of milk shown in Table 1.1. The shortest time to reach the end-point was recorded when seal milk was investigated. Use your knowledge of enzymes and the data in Table 1.1 to suggest an explanation for this result. ........................................................................................................................................... ........................................................................................................................................... ........................................................................................................................................... ........................................................................................................................................... .......................................................................................................................................[2] [Total: 23]
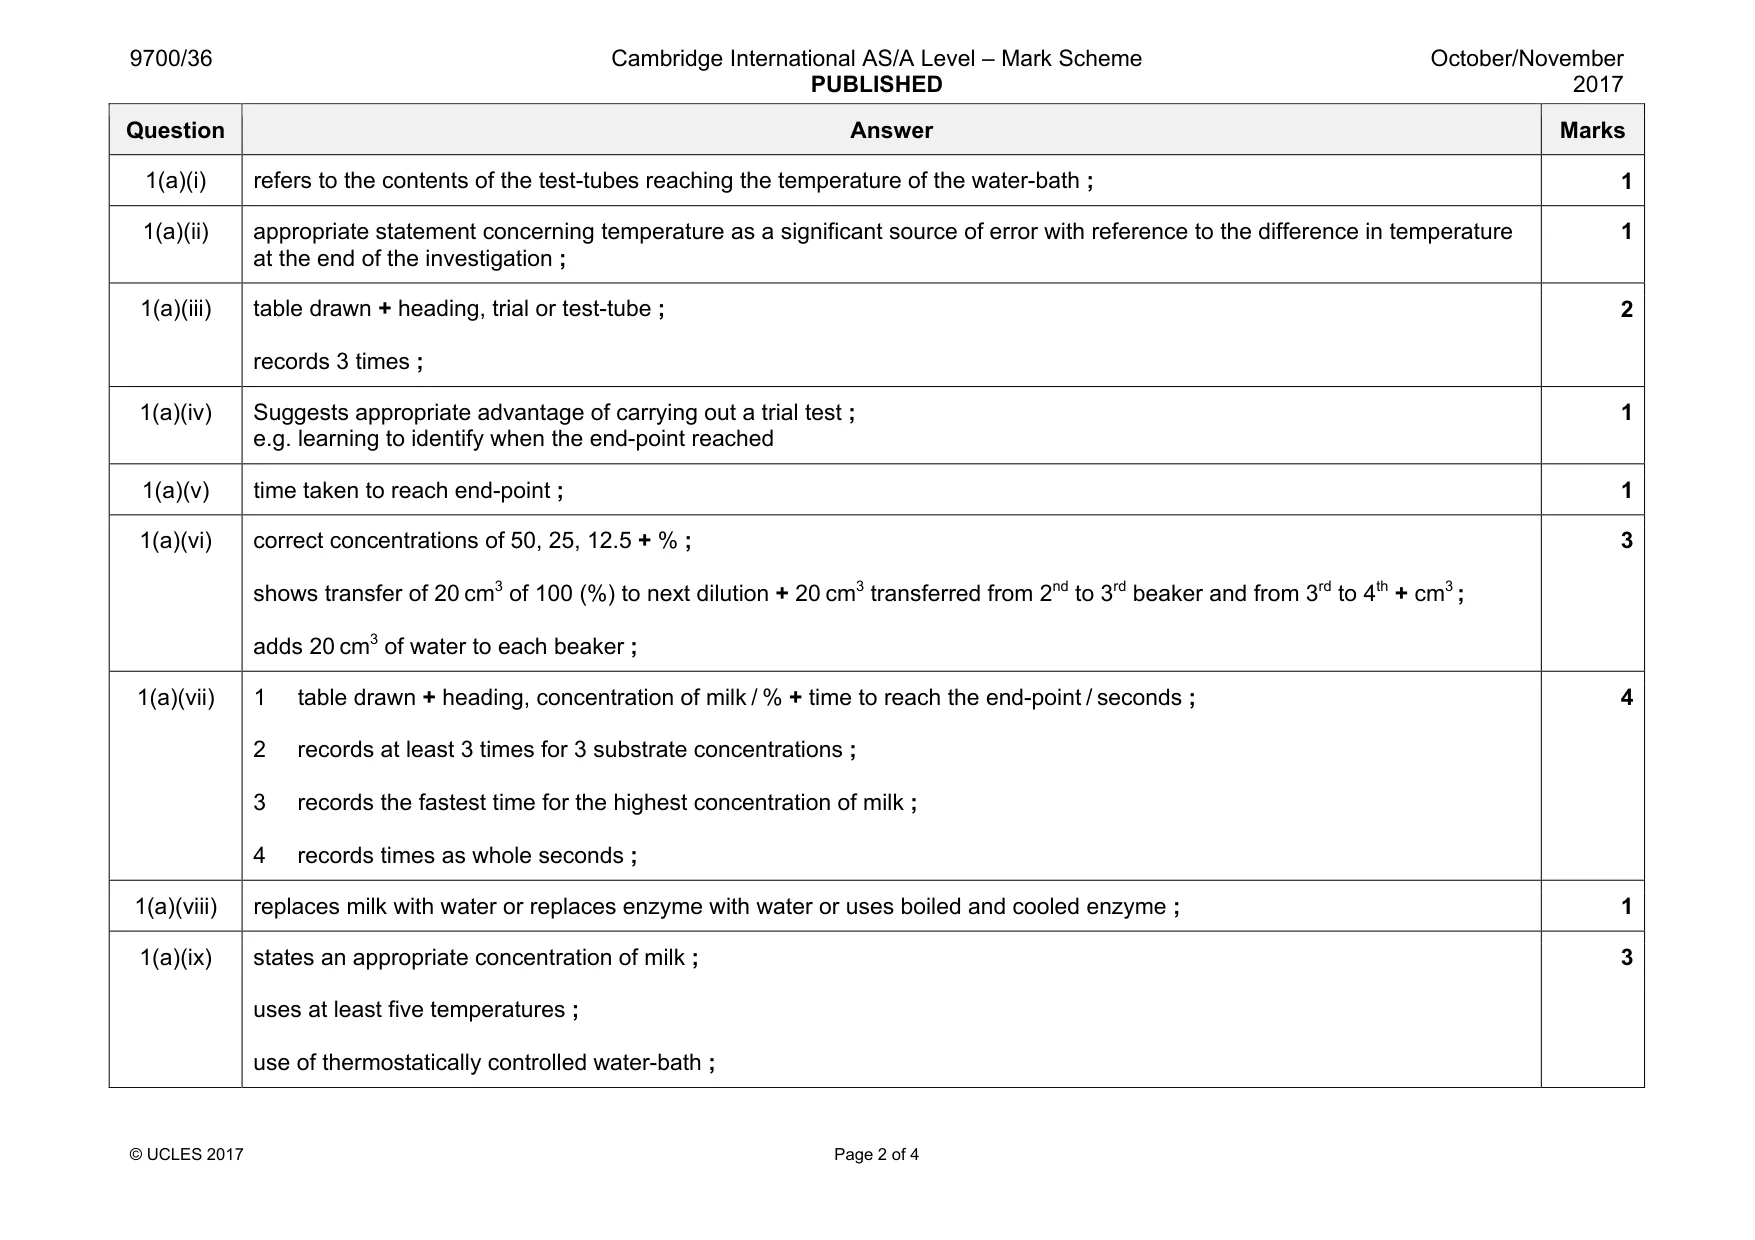
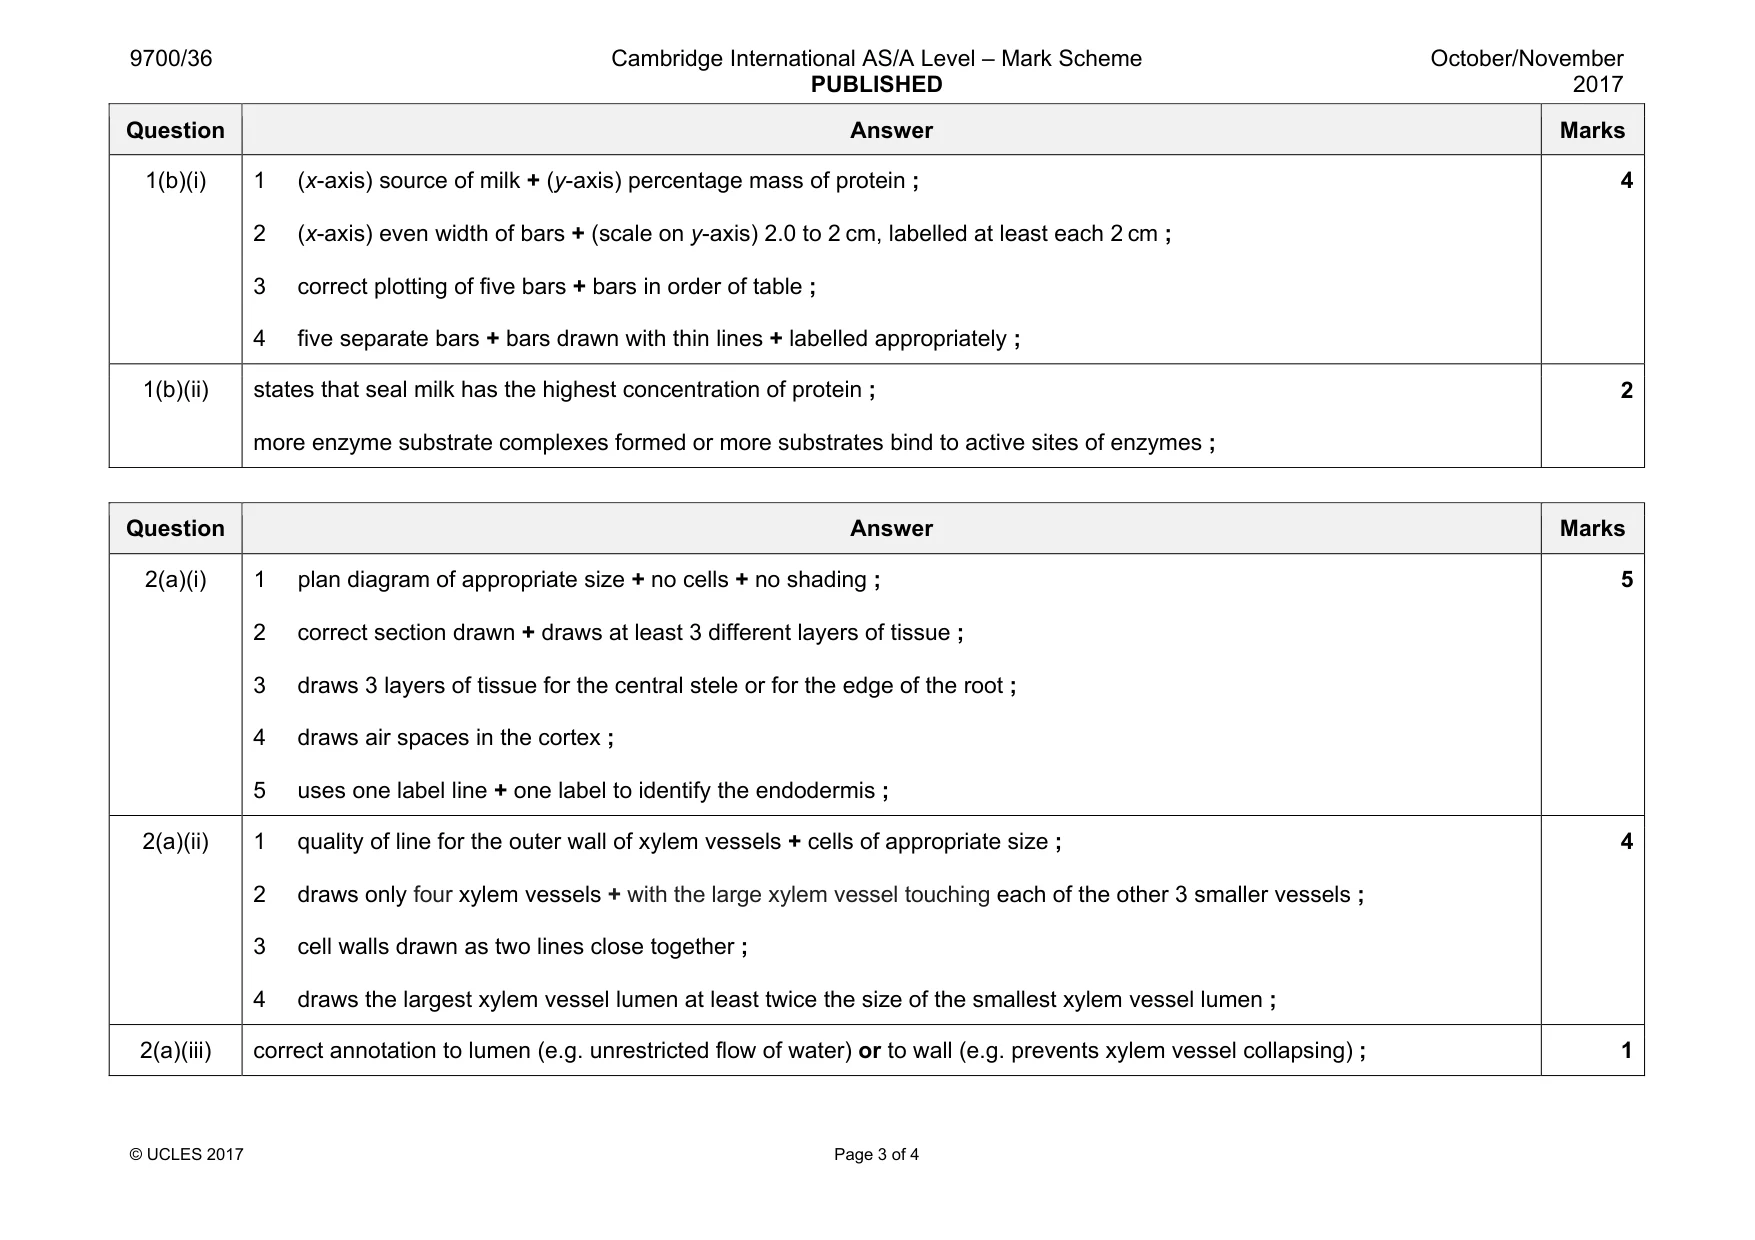
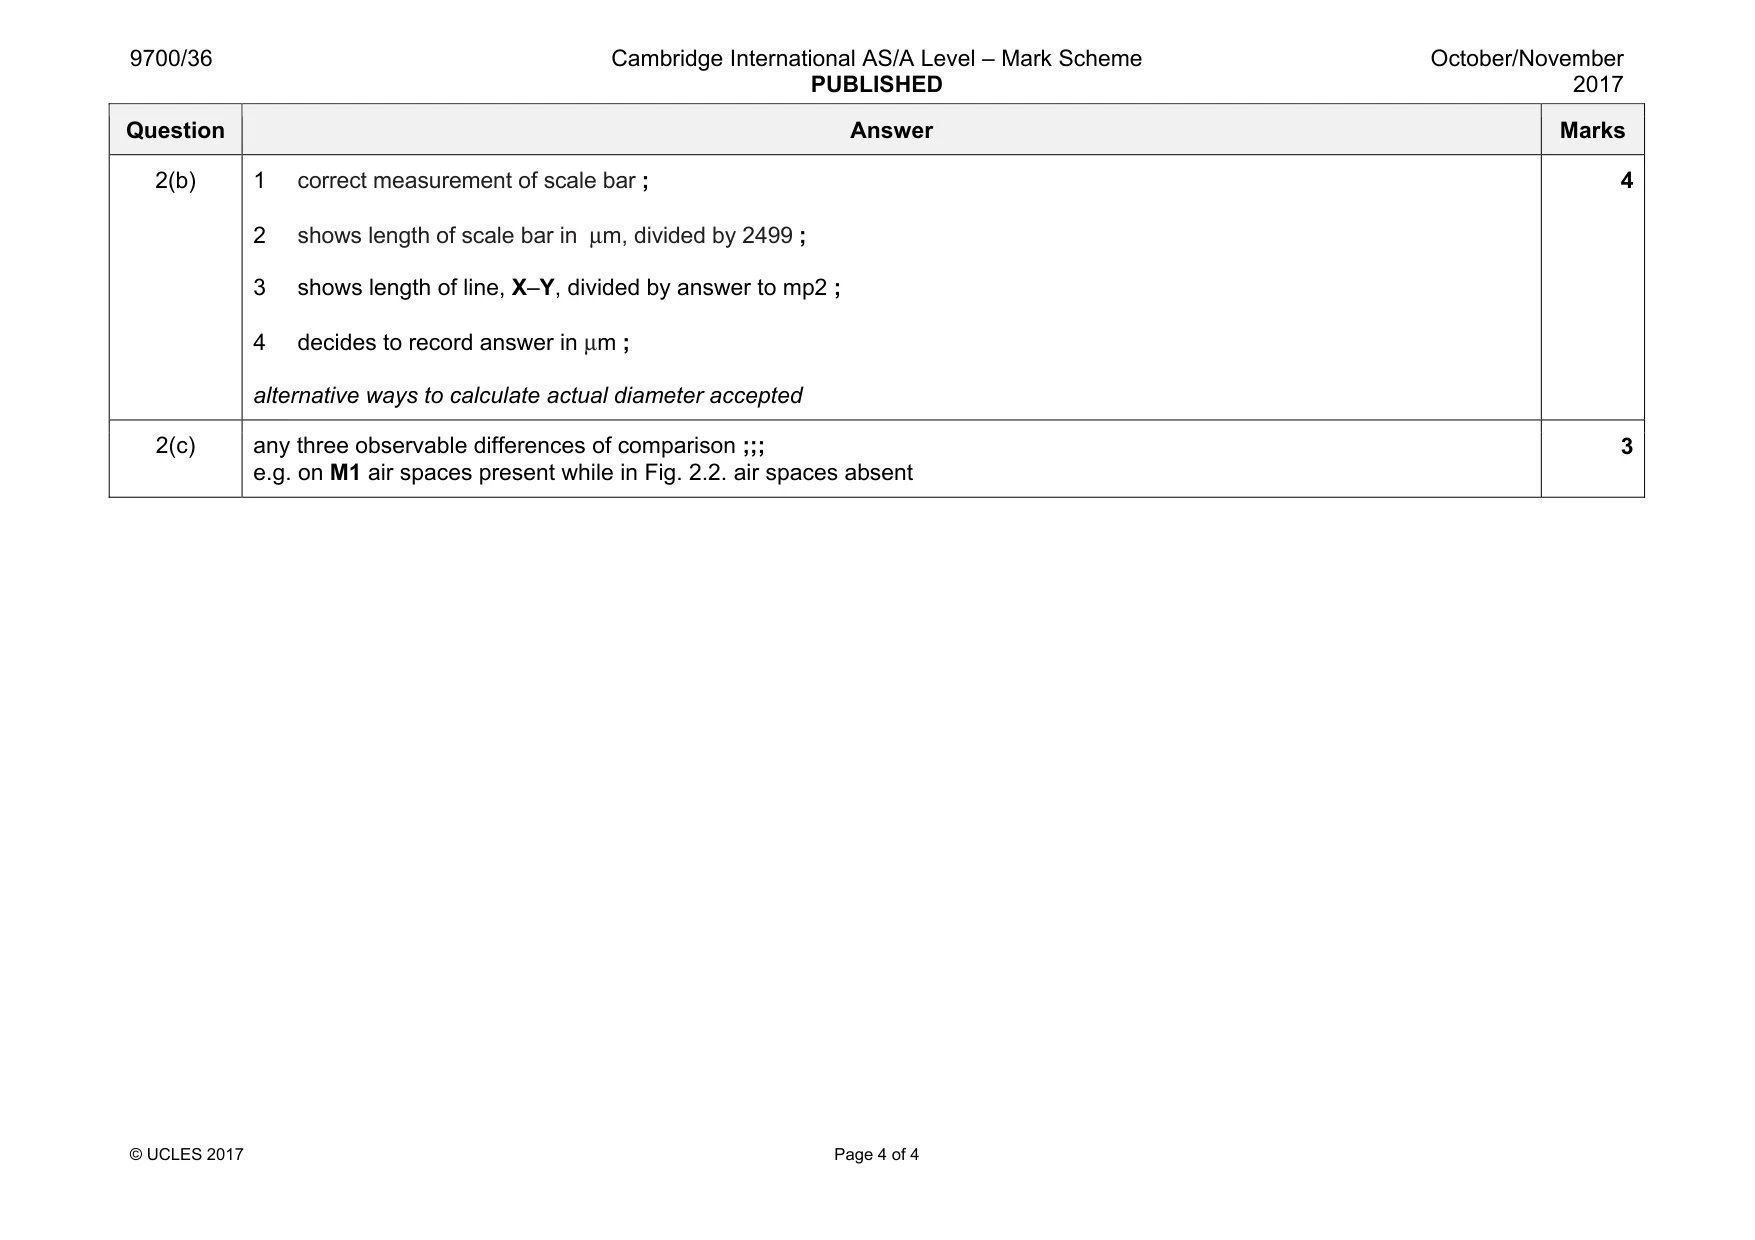
Mark scheme: 1(a)(i) refers to the contents of the test-tubes reaching the temperature of the water-bath ; 1 1(a)(ii) appropriate statement concerning temperature as a significant source of error with reference to the difference in temperature at the end of the investigation ; 1 1(a)(iii) table drawn + heading, trial or test-tube ; records 3 times ; 2 1(a)(iv) Suggests appropriate advantage of carrying out a trial test ; e.g. learning to identify when the end-point reached 1 1(a)(v) time taken to reach end-point ; 1 1(a)(vi) correct concentrations of 50, 25, 12.5 + % ; shows transfer of 20 cm3 of 100 (%) to next dilution + 20 cm3 transferred from 2nd to 3rd beaker and from 3rd to 4th + cm3 ; adds 20 cm3 of water to each beaker ; 3 1(a)(vii) 1 table drawn + heading, concentration of milk / % + time to reach the end-point / seconds ; 2 records at least 3 times for 3 substrate concentrations ; 3 records the fastest time for the highest concentration of milk ; 4 records times as whole seconds ; 4 1(a)(viii) replaces milk with water or replaces enzyme with water or uses boiled and cooled enzyme ; 1 1(a)(ix) states an appropriate concentration of milk ; uses at least five temperatures ; use of thermostatically controlled water-bath ; 3 Question Answer Marks 1(b)(i) 1 (x-axis) source of milk + (y-axis) percentage mass of protein ; 2 (x-axis) even width of bars + (scale on y-axis) 2.0 to 2 cm, labelled at least each 2 cm ; 3 correct plotting of five bars + bars in order of table ; 4 five separate bars + bars drawn with thin lines + labelled appropriately ; 4 1(b)(ii) states that seal milk has the highest concentration of protein ; more enzyme substrate complexes formed or more substrates bind to active sites of enzymes ; 2
Q2 · M1 is a slide of a stained transverse section through a plant root
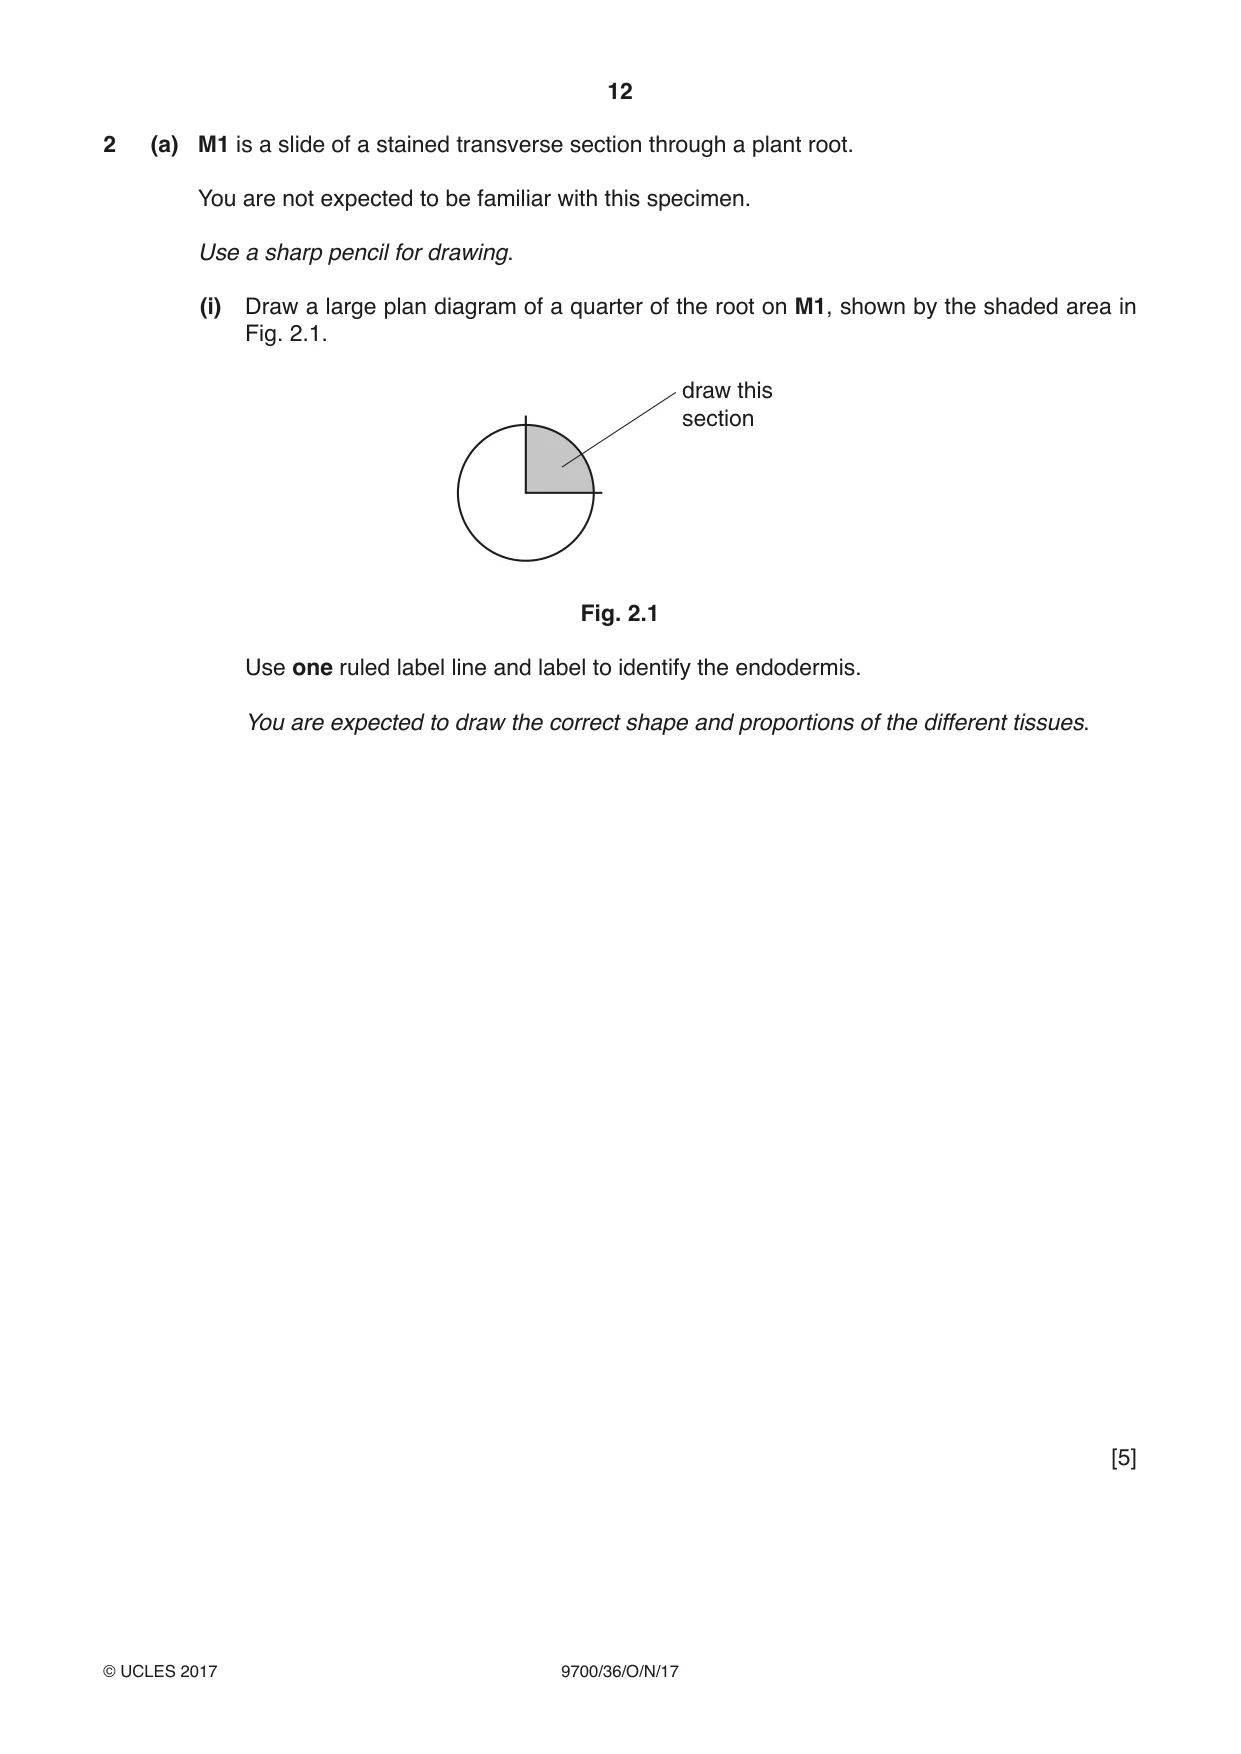
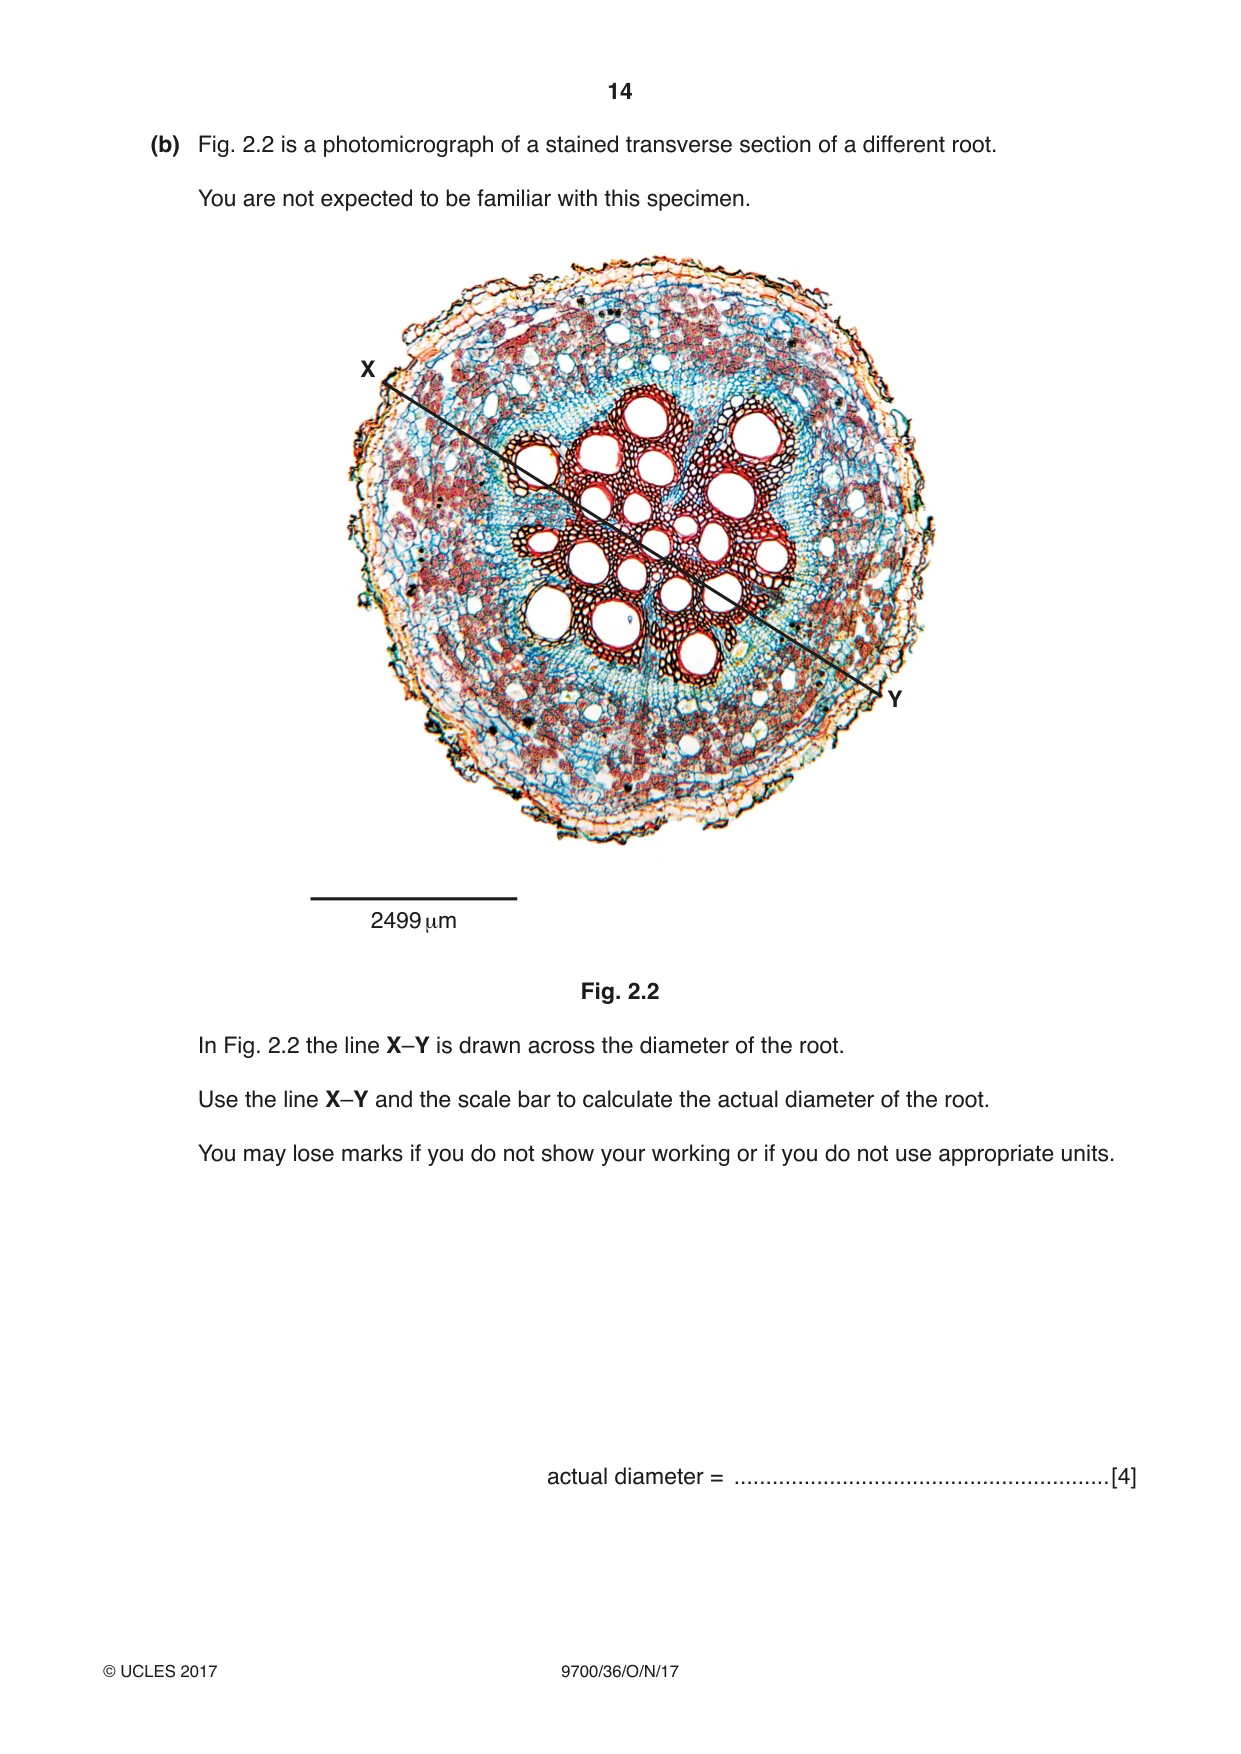
2 (a) M1 is a slide of a stained transverse section through a plant root. You are not expected to be familiar with this specimen. Use a sharp pencil for drawing. (i) Draw a large plan diagram of a quarter of the root on M1, shown by the shaded area in Fig. 2.1. draw this section Fig. 2.1 Use one ruled label line and label to identify the endodermis. You are expected to draw the correct shape and proportions of the different tissues. [5] (ii) Observe the central tissue in the root on M1. Select one large xylem vessel and three adjacent (touching) smaller xylem vessels from the tissue at the centre of the root. The large xylem vessel must touch each of the three smaller xylem vessels. Make a large drawing of this group of four xylem vessels. [4] (iii) Annotate your drawing in (a)(ii) to describe one observable feature of the xylem vessels that adapts them for their function by: • drawing a label line to the feature • describing next to the line how the feature adapts the xylem vessel for its function. [1] (b) Fig. 2.2 is a photomicrograph of a stained transverse section of a different root. You are not expected to be familiar with this specimen. X Y 2499 μm Fig. 2.2 In Fig. 2.2 the line X–Y is drawn across the diameter of the root. Use the line X–Y and the scale bar to calculate the actual diameter of the root. You may lose marks if you do not show your working or if you do not use appropriate units. actual diameter = ...........................................................[4]
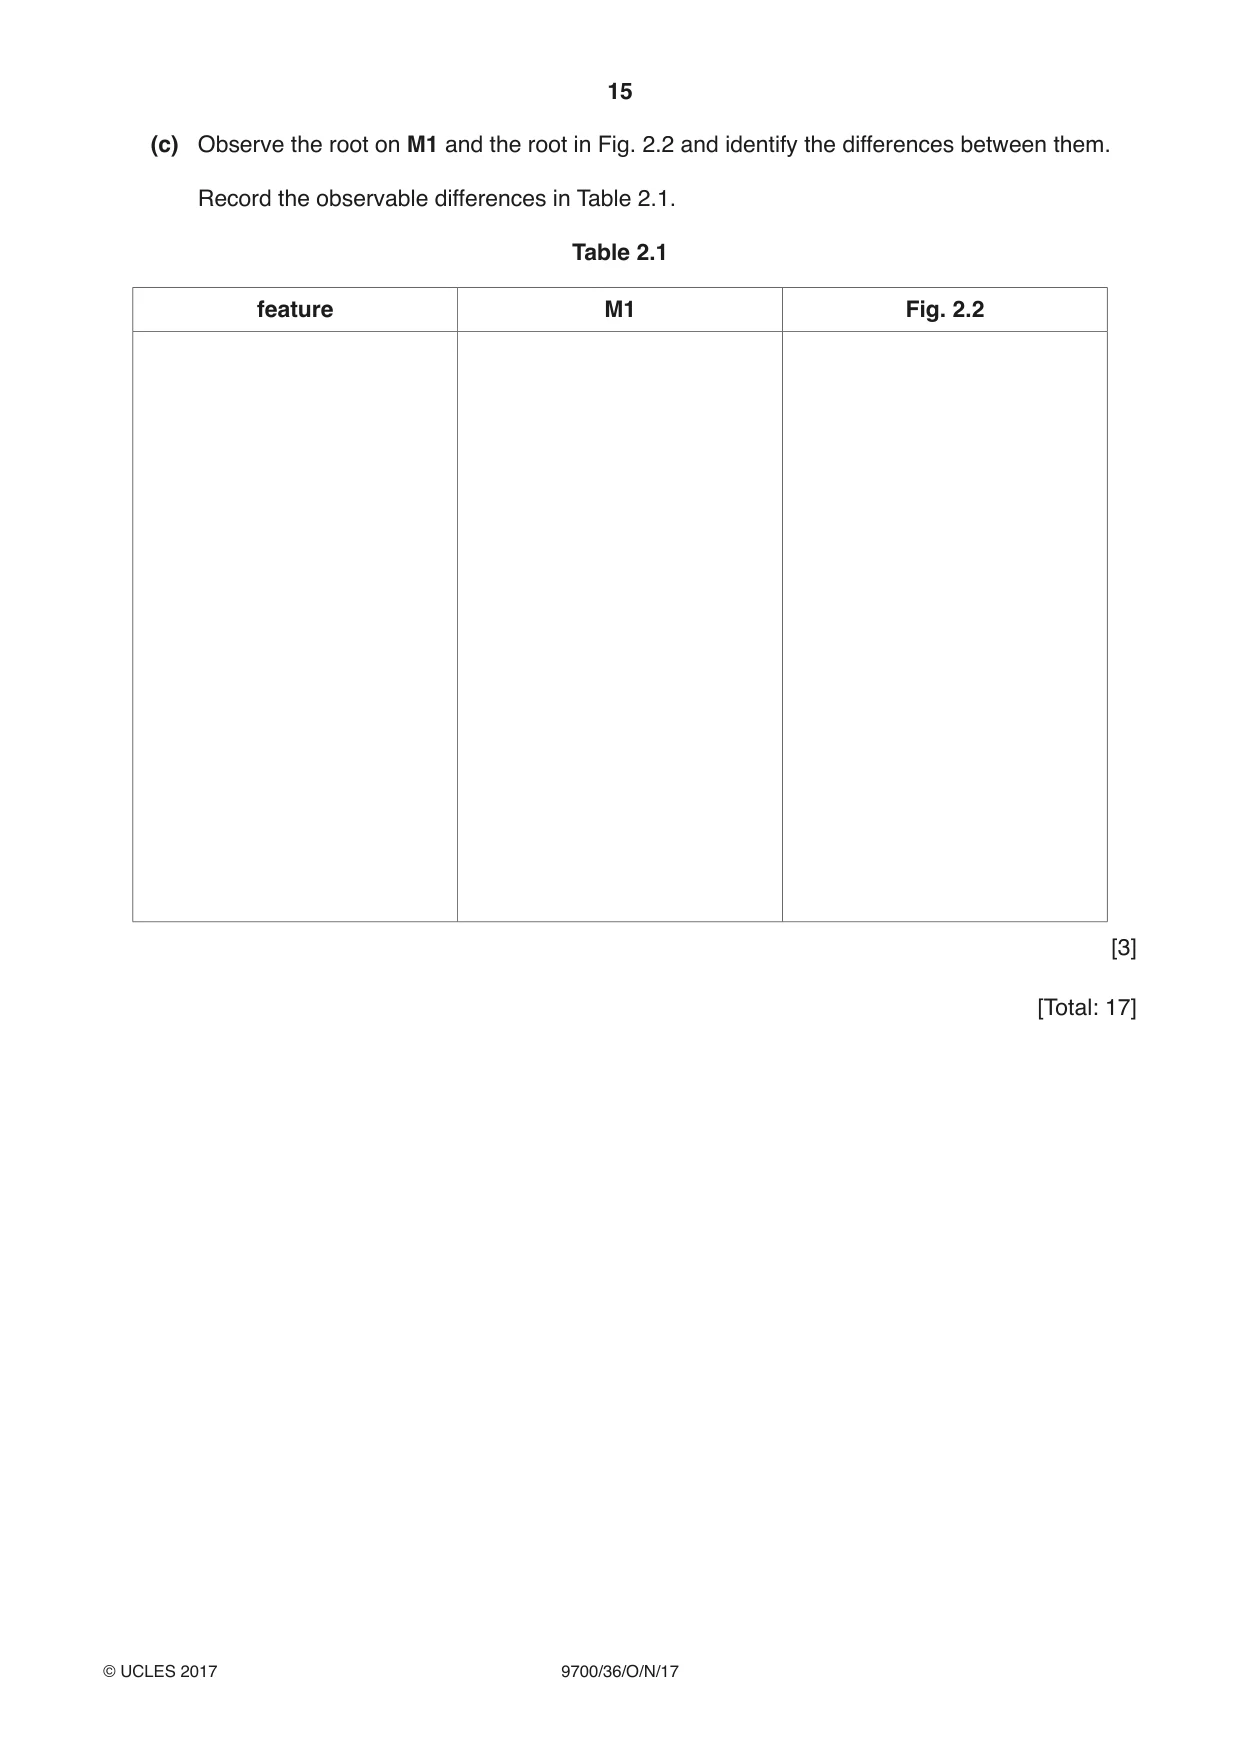
Mark scheme: 2(a)(i) 1 plan diagram of appropriate size + no cells + no shading ; 2 correct section drawn + draws at least 3 different layers of tissue ; 3 draws 3 layers of tissue for the central stele or for the edge of the root ; 4 draws air spaces in the cortex ; 5 uses one label line + one label to identify the endodermis ; 5 2(a)(ii) 1 quality of line for the outer wall of xylem vessels + cells of appropriate size ; 2 draws only four xylem vessels + with the large xylem vessel touching each of the other 3 smaller vessels ; 3 cell walls drawn as two lines close together ; 4 draws the largest xylem vessel lumen at least twice the size of the smallest xylem vessel lumen ; 4 2(a)(iii) correct annotation to lumen (e.g. unrestricted flow of water) or to wall (e.g. prevents xylem vessel collapsing) ; 1 Question Answer Marks 2(b) 1 correct measurement of scale bar ; 2 shows length of scale bar in µm, divided by 2499 ; 3 shows length of line, X–Y, divided by answer to mp2 ; 4 decides to record answer in µm ; alternative ways to calculate actual diameter accepted 4 2(c) any three observable differences of comparison ;;; e.g. on M1 air spaces present while in Fig. 2.2. air spaces absent 3
What was in this paper
The subtopics covered by these 2 questions, and how many questions each got. Open one in a new tab to see every Cambridge question on it.
What you needed in this session
Cambridge’s own grade thresholds for 2017 Oct/Nov, Paper 3 · Variant 6. A higher threshold means an easier paper — the bar moves with how the cohort did.