Cambridge A Level Biology 9700 — 2020 Oct/Nov Paper 3 · Variant 6
9700/36/O/N/20 · 2 questions · 40 marks · ≈45 min
The question paper and its mark scheme, free to read here and free to download. This is Cambridge’s own paper, exactly as it was sat.
Question paper12 pages



Mark scheme8 pages
Answers below. Sit the paper first if you are practising.

Questions as text
Q1 · Urease is an enzyme that catalyses the breakdown of urea as shown in Fig
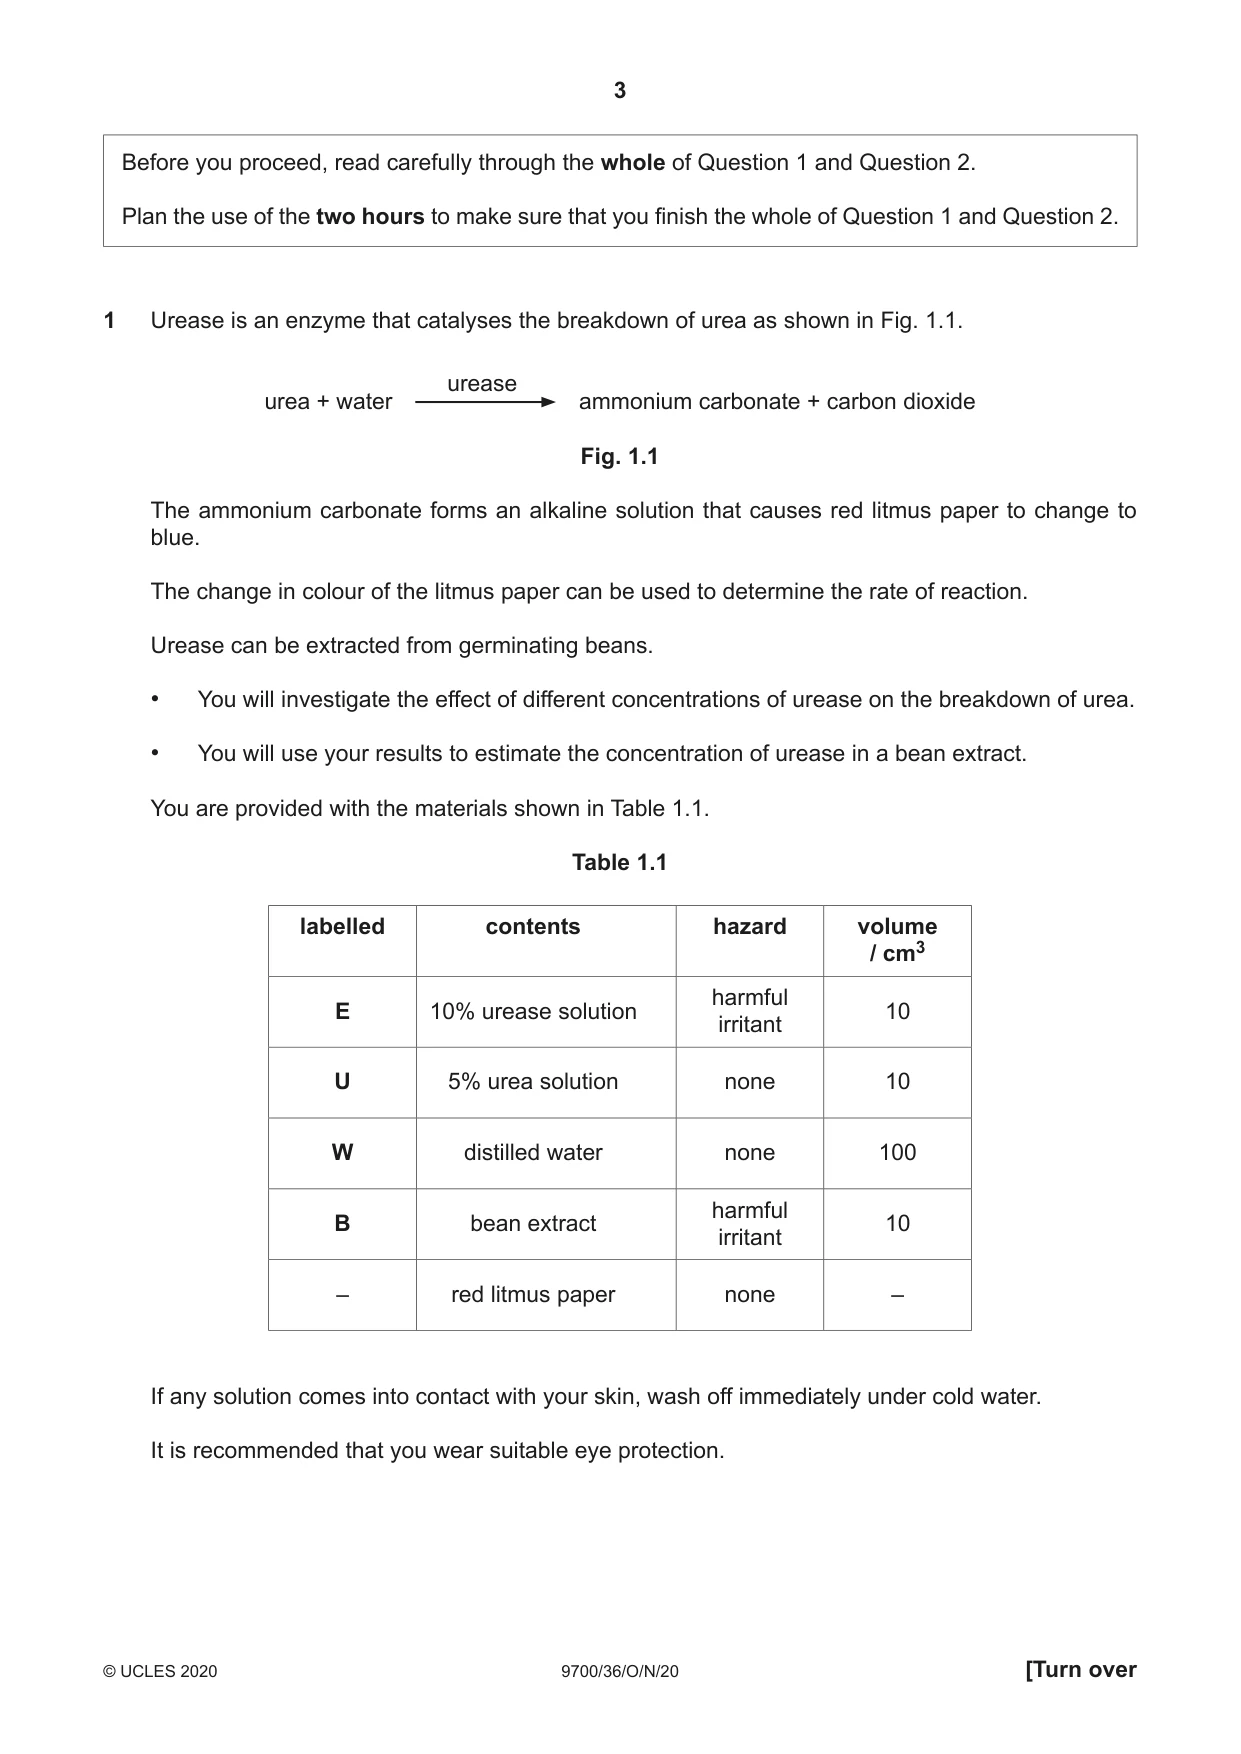
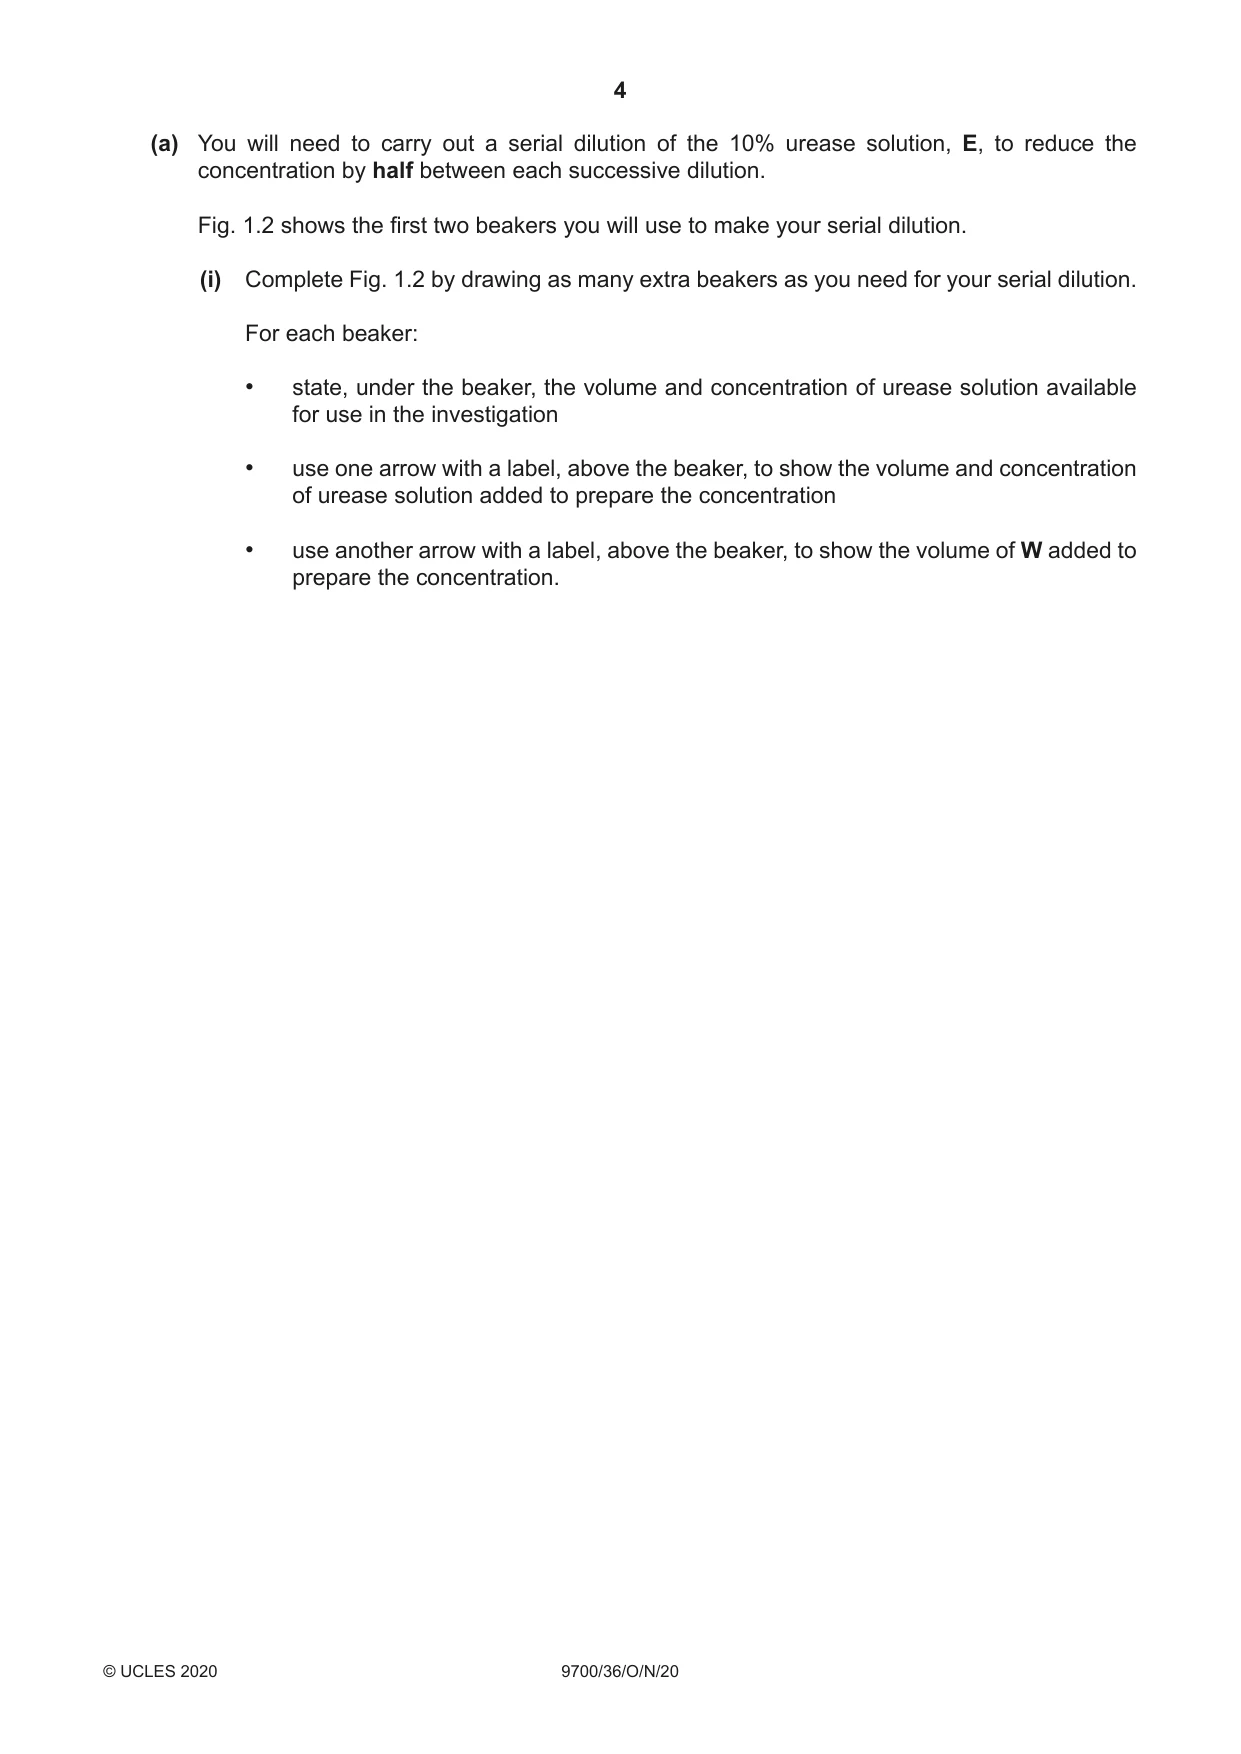
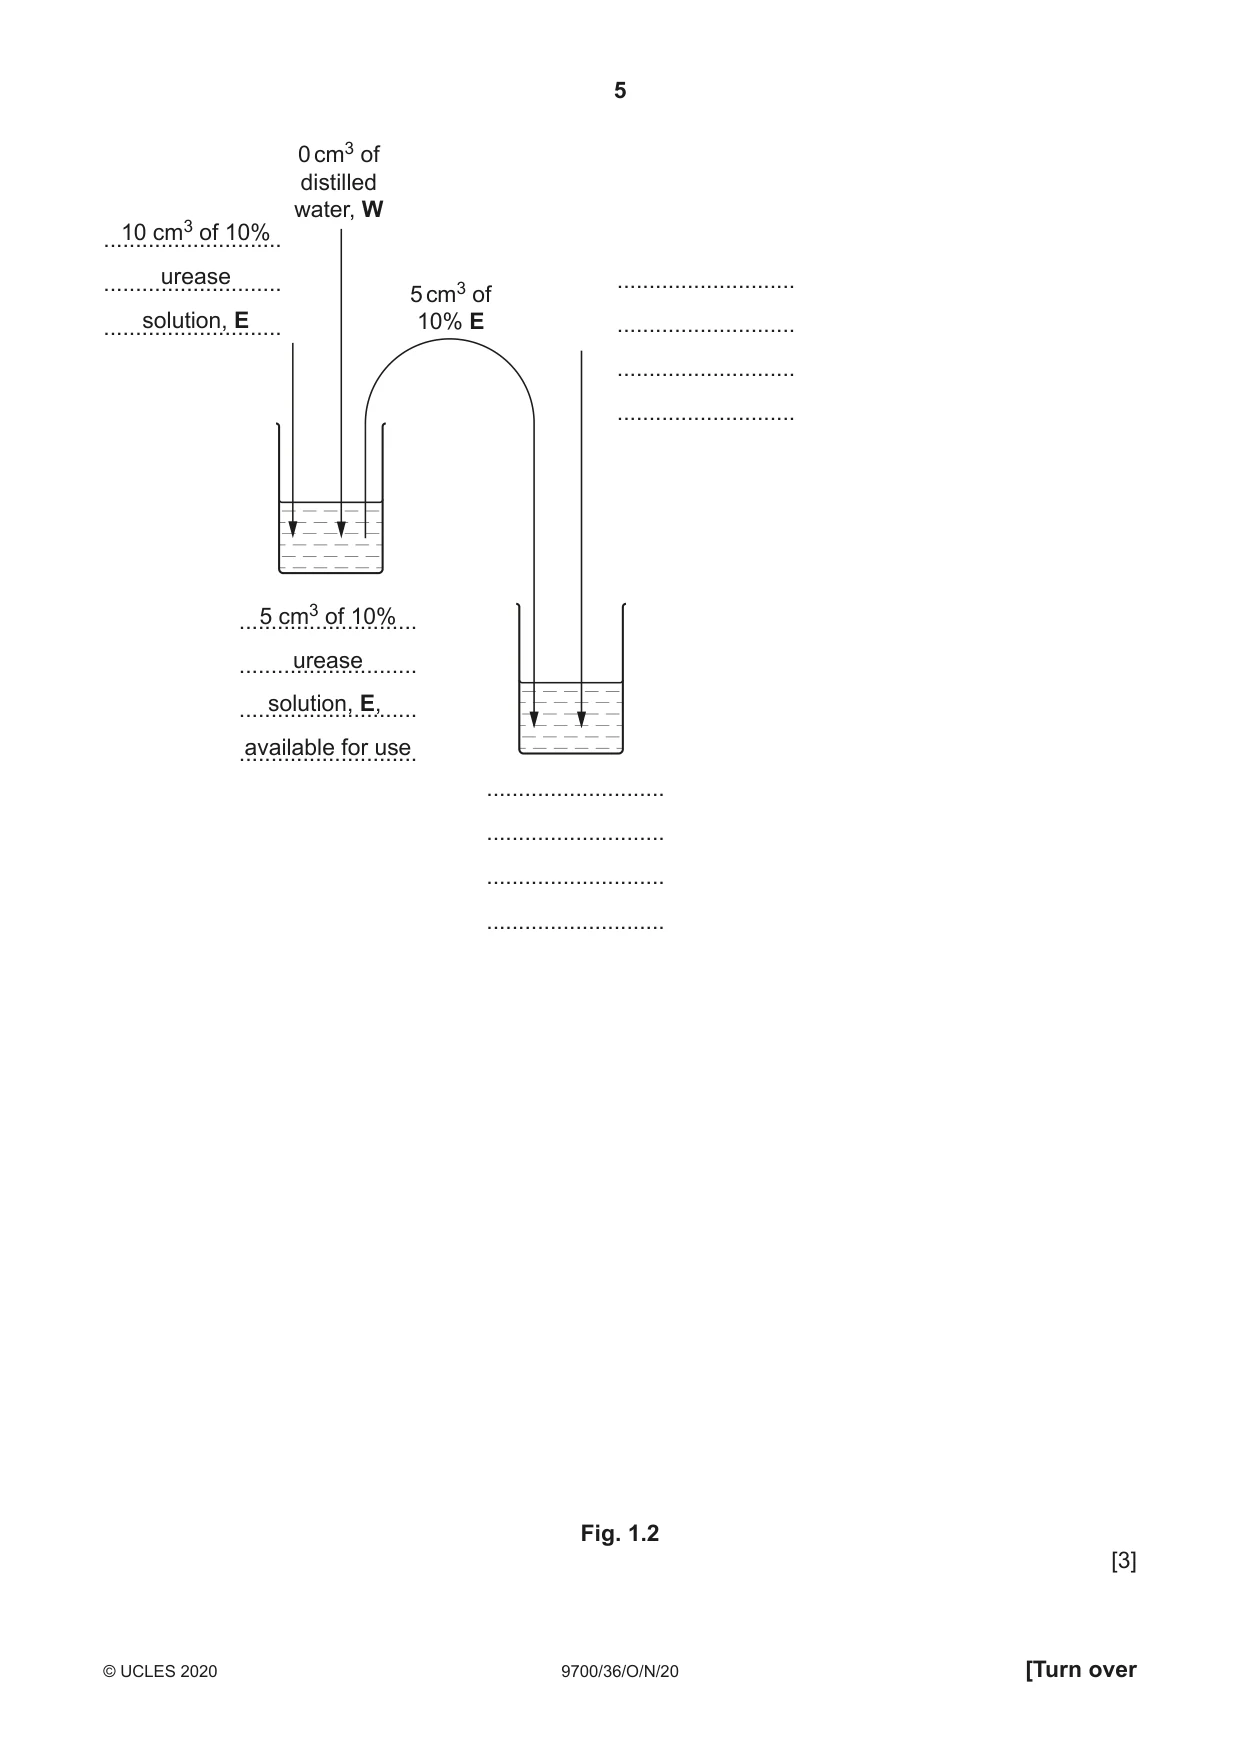
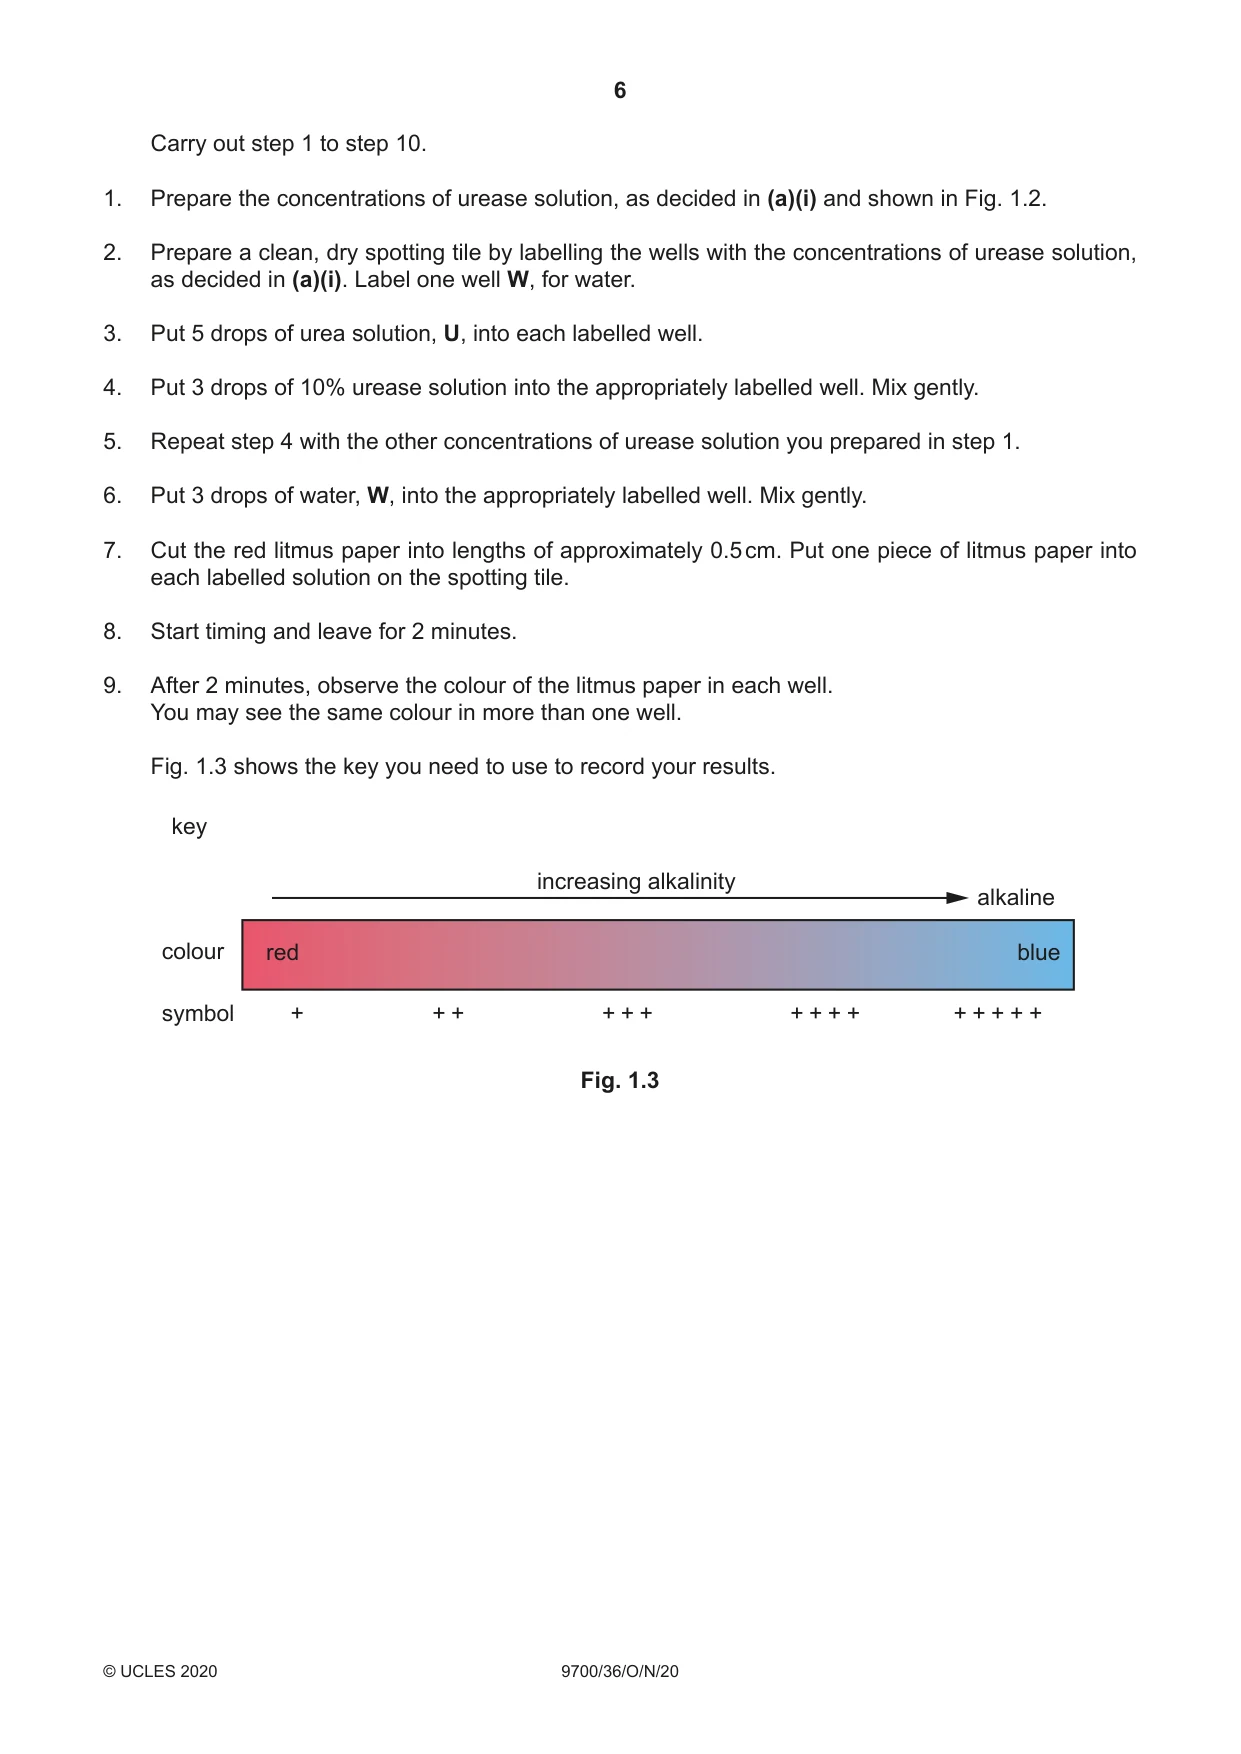
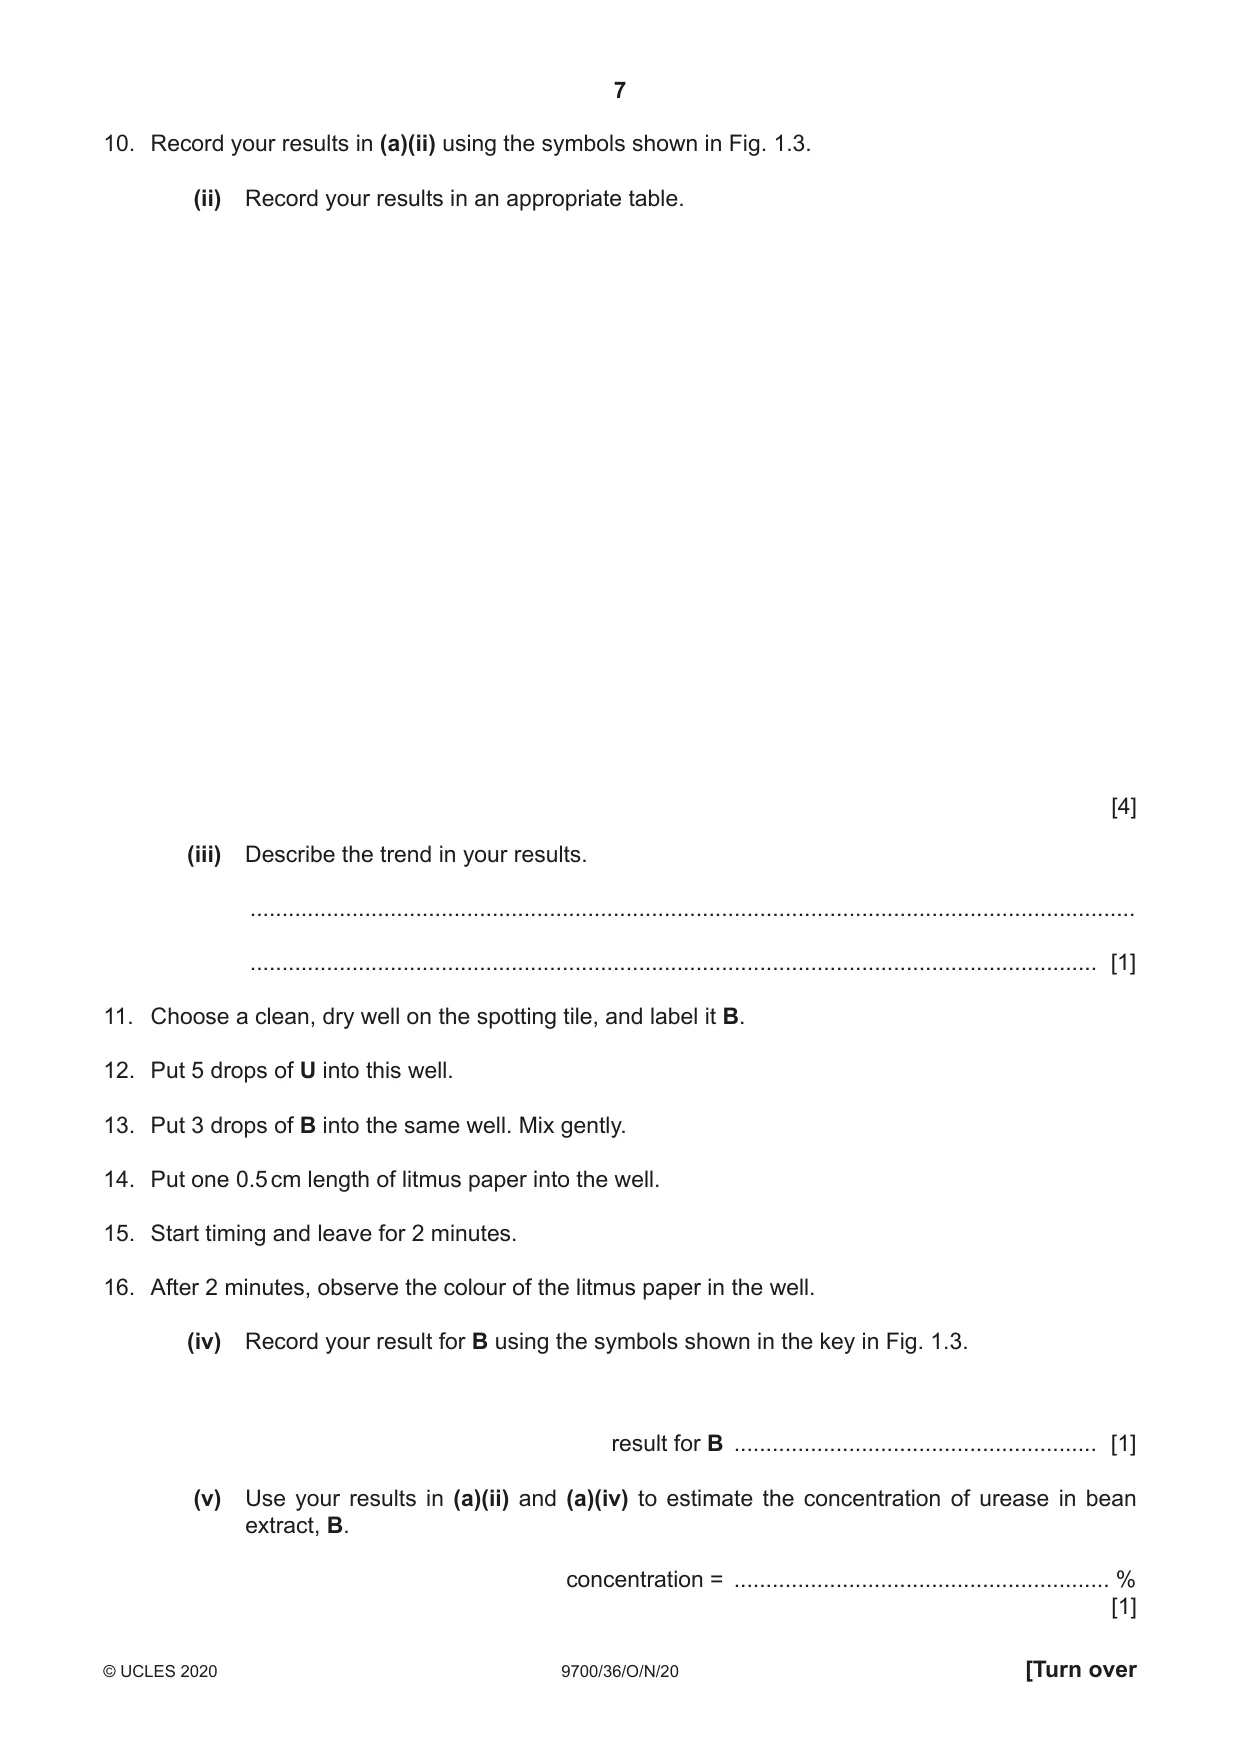
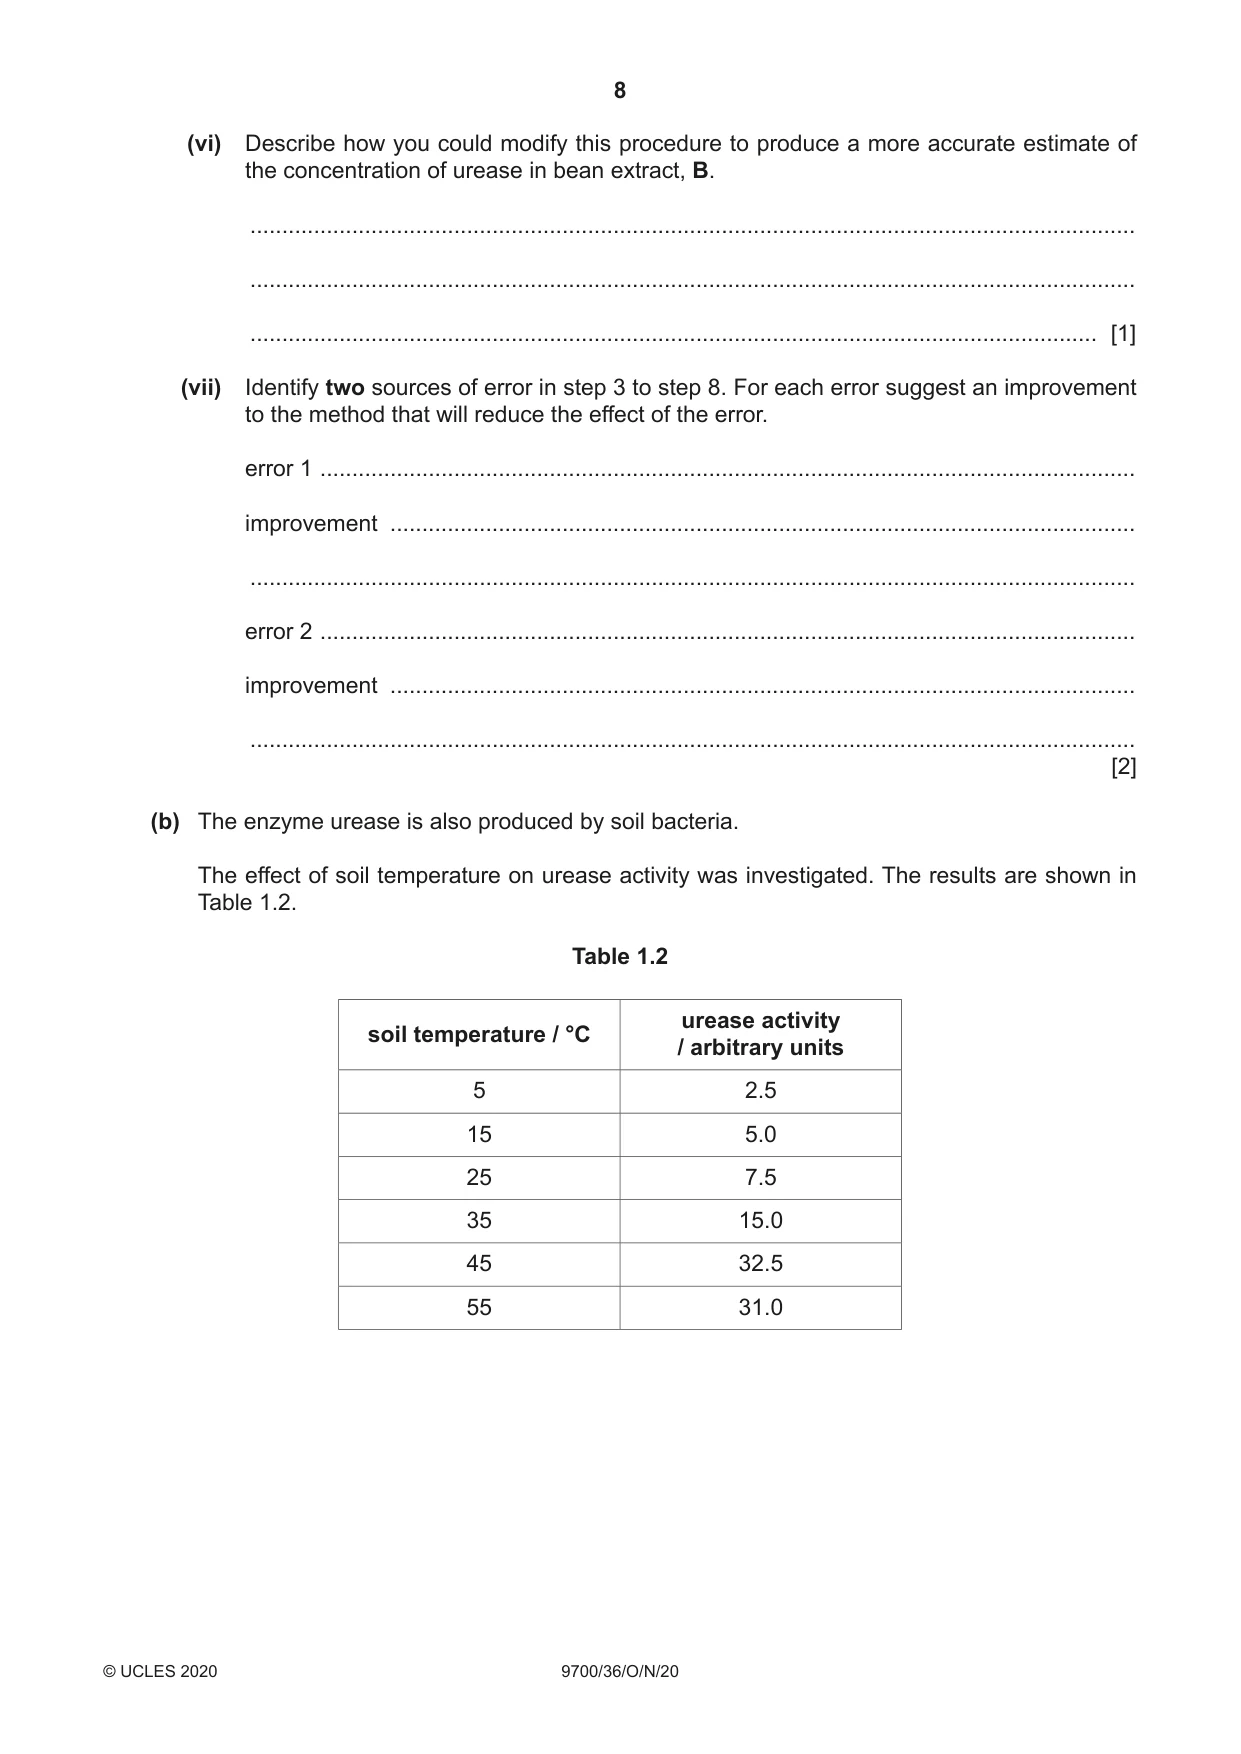
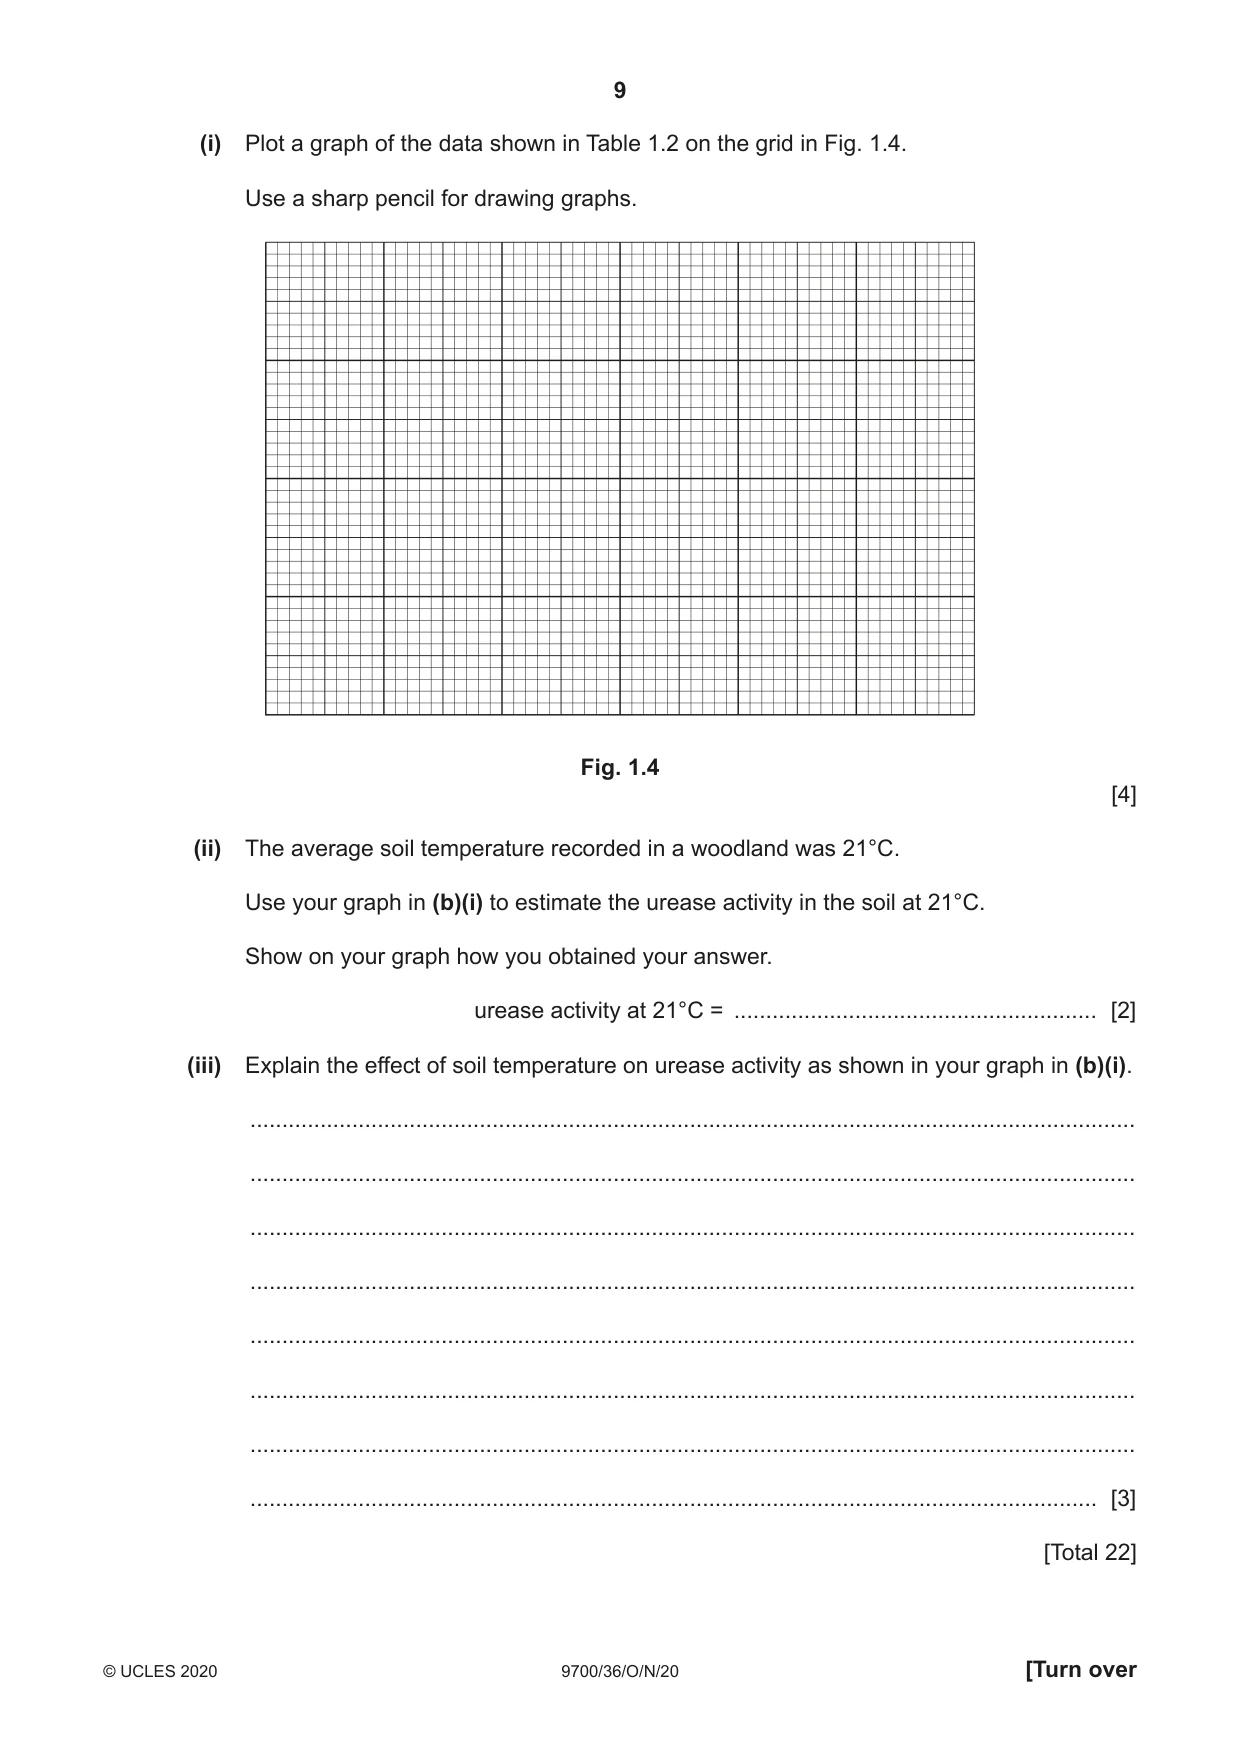
1 Urease is an enzyme that catalyses the breakdown of urea as shown in Fig. 1.1. urease urea + water ammonium carbonate + carbon dioxide Fig. 1.1 The ammonium carbonate forms an alkaline solution that causes red litmus paper to change to blue. The change in colour of the litmus paper can be used to determine the rate of reaction. Urease can be extracted from germinating beans. • You will investigate the effect of different concentrations of urease on the breakdown of urea. • You will use your results to estimate the concentration of urease in a bean extract. You are provided with the materials shown in Table 1.1. Table 1.1 labelled contents hazard volume / cm3 harmful E 10% urease solution 10 irritant U 5% urea solution none 10 W distilled water none 100 harmful B bean extract 10 irritant – red litmus paper none – If any solution comes into contact with your skin, wash off immediately under cold water. It is recommended that you wear suitable eye protection. (a) You will need to carry out a serial dilution of the 10% urease solution, E, to reduce the concentration by half between each successive dilution. Fig. 1.2 shows the first two beakers you will use to make your serial dilution. (i) Complete Fig. 1.2 by drawing as many extra beakers as you need for your serial dilution. For each beaker: • state, under the beaker, the volume and concentration of urease solution available for use in the investigation • use one arrow with a label, above the beaker, to show the volume and concentration of urease solution added to prepare the concentration • use another arrow with a label, above the beaker, to show the volume of W added to prepare the concentration. 0 cm3 of distilled water, W 10 cm3 of 10%............................ urease ........................................................ 5 cm3 of solution, E 10% E ........................................................ ............................ ............................ ............................5 cm3 of 10% ............................urease ............................solution, E, ............................available for use ............................ ............................ ............................ ............................ Fig. 1.2 [3] Carry out step 1 to step 10. 1. Prepare the concentrations of urease solution, as decided in (a)(i) and shown in Fig. 1.2. 2. Prepare a clean, dry spotting tile by labelling the wells with the concentrations of urease solution, as decided in (a)(i). Label one well W, for water. 3. Put 5 drops of urea solution, U, into each labelled well. 4. Put 3 drops of 10% urease solution into the appropriately labelled well. Mix gently. 5. Repeat step 4 with the other concentrations of urease solution you prepared in step 1. 6. Put 3 drops of water, W, into the appropriately labelled well. Mix gently. 7. Cut the red litmus paper into lengths of approximately 0.5 cm. Put one piece of litmus paper into each labelled solution on the spotting tile. 8. Start timing and leave for 2 minutes. 9. After 2 minutes, observe the colour of the litmus paper in each well. You may see the same colour in more than one well. Fig. 1.3 shows the key you need to use to record your results. key increasing alkalinity alkaline colour red blue symbol + + + + + + + + + + + + + + + Fig. 1.3 10. Record your results in (a)(ii) using the symbols shown in Fig. 1.3. (ii) Record your results in an appropriate table. [4] (iii) Describe the trend in your results. ........................................................................................................................................... ..................................................................................................................................... [1] 11. Choose a clean, dry well on the spotting tile, and label it B. 12. Put 5 drops of U into this well. 13. Put 3 drops of B into the same well. Mix gently. 14. Put one 0.5 cm length of litmus paper into the well. 15. Start timing and leave for 2 minutes. 16. After 2 minutes, observe the colour of the litmus paper in the well. (iv) Record your result for B using the symbols shown in the key in Fig. 1.3. result for B ......................................................... [1] (v) Use your results in (a)(ii) and (a)(iv) to estimate the concentration of urease in bean extract, B. concentration = ........................................................... % [1] (vi) Describe how you could modify this procedure to produce a more accurate estimate of the concentration of urease in bean extract, B. ........................................................................................................................................... ........................................................................................................................................... ..................................................................................................................................... [1] (vii) Identify two sources of error in step 3 to step 8. For each error suggest an improvement to the method that will reduce the effect of the error. error 1 ................................................................................................................................ improvement ..................................................................................................................... ........................................................................................................................................... error 2 ................................................................................................................................ improvement ..................................................................................................................... ........................................................................................................................................... [2] (b) The enzyme urease is also produced by soil bacteria. The effect of soil temperature on urease activity was investigated. The results are shown in Table 1.2. Table 1.2 urease activity soil temperature / °C / arbitrary units 5 2.5 15 5.0 25 7.5 35 15.0 45 32.5 55 31.0 (i) Plot a graph of the data shown in Table 1.2 on the grid in Fig. 1.4. Use a sharp pencil for drawing graphs. Fig. 1.4 [4] (ii) The average soil temperature recorded in a woodland was 21°C. Use your graph in (b)(i) to estimate the urease activity in the soil at 21°C. Show on your graph how you obtained your answer. urease activity at 21°C = ......................................................... [2] (iii) Explain the effect of soil temperature on urease activity as shown in your graph in (b)(i). ........................................................................................................................................... ........................................................................................................................................... ........................................................................................................................................... ........................................................................................................................................... ........................................................................................................................................... ........................................................................................................................................... ........................................................................................................................................... ..................................................................................................................................... [3] [Total 22]
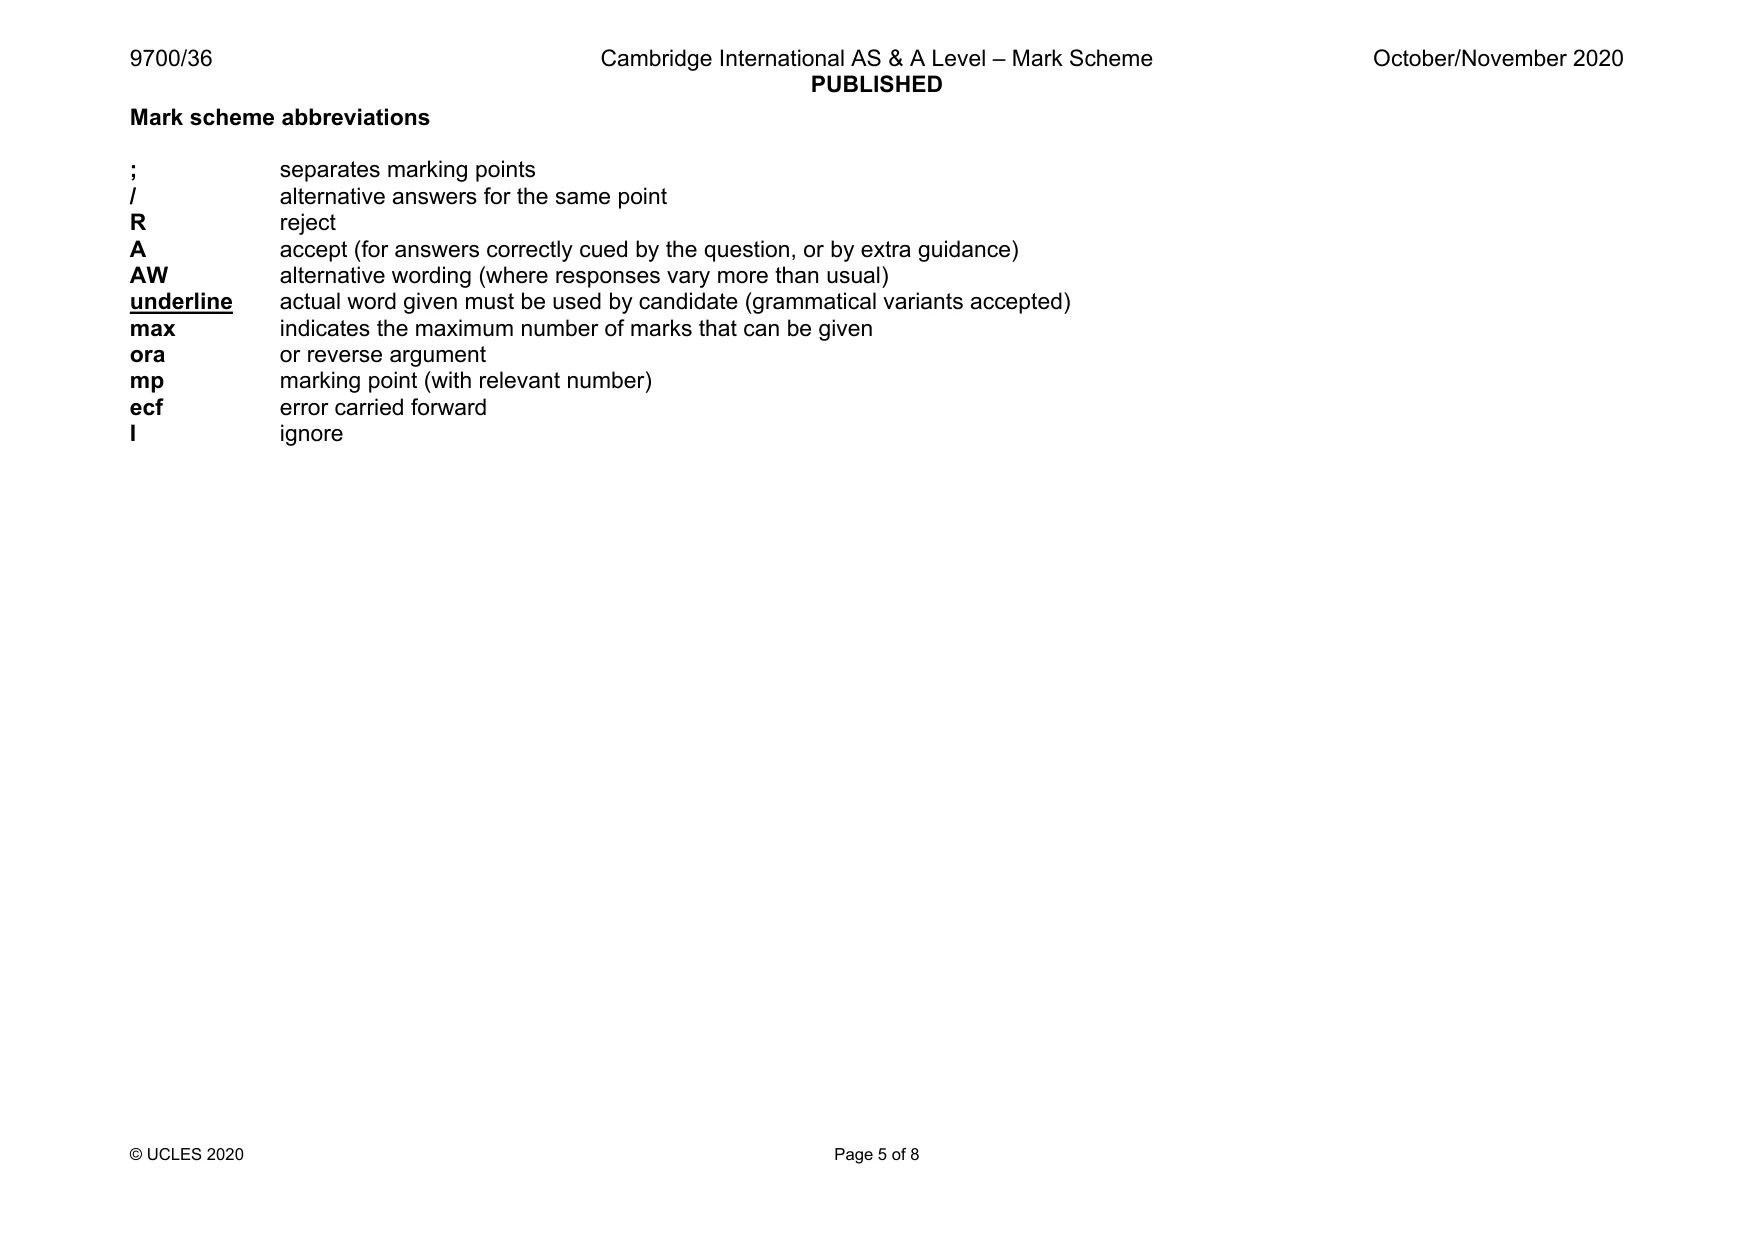
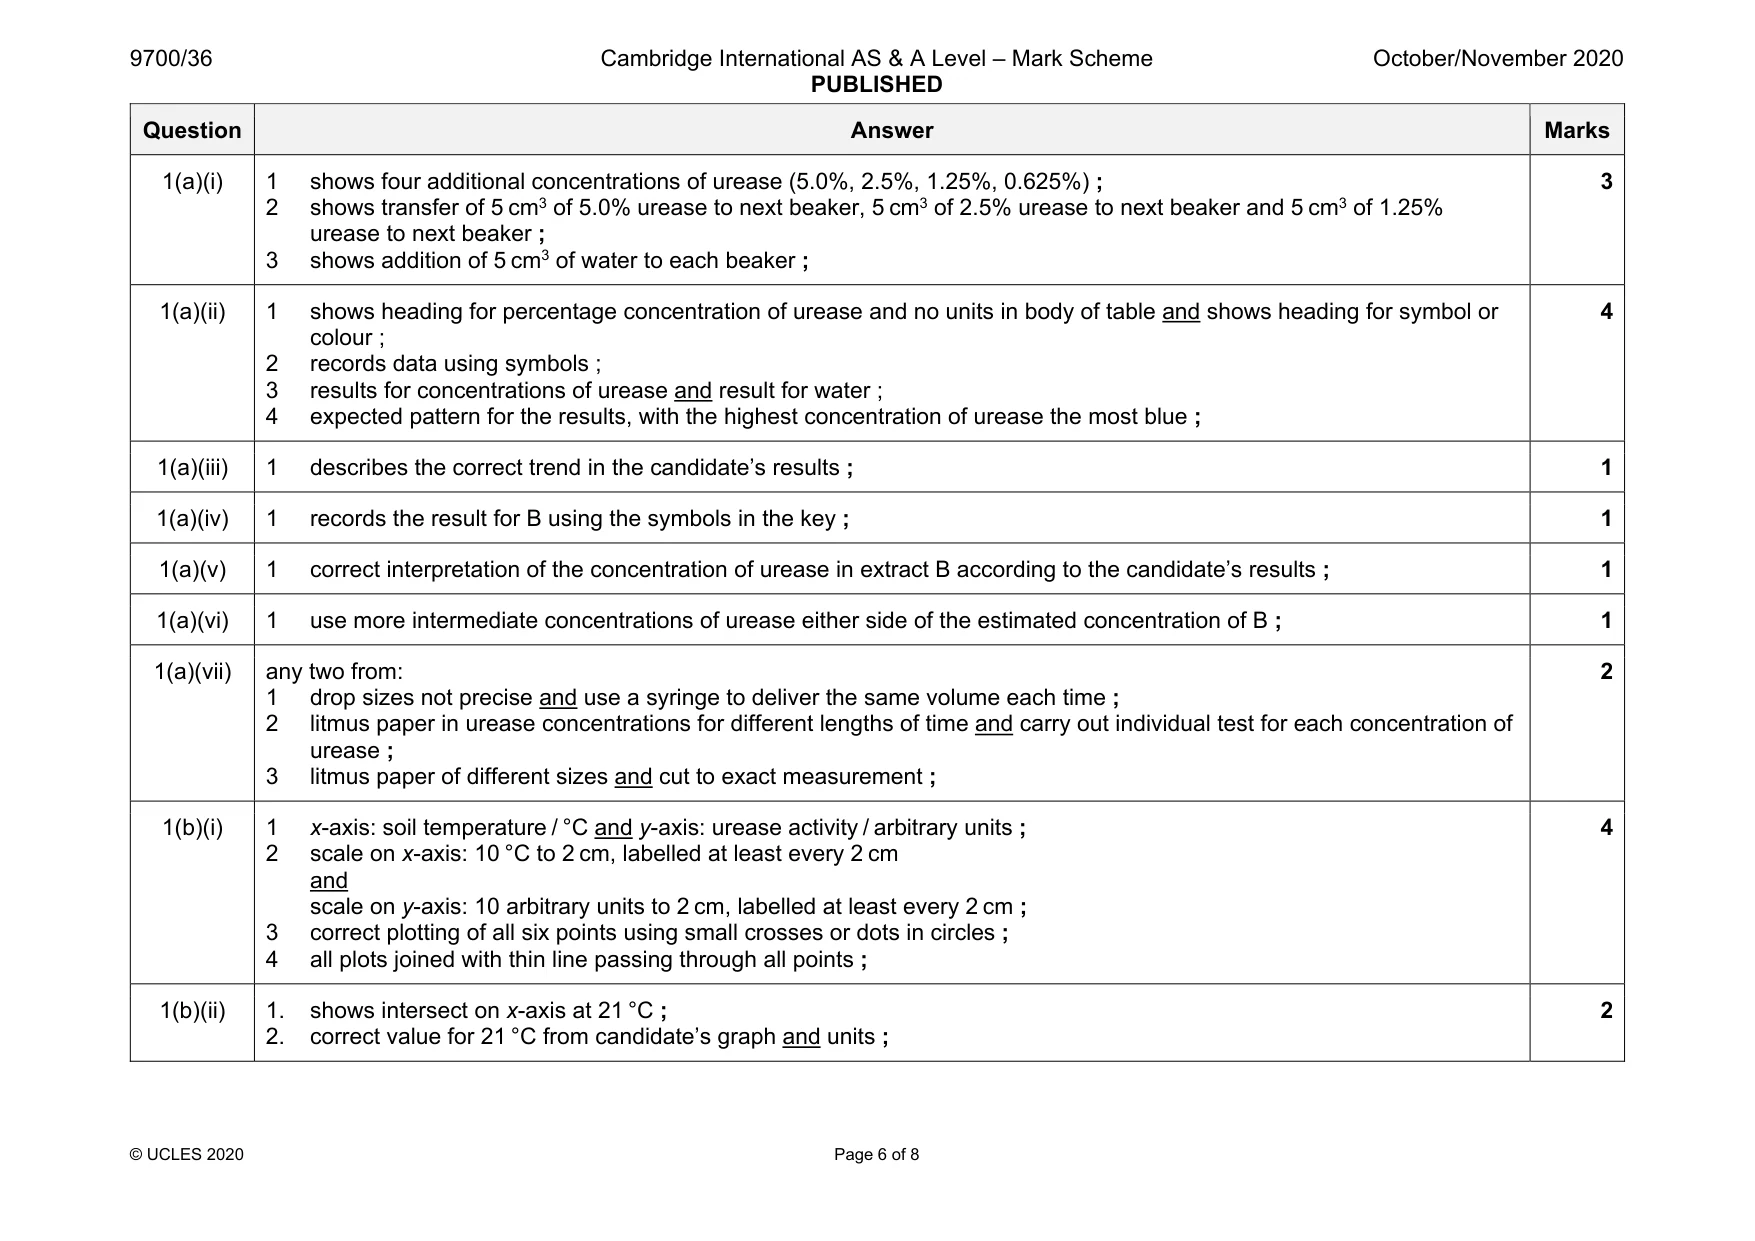
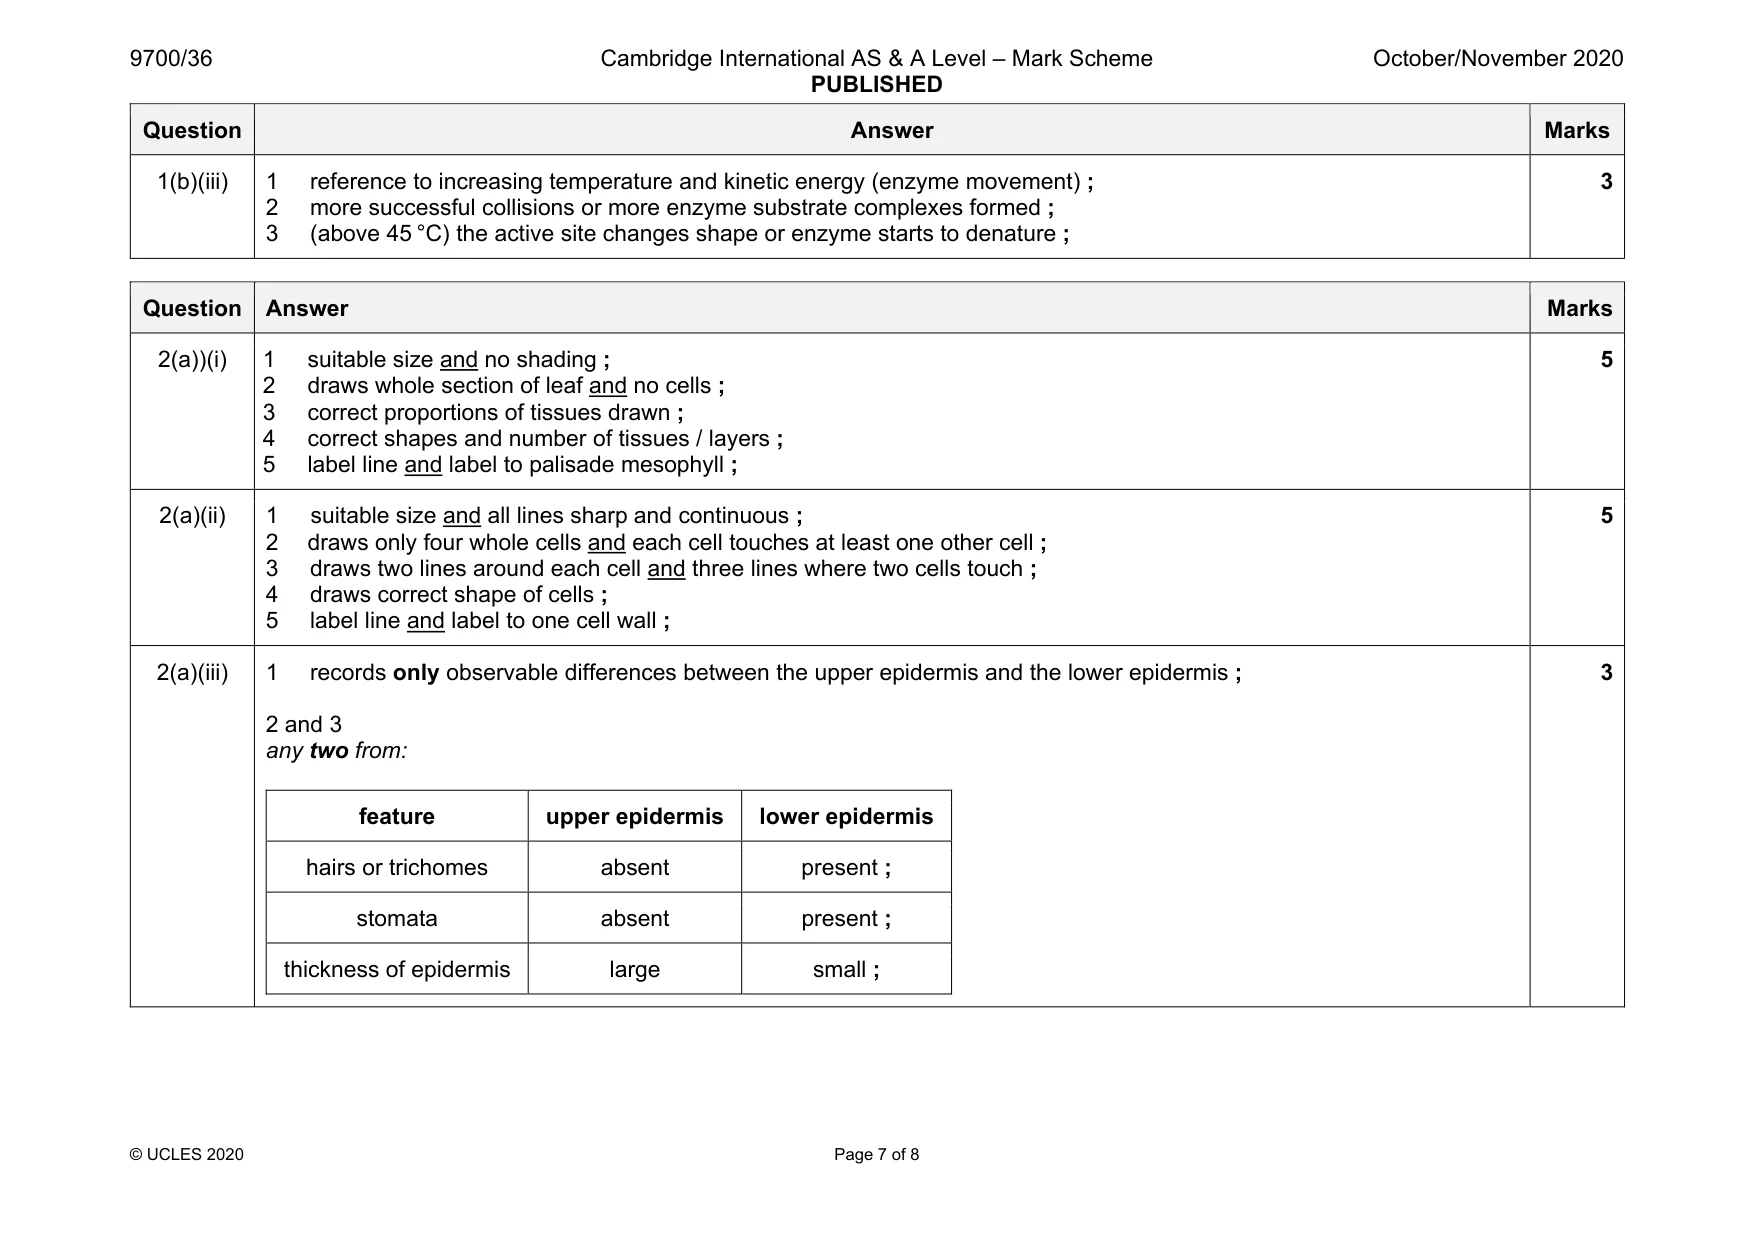
Mark scheme: 1(a)(i) 1 shows four additional concentrations of urease (5.0%, 2.5%, 1.25%, 0.625%) ; 2 shows transfer of 5 cm3 of 5.0% urease to next beaker, 5 cm3 of 2.5% urease to next beaker and 5 cm3 of 1.25% urease to next beaker ; 3 shows addition of 5 cm3 of water to each beaker ; 3 1(a)(ii) 1 shows heading for percentage concentration of urease and no units in body of table and shows heading for symbol or colour ; 2 records data using symbols ; 3 results for concentrations of urease and result for water ; 4 expected pattern for the results, with the highest concentration of urease the most blue ; 4 1(a)(iii) 1 describes the correct trend in the candidate’s results ; 1 1(a)(iv) 1 records the result for B using the symbols in the key ; 1 1(a)(v) 1 correct interpretation of the concentration of urease in extract B according to the candidate’s results ; 1 1(a)(vi) 1 use more intermediate concentrations of urease either side of the estimated concentration of B ; 1 1(a)(vii) any two from: 1 drop sizes not precise and use a syringe to deliver the same volume each time ; 2 litmus paper in urease concentrations for different lengths of time and carry out individual test for each concentration of urease ; 3 litmus paper of different sizes and cut to exact measurement ; 2 1(b)(i) 1 x-axis: soil temperature / °C and y-axis: urease activity / arbitrary units ; 2 scale on x-axis: 10 °C to 2 cm, labelled at least every 2 cm and scale on y-axis: 10 arbitrary units to 2 cm, labelled at least every 2 cm ; 3 correct plotting of all six points using small crosses or dots in circles ; 4 all plots joined with thin line passing through all points ; 4 1(b)(ii) 1. shows intersect on x-axis at 21 °C ; 2. correct value for 21 °C from candidate’s graph and units ; 2 Question Answer Marks 1(b)(iii) 1 reference to increasing temperature and kinetic energy (enzyme movement) ; 2 more successful collisions or more enzyme substrate complexes formed ; 3 (above 45 °C) the active site changes shape or enzyme starts to denature ; 3 Question Answer Marks
Q2 · N1 is a slide of a stained transverse section through a plant leaf
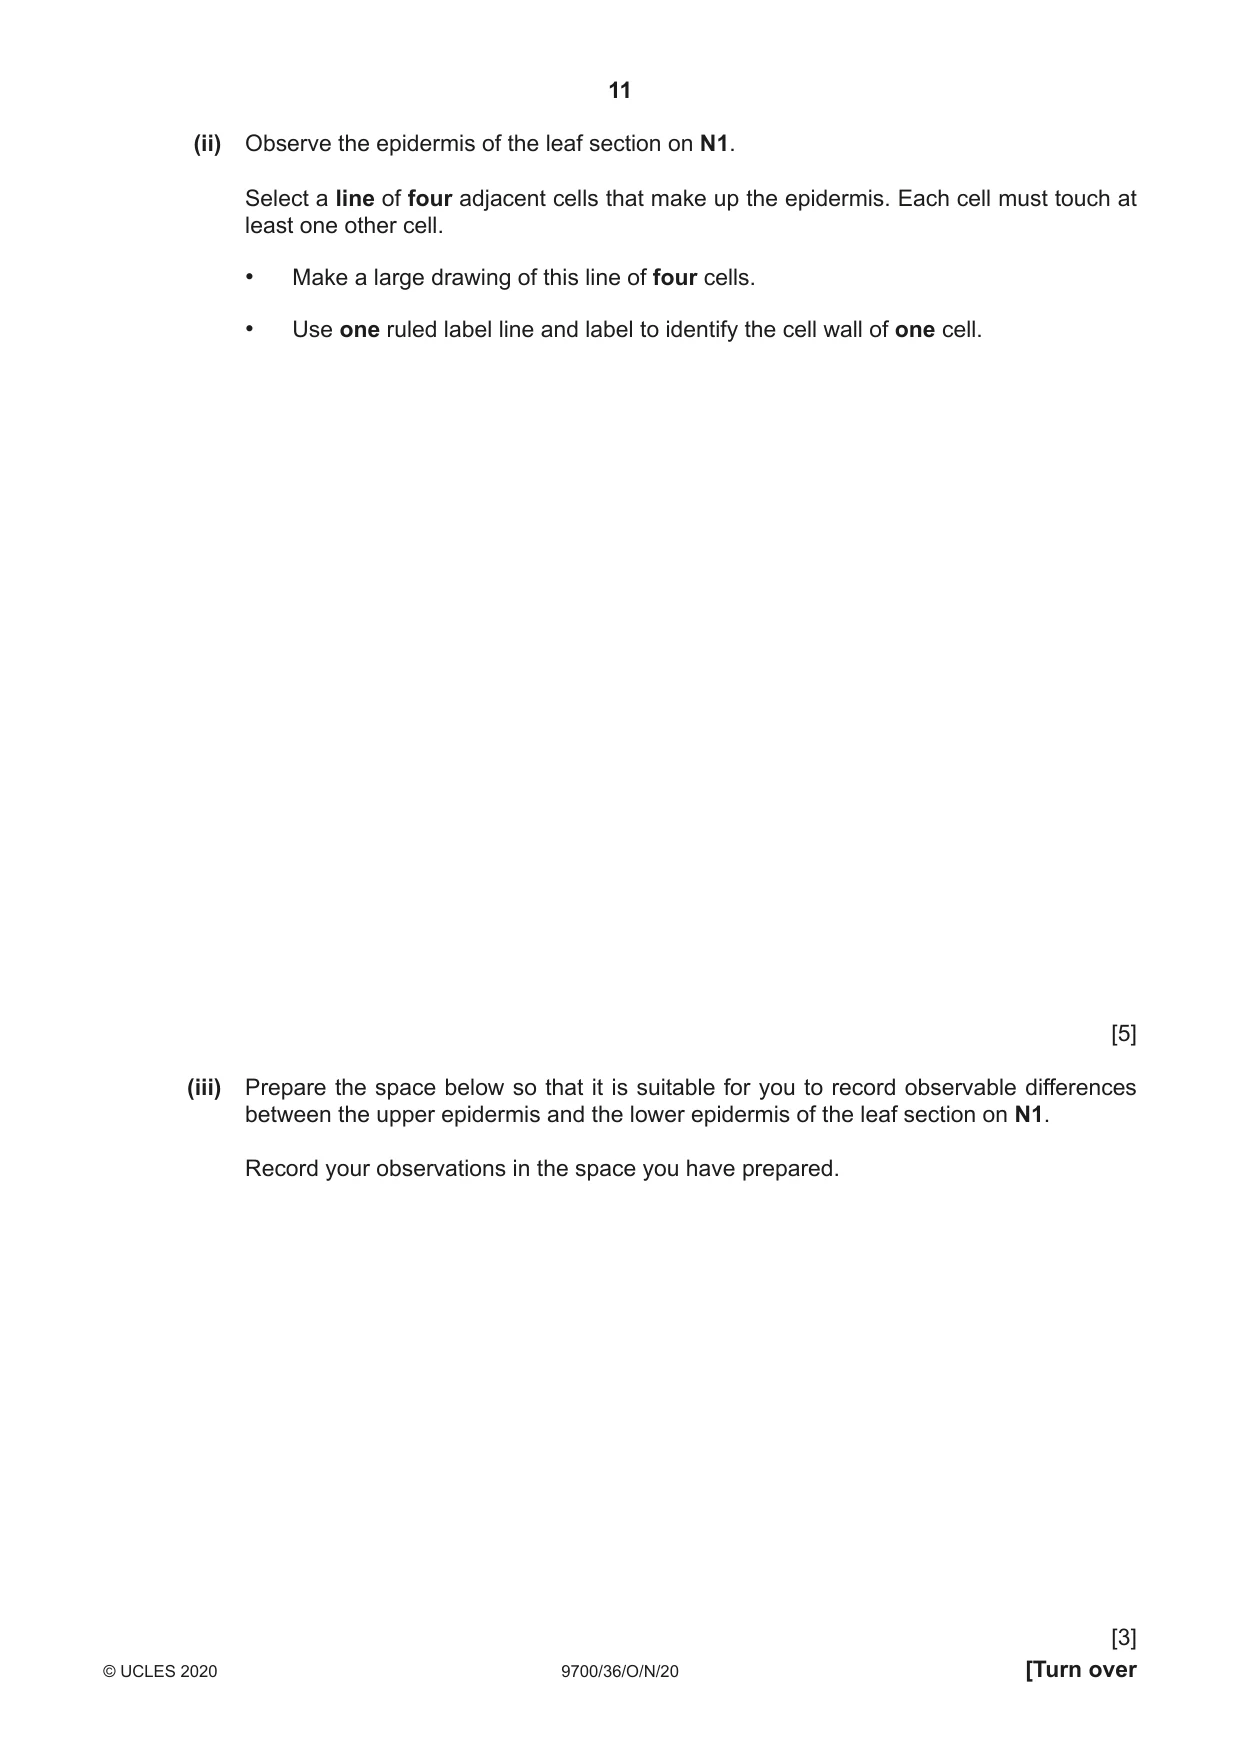
2 N1 is a slide of a stained transverse section through a plant leaf. You are not expected to be familiar with this specimen. Use a sharp pencil for drawing. You are expected to draw the correct shape and proportions of the different tissues. (a) (i) Draw a large plan diagram of the whole section of the leaf on N1. Use one ruled label line and label to identify the palisade mesophyll. [5] (ii) Observe the epidermis of the leaf section on N1. Select a line of four adjacent cells that make up the epidermis. Each cell must touch at least one other cell. • Make a large drawing of this line of four cells. • Use one ruled label line and label to identify the cell wall of one cell. [5] (iii) Prepare the space below so that it is suitable for you to record observable differences between the upper epidermis and the lower epidermis of the leaf section on N1. Record your observations in the space you have prepared. [3] (b) Fig. 2.1 is a photomicrograph of a stained transverse section through a leaf of a different type of plant. You are not expected to be familiar with this specimen. X Y scale bar 2.5 mm Fig. 2.1 Use the scale bar on Fig. 2.1 to calculate the actual depth of the leaf section indicated by line X–Y. Show your working and use appropriate units. actual depth = .......................................................... [5] [Total 18]
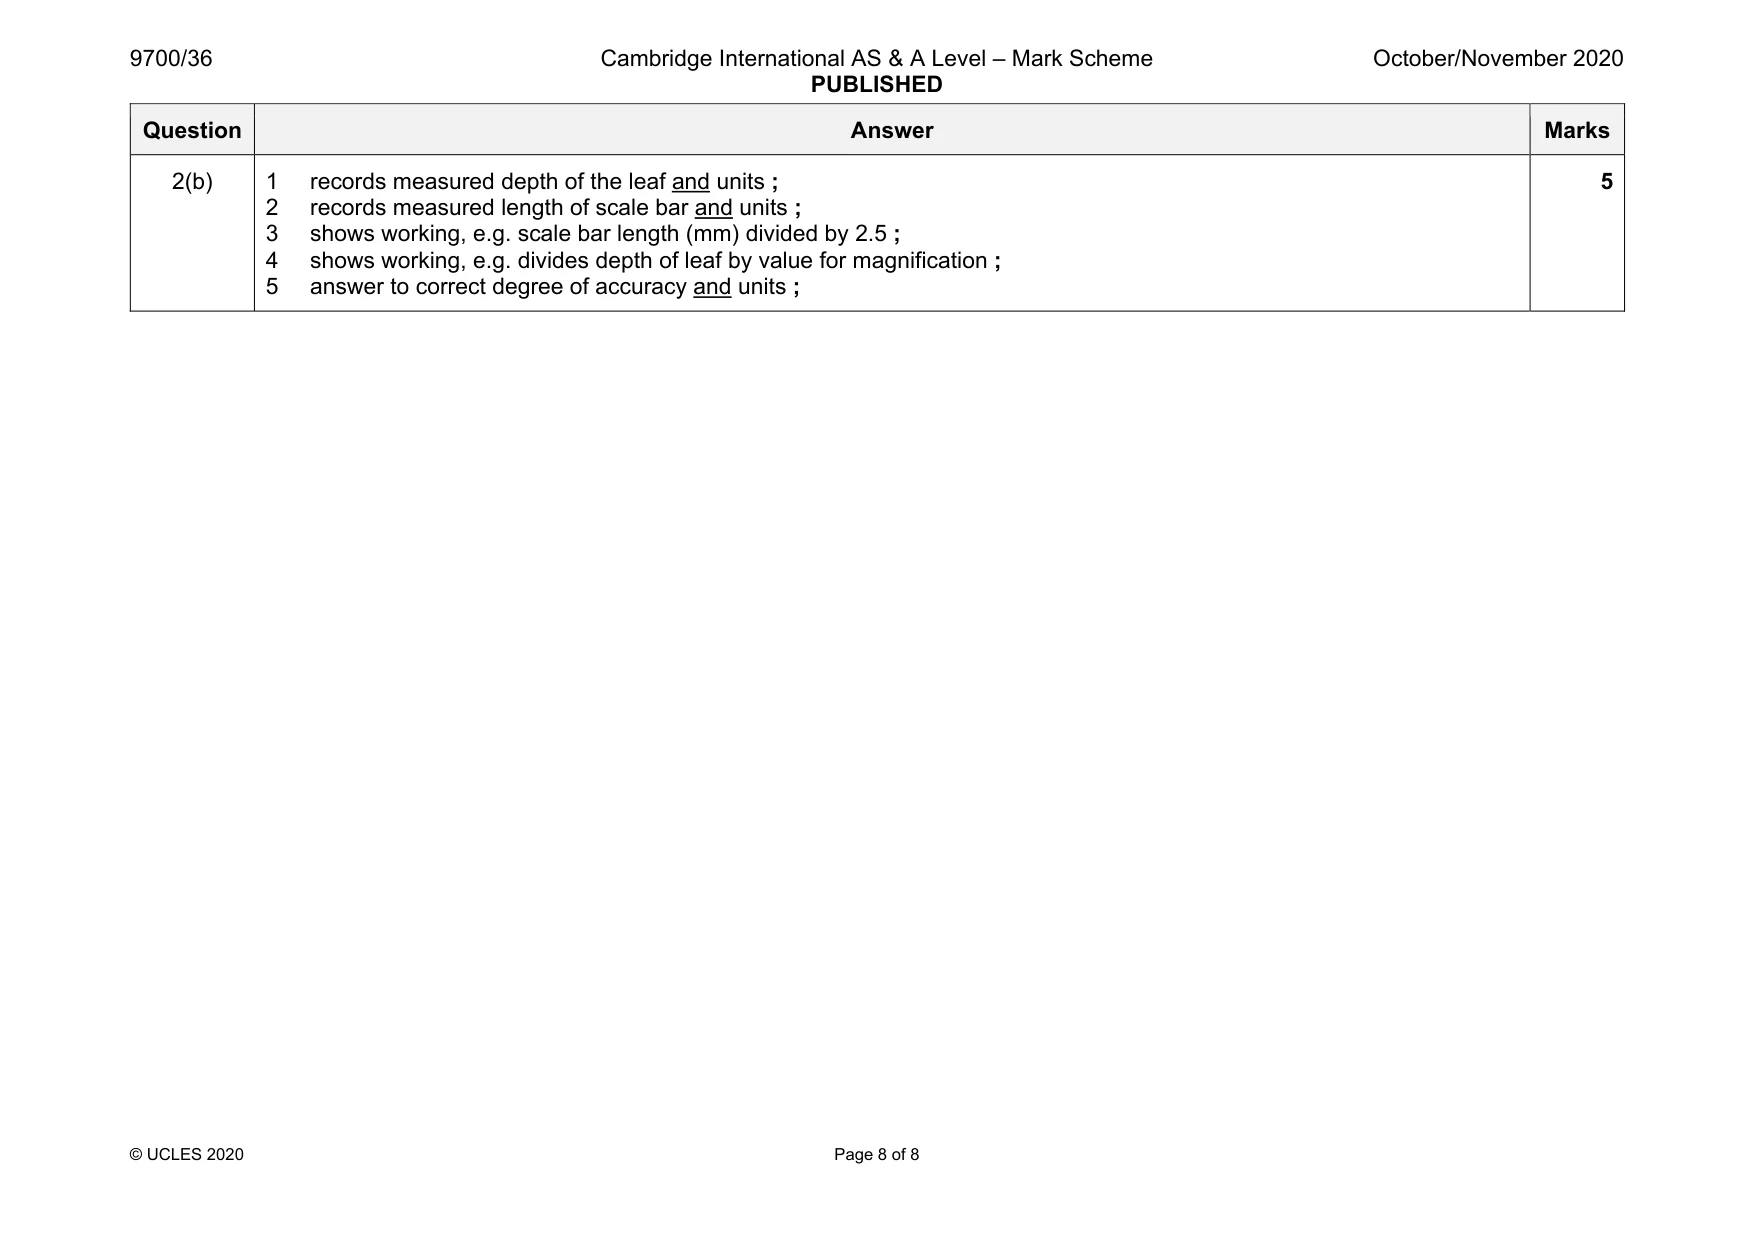
Mark scheme: 2(a))(i) 1 suitable size and no shading ; 2 draws whole section of leaf and no cells ; 3 correct proportions of tissues drawn ; 4 correct shapes and number of tissues / layers ; 5 label line and label to palisade mesophyll ; 5 2(a)(ii) 1 suitable size and all lines sharp and continuous ; 2 draws only four whole cells and each cell touches at least one other cell ; 3 draws two lines around each cell and three lines where two cells touch ; 4 draws correct shape of cells ; 5 label line and label to one cell wall ; 5 2(a)(iii) 1 records only observable differences between the upper epidermis and the lower epidermis ; 2 and 3 any two from: feature upper epidermis lower epidermis hairs or trichomes absent present ; stomata absent present ; thickness of epidermis large small ; 3 Question Answer Marks 2(b) 1 records measured depth of the leaf and units ; 2 records measured length of scale bar and units ; 3 shows working, e.g. scale bar length (mm) divided by 2.5 ; 4 shows working, e.g. divides depth of leaf by value for magnification ; 5 answer to correct degree of accuracy and units ; 5
More questions on Cells as the basic units of living organisms
What was in this paper
The subtopics covered by these 2 questions, and how many questions each got. Open one in a new tab to see every Cambridge question on it.
What you needed in this session
Cambridge’s own grade thresholds for 2020 Oct/Nov, Paper 3 · Variant 6. A higher threshold means an easier paper — the bar moves with how the cohort did.