Cambridge A Level Biology 9700 — 2023 Oct/Nov Paper 3 · Variant 6
9700/36/O/N/23 · 2 questions · 40 marks · ≈45 min
The question paper and its mark scheme, free to read here and free to download. This is Cambridge’s own paper, exactly as it was sat.
Question paper16 pages

Mark scheme6 pages
Answers below. Sit the paper first if you are practising.
Questions as text
Q1 · Agar stained with universal indicator can be used to investigate diffusion
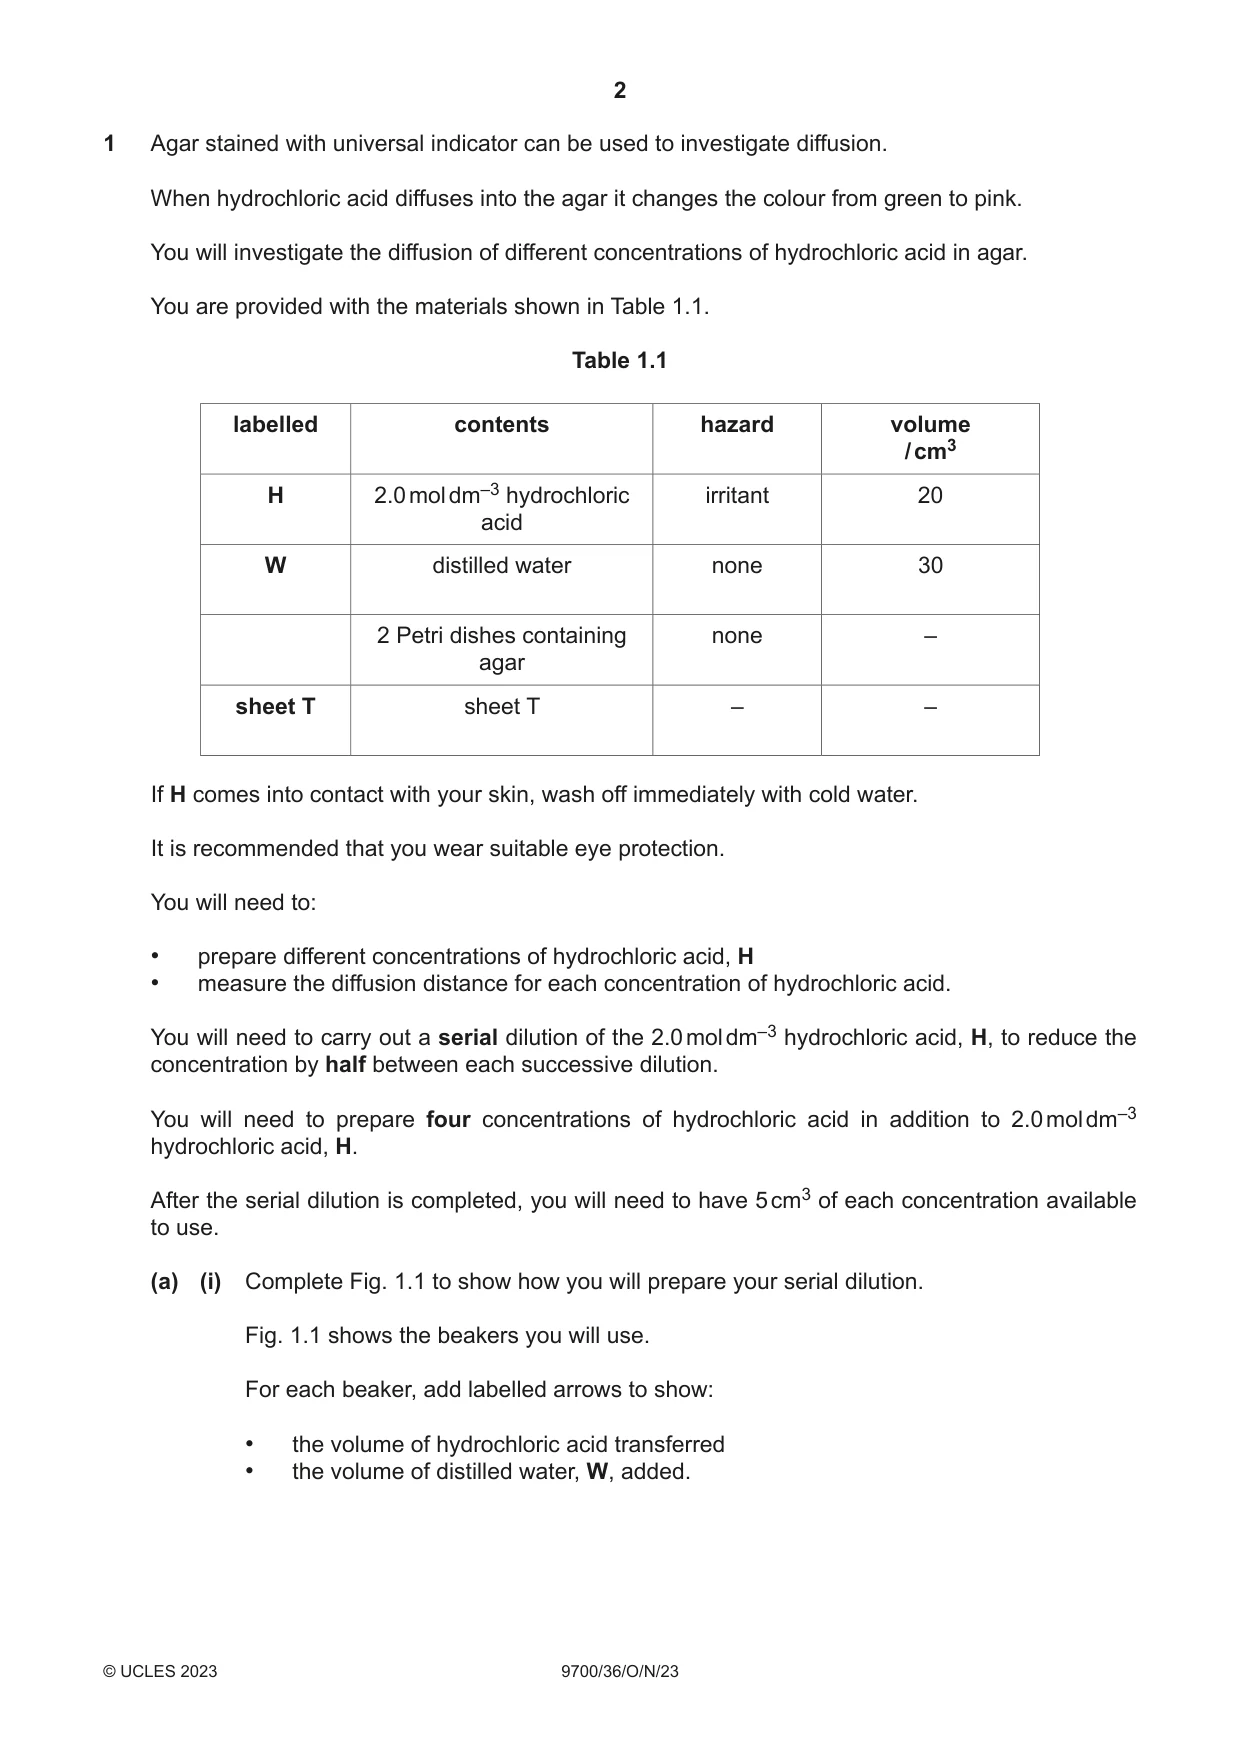
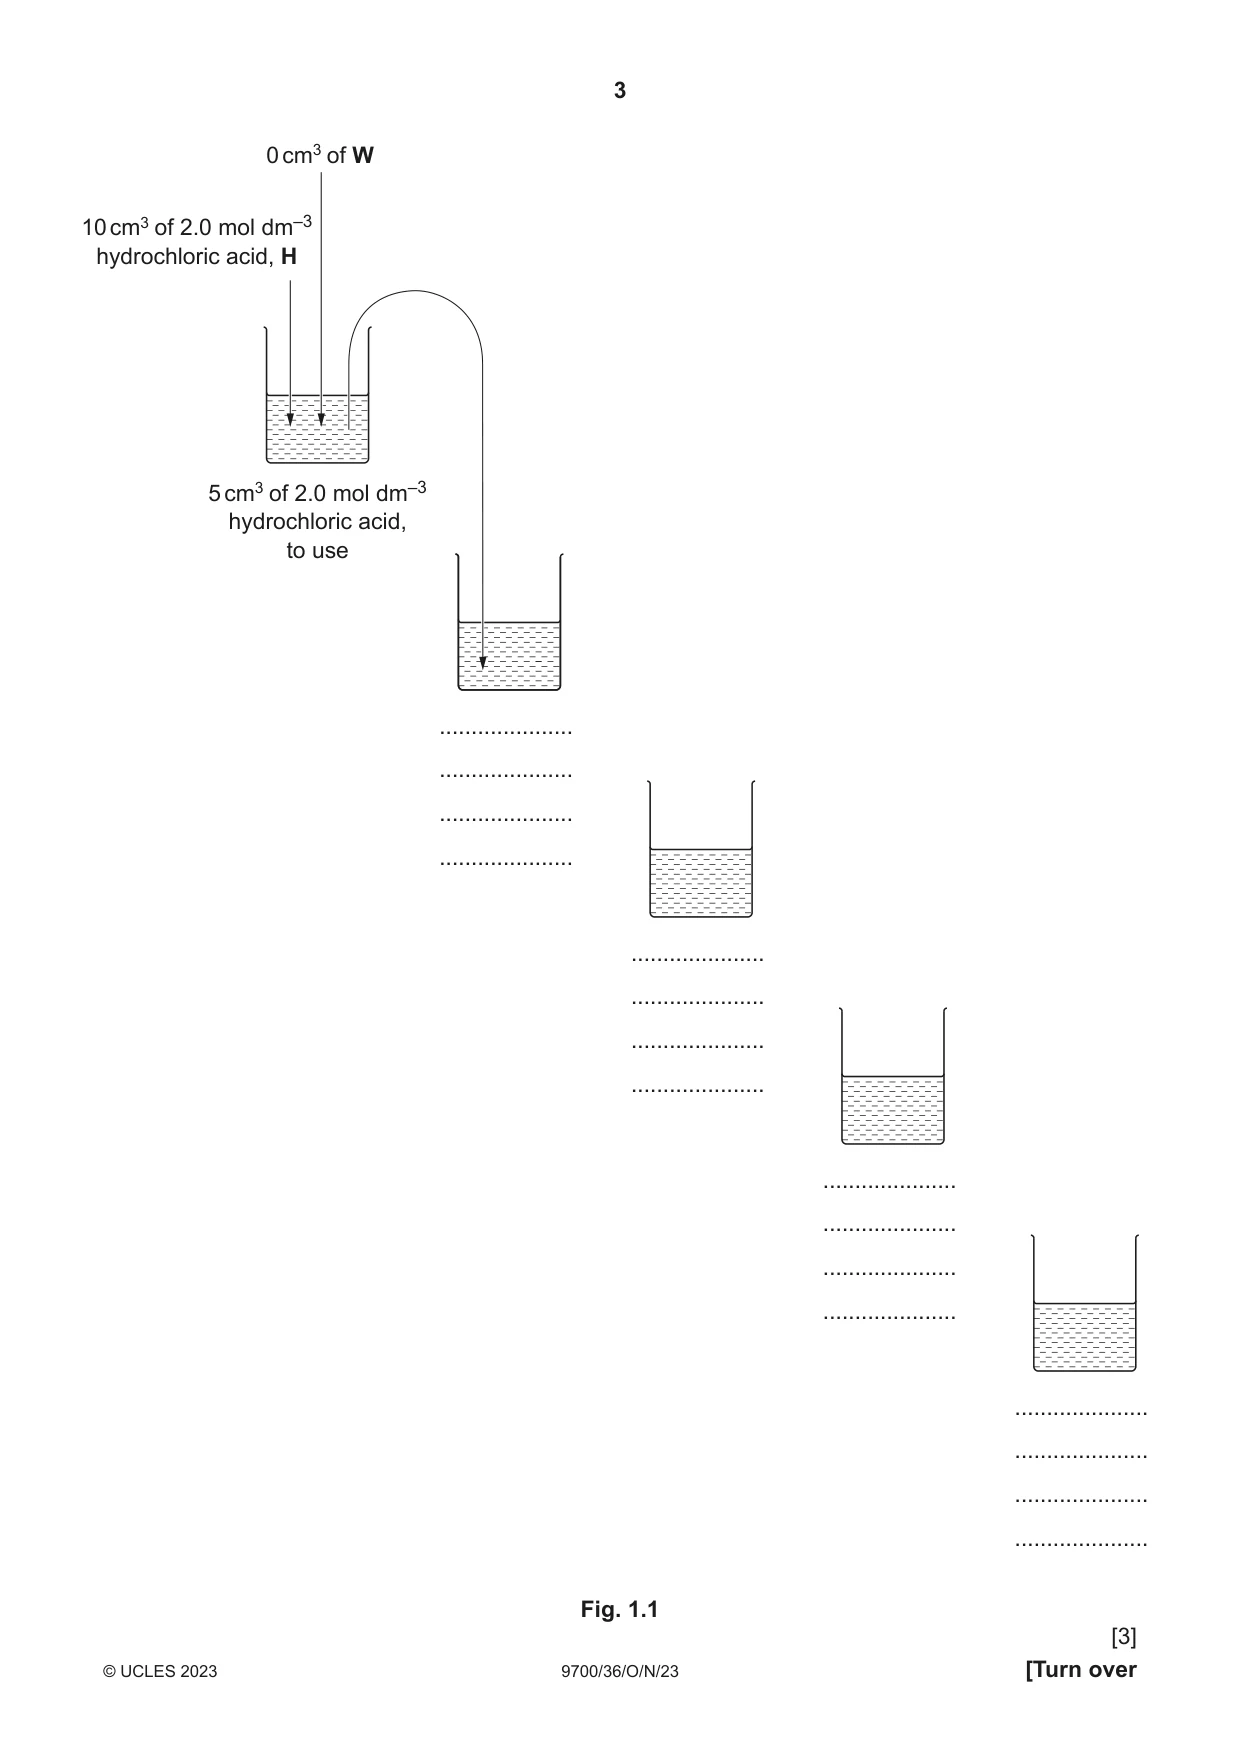
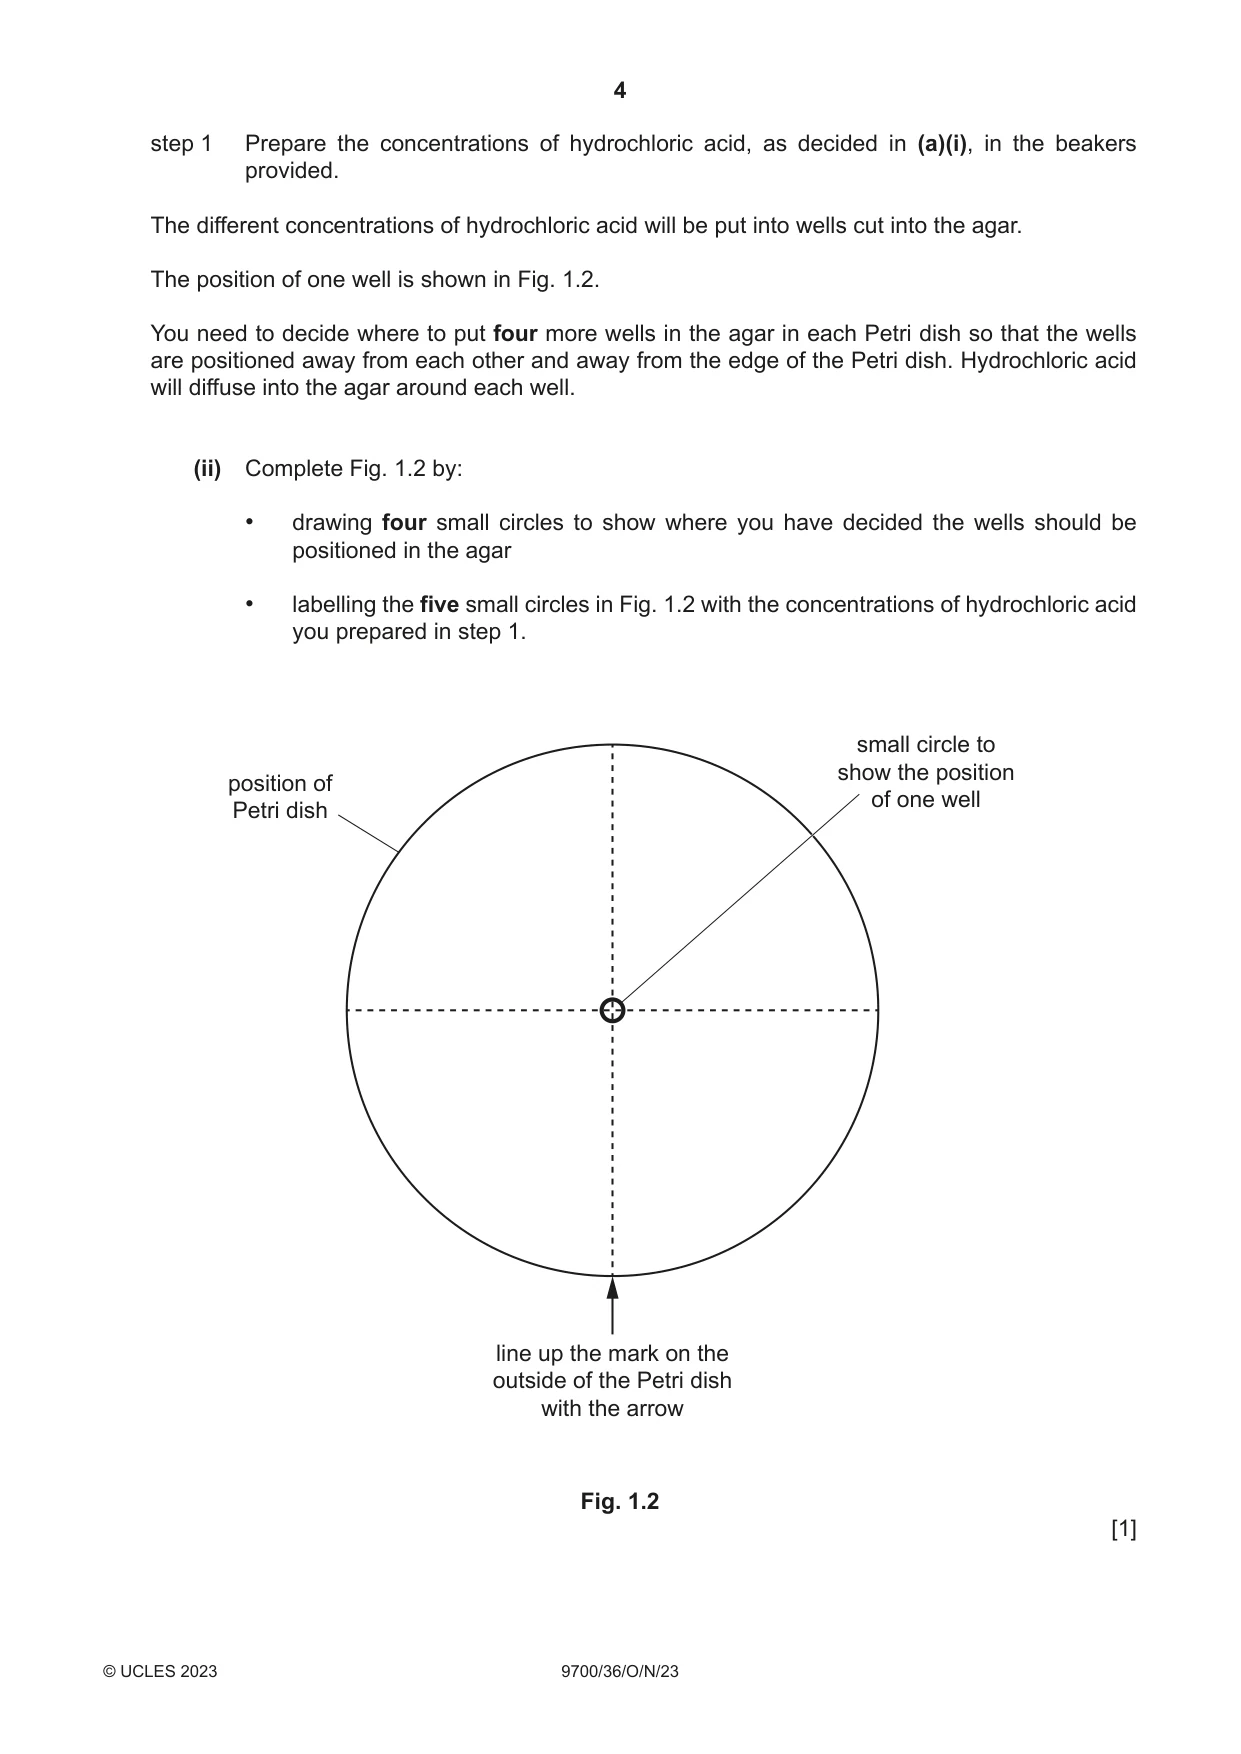
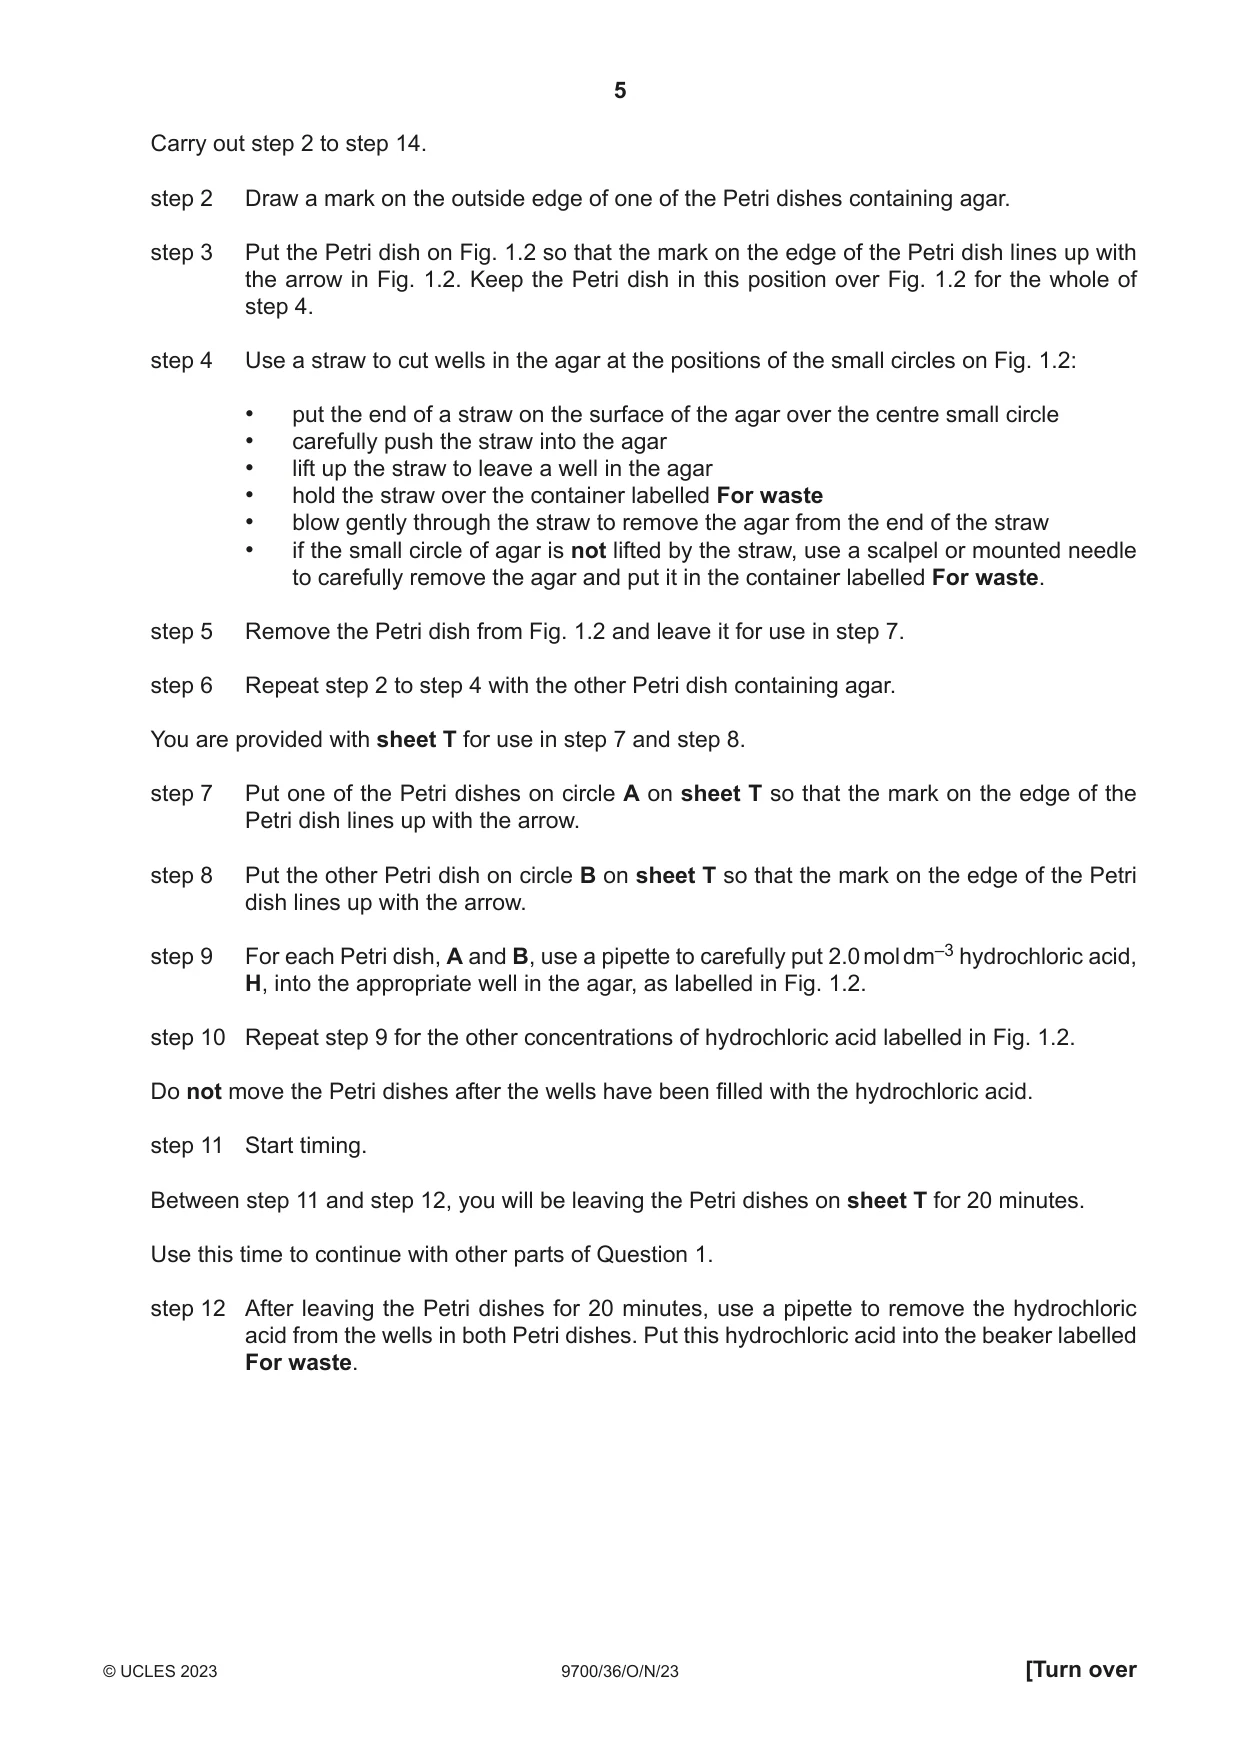
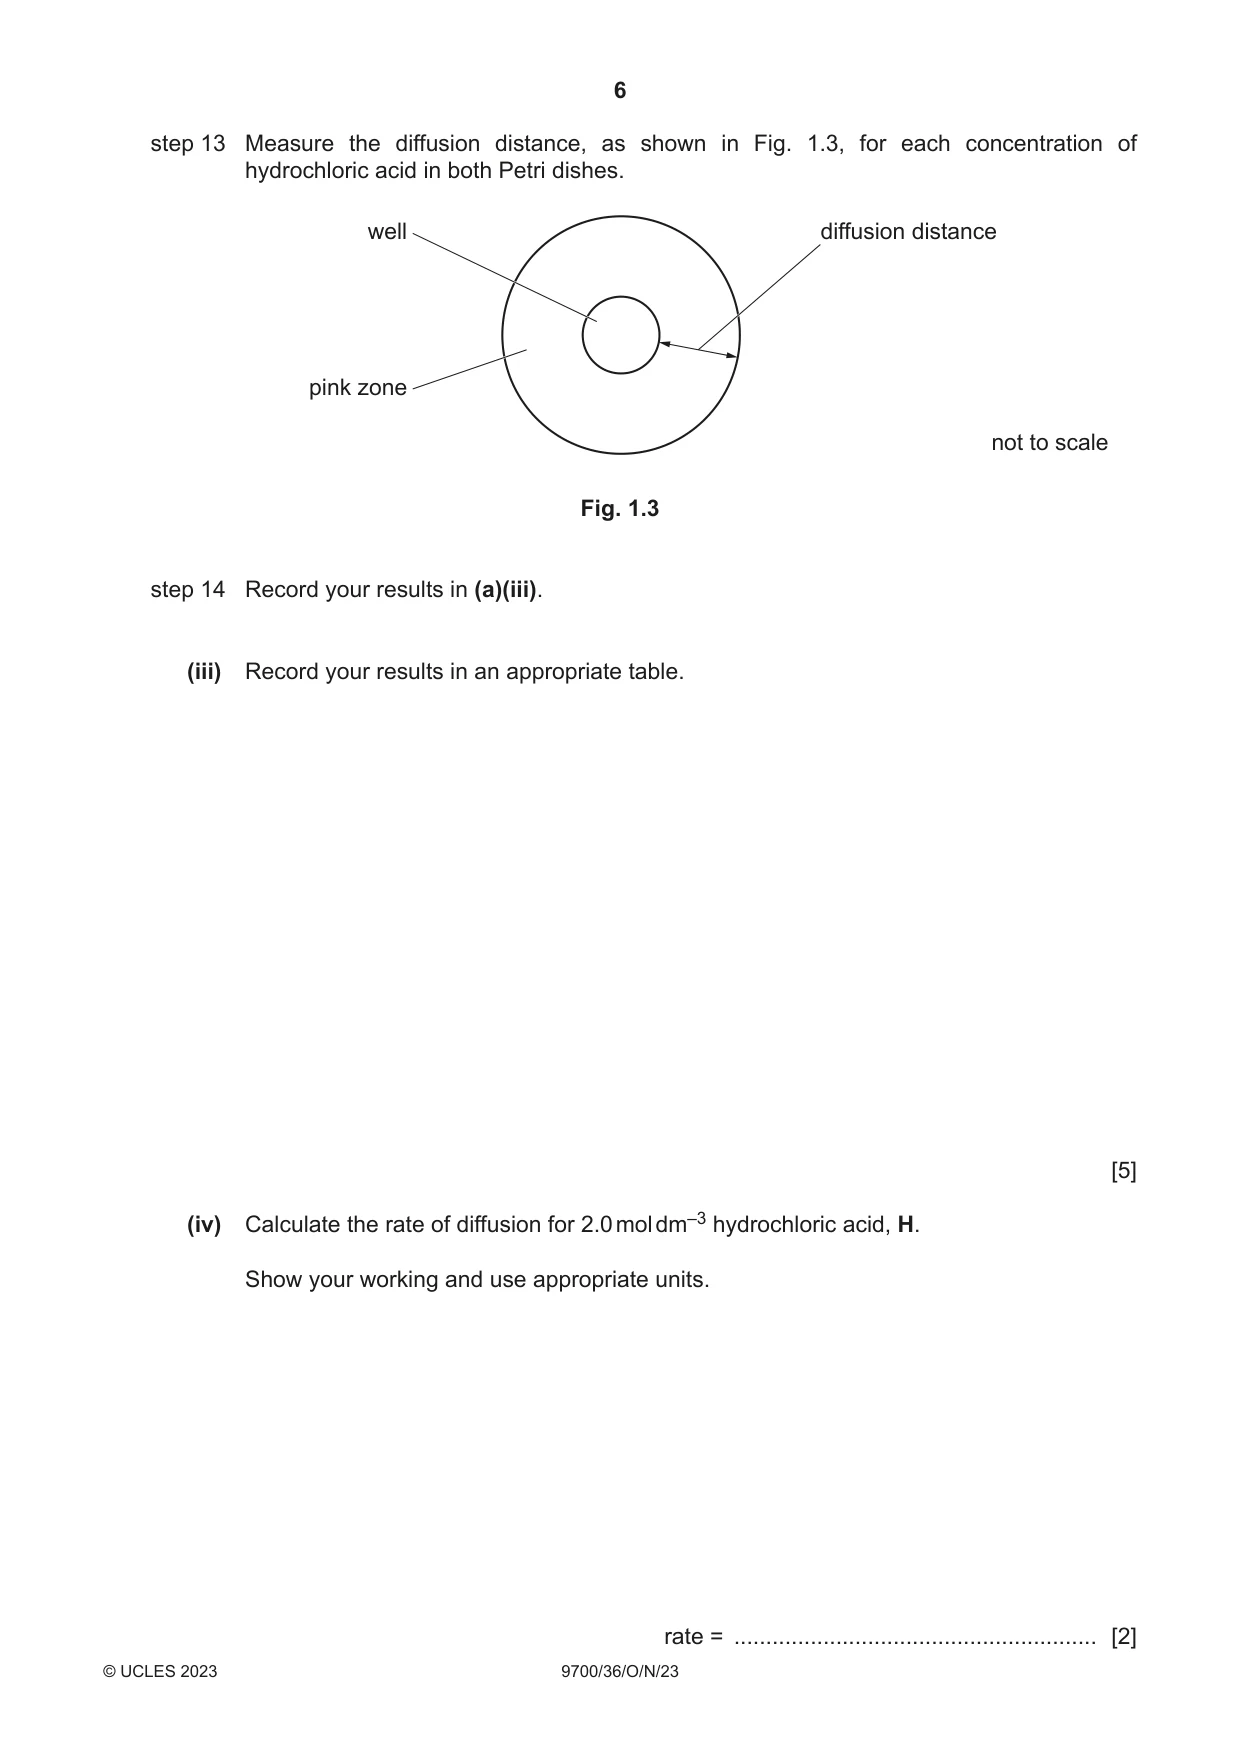
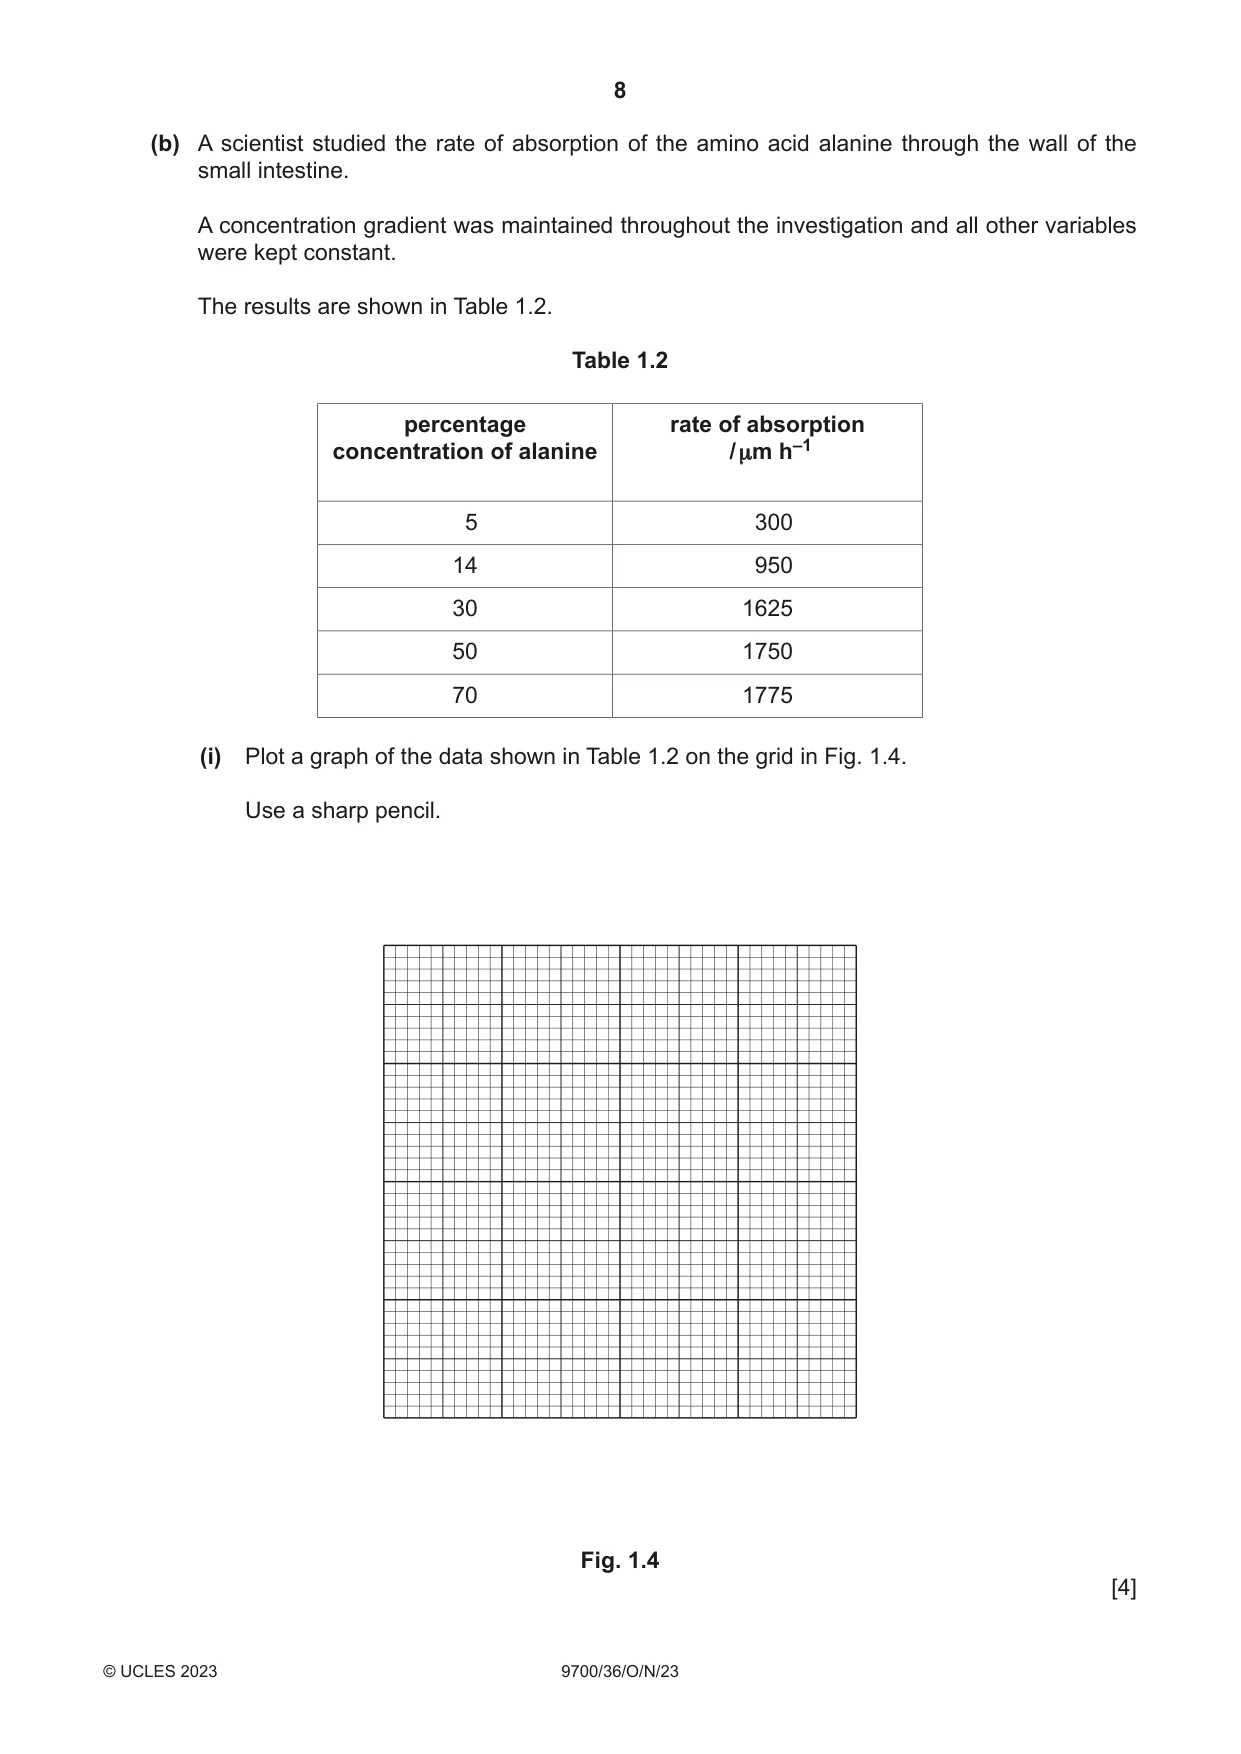
1 Agar stained with universal indicator can be used to investigate diffusion. When hydrochloric acid diffuses into the agar it changes the colour from green to pink. You will investigate the diffusion of different concentrations of hydrochloric acid in agar. You are provided with the materials shown in Table 1.1. Table 1.1 labelled contents hazard volume / cm3 H 2.0 mol dm–3 hydrochloric irritant 20 acid W distilled water none 30 2 Petri dishes containing none – agar sheet T sheet T – – If H comes into contact with your skin, wash off immediately with cold water. It is recommended that you wear suitable eye protection. You will need to: • prepare different concentrations of hydrochloric acid, H • measure the diffusion distance for each concentration of hydrochloric acid. You will need to carry out a serial dilution of the 2.0 mol dm–3 hydrochloric acid, H, to reduce the concentration by half between each successive dilution. You will need to prepare four concentrations of hydrochloric acid in addition to 2.0 mol dm–3 hydrochloric acid, H. After the serial dilution is completed, you will need to have 5 cm3 of each concentration available to use. (a) (i) Complete Fig. 1.1 to show how you will prepare your serial dilution. Fig. 1.1 shows the beakers you will use. For each beaker, add labelled arrows to show: • the volume of hydrochloric acid transferred • the volume of distilled water, W, added. 0 cm3 of W 10 cm3 of 2.0 mol dm–3 hydrochloric acid, H 5 cm3 of 2.0 mol dm–3 hydrochloric acid, to use ..................... ..................... ..................... ..................... ..................... ..................... ..................... ..................... ..................... ..................... ..................... ..................... ..................... ..................... ..................... ..................... Fig. 1.1 [3] step 1 Prepare the concentrations of hydrochloric acid, as decided in (a)(i), in the beakers provided. The different concentrations of hydrochloric acid will be put into wells cut into the agar. The position of one well is shown in Fig. 1.2. You need to decide where to put four more wells in the agar in each Petri dish so that the wells are positioned away from each other and away from the edge of the Petri dish. Hydrochloric acid will diffuse into the agar around each well. (ii) Complete Fig. 1.2 by: • drawing four small circles to show where you have decided the wells should be positioned in the agar • labelling the five small circles in Fig. 1.2 with the concentrations of hydrochloric acid you prepared in step 1. small circle to show the position position of of one well Petri dish line up the mark on the outside of the Petri dish with the arrow Fig. 1.2 [1] Carry out step 2 to step 14. step 2 Draw a mark on the outside edge of one of the Petri dishes containing agar. step 3 Put the Petri dish on Fig. 1.2 so that the mark on the edge of the Petri dish lines up with the arrow in Fig. 1.2. Keep the Petri dish in this position over Fig. 1.2 for the whole of step 4. step 4 Use a straw to cut wells in the agar at the positions of the small circles on Fig. 1.2: • put the end of a straw on the surface of the agar over the centre small circle • carefully push the straw into the agar • lift up the straw to leave a well in the agar • hold the straw over the container labelled For waste • blow gently through the straw to remove the agar from the end of the straw • if the small circle of agar is not lifted by the straw, use a scalpel or mounted needle to carefully remove the agar and put it in the container labelled For waste. step 5 Remove the Petri dish from Fig. 1.2 and leave it for use in step 7. step 6 Repeat step 2 to step 4 with the other Petri dish containing agar. You are provided with sheet T for use in step 7 and step 8. step 7 Put one of the Petri dishes on circle A on sheet T so that the mark on the edge of the Petri dish lines up with the arrow. step 8 Put the other Petri dish on circle B on sheet T so that the mark on the edge of the Petri dish lines up with the arrow. step 9 For each Petri dish, A and B, use a pipette to carefully put 2.0 mol dm–3 hydrochloric acid, H, into the appropriate well in the agar, as labelled in Fig. 1.2. step 10 Repeat step 9 for the other concentrations of hydrochloric acid labelled in Fig. 1.2. Do not move the Petri dishes after the wells have been filled with the hydrochloric acid. step 11 Start timing. Between step 11 and step 12, you will be leaving the Petri dishes on sheet T for 20 minutes. Use this time to continue with other parts of Question 1. step 12 After leaving the Petri dishes for 20 minutes, use a pipette to remove the hydrochloric acid from the wells in both Petri dishes. Put this hydrochloric acid into the beaker labelled For waste. step 13 Measure the diffusion distance, as shown in Fig. 1.3, for each concentration of hydrochloric acid in both Petri dishes. well diffusion distance pink zone not to scale Fig. 1.3 step 14 Record your results in (a)(iii). (iii) Record your results in an appropriate table. [5] (iv) Calculate the rate of diffusion for 2.0 mol dm–3 hydrochloric acid, H. Show your working and use appropriate units. rate = ......................................................... [2] (v) A student observed that the rate of diffusion was not constant during the investigation. Suggest how the student could modify the procedure to investigate the change in the rate of diffusion. ........................................................................................................................................... ........................................................................................................................................... ........................................................................................................................................... ........................................................................................................................................... ........................................................................................................................................... ..................................................................................................................................... [3] (b) A scientist studied the rate of absorption of the amino acid alanine through the wall of the small intestine. A concentration gradient was maintained throughout the investigation and all other variables were kept constant. The results are shown in Table 1.2. Table 1.2 percentage rate of absorption concentration of alanine / µm h–1 5 300 14 950 30 1625 50 1750 70 1775 (i) Plot a graph of the data shown in Table 1.2 on the grid in Fig. 1.4. Use a sharp pencil. Fig. 1.4 [4] (ii) Amino acids are transported into cells by facilitated diffusion. Explain the shape of your graph in Fig. 1.4. ........................................................................................................................................... ........................................................................................................................................... ........................................................................................................................................... ........................................................................................................................................... ........................................................................................................................................... ........................................................................................................................................... ..................................................................................................................................... [3] [Total: 21]
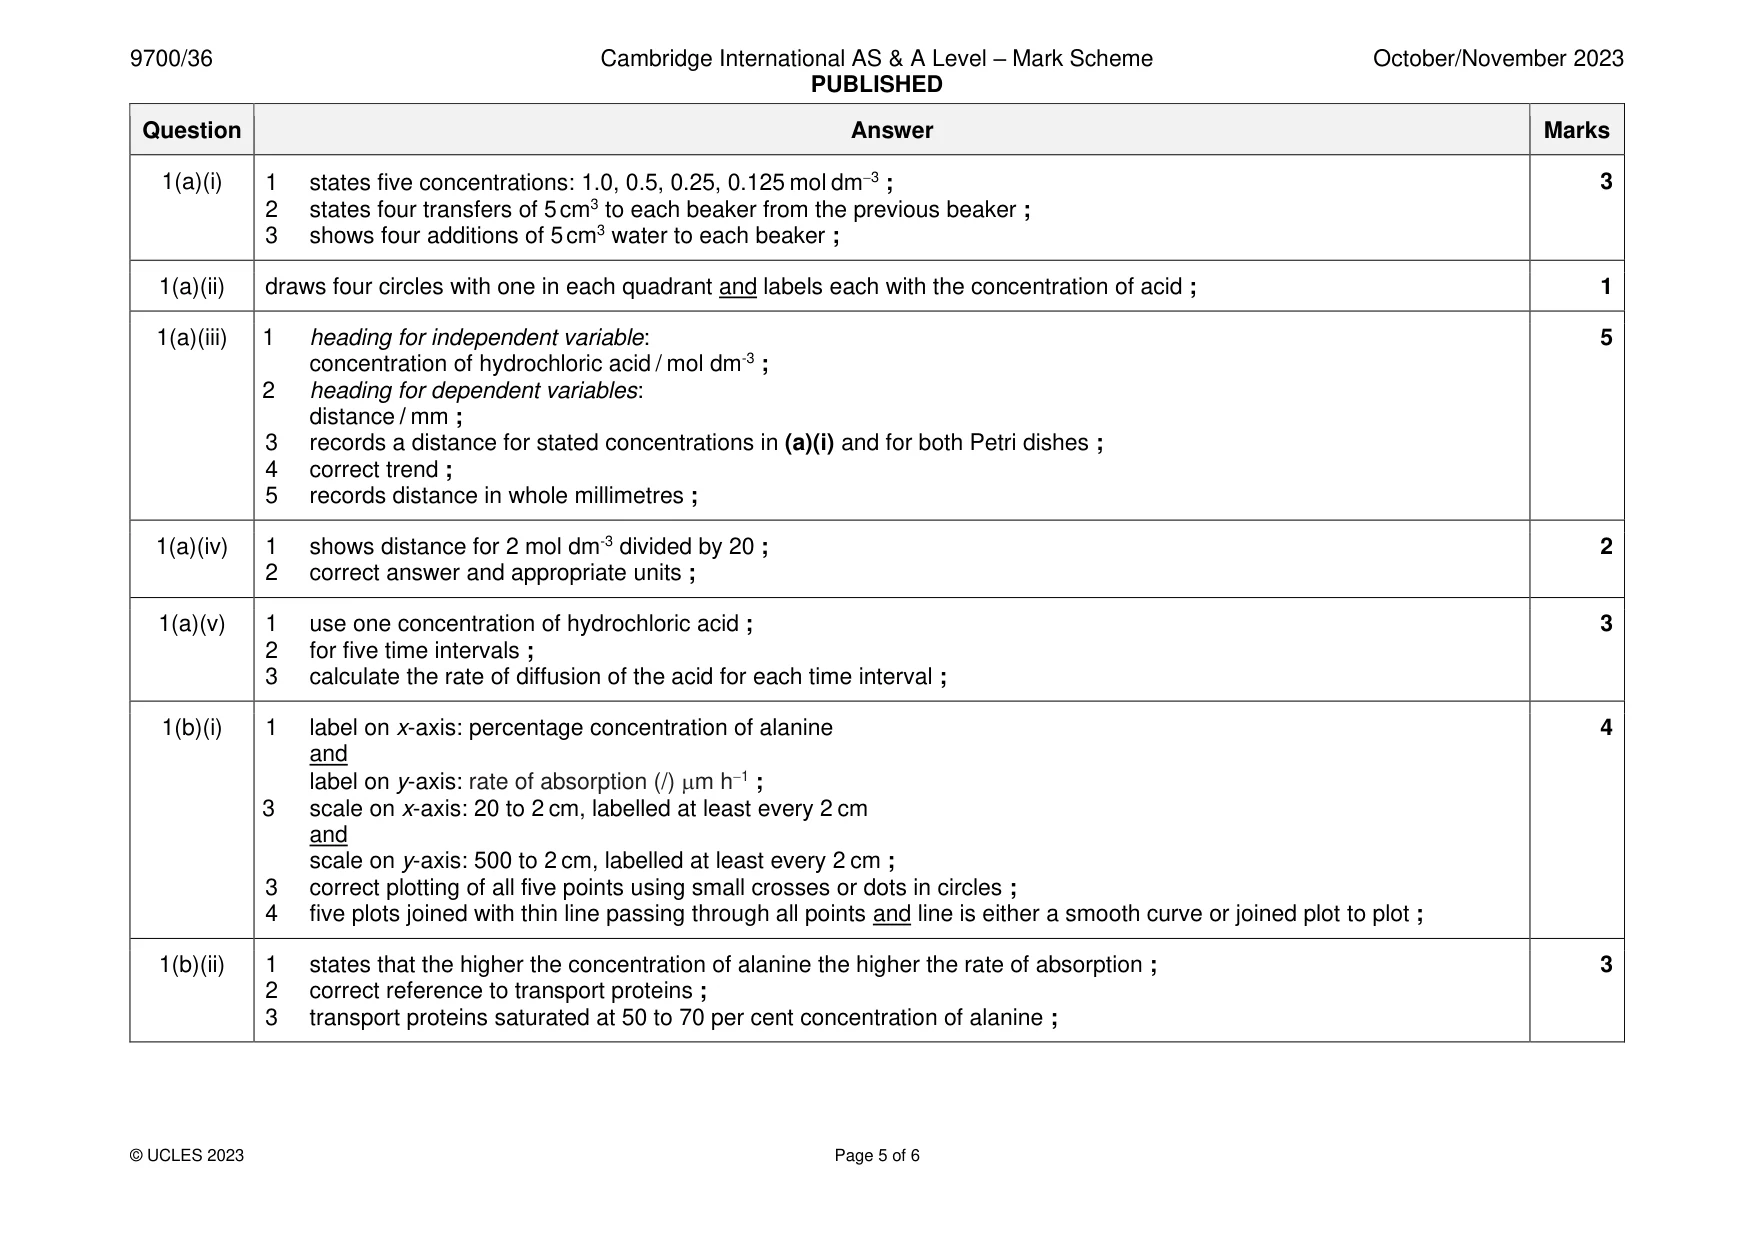
Mark scheme: Question Answer Marks 1(a)(i) 1 states five concentrations: 1.0, 0.5, 0.25, 0.125 mol dm−3 ; 3 2 states four transfers of 5 cm3 to each beaker from the previous beaker ; 3 shows four additions of 5 cm3 water to each beaker ; 1(a)(ii) draws four circles with one in each quadrant and labels each with the concentration of acid ; 1 1(a)(iii) 1 heading for independent variable: 5 concentration of hydrochloric acid / mol dm-3 ; 2 heading for dependent variables: distance / mm ; 3 records a distance for stated concentrations in (a)(i) and for both Petri dishes ; 4 correct trend ; 5 records distance in whole millimetres ; 1(a)(iv) 1 shows distance for 2 mol dm-3 divided by 20 ; 2 2 correct answer and appropriate units ; 1(a)(v) 1 use one concentration of hydrochloric acid ; 3 2 for five time intervals ; 3 calculate the rate of diffusion of the acid for each time interval ; 1(b)(i) 1 label on x-axis: percentage concentration of alanine 4 and label on y-axis: rate of absorption (/) m h−1 ; 3 scale on x-axis: 20 to 2 cm, labelled at least every 2 cm and scale on y-axis: 500 to 2 cm, labelled at least every 2 cm ; 3 correct plotting of all five points using small crosses or dots in circles ; 4 five plots joined with thin line passing through all points and line is either a smooth curve or joined plot to plot ; 1(b)(ii) 1 states that the higher the concentration of alanine the higher the rate of absorption ; 3 2 correct reference to transport proteins ; 3 transport proteins saturated at 50 to 70 per cent concentration of alanine ;
Q2 · N1 is a slide of a stained transverse section through a plant stem
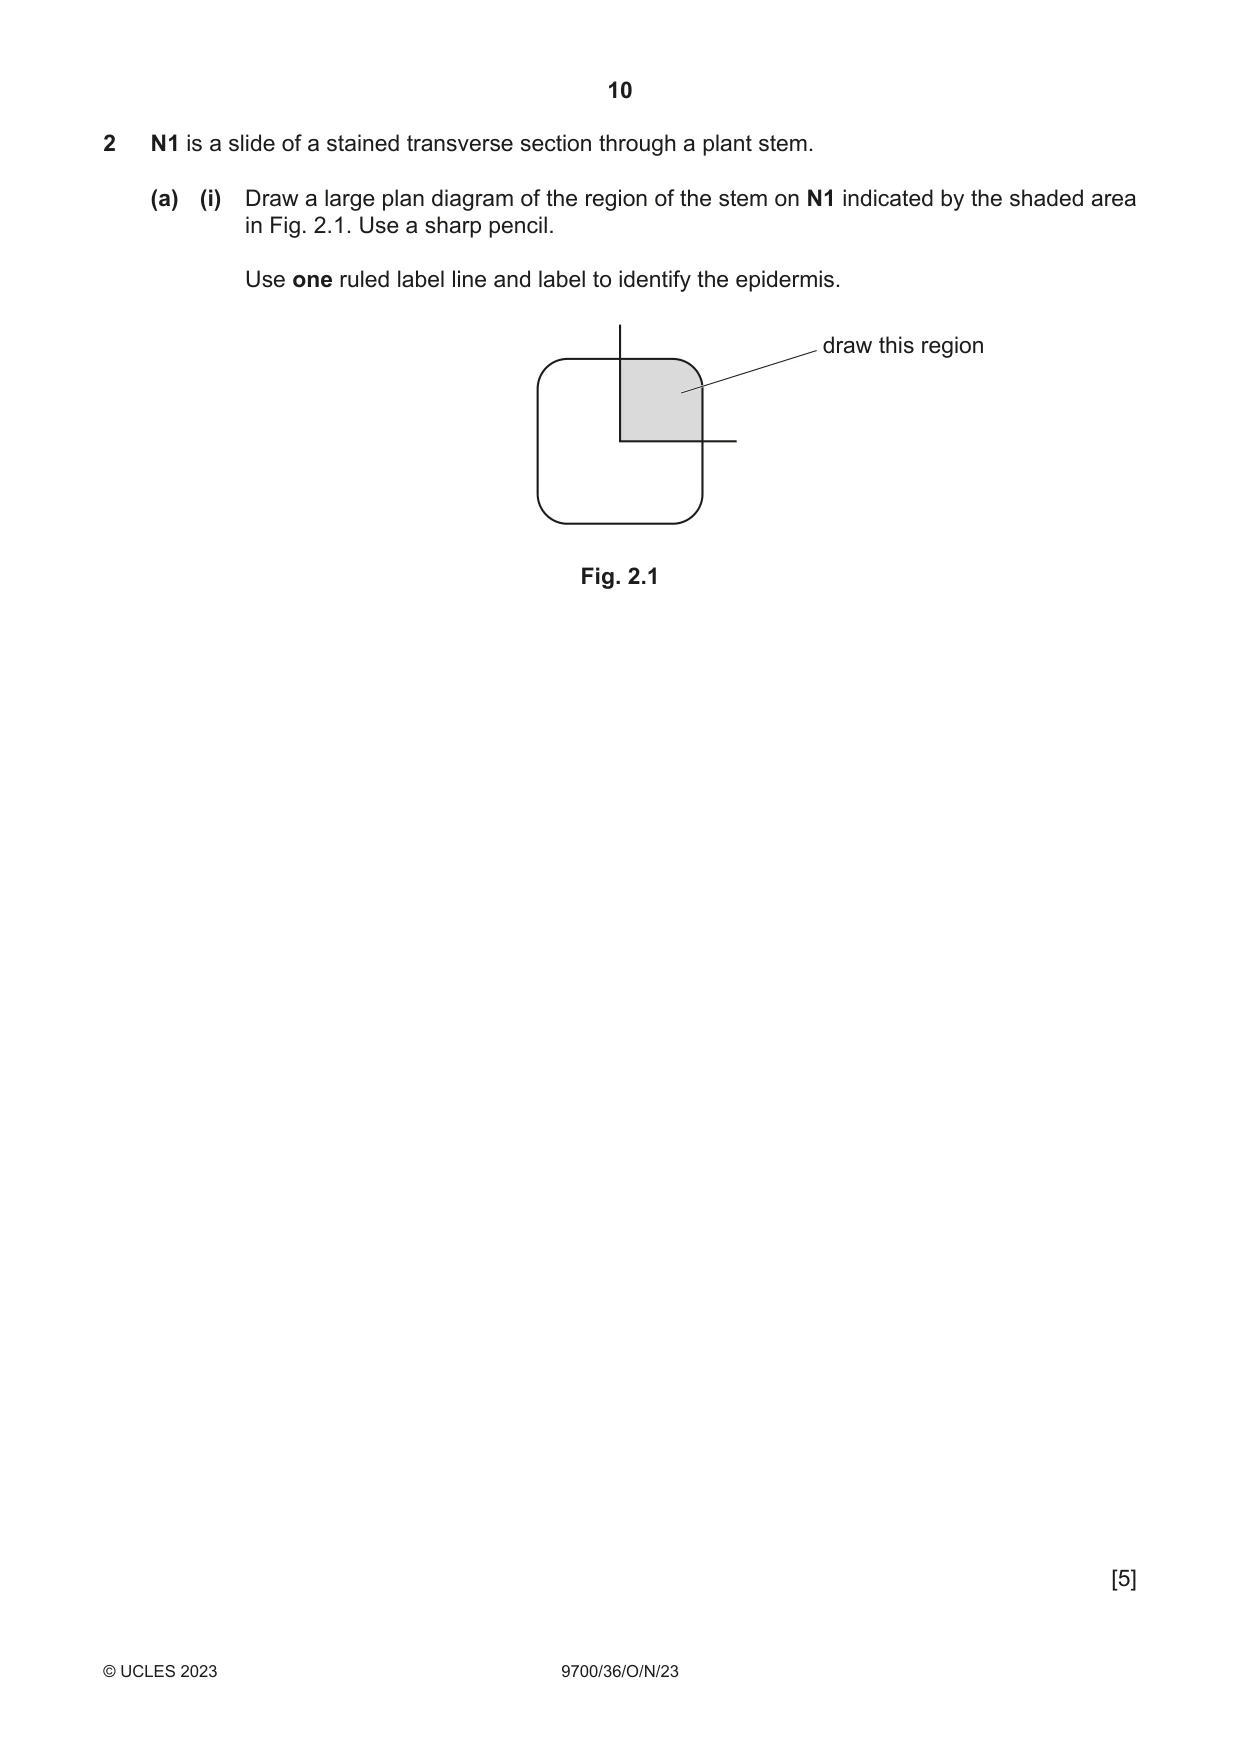
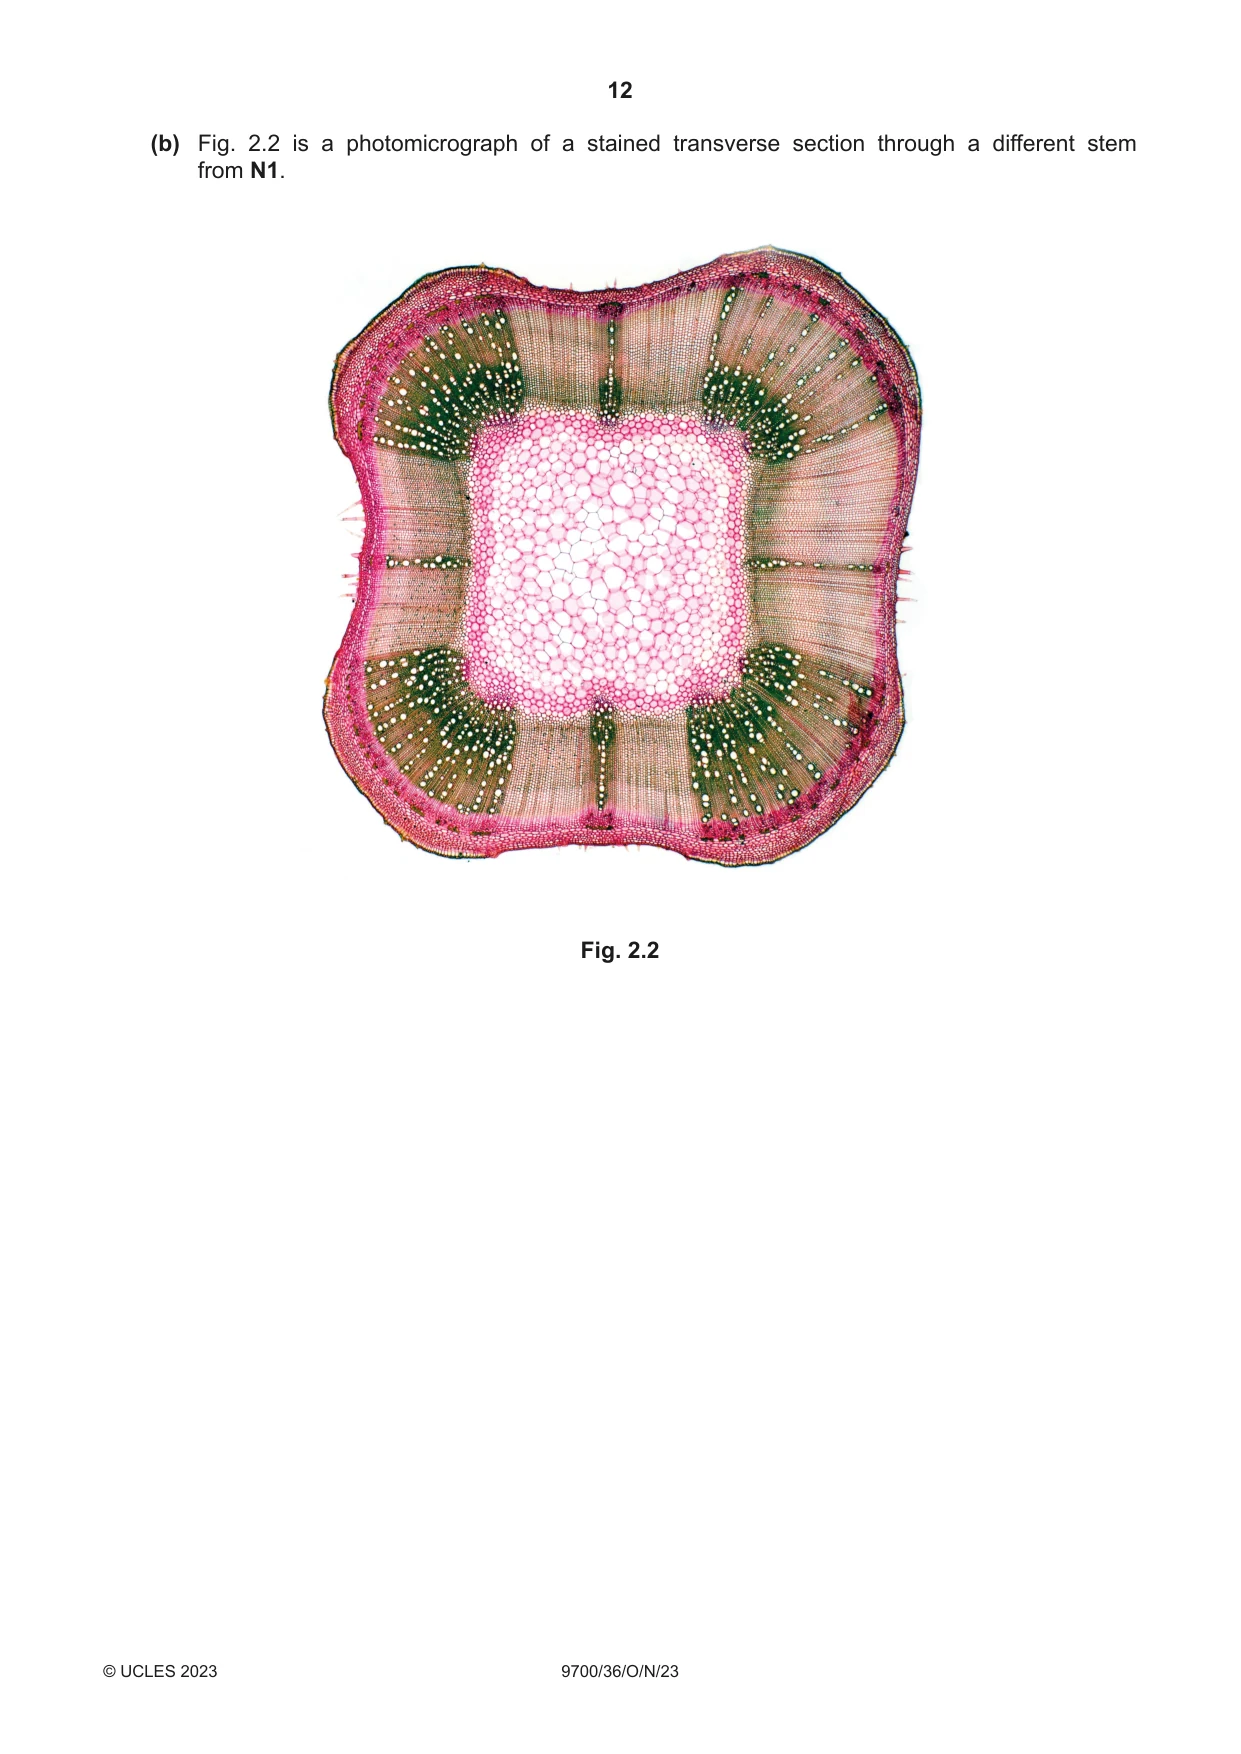
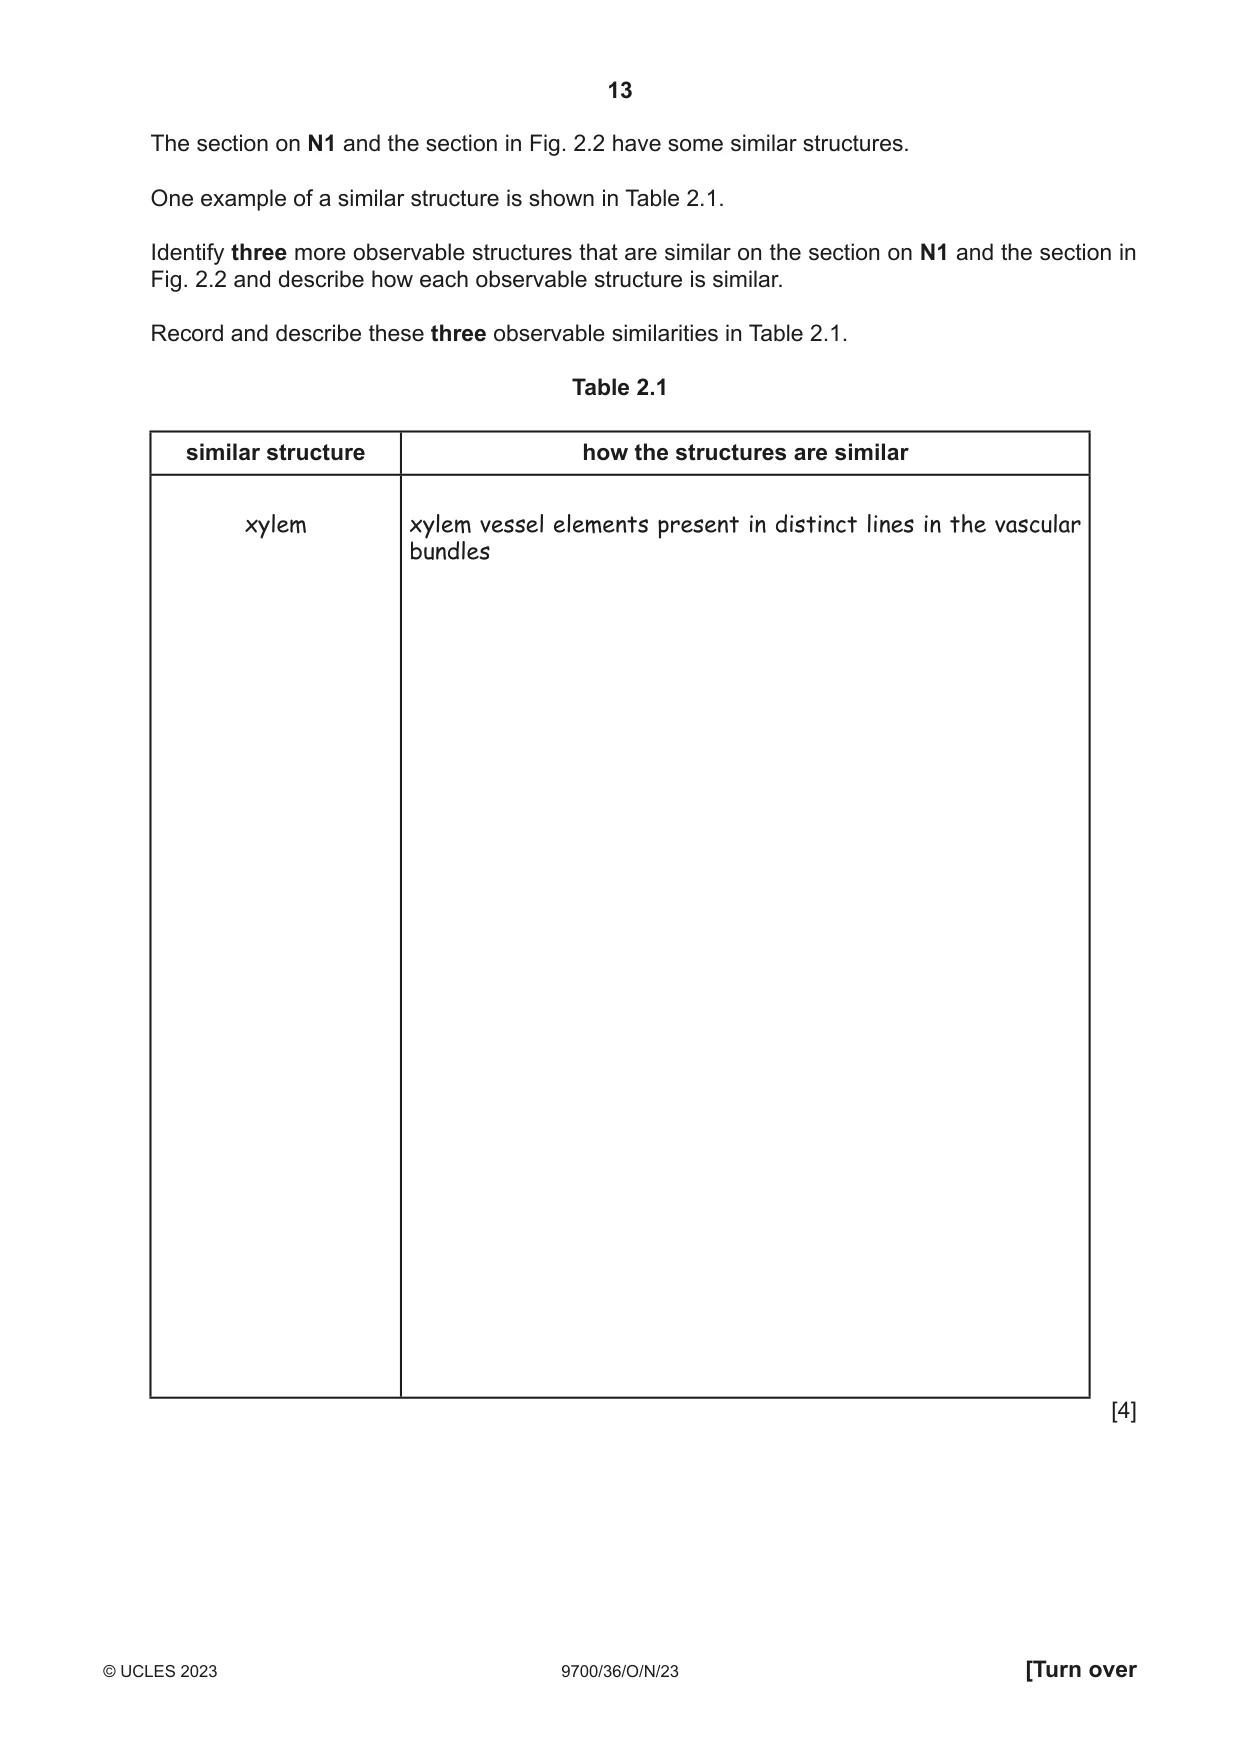
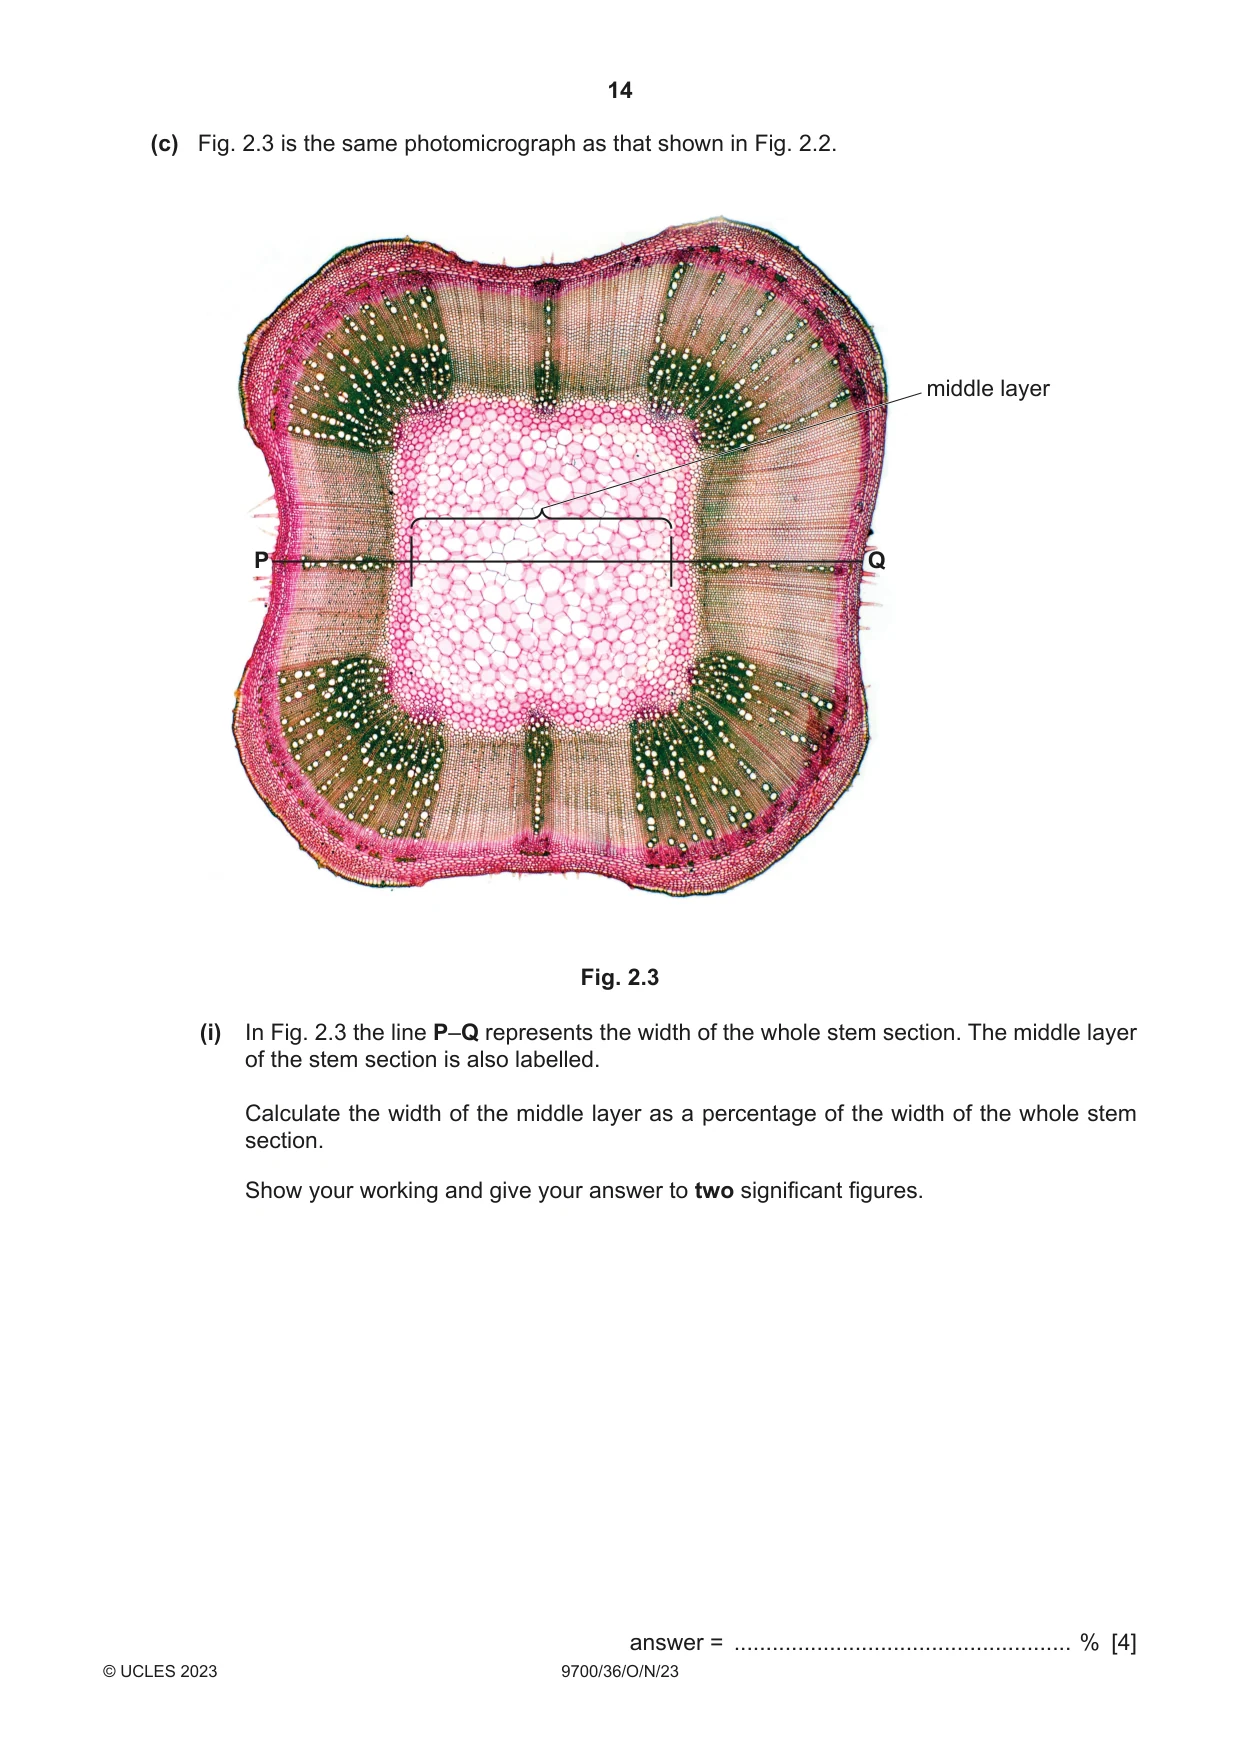
2 N1 is a slide of a stained transverse section through a plant stem. (a) (i) Draw a large plan diagram of the region of the stem on N1 indicated by the shaded area in Fig. 2.1. Use a sharp pencil. Use one ruled label line and label to identify the epidermis. draw this region Fig. 2.1 [5] (ii) Observe the xylem on the section of the stem on N1. Select a line of four adjacent xylem vessel elements. Each xylem vessel element must touch at least one of the other xylem vessel elements that you have selected. • Make a large drawing of this line of four xylem vessel elements. • Use one ruled label line and label to identify the lumen. [5] (b) Fig. 2.2 is a photomicrograph of a stained transverse section through a different stem from N1. Fig. 2.2
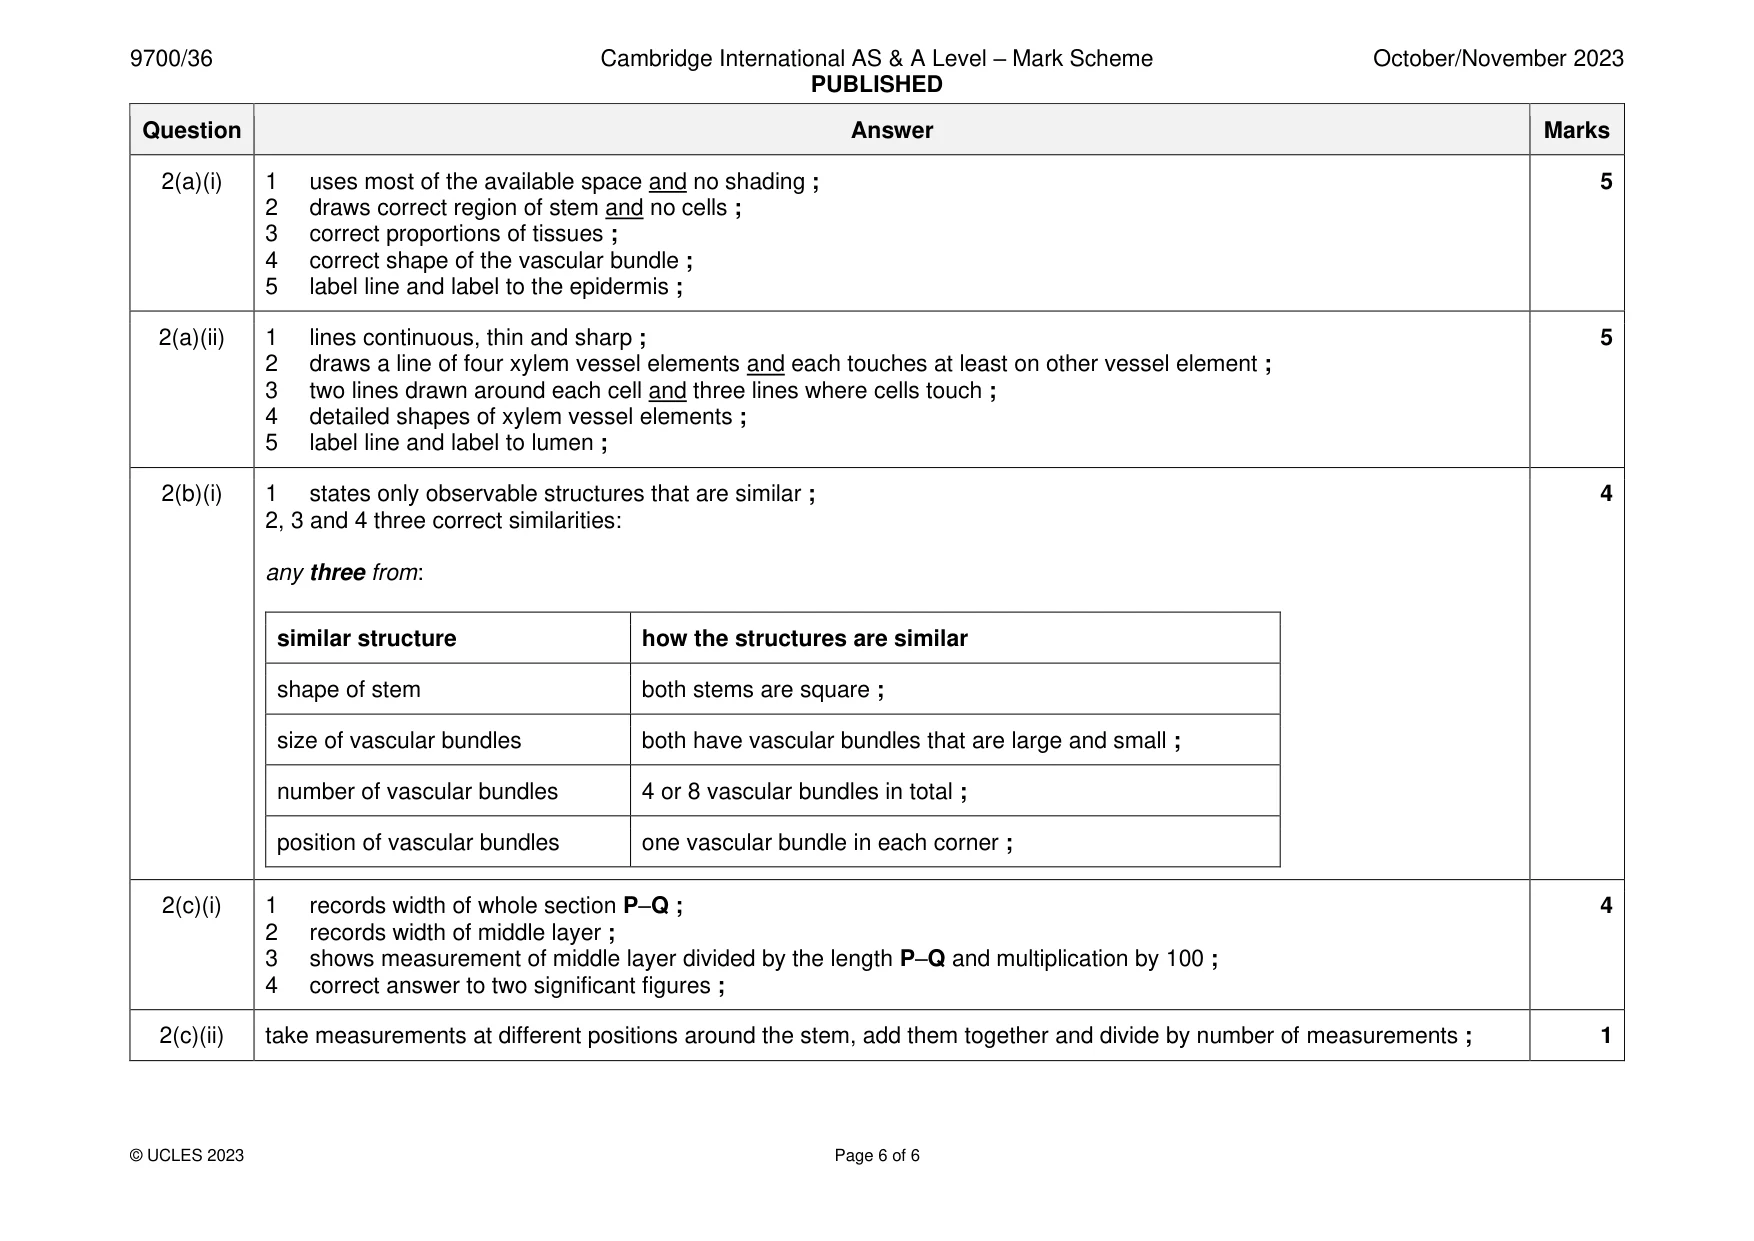
Mark scheme: 2(a)(i) 1 uses most of the available space and no shading ; 5 2 draws correct region of stem and no cells ; 3 correct proportions of tissues ; 4 correct shape of the vascular bundle ; 5 label line and label to the epidermis ; 2(a)(ii) 1 lines continuous, thin and sharp ; 5 2 draws a line of four xylem vessel elements and each touches at least on other vessel element ; 3 two lines drawn around each cell and three lines where cells touch ; 4 detailed shapes of xylem vessel elements ; 5 label line and label to lumen ; 2(b)(i) 1 states only observable structures that are similar ; 4 2, 3 and 4 three correct similarities: any three from: similar structure how the structures are similar shape of stem both stems are square ; size of vascular bundles both have vascular bundles that are large and small ; number of vascular bundles 4 or 8 vascular bundles in total ; position of vascular bundles one vascular bundle in each corner ; 2(c)(i) 1 records width of whole section P–Q ; 4 2 records width of middle layer ; 3 shows measurement of middle layer divided by the length P–Q and multiplication by 100 ; 4 correct answer to two significant figures ; 2(c)(ii) take measurements at different positions around the stem, add them together and divide by number of measurements ; 1
What was in this paper
The subtopics covered by these 2 questions, and how many questions each got. Open one in a new tab to see every Cambridge question on it.
What you needed in this session
Cambridge’s own grade thresholds for 2023 Oct/Nov, Paper 3 · Variant 6. A higher threshold means an easier paper — the bar moves with how the cohort did.