Cambridge A Level Biology 9700 — 2022 Oct/Nov Paper 3 · Variant 6
9700/36/O/N/22 · 2 questions · 40 marks · ≈45 min
The question paper and its mark scheme, free to read here and free to download. This is Cambridge’s own paper, exactly as it was sat.
Question paper16 pages




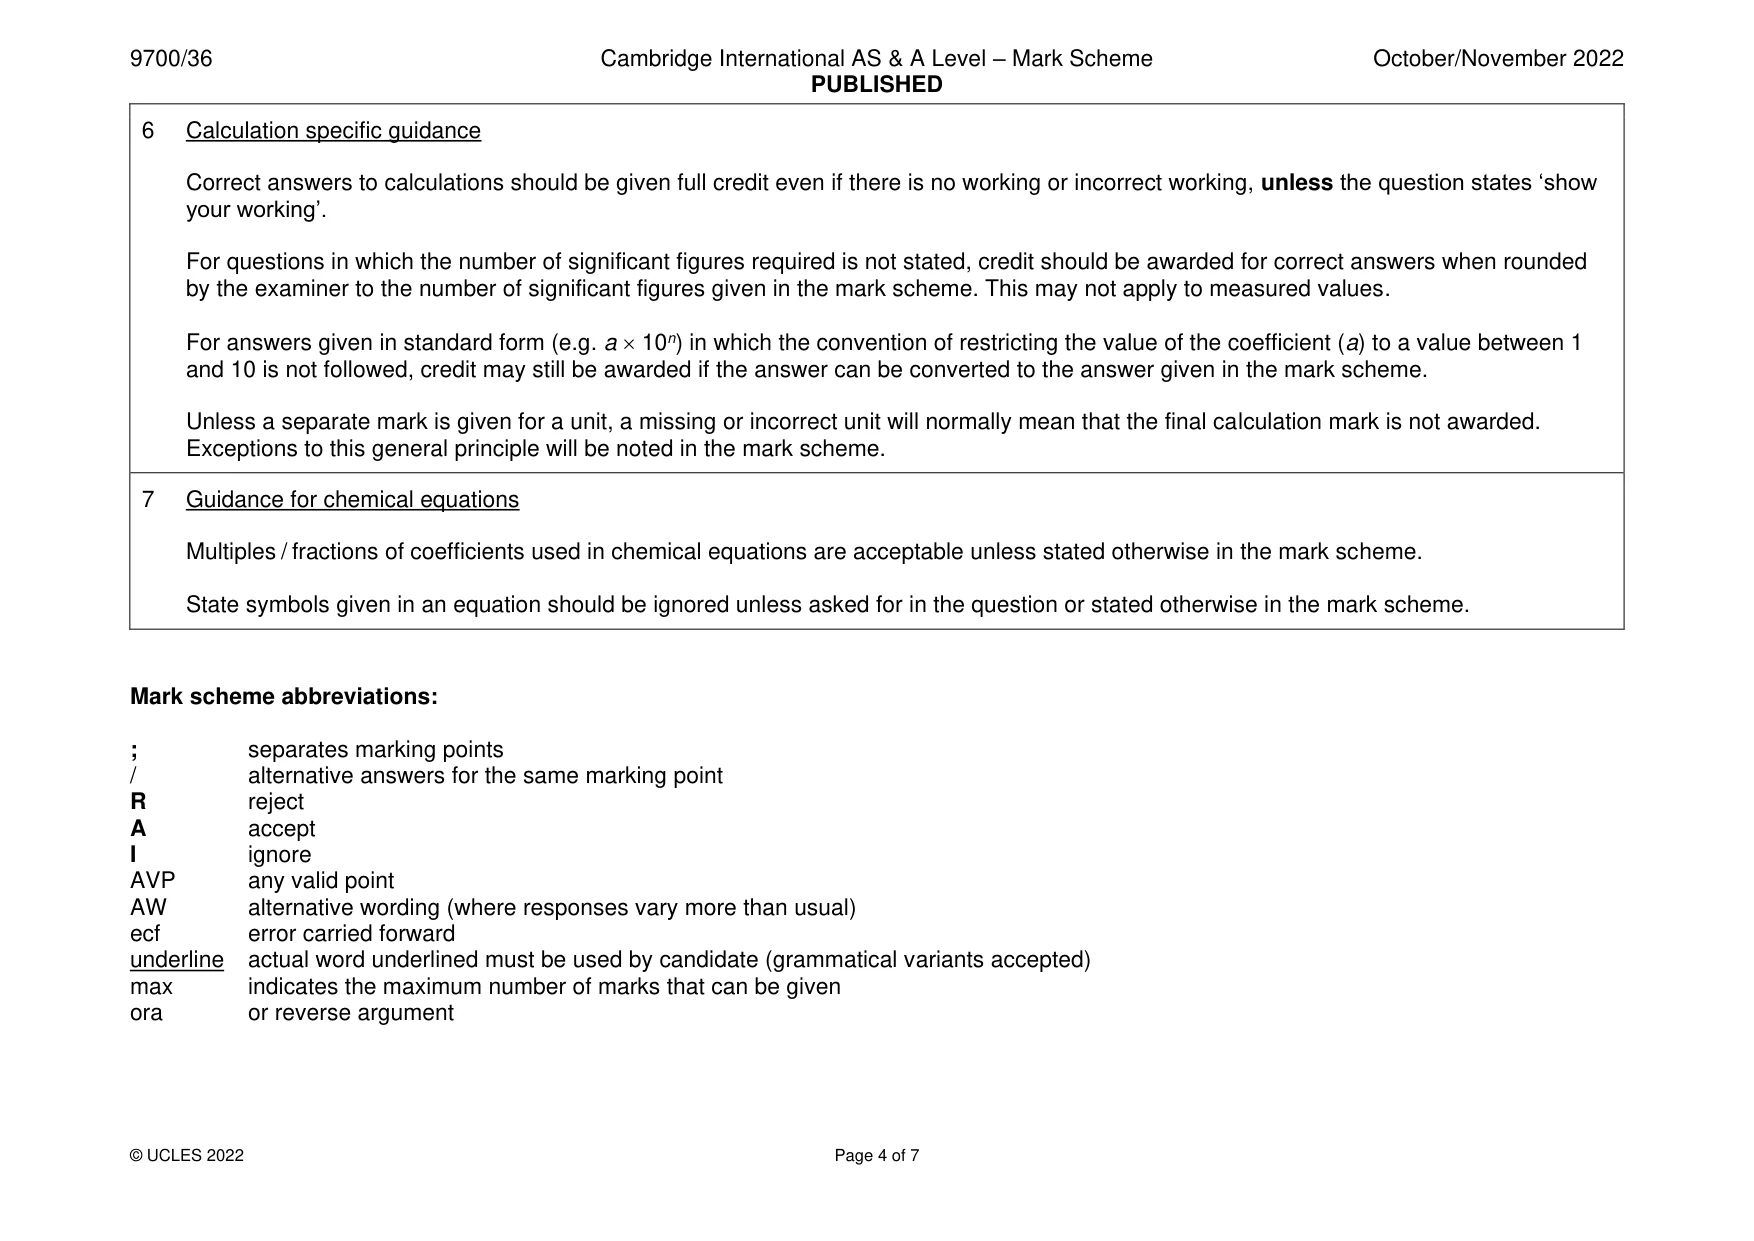
Mark scheme7 pages
Answers below. Sit the paper first if you are practising.
Questions as text
Q1 · Yeast cells contain enzymes that catalyse metabolic reactions
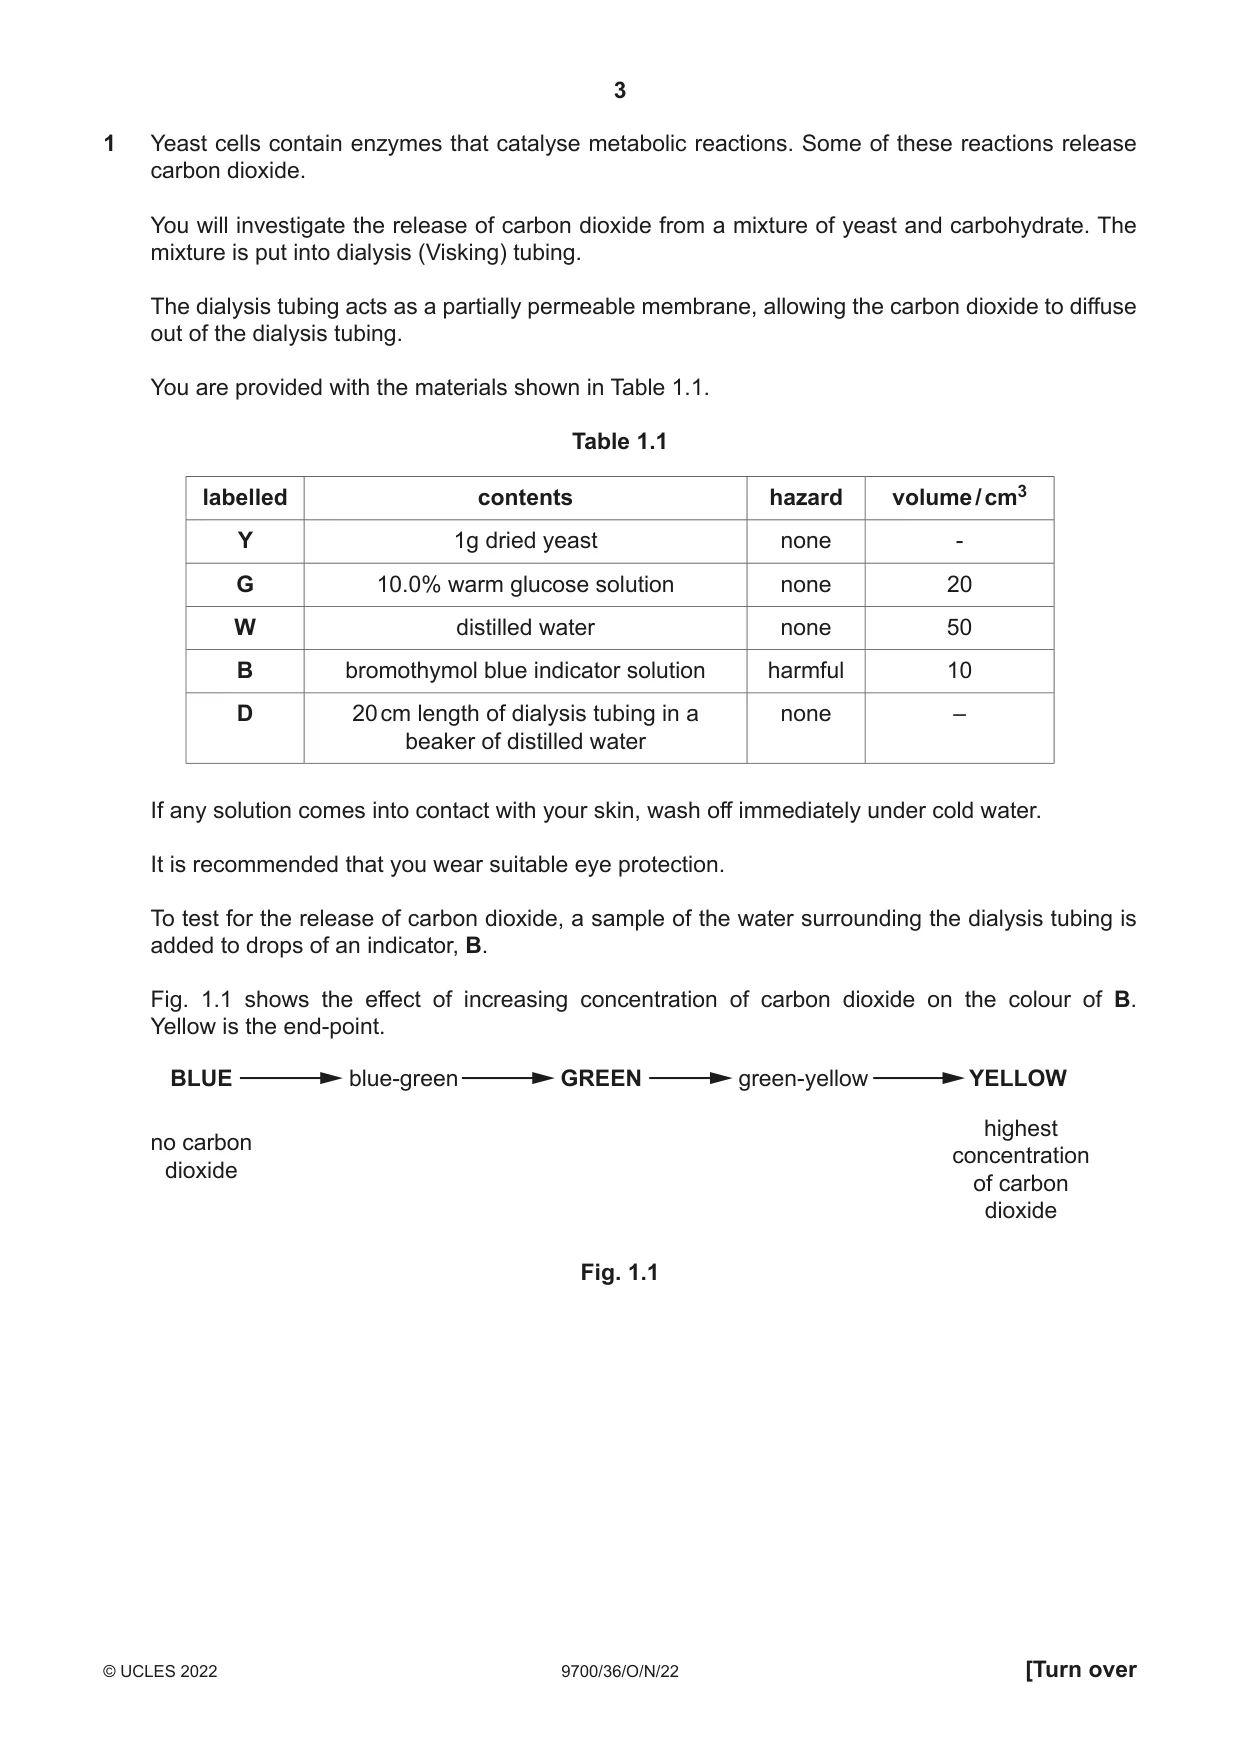
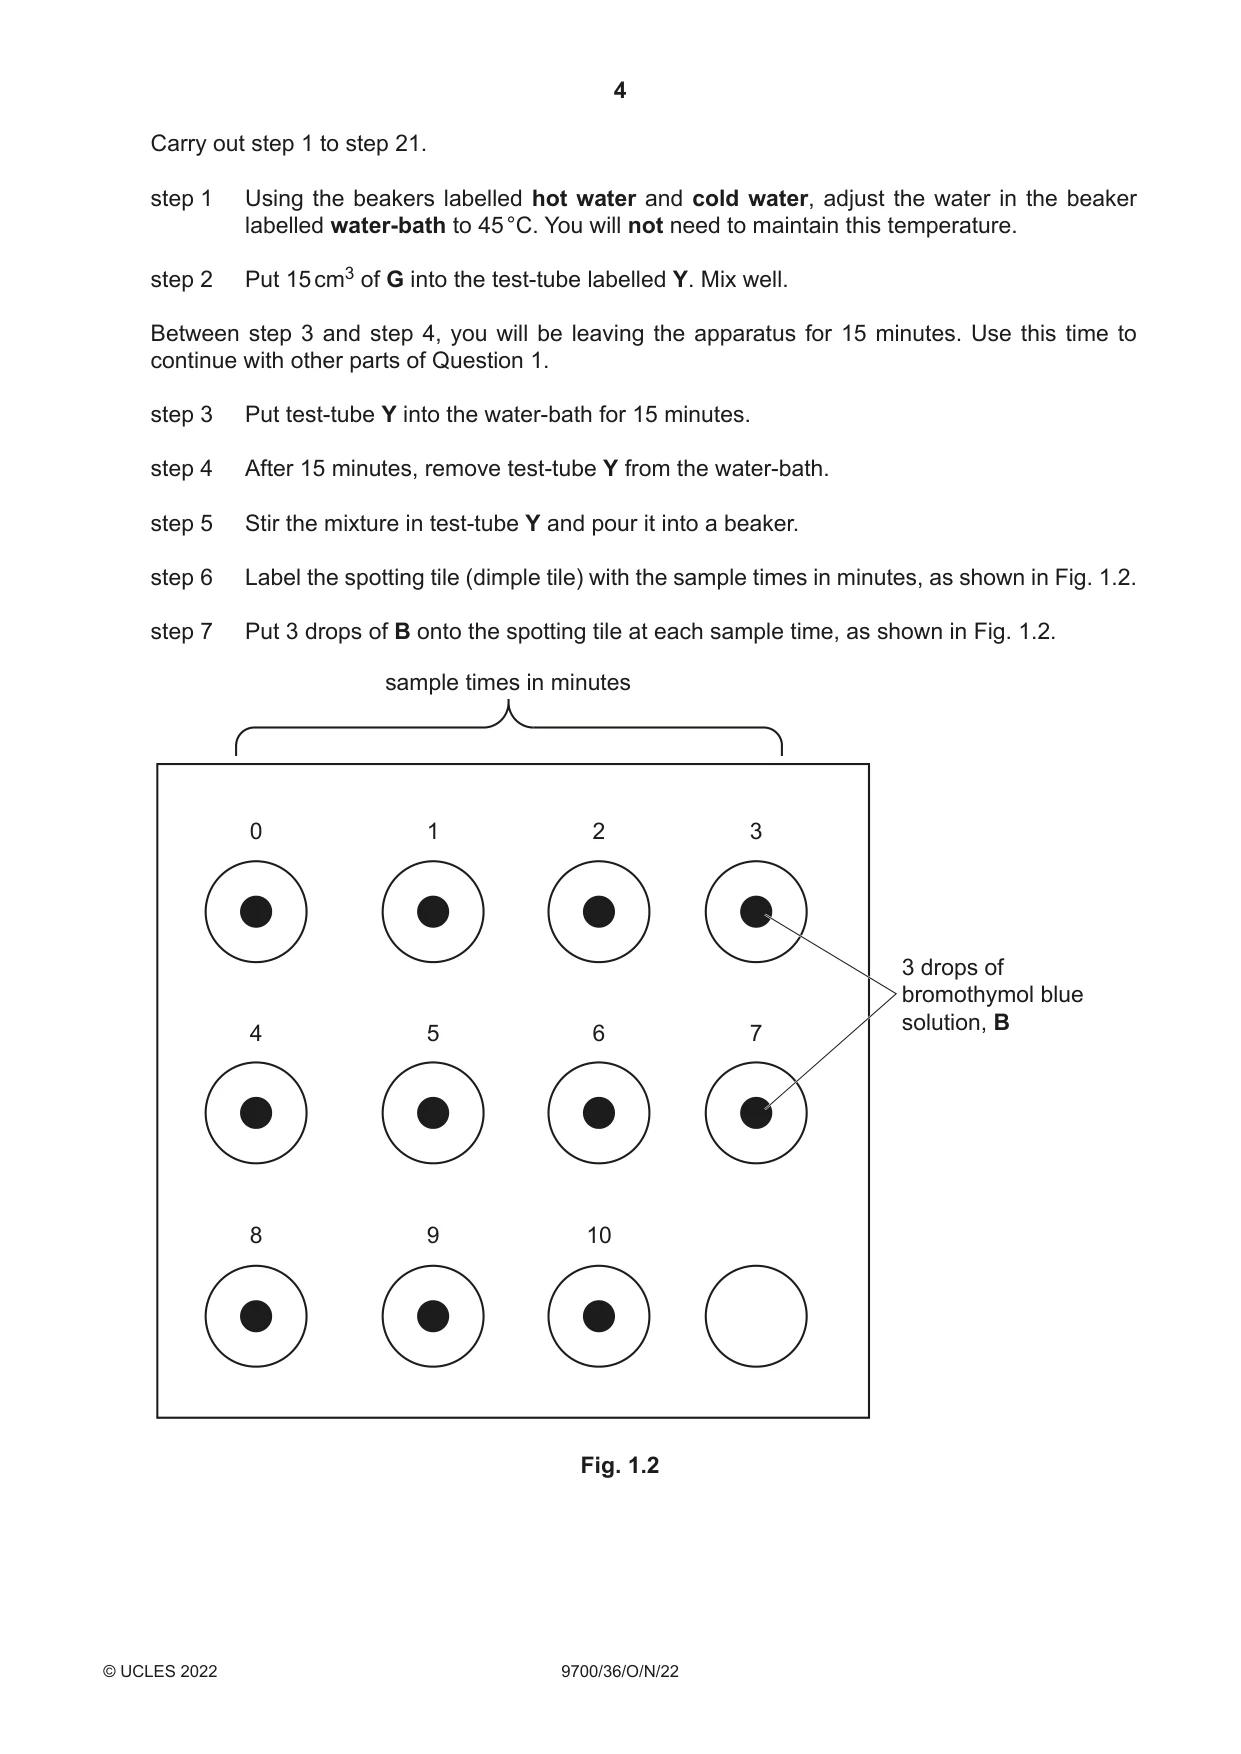
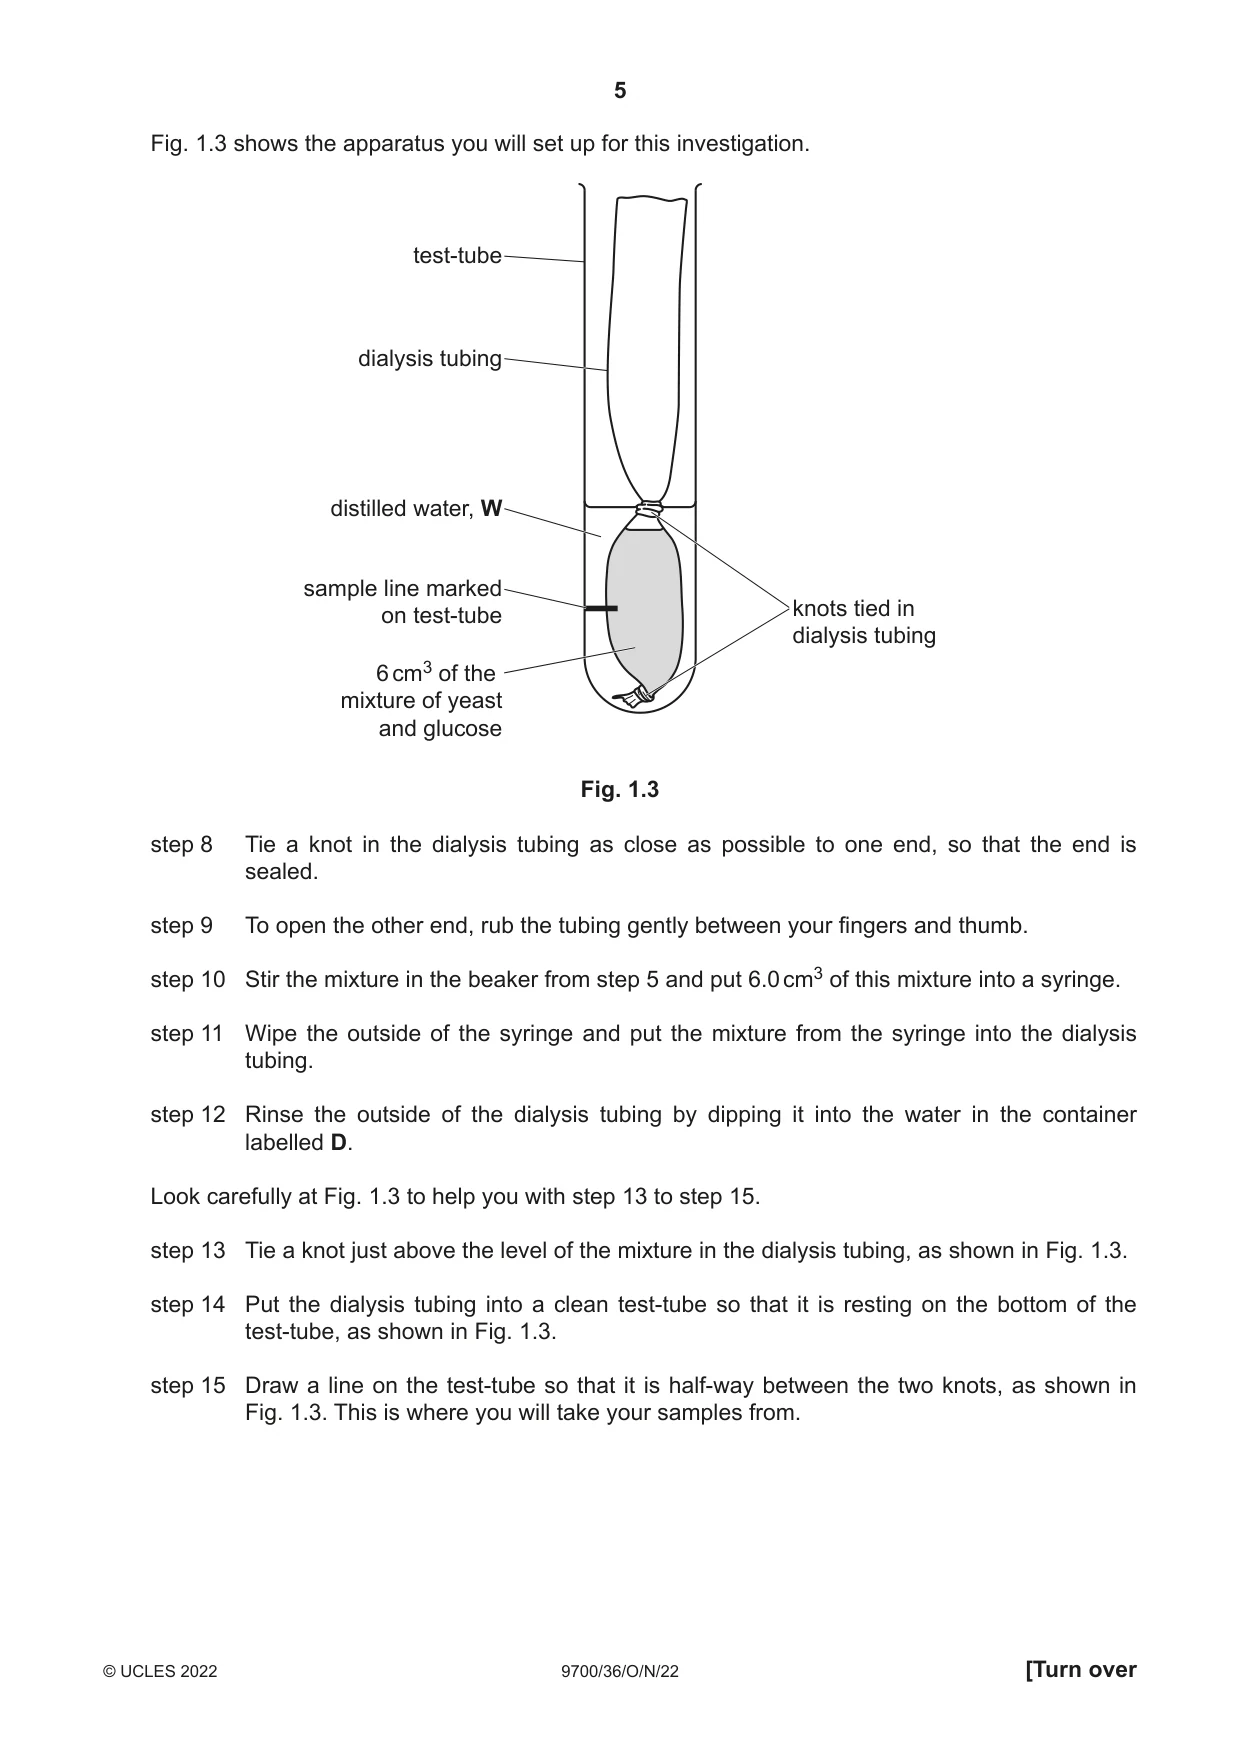
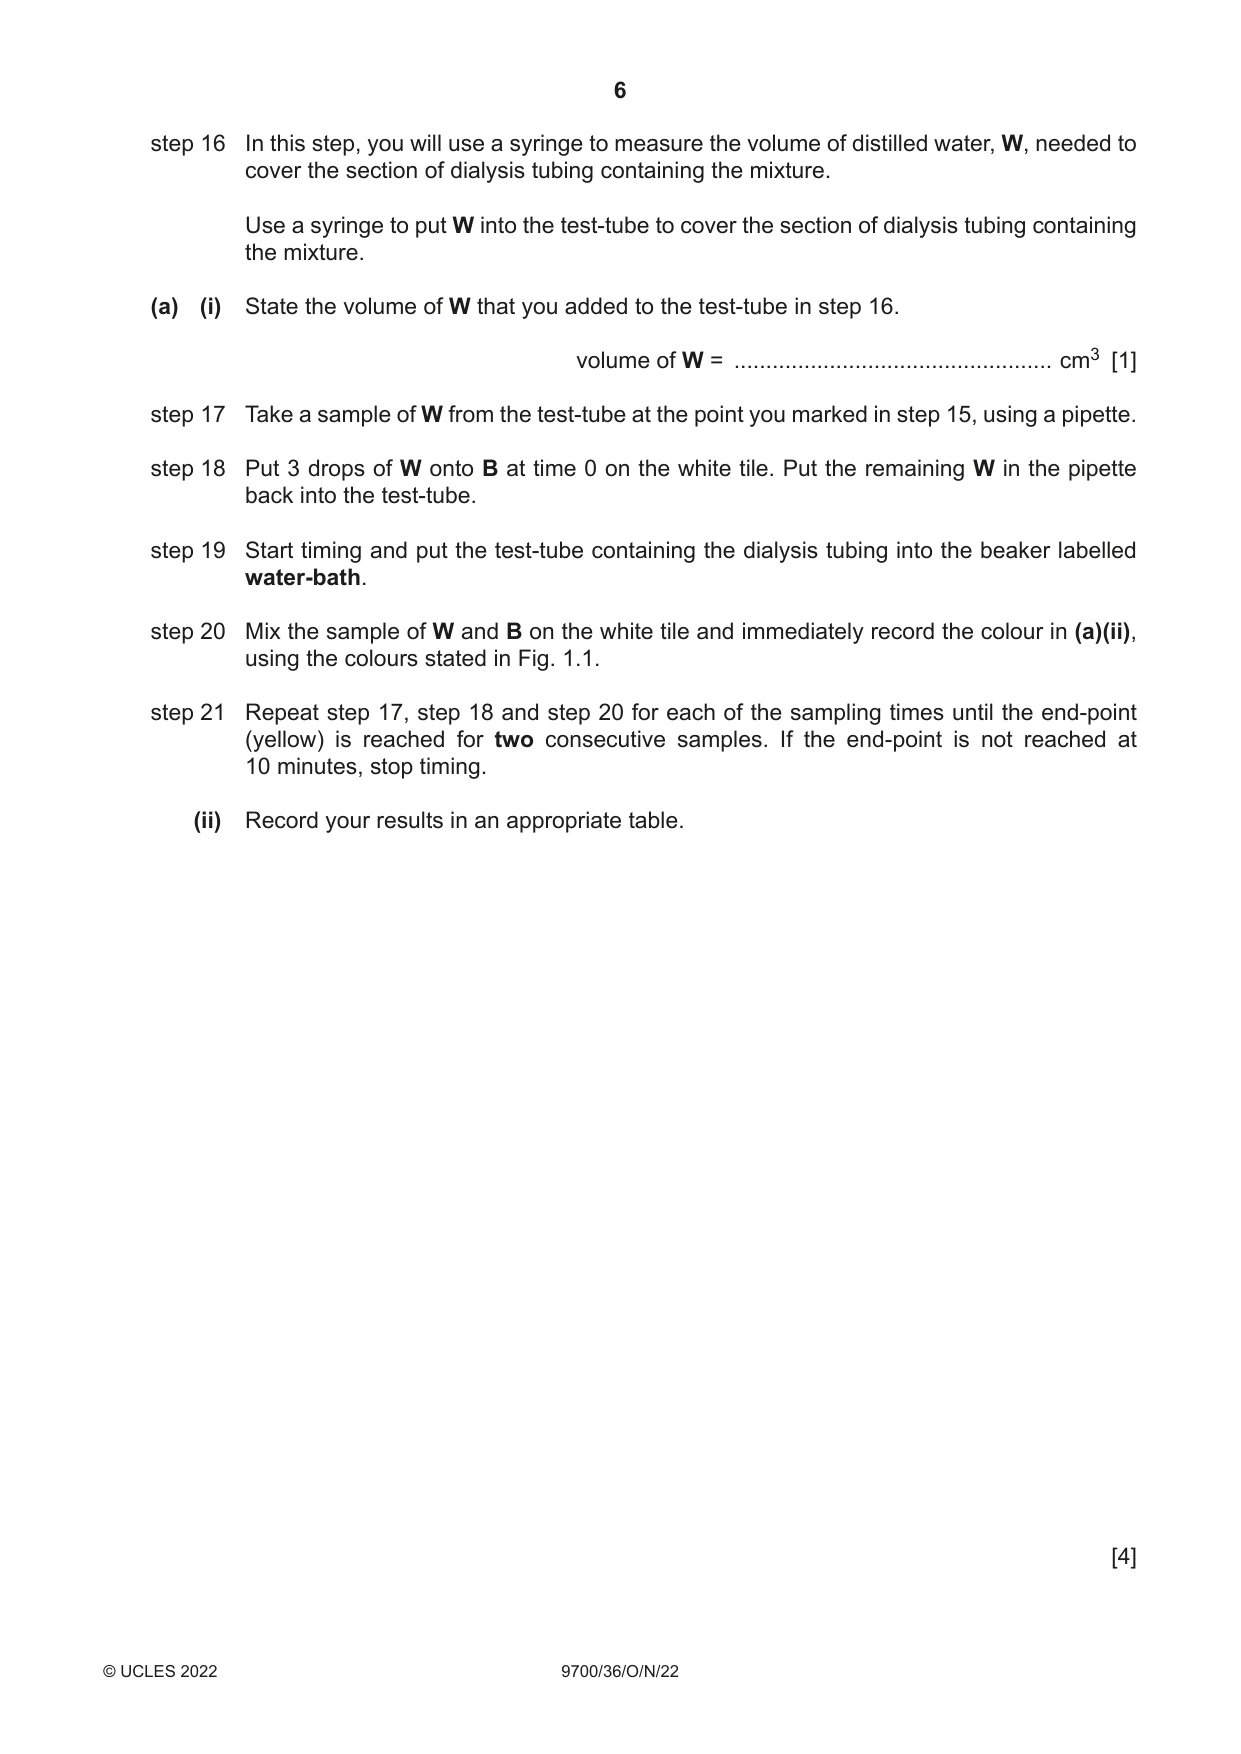
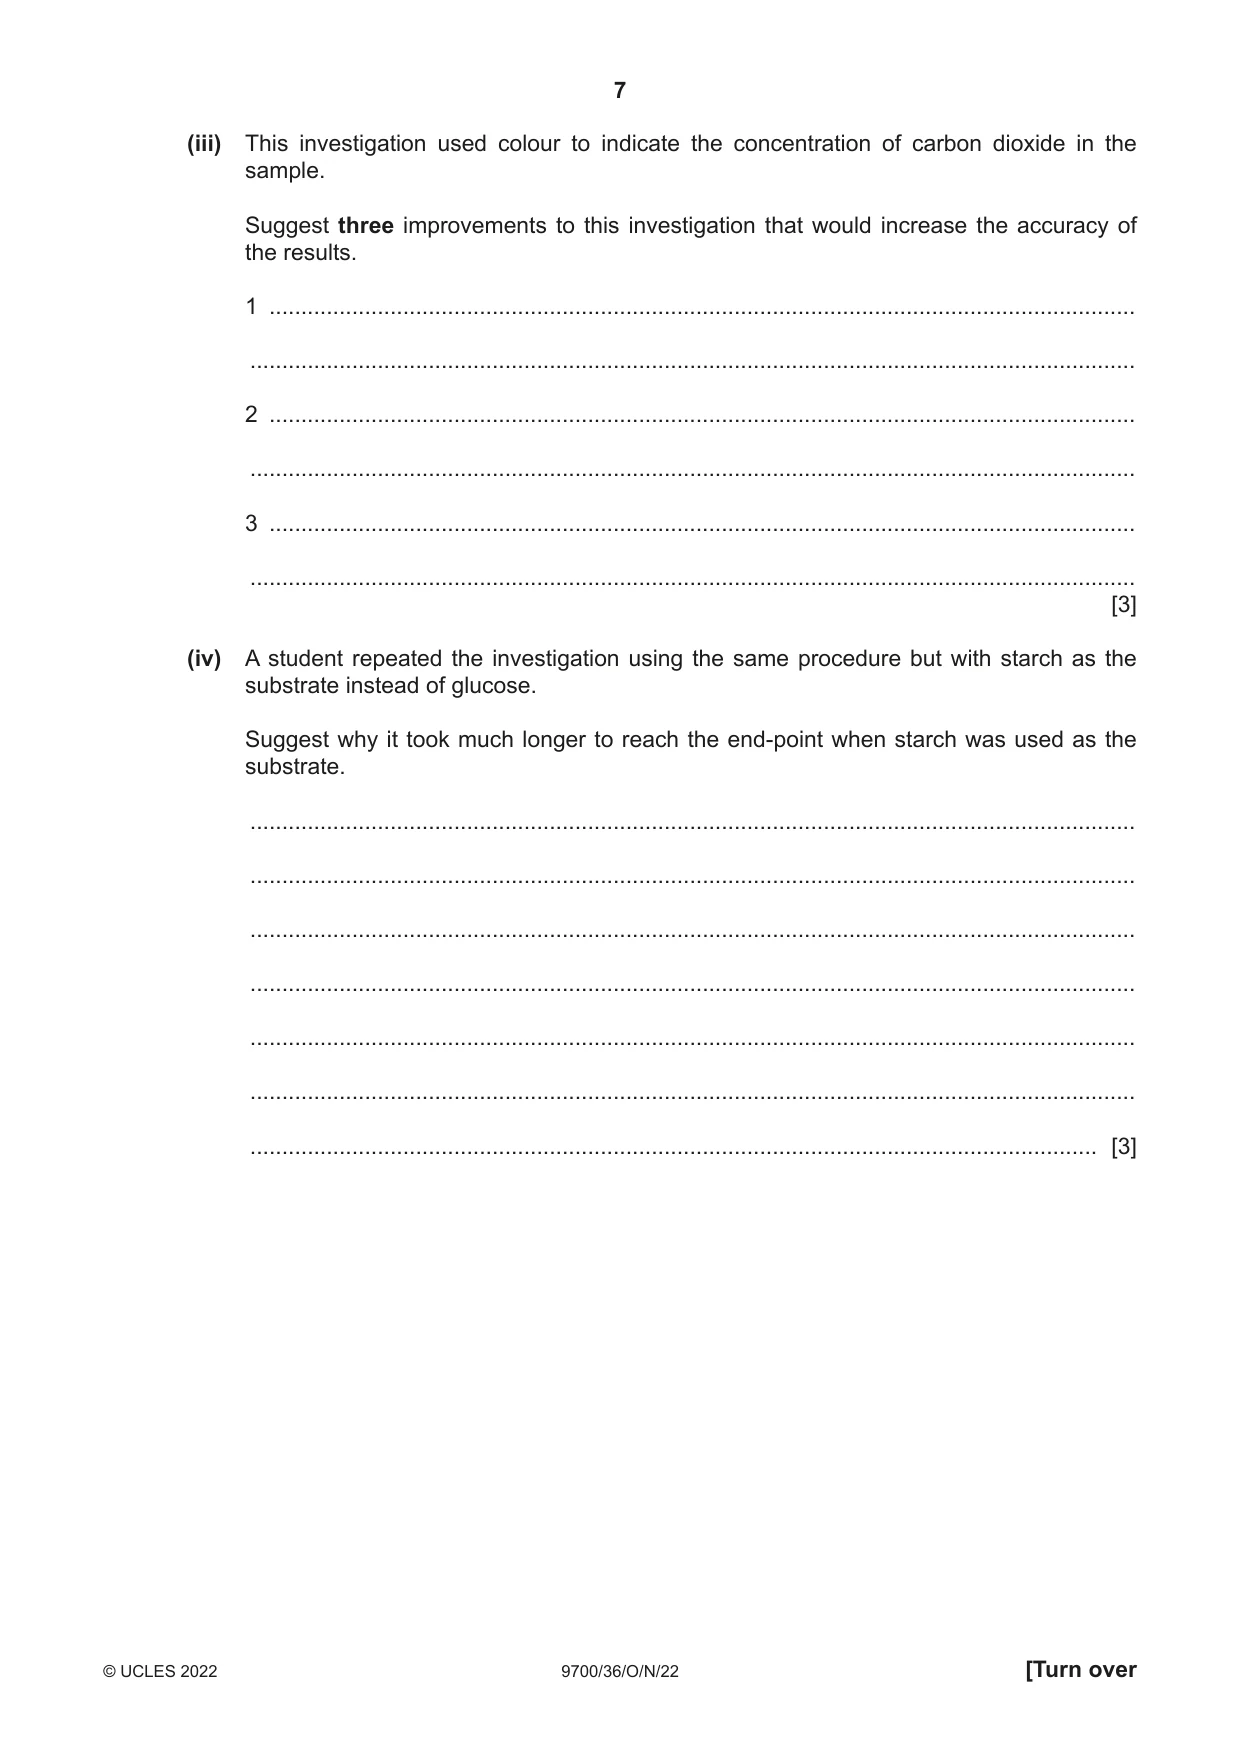
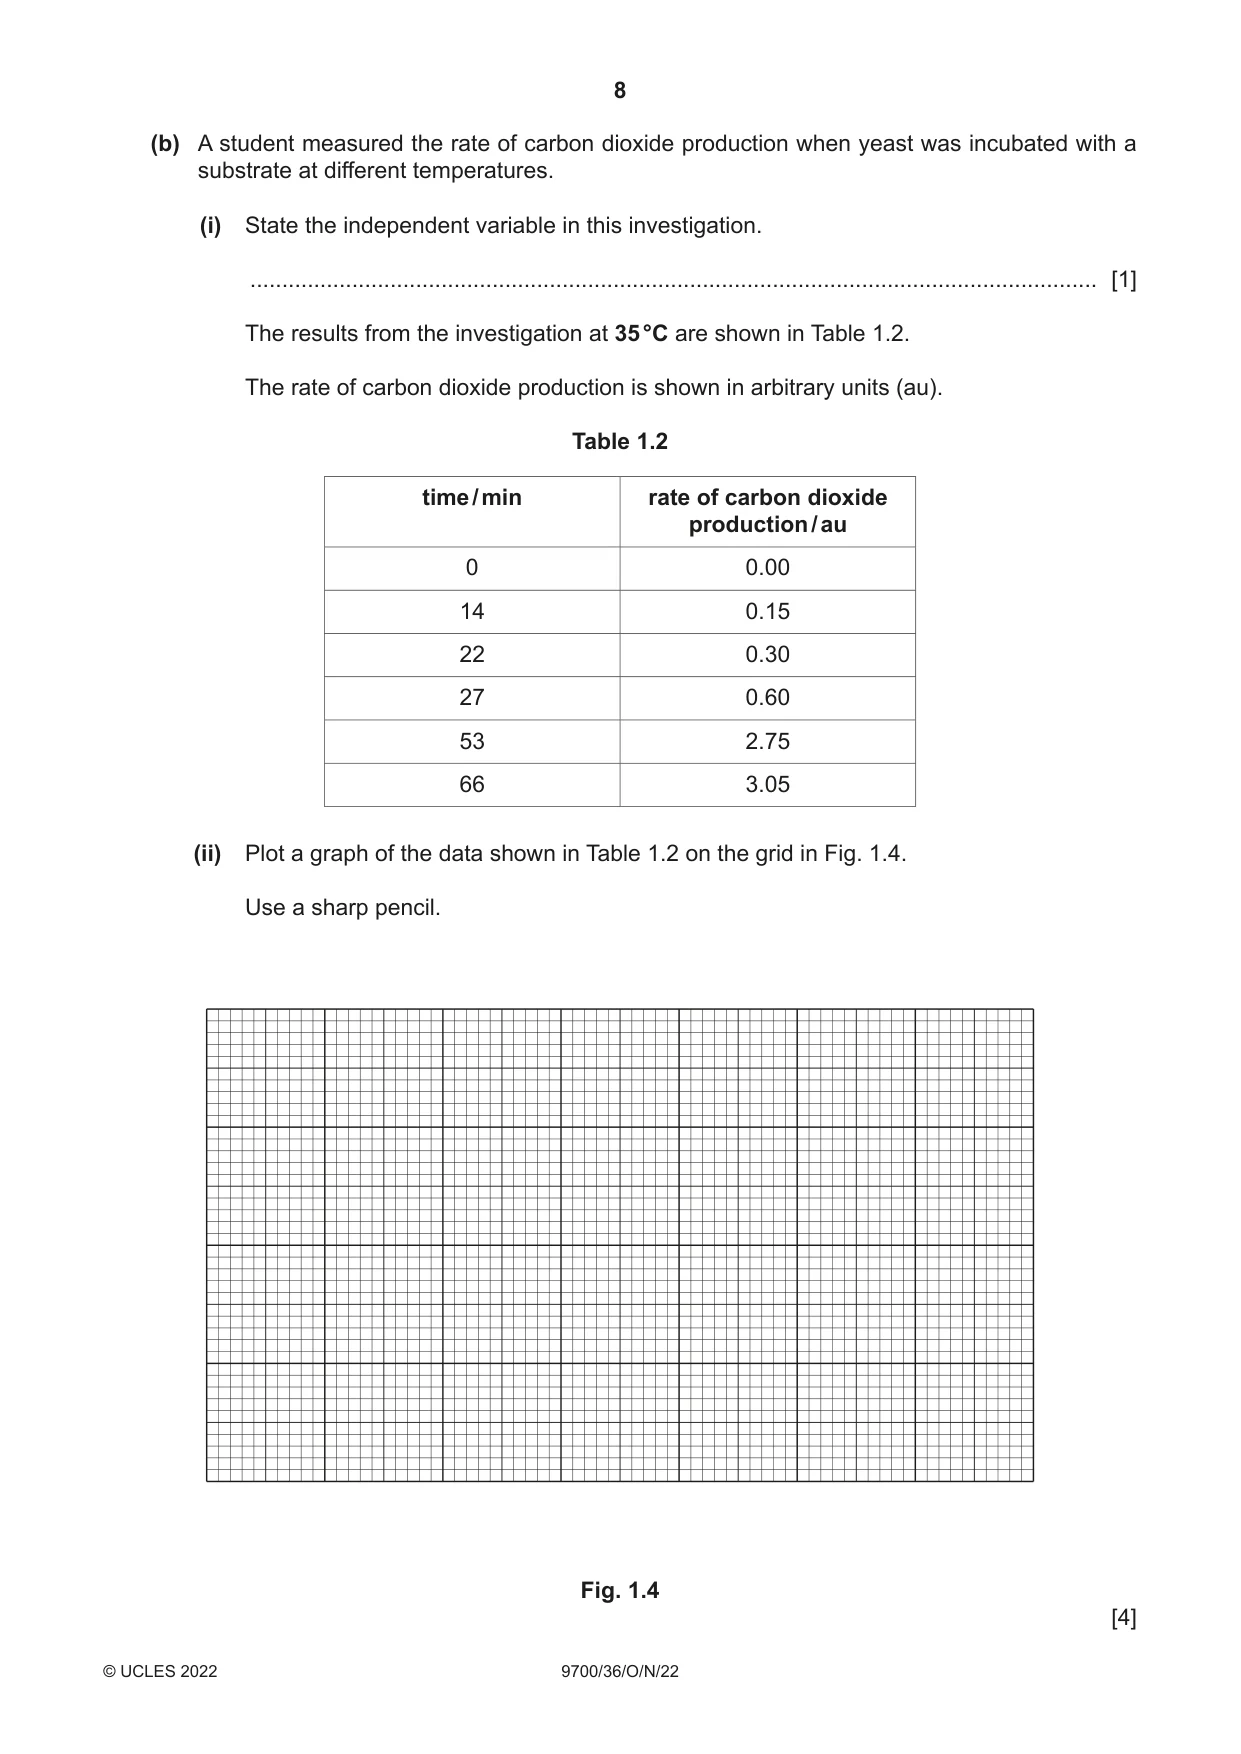
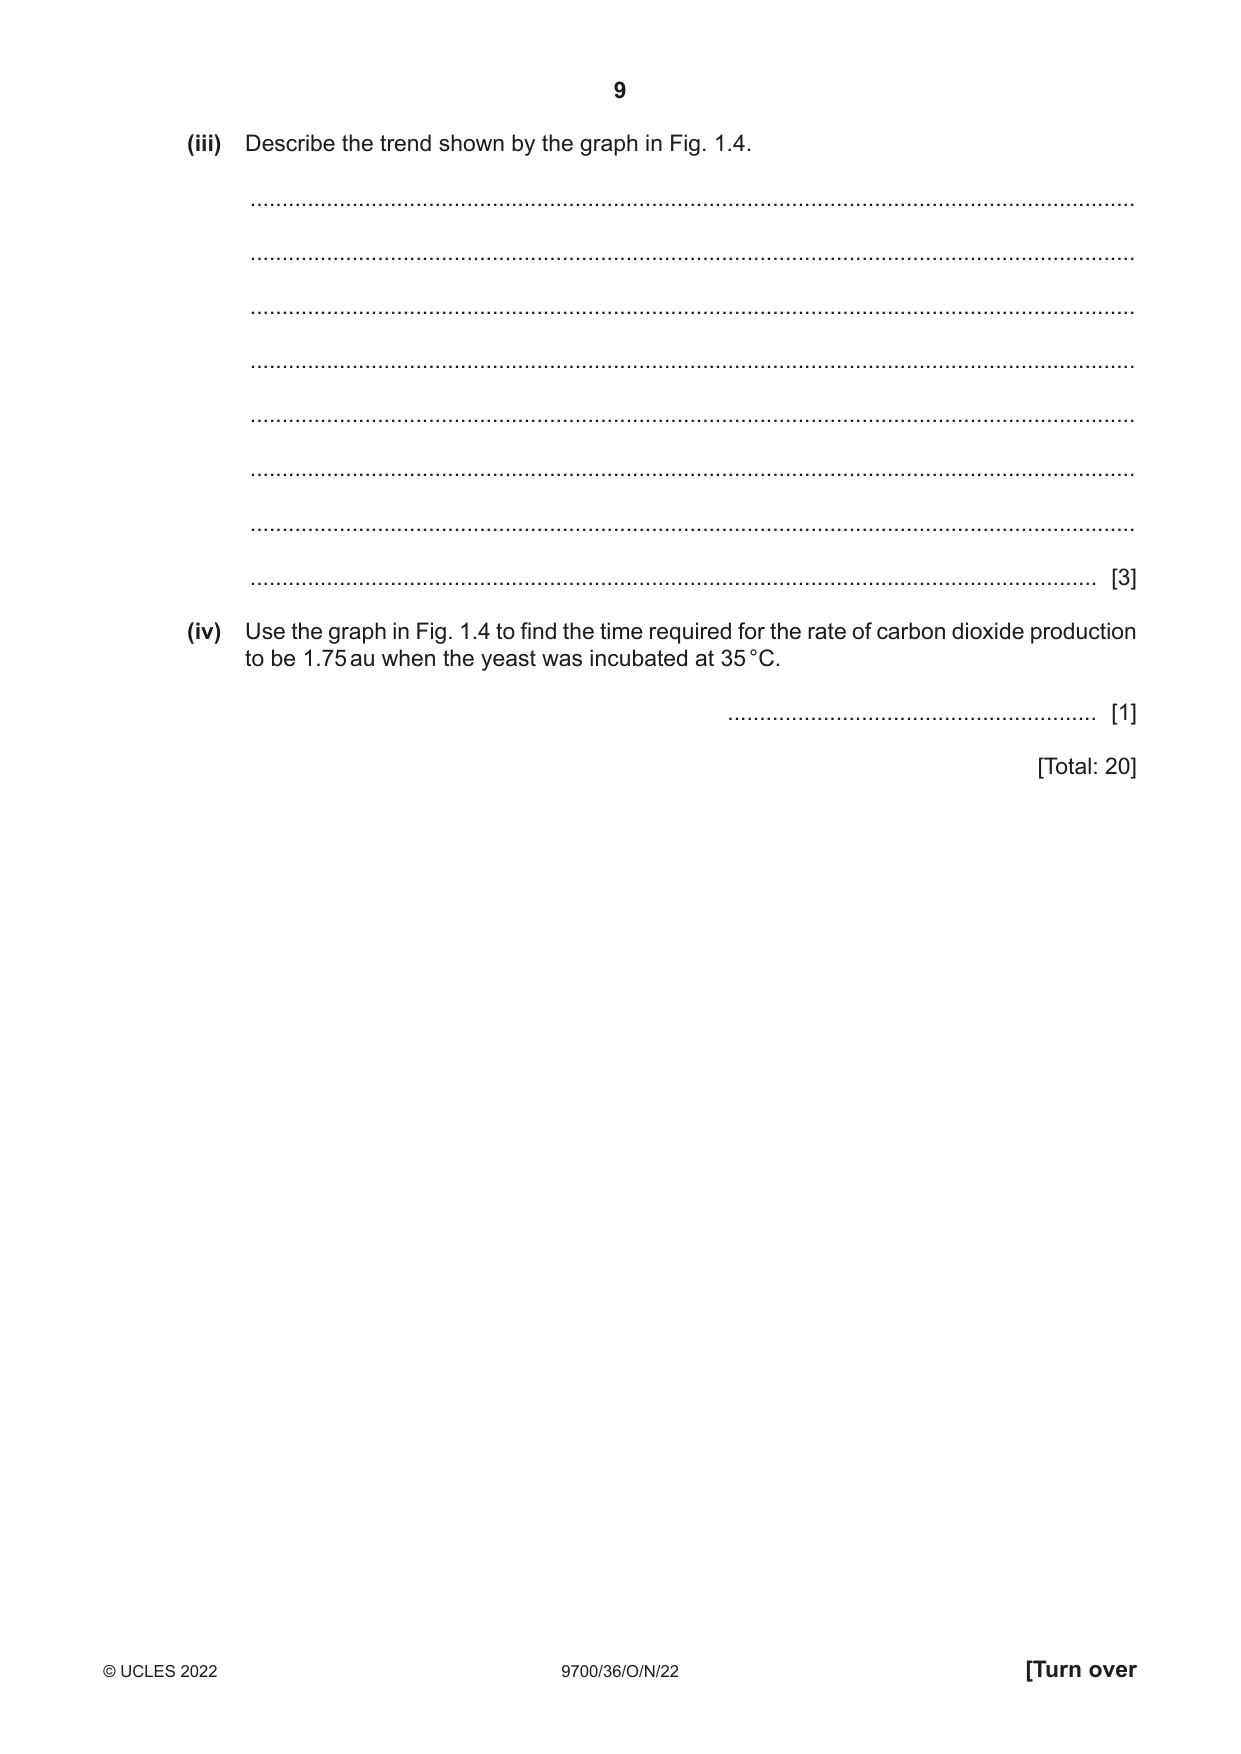
1 Yeast cells contain enzymes that catalyse metabolic reactions. Some of these reactions release carbon dioxide. You will investigate the release of carbon dioxide from a mixture of yeast and carbohydrate. The mixture is put into dialysis (Visking) tubing. The dialysis tubing acts as a partially permeable membrane, allowing the carbon dioxide to diffuse out of the dialysis tubing. You are provided with the materials shown in Table 1.1. Table 1.1 labelled contents hazard volume / cm3 Y 1g dried yeast none - G 10.0% warm glucose solution none 20 W distilled water none 50 B bromothymol blue indicator solution harmful 10 D 20 cm length of dialysis tubing in a none – beaker of distilled water If any solution comes into contact with your skin, wash off immediately under cold water. It is recommended that you wear suitable eye protection. To test for the release of carbon dioxide, a sample of the water surrounding the dialysis tubing is added to drops of an indicator, B. Fig. 1.1 shows the effect of increasing concentration of carbon dioxide on the colour of B. Yellow is the end-point. BLUE blue-green GREEN green-yellow YELLOW highest no carbon concentration dioxide of carbon dioxide Fig. 1.1 Carry out step 1 to step 21. step 1 Using the beakers labelled hot water and cold water, adjust the water in the beaker labelled water-bath to 45 °C. You will not need to maintain this temperature. step 2 Put 15 cm3 of G into the test-tube labelled Y. Mix well. Between step 3 and step 4, you will be leaving the apparatus for 15 minutes. Use this time to continue with other parts of Question 1. step 3 Put test-tube Y into the water-bath for 15 minutes. step 4 After 15 minutes, remove test-tube Y from the water-bath. step 5 Stir the mixture in test-tube Y and pour it into a beaker. step 6 Label the spotting tile (dimple tile) with the sample times in minutes, as shown in Fig. 1.2. step 7 Put 3 drops of B onto the spotting tile at each sample time, as shown in Fig. 1.2. sample times in minutes 0 1 2 3 3 drops of bromothymol blue solution, B 4 5 6 7 8 9 10 Fig. 1.2 Fig. 1.3 shows the apparatus you will set up for this investigation. test-tube dialysis tubing distilled water, W sample line marked knots tied in on test-tube dialysis tubing 6 cm3 of the mixture of yeast and glucose Fig. 1.3 step 8 Tie a knot in the dialysis tubing as close as possible to one end, so that the end is sealed. step 9 To open the other end, rub the tubing gently between your fingers and thumb. step 10 Stir the mixture in the beaker from step 5 and put 6.0 cm3 of this mixture into a syringe. step 11 Wipe the outside of the syringe and put the mixture from the syringe into the dialysis tubing. step 12 Rinse the outside of the dialysis tubing by dipping it into the water in the container labelled D. Look carefully at Fig. 1.3 to help you with step 13 to step 15. step 13 Tie a knot just above the level of the mixture in the dialysis tubing, as shown in Fig. 1.3. step 14 Put the dialysis tubing into a clean test-tube so that it is resting on the bottom of the test-tube, as shown in Fig. 1.3. step 15 Draw a line on the test-tube so that it is half-way between the two knots, as shown in Fig. 1.3. This is where you will take your samples from. step 16 In this step, you will use a syringe to measure the volume of distilled water, W, needed to cover the section of dialysis tubing containing the mixture. Use a syringe to put W into the test-tube to cover the section of dialysis tubing containing the mixture. (a) (i) State the volume of W that you added to the test-tube in step 16. volume of W = .................................................. cm3 [1] step 17 Take a sample of W from the test-tube at the point you marked in step 15, using a pipette. step 18 Put 3 drops of W onto B at time 0 on the white tile. Put the remaining W in the pipette back into the test-tube. step 19 Start timing and put the test-tube containing the dialysis tubing into the beaker labelled water-bath. step 20 Mix the sample of W and B on the white tile and immediately record the colour in (a)(ii), using the colours stated in Fig. 1.1. step 21 Repeat step 17, step 18 and step 20 for each of the sampling times until the end-point (yellow) is reached for two consecutive samples. If the end-point is not reached at 10 minutes, stop timing. (ii) Record your results in an appropriate table. [4] (iii) This investigation used colour to indicate the concentration of carbon dioxide in the sample. Suggest three improvements to this investigation that would increase the accuracy of the results. 1 ........................................................................................................................................ ........................................................................................................................................... 2 ........................................................................................................................................ ........................................................................................................................................... 3 ........................................................................................................................................ ........................................................................................................................................... [3] (iv) A student repeated the investigation using the same procedure but with starch as the substrate instead of glucose. Suggest why it took much longer to reach the end-point when starch was used as the substrate. ........................................................................................................................................... ........................................................................................................................................... ........................................................................................................................................... ........................................................................................................................................... ........................................................................................................................................... ........................................................................................................................................... ..................................................................................................................................... [3] (b) A student measured the rate of carbon dioxide production when yeast was incubated with a substrate at different temperatures. (i) State the independent variable in this investigation. ..................................................................................................................................... [1] The results from the investigation at 35 °C are shown in Table 1.2. The rate of carbon dioxide production is shown in arbitrary units (au). Table 1.2 time / min rate of carbon dioxide production / au 0 0.00 14 0.15 22 0.30 27 0.60 53 2.75 66 3.05 (ii) Plot a graph of the data shown in Table 1.2 on the grid in Fig. 1.4. Use a sharp pencil. Fig. 1.4 [4] (iii) Describe the trend shown by the graph in Fig. 1.4. ........................................................................................................................................... ........................................................................................................................................... ........................................................................................................................................... ........................................................................................................................................... ........................................................................................................................................... ........................................................................................................................................... ........................................................................................................................................... ..................................................................................................................................... [3] (iv) Use the graph in Fig. 1.4 to find the time required for the rate of carbon dioxide production to be 1.75 au when the yeast was incubated at 35 °C. .......................................................... [1] [Total: 20]
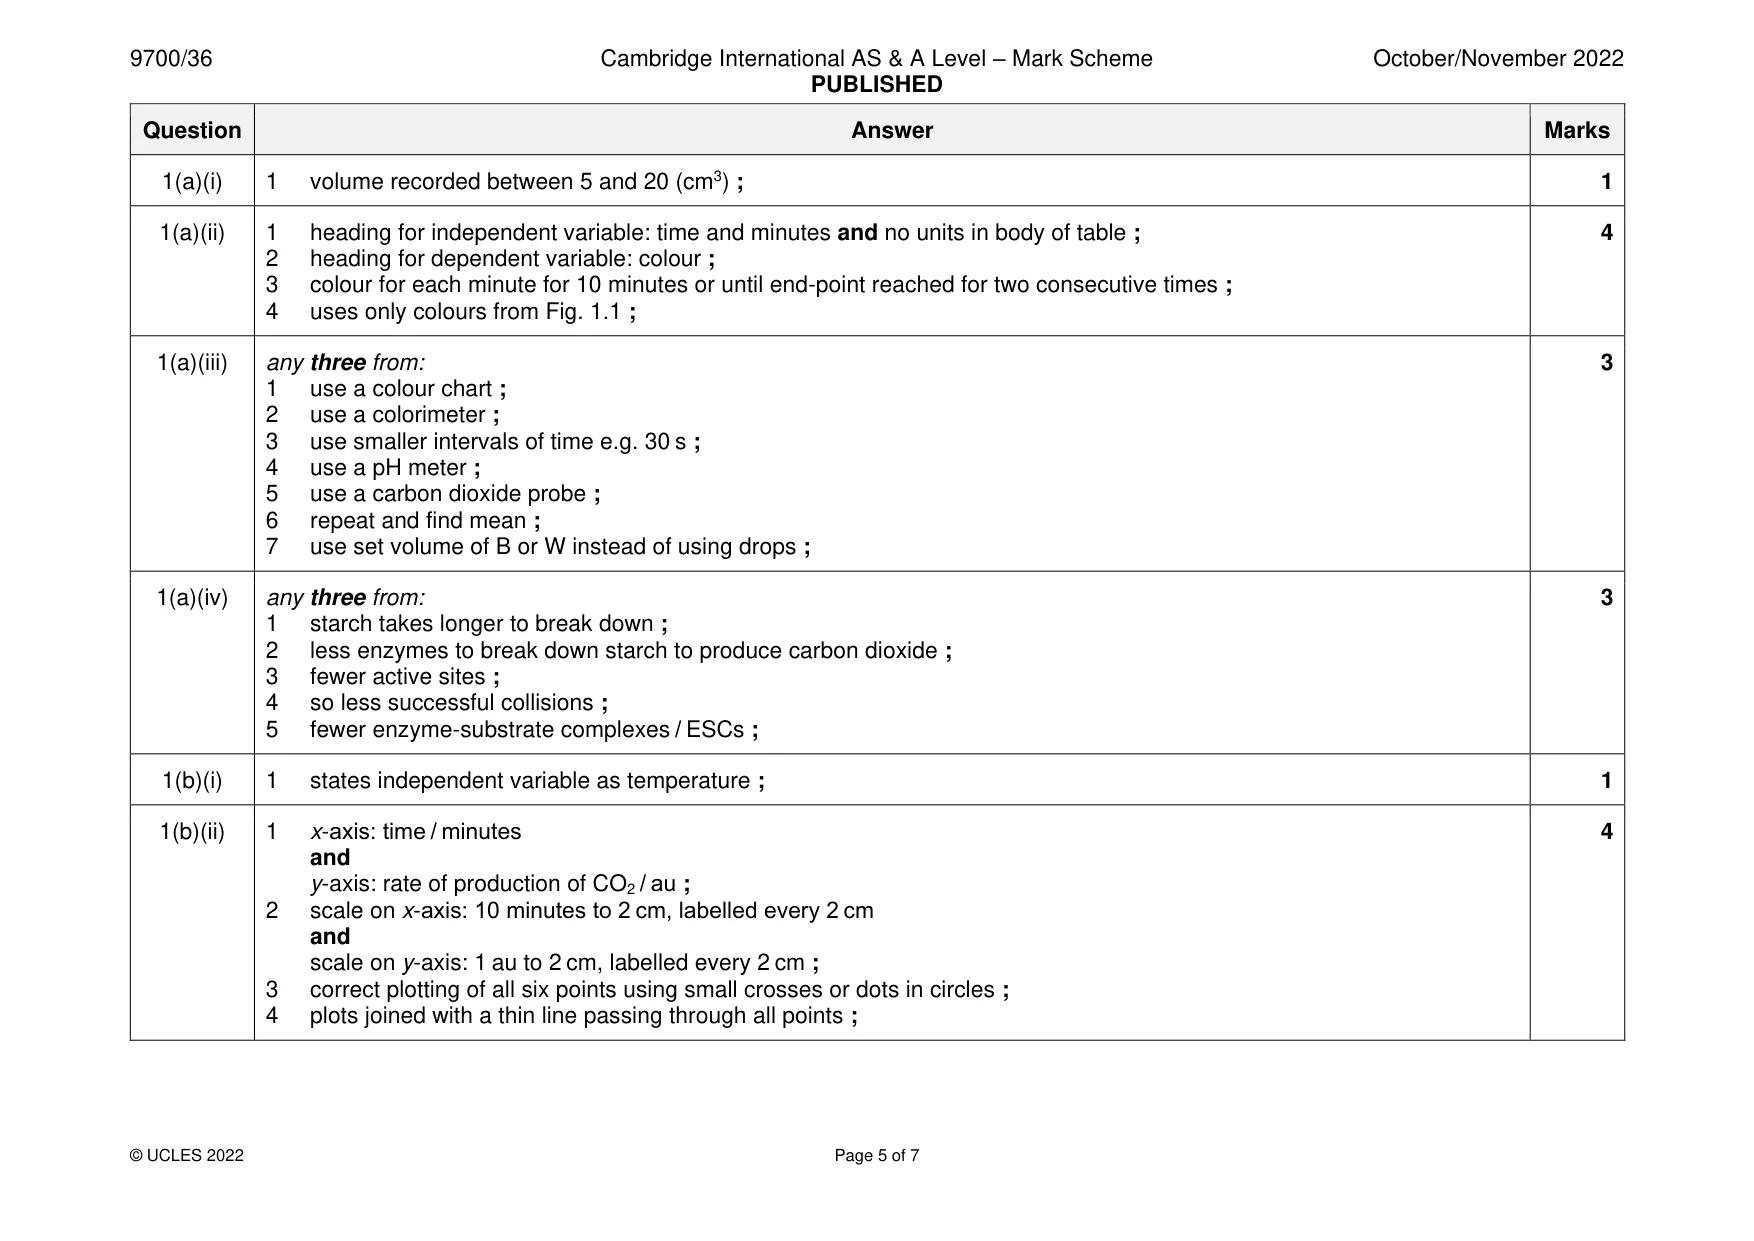
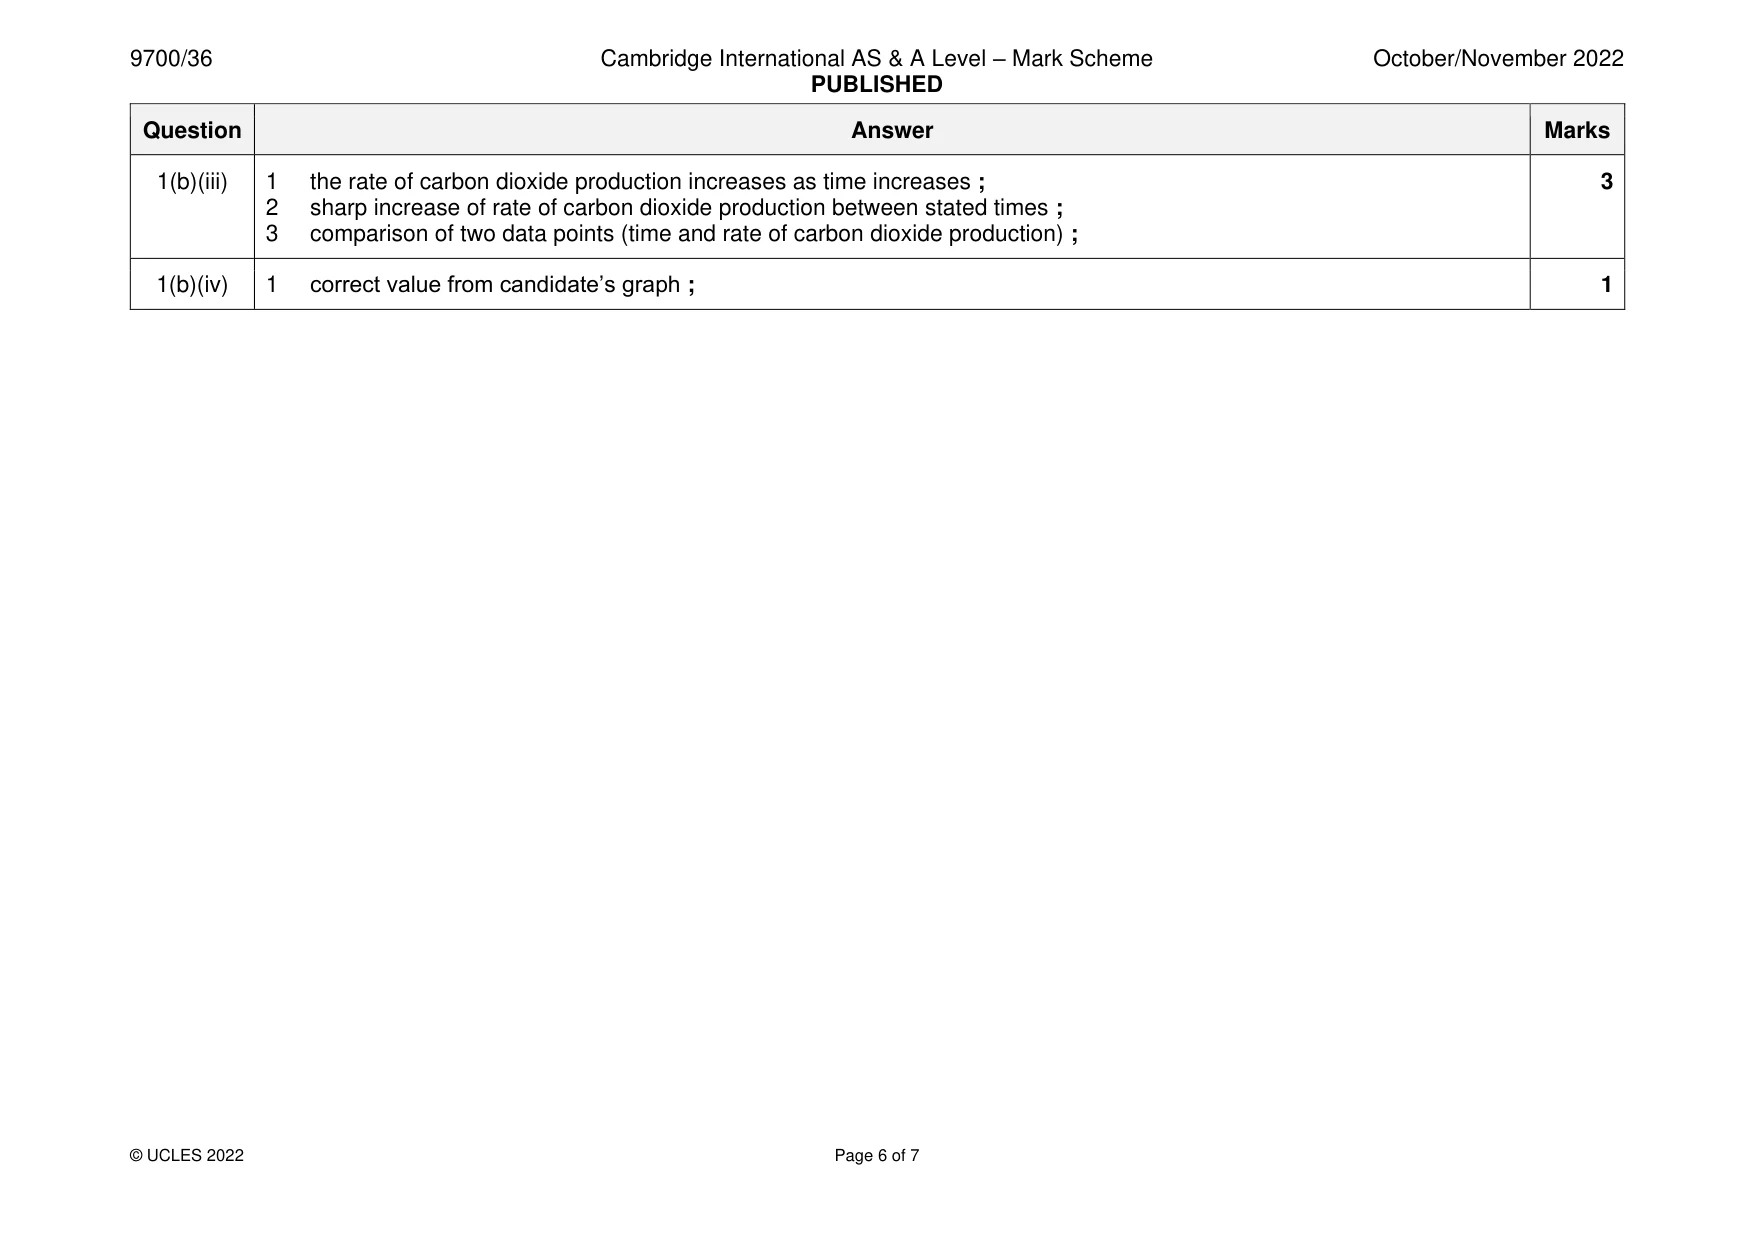
Mark scheme: Question Answer Marks 1(a)(i) 1 volume recorded between 5 and 20 (cm3) ; 1 1(a)(ii) 1 heading for independent variable: time and minutes and no units in body of table ; 4 2 heading for dependent variable: colour ; 3 colour for each minute for 10 minutes or until end-point reached for two consecutive times ; 4 uses only colours from Fig. 1.1 ; 1(a)(iii) any three from: 3 1 use a colour chart ; 2 use a colorimeter ; 3 use smaller intervals of time e.g. 30 s ; 4 use a pH meter ; 5 use a carbon dioxide probe ; 6 repeat and find mean ; 7 use set volume of B or W instead of using drops ; 1(a)(iv) any three from: 3 1 starch takes longer to break down ; 2 less enzymes to break down starch to produce carbon dioxide ; 3 fewer active sites ; 4 so less successful collisions ; 5 fewer enzyme-substrate complexes / ESCs ; 1(b)(i) 1 states independent variable as temperature ; 1 1(b)(ii) 1 x-axis: time / minutes 4 and y-axis: rate of production of CO2 / au ; 2 scale on x-axis: 10 minutes to 2 cm, labelled every 2 cm and scale on y-axis: 1 au to 2 cm, labelled every 2 cm ; 3 correct plotting of all six points using small crosses or dots in circles ; 4 plots joined with a thin line passing through all points ; 1(b)(iii) 1 the rate of carbon dioxide production increases as time increases ; 3 2 sharp increase of rate of carbon dioxide production between stated times ; 3 comparison of two data points (time and rate of carbon dioxide production) ; 1(b)(iv) 1 correct value from candidate’s graph ; 1
Q2 · N1 is a slide of a stained transverse section through a plant root
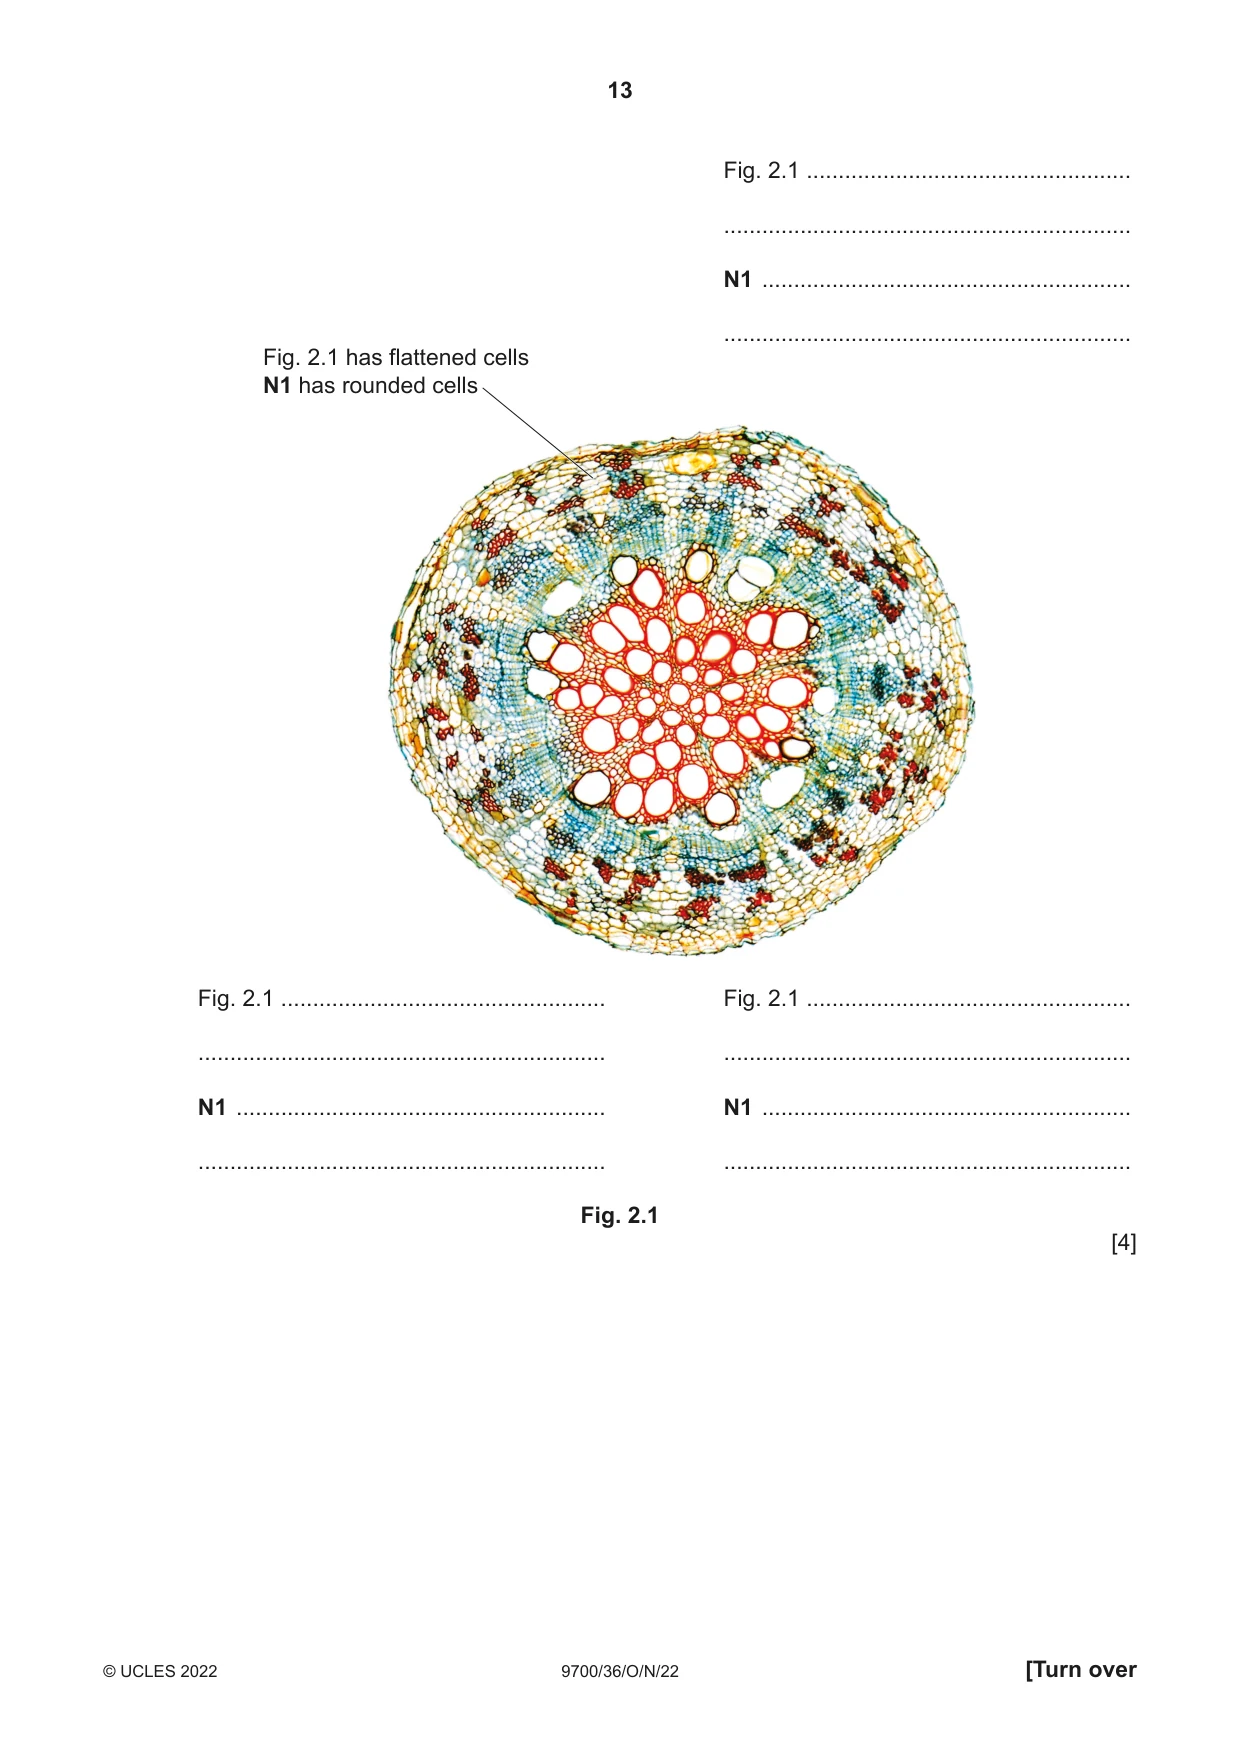
2 N1 is a slide of a stained transverse section through a plant root. (a) (i) Draw a large plan diagram of the whole section of the root on N1. Use a sharp pencil. Use one ruled label line and label to identify the phloem. [5] (ii) Observe the cells in the cortex of the root on N1. Select a group of four adjacent cells that make up this tissue. Each cell must touch at least two of the other cells. • Make a large drawing of this group of four cells. • Use one ruled label line and label to identify an air space. [5] (b) Fig. 2.1 is a photomicrograph of a stained transverse section through a different root. Observe the photomicrograph in Fig. 2.1 and the section on N1 to identify differences between them. Fig. 2.1 has been annotated to describe one of these differences. A label line has been used to indicate the feature that is different. Complete Fig. 2.1 by: • identifying and annotating three more differences between the photomicrograph in Fig. 2.1 and the section on N1 • using a label line to identify the feature that is different.
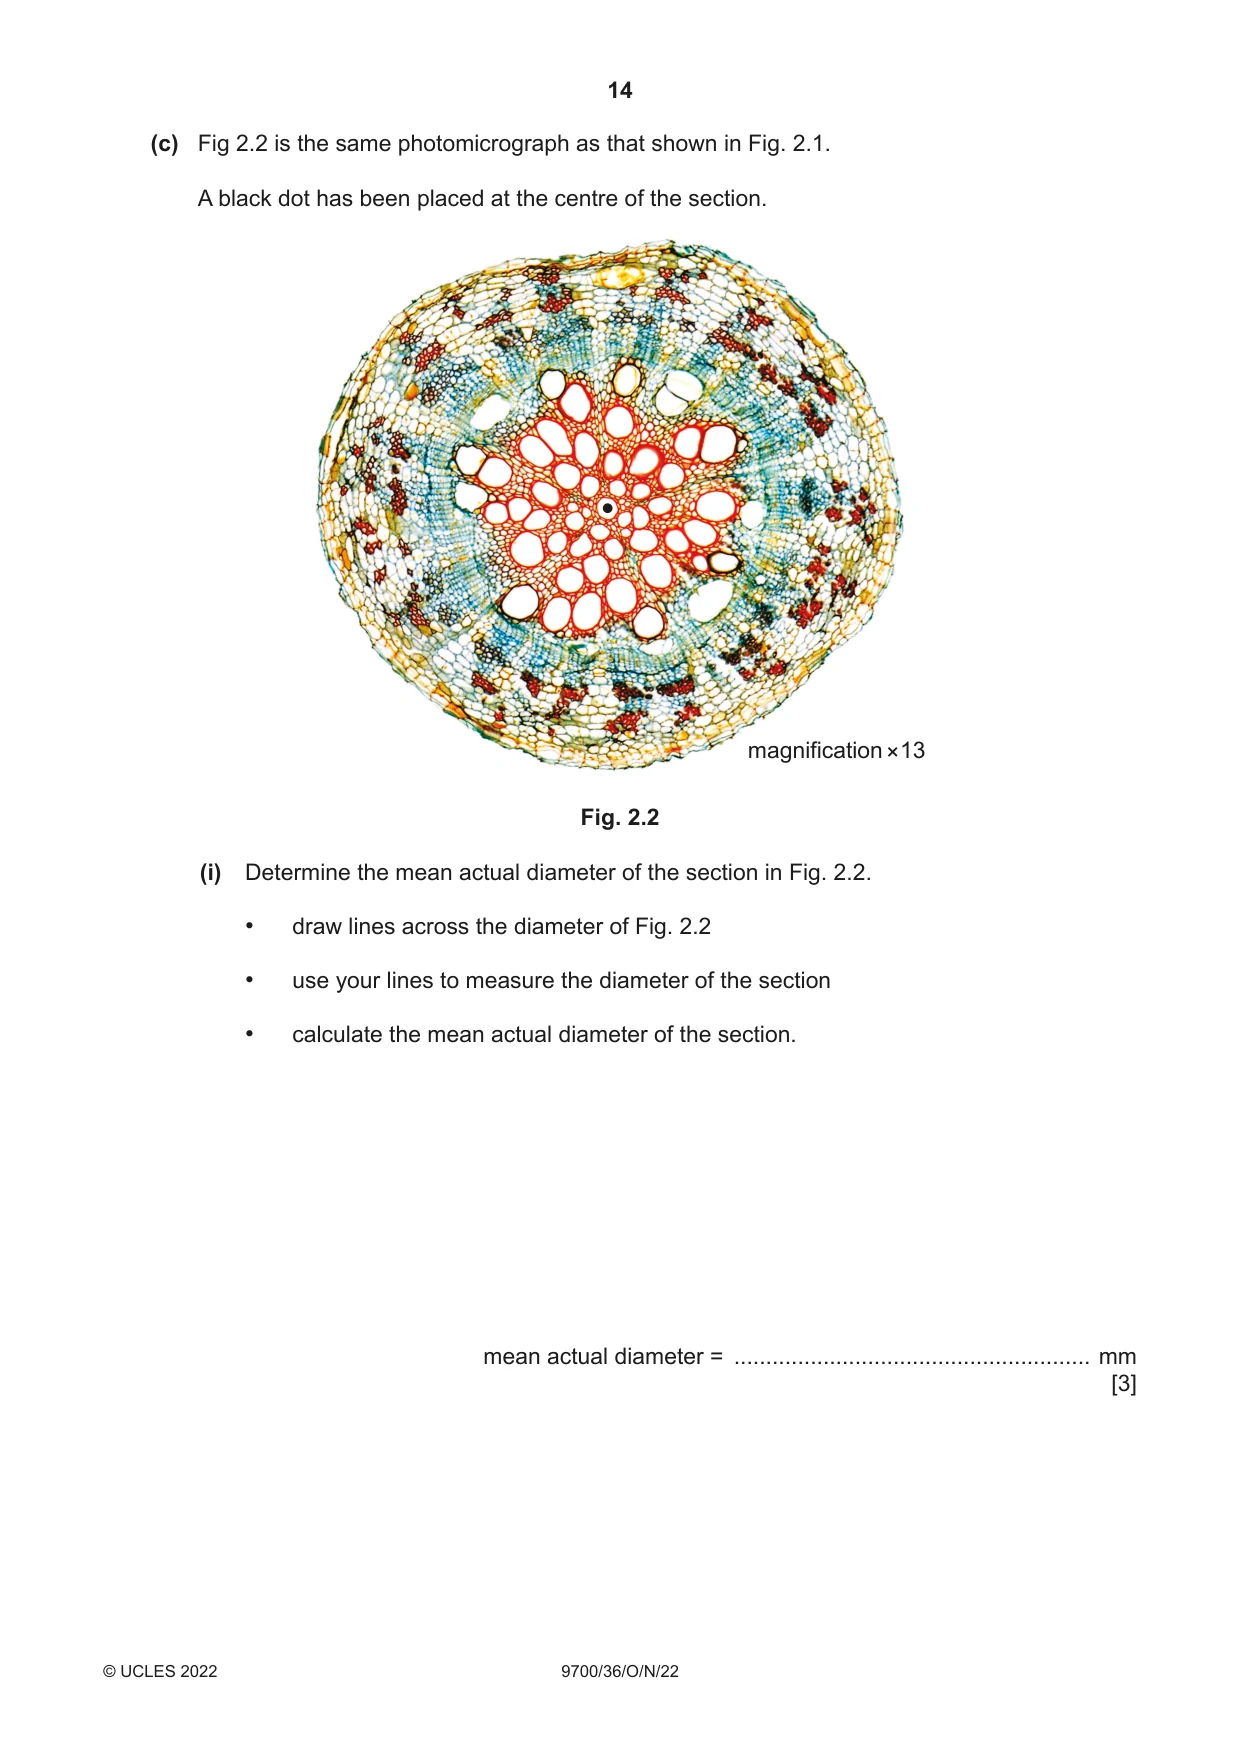
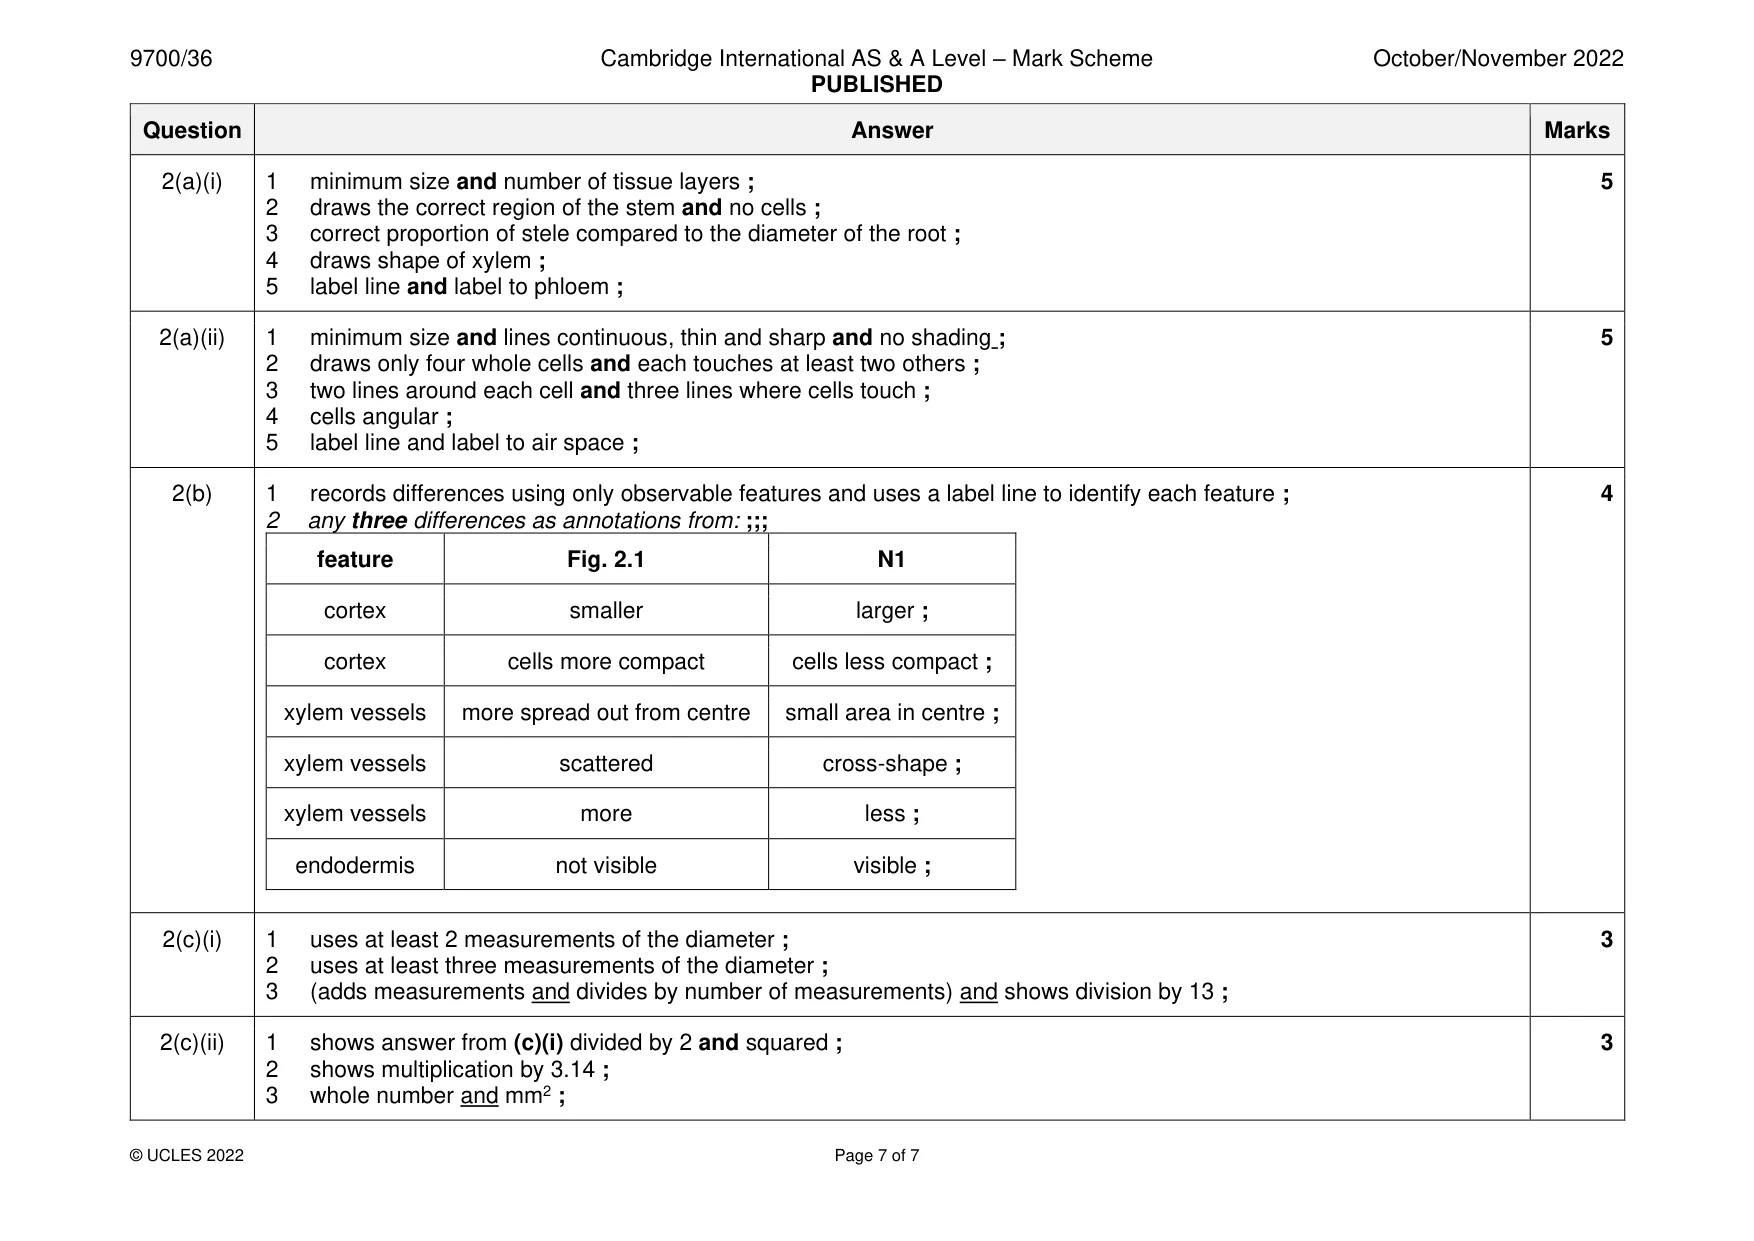
Mark scheme: 2(a)(i) 1 minimum size and number of tissue layers ; 5 2 draws the correct region of the stem and no cells ; 3 correct proportion of stele compared to the diameter of the root ; 4 draws shape of xylem ; 5 label line and label to phloem ; 2(a)(ii) 1 minimum size and lines continuous, thin and sharp and no shading ; 5 2 draws only four whole cells and each touches at least two others ; 3 two lines around each cell and three lines where cells touch ; 4 cells angular ; 5 label line and label to air space ; 2(b) 1 records differences using only observable features and uses a label line to identify each feature ; 4 2 any three differences as annotations from: ;;; feature Fig. 2.1 N1 cortex smaller larger ; cortex cells more compact cells less compact ; xylem vessels more spread out from centre small area in centre ; xylem vessels scattered cross-shape ; xylem vessels more less ; endodermis not visible visible ; 2(c)(i) 1 uses at least 2 measurements of the diameter ; 3 2 uses at least three measurements of the diameter ; 3 (adds measurements and divides by number of measurements) and shows division by 13 ; 2(c)(ii) 1 shows answer from (c)(i) divided by 2 and squared ; 3 2 shows multiplication by 3.14 ; 3 whole number and mm2 ;
What was in this paper
The subtopics covered by these 2 questions, and how many questions each got. Open one in a new tab to see every Cambridge question on it.
What you needed in this session
Cambridge’s own grade thresholds for 2022 Oct/Nov, Paper 3 · Variant 6. A higher threshold means an easier paper — the bar moves with how the cohort did.