Cambridge A Level Biology 9700 — 2017 Oct/Nov Paper 3 · Variant 4
9700/34/O/N/17 · 2 questions · 40 marks · ≈45 min
The question paper and its mark scheme, free to read here and free to download. This is Cambridge’s own paper, exactly as it was sat.
Question paper12 pages

Mark scheme8 pages
Answers below. Sit the paper first if you are practising.
Questions as text
Q1 · Yeast cells contain enzymes that catalyse metabolic reactions
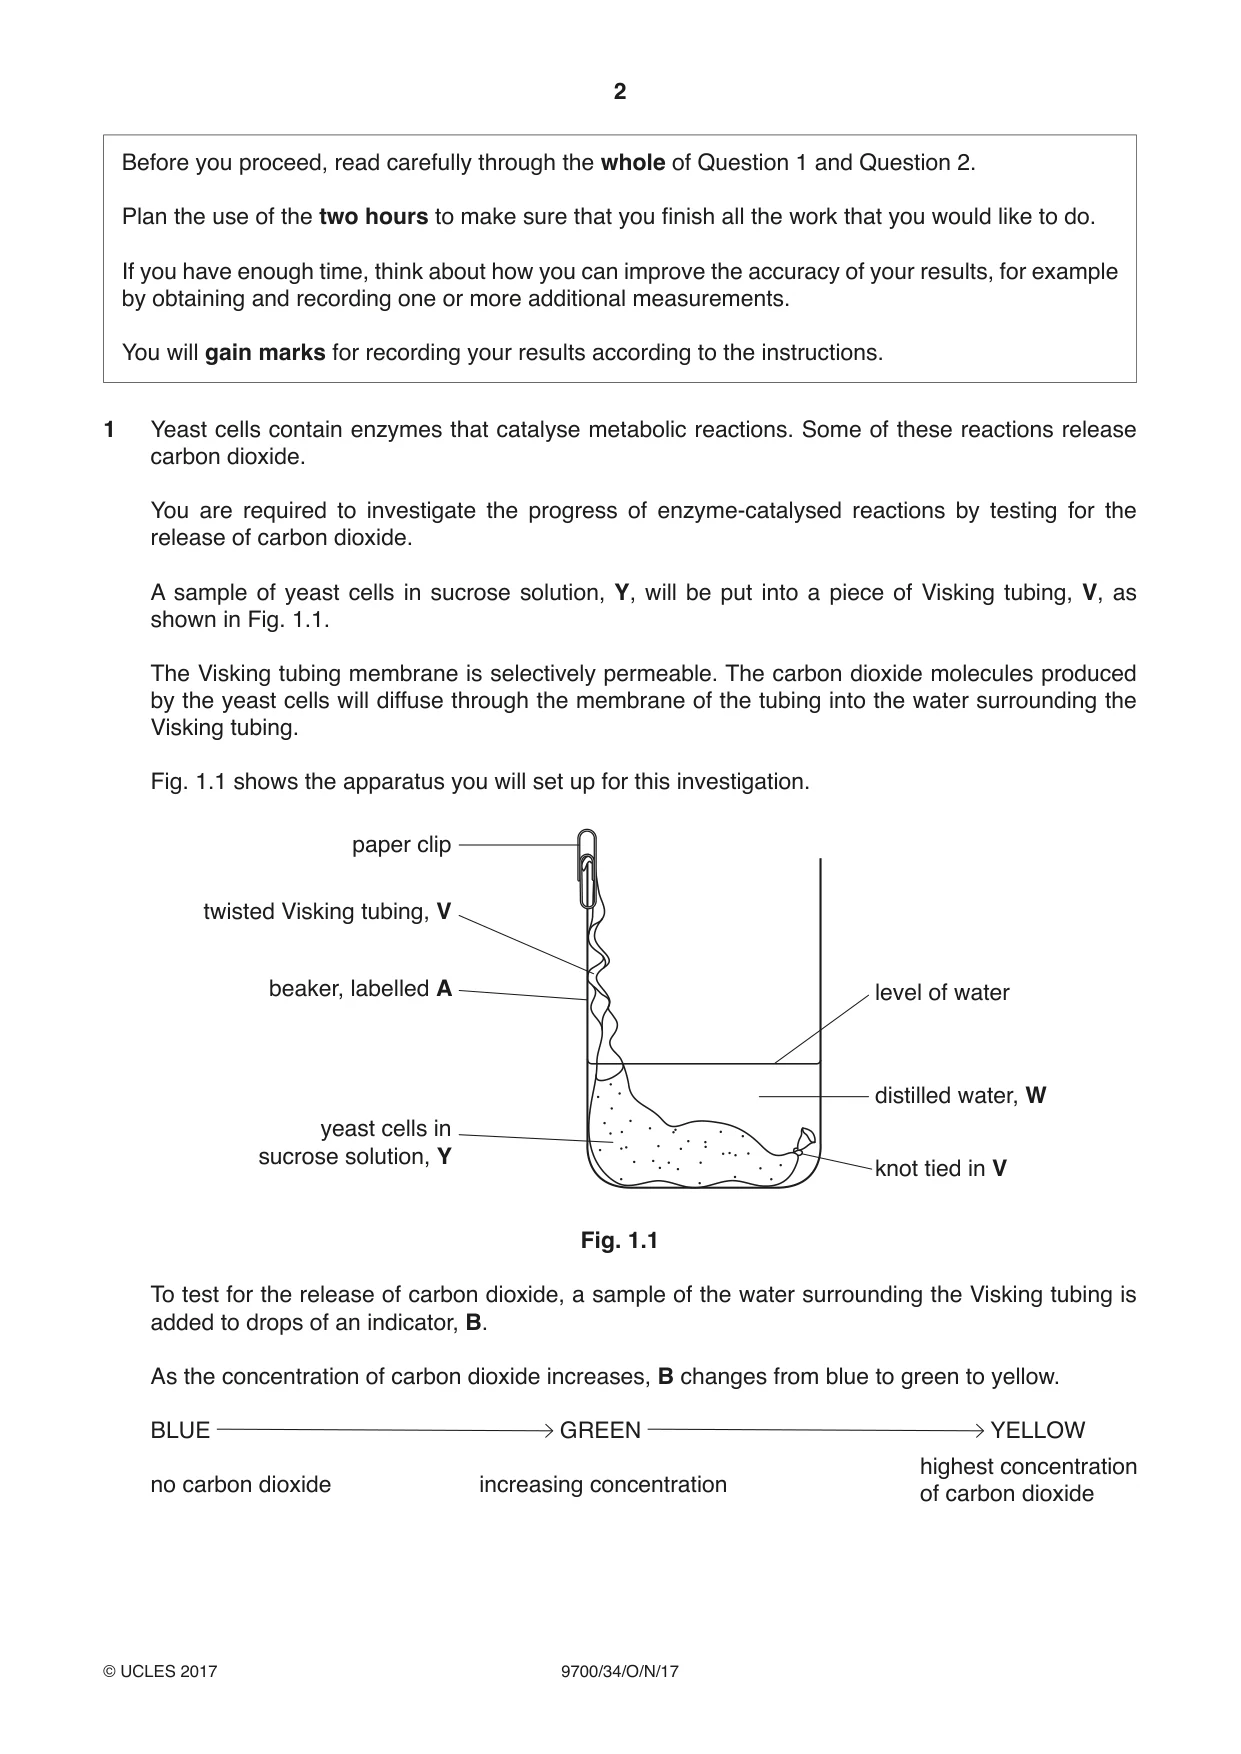
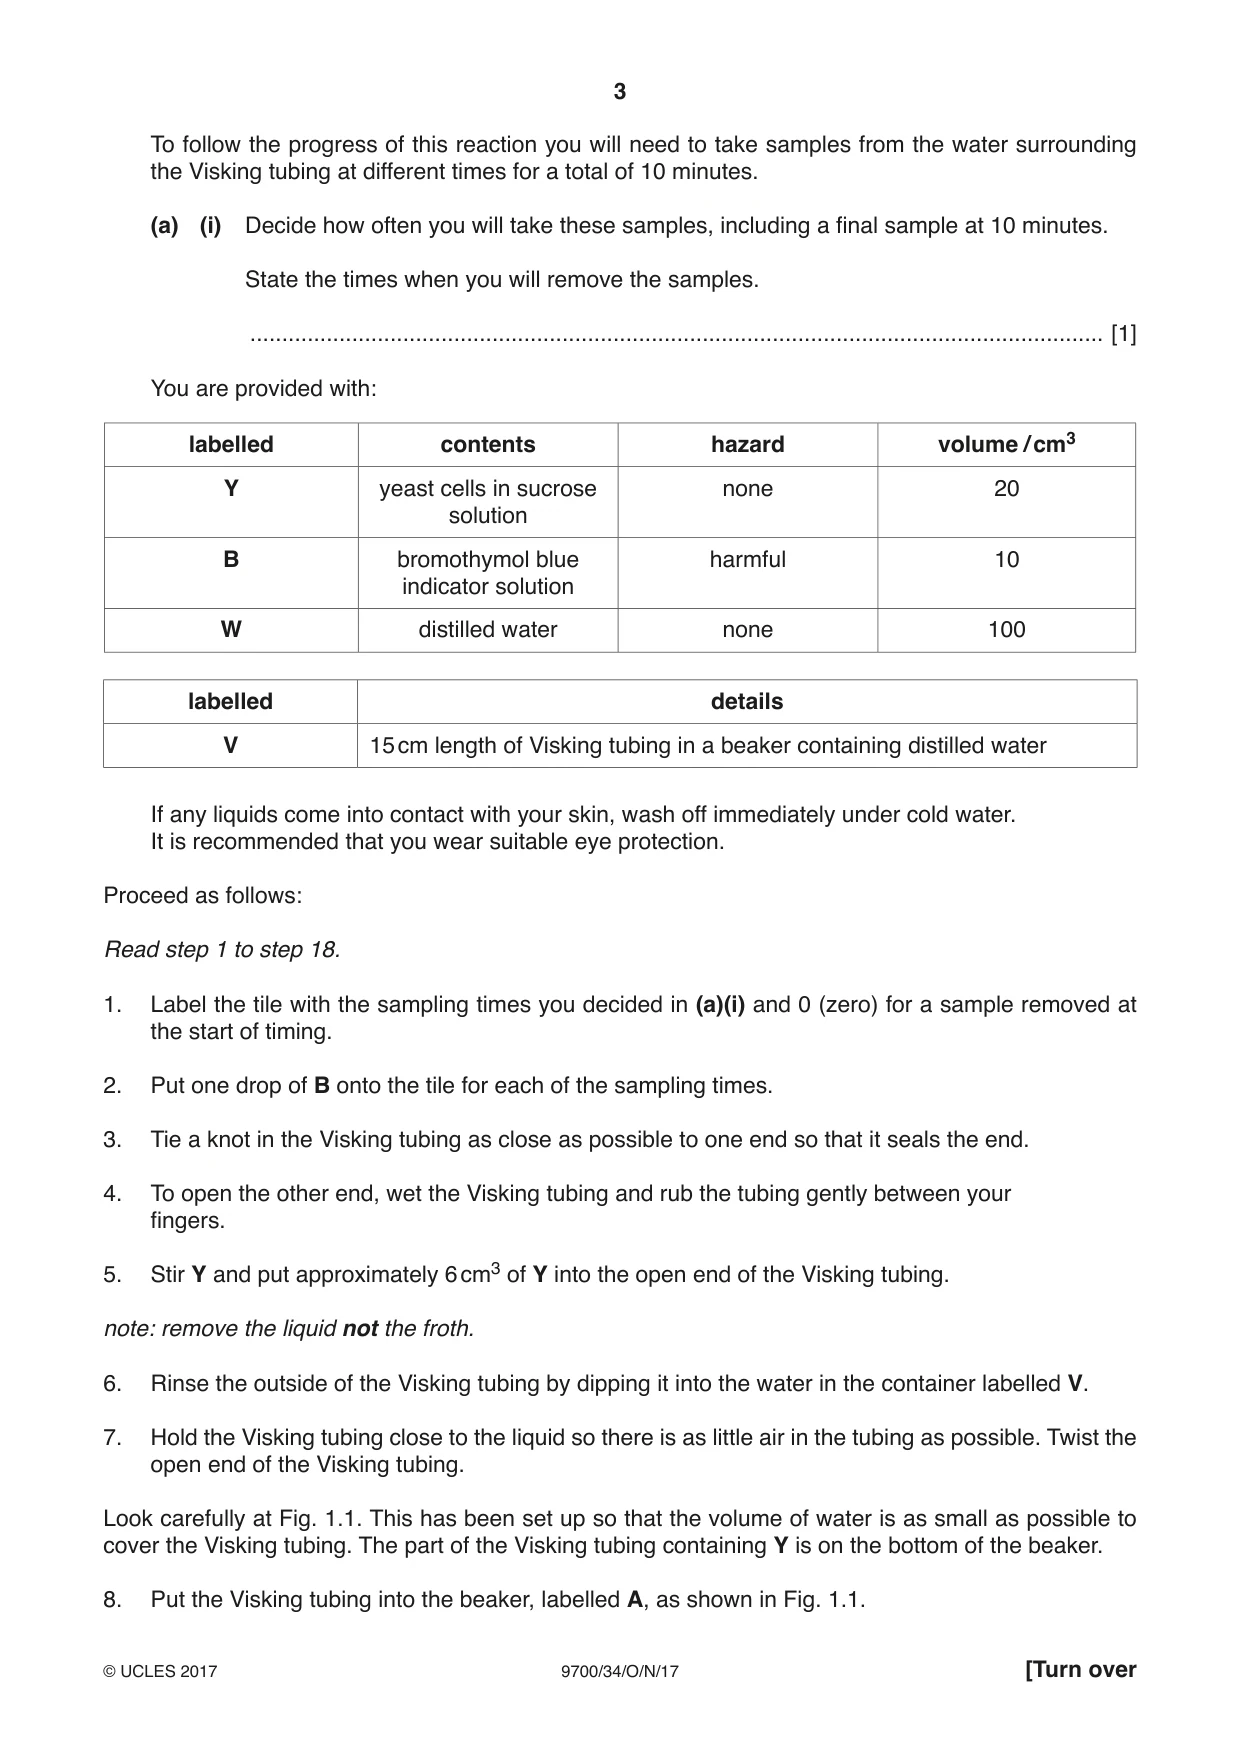
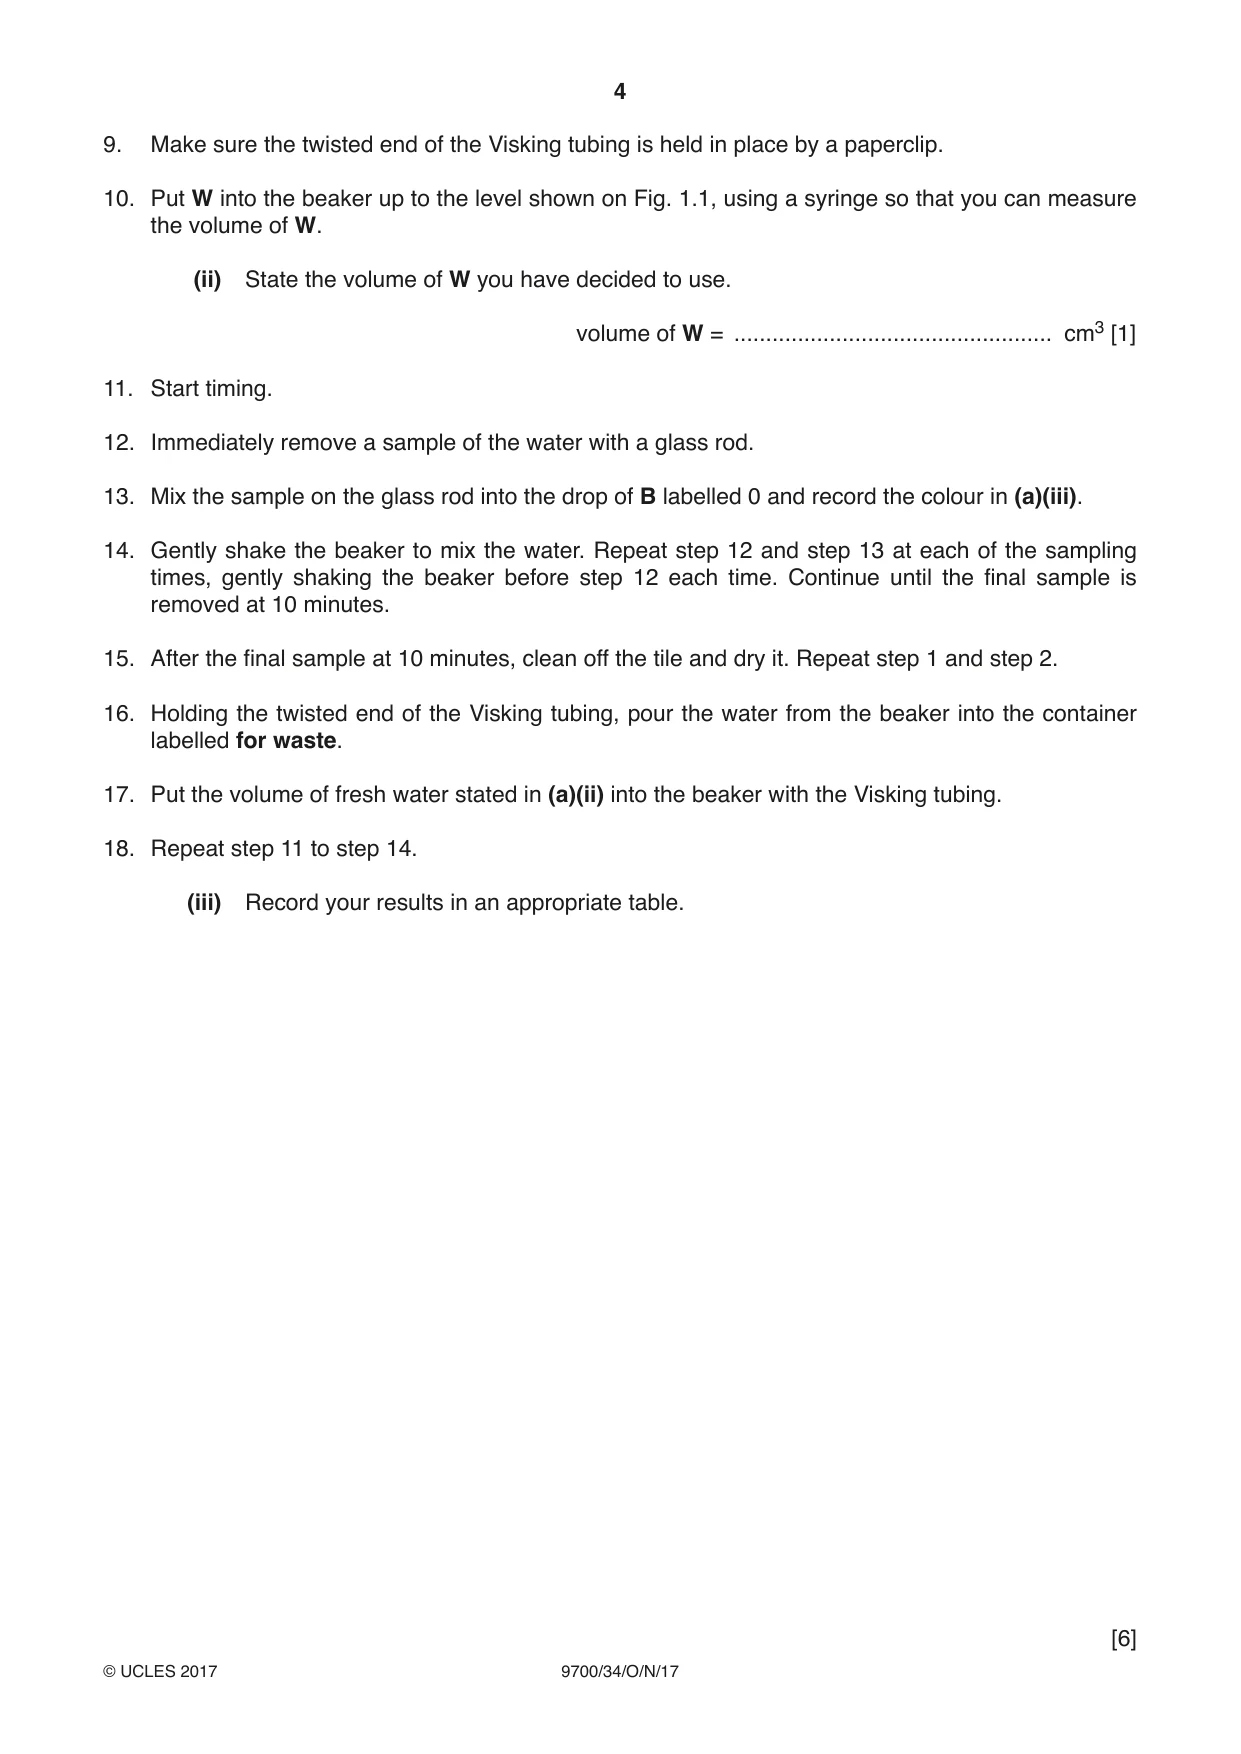
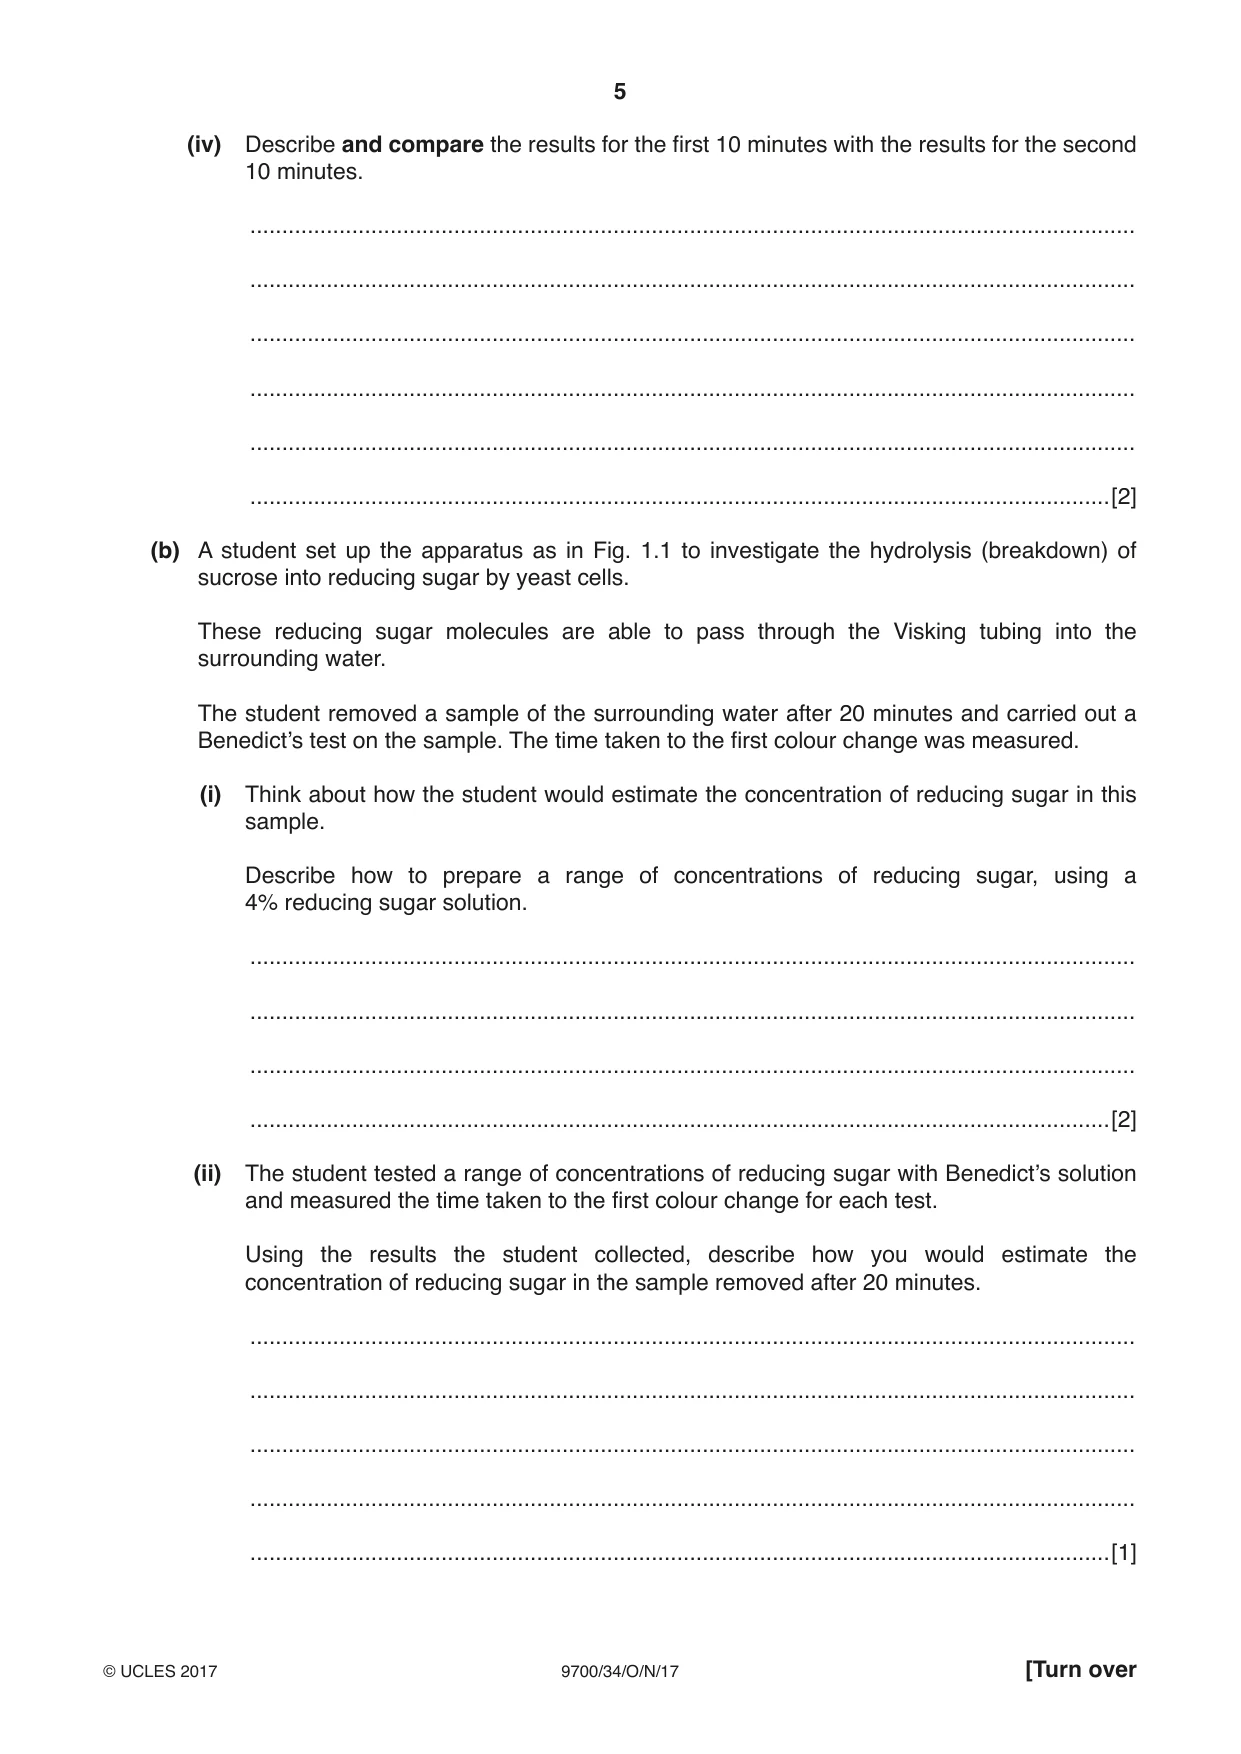
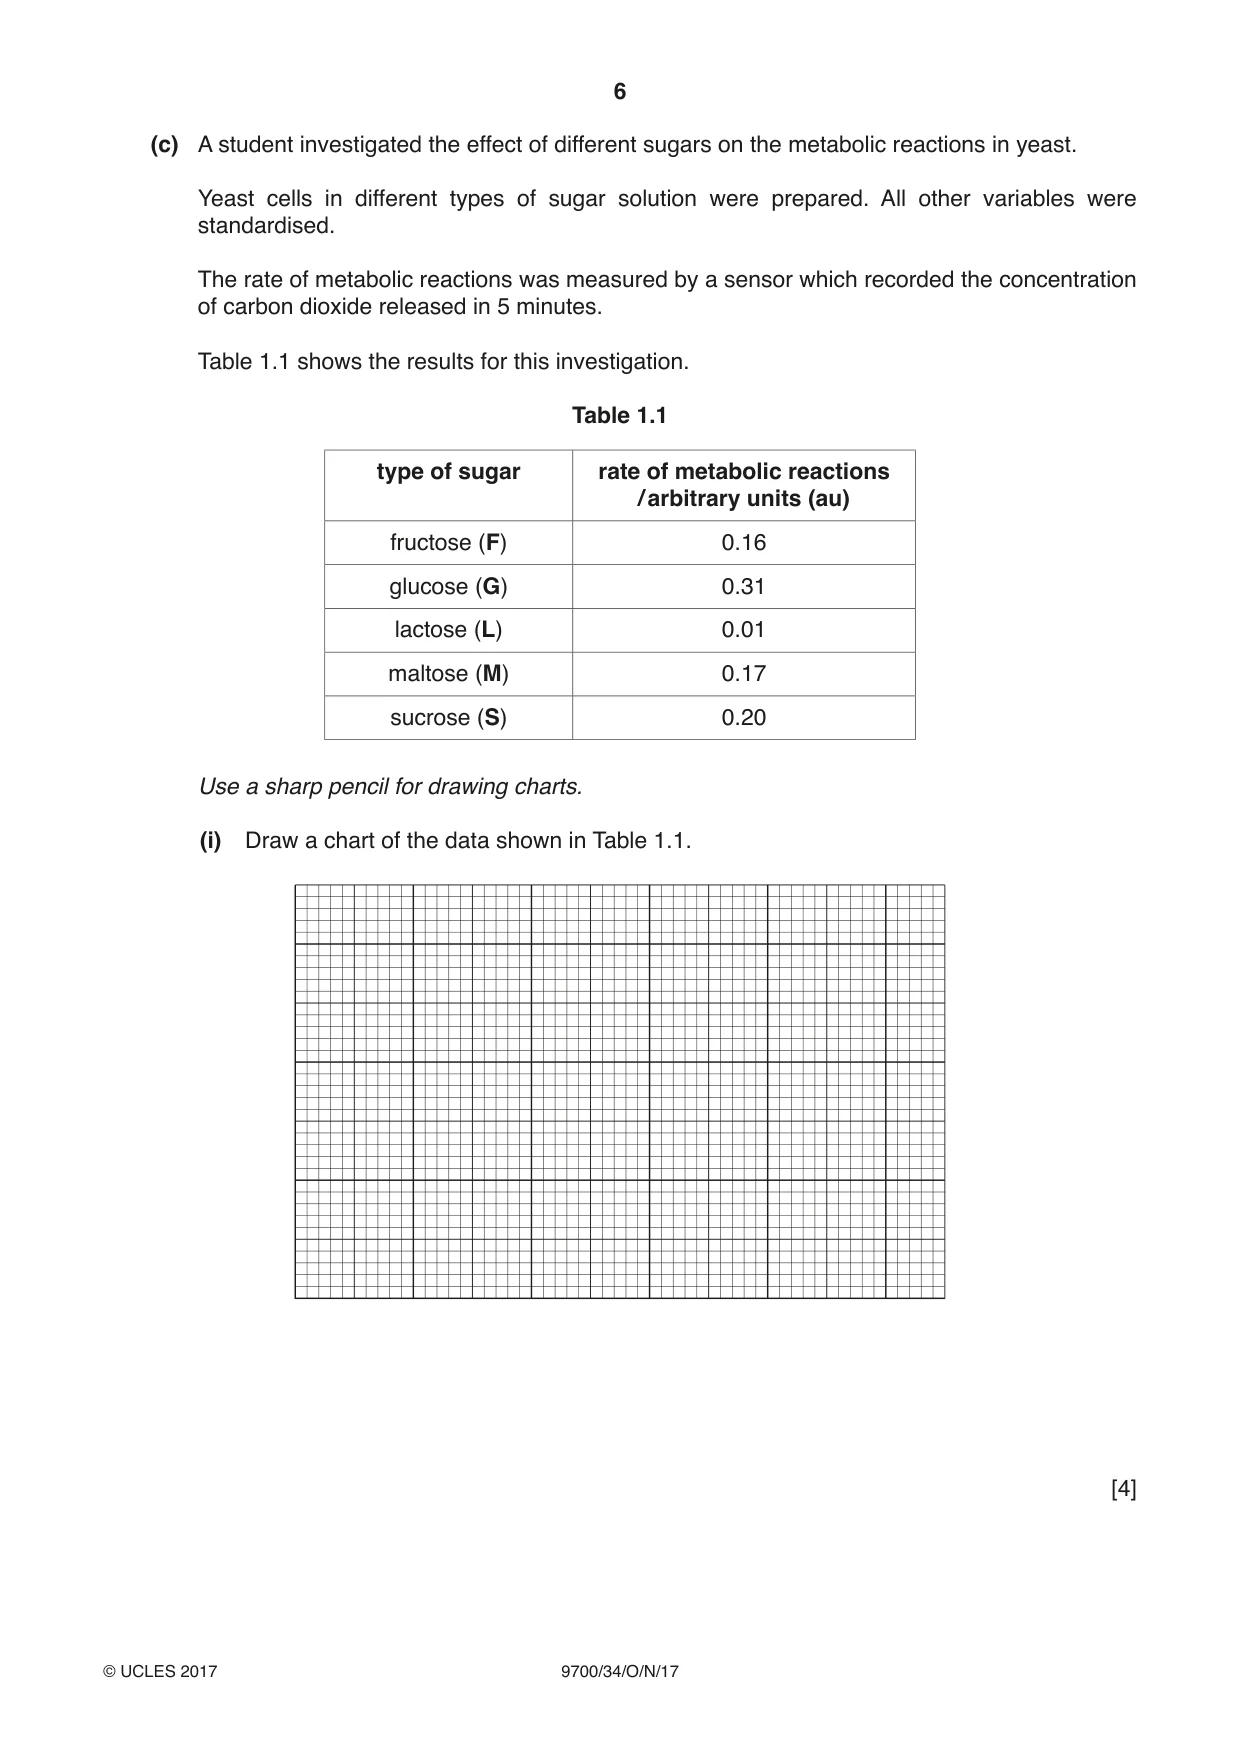
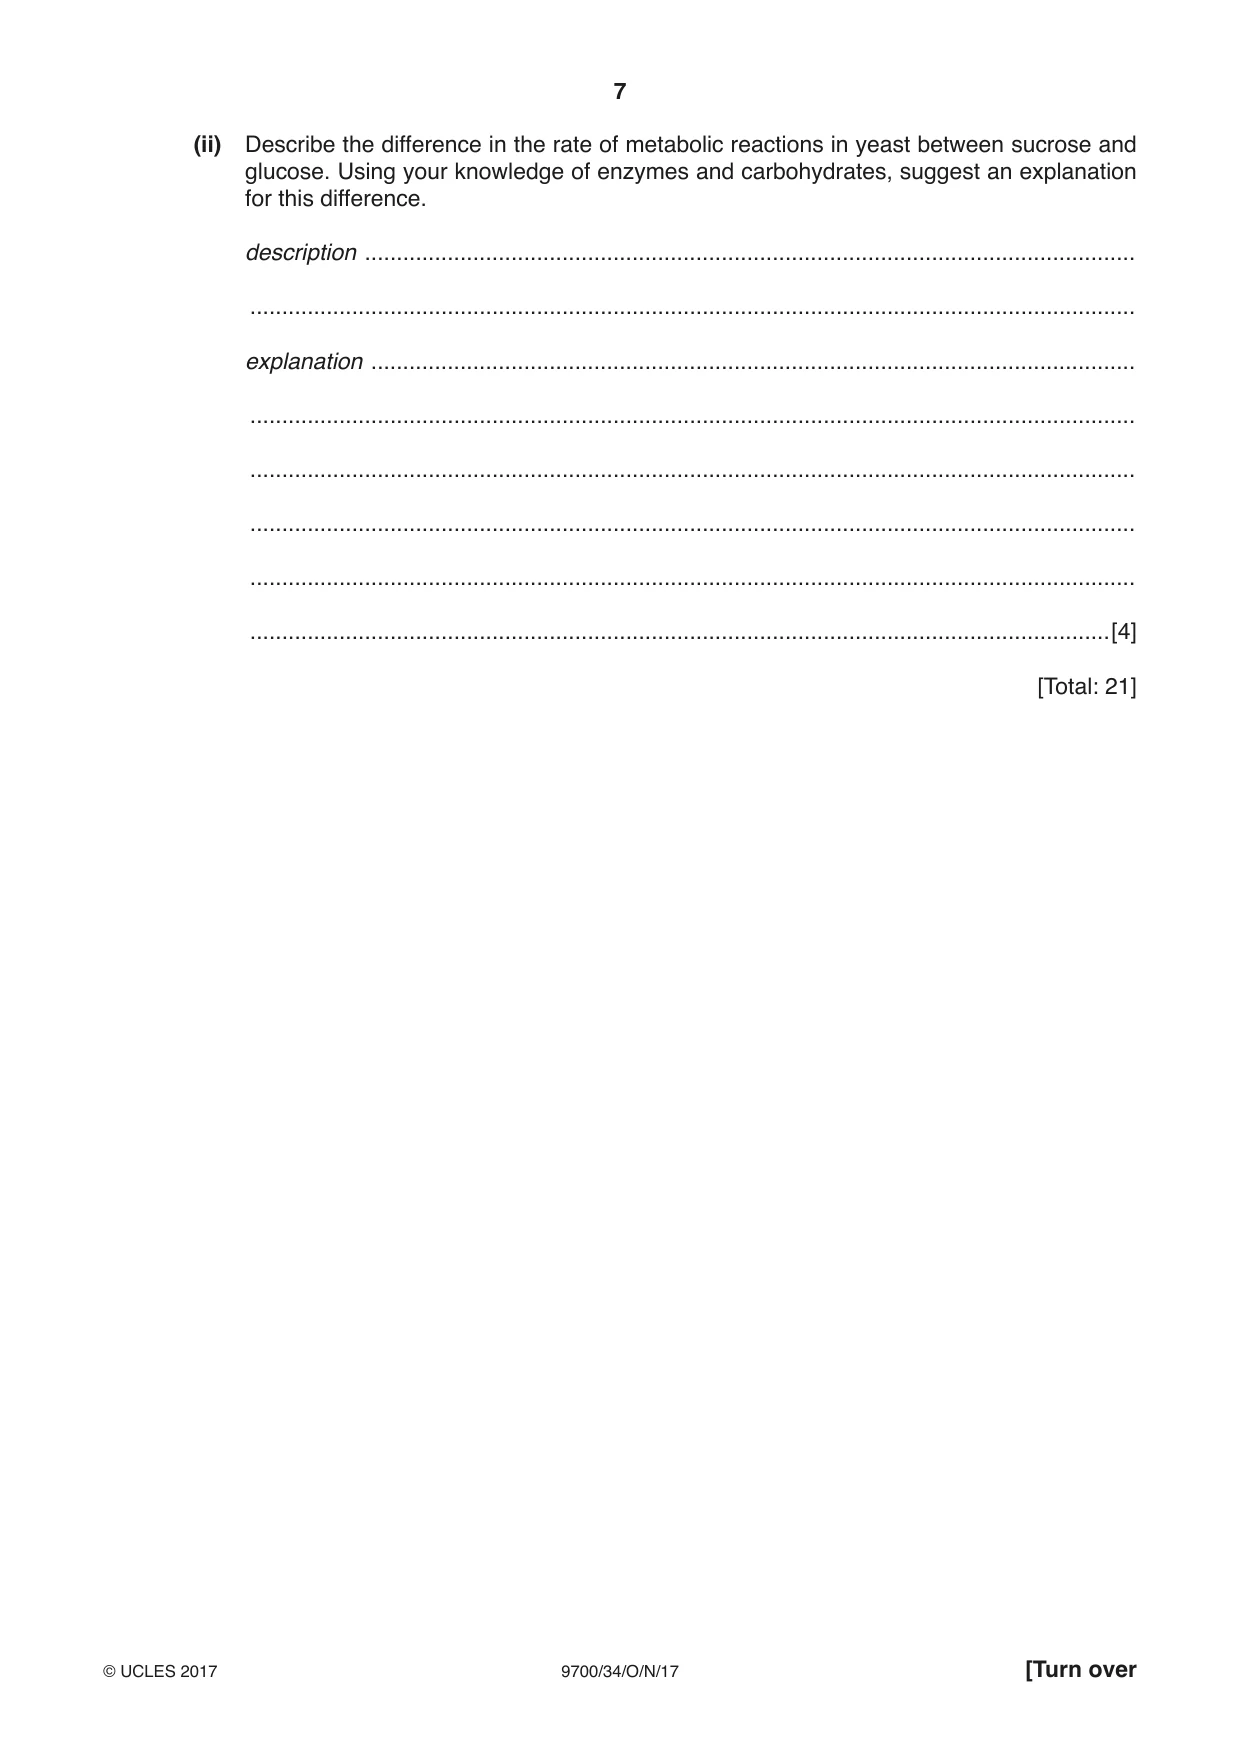
1 Yeast cells contain enzymes that catalyse metabolic reactions. Some of these reactions release carbon dioxide. You are required to investigate the progress of enzyme-catalysed reactions by testing for the release of carbon dioxide. A sample of yeast cells in sucrose solution, Y, will be put into a piece of Visking tubing, V, as shown in Fig. 1.1. The Visking tubing membrane is selectively permeable. The carbon dioxide molecules produced by the yeast cells will diffuse through the membrane of the tubing into the water surrounding the Visking tubing. Fig. 1.1 shows the apparatus you will set up for this investigation. paper clip twisted Visking tubing, V beaker, labelled A level of water distilled water, W yeast cells in sucrose solution, Y knot tied in V Fig. 1.1 To test for the release of carbon dioxide, a sample of the water surrounding the Visking tubing is added to drops of an indicator, B. As the concentration of carbon dioxide increases, B changes from blue to green to yellow. BLUE GREEN YELLOW highest concentration no carbon dioxide increasing concentration of carbon dioxide To follow the progress of this reaction you will need to take samples from the water surrounding the Visking tubing at different times for a total of 10 minutes. (a) (i) Decide how often you will take these samples, including a final sample at 10 minutes. State the times when you will remove the samples. ...................................................................................................................................... [1] You are provided with: labelled contents hazard volume / cm3 Y yeast cells in sucrose none 20 solution B bromothymol blue harmful 10 indicator solution W distilled water none 100 labelled details V 15 cm length of Visking tubing in a beaker containing distilled water If any liquids come into contact with your skin, wash off immediately under cold water. It is recommended that you wear suitable eye protection. Proceed as follows: Read step 1 to step 18. 1. Label the tile with the sampling times you decided in (a)(i) and 0 (zero) for a sample removed at the start of timing. 2. Put one drop of B onto the tile for each of the sampling times. 3. Tie a knot in the Visking tubing as close as possible to one end so that it seals the end. 4. To open the other end, wet the Visking tubing and rub the tubing gently between your fingers. 5. Stir Y and put approximately 6 cm3 of Y into the open end of the Visking tubing. note: remove the liquid not the froth. 6. Rinse the outside of the Visking tubing by dipping it into the water in the container labelled V. 7. Hold the Visking tubing close to the liquid so there is as little air in the tubing as possible. Twist the open end of the Visking tubing. Look carefully at Fig. 1.1. This has been set up so that the volume of water is as small as possible to cover the Visking tubing. The part of the Visking tubing containing Y is on the bottom of the beaker. 8. Put the Visking tubing into the beaker, labelled A, as shown in Fig. 1.1. 9. Make sure the twisted end of the Visking tubing is held in place by a paperclip. 10. Put W into the beaker up to the level shown on Fig. 1.1, using a syringe so that you can measure the volume of W. (ii) State the volume of W you have decided to use. volume of W = .................................................. cm3 [1] 11. Start timing. 12. Immediately remove a sample of the water with a glass rod. 13. Mix the sample on the glass rod into the drop of B labelled 0 and record the colour in (a)(iii). 14. Gently shake the beaker to mix the water. Repeat step 12 and step 13 at each of the sampling times, gently shaking the beaker before step 12 each time. Continue until the final sample is removed at 10 minutes. 15. After the final sample at 10 minutes, clean off the tile and dry it. Repeat step 1 and step 2. 16. Holding the twisted end of the Visking tubing, pour the water from the beaker into the container labelled for waste. 17. Put the volume of fresh water stated in (a)(ii) into the beaker with the Visking tubing. 18. Repeat step 11 to step 14. (iii) Record your results in an appropriate table. [6] (iv) Describe and compare the results for the first 10 minutes with the results for the second 10 minutes. ........................................................................................................................................... ........................................................................................................................................... ........................................................................................................................................... ........................................................................................................................................... ........................................................................................................................................... .......................................................................................................................................[2] (b) A student set up the apparatus as in Fig. 1.1 to investigate the hydrolysis (breakdown) of sucrose into reducing sugar by yeast cells. These reducing sugar molecules are able to pass through the Visking tubing into the surrounding water. The student removed a sample of the surrounding water after 20 minutes and carried out a Benedict’s test on the sample. The time taken to the first colour change was measured. (i) Think about how the student would estimate the concentration of reducing sugar in this sample. Describe how to prepare a range of concentrations of reducing sugar, using a 4% reducing sugar solution. ........................................................................................................................................... ........................................................................................................................................... ........................................................................................................................................... .......................................................................................................................................[2] (ii) The student tested a range of concentrations of reducing sugar with Benedict’s solution and measured the time taken to the first colour change for each test. Using the results the student collected, describe how you would estimate the concentration of reducing sugar in the sample removed after 20 minutes. ........................................................................................................................................... ........................................................................................................................................... ........................................................................................................................................... ........................................................................................................................................... .......................................................................................................................................[1] (c) A student investigated the effect of different sugars on the metabolic reactions in yeast. Yeast cells in different types of sugar solution were prepared. All other variables were standardised. The rate of metabolic reactions was measured by a sensor which recorded the concentration of carbon dioxide released in 5 minutes. Table 1.1 shows the results for this investigation. Table 1.1 type of sugar rate of metabolic reactions / arbitrary units (au) fructose (F) 0.16 glucose (G) 0.31 lactose (L) 0.01 maltose (M) 0.17 sucrose (S) 0.20 Use a sharp pencil for drawing charts. (i) Draw a chart of the data shown in Table 1.1. [4] (ii) Describe the difference in the rate of metabolic reactions in yeast between sucrose and glucose. Using your knowledge of enzymes and carbohydrates, suggest an explanation for this difference. description ......................................................................................................................... ........................................................................................................................................... explanation ........................................................................................................................ ........................................................................................................................................... ........................................................................................................................................... ........................................................................................................................................... ........................................................................................................................................... .......................................................................................................................................[4] [Total: 21]
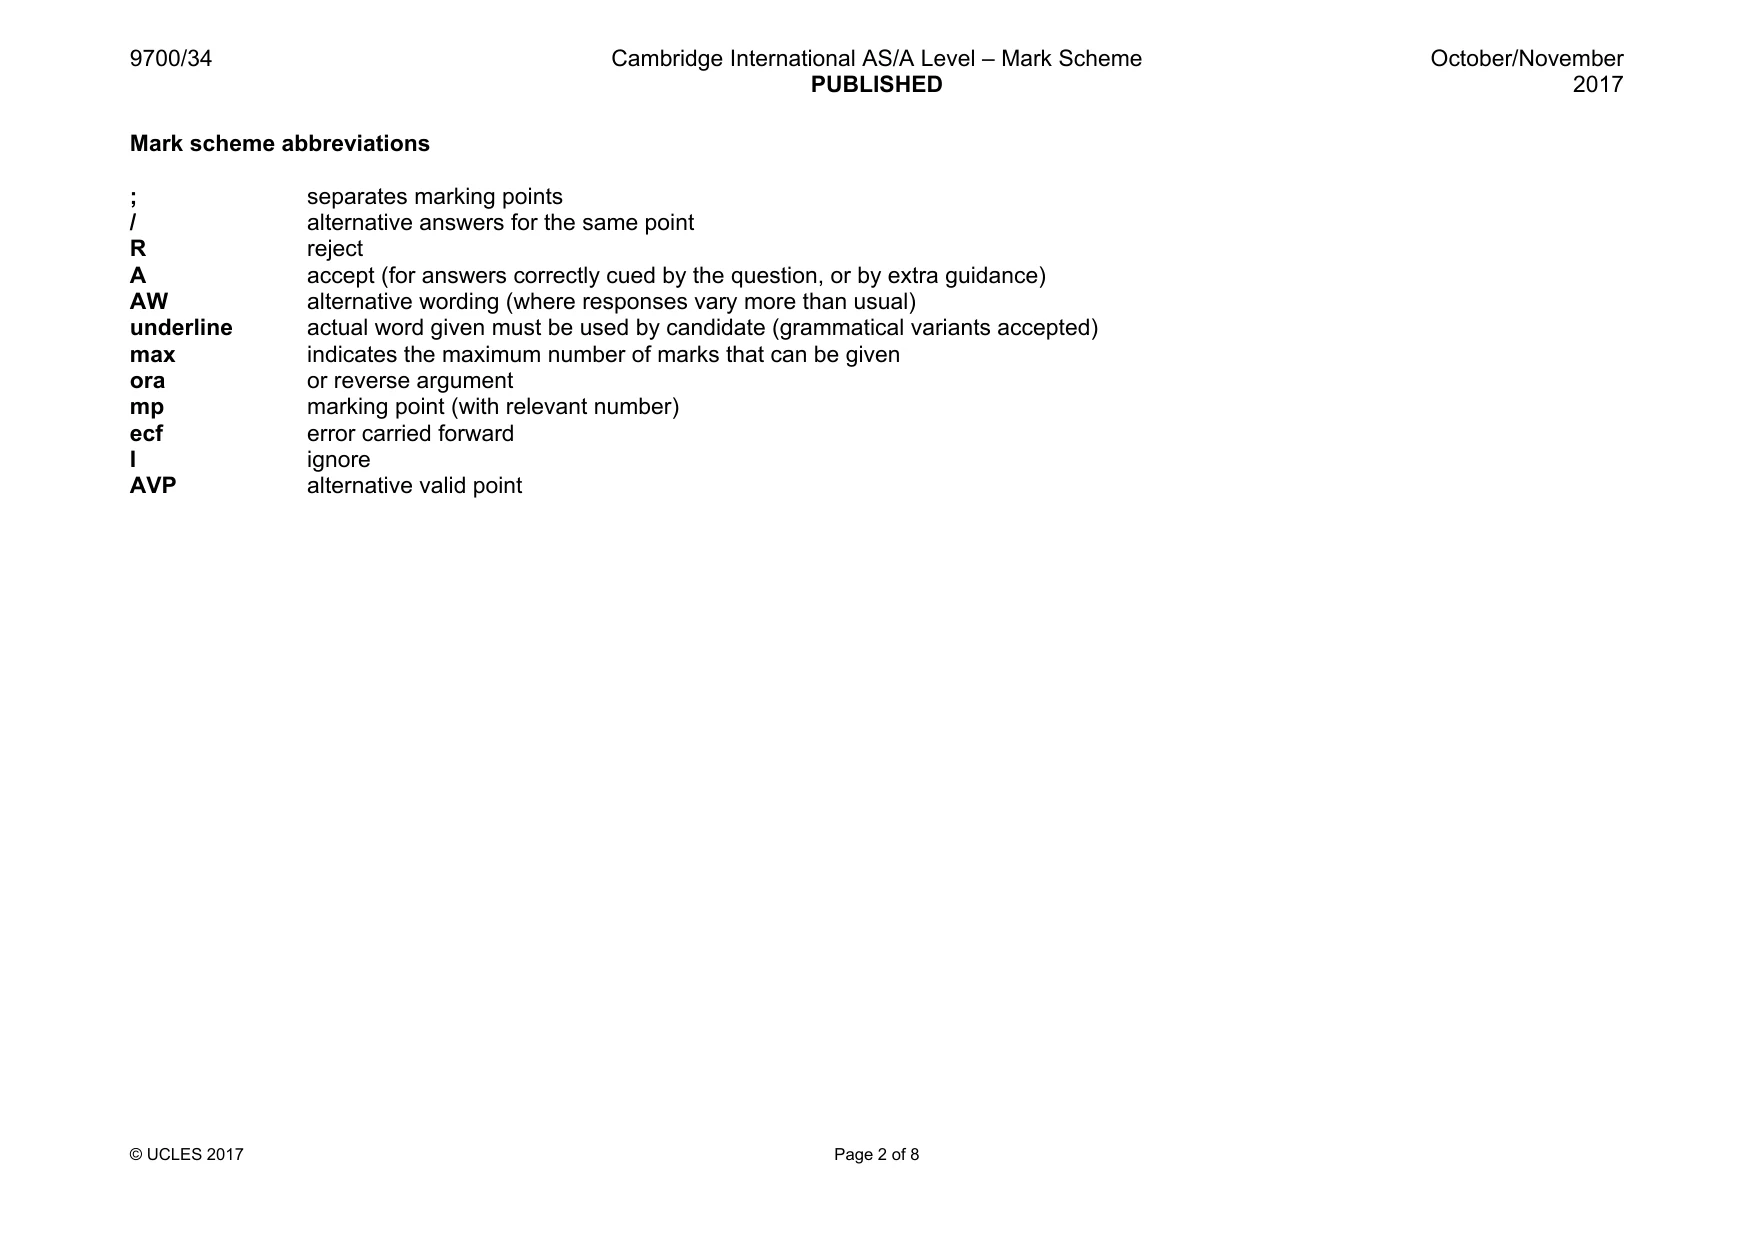
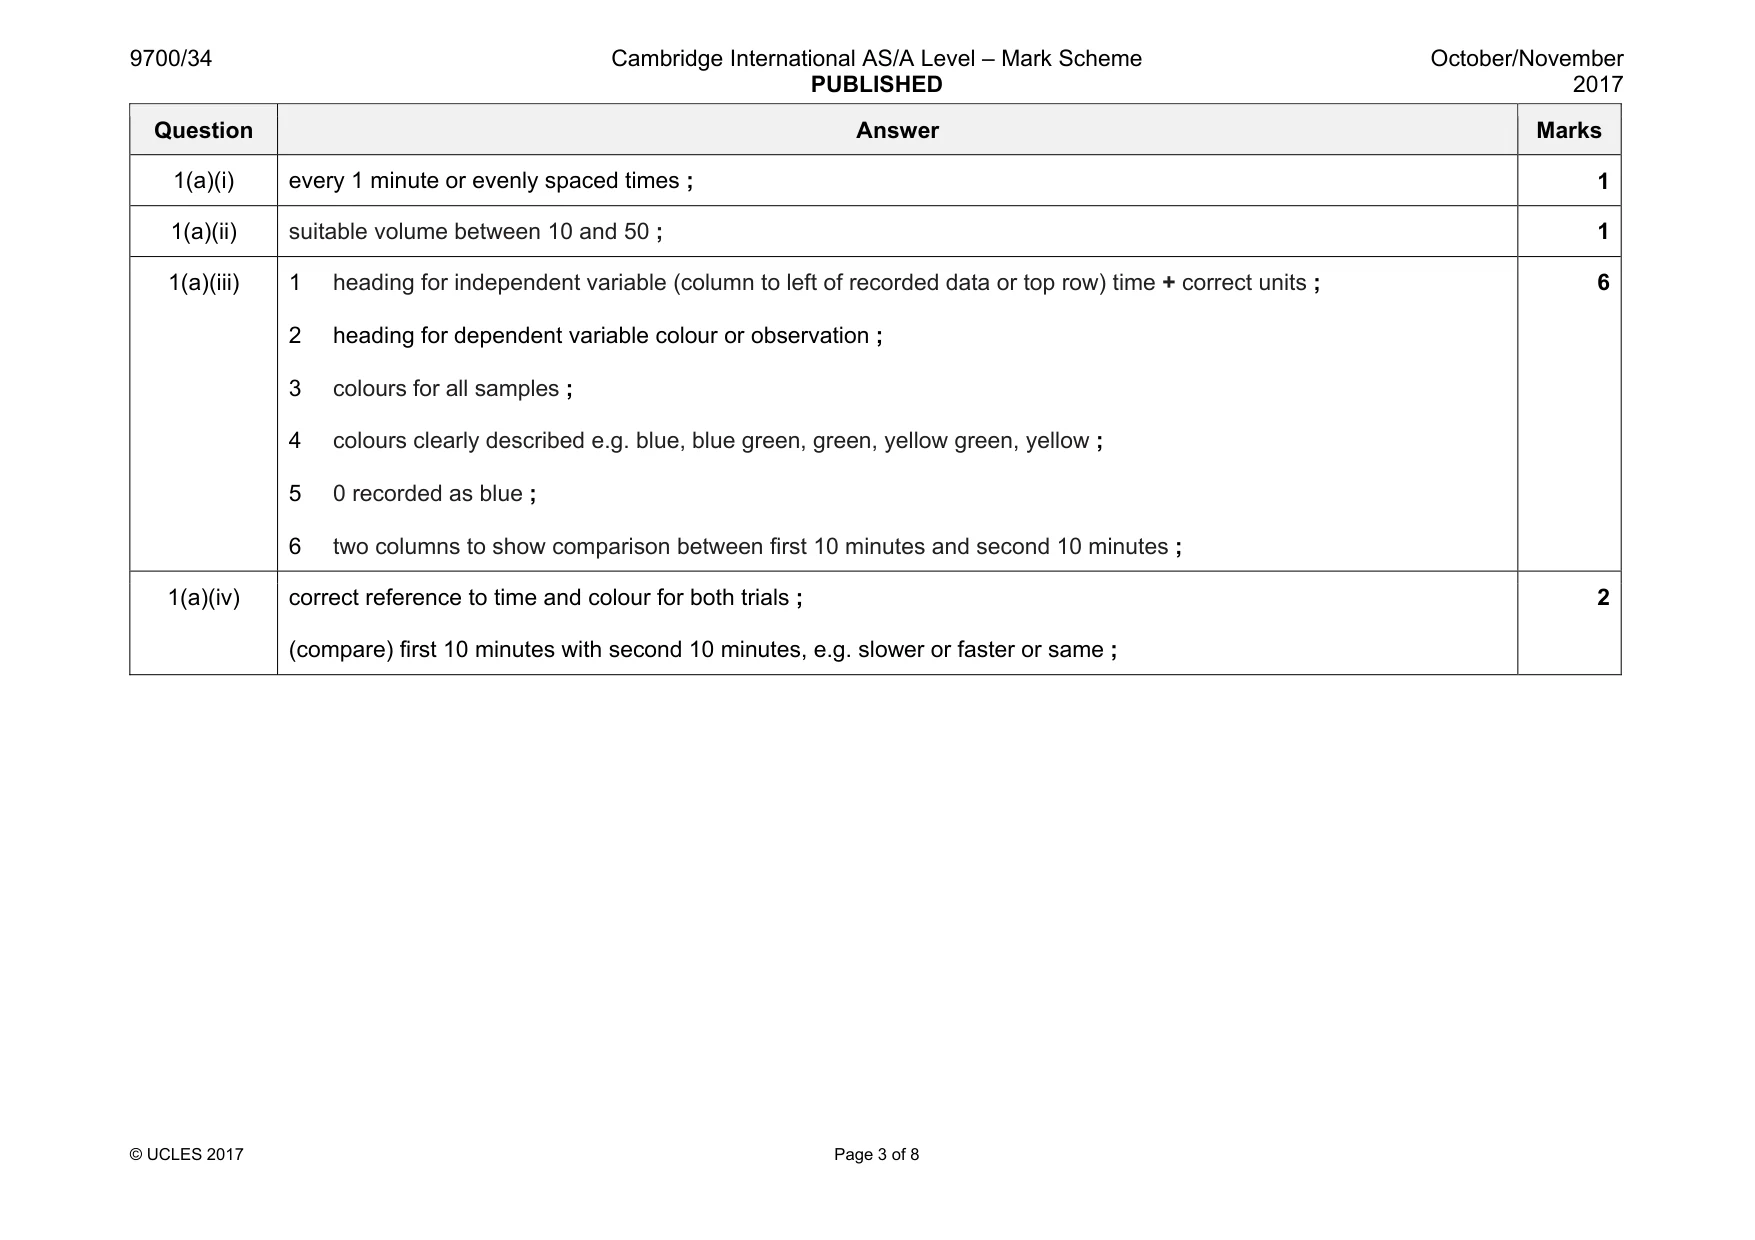
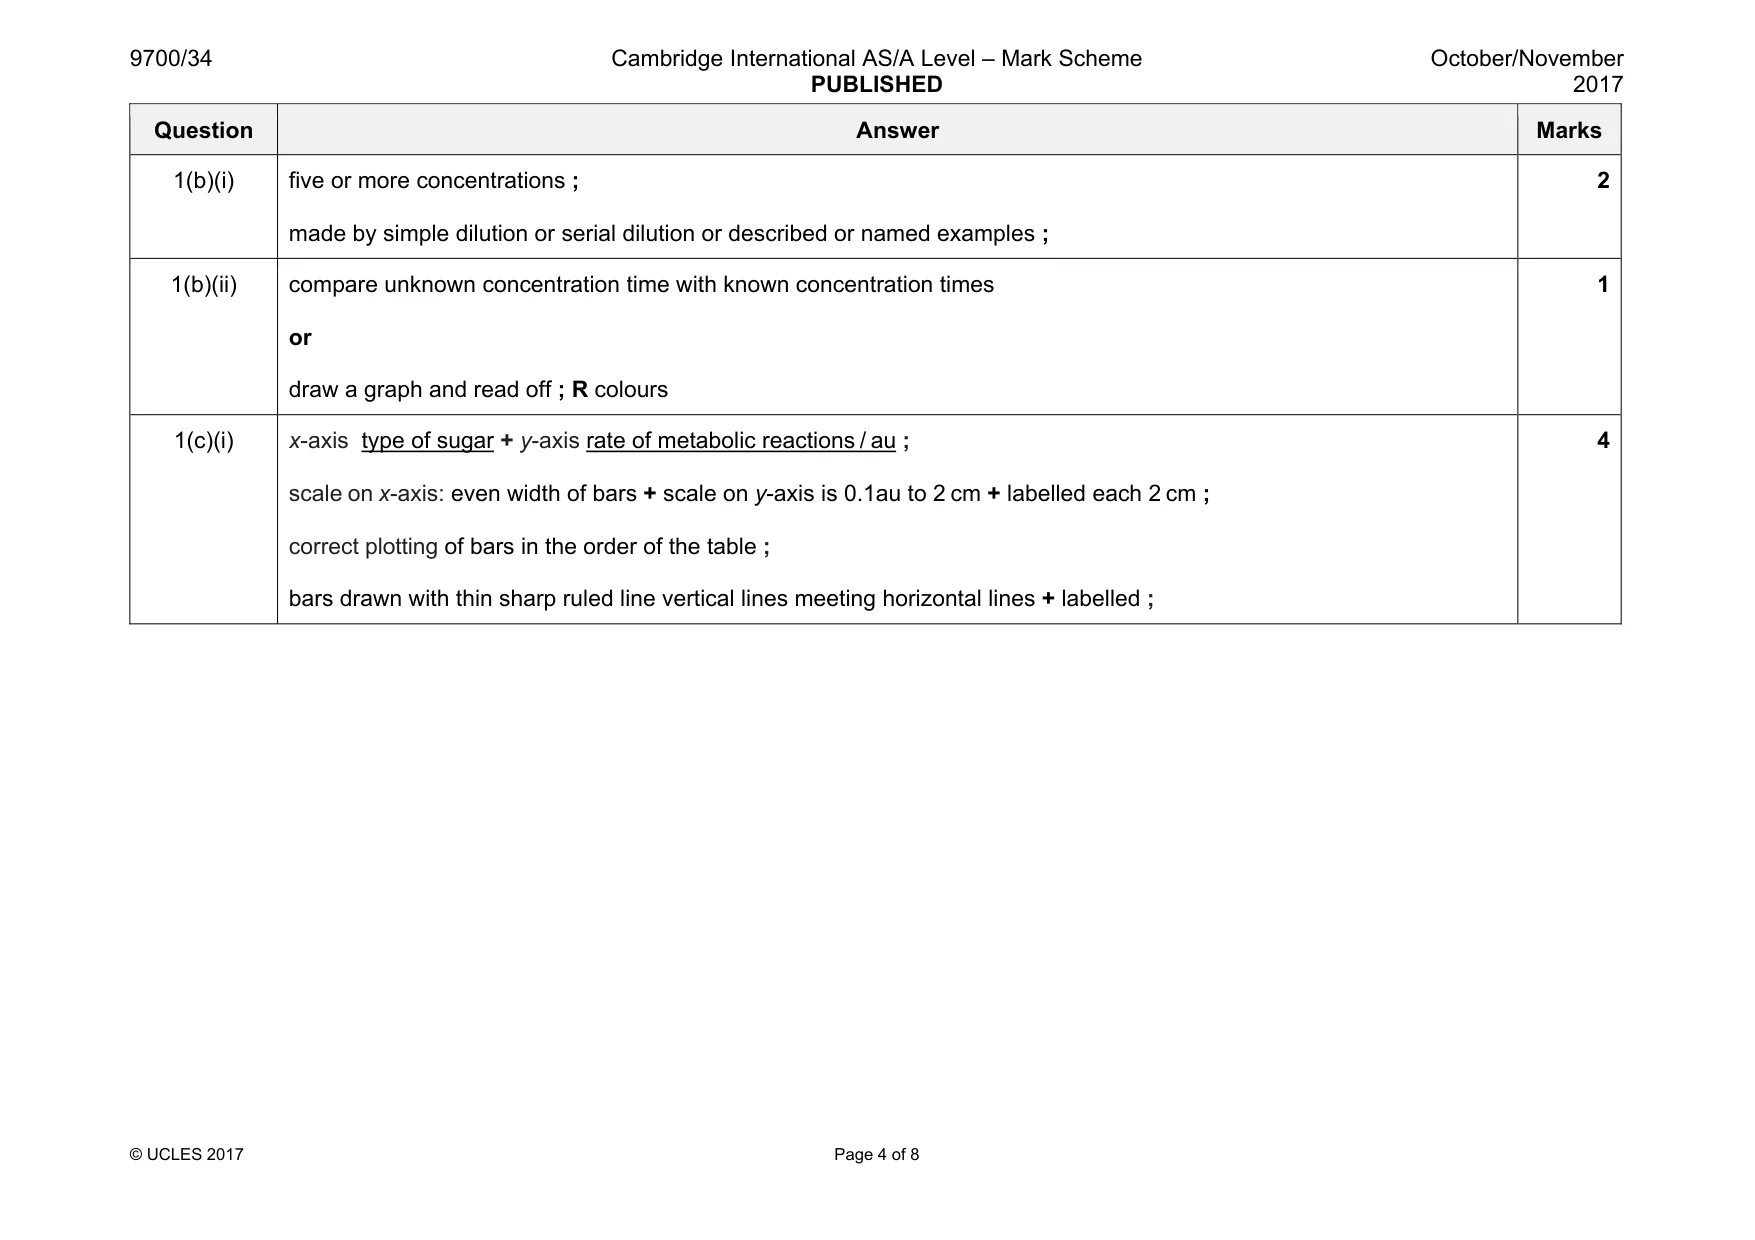
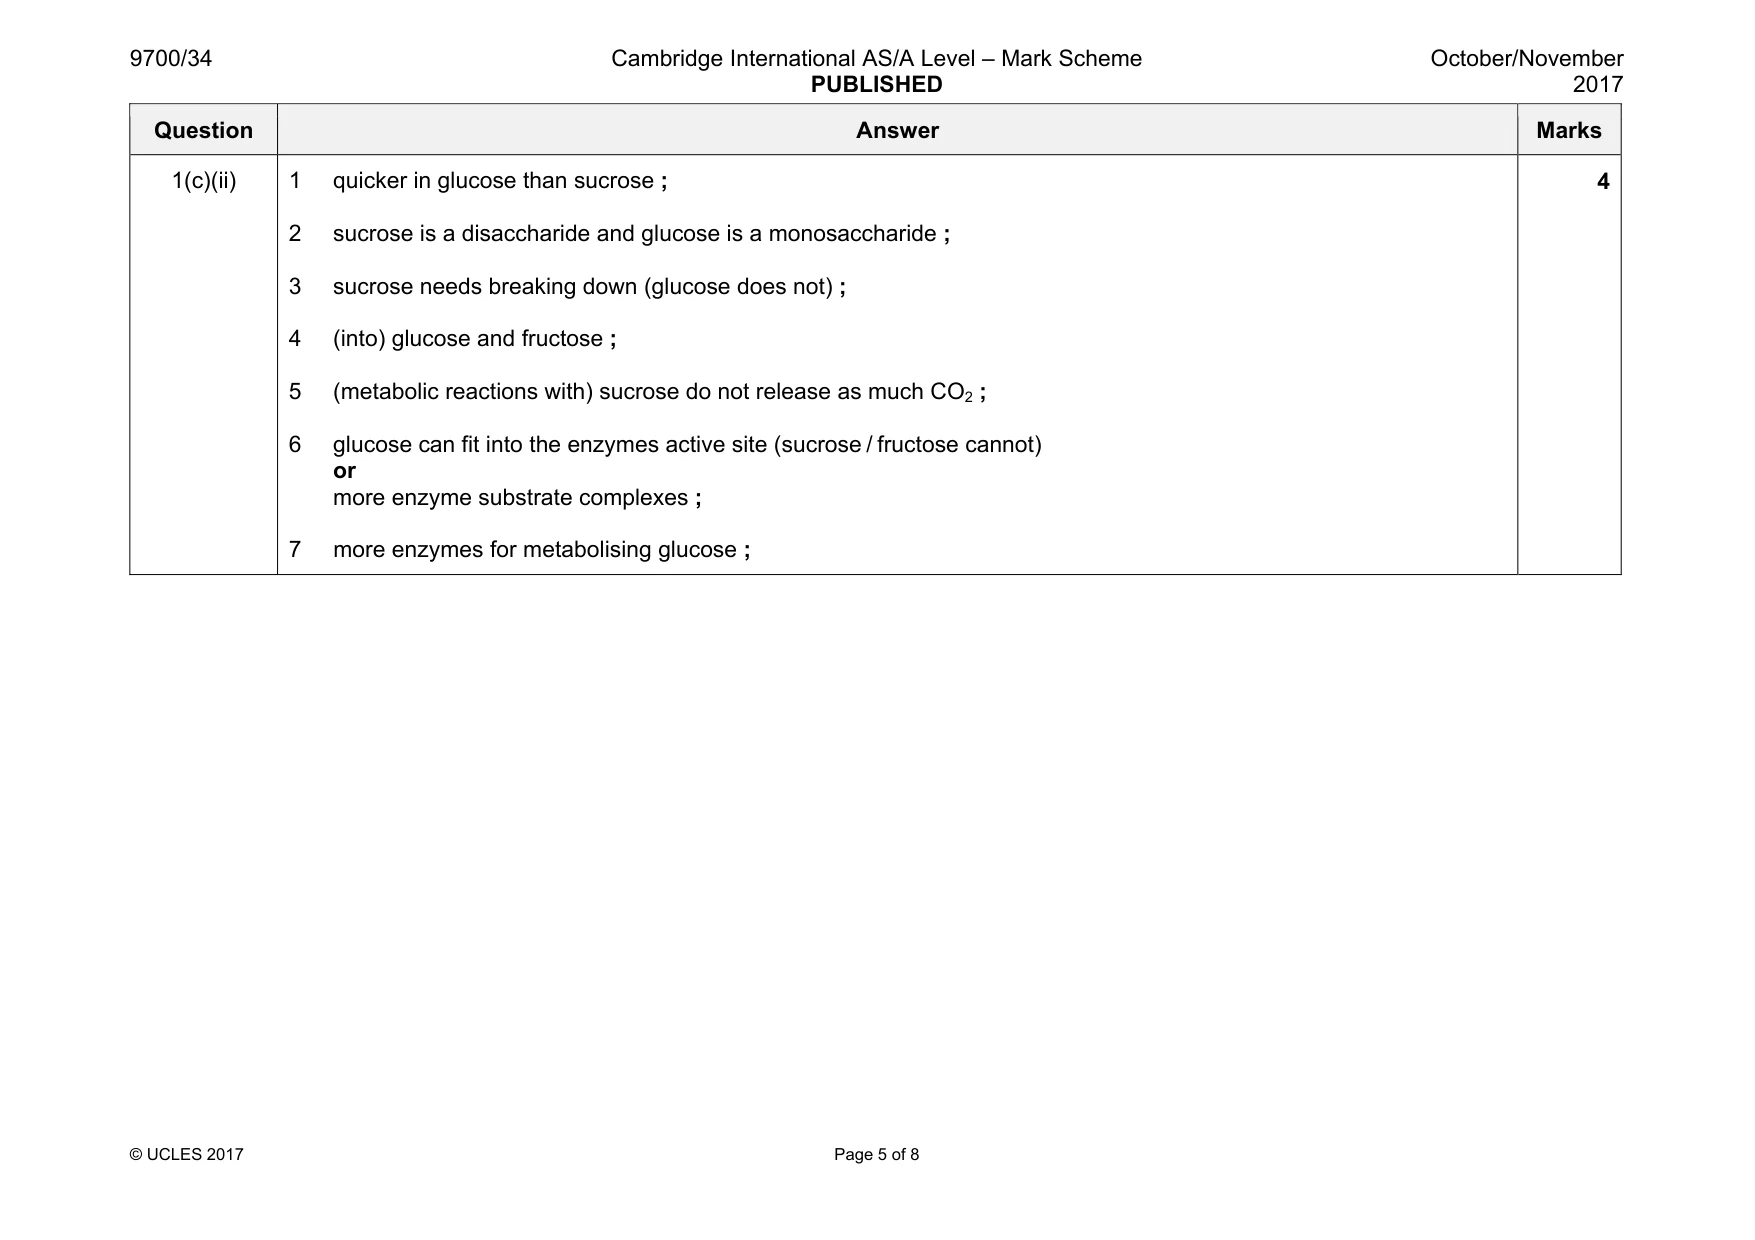
Mark scheme: 1(a)(i) every 1 minute or evenly spaced times ; 1 1(a)(ii) suitable volume between 10 and 50 ; 1 1(a)(iii) 1 heading for independent variable (column to left of recorded data or top row) time + correct units ; 2 heading for dependent variable colour or observation ; 3 colours for all samples ; 4 colours clearly described e.g. blue, blue green, green, yellow green, yellow ; 5 0 recorded as blue ; 6 two columns to show comparison between first 10 minutes and second 10 minutes ; 6 1(a)(iv) correct reference to time and colour for both trials ; (compare) first 10 minutes with second 10 minutes, e.g. slower or faster or same ; 2 Question Answer Marks 1(b)(i) five or more concentrations ; made by simple dilution or serial dilution or described or named examples ; 2 1(b)(ii) compare unknown concentration time with known concentration times or draw a graph and read off ; R colours 1 1(c)(i) x-axis type of sugar + y-axis rate of metabolic reactions / au ; scale on x-axis: even width of bars + scale on y-axis is 0.1au to 2 cm + labelled each 2 cm ; correct plotting of bars in the order of the table ; bars drawn with thin sharp ruled line vertical lines meeting horizontal lines + labelled ; 4 Question Answer Marks 1(c)(ii) 1 quicker in glucose than sucrose ; 2 sucrose is a disaccharide and glucose is a monosaccharide ; 3 sucrose needs breaking down (glucose does not) ; 4 (into) glucose and fructose ; 5 (metabolic reactions with) sucrose do not release as much CO2 ; 6 glucose can fit into the enzymes active site (sucrose / fructose cannot) or more enzyme substrate complexes ; 7 more enzymes for metabolising glucose ; 4
Q2 · L1 is a slide of a stained transverse section through a plant stem
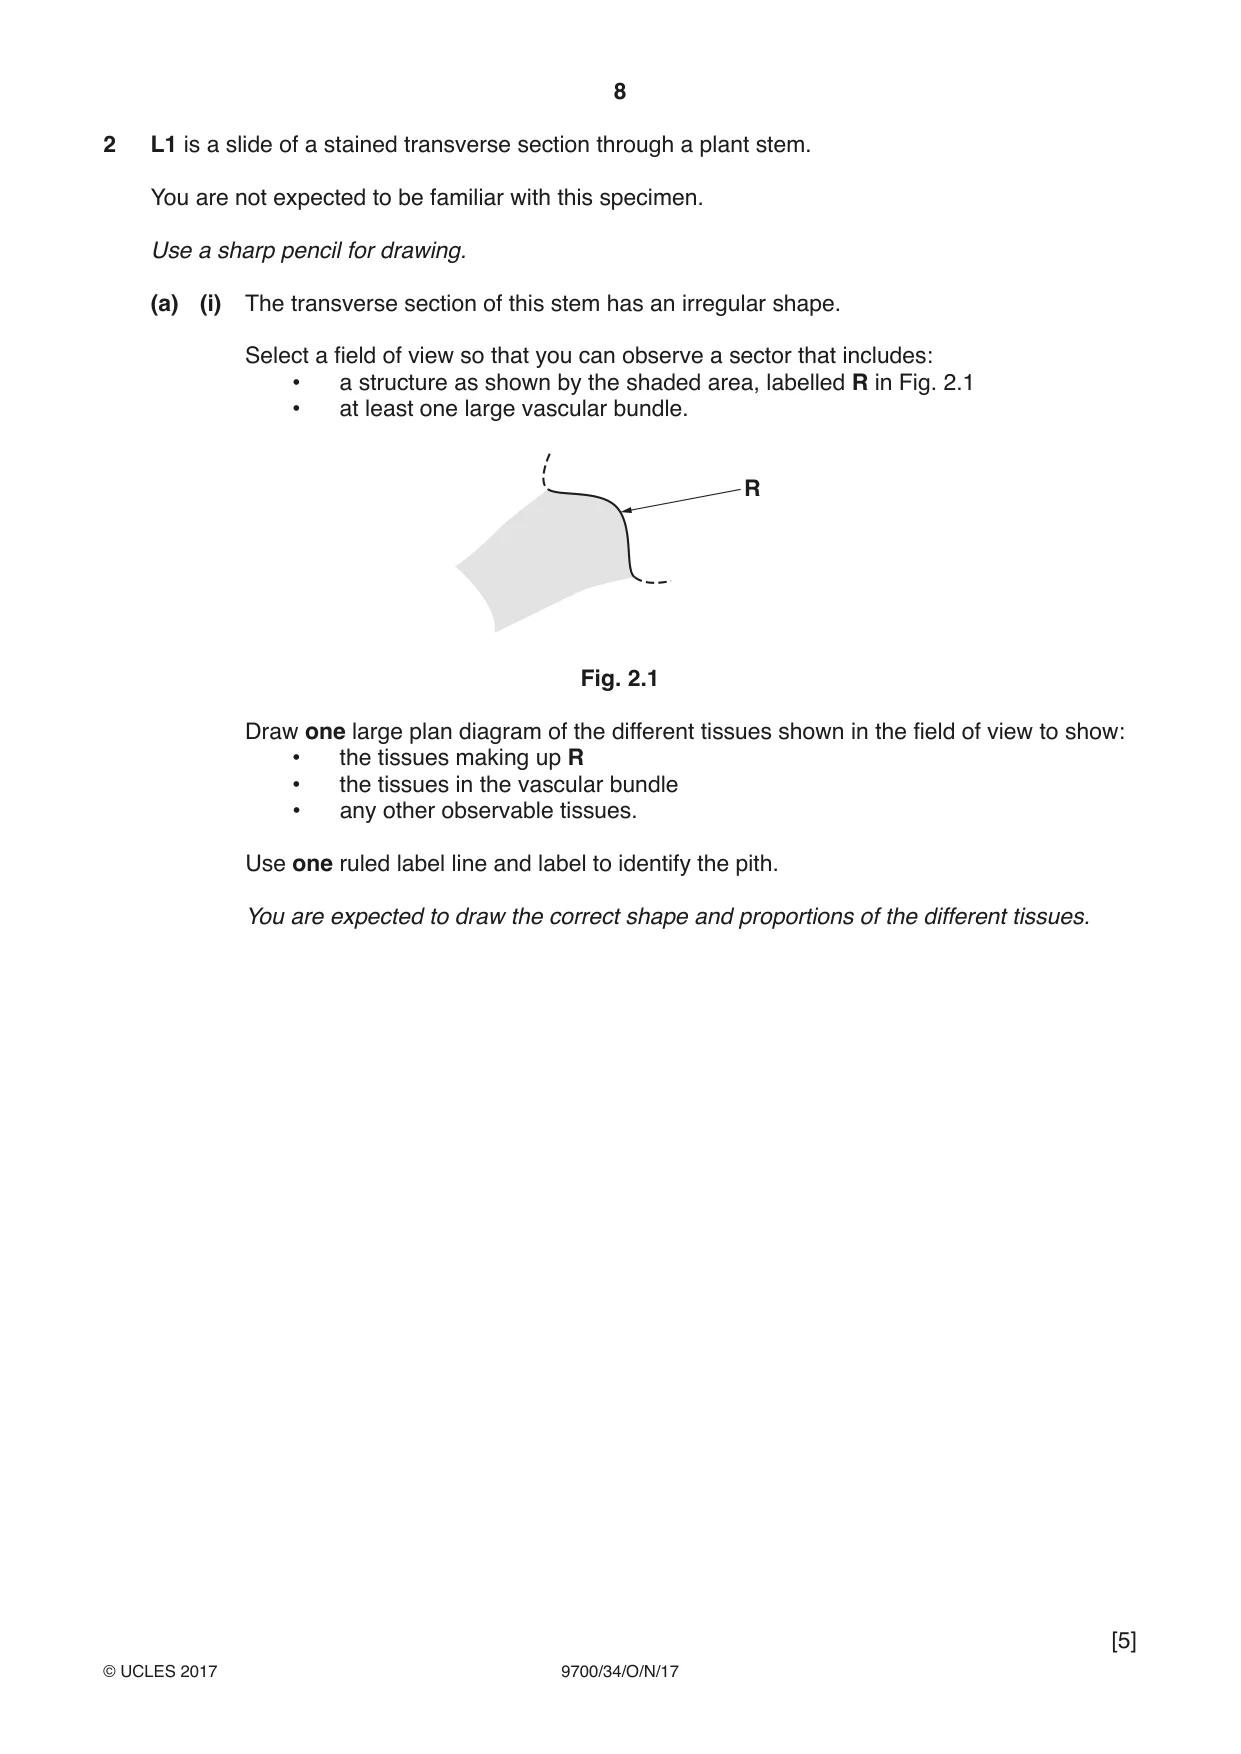
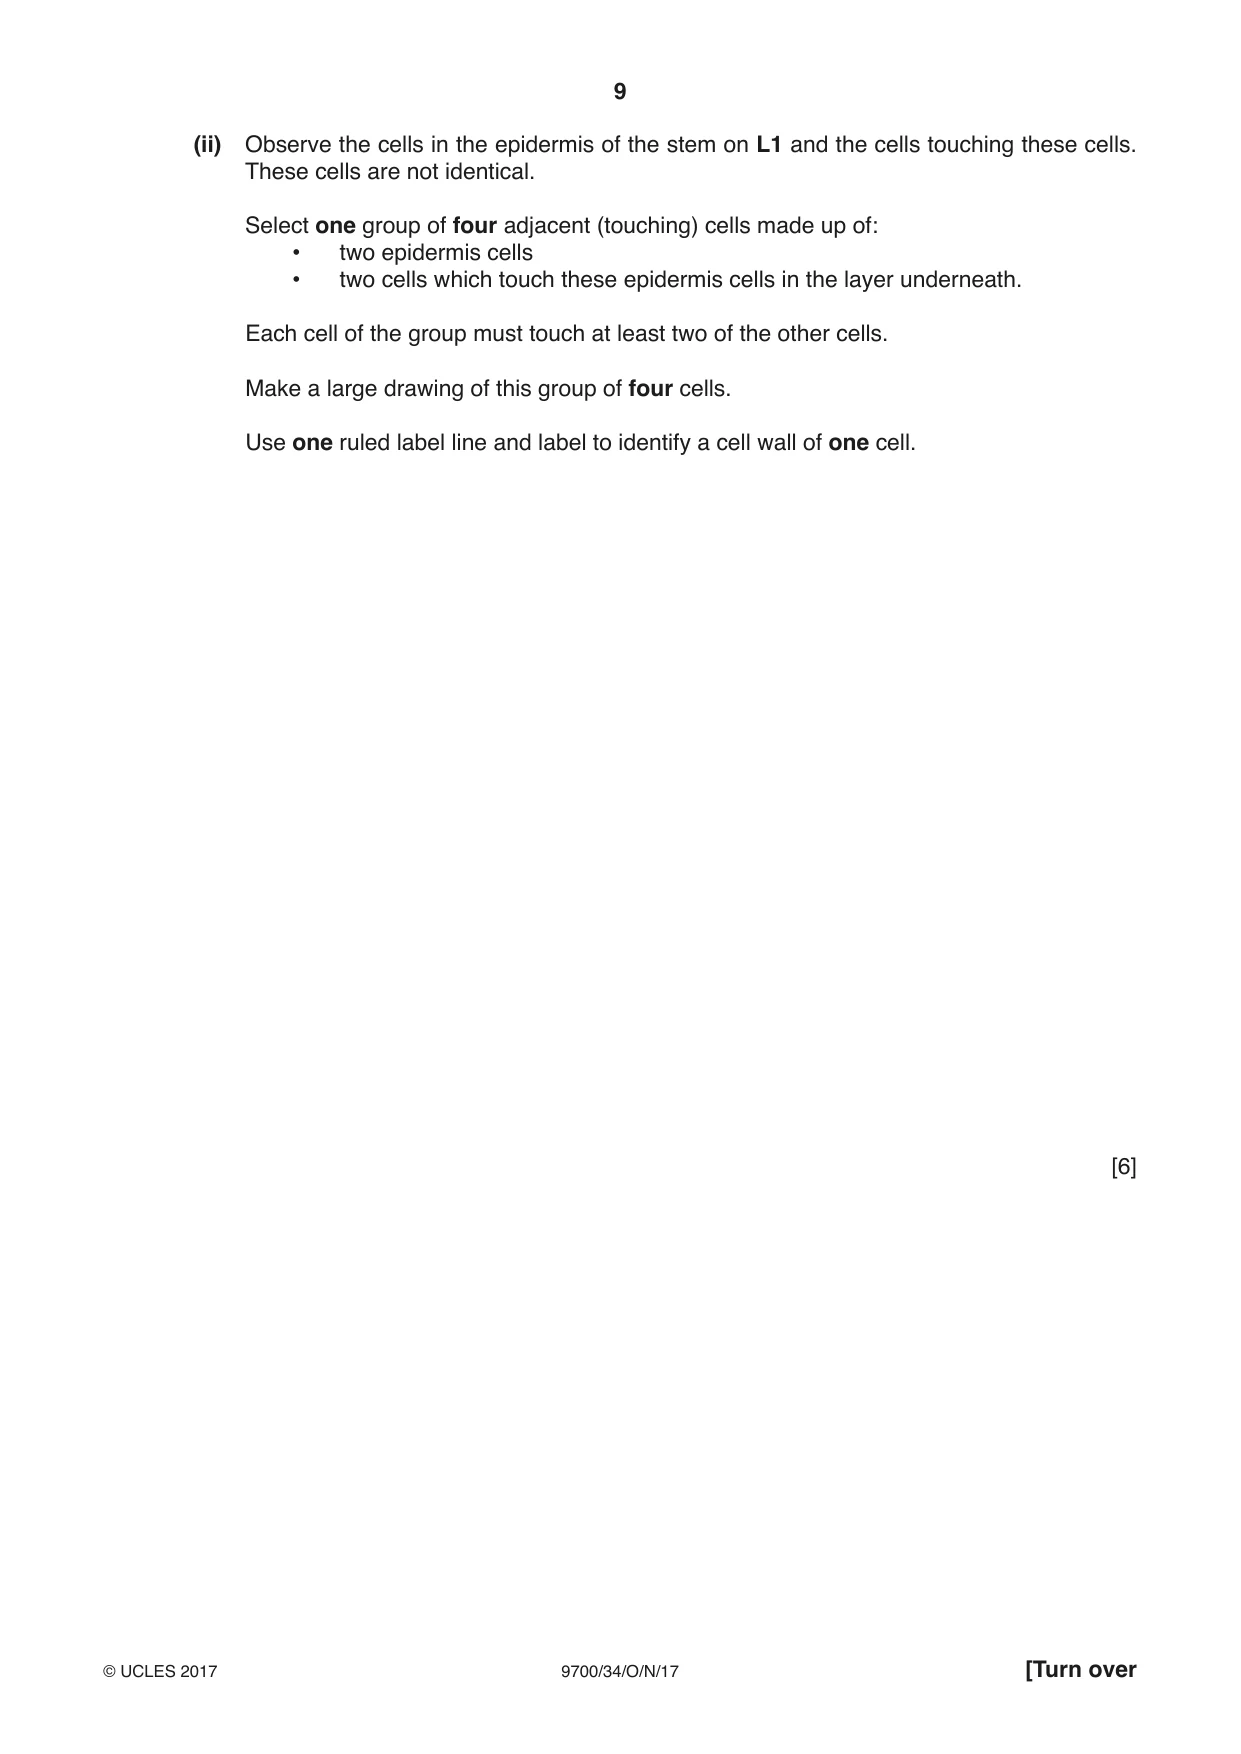
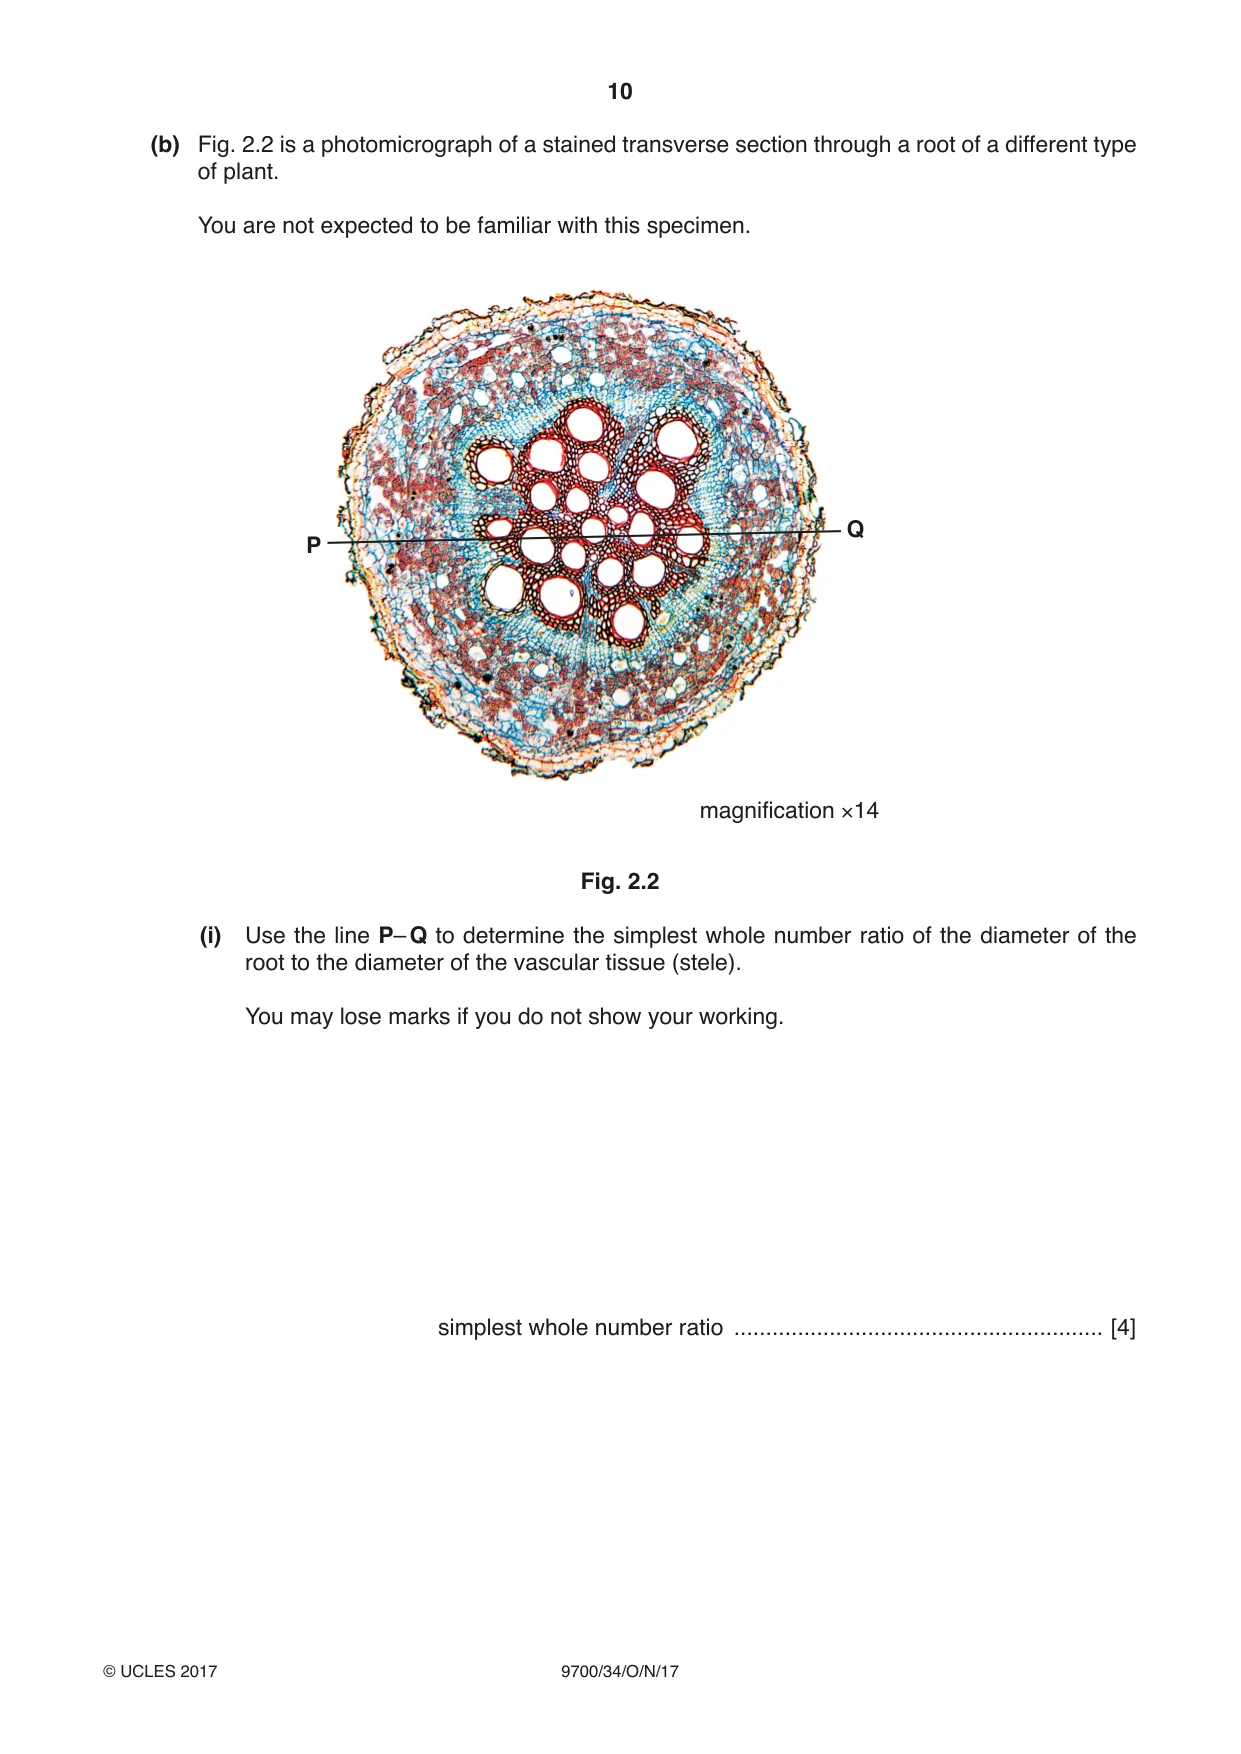
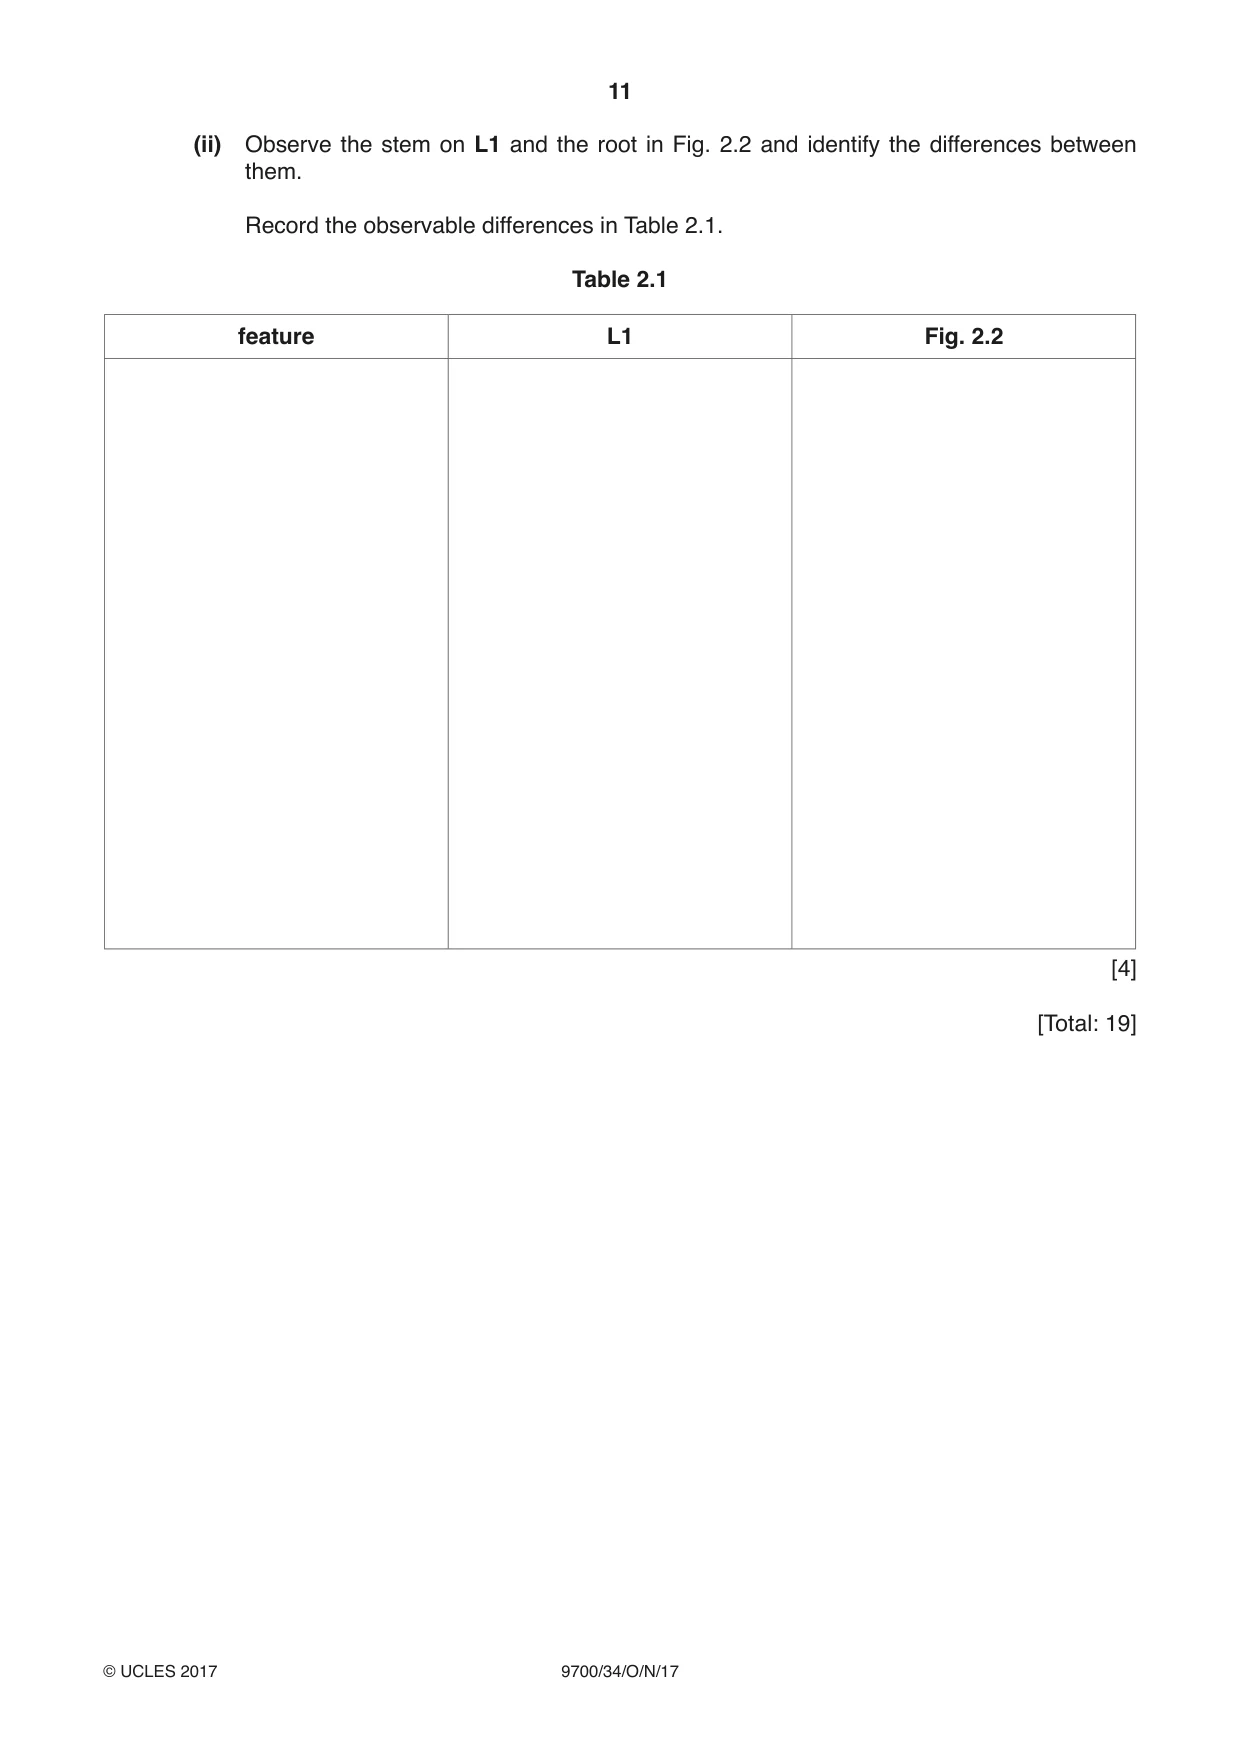
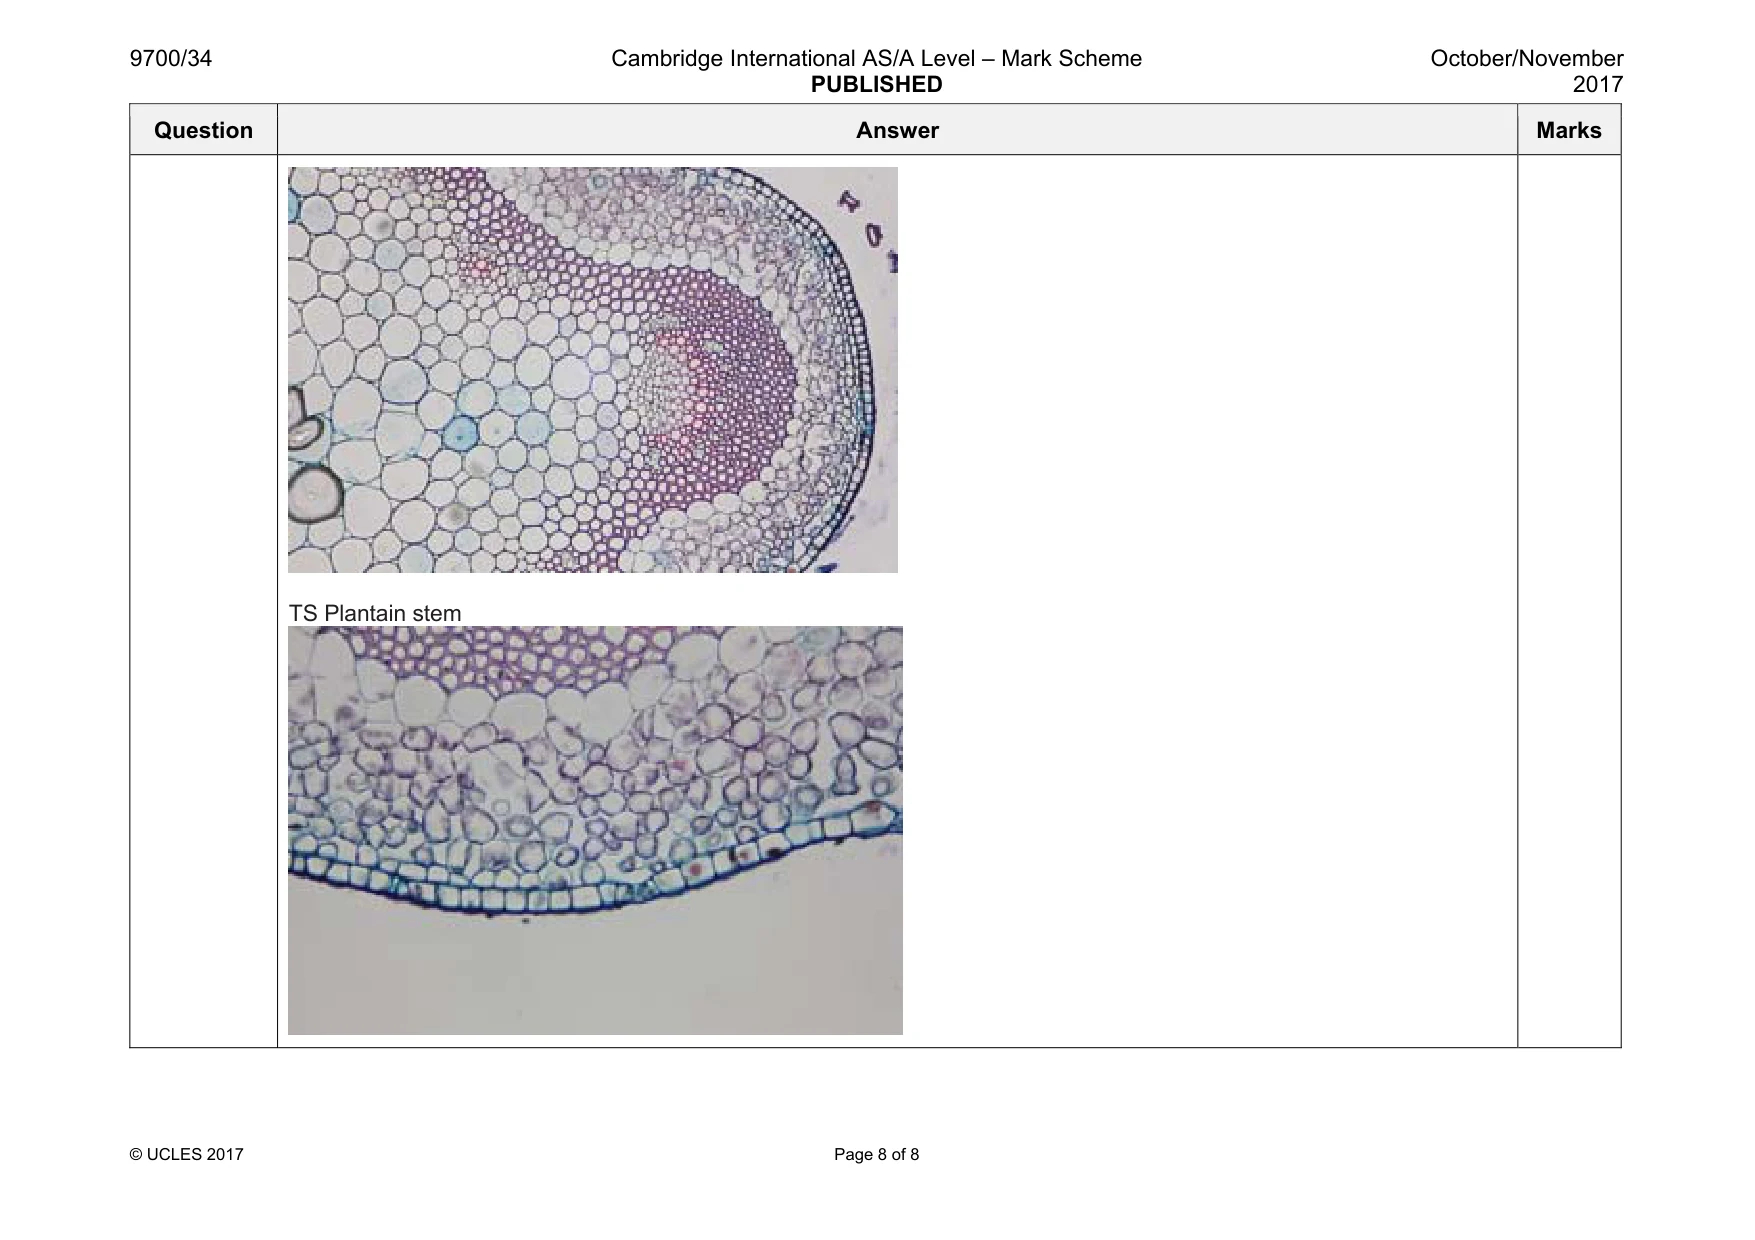
2 L1 is a slide of a stained transverse section through a plant stem. You are not expected to be familiar with this specimen. Use a sharp pencil for drawing. (a) (i) The transverse section of this stem has an irregular shape. Select a field of view so that you can observe a sector that includes: • a structure as shown by the shaded area, labelled R in Fig. 2.1 • at least one large vascular bundle. R Fig. 2.1 Draw one large plan diagram of the different tissues shown in the field of view to show: • the tissues making up R • the tissues in the vascular bundle • any other observable tissues. Use one ruled label line and label to identify the pith. You are expected to draw the correct shape and proportions of the different tissues. [5] (ii) Observe the cells in the epidermis of the stem on L1 and the cells touching these cells. These cells are not identical. Select one group of four adjacent (touching) cells made up of: • two epidermis cells • two cells which touch these epidermis cells in the layer underneath. Each cell of the group must touch at least two of the other cells. Make a large drawing of this group of four cells. Use one ruled label line and label to identify a cell wall of one cell. [6] (b) Fig. 2.2 is a photomicrograph of a stained transverse section through a root of a different type of plant. You are not expected to be familiar with this specimen. Q P magnification ×14 Fig. 2.2 (i) Use the line P– Q to determine the simplest whole number ratio of the diameter of the root to the diameter of the vascular tissue (stele). You may lose marks if you do not show your working. simplest whole number ratio .......................................................... [4]
Mark scheme: 2(a)(i) 1 minimum size + no shading + no cells ; 2 drawn correct (bulge / curved) area ; 3 draws tissues in vascular bundle correctly in the correct position ; 4 draws bulge and correct shape of tissues ; 5 label line and label to pith ; 5 2(a)(ii) 1 size at least 40 mm across the largest cell at the widest point + quality of lines are continuous, thin and sharp ; 2 draws only four cells + each cell touching at least two of the other cells ; 3 two lines drawn around each cell + three lines where cells touch ; 4 (epidermal cell) at least one cell with a convex surface ; 5 identifies and draws correct cells, e.g. different shapes and sizes ; 6 label line and label to cell wall ; 6 Question Answer Marks 2(b)(i) 1 correct measurements of root and vascular tissue using line P–Q ; 2 both measurements using same units ; 3 larger number to smaller number ; 4 to lowest common denominator ; 4 2(b)(ii) collects only observable differences ; three correct differences ;;; 4 Question Answer Marks TS Plantain stem
What was in this paper
The subtopics covered by these 2 questions, and how many questions each got. Open one in a new tab to see every Cambridge question on it.
What you needed in this session
Cambridge’s own grade thresholds for 2017 Oct/Nov, Paper 3 · Variant 4. A higher threshold means an easier paper — the bar moves with how the cohort did.