Cambridge A Level Biology 9700 — 2021 Oct/Nov Paper 3 · Variant 6
9700/36/O/N/21 · 2 questions · 40 marks · ≈45 min
The question paper and its mark scheme, free to read here and free to download. This is Cambridge’s own paper, exactly as it was sat.
Question paper16 pages


Mark scheme7 pages
Answers below. Sit the paper first if you are practising.
Questions as text
Q1 · Catalase is an enzyme produced by bacteria
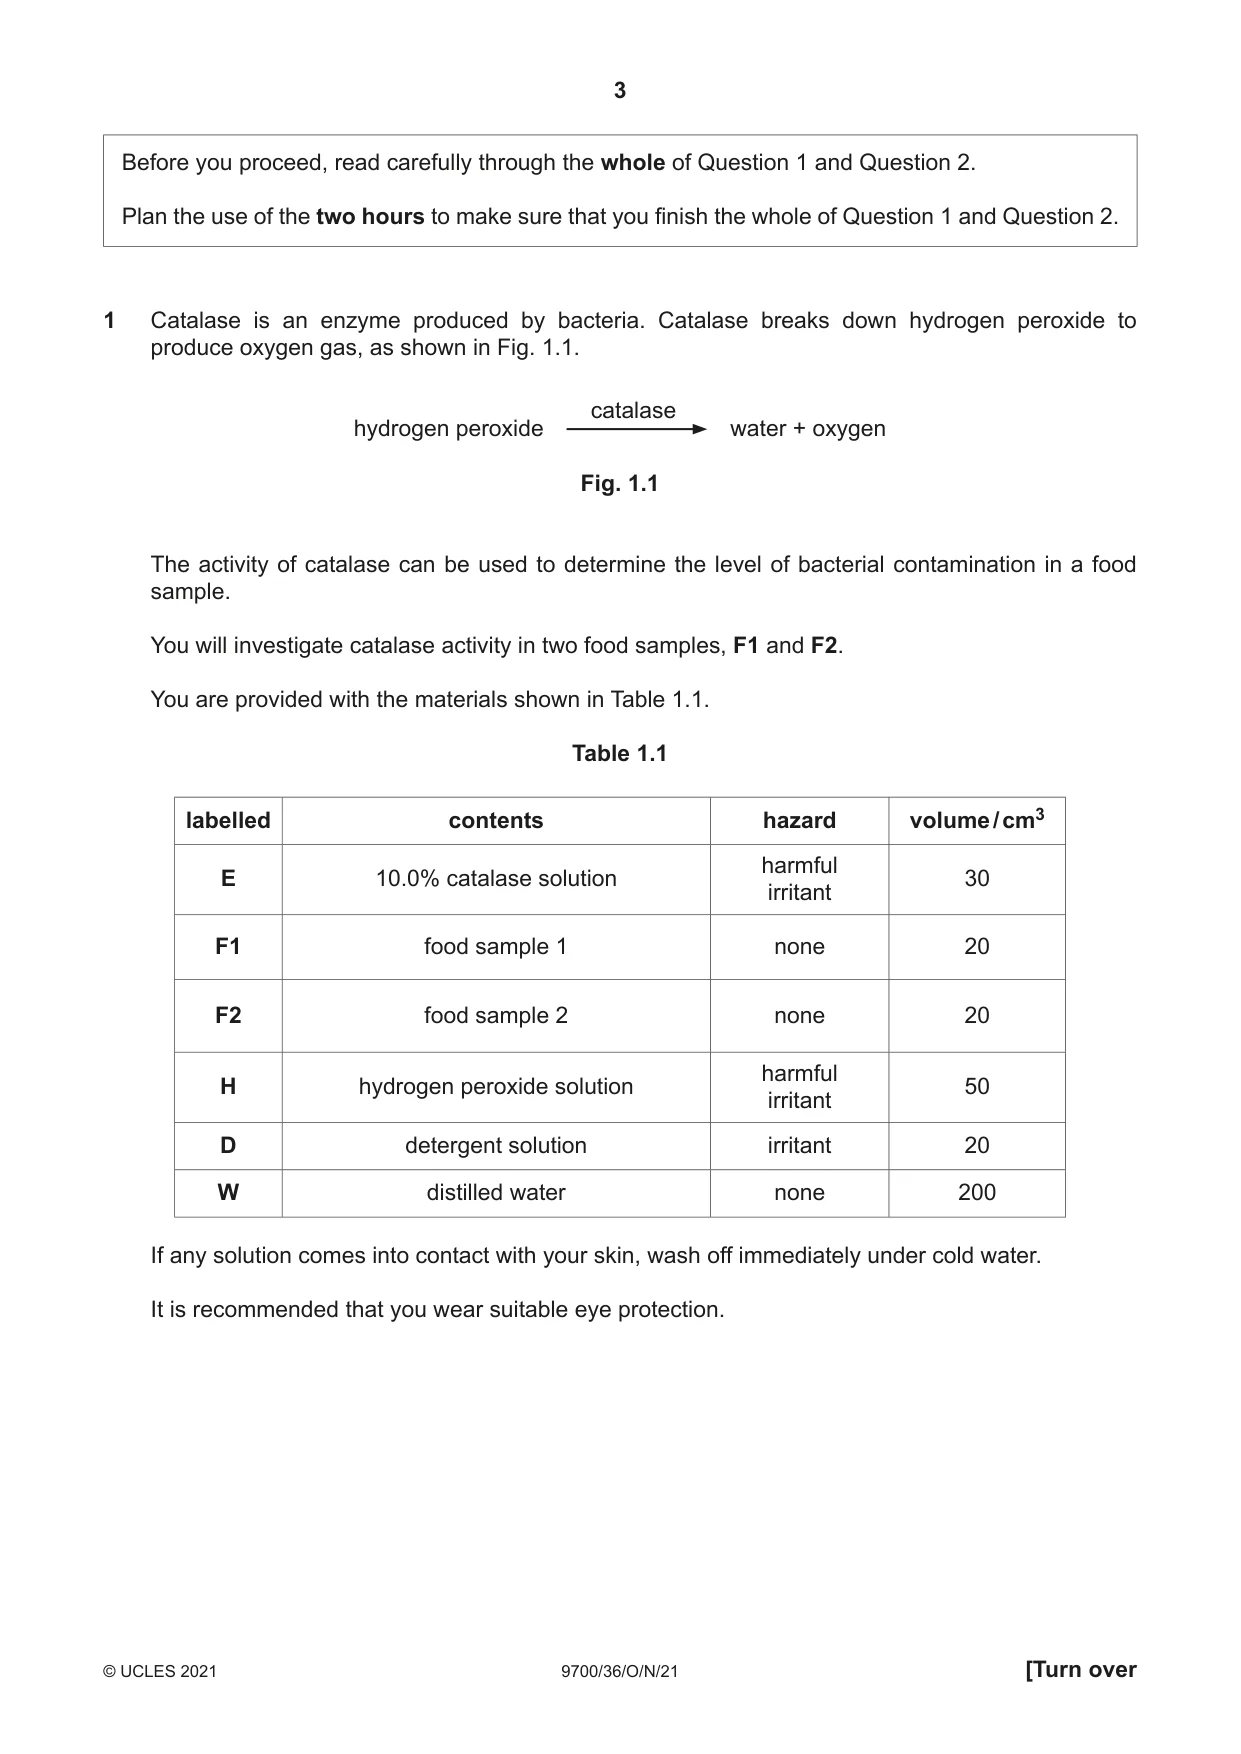
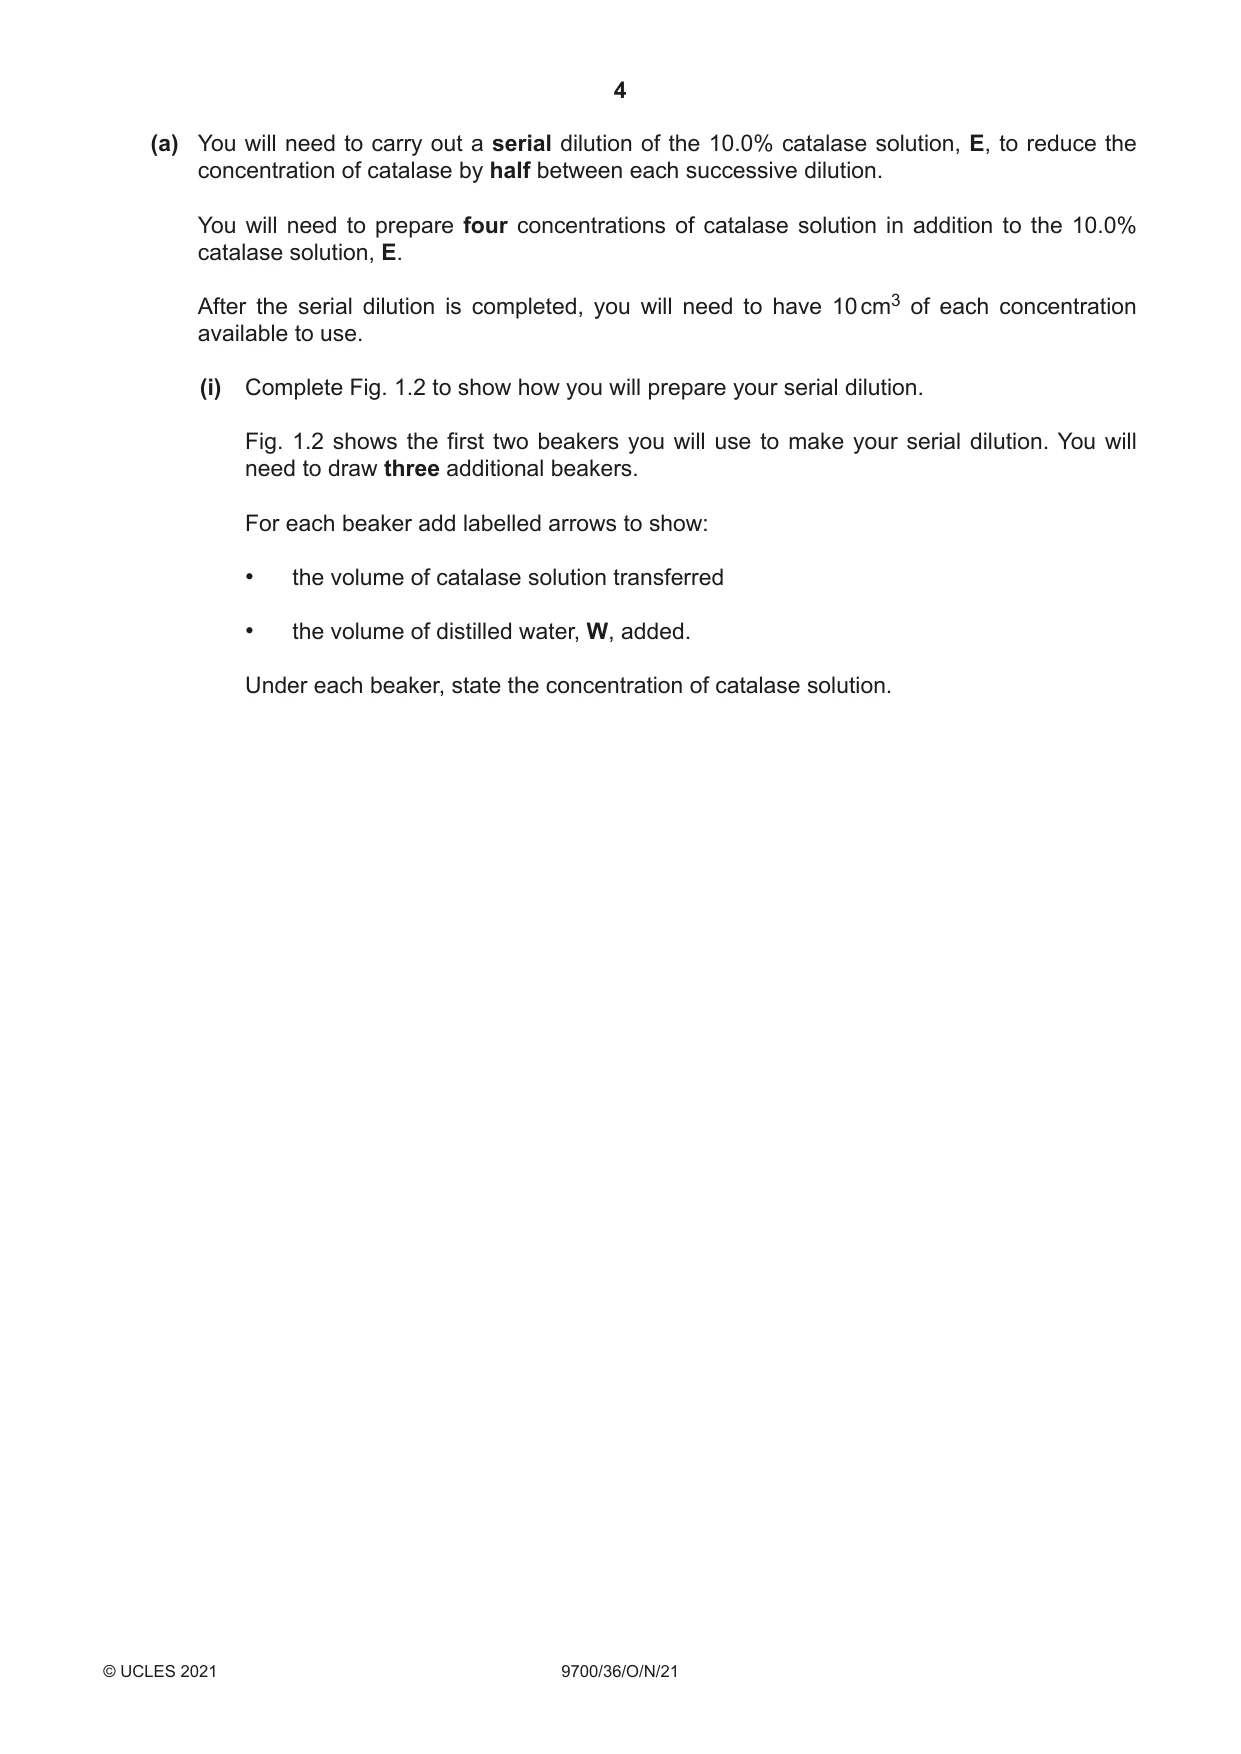
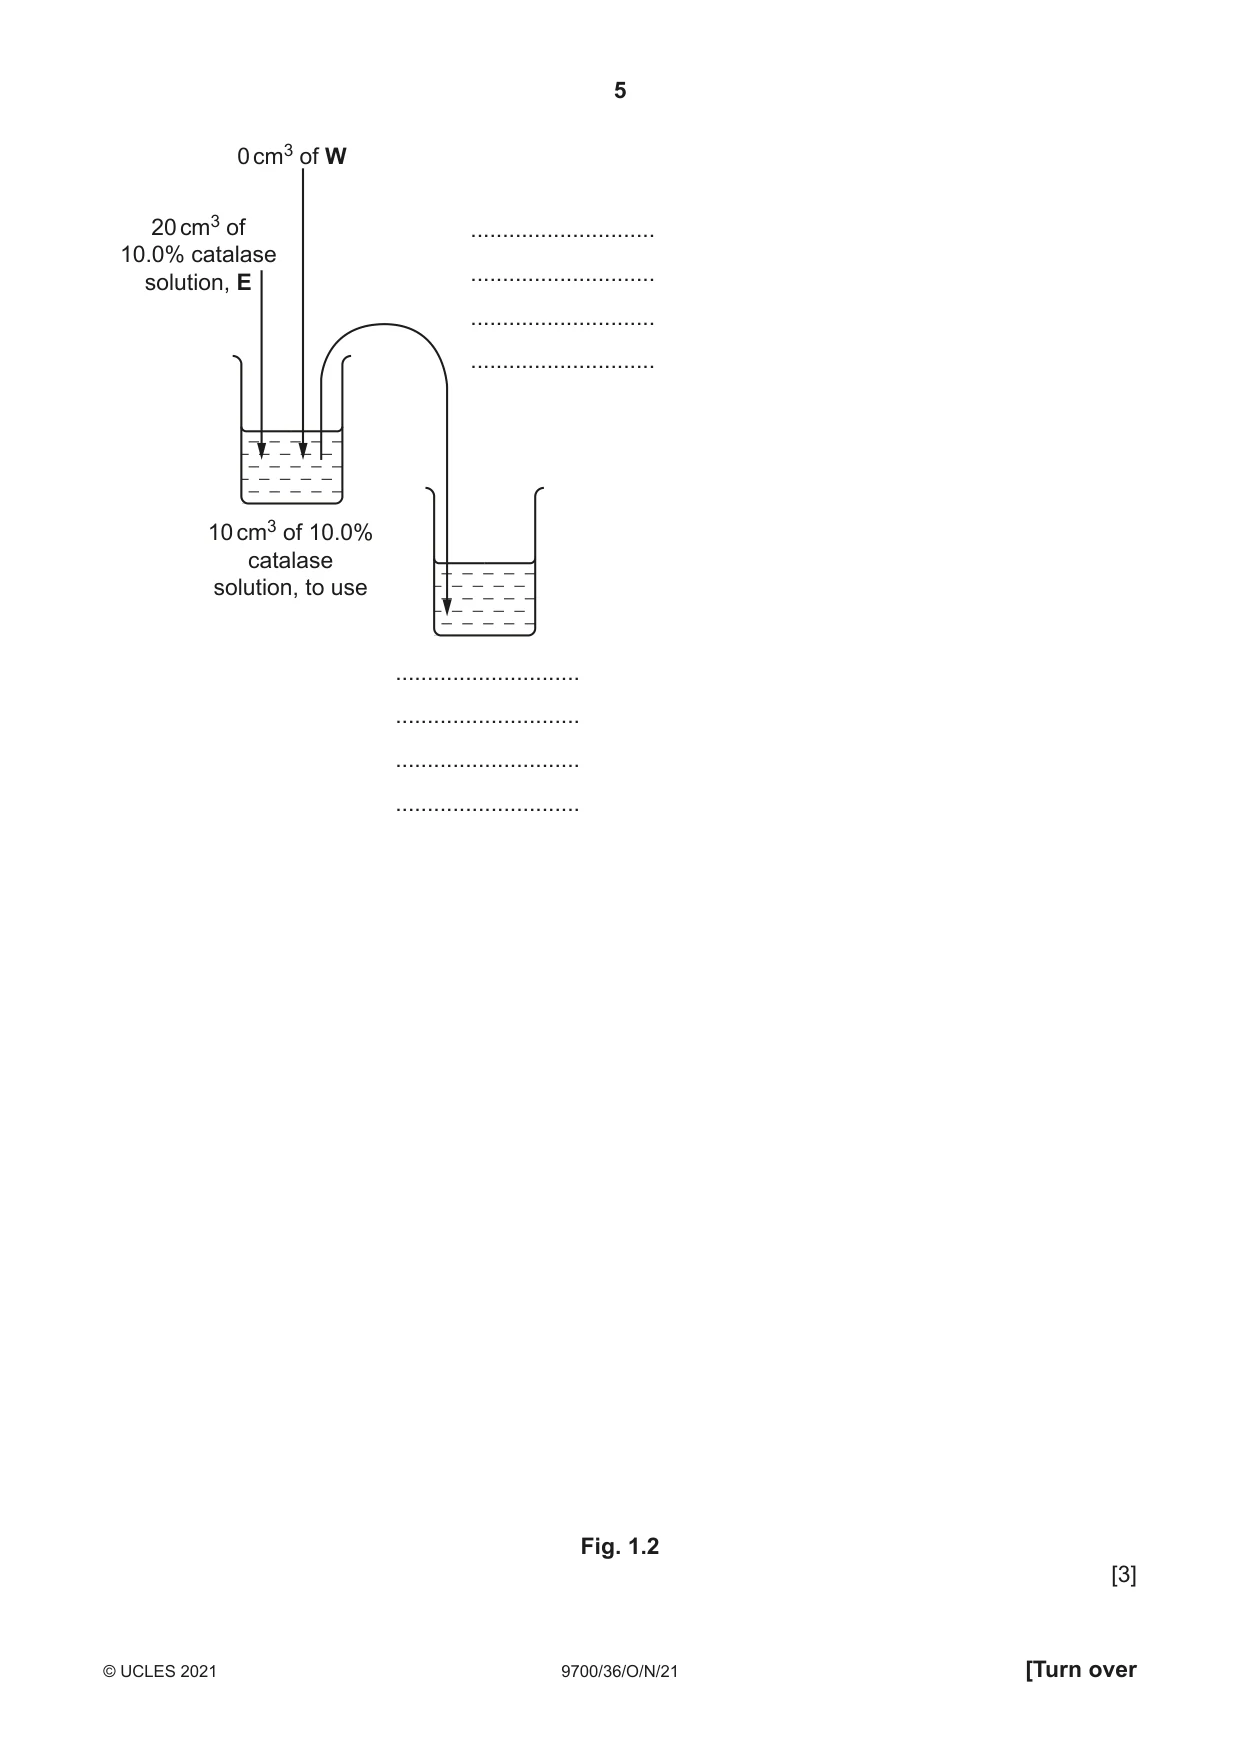
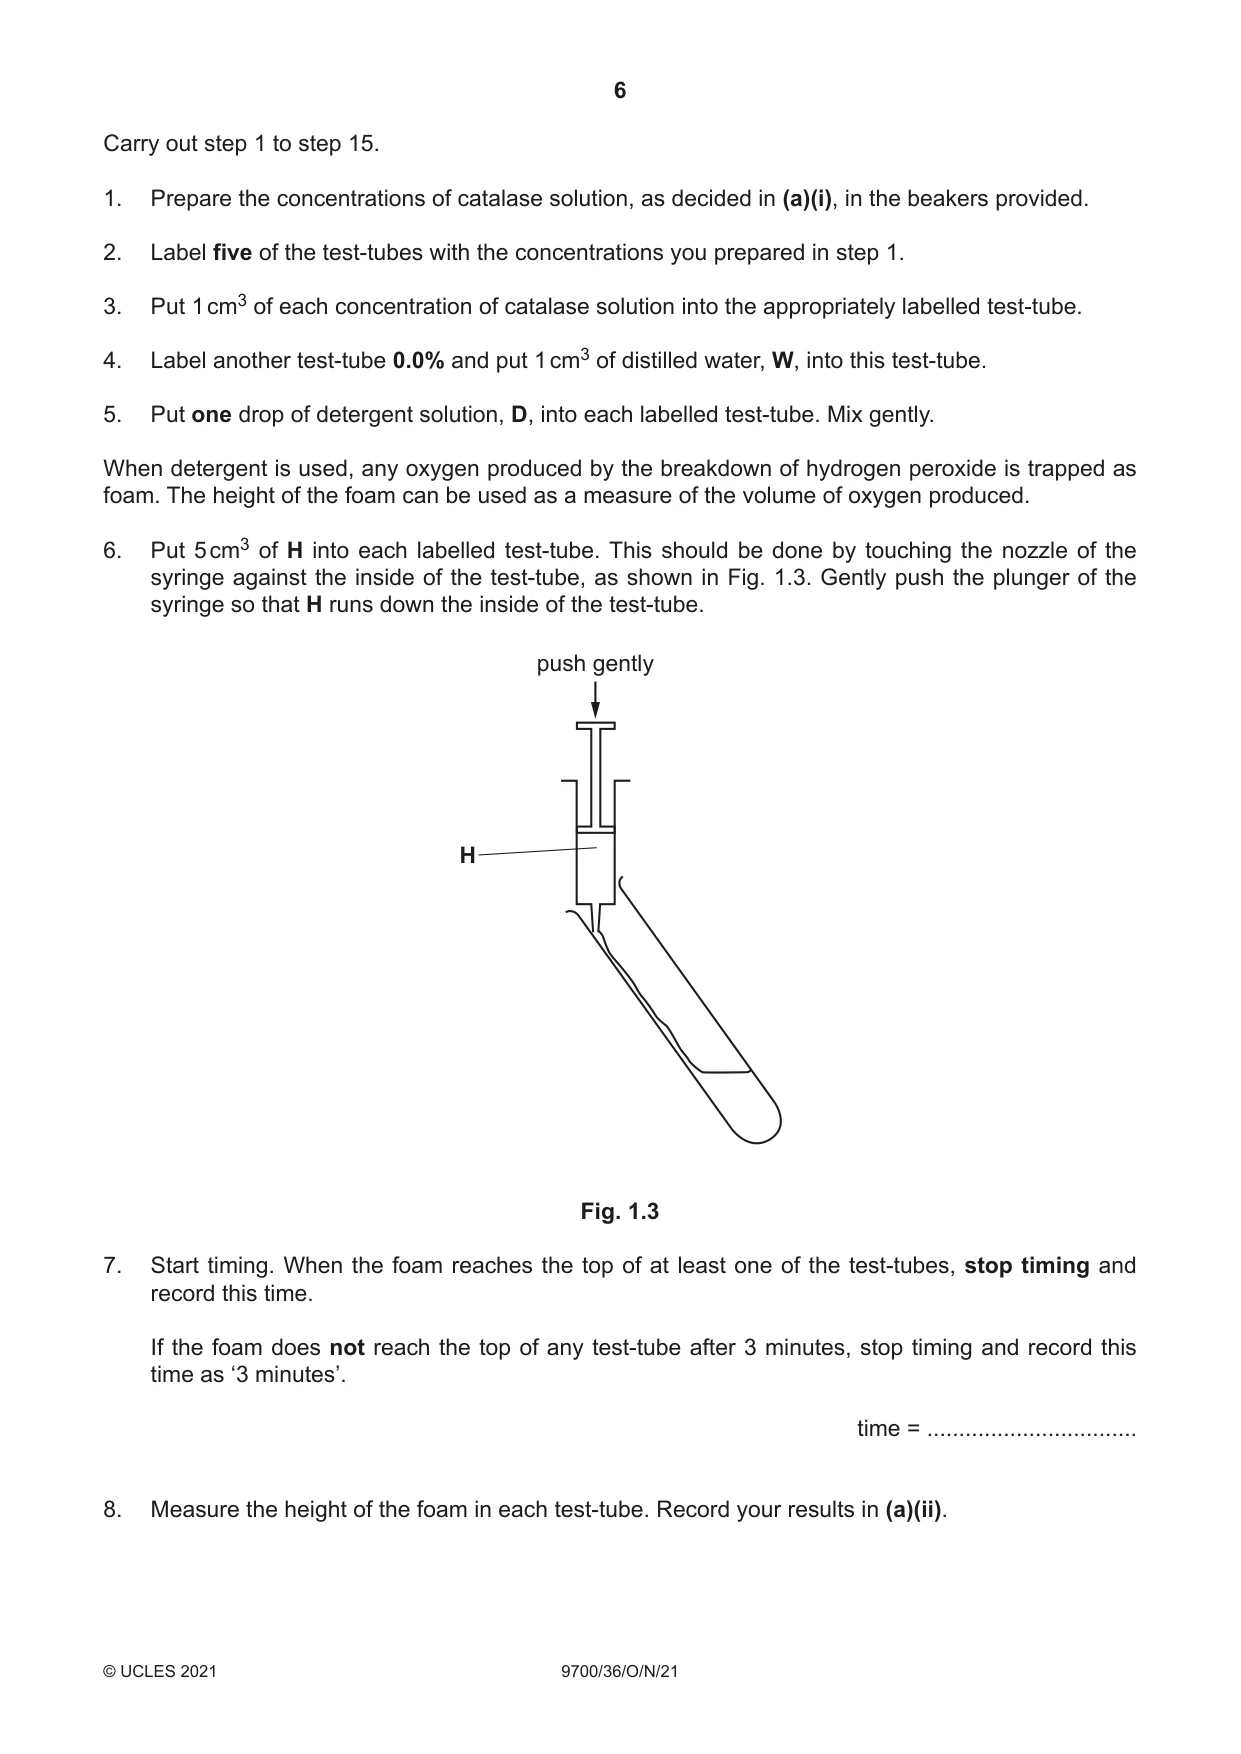
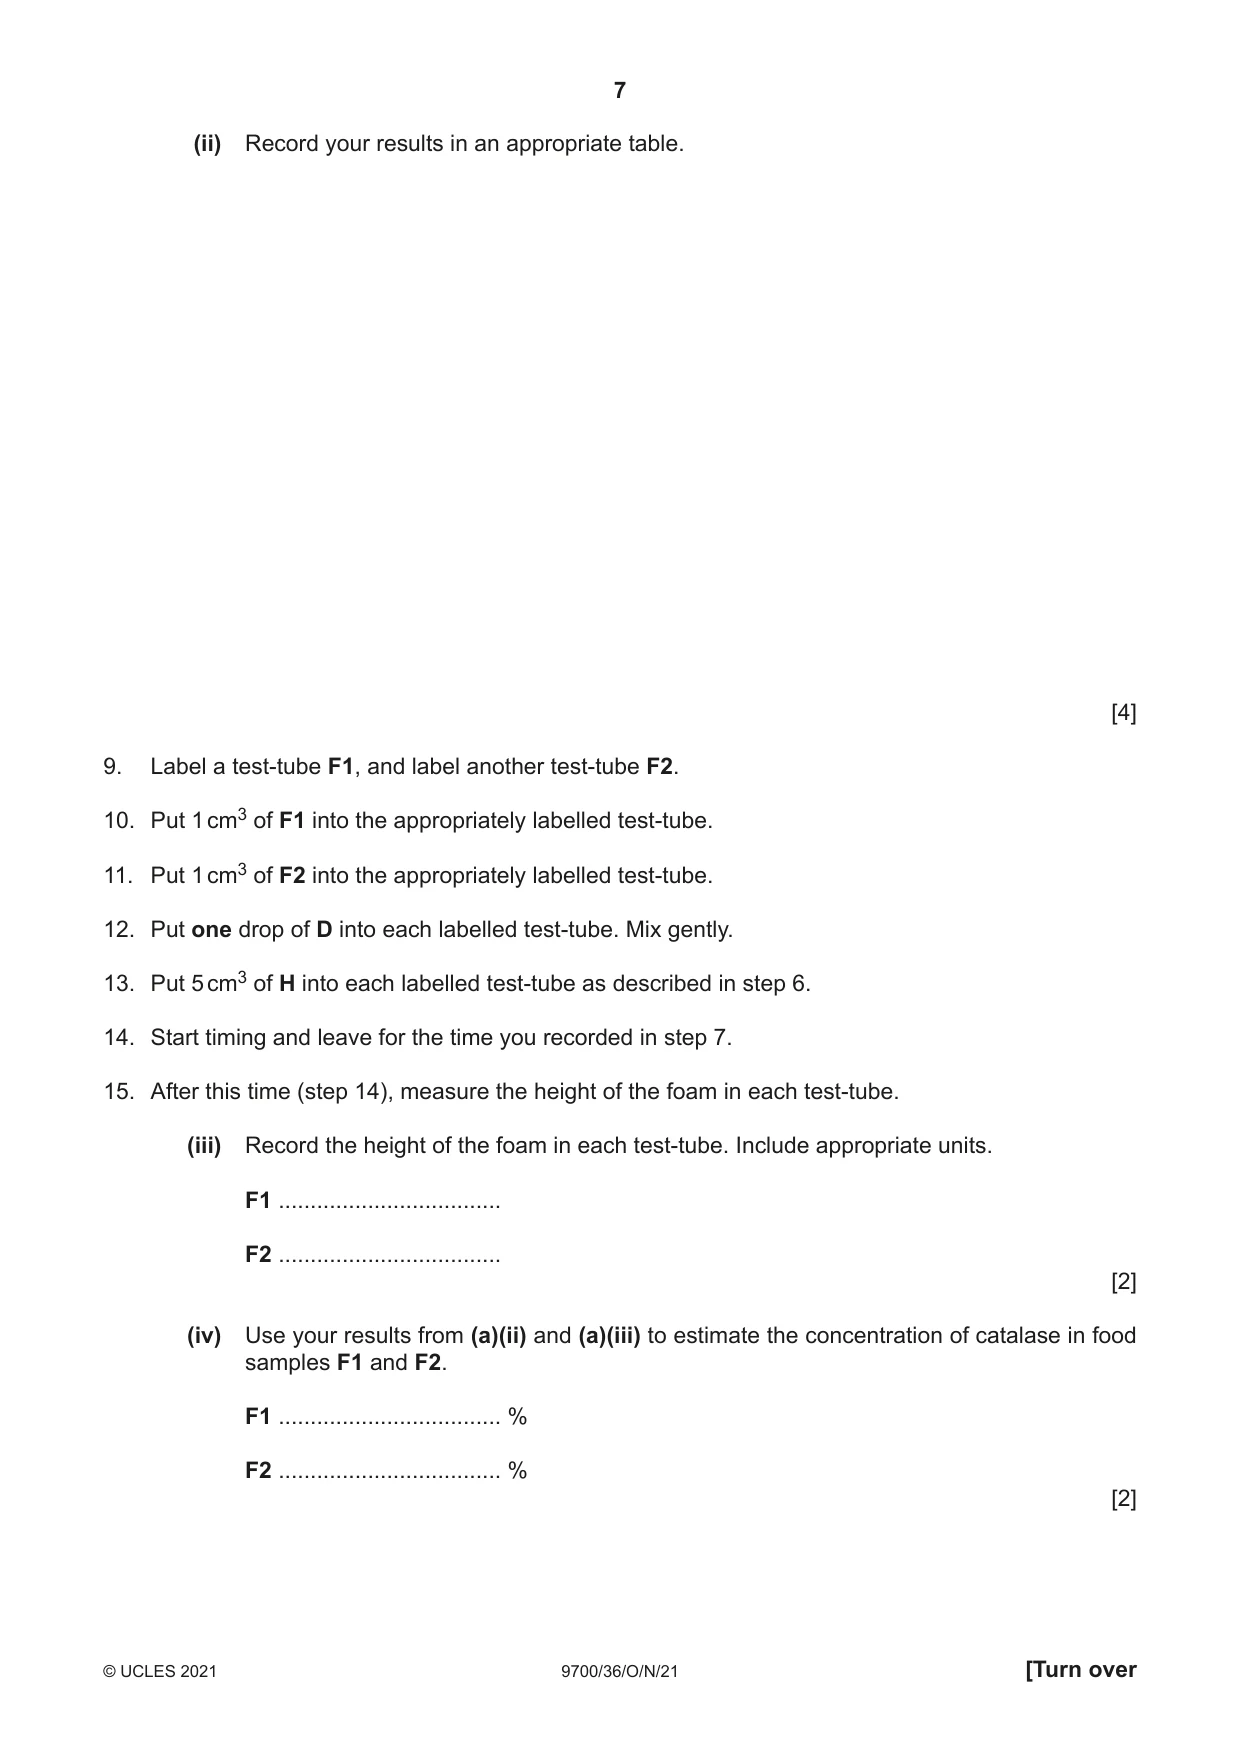
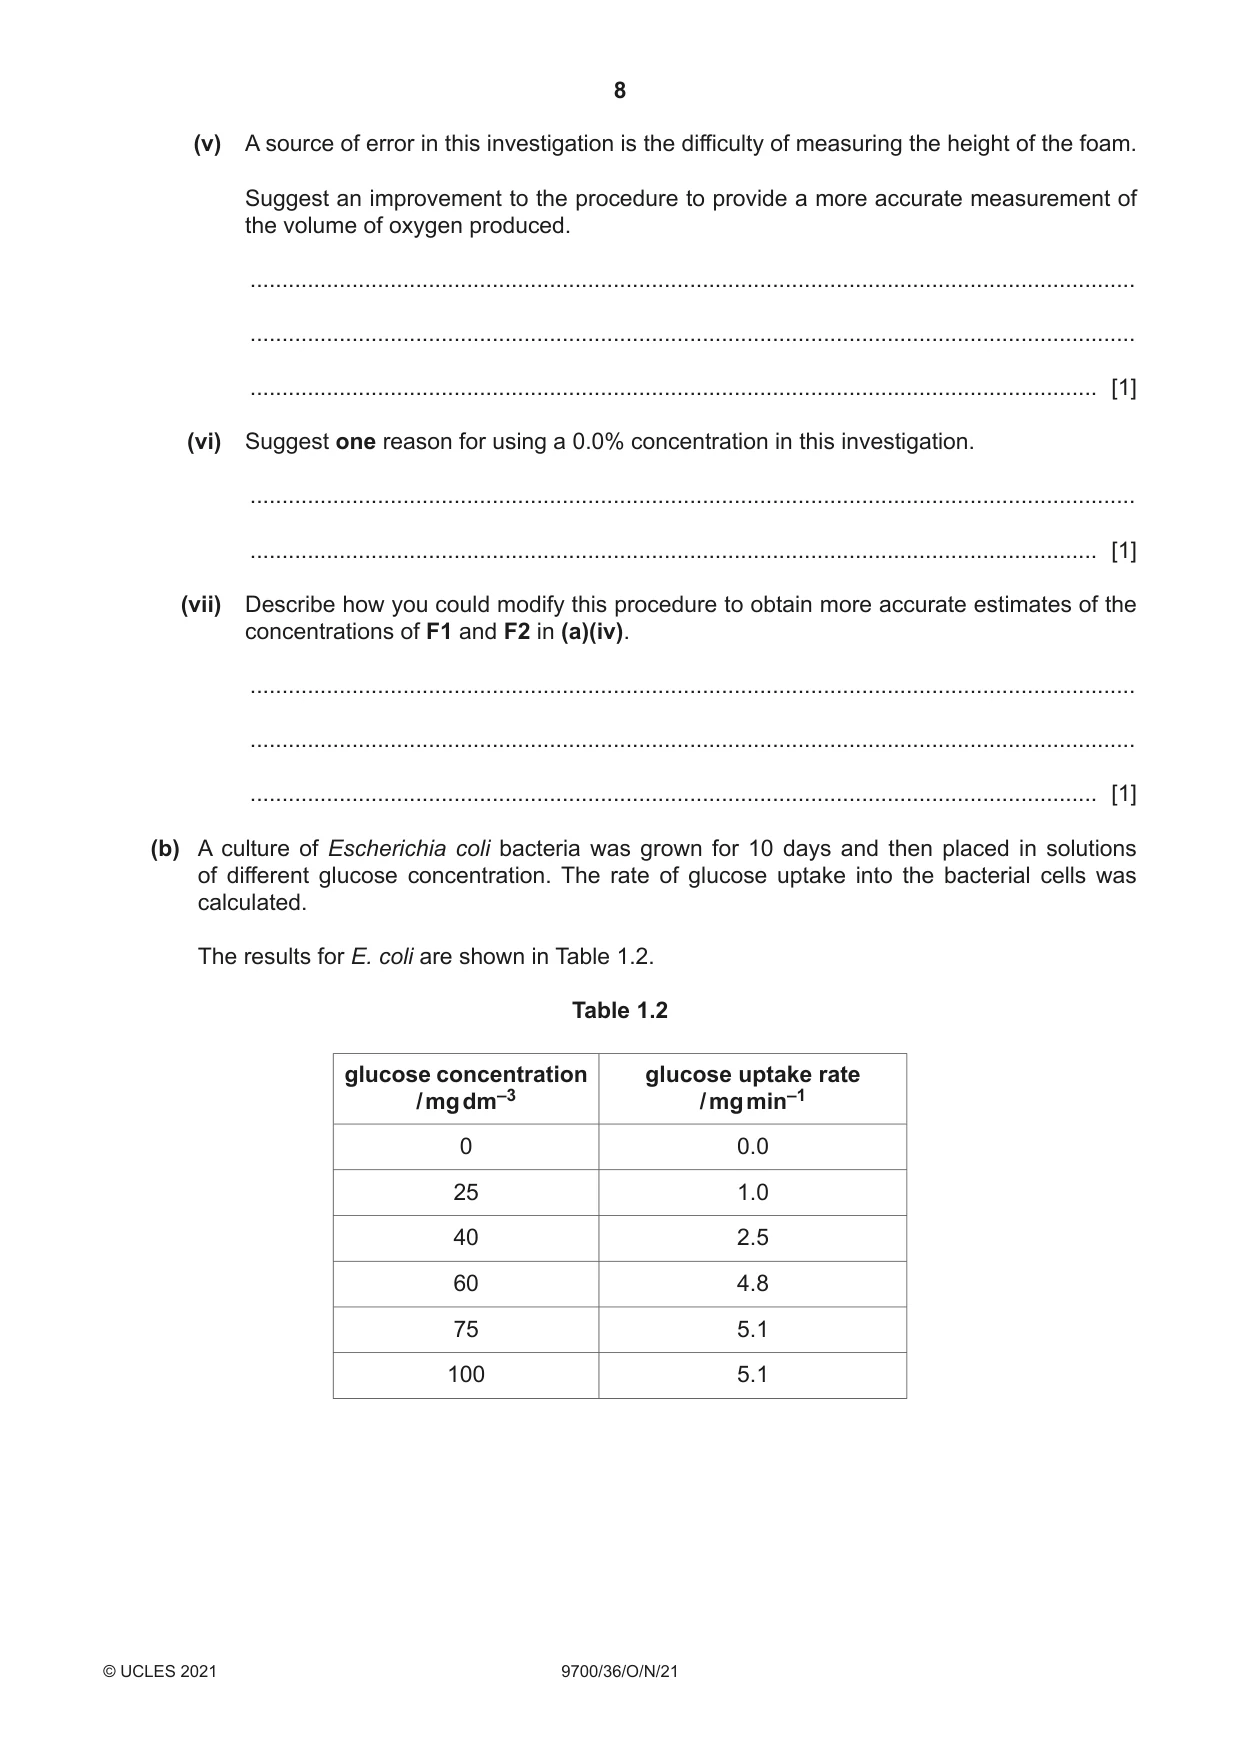
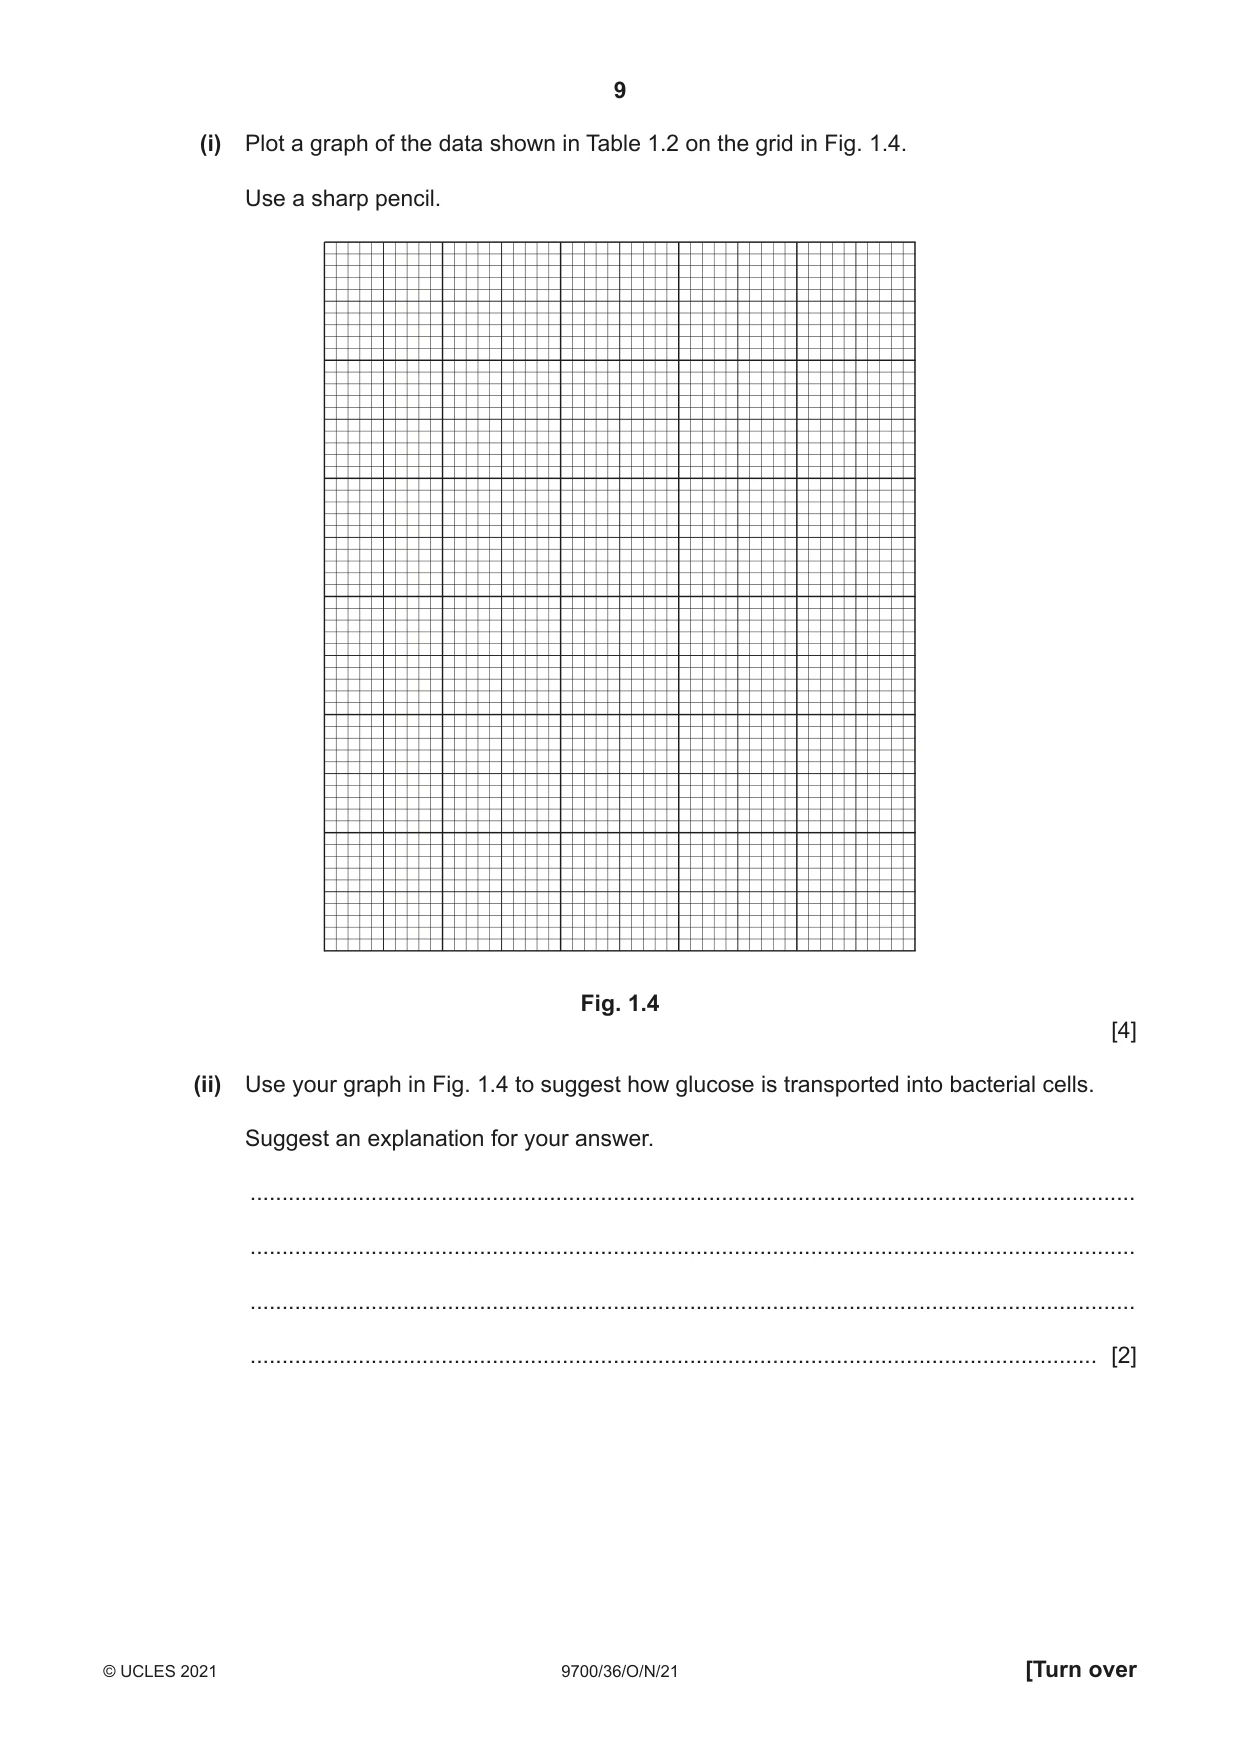
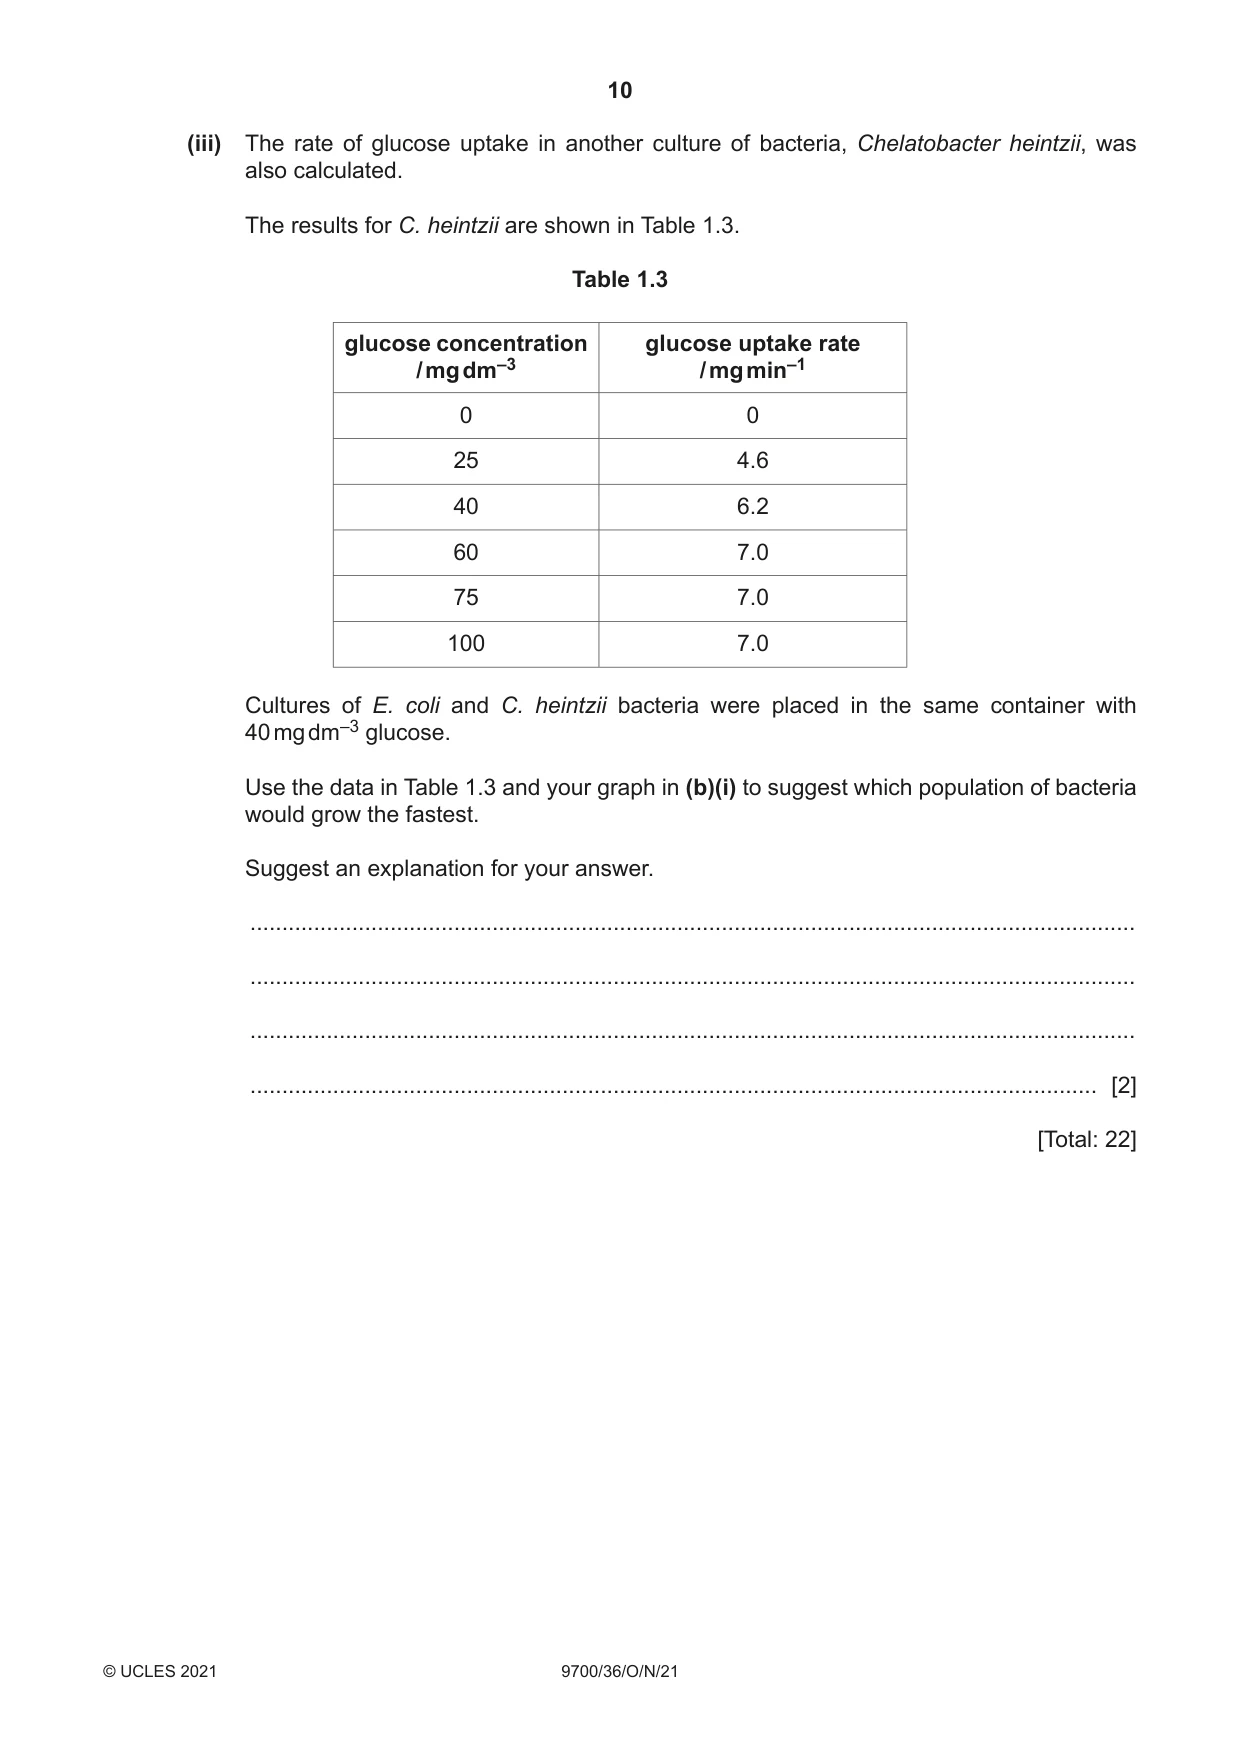
1 Catalase is an enzyme produced by bacteria. Catalase breaks down hydrogen peroxide to produce oxygen gas, as shown in Fig. 1.1. catalase hydrogen peroxide water + oxygen Fig. 1.1 The activity of catalase can be used to determine the level of bacterial contamination in a food sample. You will investigate catalase activity in two food samples, F1 and F2. You are provided with the materials shown in Table 1.1. Table 1.1 labelled contents hazard volume / cm3 harmful E 10.0% catalase solution 30 irritant F1 food sample 1 none 20 F2 food sample 2 none 20 harmful H hydrogen peroxide solution 50 irritant D detergent solution irritant 20 W distilled water none 200 If any solution comes into contact with your skin, wash off immediately under cold water. It is recommended that you wear suitable eye protection. (a) You will need to carry out a serial dilution of the 10.0% catalase solution, E, to reduce the concentration of catalase by half between each successive dilution. You will need to prepare four concentrations of catalase solution in addition to the 10.0% catalase solution, E. After the serial dilution is completed, you will need to have 10 cm3 of each concentration available to use. (i) Complete Fig. 1.2 to show how you will prepare your serial dilution. Fig. 1.2 shows the first two beakers you will use to make your serial dilution. You will need to draw three additional beakers. For each beaker add labelled arrows to show: • the volume of catalase solution transferred • the volume of distilled water, W, added. Under each beaker, state the concentration of catalase solution. 0 cm3 of W 20 cm3 of ............................. 10.0% catalase ............................. solution, E ............................. ............................. 10 cm3 of 10.0% catalase solution, to use ............................. ............................. ............................. ............................. Fig. 1.2 [3] Carry out step 1 to step 15. 1. Prepare the concentrations of catalase solution, as decided in (a)(i), in the beakers provided. 2. Label five of the test-tubes with the concentrations you prepared in step 1. 3. Put 1 cm3 of each concentration of catalase solution into the appropriately labelled test-tube. 4. Label another test-tube 0.0% and put 1 cm3 of distilled water, W, into this test-tube. 5. Put one drop of detergent solution, D, into each labelled test-tube. Mix gently. When detergent is used, any oxygen produced by the breakdown of hydrogen peroxide is trapped as foam. The height of the foam can be used as a measure of the volume of oxygen produced. 6. Put 5 cm3 of H into each labelled test-tube. This should be done by touching the nozzle of the syringe against the inside of the test-tube, as shown in Fig. 1.3. Gently push the plunger of the syringe so that H runs down the inside of the test-tube. push gently H Fig. 1.3 7. Start timing. When the foam reaches the top of at least one of the test-tubes, stop timing and record this time. If the foam does not reach the top of any test-tube after 3 minutes, stop timing and record this time as ‘3 minutes’. time = ................................. 8. Measure the height of the foam in each test-tube. Record your results in (a)(ii). (ii) Record your results in an appropriate table. [4] 9. Label a test-tube F1, and label another test-tube F2. 10. Put 1 cm3 of F1 into the appropriately labelled test-tube. 11. Put 1 cm3 of F2 into the appropriately labelled test-tube. 12. Put one drop of D into each labelled test-tube. Mix gently. 13. Put 5 cm3 of H into each labelled test-tube as described in step 6. 14. Start timing and leave for the time you recorded in step 7. 15. After this time (step 14), measure the height of the foam in each test-tube. (iii) Record the height of the foam in each test-tube. Include appropriate units. F1 ................................... F2 ................................... [2] (iv) Use your results from (a)(ii) and (a)(iii) to estimate the concentration of catalase in food samples F1 and F2. F1 ................................... % F2 ................................... % [2] (v) A source of error in this investigation is the difficulty of measuring the height of the foam. Suggest an improvement to the procedure to provide a more accurate measurement of the volume of oxygen produced. ........................................................................................................................................... ........................................................................................................................................... ..................................................................................................................................... [1] (vi) Suggest one reason for using a 0.0% concentration in this investigation. ........................................................................................................................................... ..................................................................................................................................... [1] (vii) Describe how you could modify this procedure to obtain more accurate estimates of the concentrations of F1 and F2 in (a)(iv). ........................................................................................................................................... ........................................................................................................................................... ..................................................................................................................................... [1] (b) A culture of Escherichia coli bacteria was grown for 10 days and then placed in solutions of different glucose concentration. The rate of glucose uptake into the bacterial cells was calculated. The results for E. coli are shown in Table 1.2. Table 1.2 glucose concentration glucose uptake rate / mg dm–3 / mg min–1 0 0.0 25 1.0 40 2.5 60 4.8 75 5.1 100 5.1 (i) Plot a graph of the data shown in Table 1.2 on the grid in Fig. 1.4. Use a sharp pencil. Fig. 1.4 [4] (ii) Use your graph in Fig. 1.4 to suggest how glucose is transported into bacterial cells. Suggest an explanation for your answer. ........................................................................................................................................... ........................................................................................................................................... ........................................................................................................................................... ..................................................................................................................................... [2] (iii) The rate of glucose uptake in another culture of bacteria, Chelatobacter heintzii, was also calculated. The results for C. heintzii are shown in Table 1.3. Table 1.3 glucose concentration glucose uptake rate / mg dm–3 / mg min–1 0 0 25 4.6 40 6.2 60 7.0 75 7.0 100 7.0 Cultures of E. coli and C. heintzii bacteria were placed in the same container with 40 mg dm–3 glucose. Use the data in Table 1.3 and your graph in (b)(i) to suggest which population of bacteria would grow the fastest. Suggest an explanation for your answer. ........................................................................................................................................... ........................................................................................................................................... ........................................................................................................................................... ..................................................................................................................................... [2] [Total: 22]
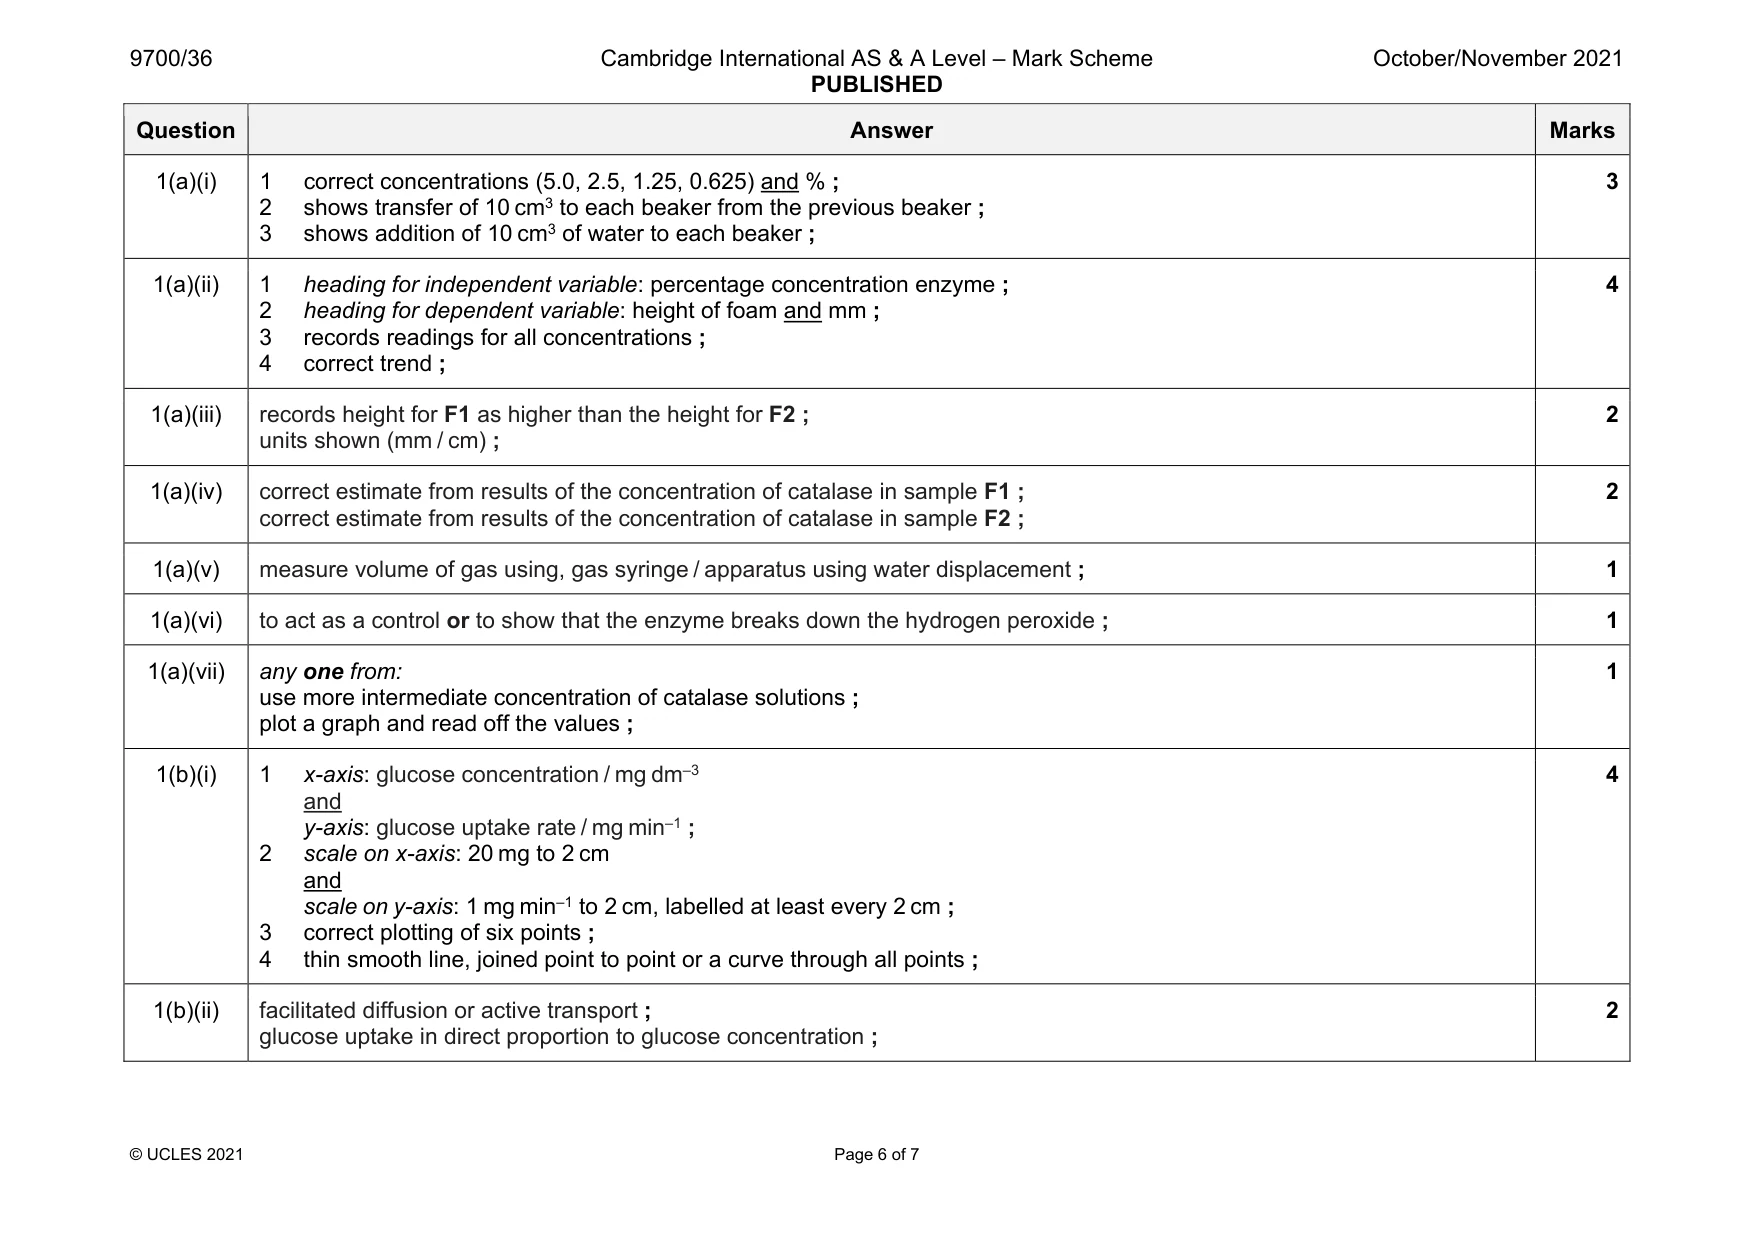
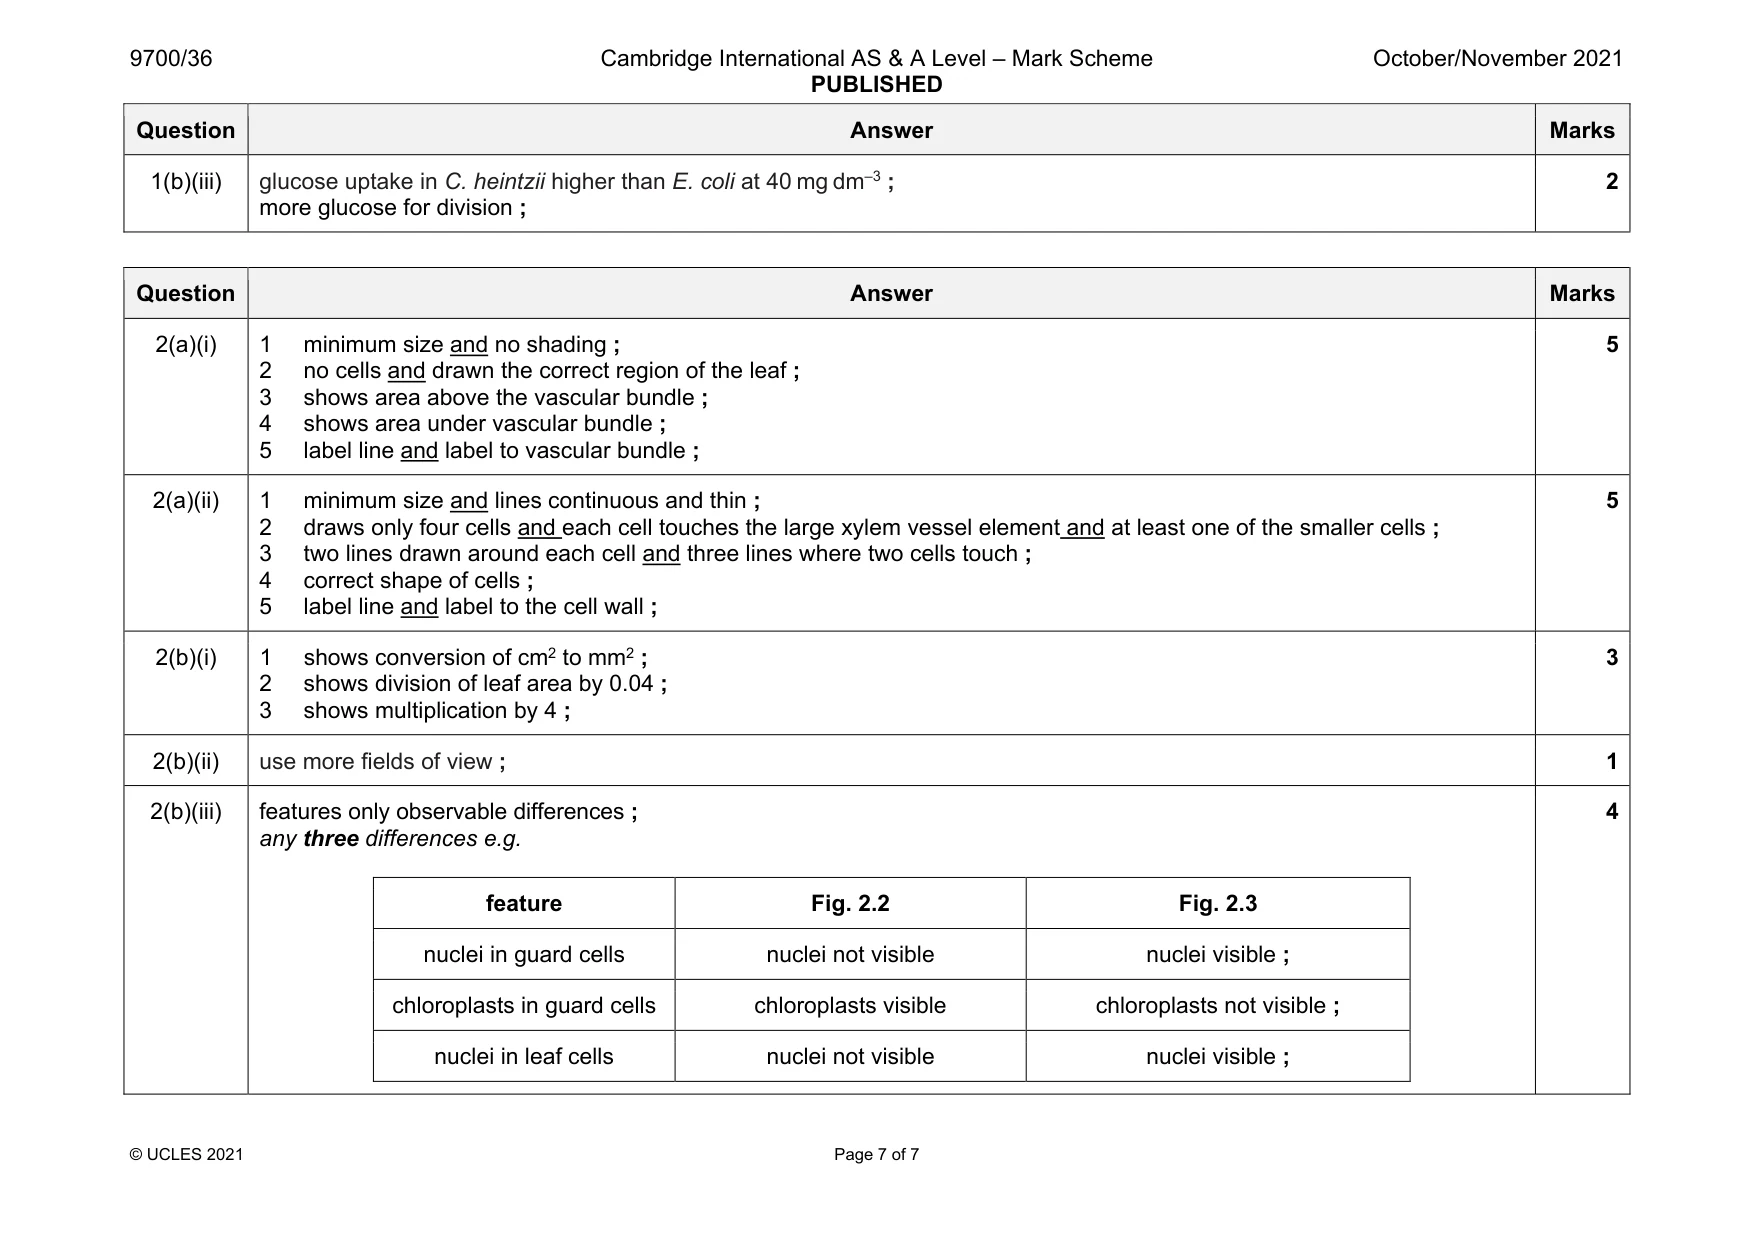
Mark scheme: 1(a)(i) 1 correct concentrations (5.0, 2.5, 1.25, 0.625) and % ; 2 shows transfer of 10 cm3 to each beaker from the previous beaker ; 3 shows addition of 10 cm3 of water to each beaker ; 3 1(a)(ii) 1 heading for independent variable: percentage concentration enzyme ; 2 heading for dependent variable: height of foam and mm ; 3 records readings for all concentrations ; 4 correct trend ; 4 1(a)(iii) records height for F1 as higher than the height for F2 ; units shown (mm / cm) ; 2 1(a)(iv) correct estimate from results of the concentration of catalase in sample F1 ; correct estimate from results of the concentration of catalase in sample F2 ; 2 1(a)(v) measure volume of gas using, gas syringe / apparatus using water displacement ; 1 1(a)(vi) to act as a control or to show that the enzyme breaks down the hydrogen peroxide ; 1 1(a)(vii) any one from: use more intermediate concentration of catalase solutions ; plot a graph and read off the values ; 1 1(b)(i) 1 x-axis: glucose concentration / mg dm–3 and y-axis: glucose uptake rate / mg min–1 ; 2 scale on x-axis: 20 mg to 2 cm and scale on y-axis: 1 mg min–1 to 2 cm, labelled at least every 2 cm ; 3 correct plotting of six points ; 4 thin smooth line, joined point to point or a curve through all points ; 4 1(b)(ii) facilitated diffusion or active transport ; glucose uptake in direct proportion to glucose concentration ; 2 Question Answer Marks 1(b)(iii) glucose uptake in C. heintzii higher than E. coli at 40 mg dm–3 ; more glucose for division ; 2
Q2 · N1 is a slide of a stained transverse section through a plant leaf
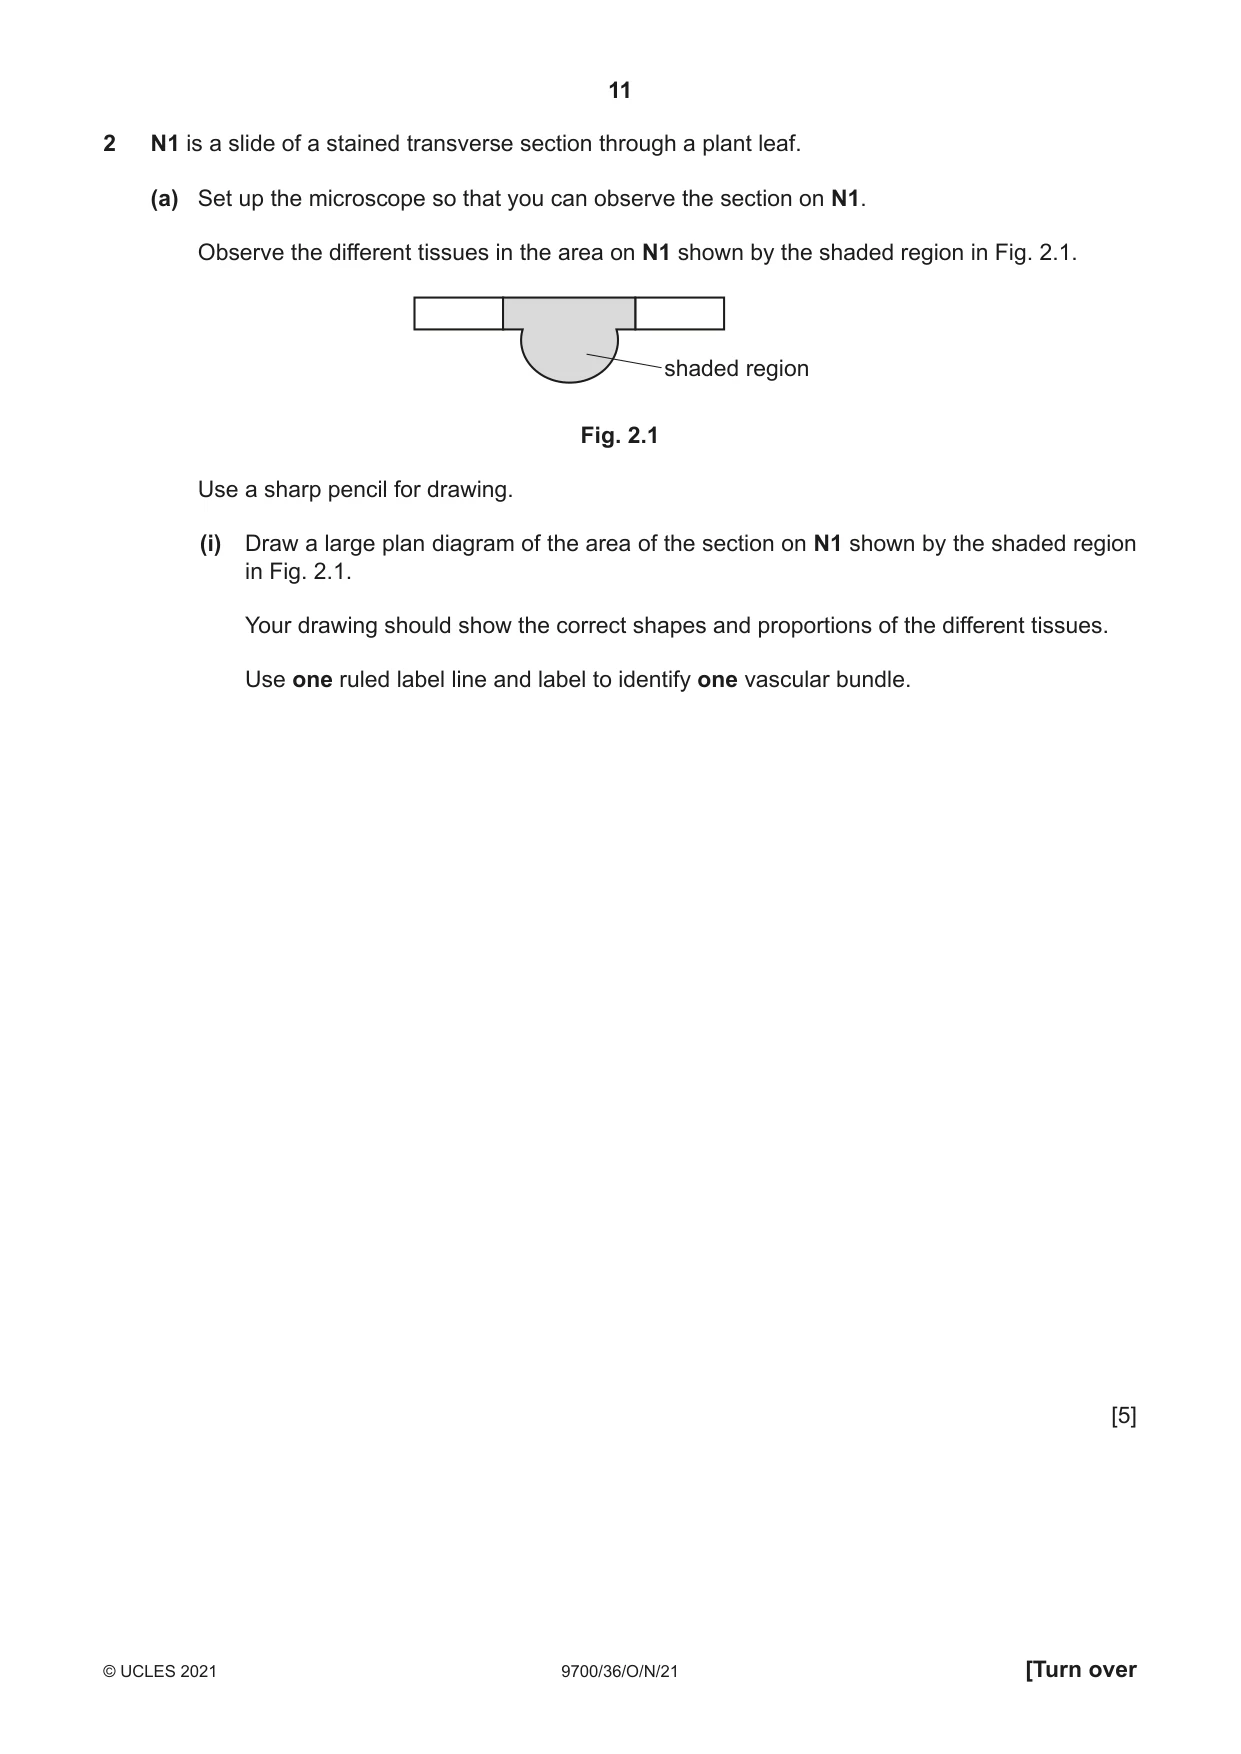
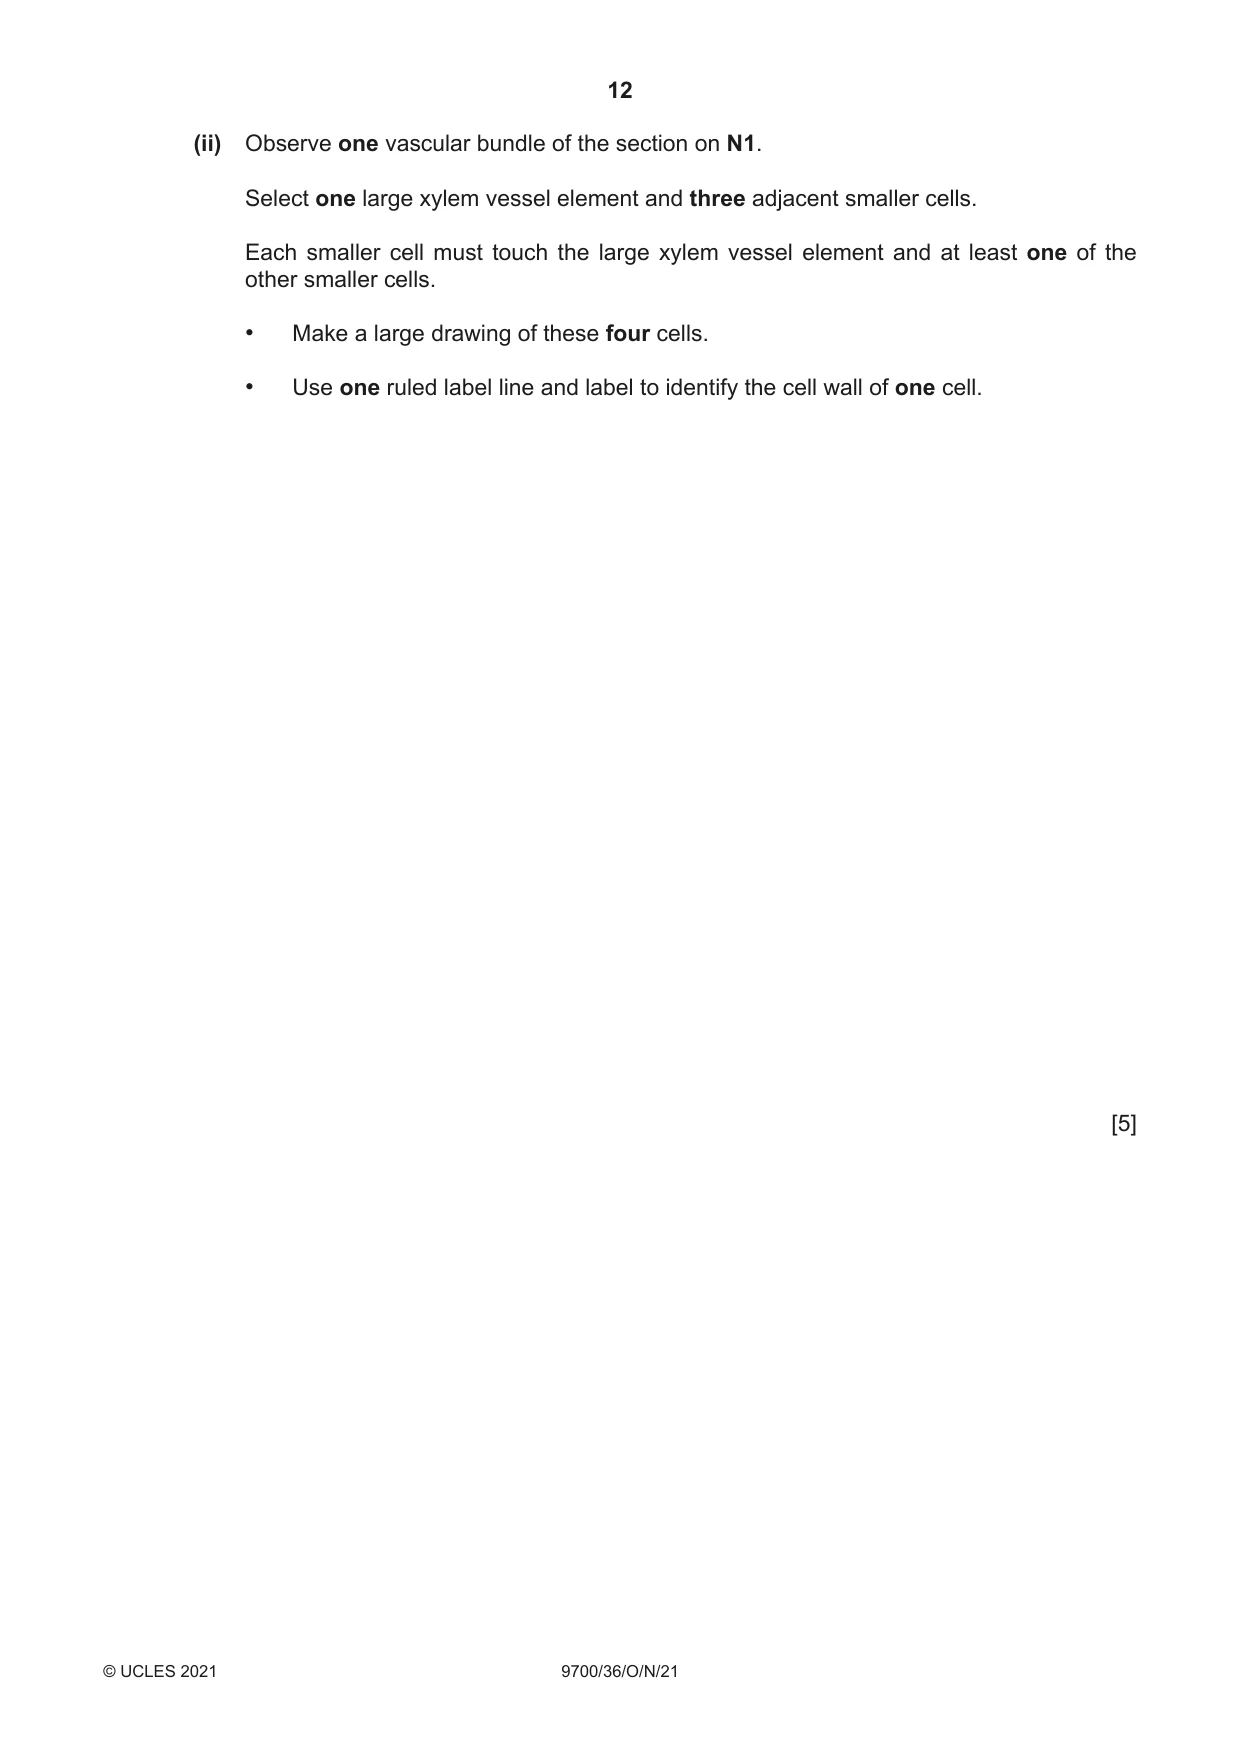
2 N1 is a slide of a stained transverse section through a plant leaf. (a) Set up the microscope so that you can observe the section on N1. Observe the different tissues in the area on N1 shown by the shaded region in Fig. 2.1. shaded region Fig. 2.1 Use a sharp pencil for drawing. (i) Draw a large plan diagram of the area of the section on N1 shown by the shaded region in Fig. 2.1. Your drawing should show the correct shapes and proportions of the different tissues. Use one ruled label line and label to identify one vascular bundle. [5] (ii) Observe one vascular bundle of the section on N1. Select one large xylem vessel element and three adjacent smaller cells. Each smaller cell must touch the large xylem vessel element and at least one of the other smaller cells. • Make a large drawing of these four cells. • Use one ruled label line and label to identify the cell wall of one cell. [5] Question 2 continues on page 14
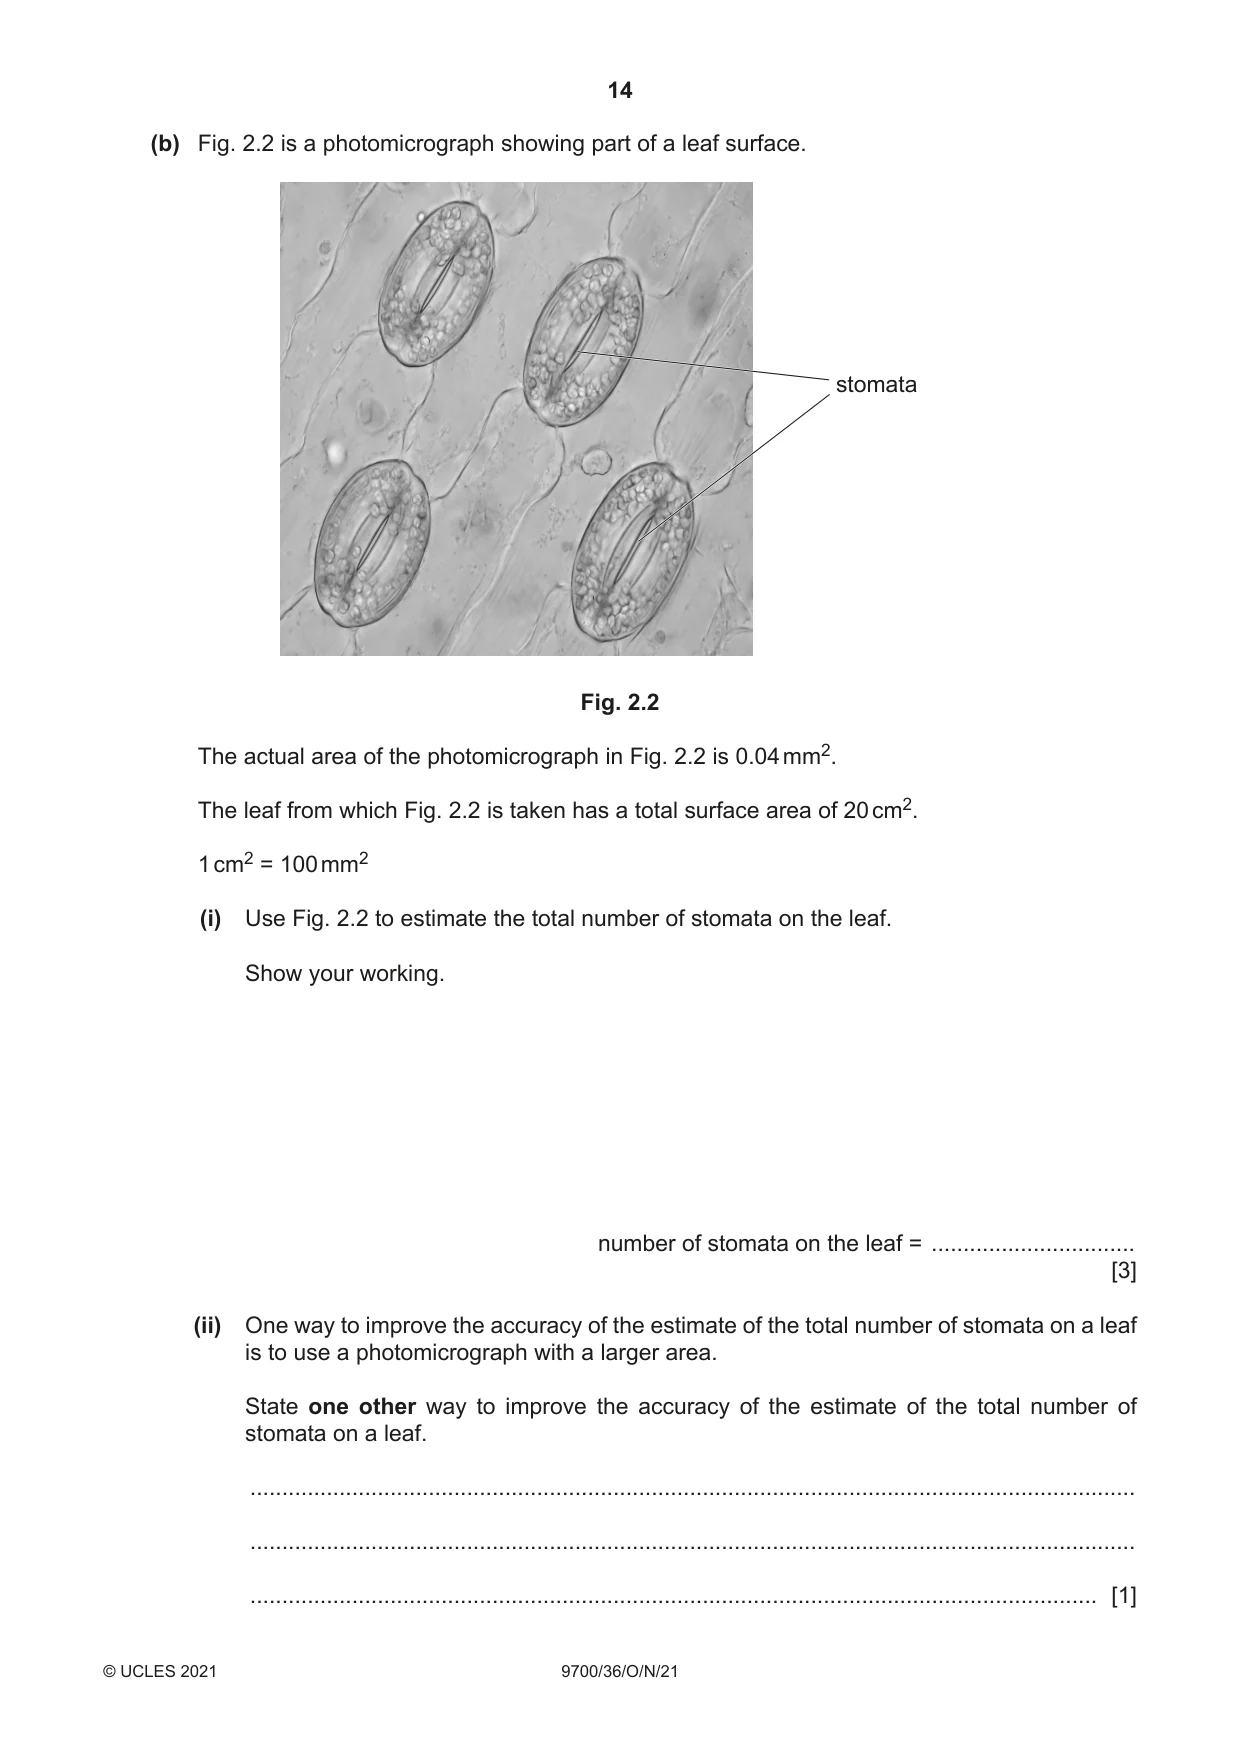
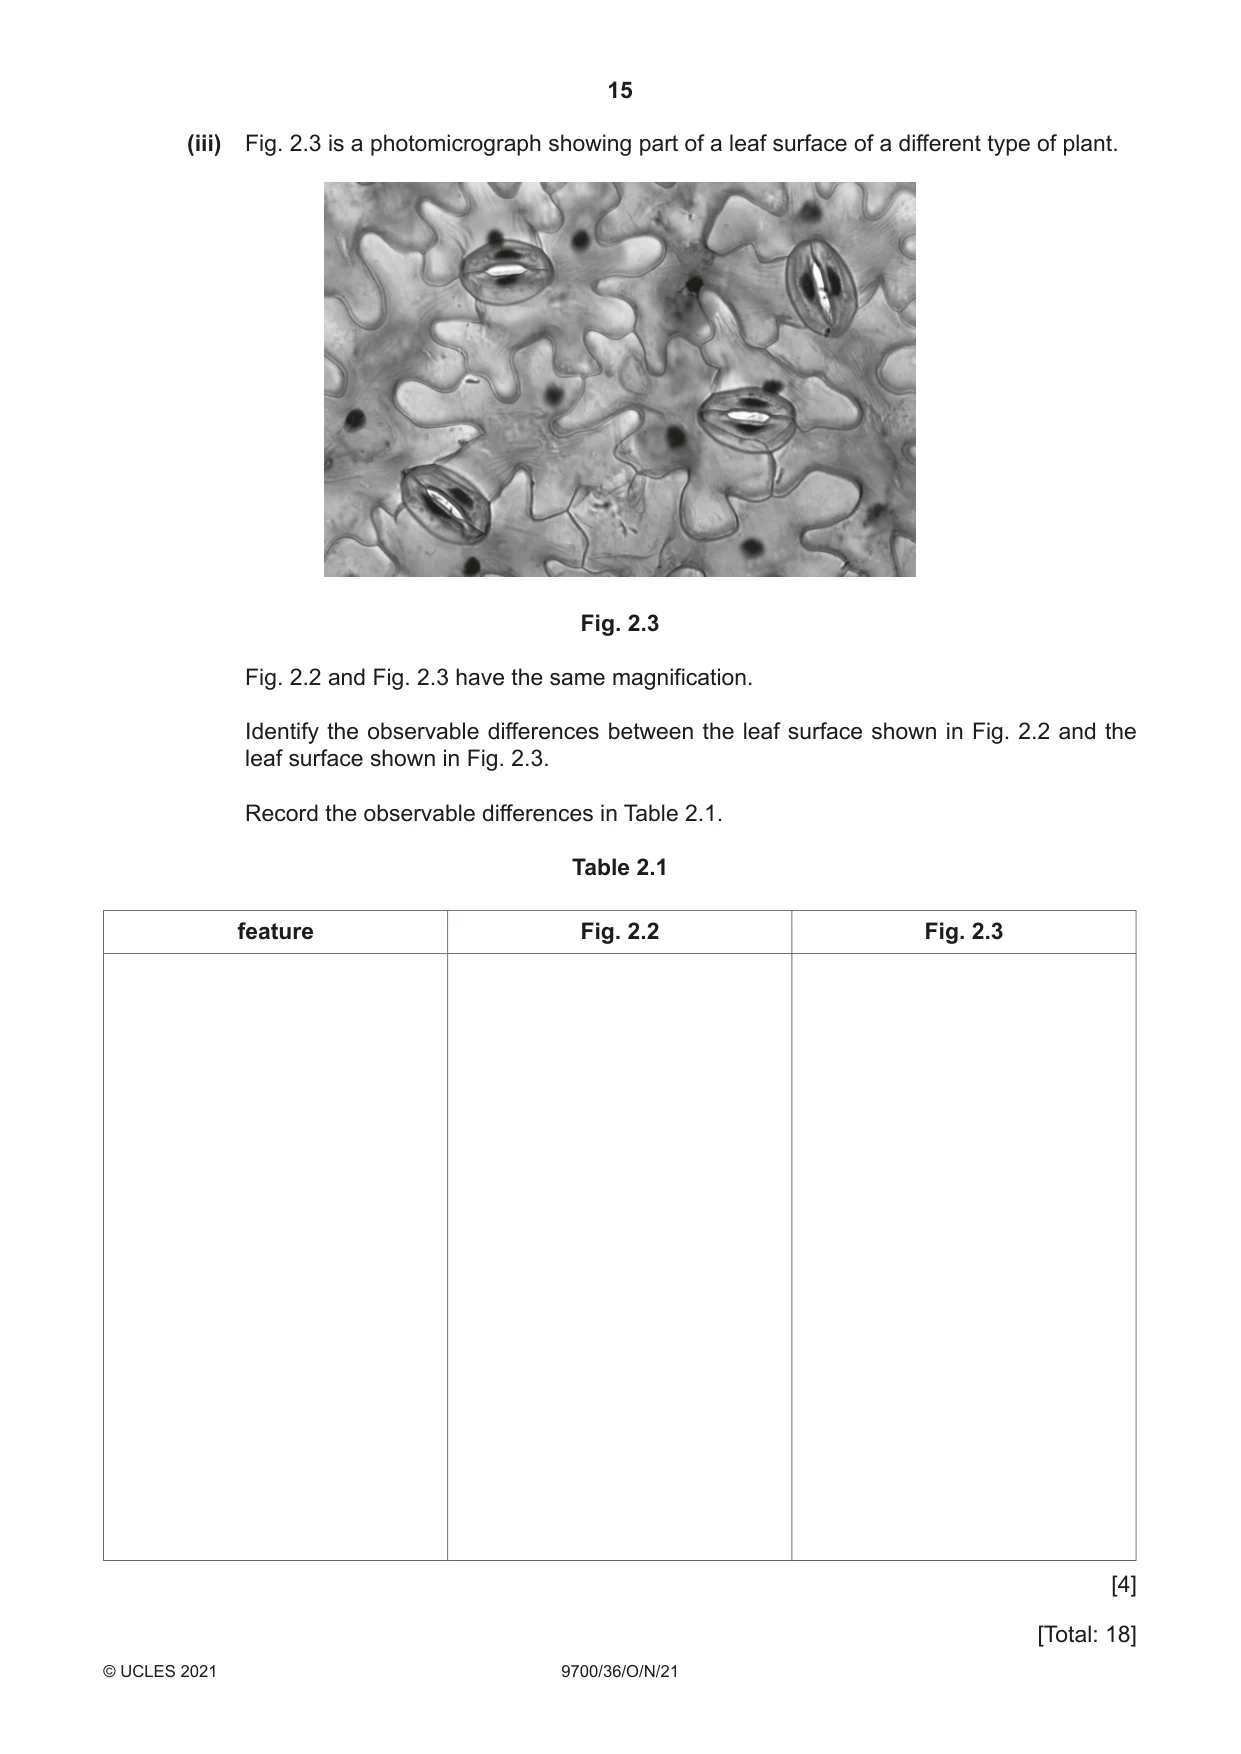
Mark scheme: 2(a)(i) 1 minimum size and no shading ; 2 no cells and drawn the correct region of the leaf ; 3 shows area above the vascular bundle ; 4 shows area under vascular bundle ; 5 label line and label to vascular bundle ; 5 2(a)(ii) 1 minimum size and lines continuous and thin ; 2 draws only four cells and each cell touches the large xylem vessel element and at least one of the smaller cells ; 3 two lines drawn around each cell and three lines where two cells touch ; 4 correct shape of cells ; 5 label line and label to the cell wall ; 5 2(b)(i) 1 shows conversion of cm2 to mm2 ; 2 shows division of leaf area by 0.04 ; 3 shows multiplication by 4 ; 3 2(b)(ii) use more fields of view ; 1 2(b)(iii) features only observable differences ; any three differences e.g. feature Fig. 2.2 Fig. 2.3 nuclei in guard cells nuclei not visible nuclei visible ; chloroplasts in guard cells chloroplasts visible chloroplasts not visible ; nuclei in leaf cells nuclei not visible nuclei visible ; 4
What was in this paper
The subtopics covered by these 2 questions, and how many questions each got. Open one in a new tab to see every Cambridge question on it.
What you needed in this session
Cambridge’s own grade thresholds for 2021 Oct/Nov, Paper 3 · Variant 6. A higher threshold means an easier paper — the bar moves with how the cohort did.