Cambridge A Level Biology 9700 — 2017 Oct/Nov Paper 3 · Variant 5
9700/35/O/N/17 · 2 questions · 40 marks · ≈45 min
The question paper and its mark scheme, free to read here and free to download. This is Cambridge’s own paper, exactly as it was sat.
Question paper16 pages




Mark scheme7 pages
Answers below. Sit the paper first if you are practising.
Questions as text
Q1 · In humans, the kidneys are the organs that remove waste products from the blood and…
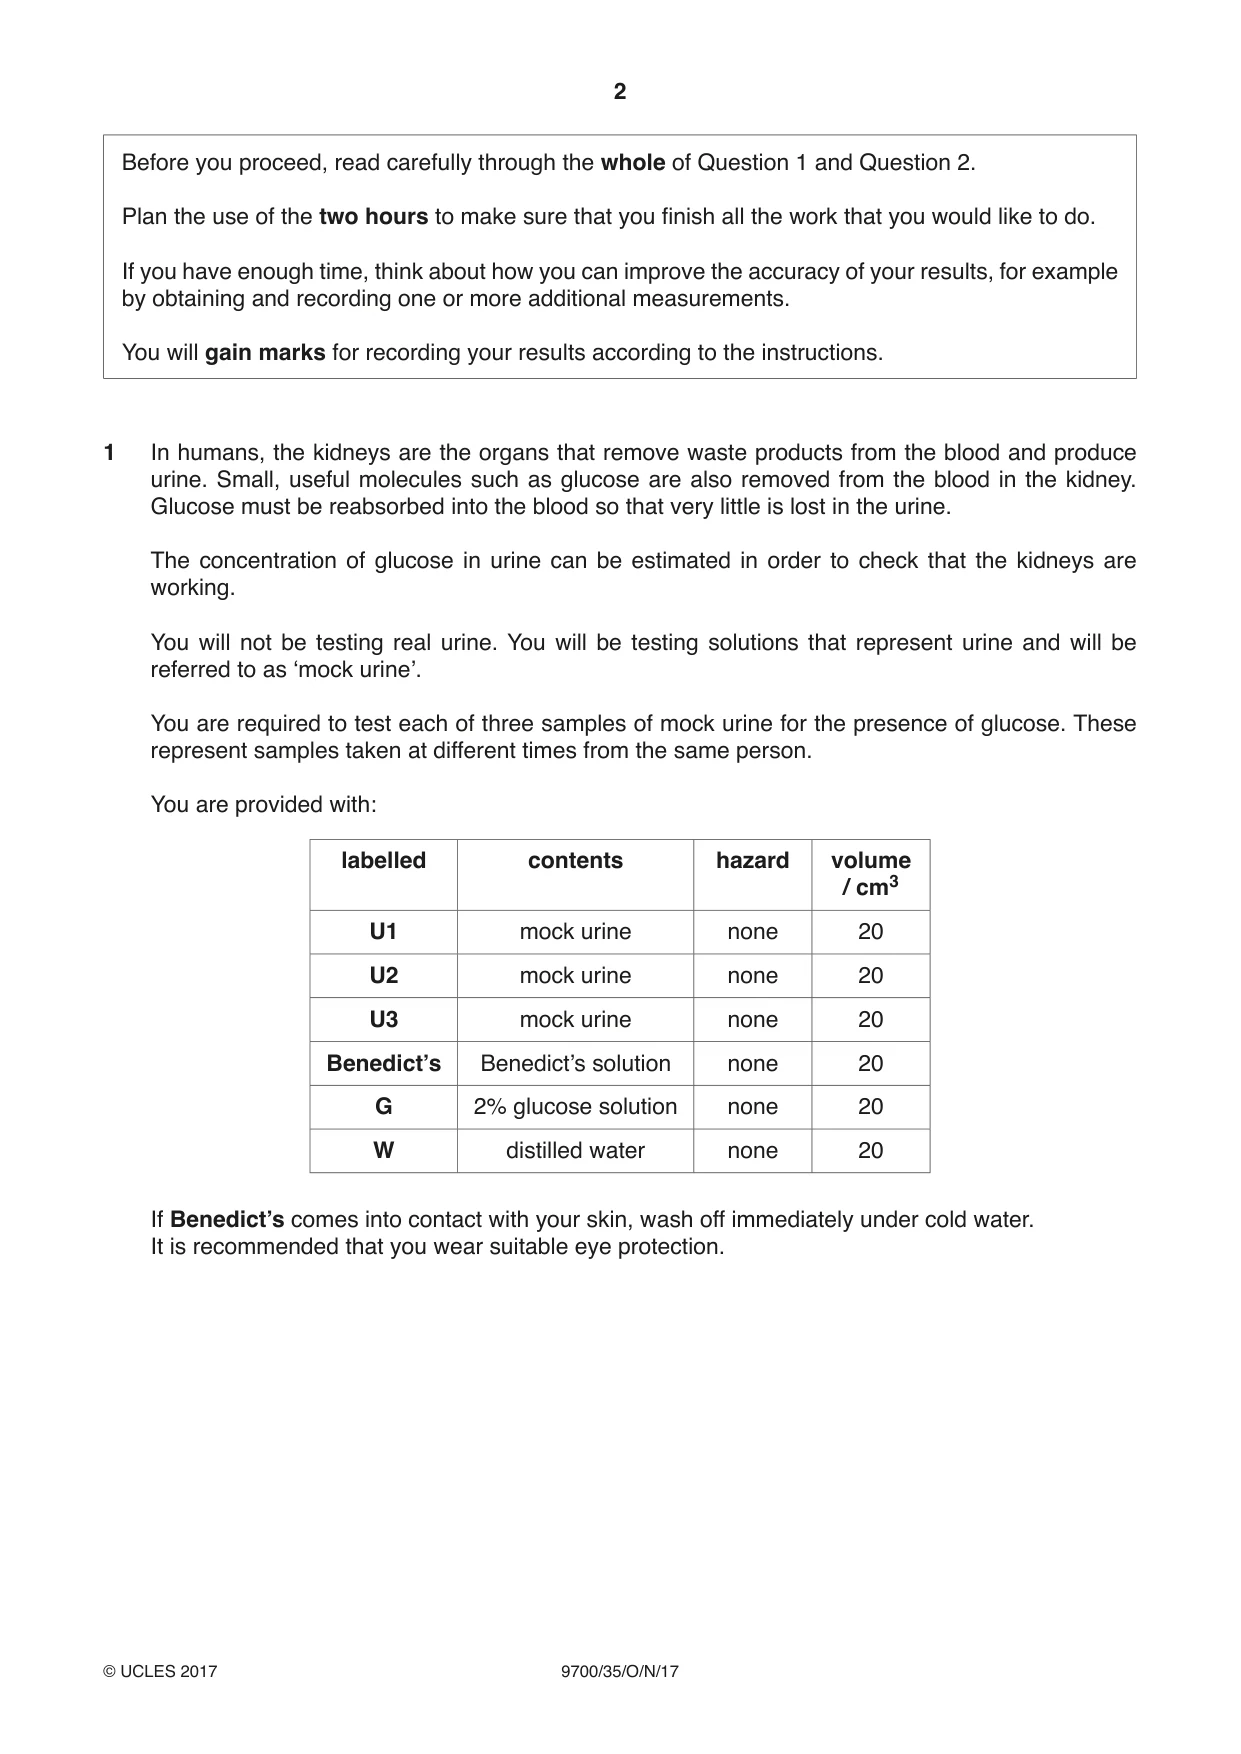
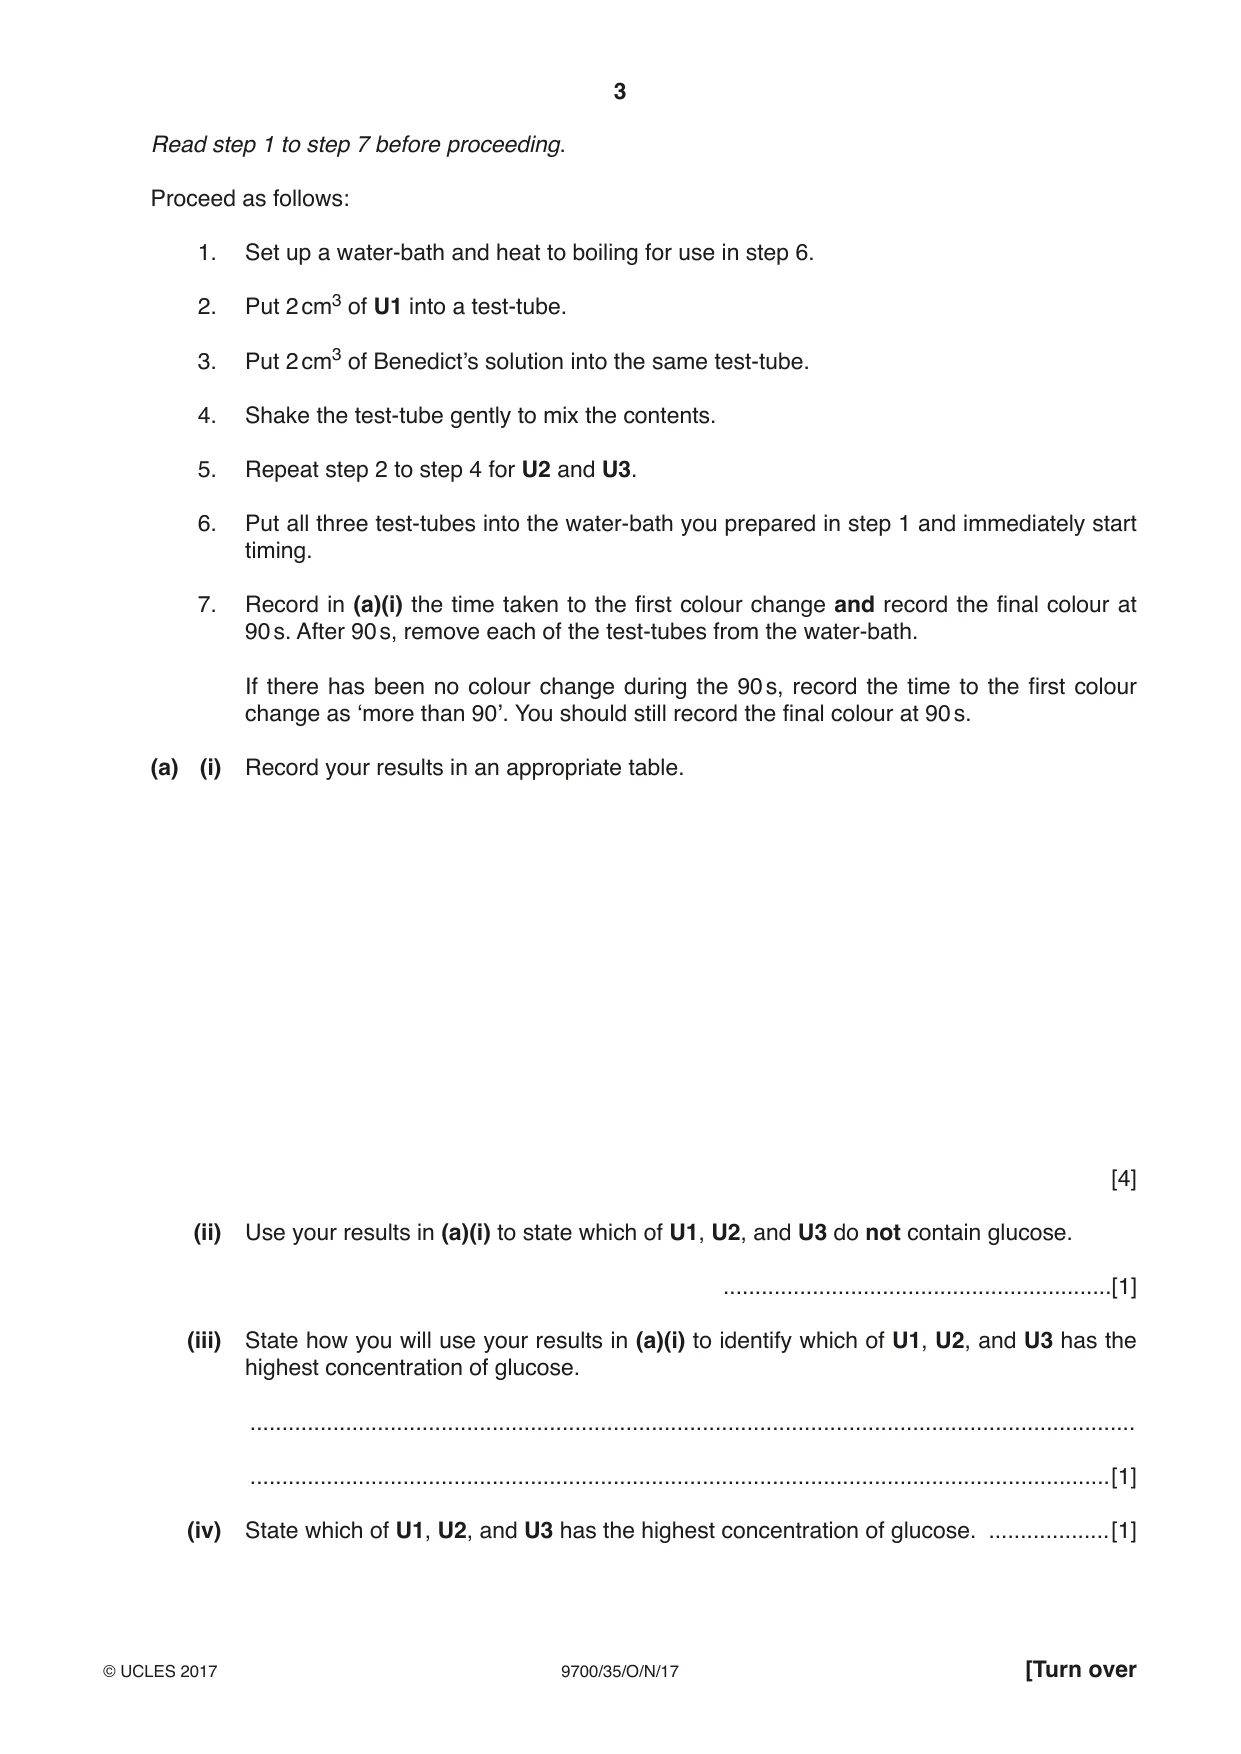
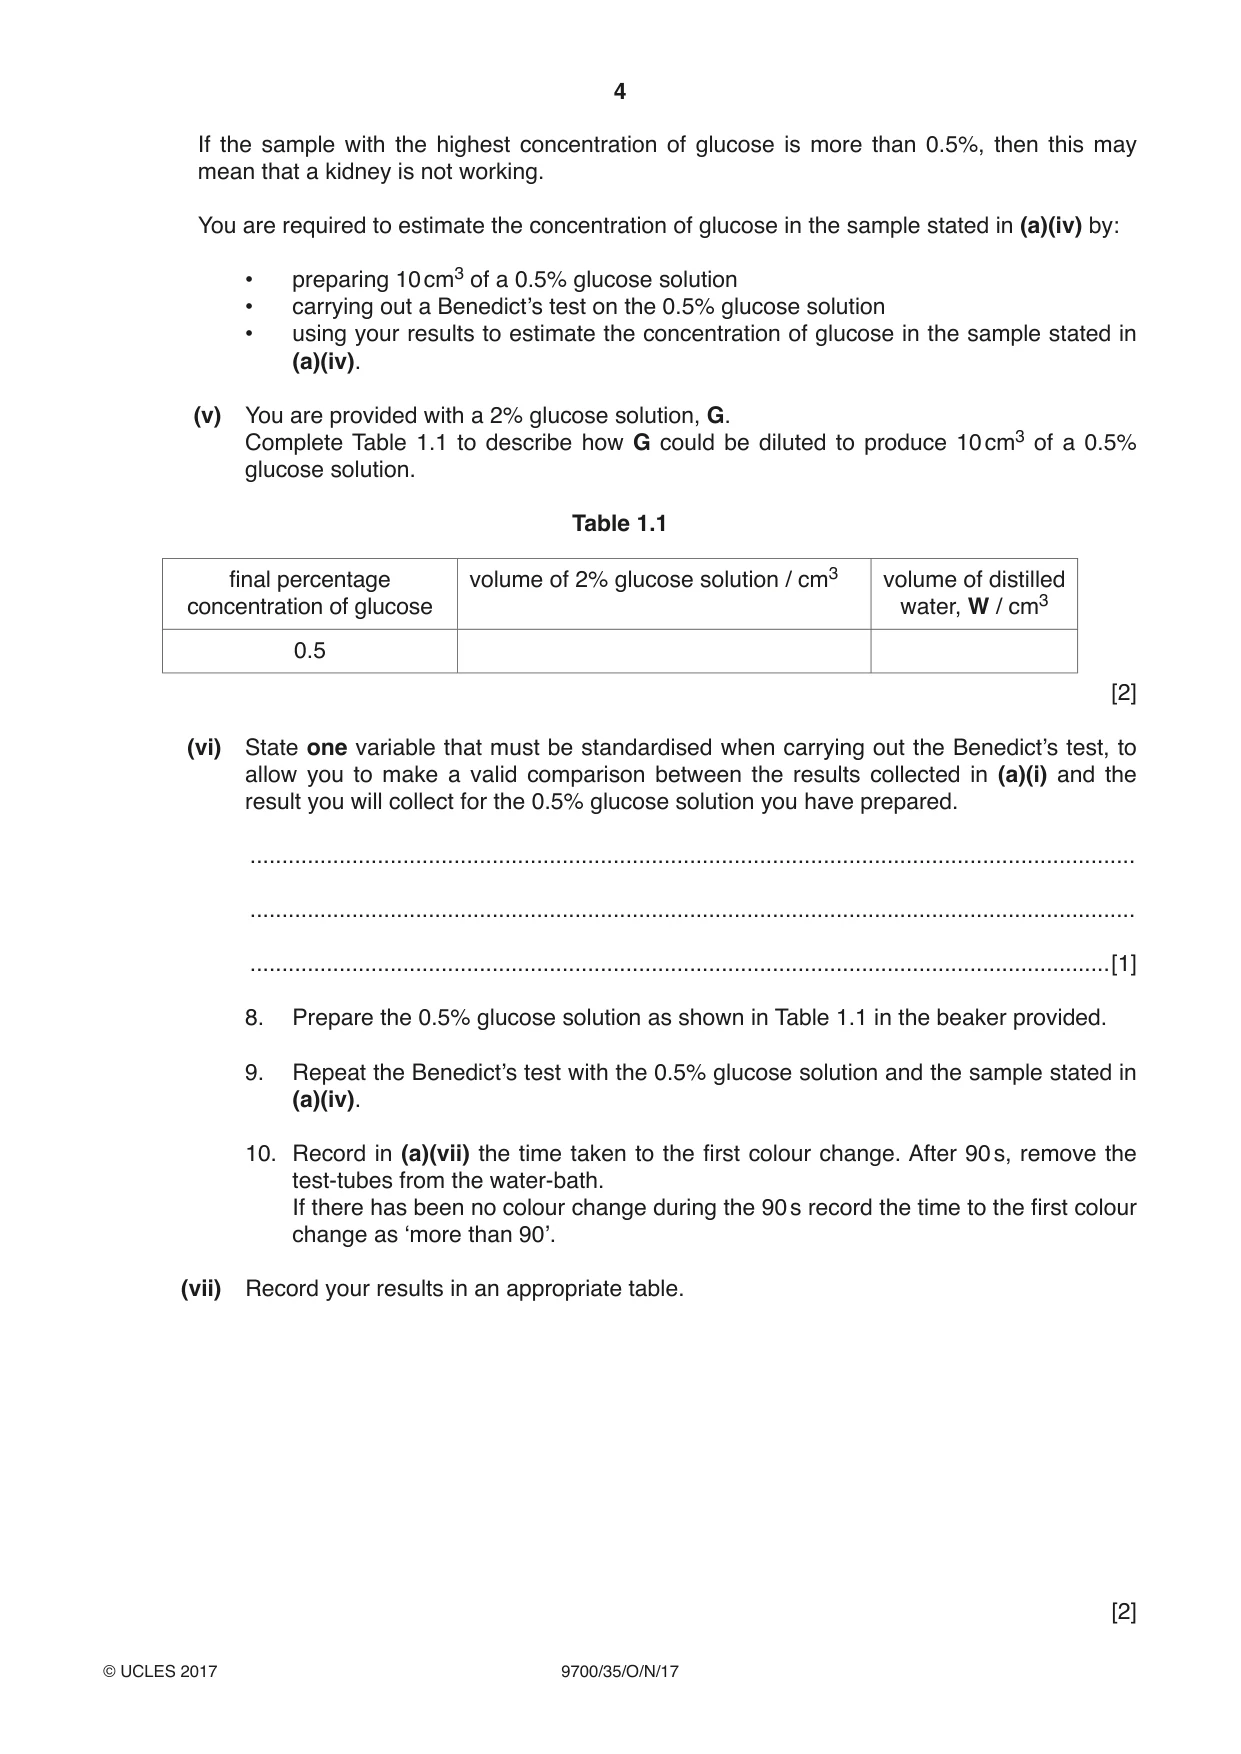
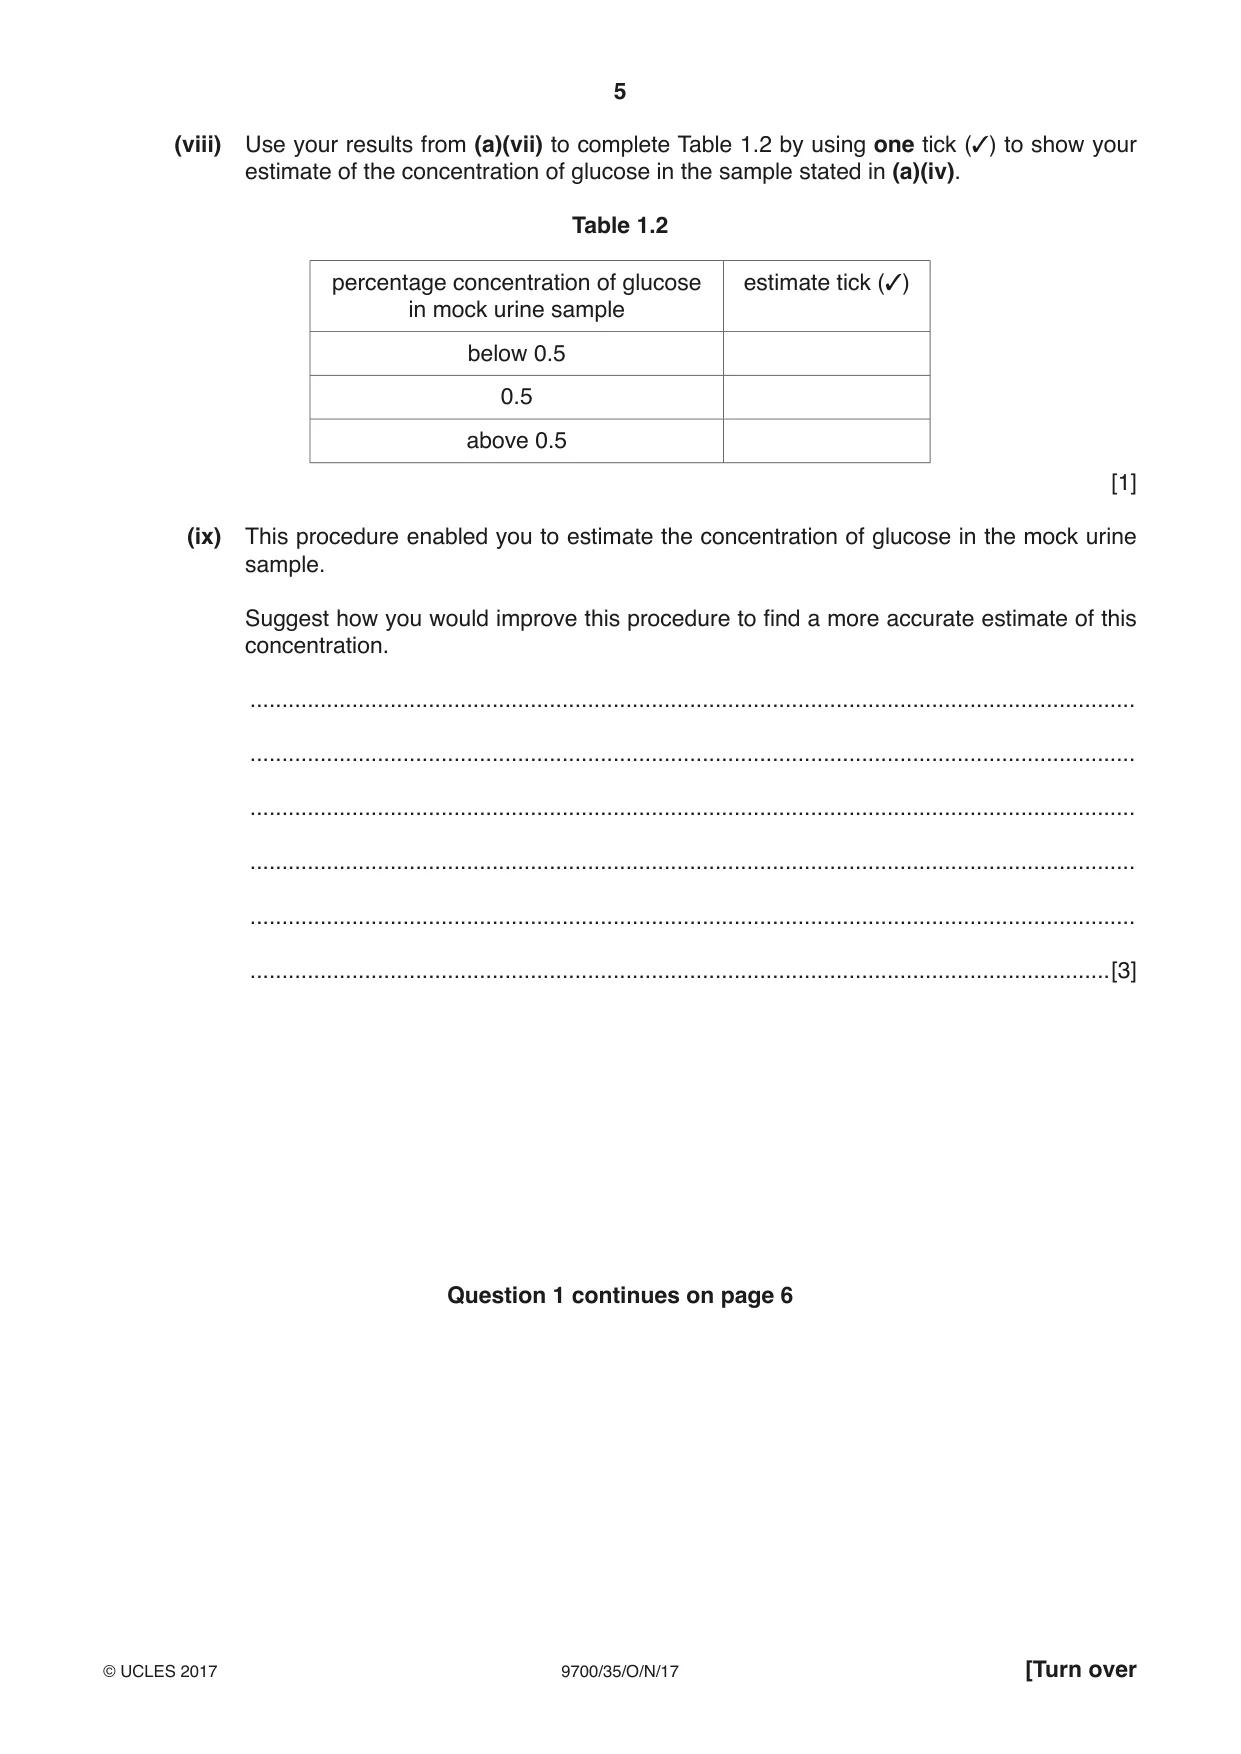
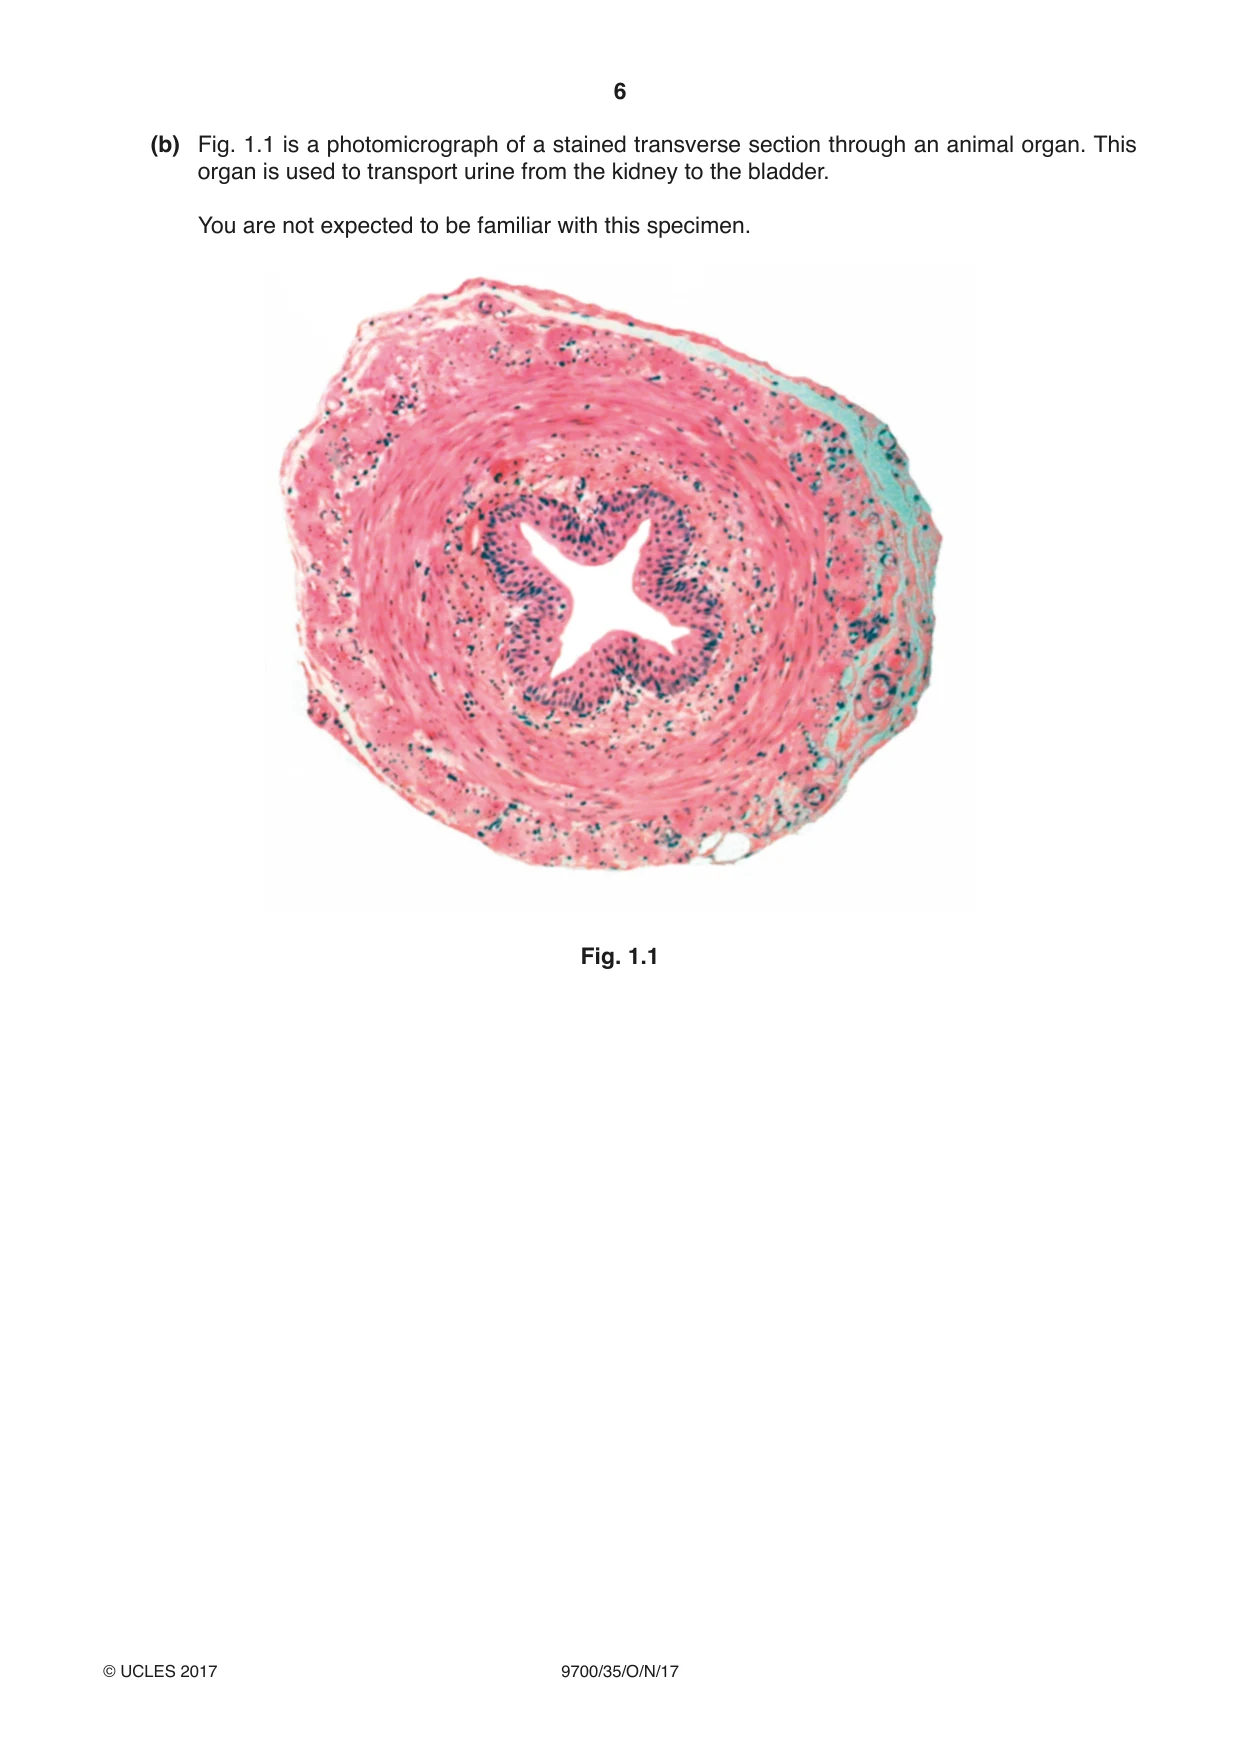
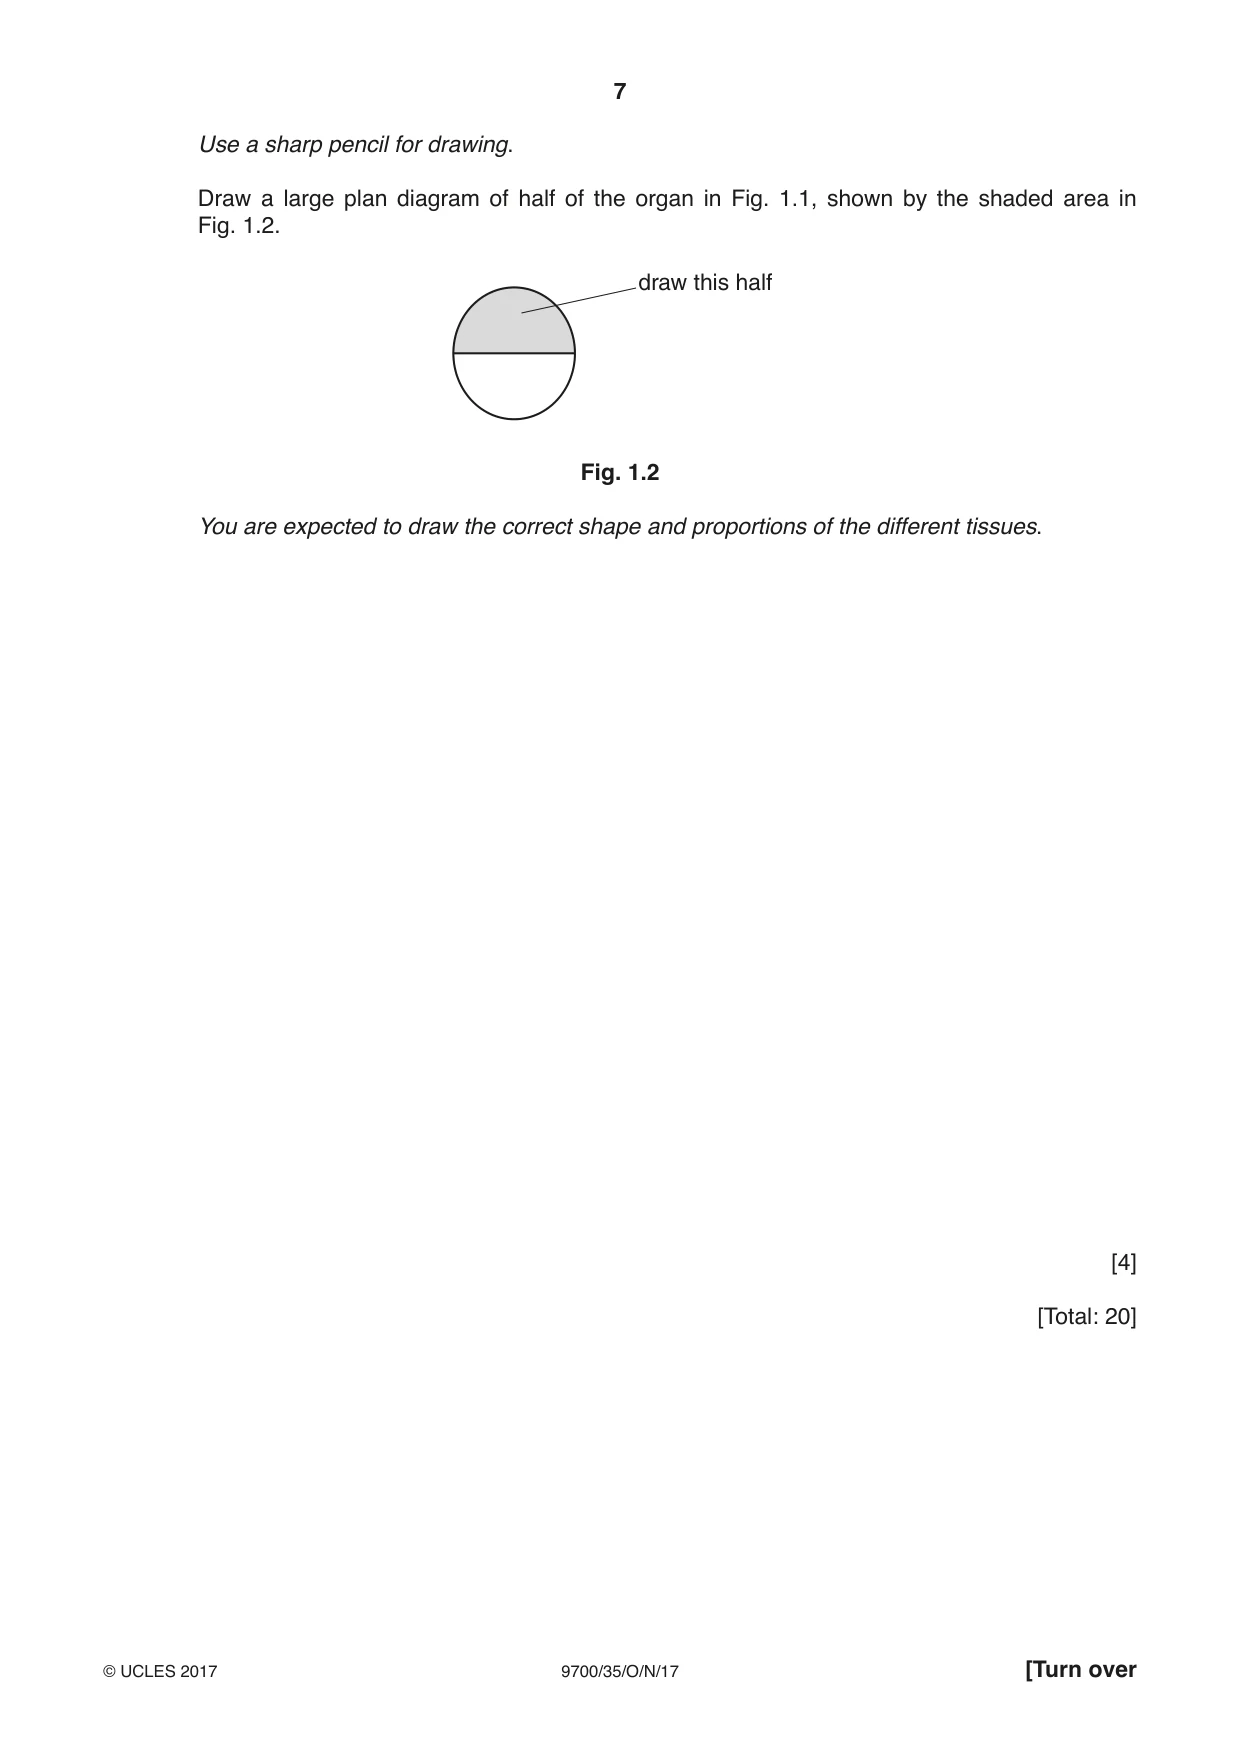
1 In humans, the kidneys are the organs that remove waste products from the blood and produce urine. Small, useful molecules such as glucose are also removed from the blood in the kidney. Glucose must be reabsorbed into the blood so that very little is lost in the urine. The concentration of glucose in urine can be estimated in order to check that the kidneys are working. You will not be testing real urine. You will be testing solutions that represent urine and will be referred to as ‘mock urine’. You are required to test each of three samples of mock urine for the presence of glucose. These represent samples taken at different times from the same person. You are provided with: labelled contents hazard volume / cm3 U1 mock urine none 20 U2 mock urine none 20 U3 mock urine none 20 Benedict’s Benedict’s solution none 20 G 2% glucose solution none 20 W distilled water none 20 If Benedict’s comes into contact with your skin, wash off immediately under cold water. It is recommended that you wear suitable eye protection. Read step 1 to step 7 before proceeding. Proceed as follows: 1. Set up a water-bath and heat to boiling for use in step 6. 2. Put 2 cm3 of U1 into a test-tube. 3. Put 2 cm3 of Benedict’s solution into the same test-tube. 4. Shake the test-tube gently to mix the contents. 5. Repeat step 2 to step 4 for U2 and U3. 6. Put all three test-tubes into the water-bath you prepared in step 1 and immediately start timing. 7. Record in (a)(i) the time taken to the first colour change and record the final colour at 90 s. After 90 s, remove each of the test-tubes from the water-bath. If there has been no colour change during the 90 s, record the time to the first colour change as ‘more than 90’. You should still record the final colour at 90 s. (a) (i) Record your results in an appropriate table. [4] (ii) Use your results in (a)(i) to state which of U1, U2, and U3 do not contain glucose. .............................................................[1] (iii) State how you will use your results in (a)(i) to identify which of U1, U2, and U3 has the highest concentration of glucose. ........................................................................................................................................... .......................................................................................................................................[1] (iv) State which of U1, U2, and U3 has the highest concentration of glucose. ...................[1] If the sample with the highest concentration of glucose is more than 0.5%, then this may mean that a kidney is not working. You are required to estimate the concentration of glucose in the sample stated in (a)(iv) by: • preparing 10 cm3 of a 0.5% glucose solution • carrying out a Benedict’s test on the 0.5% glucose solution • using your results to estimate the concentration of glucose in the sample stated in (a)(iv). (v) You are provided with a 2% glucose solution, G. Complete Table 1.1 to describe how G could be diluted to produce 10 cm3 of a 0.5% glucose solution. Table 1.1 final percentage volume of 2% glucose solution / cm3 volume of distilled concentration of glucose water, W / cm3 0.5 [2] (vi) State one variable that must be standardised when carrying out the Benedict’s test, to allow you to make a valid comparison between the results collected in (a)(i) and the result you will collect for the 0.5% glucose solution you have prepared. ........................................................................................................................................... ........................................................................................................................................... .......................................................................................................................................[1] 8. Prepare the 0.5% glucose solution as shown in Table 1.1 in the beaker provided. 9. Repeat the Benedict’s test with the 0.5% glucose solution and the sample stated in (a)(iv). 10. Record in (a)(vii) the time taken to the first colour change. After 90 s, remove the test-tubes from the water-bath. If there has been no colour change during the 90 s record the time to the first colour change as ‘more than 90’. (vii) Record your results in an appropriate table. [2] (viii) Use your results from (a)(vii) to complete Table 1.2 by using one tick (✓) to show your estimate of the concentration of glucose in the sample stated in (a)(iv). Table 1.2 percentage concentration of glucose estimate tick (✓) in mock urine sample below 0.5 0.5 above 0.5 [1] (ix) This procedure enabled you to estimate the concentration of glucose in the mock urine sample. Suggest how you would improve this procedure to find a more accurate estimate of this concentration. ........................................................................................................................................... ........................................................................................................................................... ........................................................................................................................................... ........................................................................................................................................... ........................................................................................................................................... .......................................................................................................................................[3] Question 1 continues on page 6 (b) Fig. 1.1 is a photomicrograph of a stained transverse section through an animal organ. This organ is used to transport urine from the kidney to the bladder. You are not expected to be familiar with this specimen. Fig. 1.1 Use a sharp pencil for drawing. Draw a large plan diagram of half of the organ in Fig. 1.1, shown by the shaded area in Fig. 1.2. draw this half Fig. 1.2 You are expected to draw the correct shape and proportions of the different tissues. [4] [Total: 20]
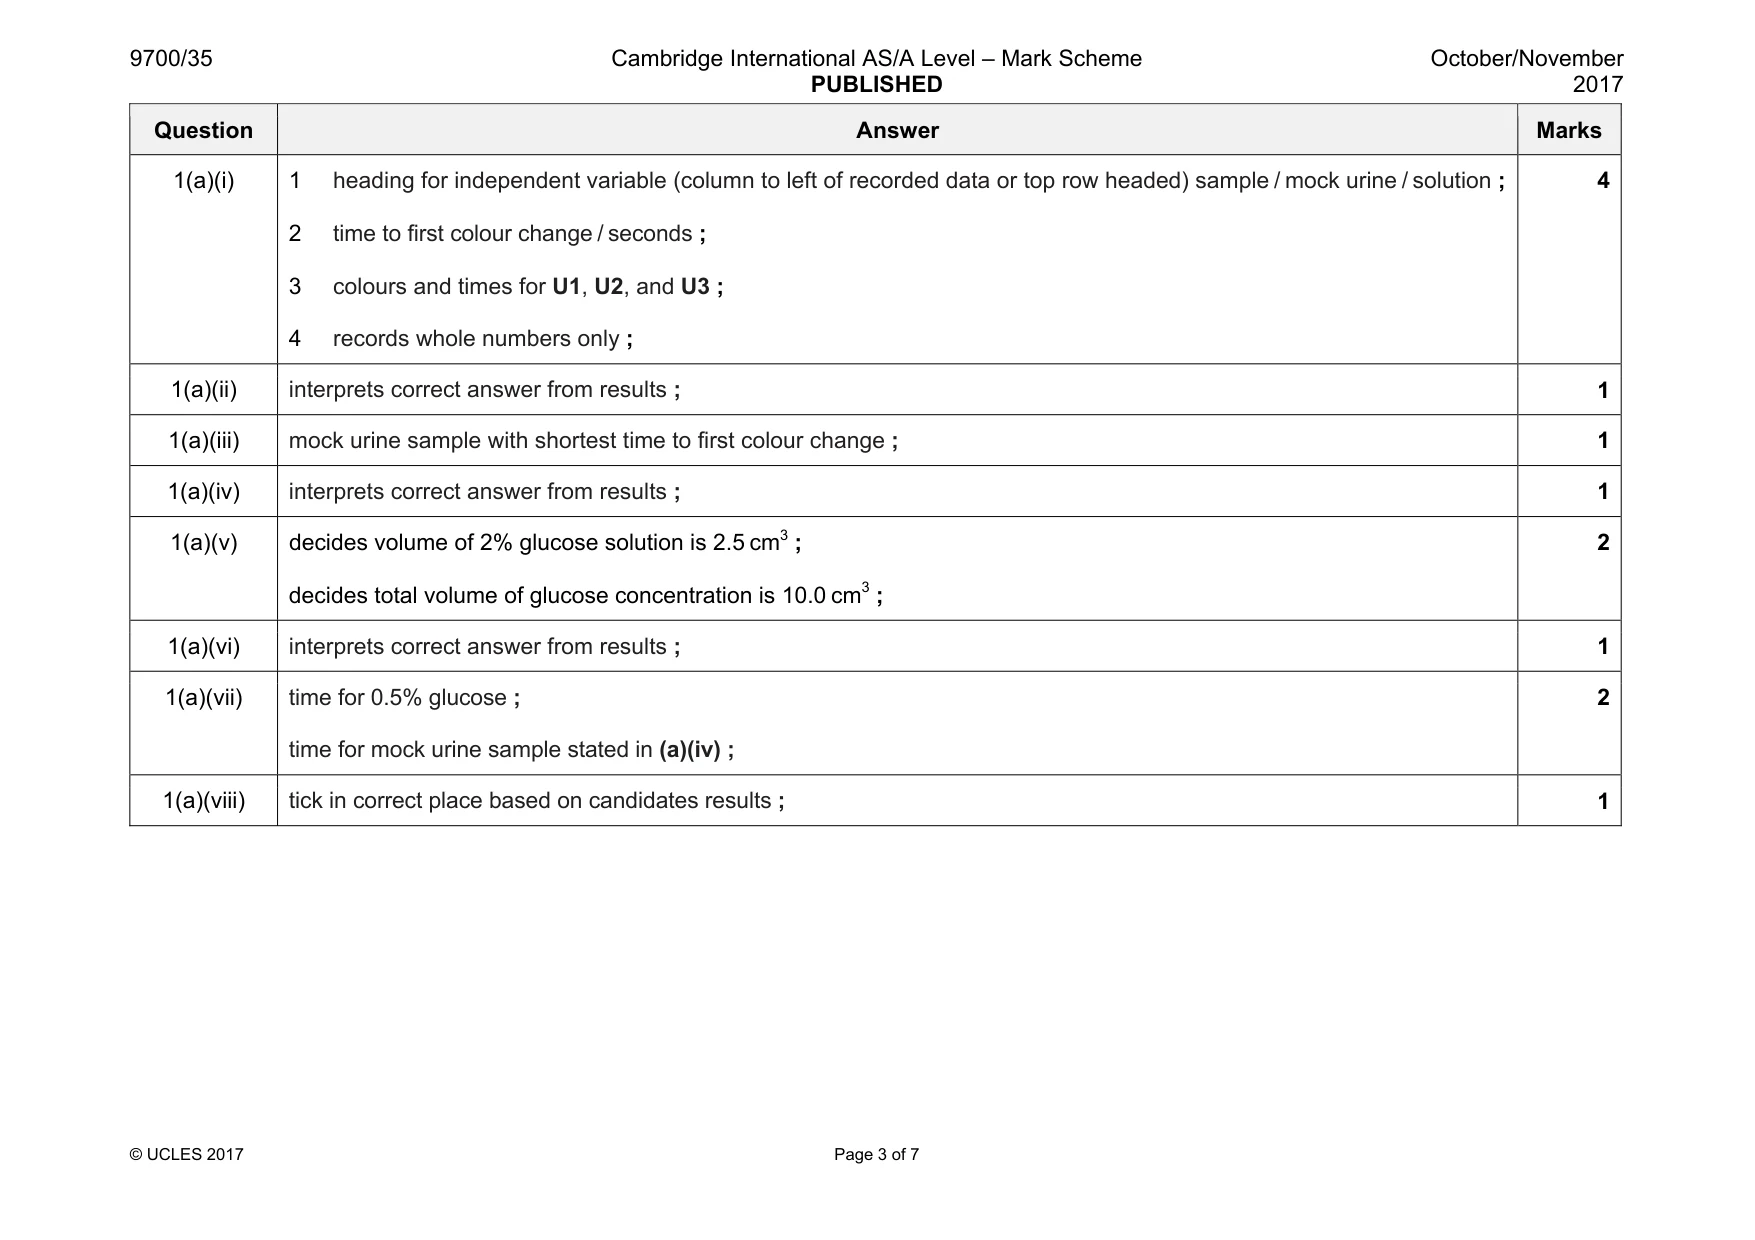
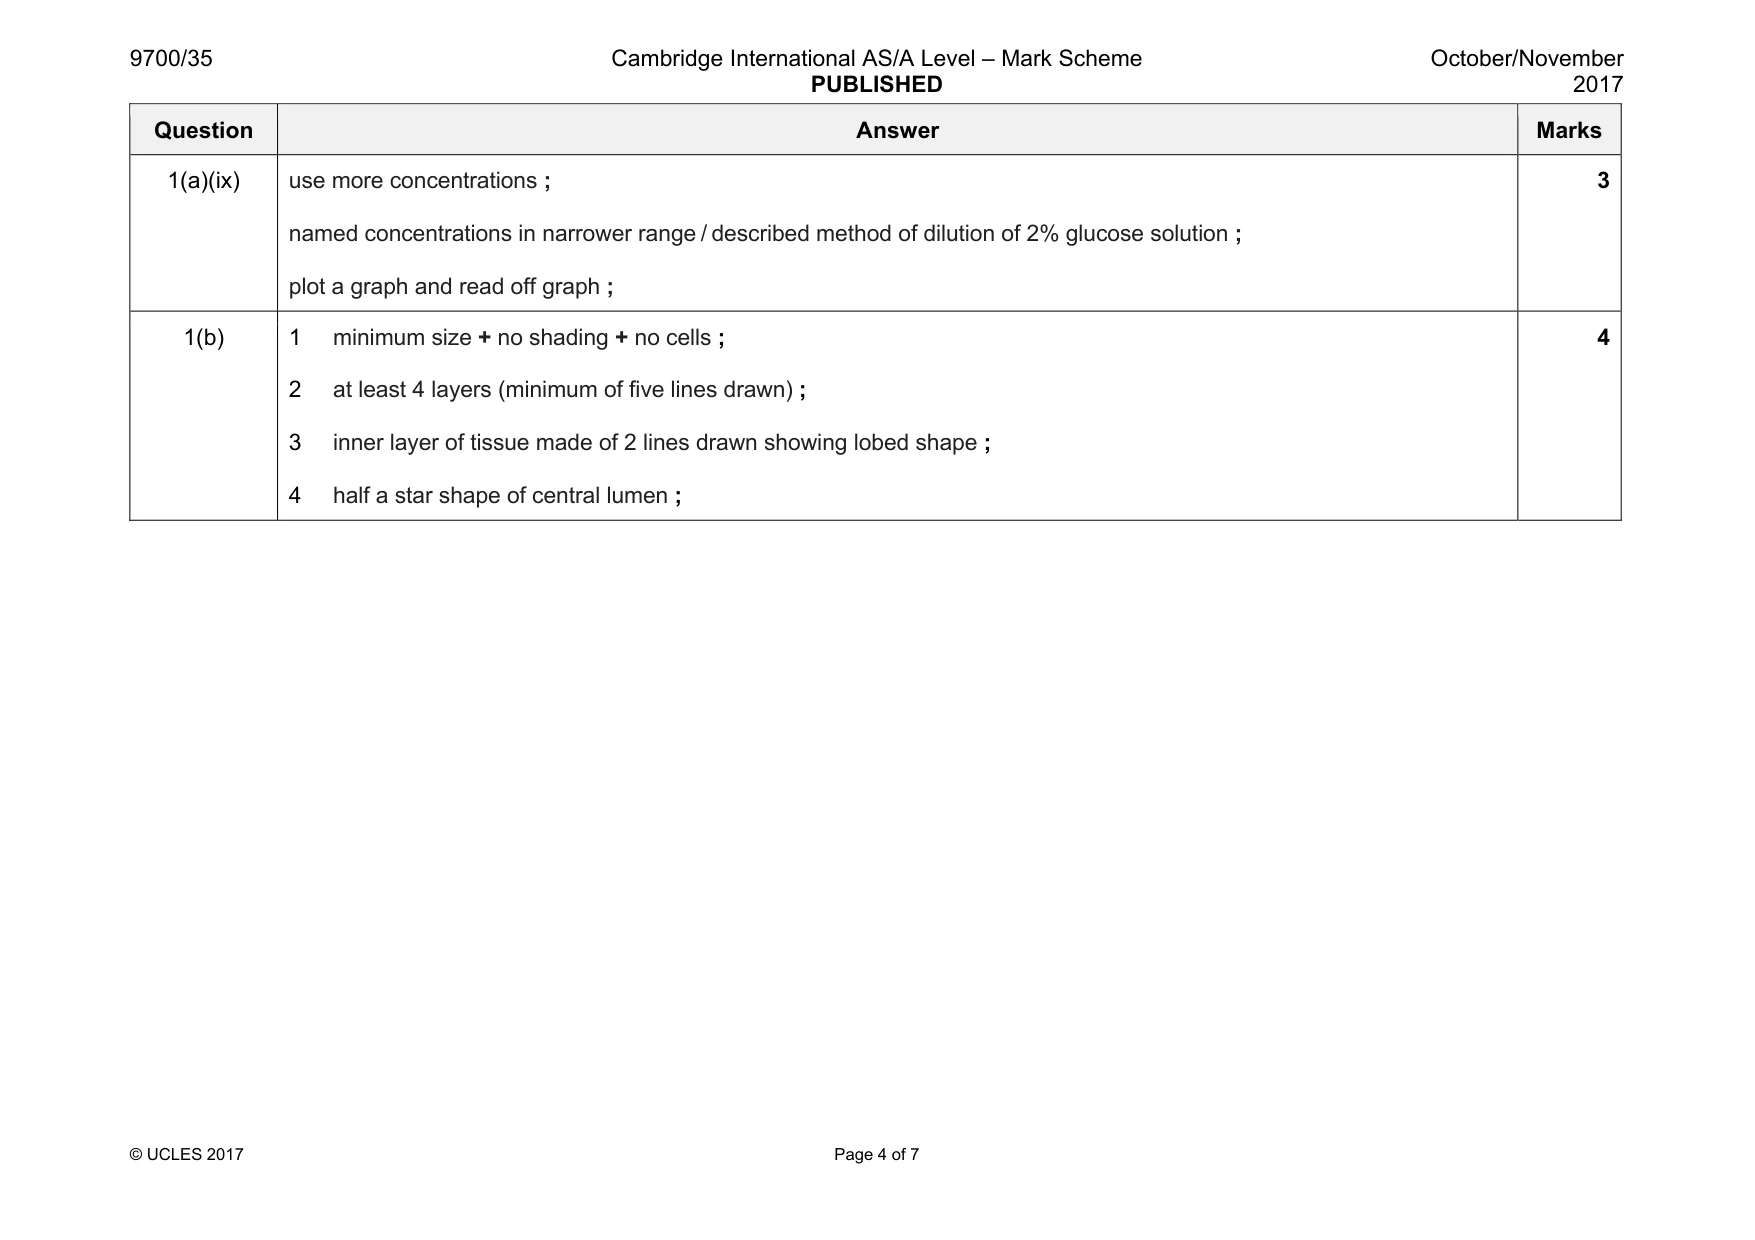
Mark scheme: 1(a)(i) 1 heading for independent variable (column to left of recorded data or top row headed) sample / mock urine / solution ; 2 time to first colour change / seconds ; 3 colours and times for U1, U2, and U3 ; 4 records whole numbers only ; 4 1(a)(ii) interprets correct answer from results ; 1 1(a)(iii) mock urine sample with shortest time to first colour change ; 1 1(a)(iv) interprets correct answer from results ; 1 1(a)(v) decides volume of 2% glucose solution is 2.5 cm3 ; decides total volume of glucose concentration is 10.0 cm3 ; 2 1(a)(vi) interprets correct answer from results ; 1 1(a)(vii) time for 0.5% glucose ; time for mock urine sample stated in (a)(iv) ; 2 1(a)(viii) tick in correct place based on candidates results ; 1 Question Answer Marks 1(a)(ix) use more concentrations ; named concentrations in narrower range / described method of dilution of 2% glucose solution ; plot a graph and read off graph ; 3 1(b) 1 minimum size + no shading + no cells ; 2 at least 4 layers (minimum of five lines drawn) ; 3 inner layer of tissue made of 2 lines drawn showing lobed shape ; 4 half a star shape of central lumen ; 4
Q2 · K1 is a slide of a stained transverse section through a plant leaf
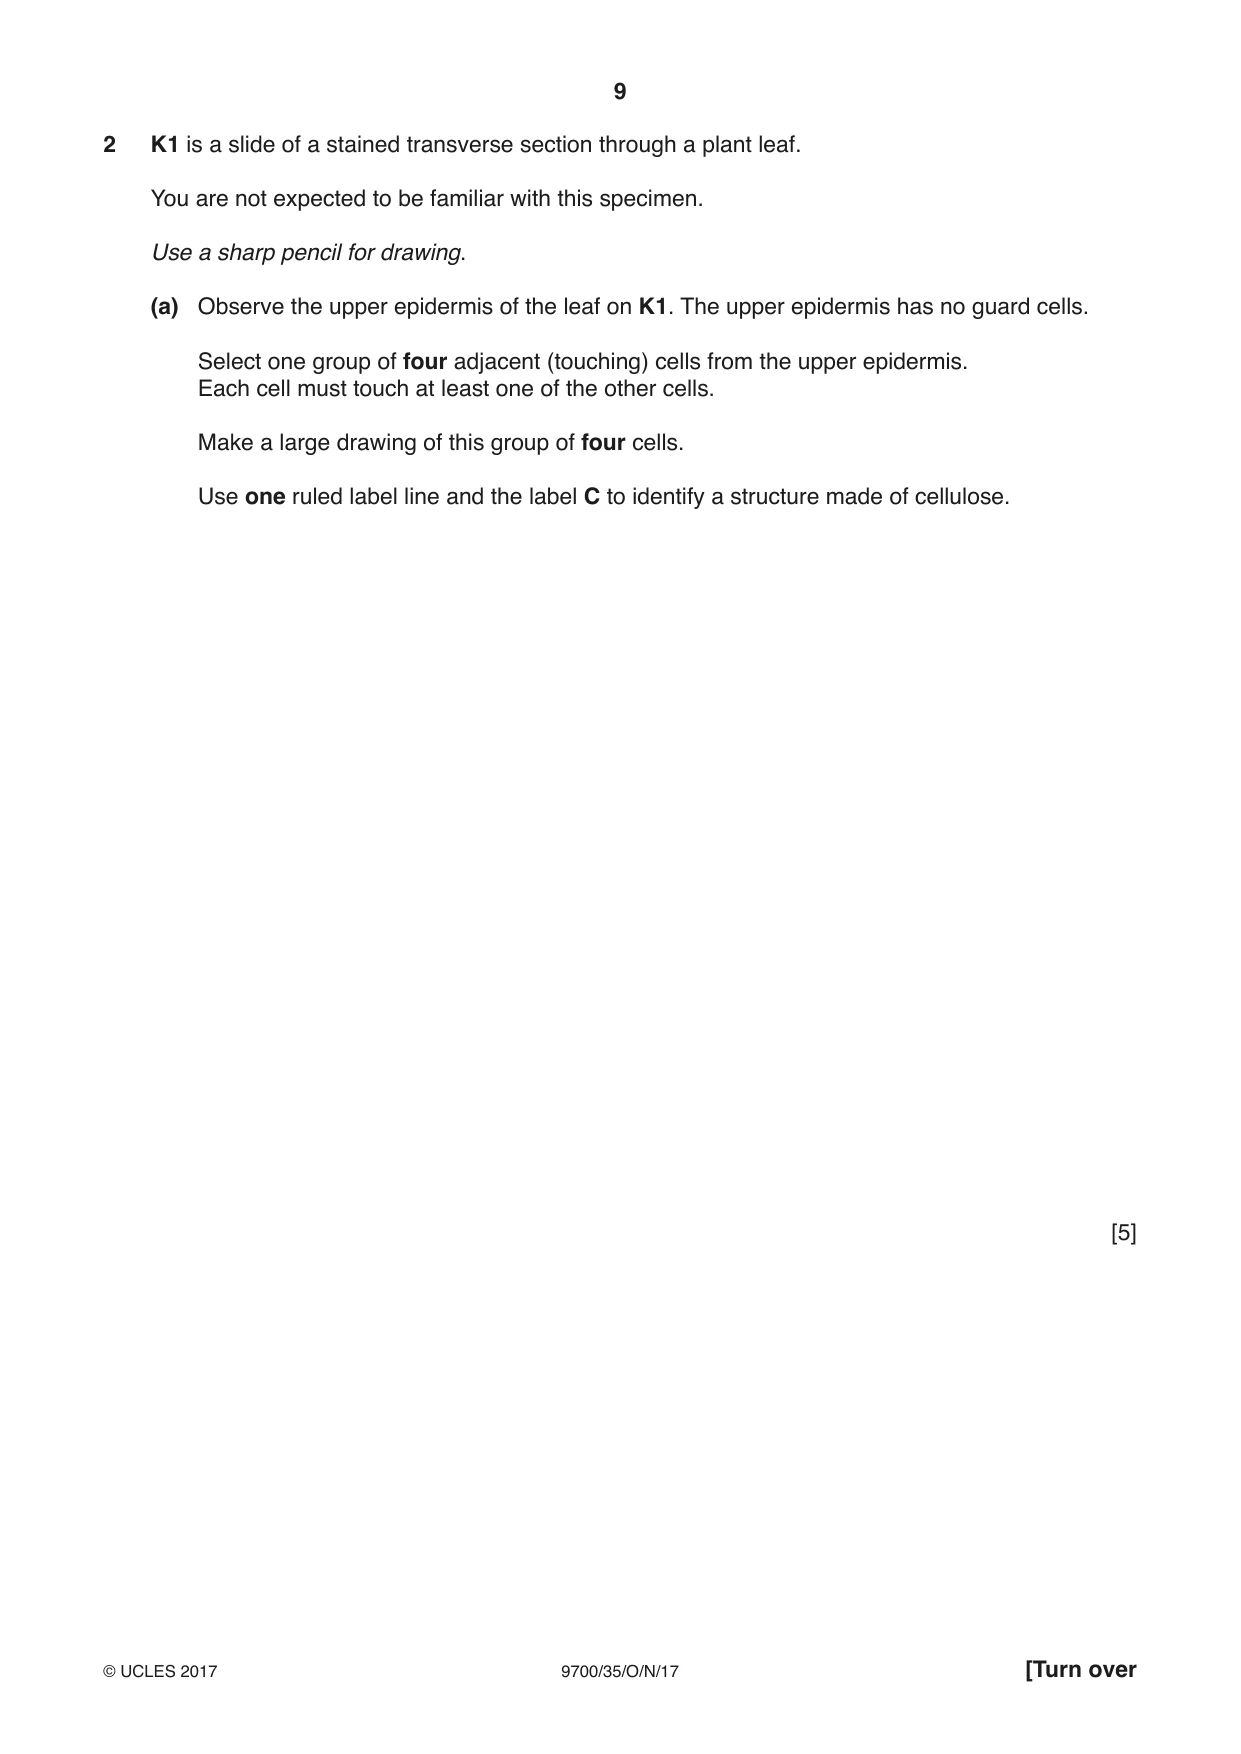
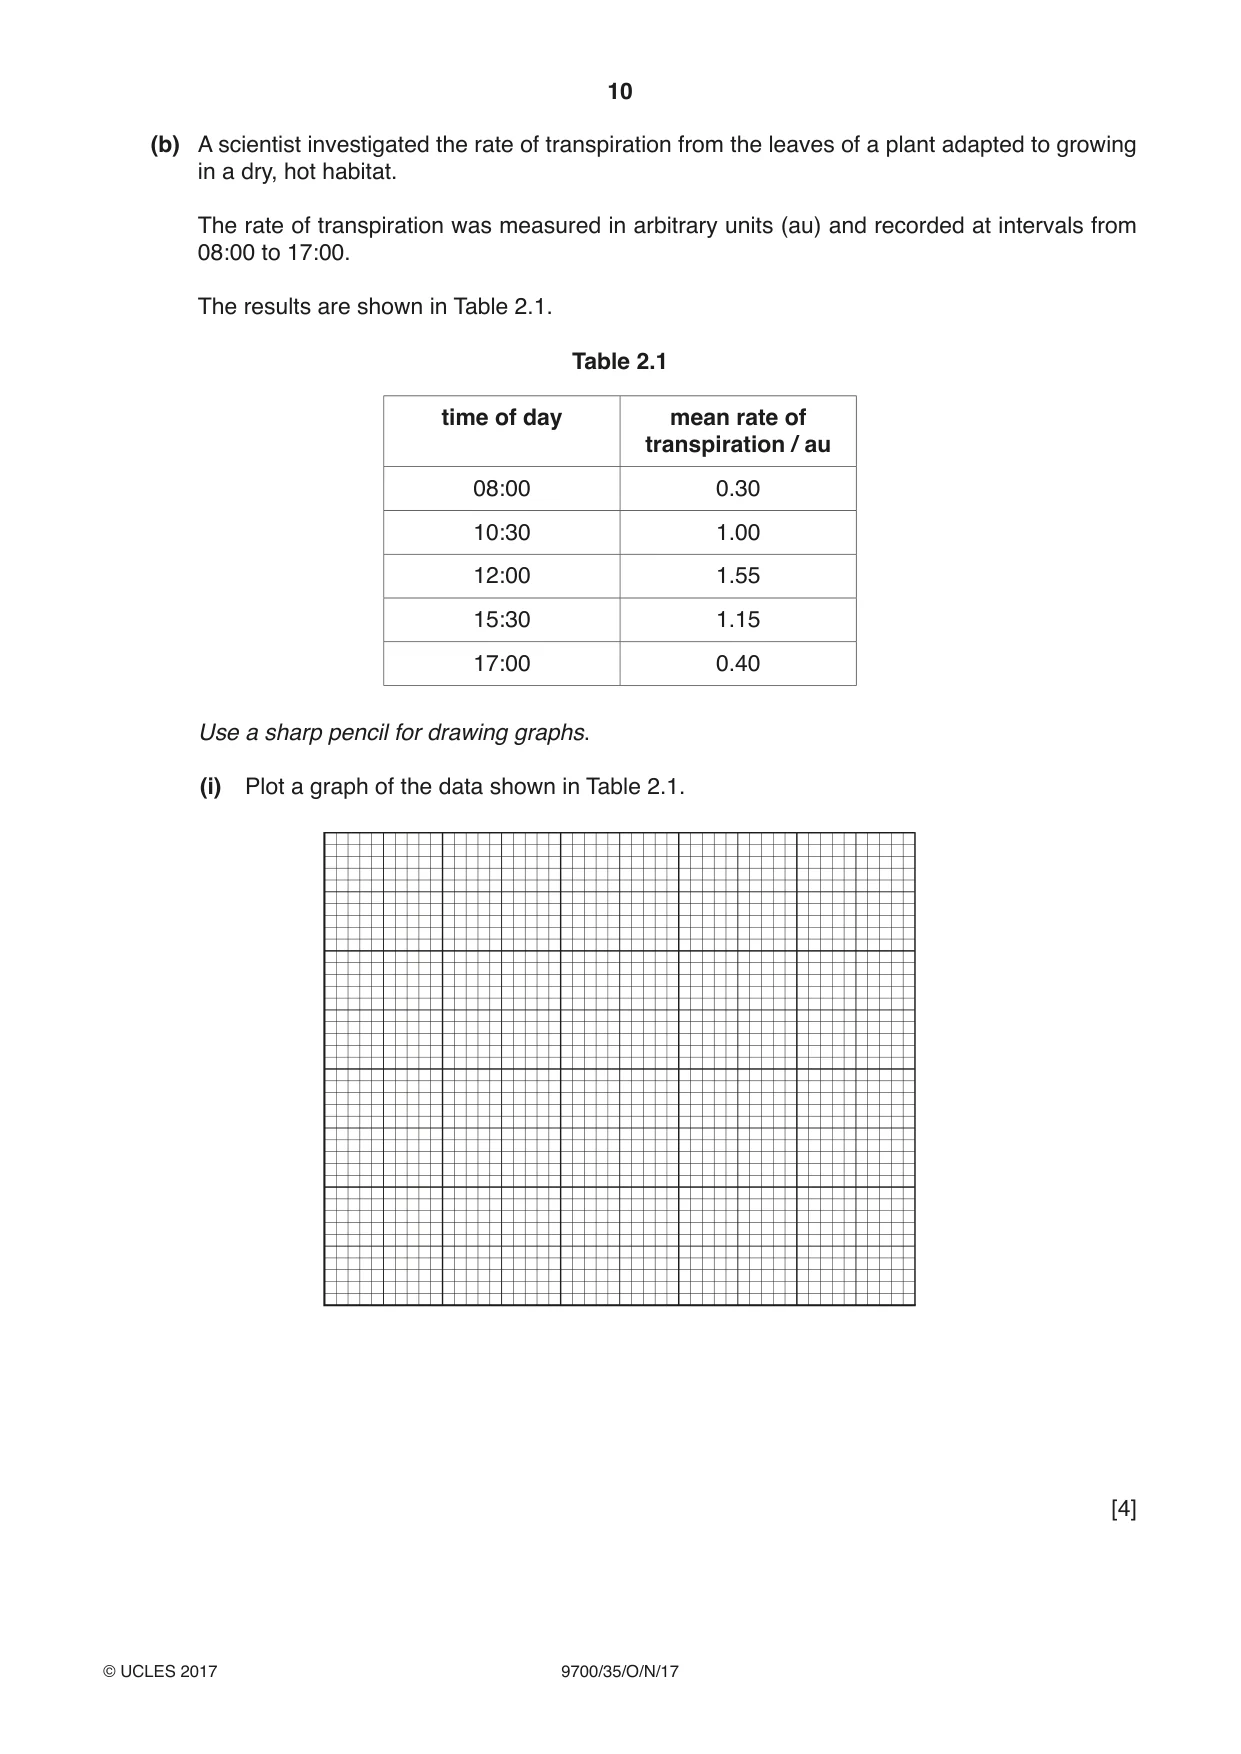
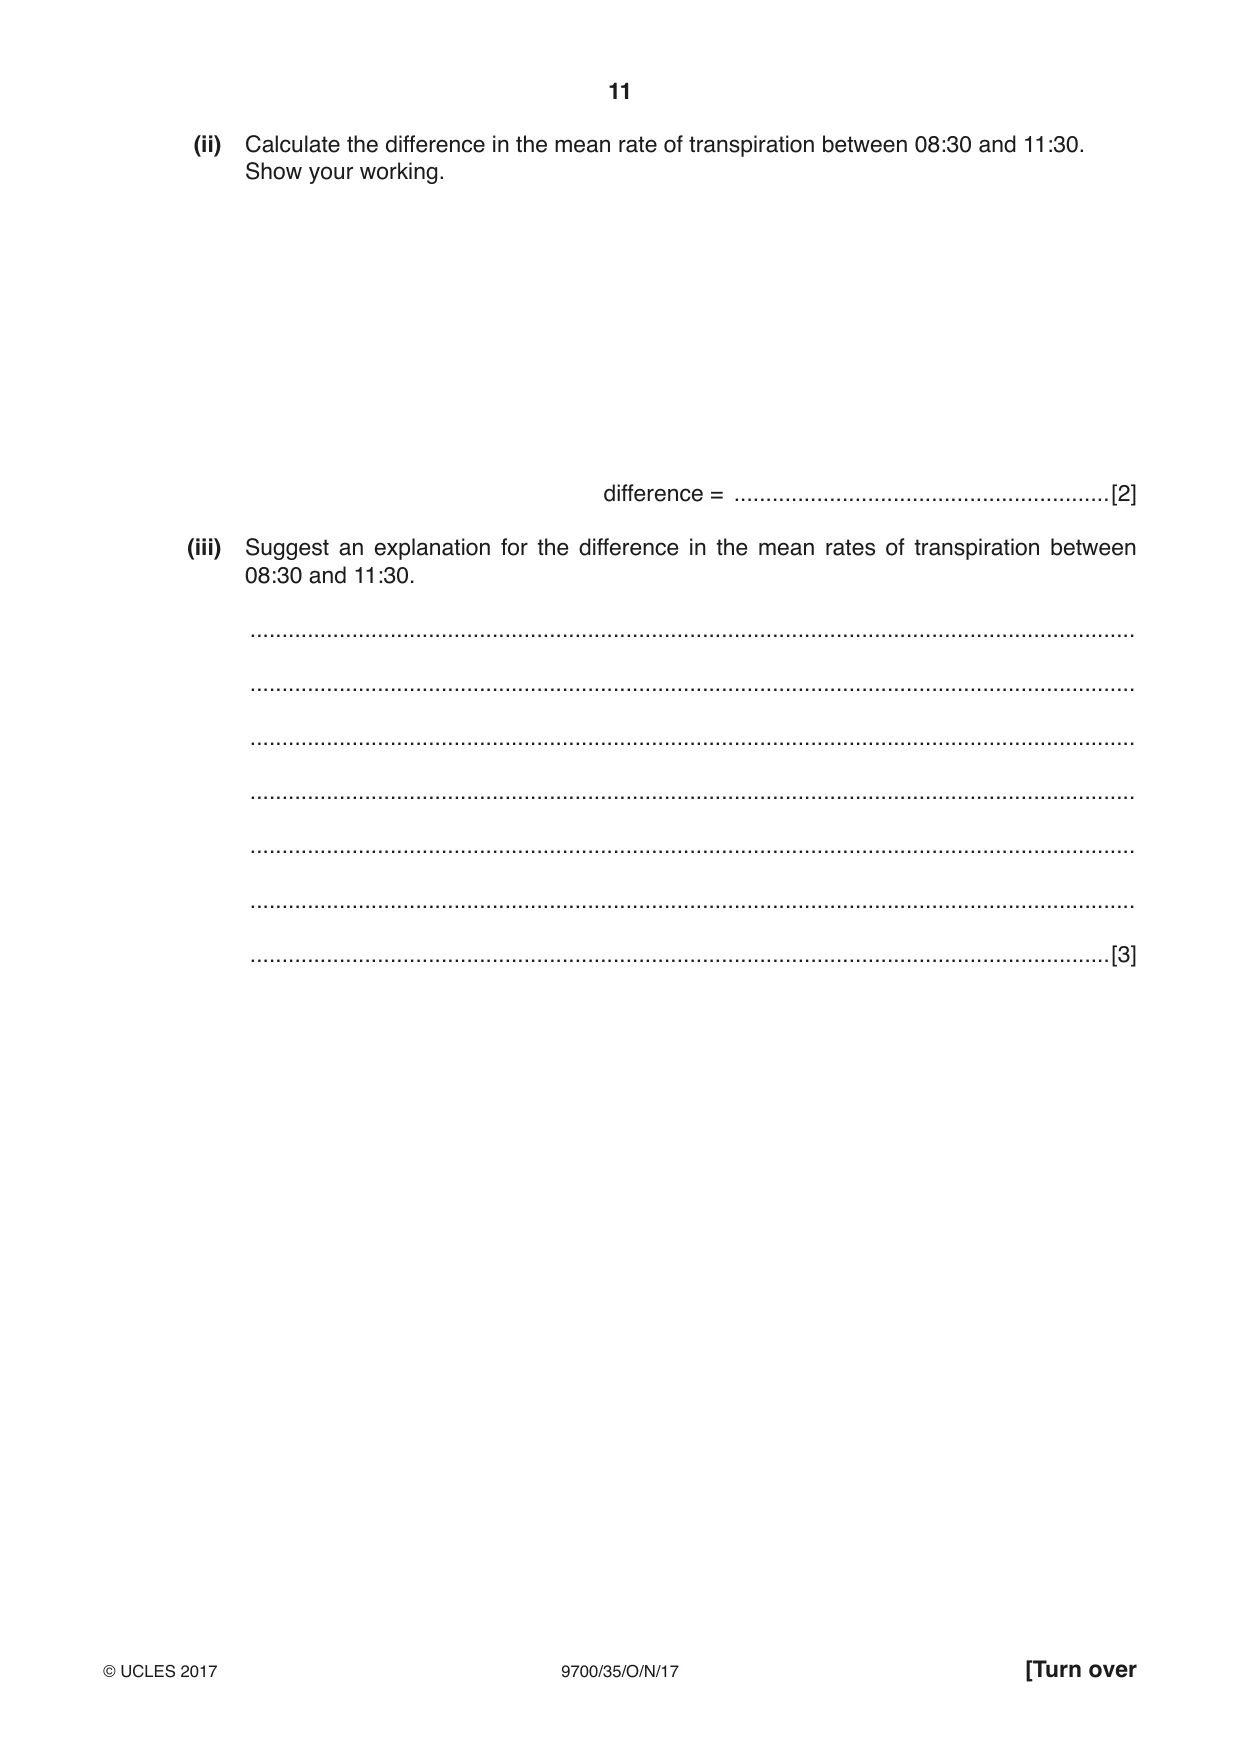
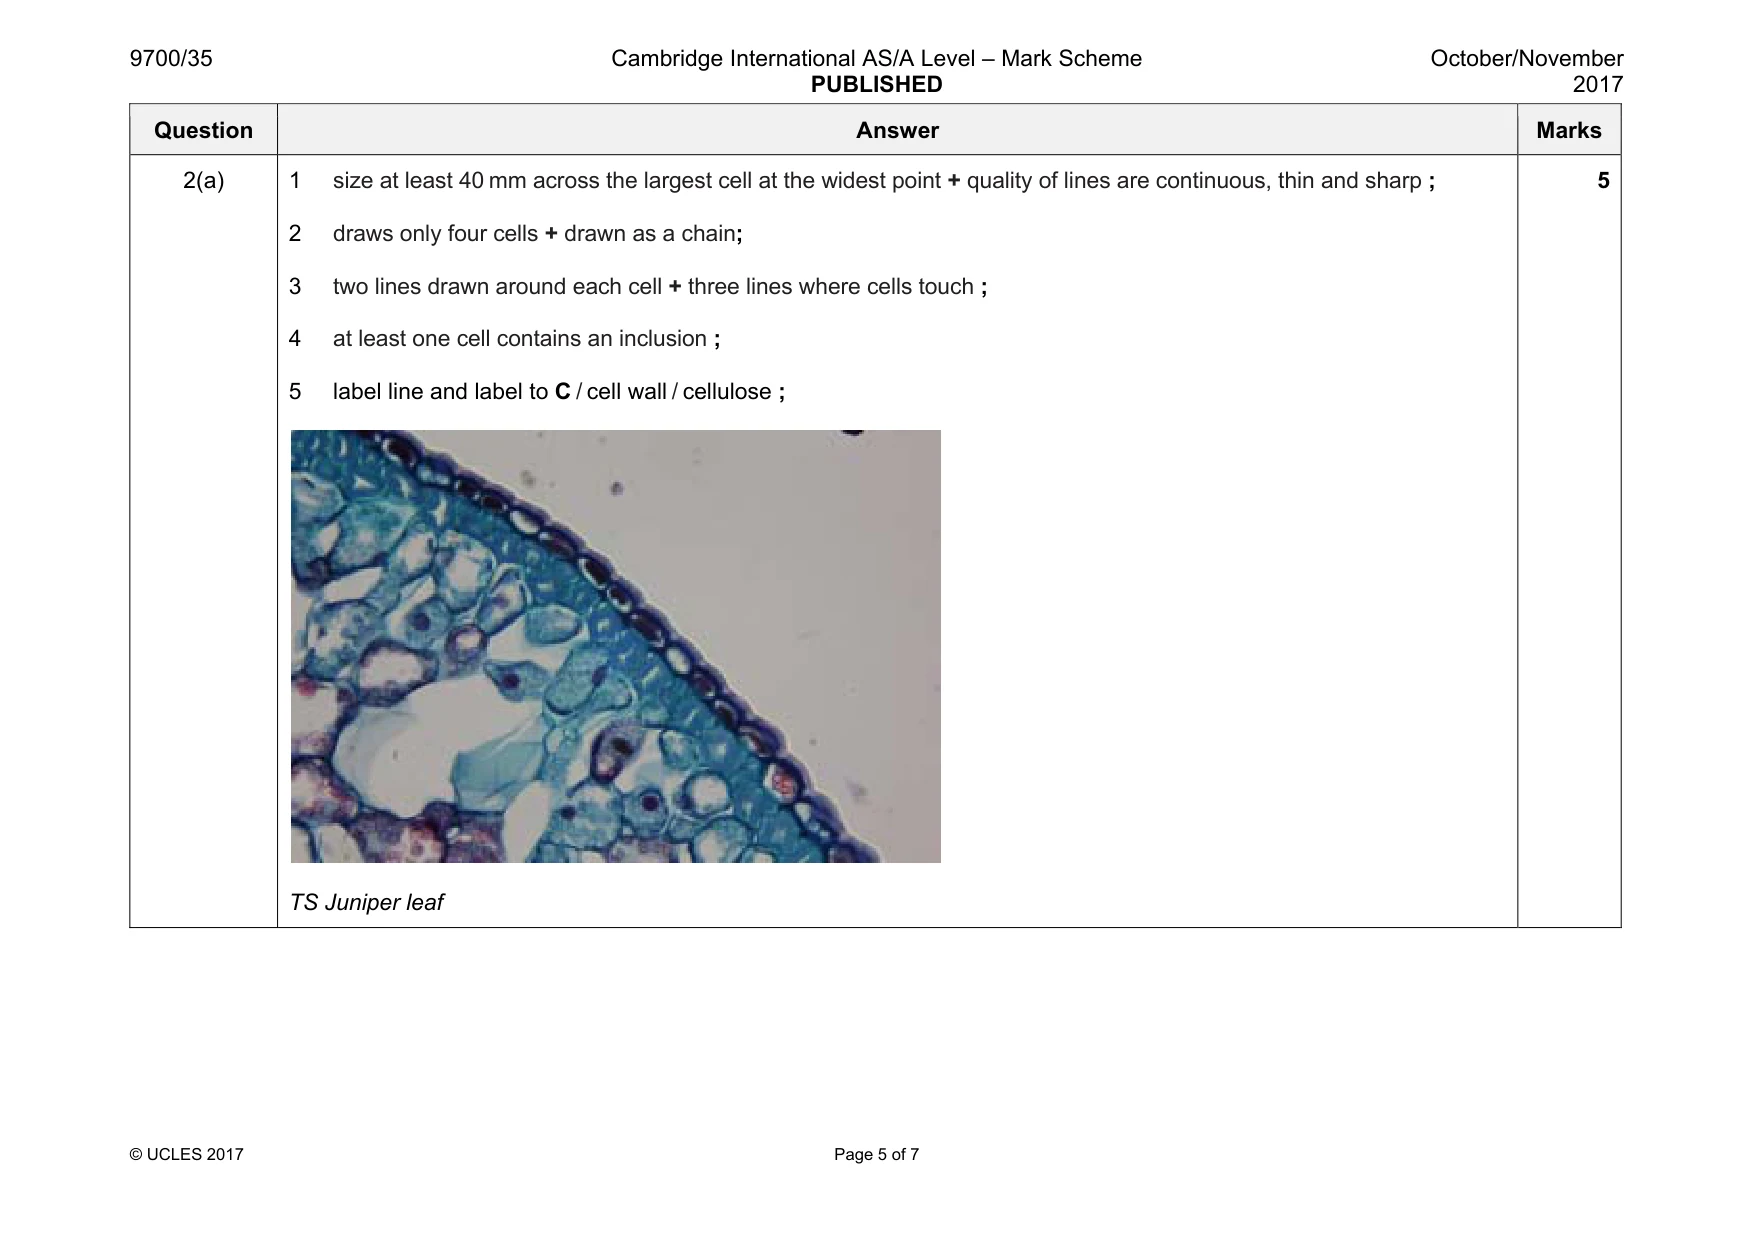
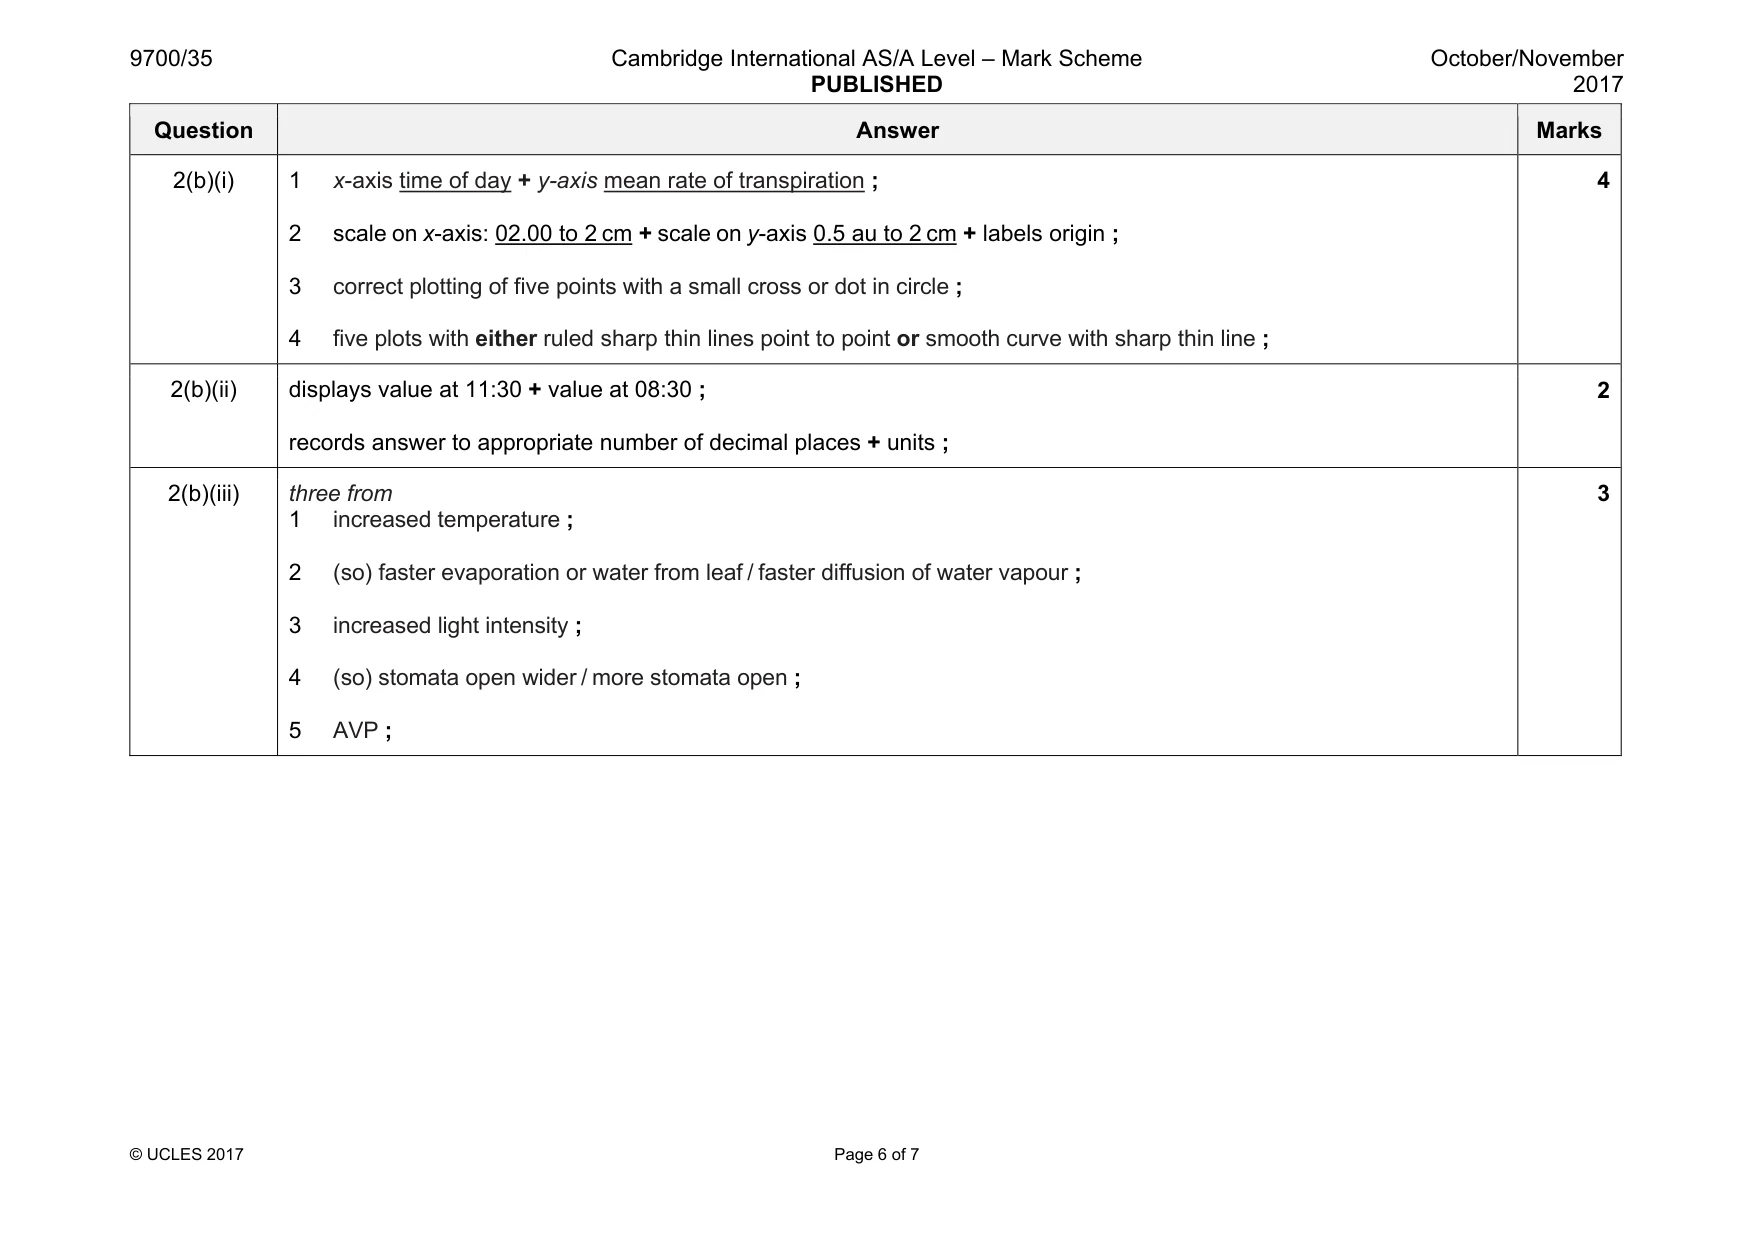
2 K1 is a slide of a stained transverse section through a plant leaf. You are not expected to be familiar with this specimen. Use a sharp pencil for drawing. (a) Observe the upper epidermis of the leaf on K1. The upper epidermis has no guard cells. Select one group of four adjacent (touching) cells from the upper epidermis. Each cell must touch at least one of the other cells. Make a large drawing of this group of four cells. Use one ruled label line and the label C to identify a structure made of cellulose. [5] (b) A scientist investigated the rate of transpiration from the leaves of a plant adapted to growing in a dry, hot habitat. The rate of transpiration was measured in arbitrary units (au) and recorded at intervals from 08:00 to 17:00. The results are shown in Table 2.1. Table 2.1 time of day mean rate of transpiration / au 08:00 0.30 10:30 1.00 12:00 1.55 15:30 1.15 17:00 0.40 Use a sharp pencil for drawing graphs. (i) Plot a graph of the data shown in Table 2.1. [4] (ii) Calculate the difference in the mean rate of transpiration between 08:30 and 11:30. Show your working. difference = ...........................................................[2] (iii) Suggest an explanation for the difference in the mean rates of transpiration between 08:30 and 11:30. ........................................................................................................................................... ........................................................................................................................................... ........................................................................................................................................... ........................................................................................................................................... ........................................................................................................................................... ........................................................................................................................................... .......................................................................................................................................[3]
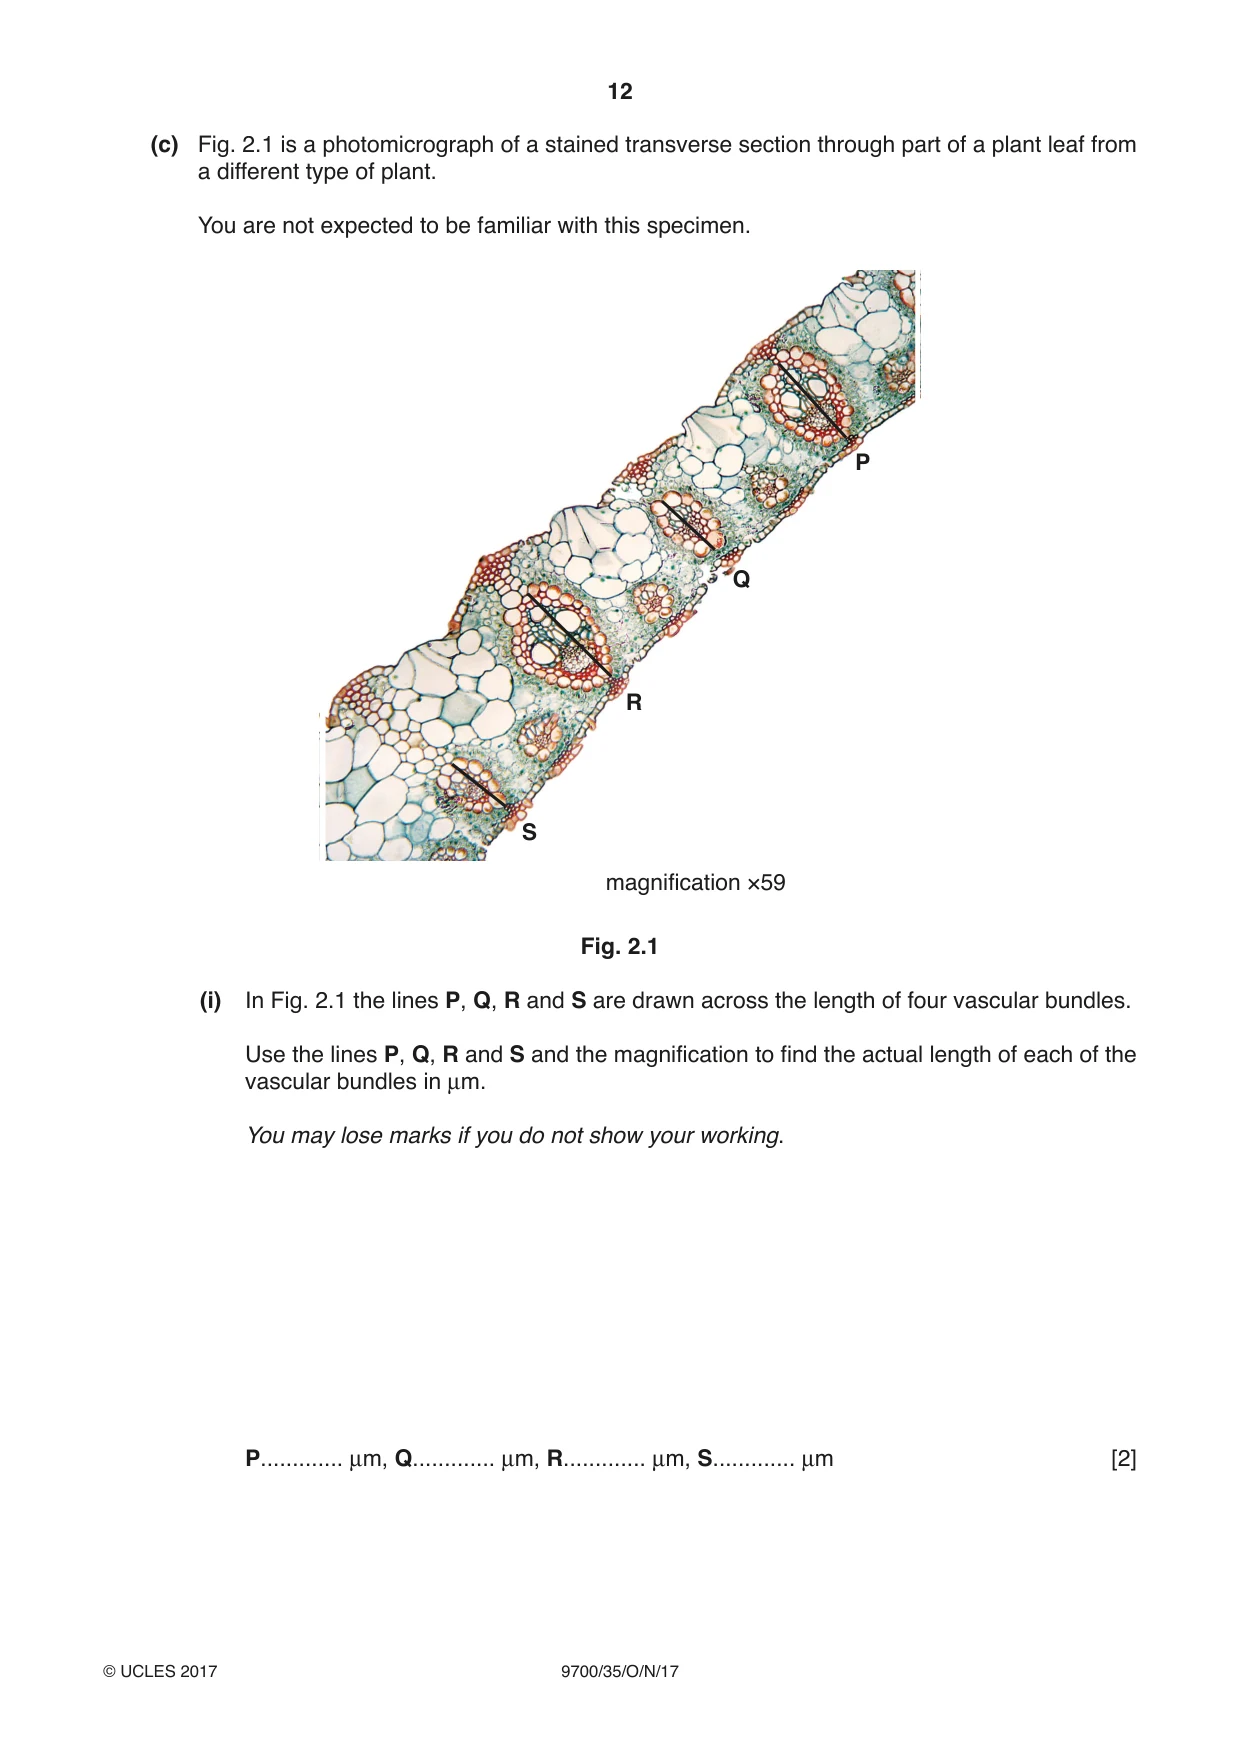
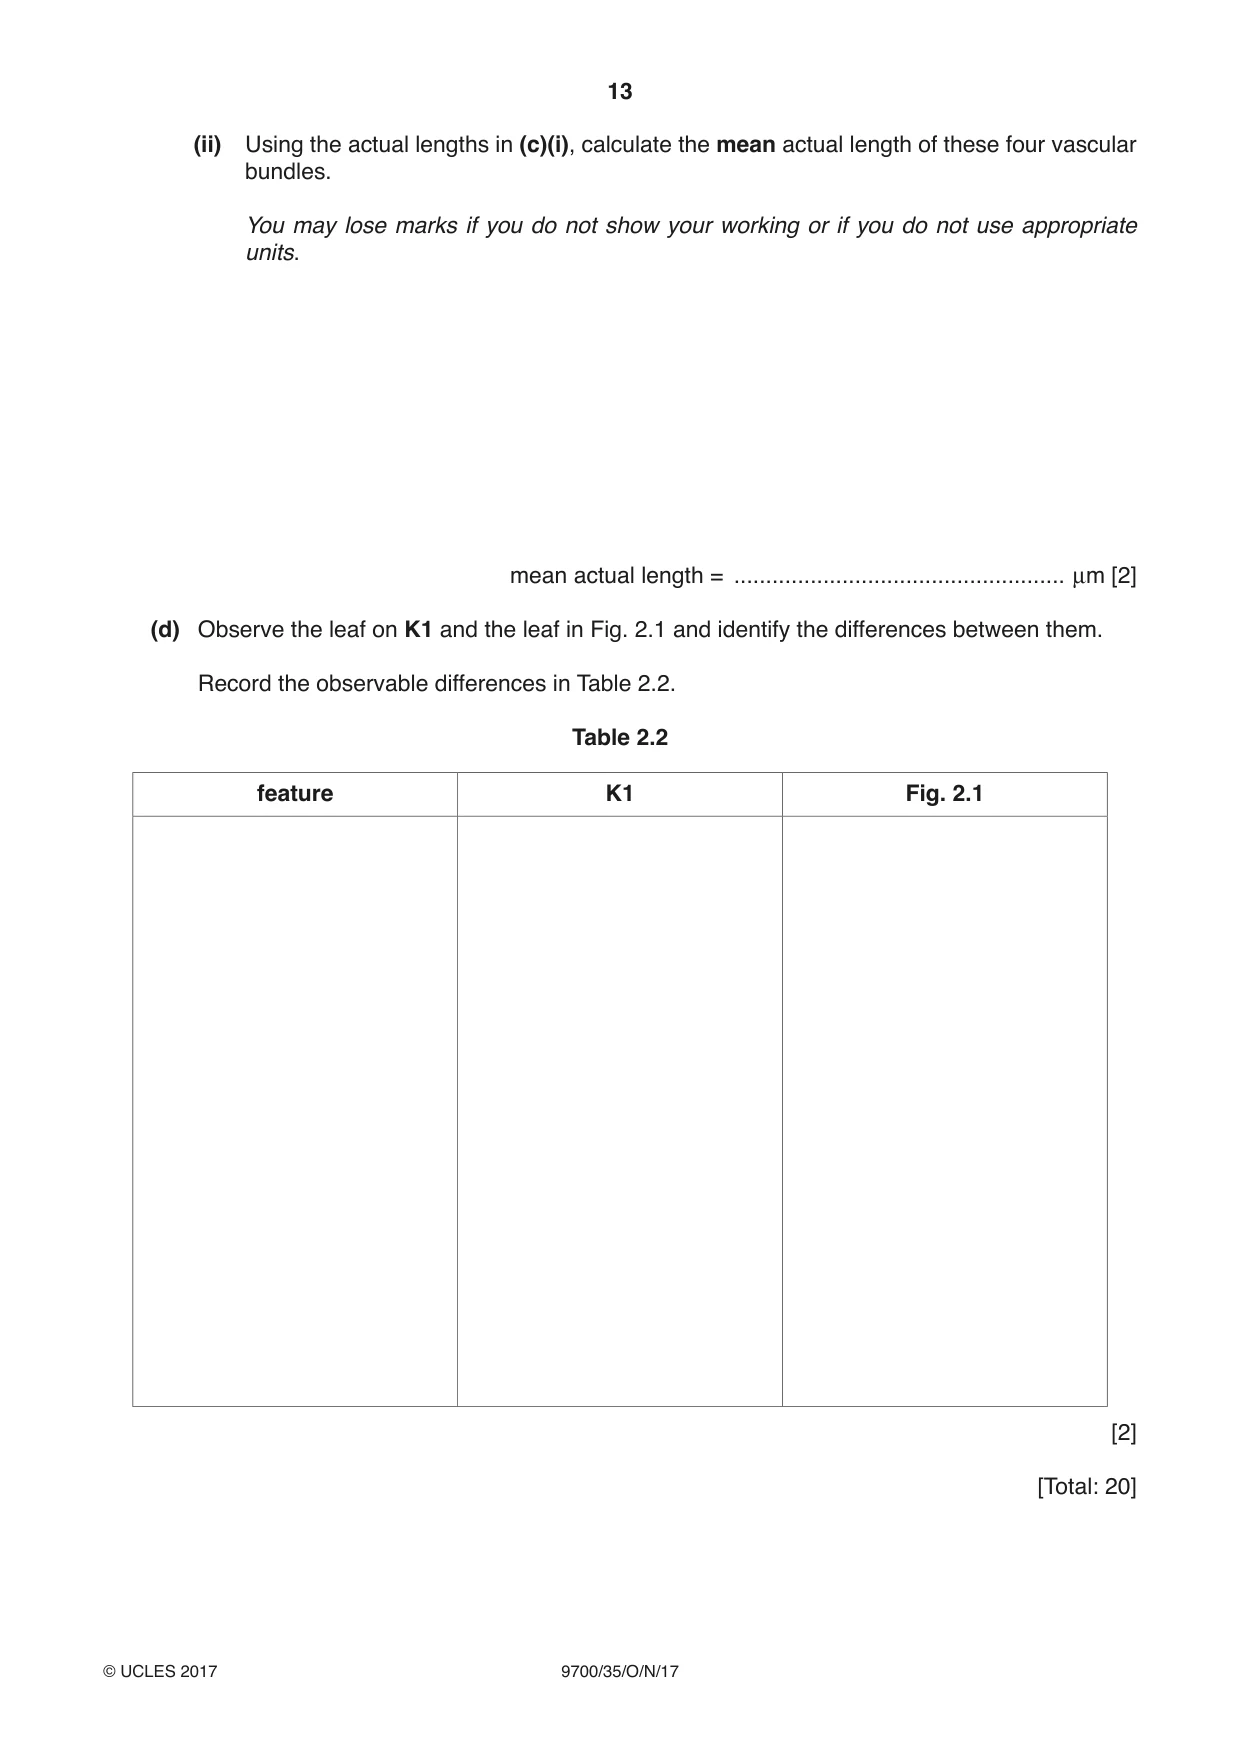
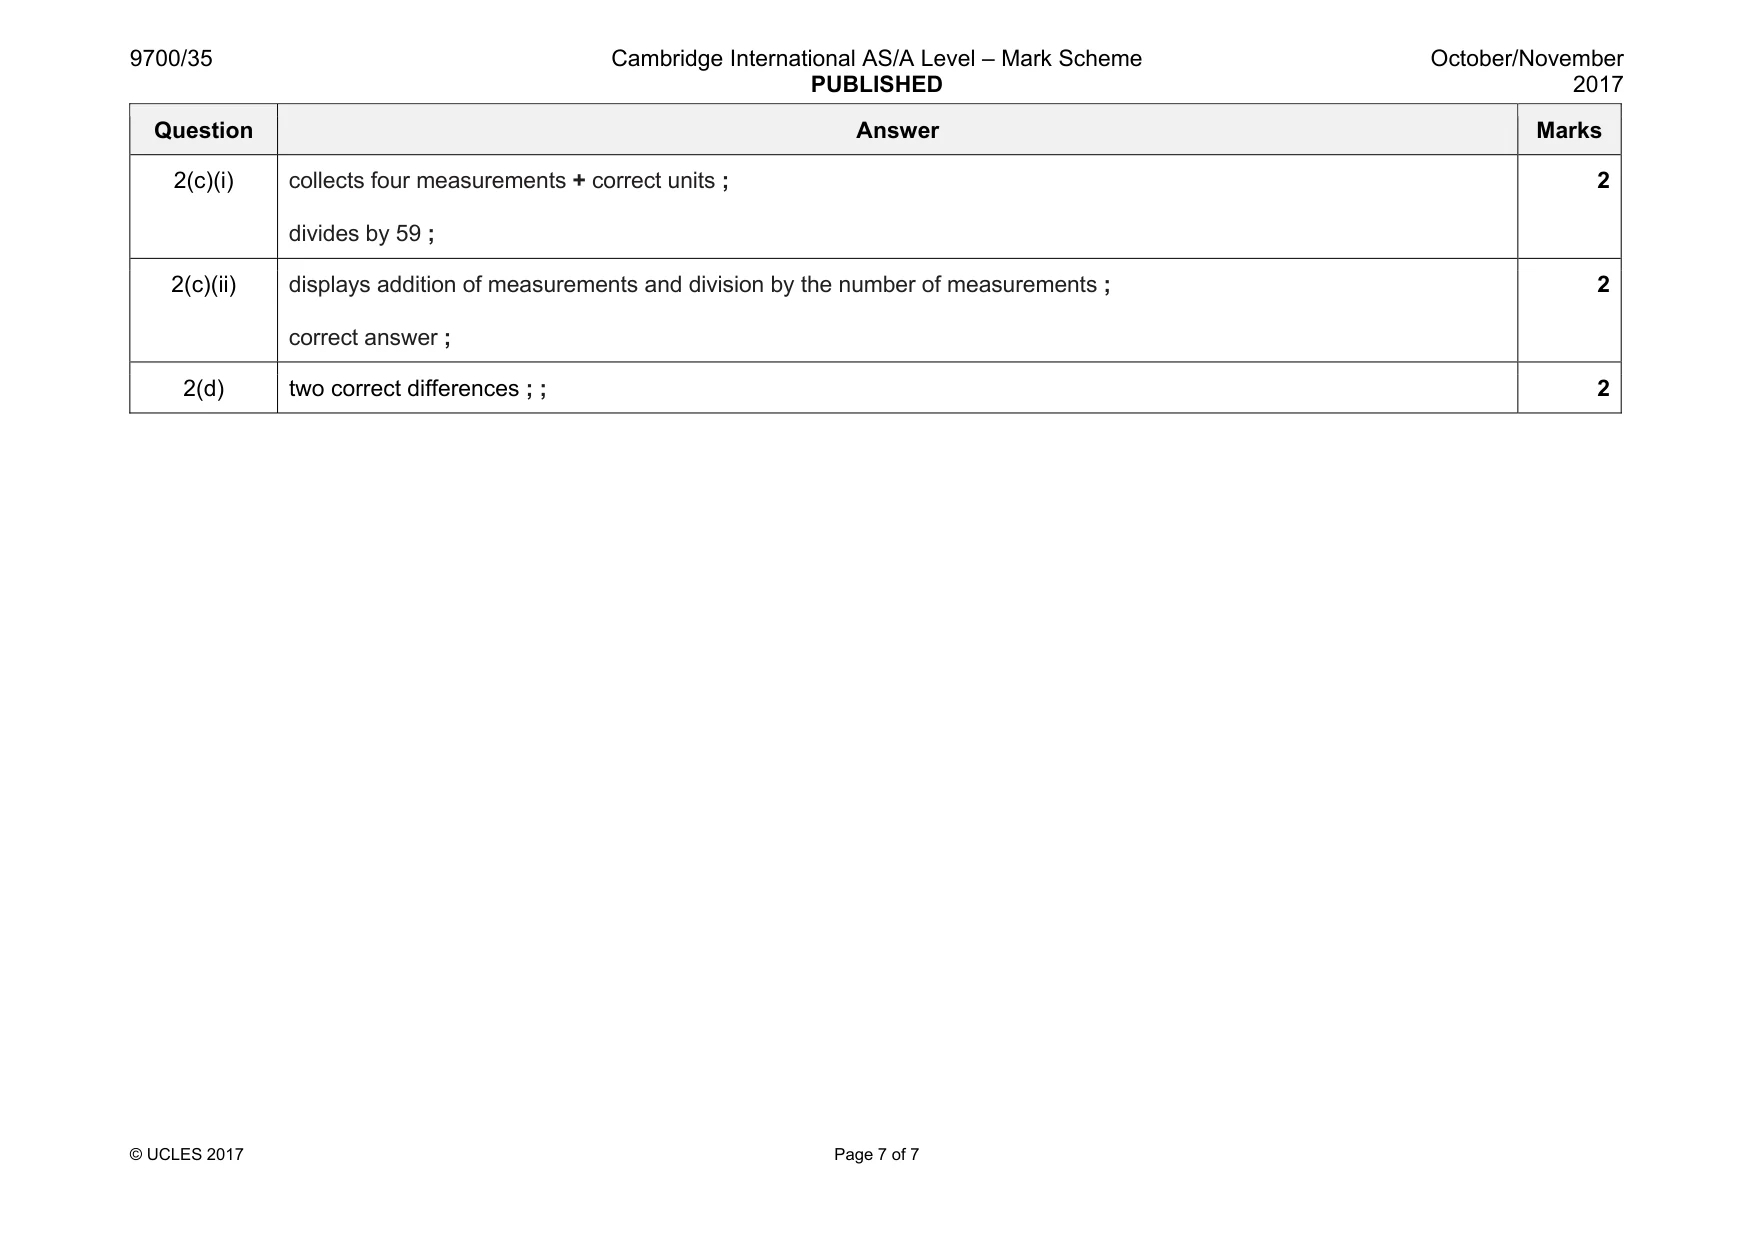
Mark scheme: 2(a) 1 size at least 40 mm across the largest cell at the widest point + quality of lines are continuous, thin and sharp ; 2 draws only four cells + drawn as a chain; 3 two lines drawn around each cell + three lines where cells touch ; 4 at least one cell contains an inclusion ; 5 label line and label to C / cell wall / cellulose ; TS Juniper leaf 5 Question Answer Marks 2(b)(i) 1 x-axis time of day + y-axis mean rate of transpiration ; 2 scale on x-axis: 02.00 to 2 cm + scale on y-axis 0.5 au to 2 cm + labels origin ; 3 correct plotting of five points with a small cross or dot in circle ; 4 five plots with either ruled sharp thin lines point to point or smooth curve with sharp thin line ; 4 2(b)(ii) displays value at 11:30 + value at 08:30 ; records answer to appropriate number of decimal places + units ; 2 2(b)(iii) three from 1 increased temperature ; 2 (so) faster evaporation or water from leaf / faster diffusion of water vapour ; 3 increased light intensity ; 4 (so) stomata open wider / more stomata open ; 5 AVP ; 3 Question Answer Marks 2(c)(i) collects four measurements + correct units ; divides by 59 ; 2 2(c)(ii) displays addition of measurements and division by the number of measurements ; correct answer ; 2 2(d) two correct differences ; ; 2
What was in this paper
The subtopics covered by these 2 questions, and how many questions each got. Open one in a new tab to see every Cambridge question on it.
What you needed in this session
Cambridge’s own grade thresholds for 2017 Oct/Nov, Paper 3 · Variant 5. A higher threshold means an easier paper — the bar moves with how the cohort did.