Cambridge A Level Biology 9700 — 2017 Oct/Nov Paper 3 · Variant 1
9700/31/O/N/17 · 2 questions · 40 marks · ≈45 min
The question paper and its mark scheme, free to read here and free to download. This is Cambridge’s own paper, exactly as it was sat.
Question paper16 pages

Mark scheme6 pages
Answers below. Sit the paper first if you are practising.
Questions as text
Q1 · You are required to estimate the water potential of potato tissue
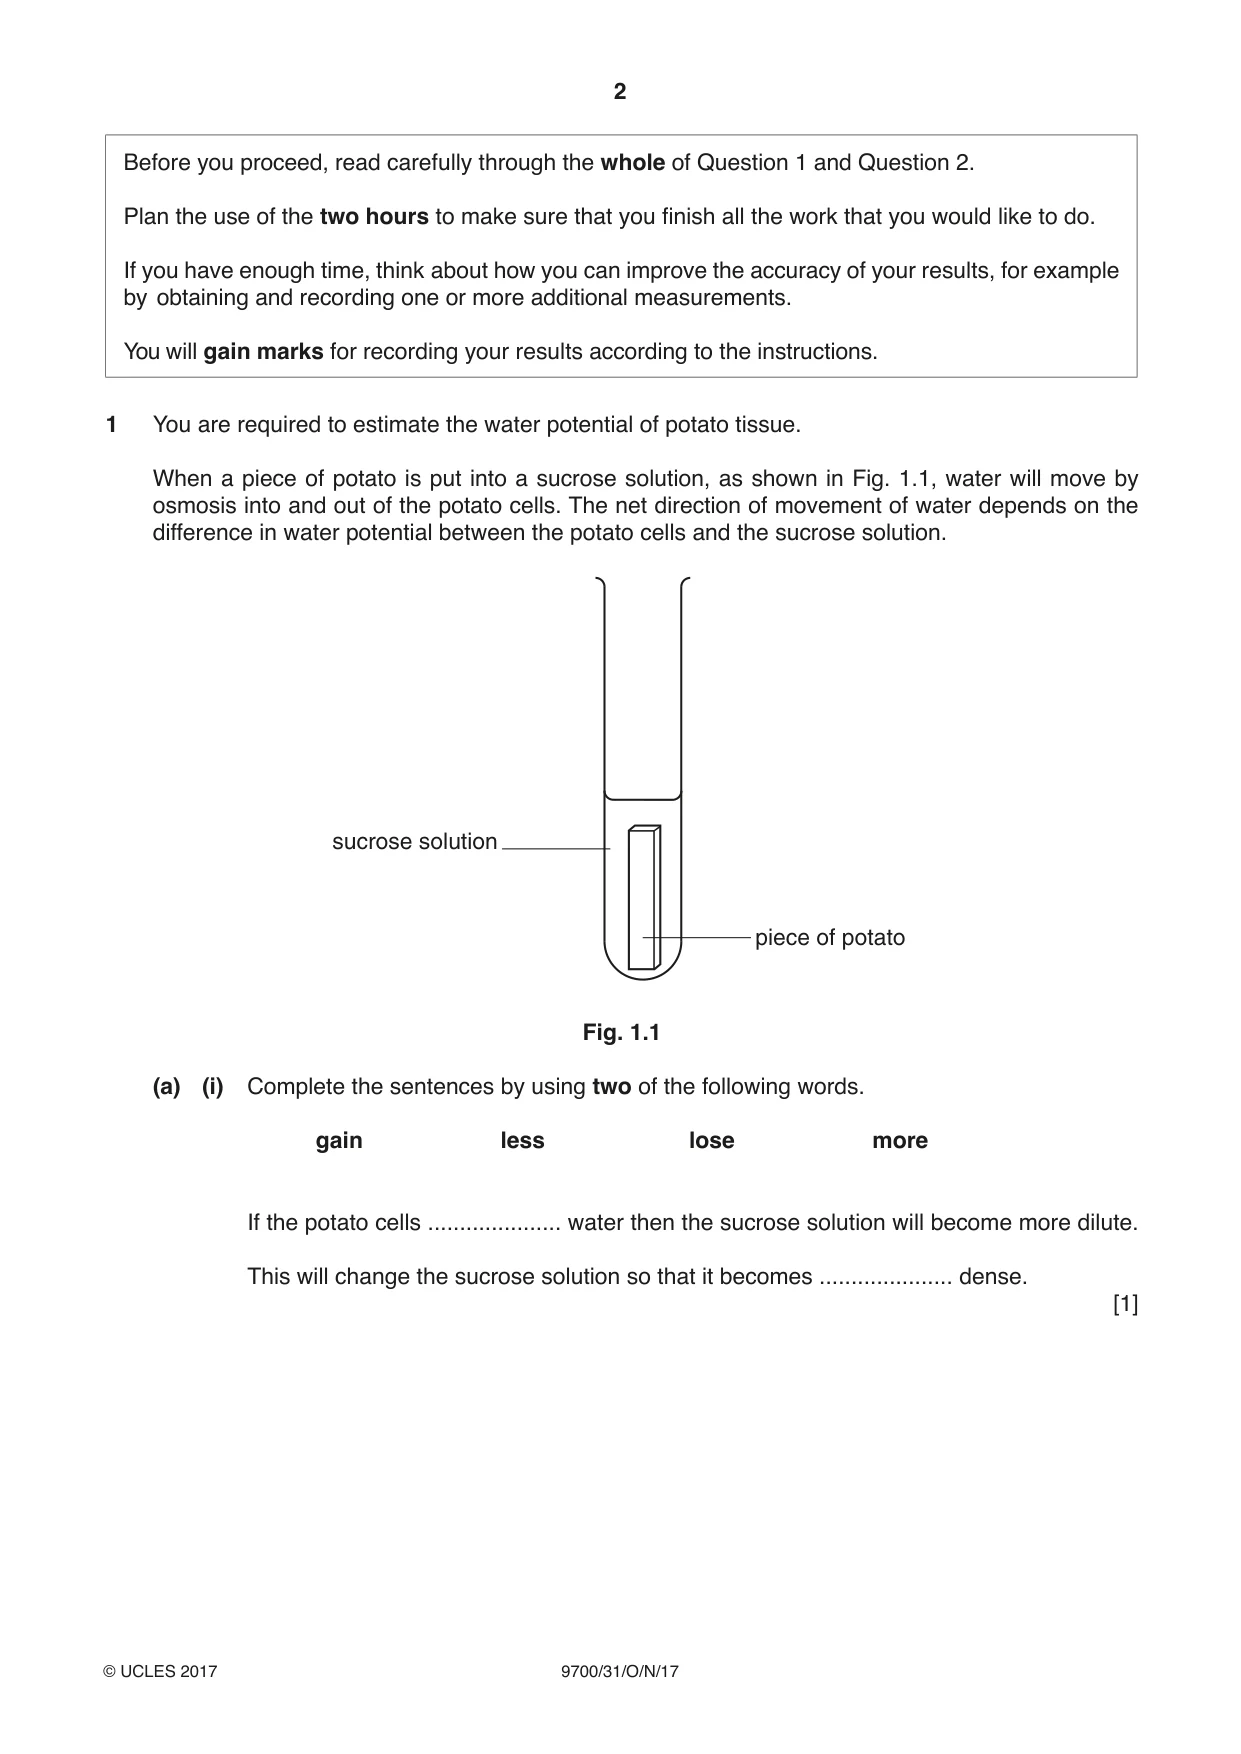
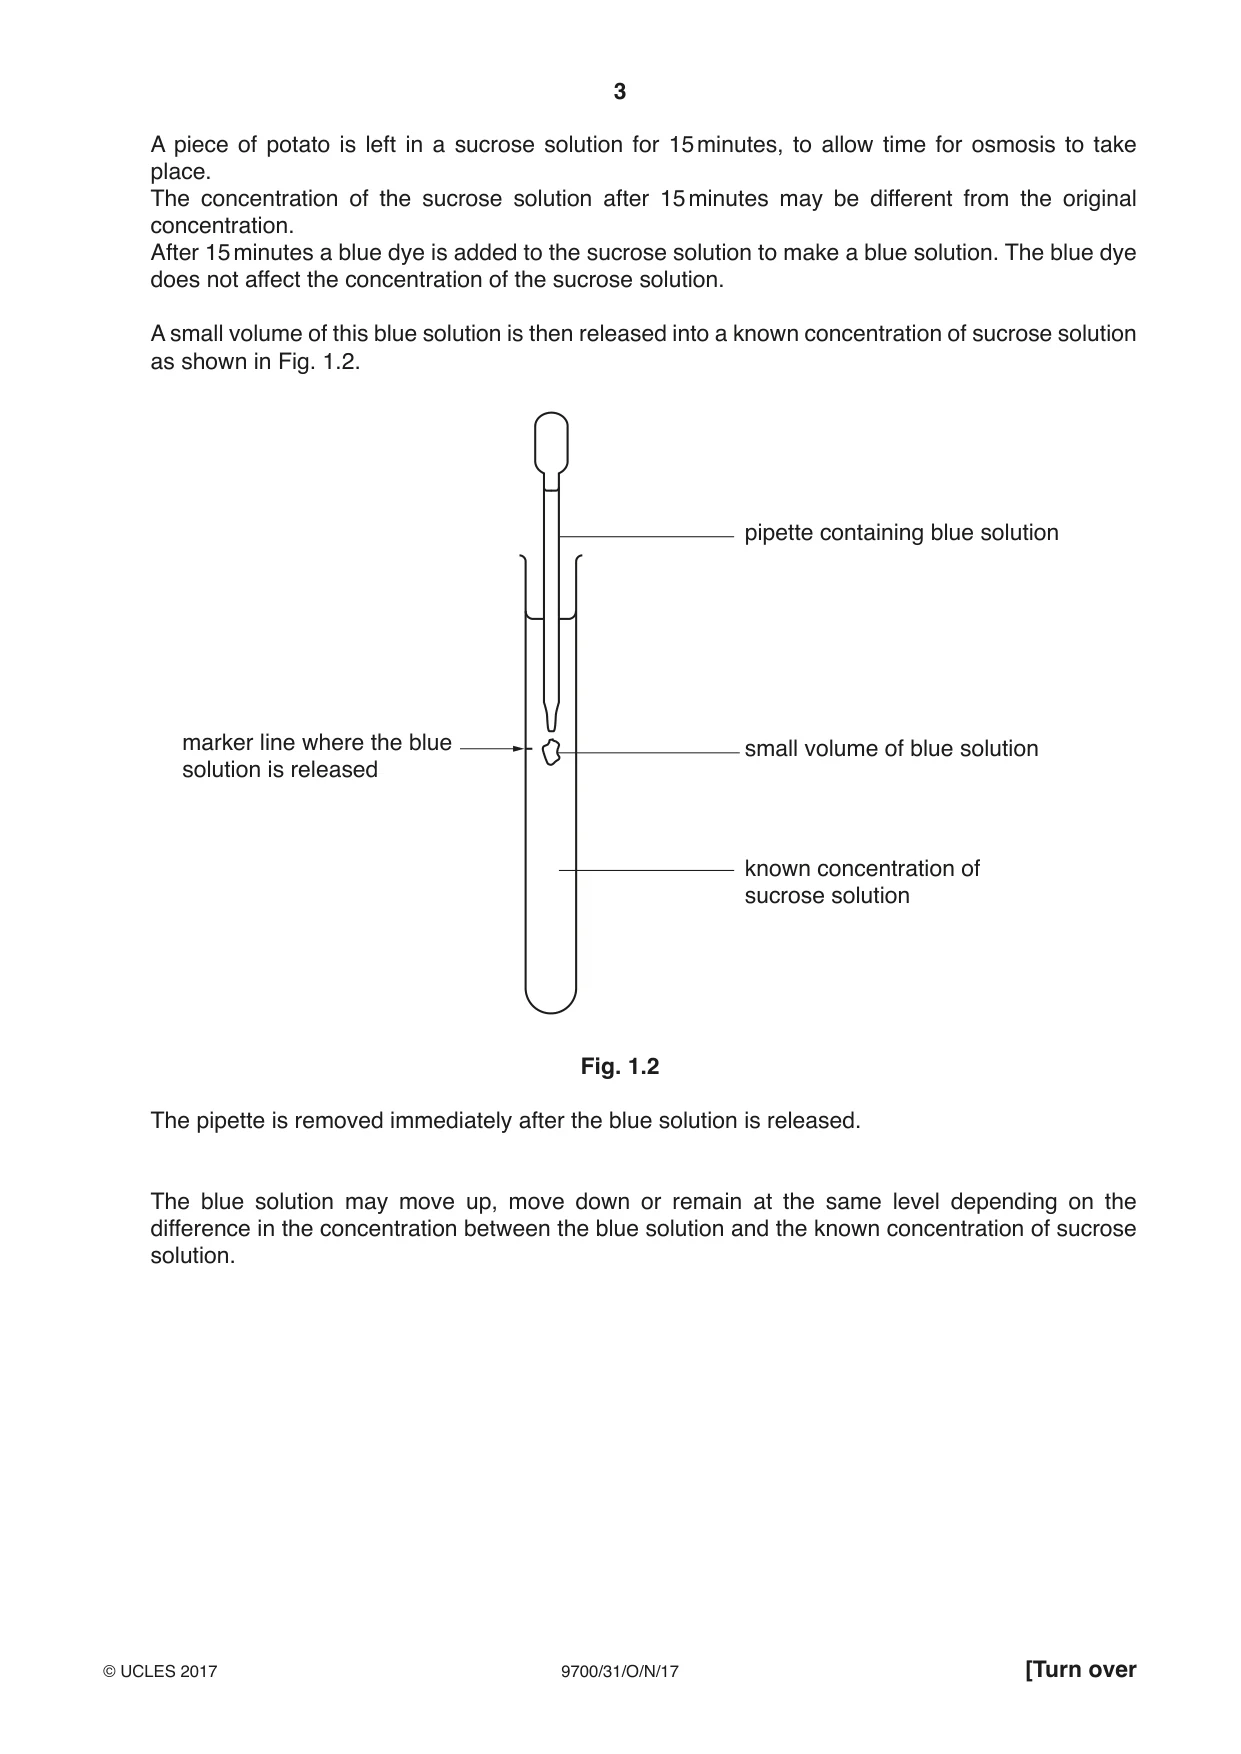
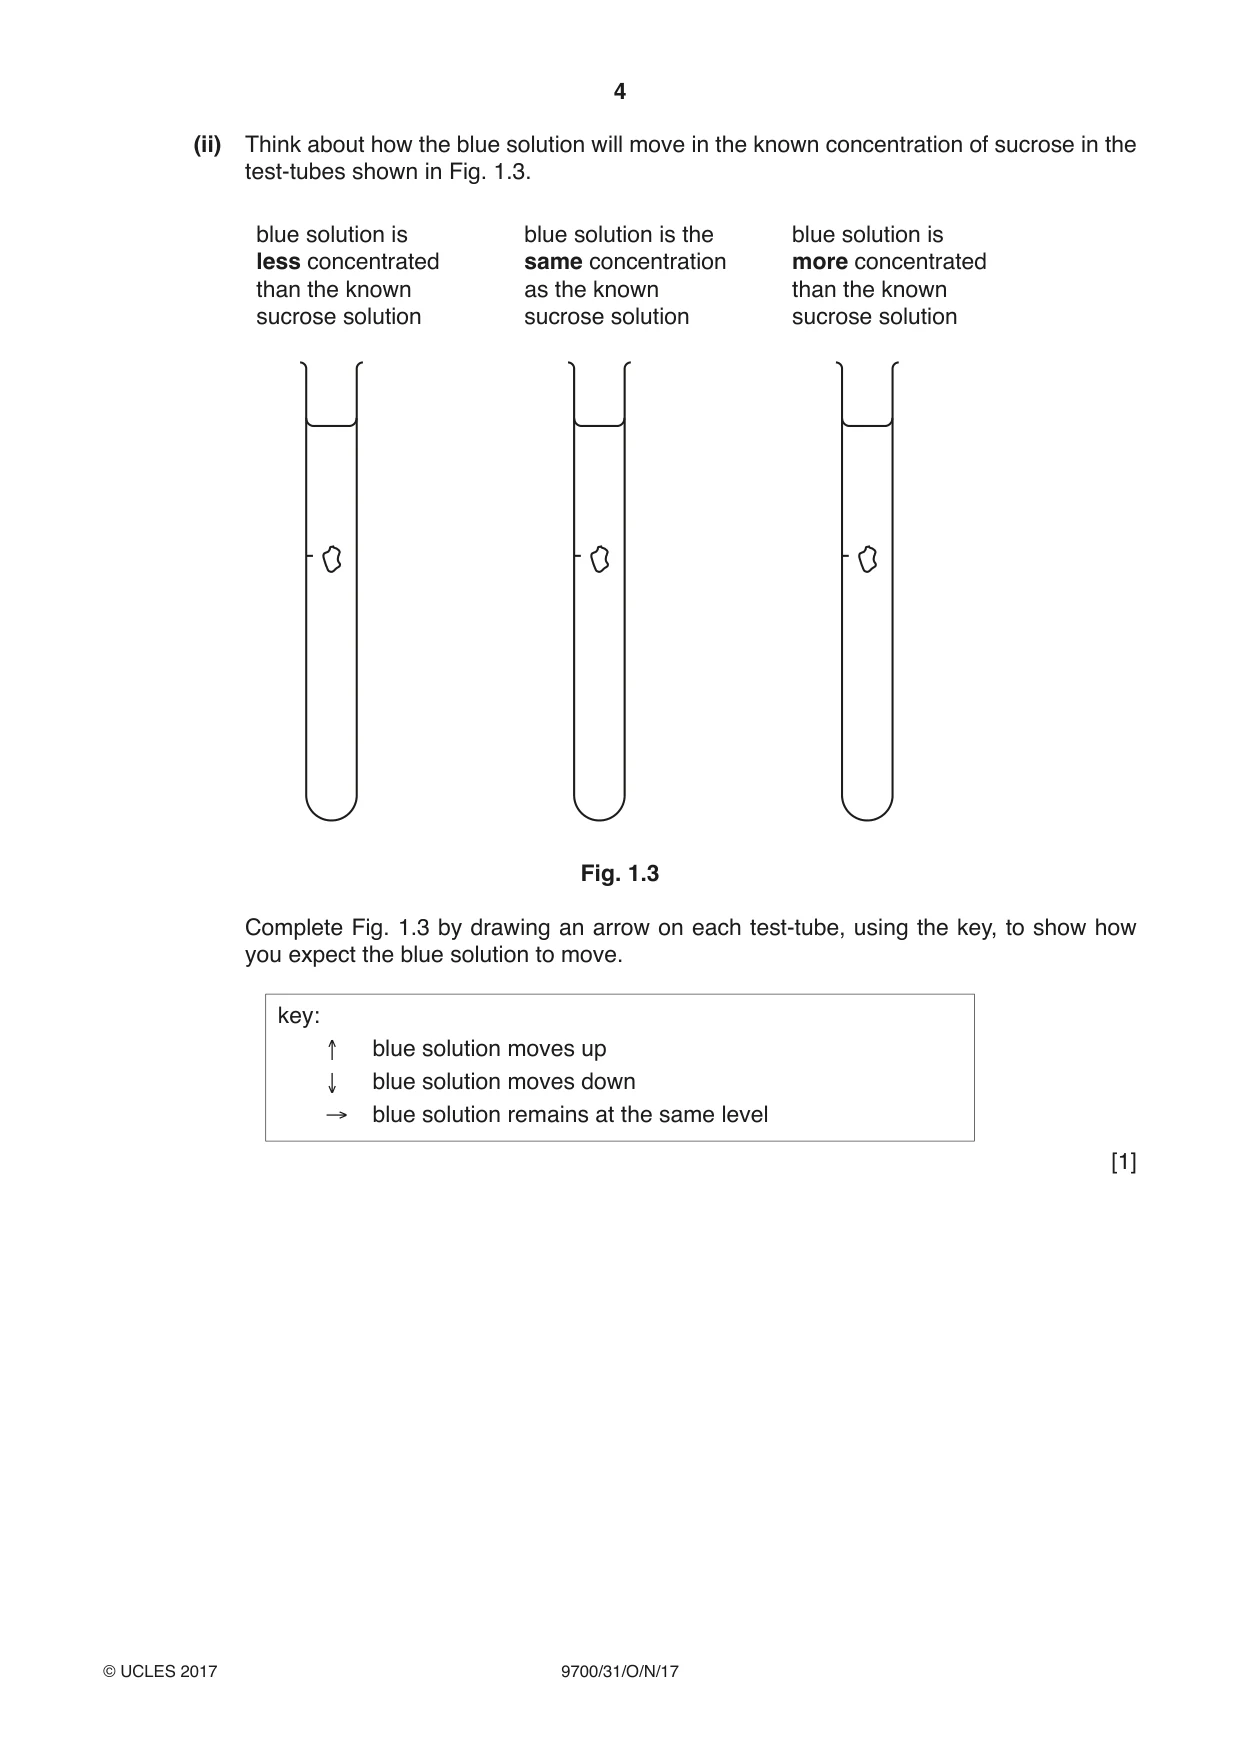
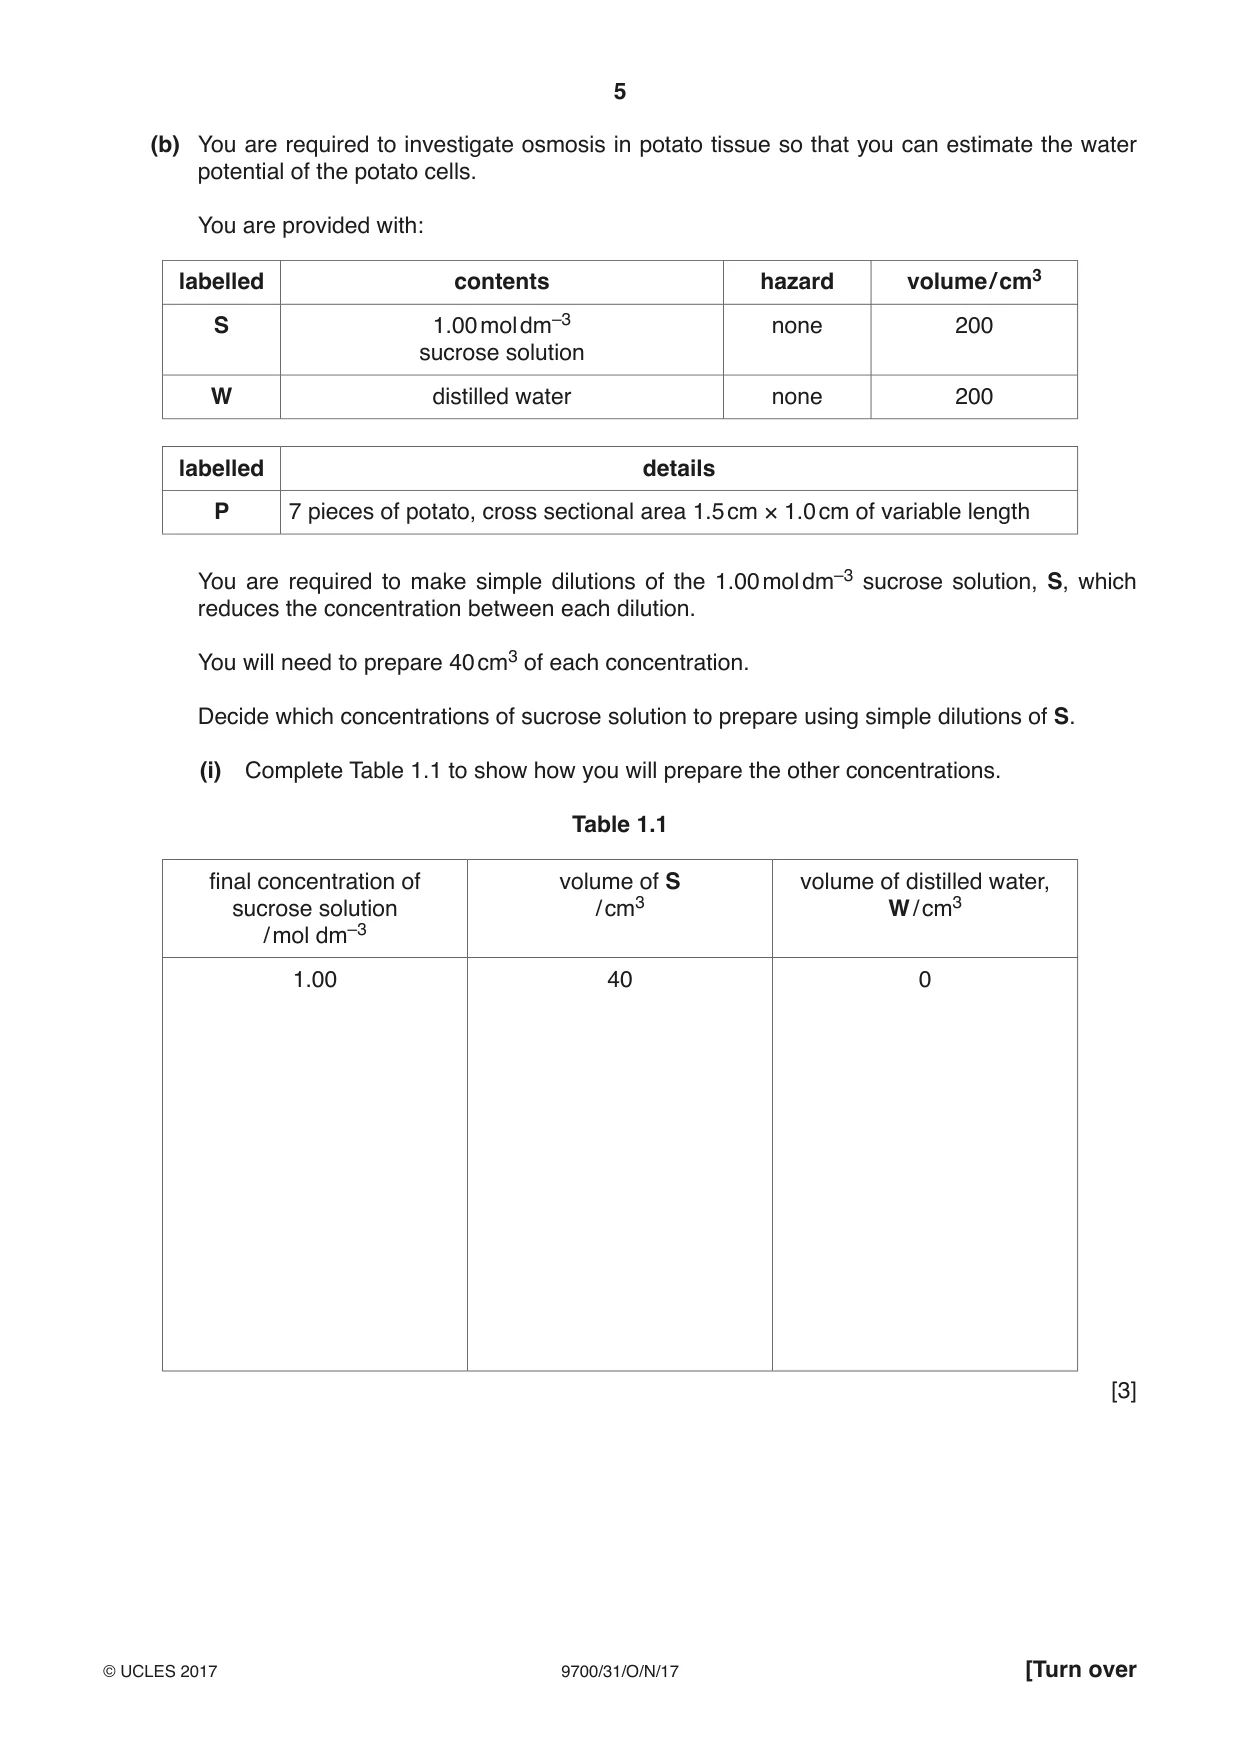
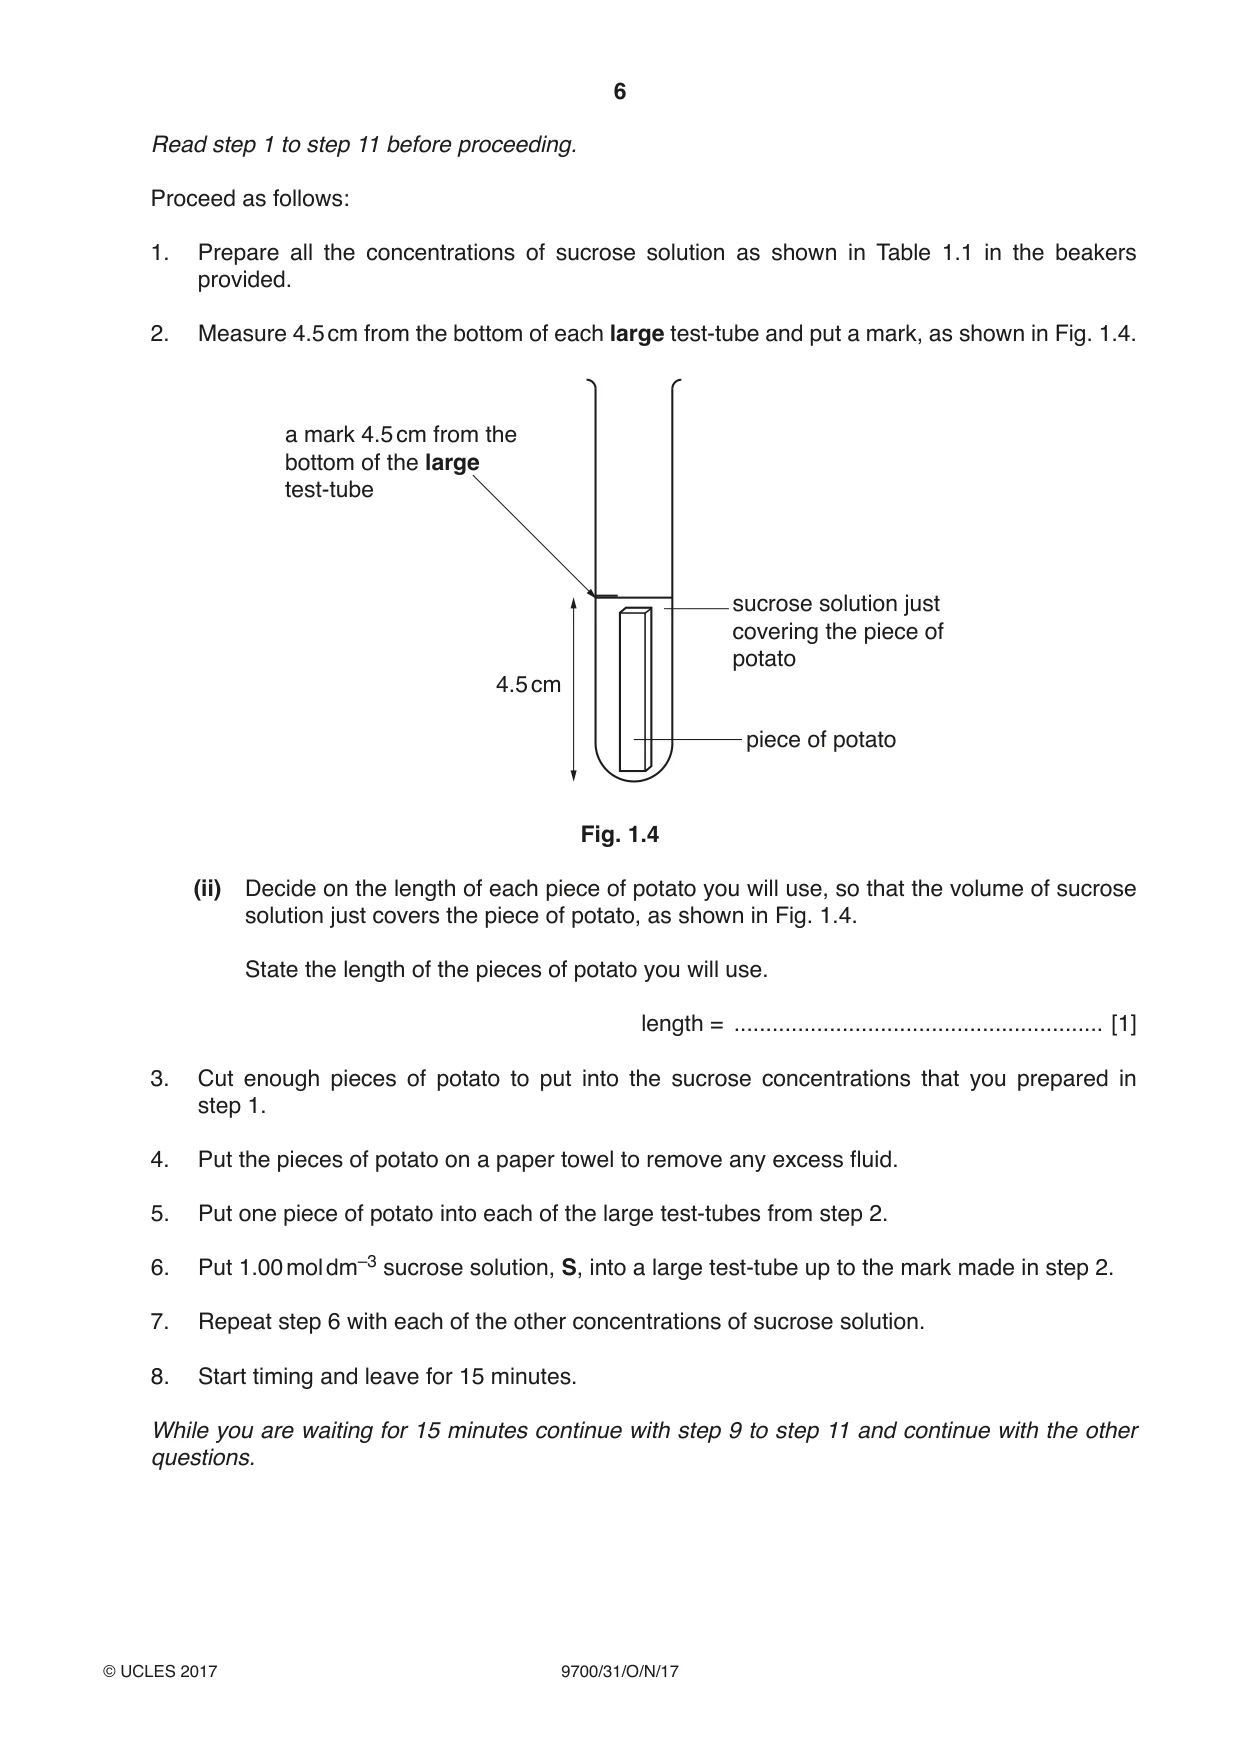
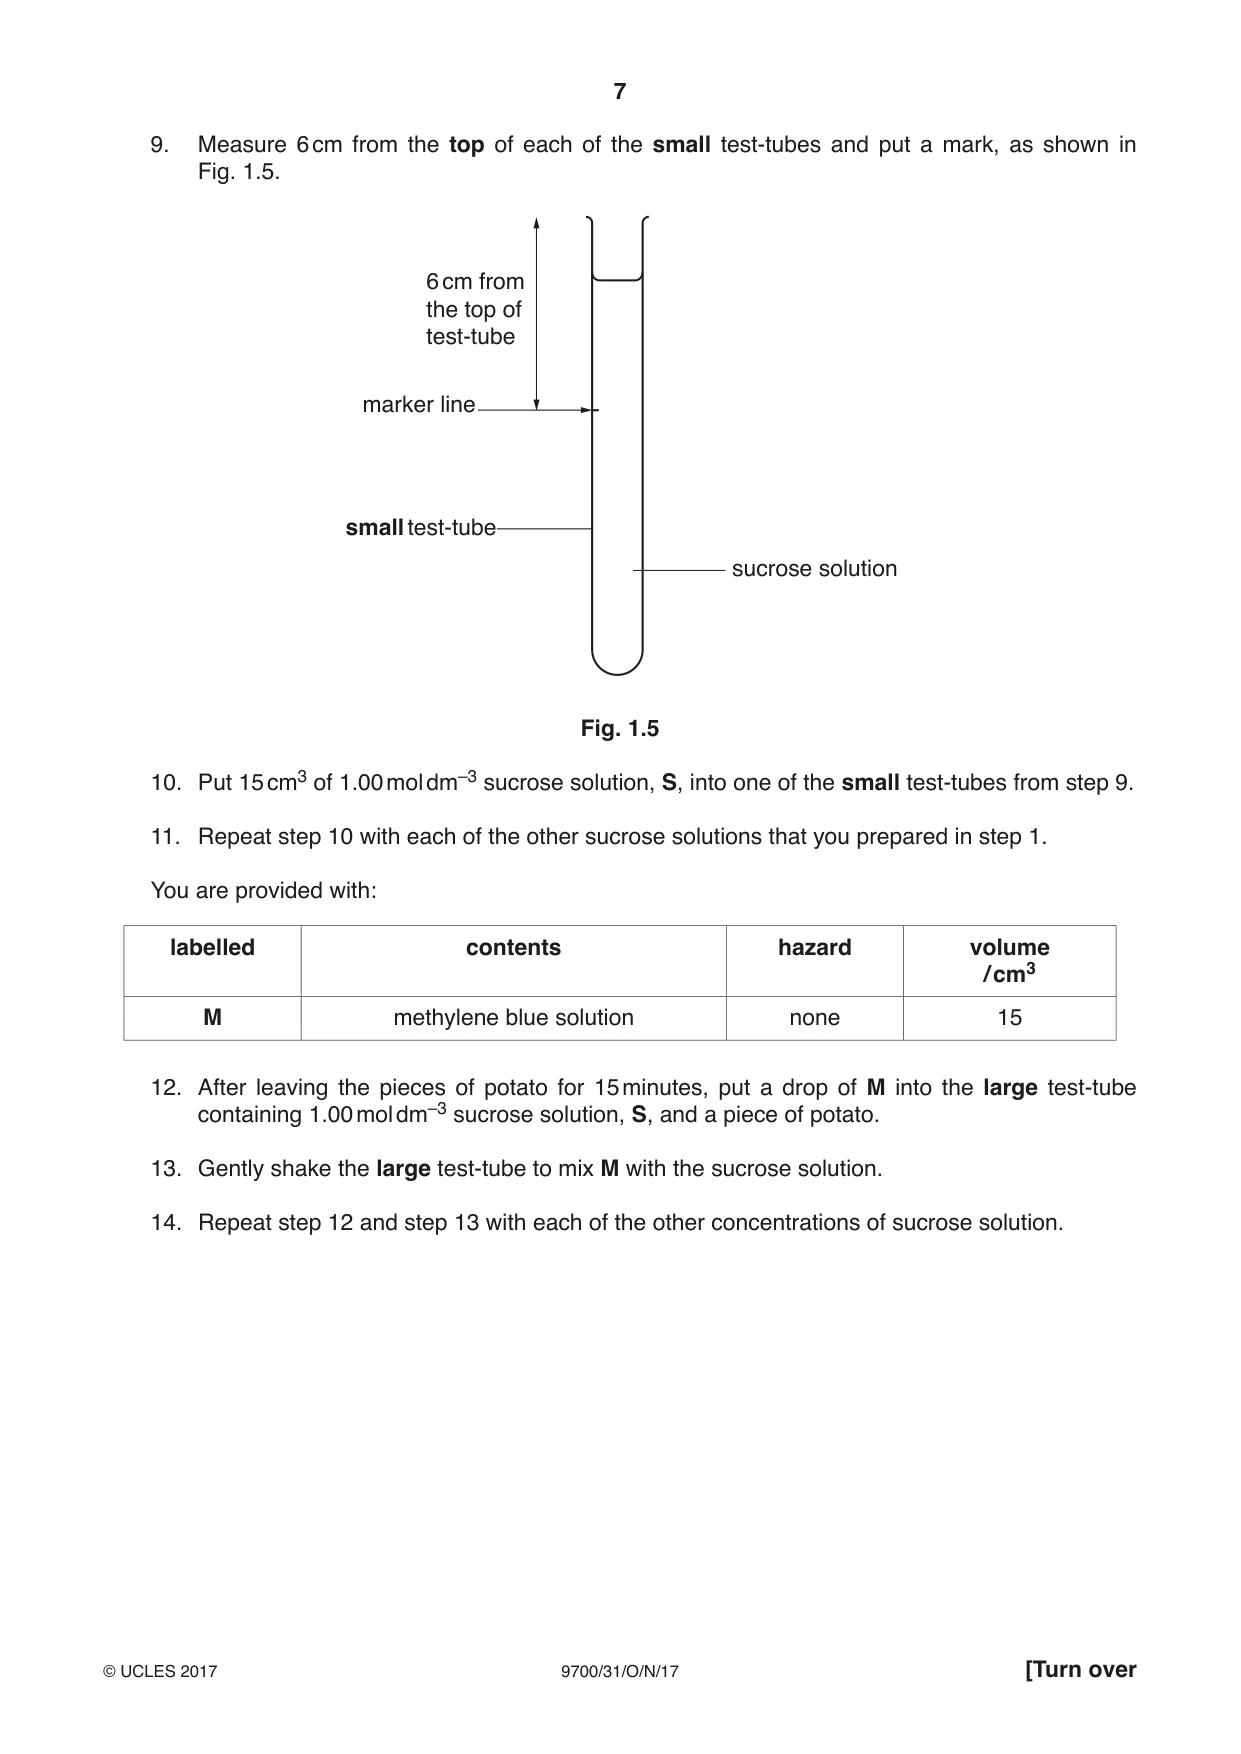
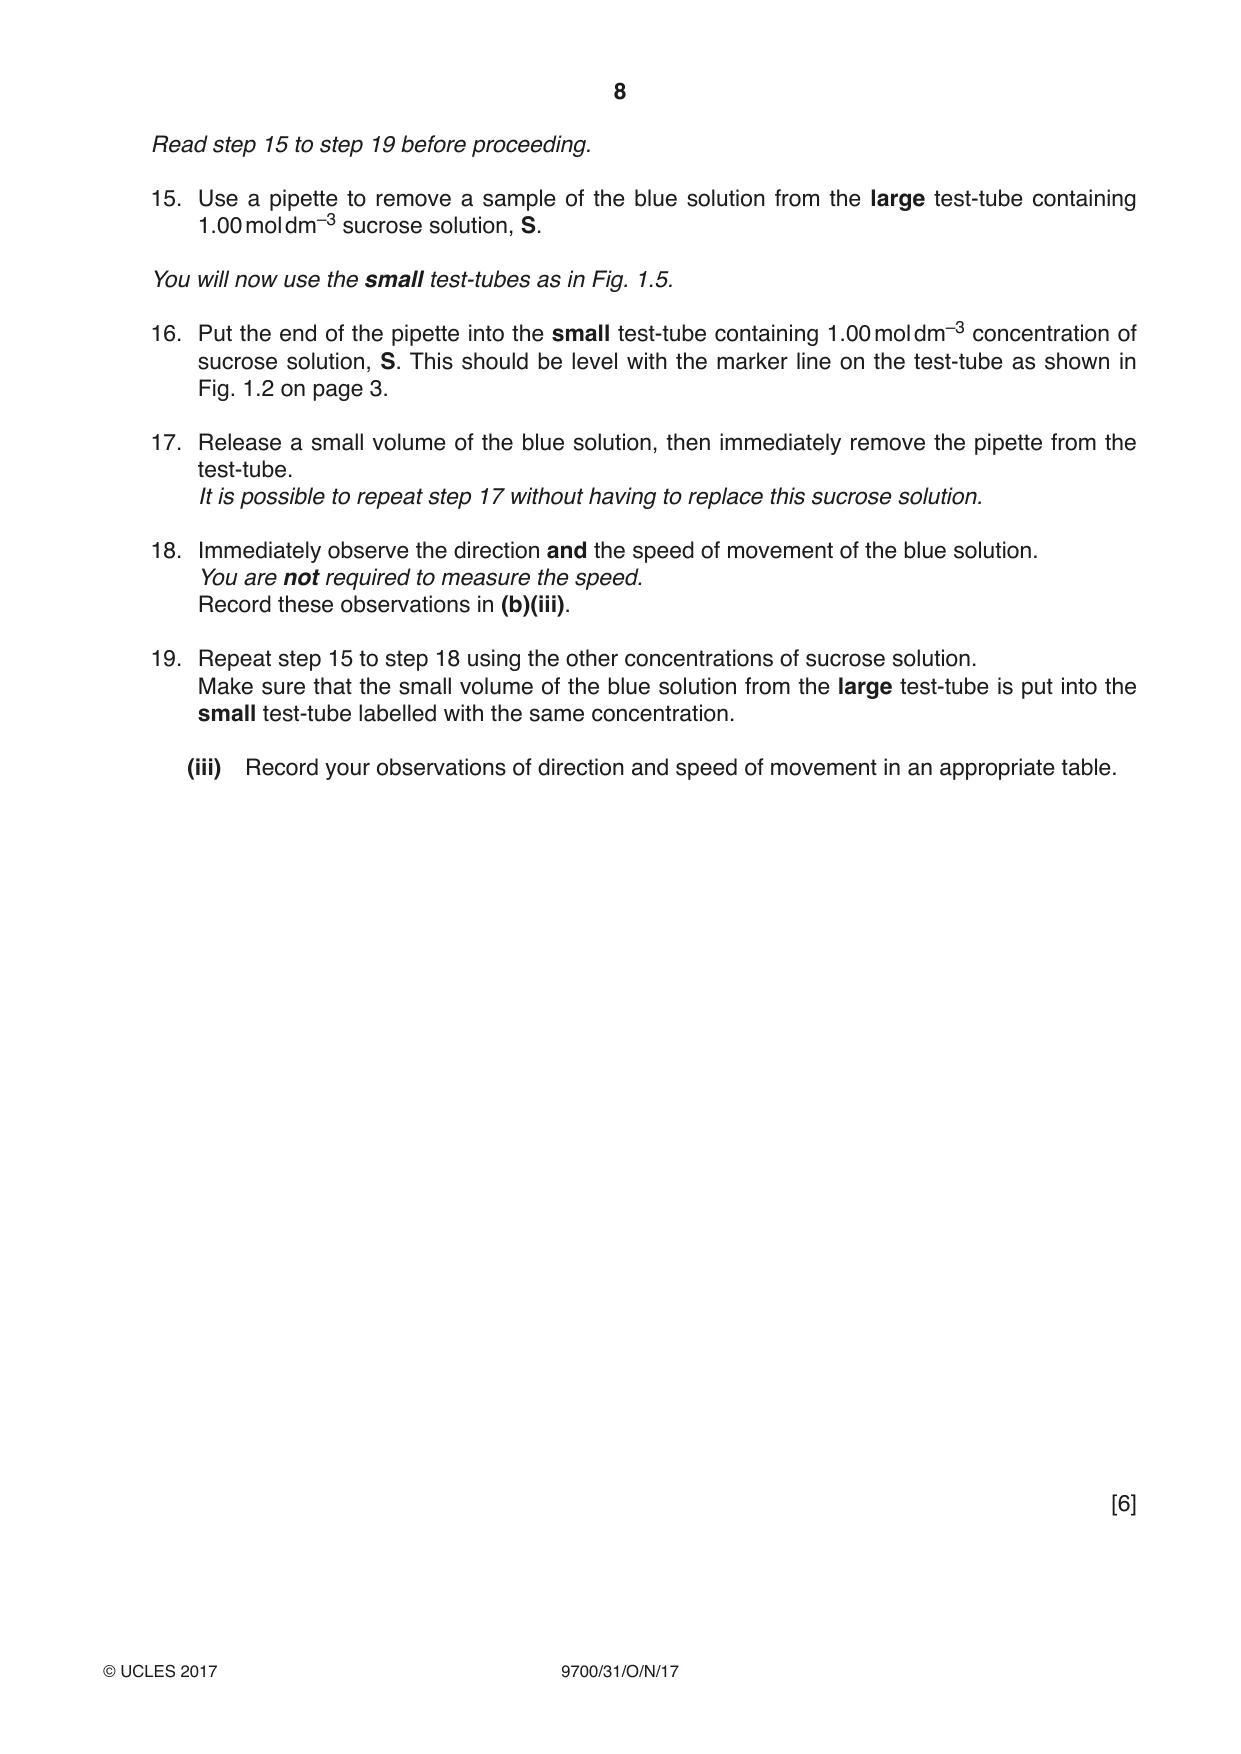
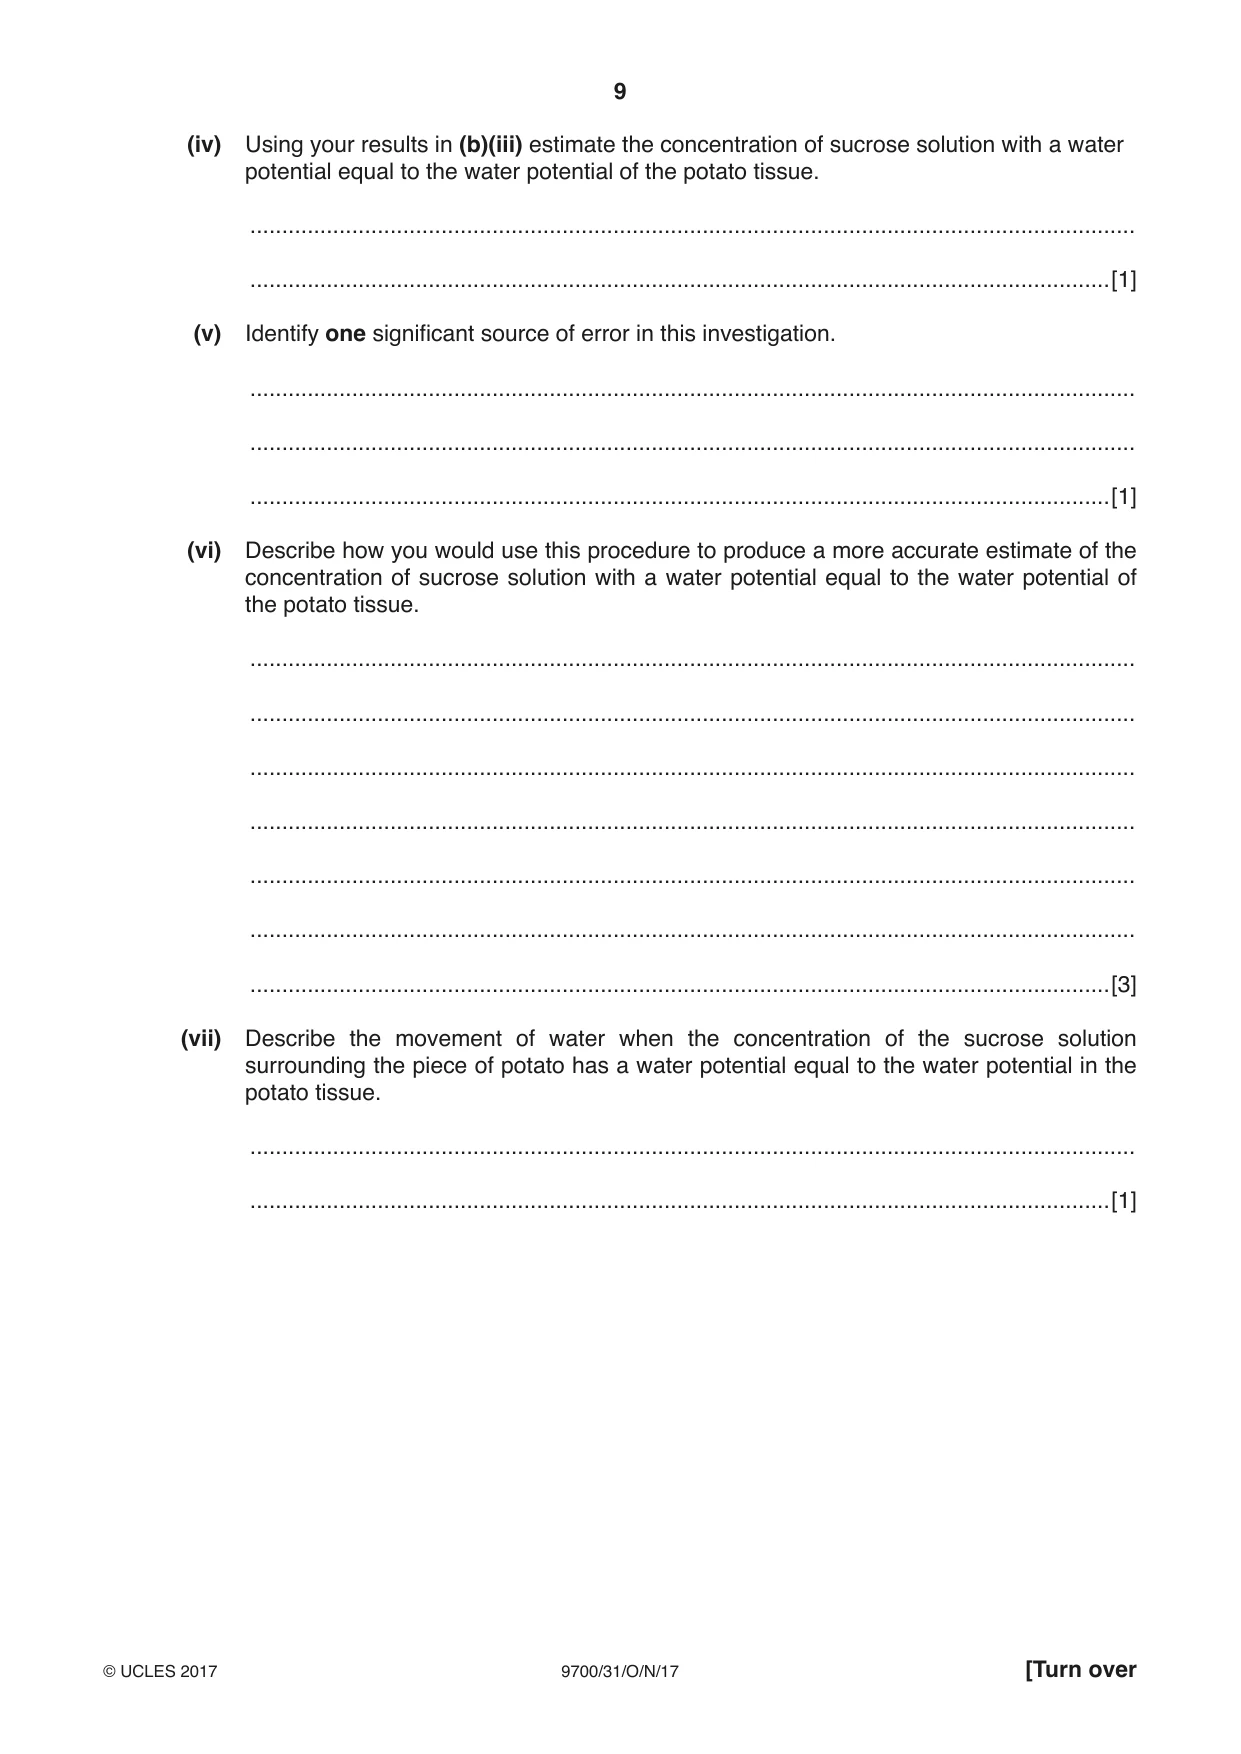
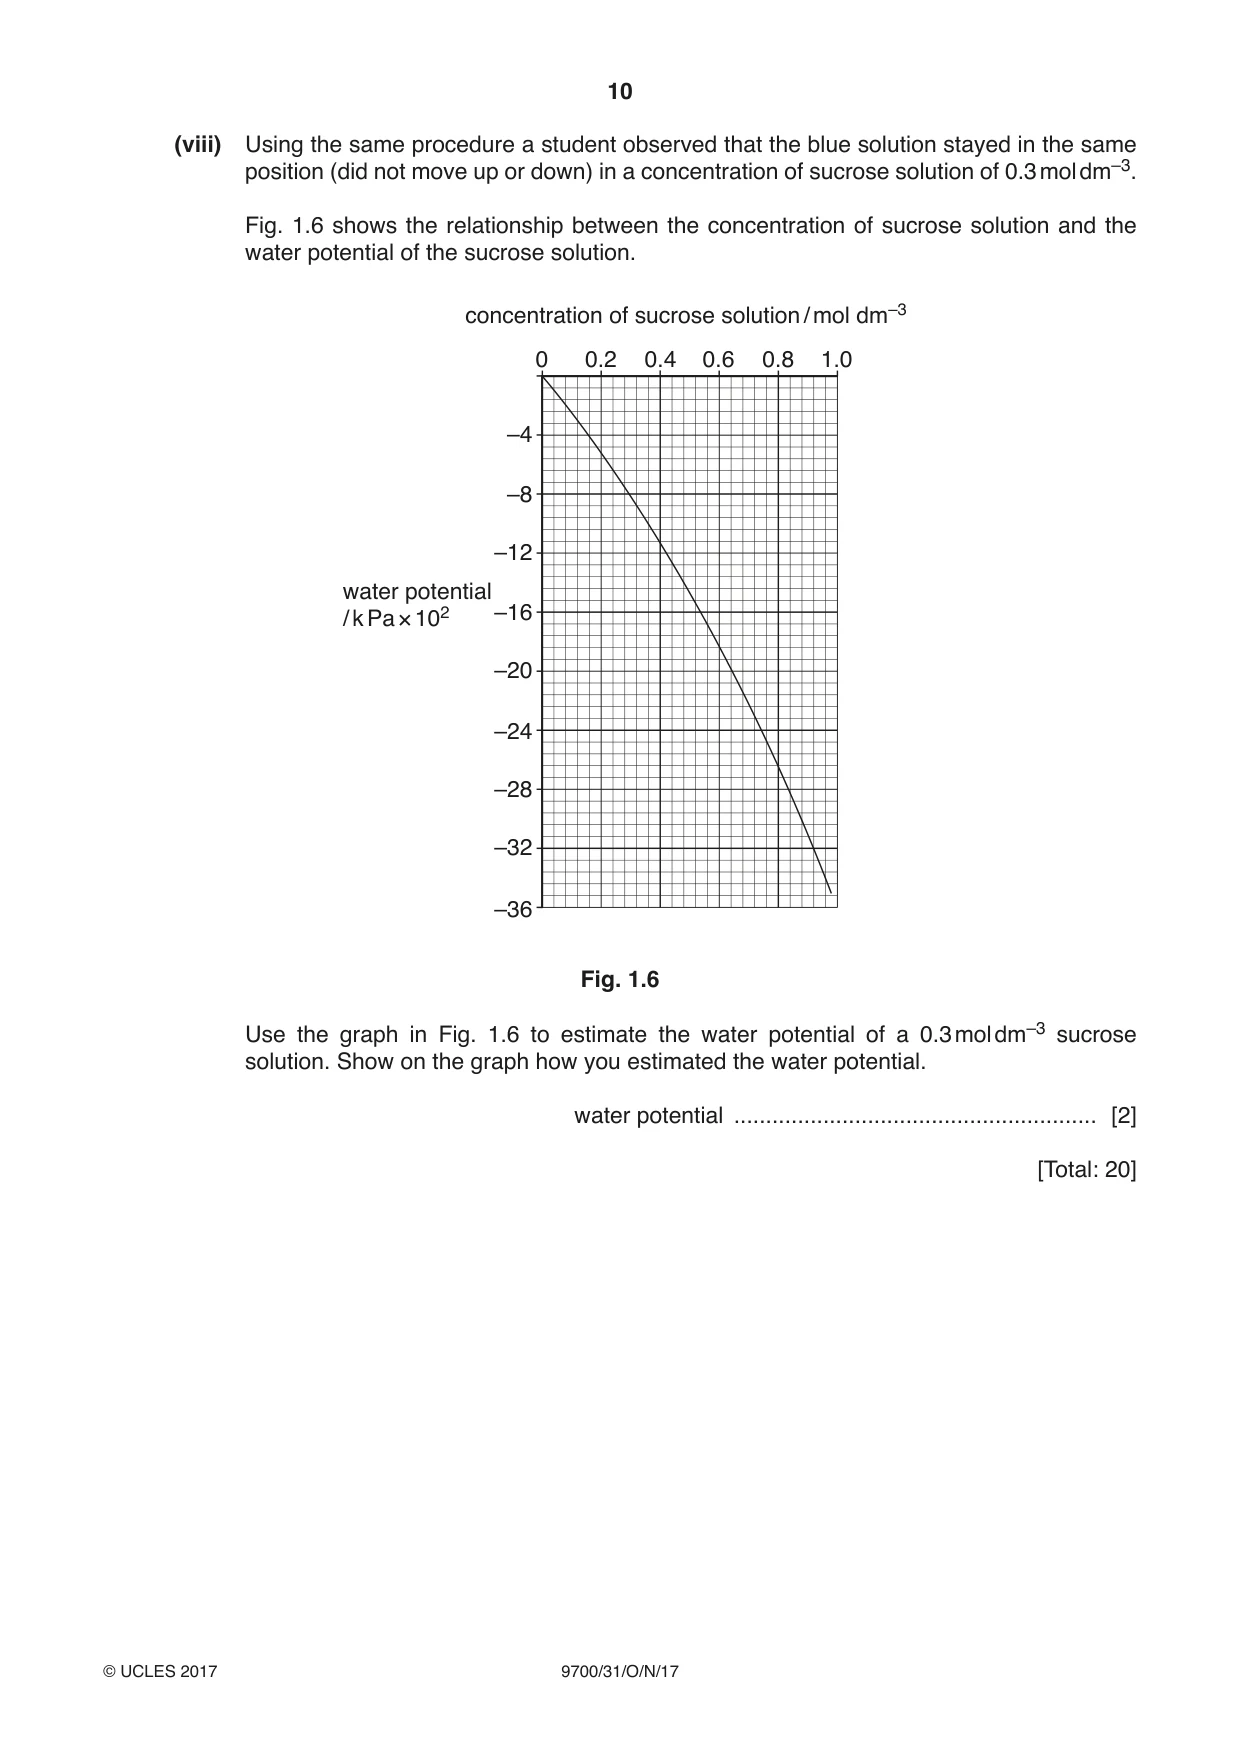
1 You are required to estimate the water potential of potato tissue. When a piece of potato is put into a sucrose solution, as shown in Fig. 1.1, water will move by osmosis into and out of the potato cells. The net direction of movement of water depends on the difference in water potential between the potato cells and the sucrose solution. sucrose solution piece of potato Fig. 1.1 (a) (i) Complete the sentences by using two of the following words. gain less lose more If the potato cells ..................... water then the sucrose solution will become more dilute. This will change the sucrose solution so that it becomes ..................... dense. [1] A piece of potato is left in a sucrose solution for 15 minutes, to allow time for osmosis to take place. The concentration of the sucrose solution after 15 minutes may be different from the original concentration. After 15 minutes a blue dye is added to the sucrose solution to make a blue solution. The blue dye does not affect the concentration of the sucrose solution. A small volume of this blue solution is then released into a known concentration of sucrose solution as shown in Fig. 1.2. pipette containing blue solution marker line where the blue small volume of blue solution solution is released known concentration of sucrose solution Fig. 1.2 The pipette is removed immediately after the blue solution is released. The blue solution may move up, move down or remain at the same level depending on the difference in the concentration between the blue solution and the known concentration of sucrose solution. (ii) Think about how the blue solution will move in the known concentration of sucrose in the test-tubes shown in Fig. 1.3. blue solution is blue solution is the blue solution is less concentrated same concentration more concentrated than the known as the known than the known sucrose solution sucrose solution sucrose solution Fig. 1.3 Complete Fig. 1.3 by drawing an arrow on each test-tube, using the key, to show how you expect the blue solution to move. key: ↑ blue solution moves up ↓ blue solution moves down → blue solution remains at the same level [1] (b) You are required to investigate osmosis in potato tissue so that you can estimate the water potential of the potato cells. You are provided with: labelled contents hazard volume / cm3 S 1.00 mol dm–3 none 200 sucrose solution W distilled water none 200 labelled details P 7 pieces of potato, cross sectional area 1.5 cm × 1.0 cm of variable length You are required to make simple dilutions of the 1.00 mol dm–3 sucrose solution, S, which reduces the concentration between each dilution. You will need to prepare 40 cm3 of each concentration. Decide which concentrations of sucrose solution to prepare using simple dilutions of S. (i) Complete Table 1.1 to show how you will prepare the other concentrations. Table 1.1 final concentration of volume of S volume of distilled water, sucrose solution / cm3 W / cm3 / mol dm–3 1.00 40 0 [3] Read step 1 to step 11 before proceeding. Proceed as follows: 1. Prepare all the concentrations of sucrose solution as shown in Table 1.1 in the beakers provided. 2. Measure 4.5 cm from the bottom of each large test-tube and put a mark, as shown in Fig. 1.4. a mark 4.5 cm from the bottom of the large test-tube sucrose solution just covering the piece of potato 4.5 cm piece of potato Fig. 1.4 (ii) Decide on the length of each piece of potato you will use, so that the volume of sucrose solution just covers the piece of potato, as shown in Fig. 1.4. State the length of the pieces of potato you will use. length = .......................................................... [1] 3. Cut enough pieces of potato to put into the sucrose concentrations that you prepared in step 1. 4. Put the pieces of potato on a paper towel to remove any excess fluid. 5. Put one piece of potato into each of the large test-tubes from step 2. 6. Put 1.00 mol dm–3 sucrose solution, S, into a large test-tube up to the mark made in step 2. 7. Repeat step 6 with each of the other concentrations of sucrose solution. 8. Start timing and leave for 15 minutes. While you are waiting for 15 minutes continue with step 9 to step 11 and continue with the other questions. 9. Measure 6 cm from the top of each of the small test-tubes and put a mark, as shown in Fig. 1.5. 6 cm from the top of test-tube marker line small test-tube sucrose solution Fig. 1.5 10. Put 15 cm3 of 1.00 mol dm–3 sucrose solution, S, into one of the small test-tubes from step 9. 11. Repeat step 10 with each of the other sucrose solutions that you prepared in step 1. You are provided with: labelled contents hazard volume / cm3 M methylene blue solution none 15 12. After leaving the pieces of potato for 15 minutes, put a drop of M into the large test-tube containing 1.00 mol dm–3 sucrose solution, S, and a piece of potato. 13. Gently shake the large test-tube to mix M with the sucrose solution. 14. Repeat step 12 and step 13 with each of the other concentrations of sucrose solution. Read step 15 to step 19 before proceeding. 15. Use a pipette to remove a sample of the blue solution from the large test-tube containing 1.00 mol dm–3 sucrose solution, S. You will now use the small test-tubes as in Fig. 1.5. 16. Put the end of the pipette into the small test-tube containing 1.00 mol dm–3 concentration of sucrose solution, S. This should be level with the marker line on the test-tube as shown in Fig. 1.2 on page 3. 17. Release a small volume of the blue solution, then immediately remove the pipette from the test-tube. It is possible to repeat step 17 without having to replace this sucrose solution. 18. Immediately observe the direction and the speed of movement of the blue solution. You are not required to measure the speed. Record these observations in (b)(iii). 19. Repeat step 15 to step 18 using the other concentrations of sucrose solution. Make sure that the small volume of the blue solution from the large test-tube is put into the small test-tube labelled with the same concentration. (iii) Record your observations of direction and speed of movement in an appropriate table. [6] (iv) Using your results in (b)(iii) estimate the concentration of sucrose solution with a water potential equal to the water potential of the potato tissue. ........................................................................................................................................... .......................................................................................................................................[1] (v) Identify one significant source of error in this investigation. ........................................................................................................................................... ........................................................................................................................................... .......................................................................................................................................[1] (vi) Describe how you would use this procedure to produce a more accurate estimate of the concentration of sucrose solution with a water potential equal to the water potential of the potato tissue. ........................................................................................................................................... ........................................................................................................................................... ........................................................................................................................................... ........................................................................................................................................... ........................................................................................................................................... ........................................................................................................................................... .......................................................................................................................................[3] (vii) Describe the movement of water when the concentration of the sucrose solution surrounding the piece of potato has a water potential equal to the water potential in the potato tissue. ........................................................................................................................................... .......................................................................................................................................[1] (viii) Using the same procedure a student observed that the blue solution stayed in the same position (did not move up or down) in a concentration of sucrose solution of 0.3 mol dm–3. Fig. 1.6 shows the relationship between the concentration of sucrose solution and the water potential of the sucrose solution. concentration of sucrose solution / mol dm–3 0 0.2 0.4 0.6 0.8 1.0 –4 –8 –12 water potential –16 / k Pa × 102 –20 –24 –28 –32 –36 Fig. 1.6 Use the graph in Fig. 1.6 to estimate the water potential of a 0.3 mol dm–3 sucrose solution. Show on the graph how you estimated the water potential. water potential ......................................................... [2] [Total: 20] Question 2 starts on page 12
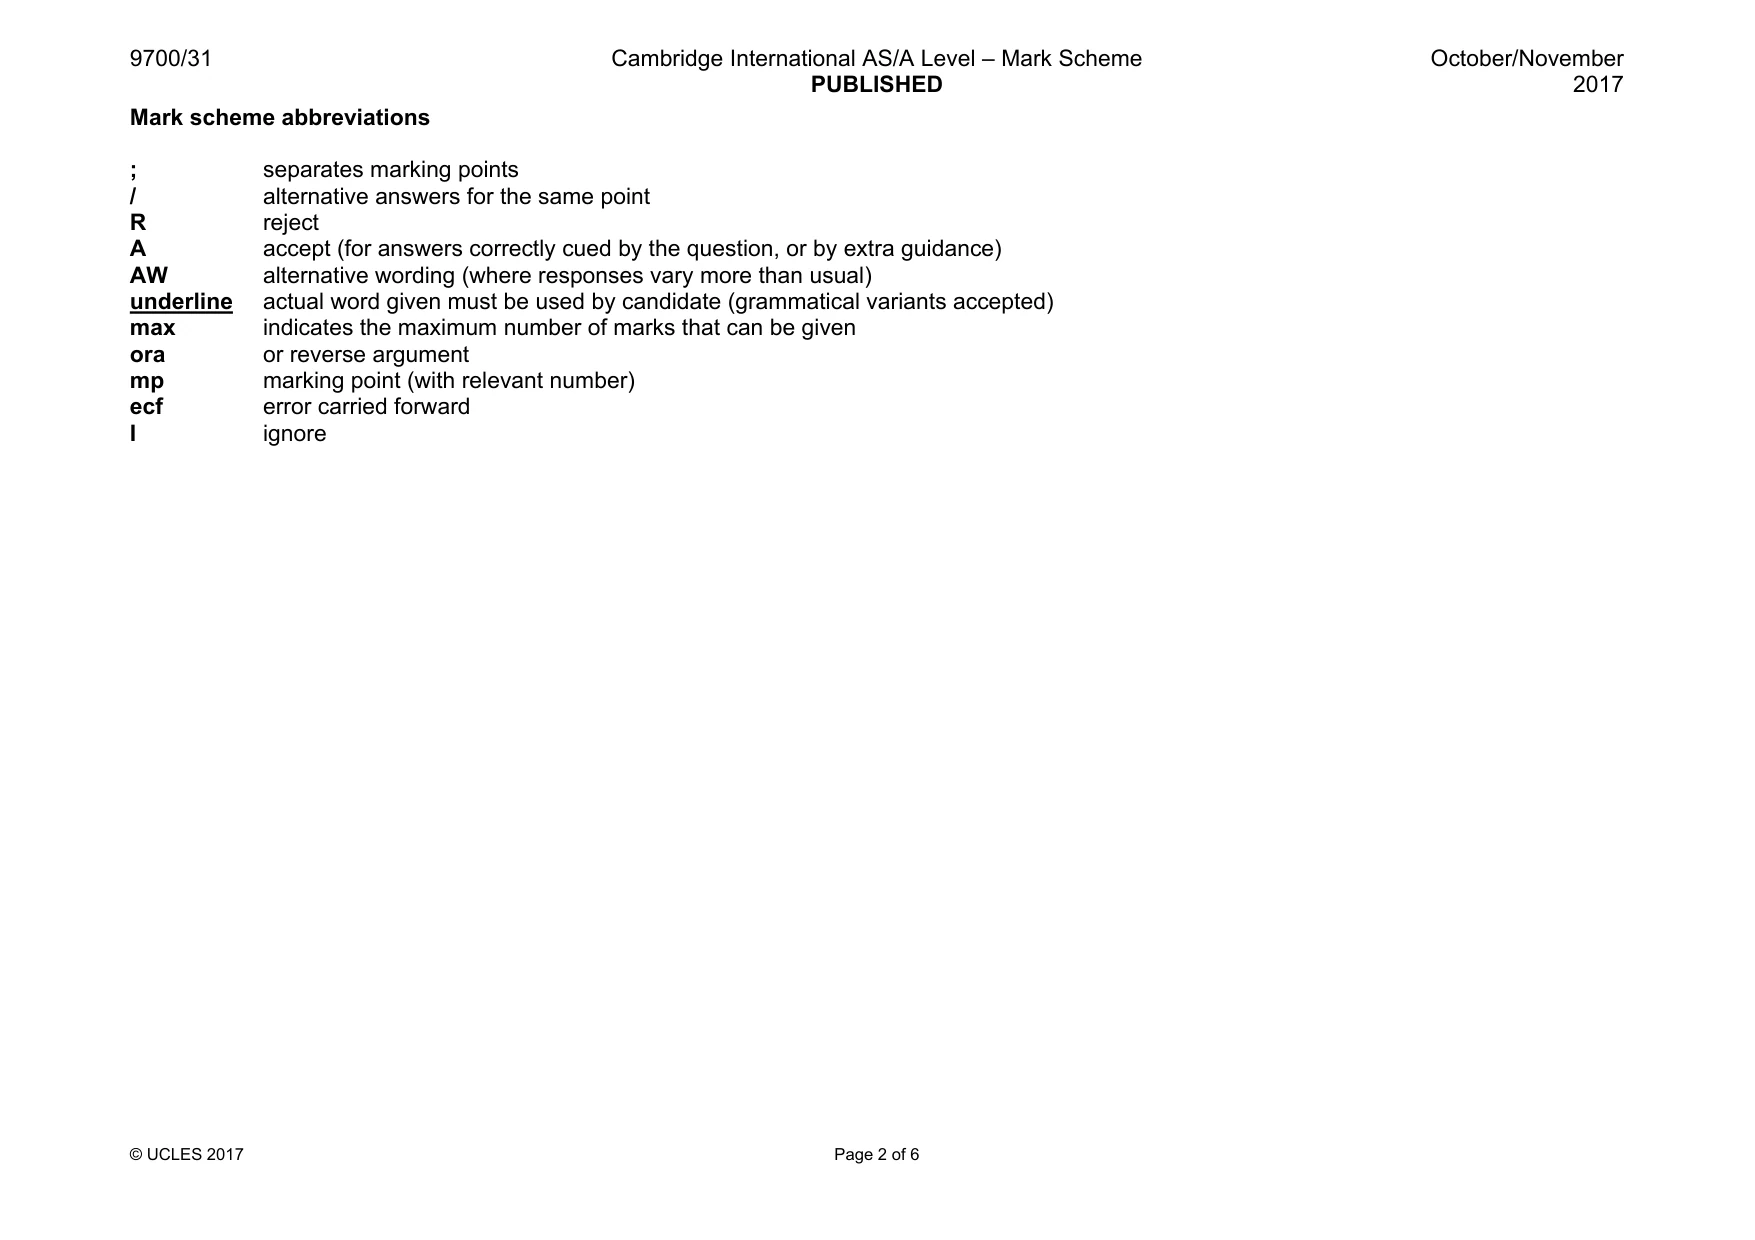
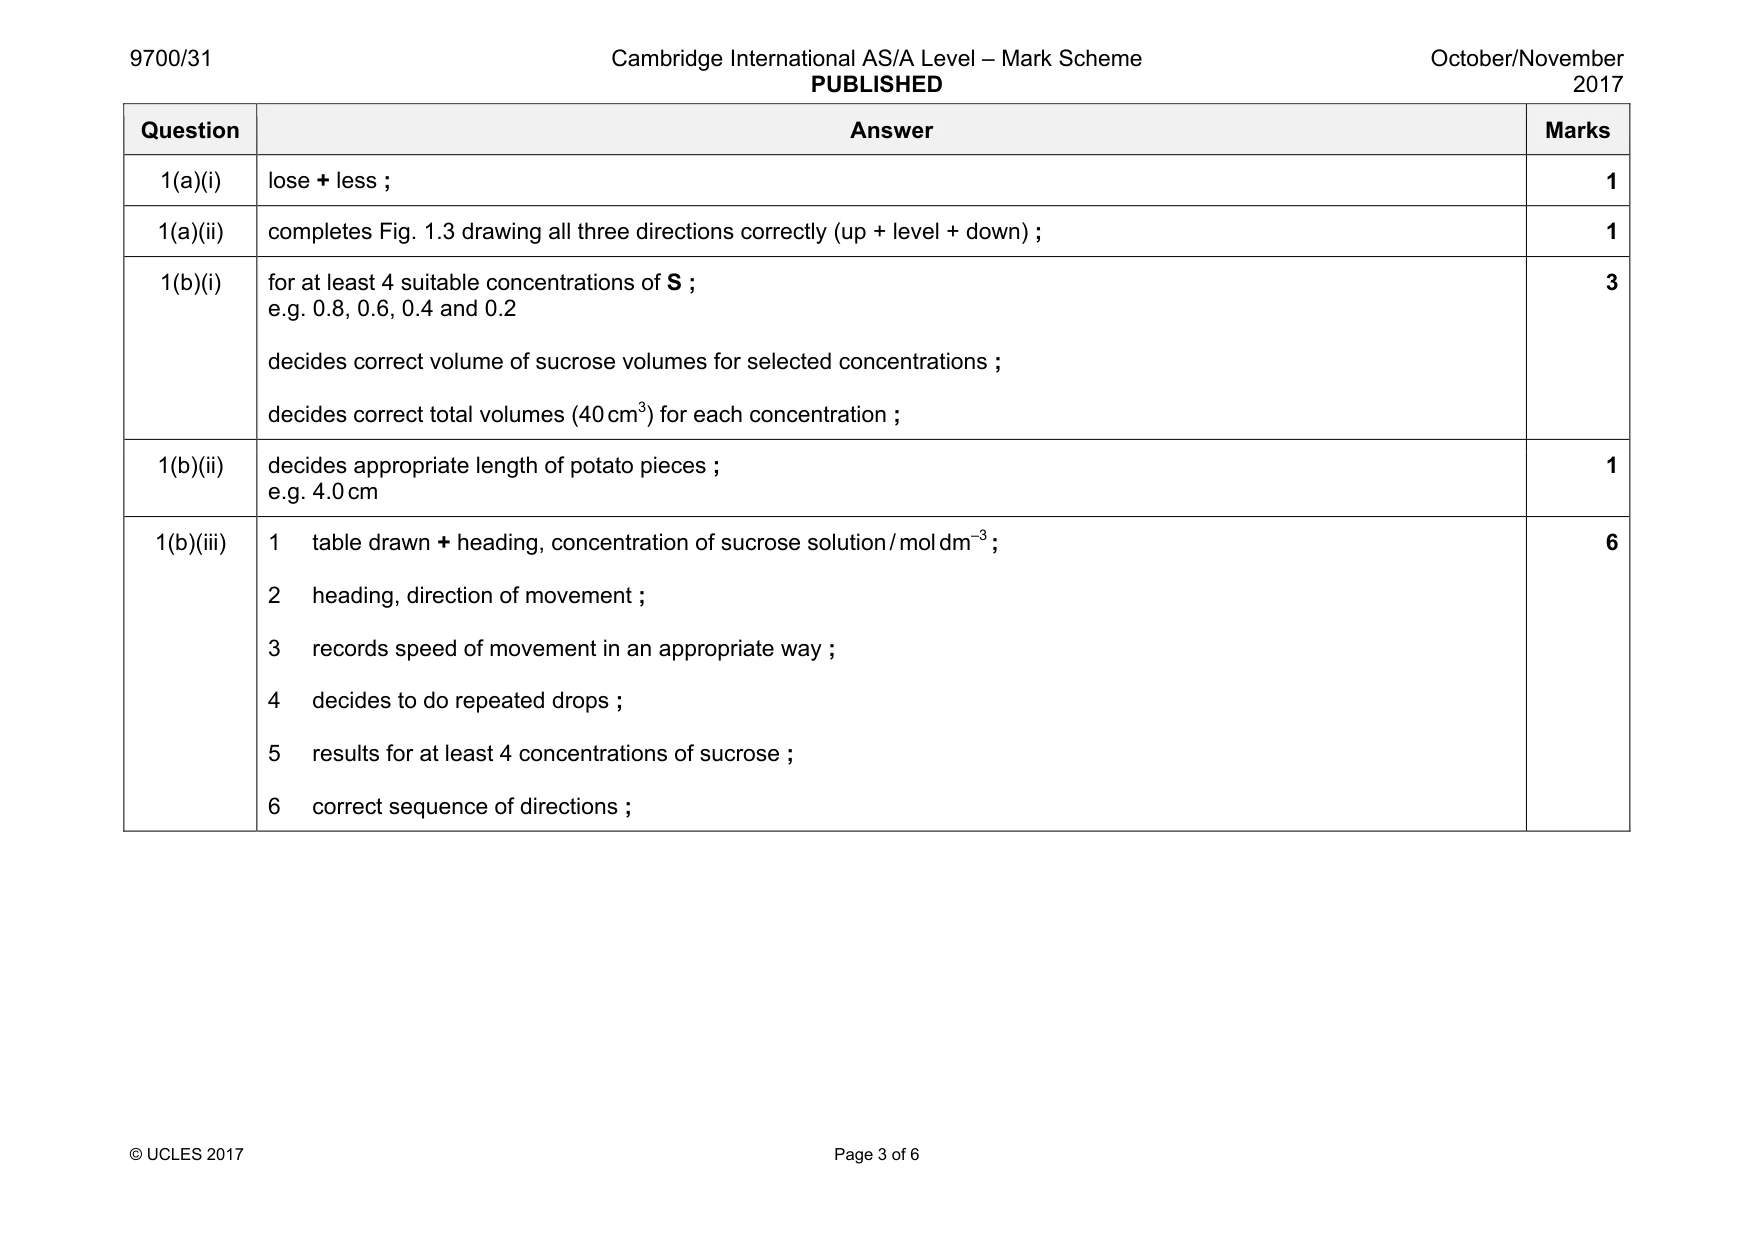
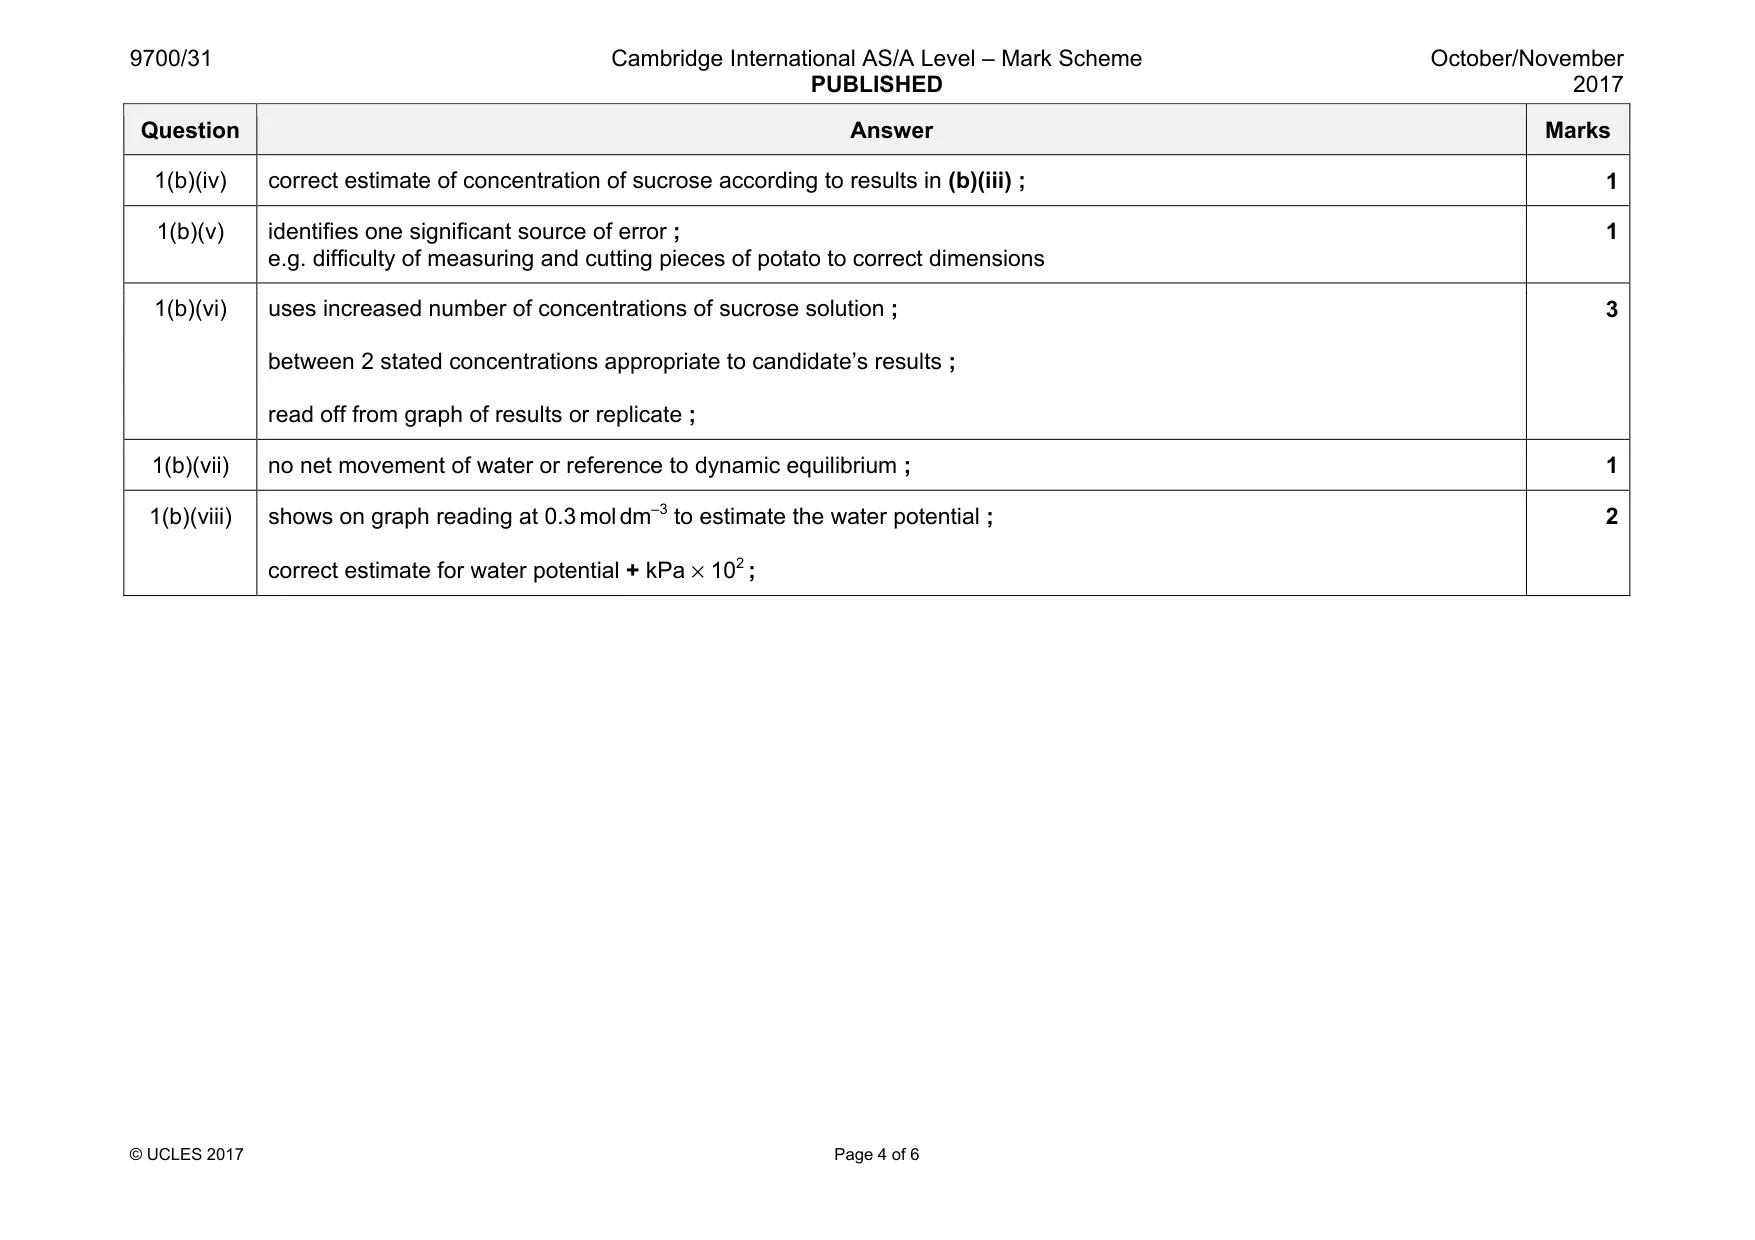
Mark scheme: 1(a)(i) lose + less ; 1 1(a)(ii) completes Fig. 1.3 drawing all three directions correctly (up + level + down) ; 1 1(b)(i) for at least 4 suitable concentrations of S ; e.g. 0.8, 0.6, 0.4 and 0.2 decides correct volume of sucrose volumes for selected concentrations ; decides correct total volumes (40 cm3) for each concentration ; 3 1(b)(ii) decides appropriate length of potato pieces ; e.g. 4.0 cm 1 1(b)(iii) 1 table drawn + heading, concentration of sucrose solution / mol dm–3 ; 2 heading, direction of movement ; 3 records speed of movement in an appropriate way ; 4 decides to do repeated drops ; 5 results for at least 4 concentrations of sucrose ; 6 correct sequence of directions ; 6 Question Answer Marks 1(b)(iv) correct estimate of concentration of sucrose according to results in (b)(iii) ; 1 1(b)(v) identifies one significant source of error ; e.g. difficulty of measuring and cutting pieces of potato to correct dimensions 1 1(b)(vi) uses increased number of concentrations of sucrose solution ; between 2 stated concentrations appropriate to candidate’s results ; read off from graph of results or replicate ; 3 1(b)(vii) no net movement of water or reference to dynamic equilibrium ; 1 1(b)(viii) shows on graph reading at 0.3 mol dm–3 to estimate the water potential ; correct estimate for water potential + kPa × 102 ; 2
Q2 · Some plants store starch as grains
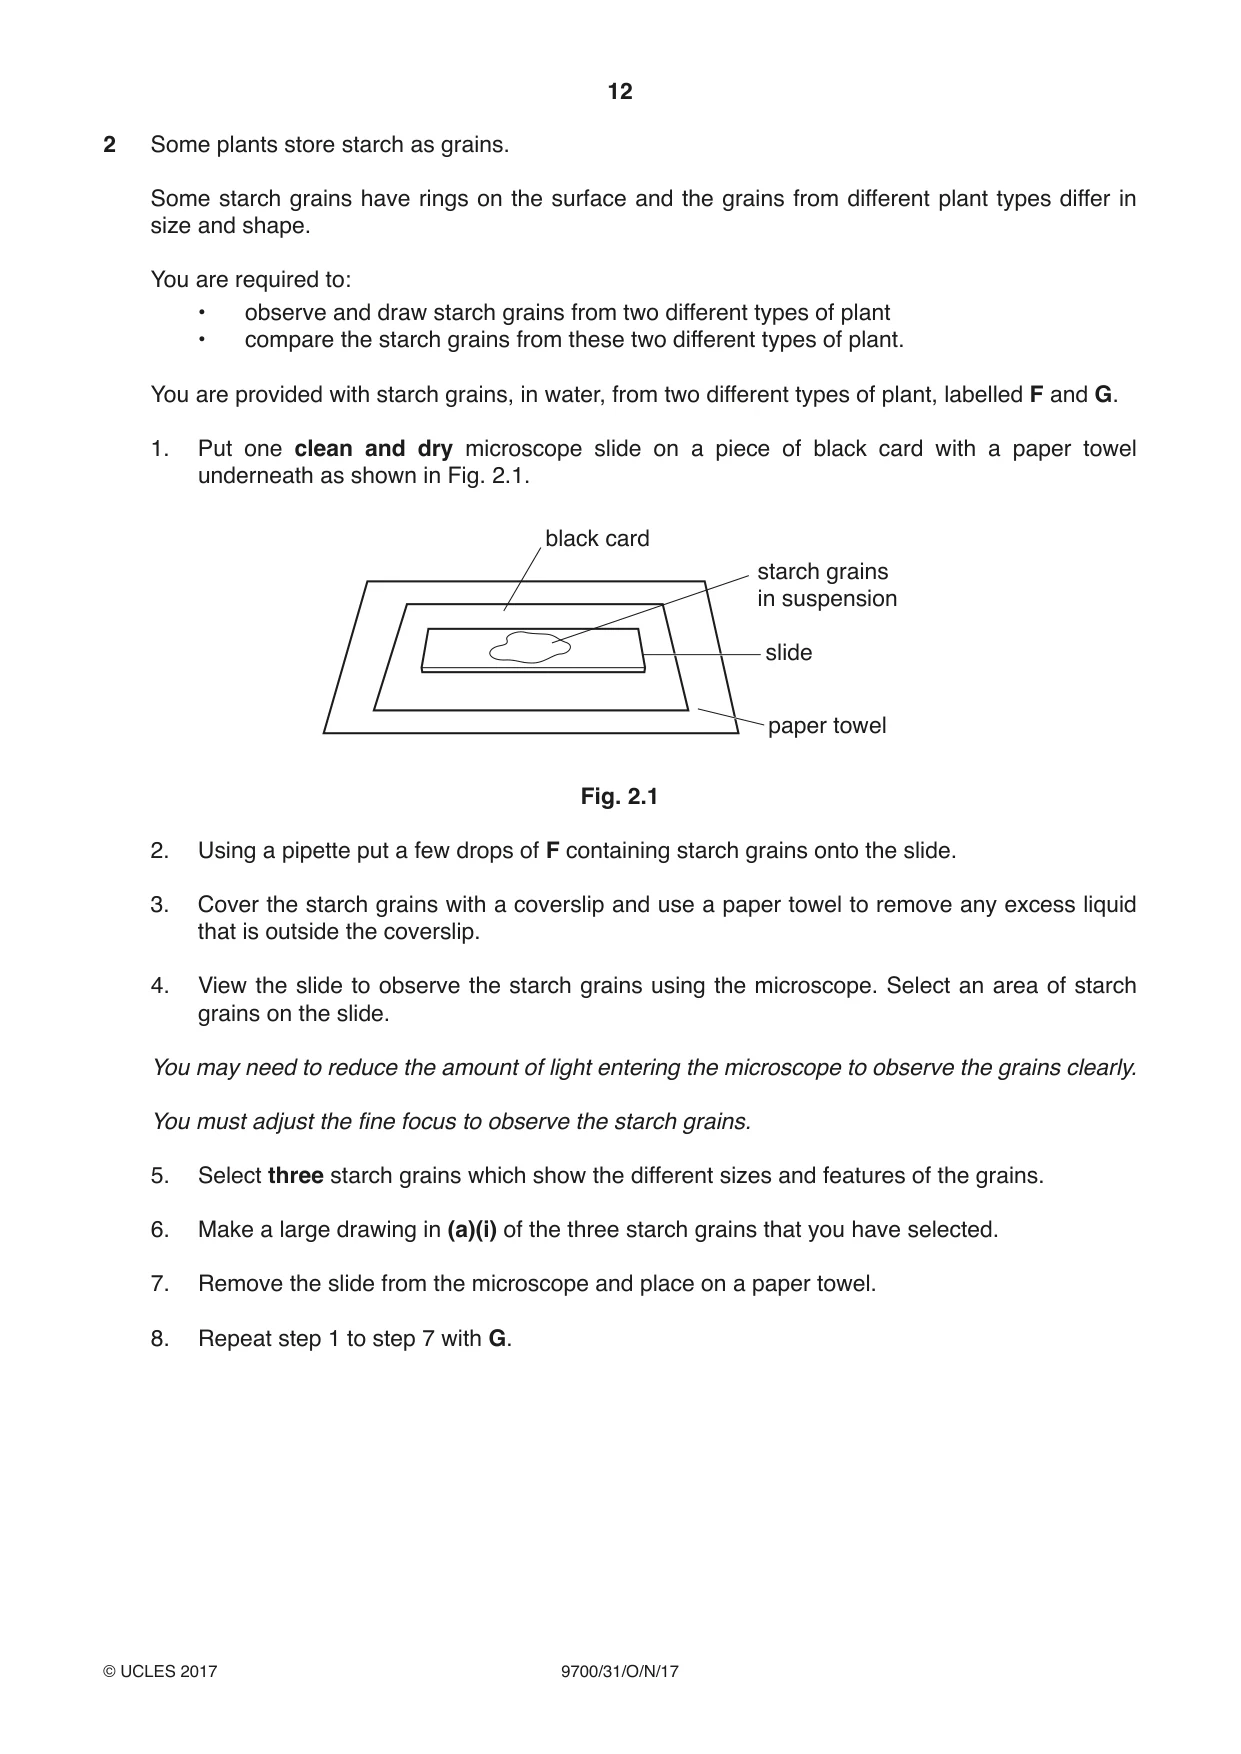
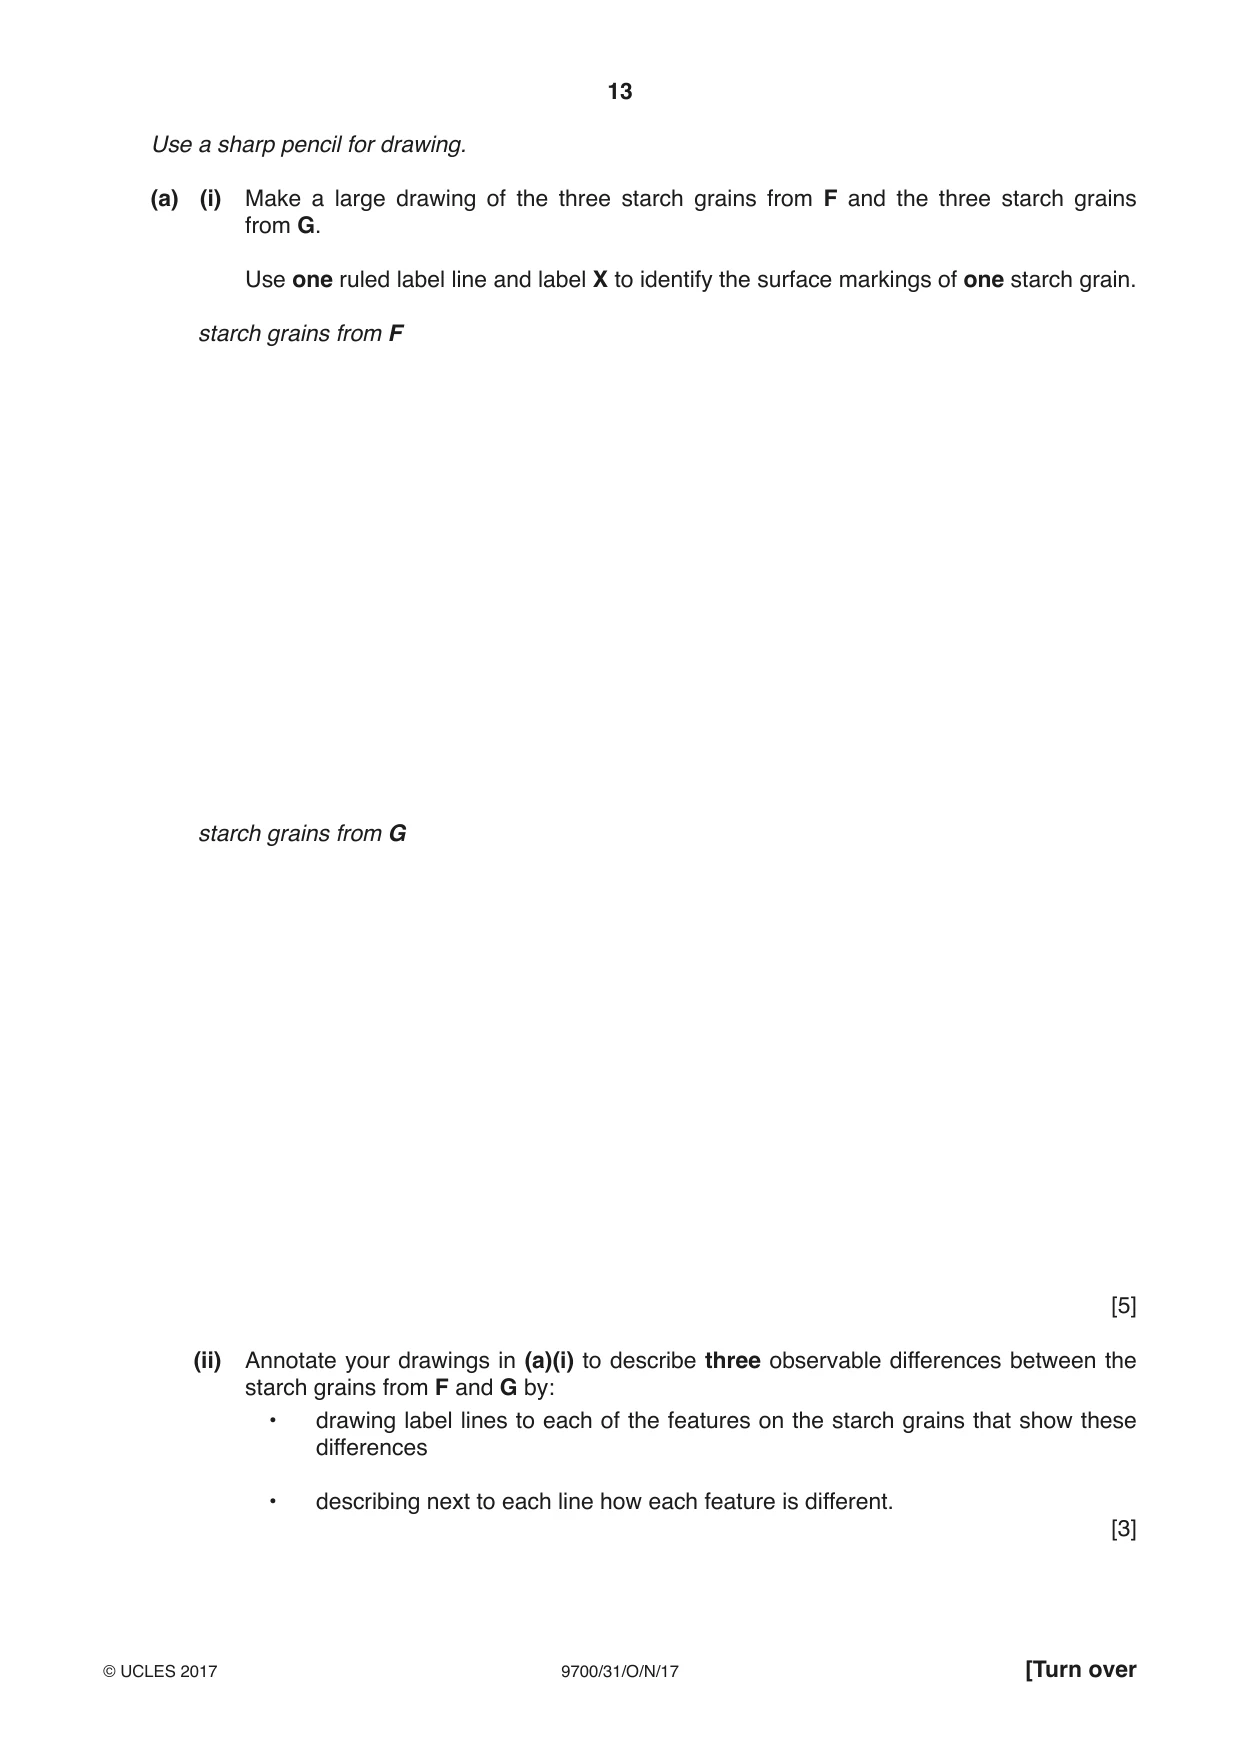
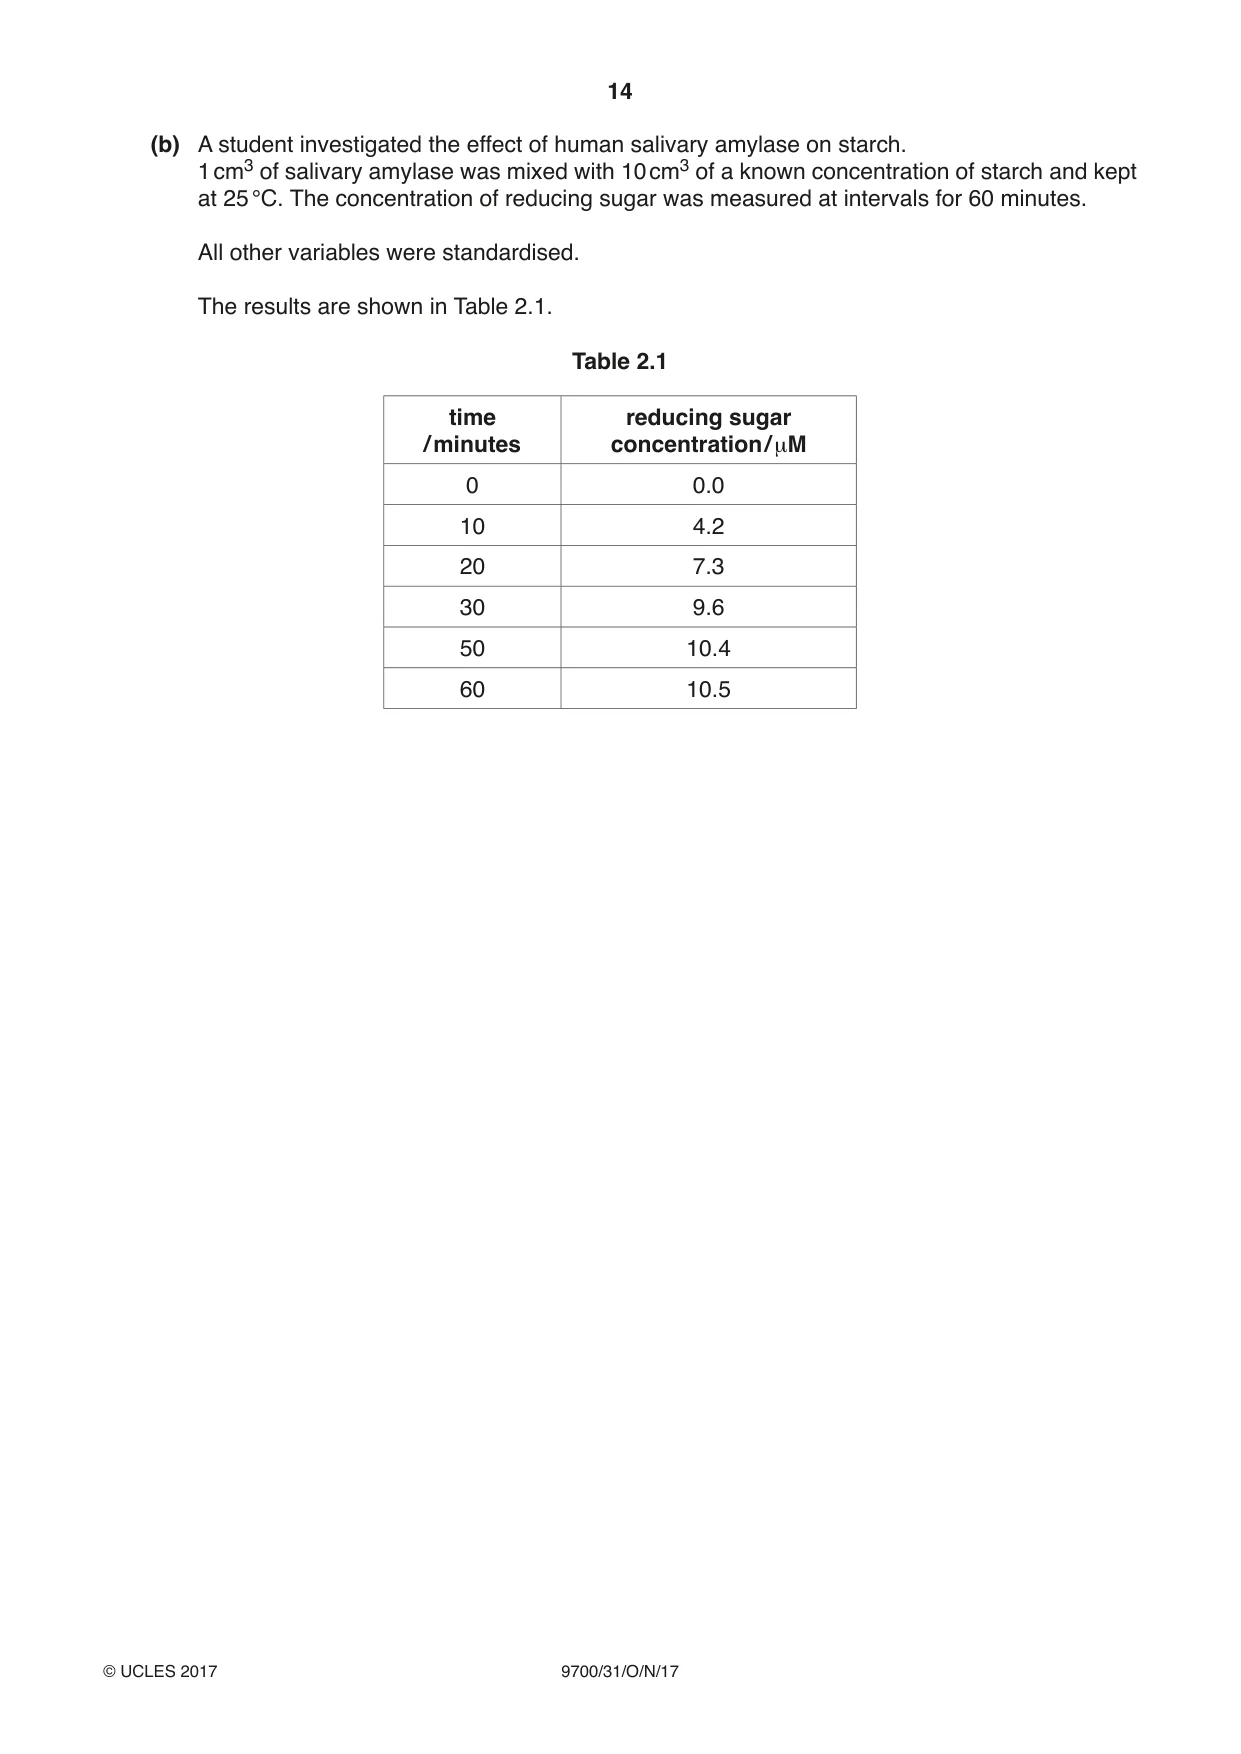
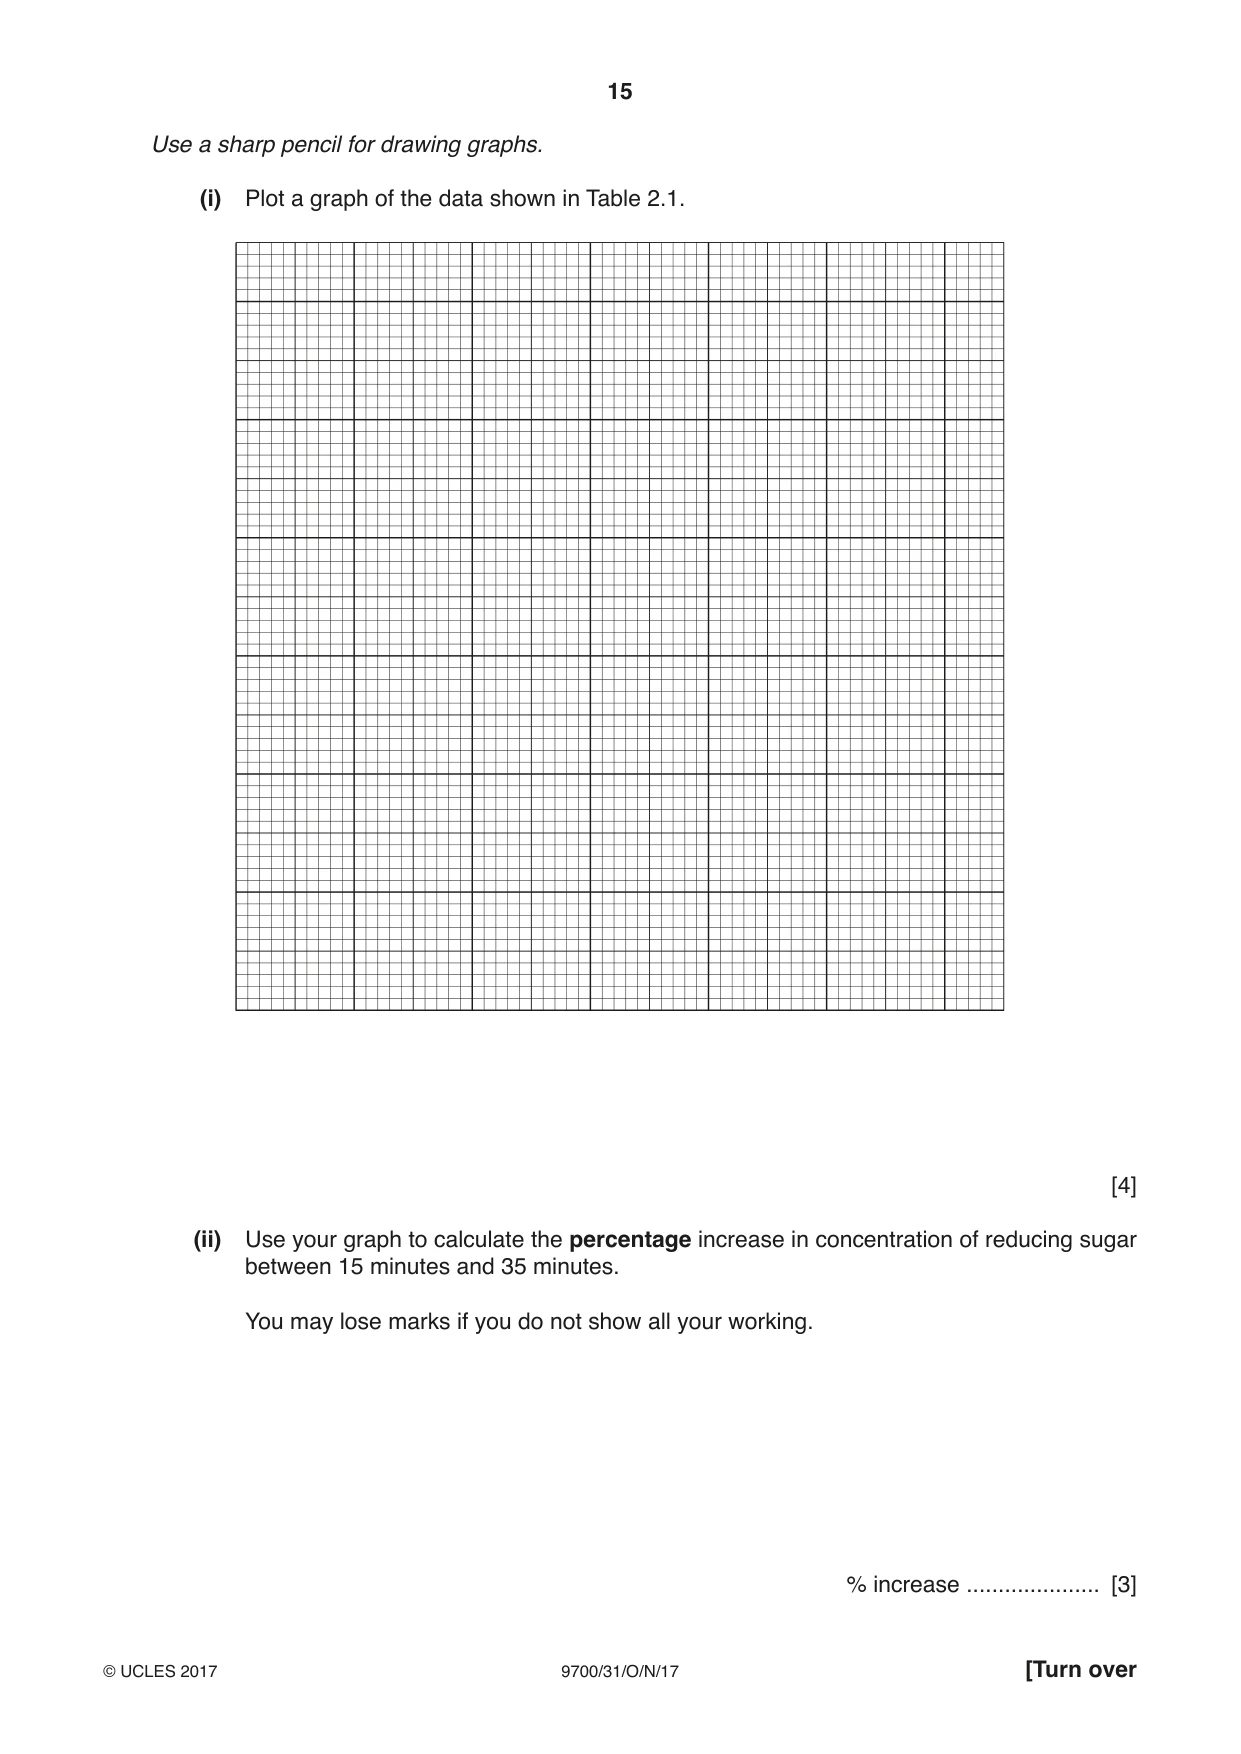
2 Some plants store starch as grains. Some starch grains have rings on the surface and the grains from different plant types differ in size and shape. You are required to: • observe and draw starch grains from two different types of plant • compare the starch grains from these two different types of plant. You are provided with starch grains, in water, from two different types of plant, labelled F and G. 1. Put one clean and dry microscope slide on a piece of black card with a paper towel underneath as shown in Fig. 2.1. black card starch grains in suspension slide paper towel Fig. 2.1 2. Using a pipette put a few drops of F containing starch grains onto the slide. 3. Cover the starch grains with a coverslip and use a paper towel to remove any excess liquid that is outside the coverslip. 4. View the slide to observe the starch grains using the microscope. Select an area of starch grains on the slide. You may need to reduce the amount of light entering the microscope to observe the grains clearly. You must adjust the fine focus to observe the starch grains. 5. Select three starch grains which show the different sizes and features of the grains. 6. Make a large drawing in (a)(i) of the three starch grains that you have selected. 7. Remove the slide from the microscope and place on a paper towel. 8. Repeat step 1 to step 7 with G. Use a sharp pencil for drawing. (a) (i) Make a large drawing of the three starch grains from F and the three starch grains from G. Use one ruled label line and label X to identify the surface markings of one starch grain. starch grains from F starch grains from G [5] (ii) Annotate your drawings in (a)(i) to describe three observable differences between the starch grains from F and G by: • drawing label lines to each of the features on the starch grains that show these differences • describing next to each line how each feature is different. [3] (b) A student investigated the effect of human salivary amylase on starch. 1 cm3 of salivary amylase was mixed with 10 cm3 of a known concentration of starch and kept at 25 °C. The concentration of reducing sugar was measured at intervals for 60 minutes. All other variables were standardised. The results are shown in Table 2.1. Table 2.1 time reducing sugar / minutes concentration / µM 0 0.0 10 4.2 20 7.3 30 9.6 50 10.4 60 10.5
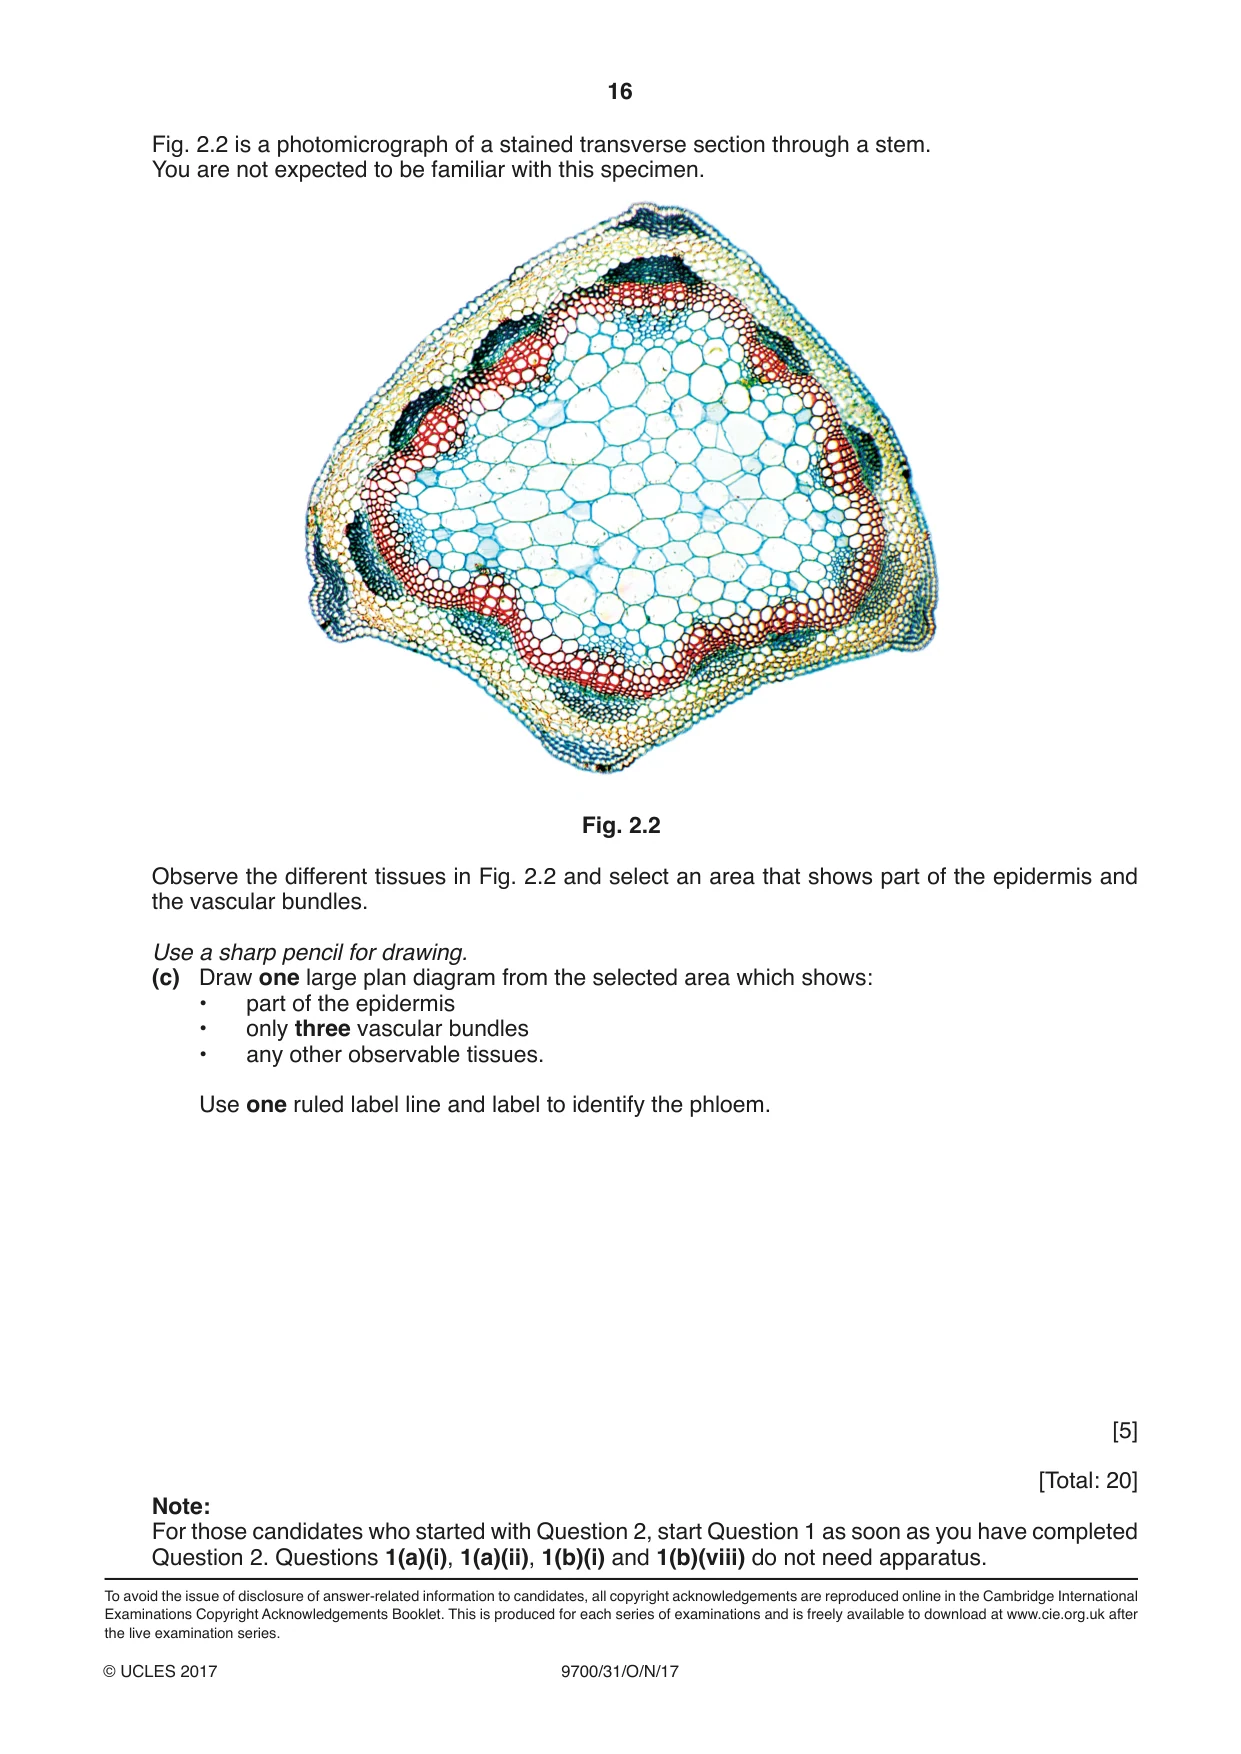
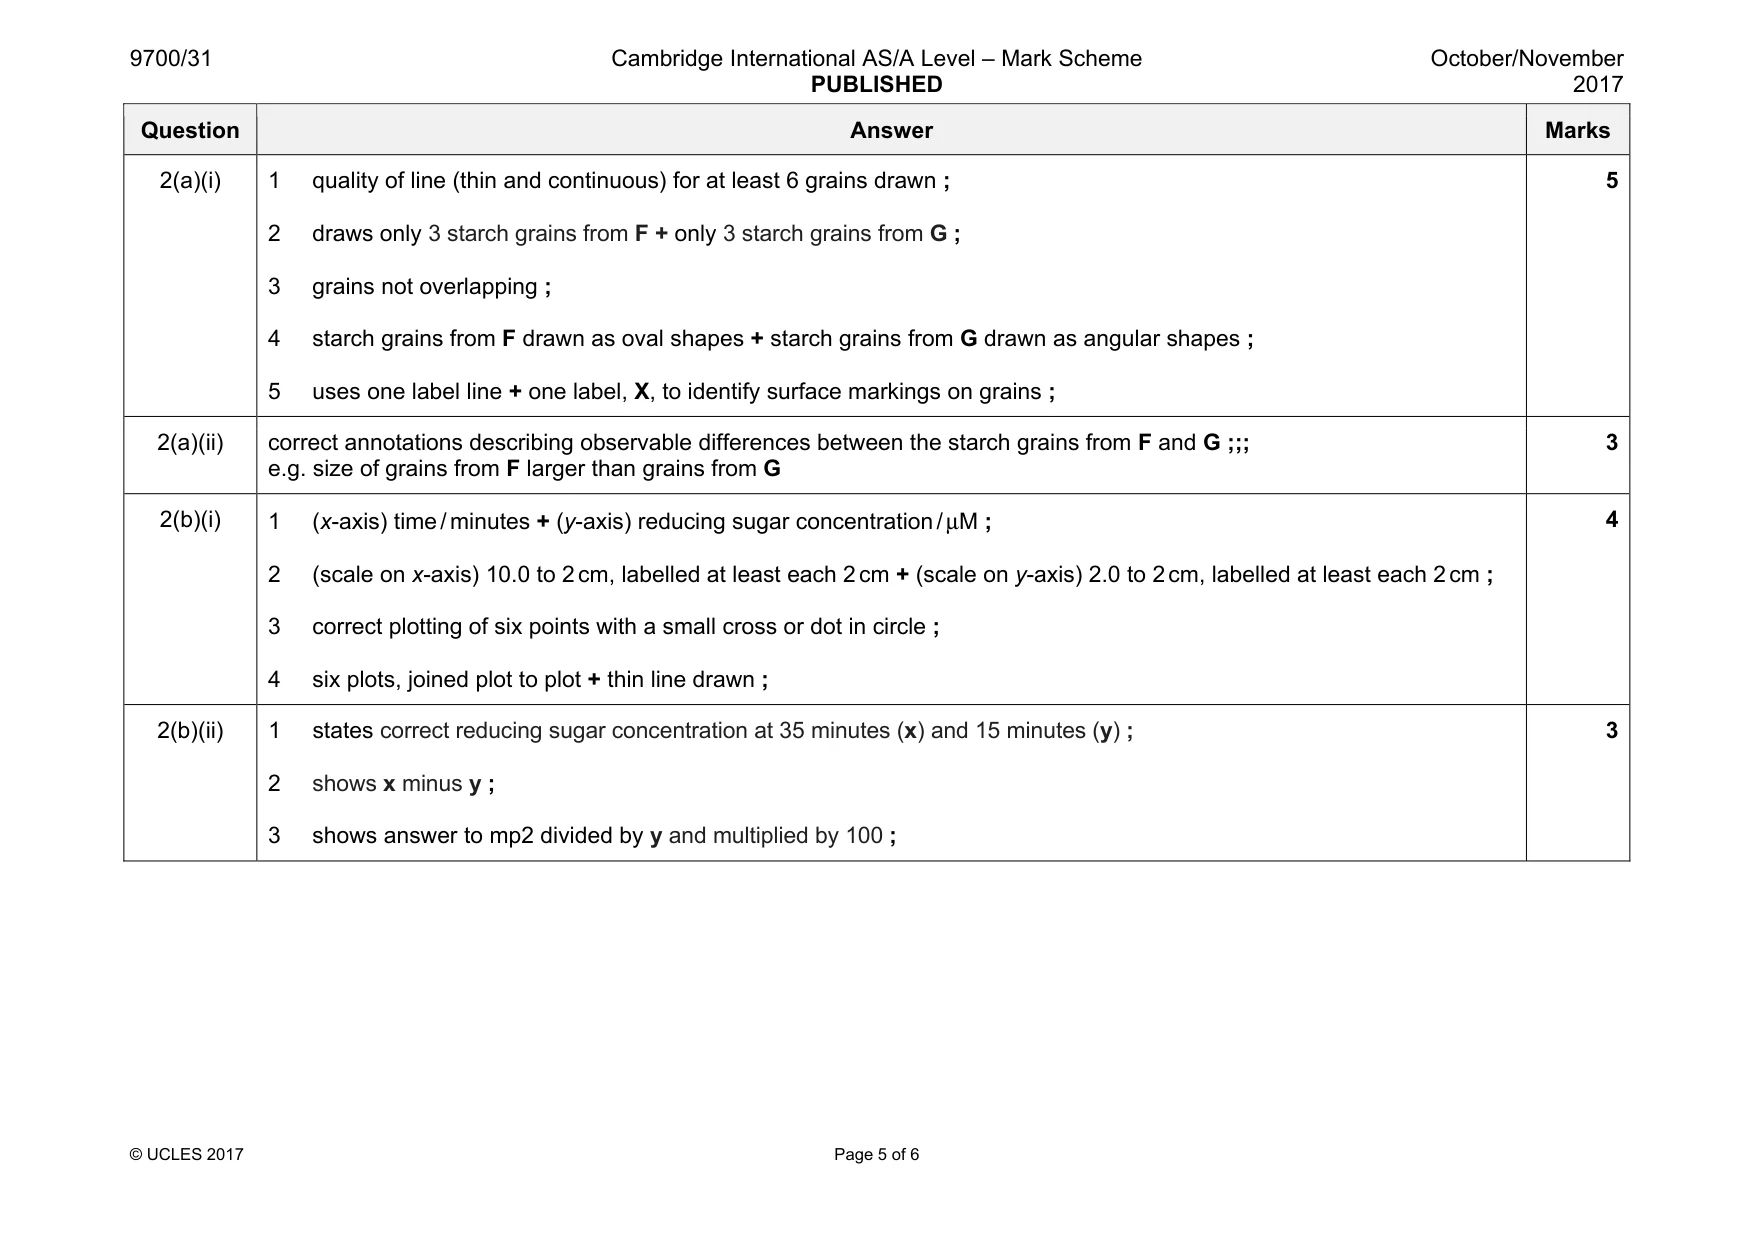
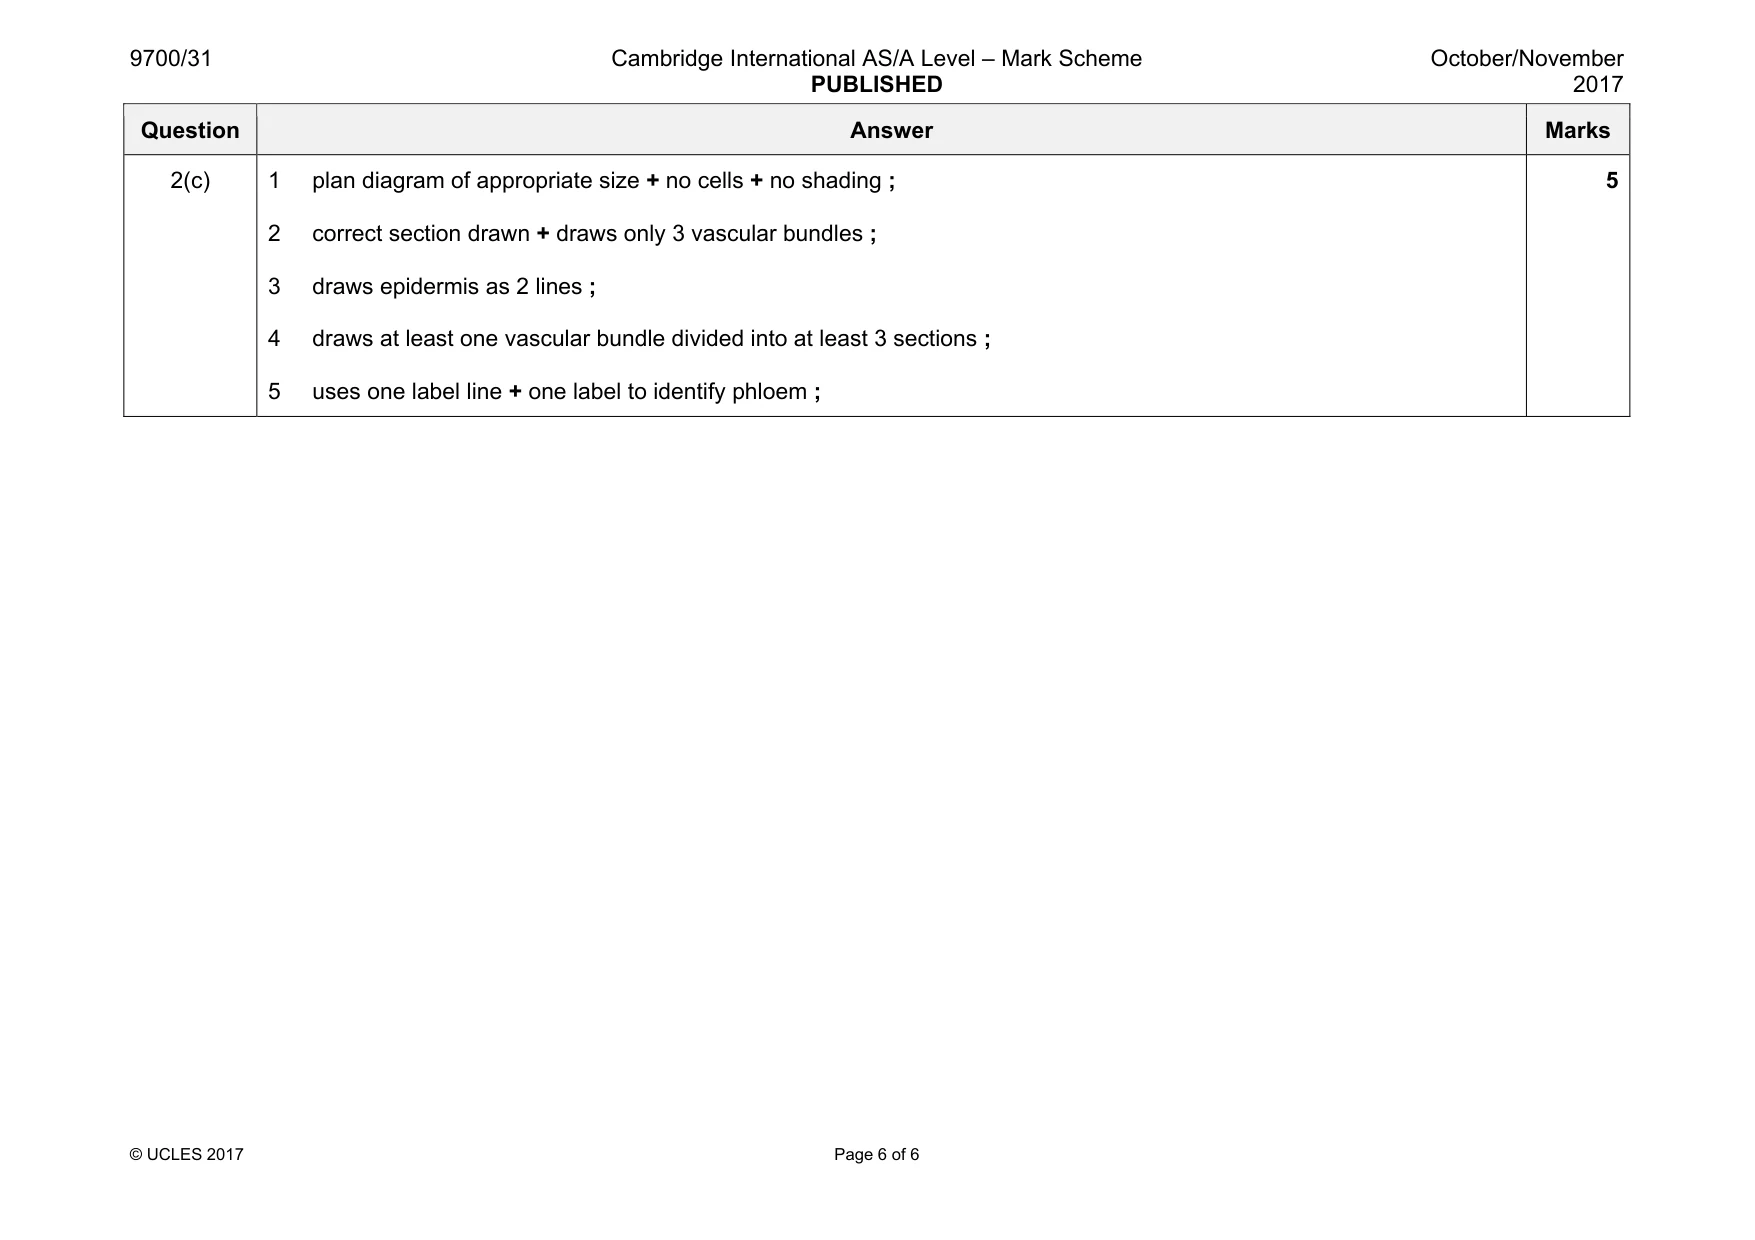
Mark scheme: 2(a)(i) 1 quality of line (thin and continuous) for at least 6 grains drawn ; 2 draws only 3 starch grains from F + only 3 starch grains from G ; 3 grains not overlapping ; 4 starch grains from F drawn as oval shapes + starch grains from G drawn as angular shapes ; 5 uses one label line + one label, X, to identify surface markings on grains ; 5 2(a)(ii) correct annotations describing observable differences between the starch grains from F and G ;;; e.g. size of grains from F larger than grains from G 3 2(b)(i) 1 (x-axis) time / minutes + (y-axis) reducing sugar concentration / µM ; 2 (scale on x-axis) 10.0 to 2 cm, labelled at least each 2 cm + (scale on y-axis) 2.0 to 2 cm, labelled at least each 2 cm ; 3 correct plotting of six points with a small cross or dot in circle ; 4 six plots, joined plot to plot + thin line drawn ; 4 2(b)(ii) 1 states correct reducing sugar concentration at 35 minutes (x) and 15 minutes (y) ; 2 shows x minus y ; 3 shows answer to mp2 divided by y and multiplied by 100 ; 3 Question Answer Marks 2(c) 1 plan diagram of appropriate size + no cells + no shading ; 2 correct section drawn + draws only 3 vascular bundles ; 3 draws epidermis as 2 lines ; 4 draws at least one vascular bundle divided into at least 3 sections ; 5 uses one label line + one label to identify phloem ; 5
What was in this paper
The subtopics covered by these 2 questions, and how many questions each got. Open one in a new tab to see every Cambridge question on it.
What you needed in this session
Cambridge’s own grade thresholds for 2017 Oct/Nov, Paper 3 · Variant 1. A higher threshold means an easier paper — the bar moves with how the cohort did.