Cambridge A Level Biology 9700 — 2024 Oct/Nov Paper 3 · Variant 6
9700/36/O/N/24 · 2 questions · 40 marks · ≈45 min
The question paper and its mark scheme, free to read here and free to download. This is Cambridge’s own paper, exactly as it was sat.
Question paper16 pages


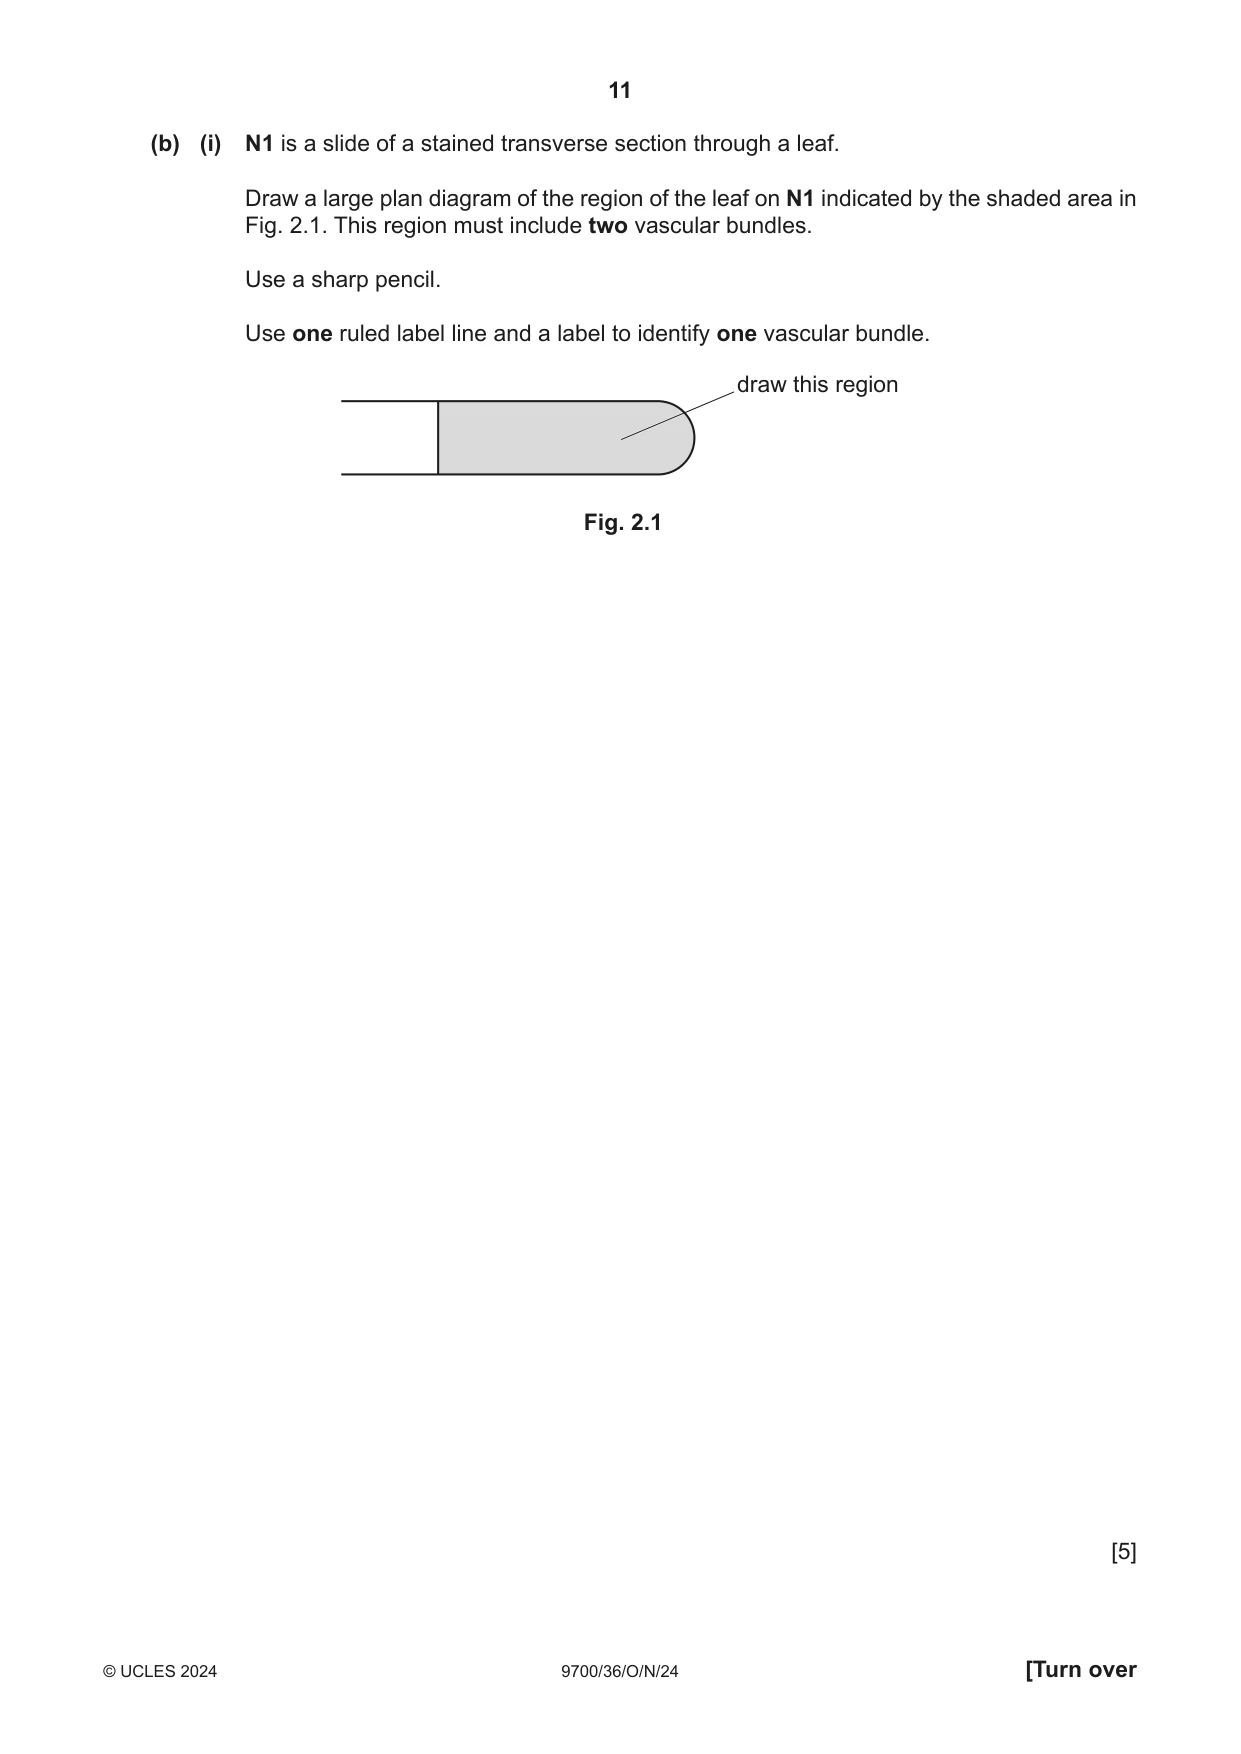
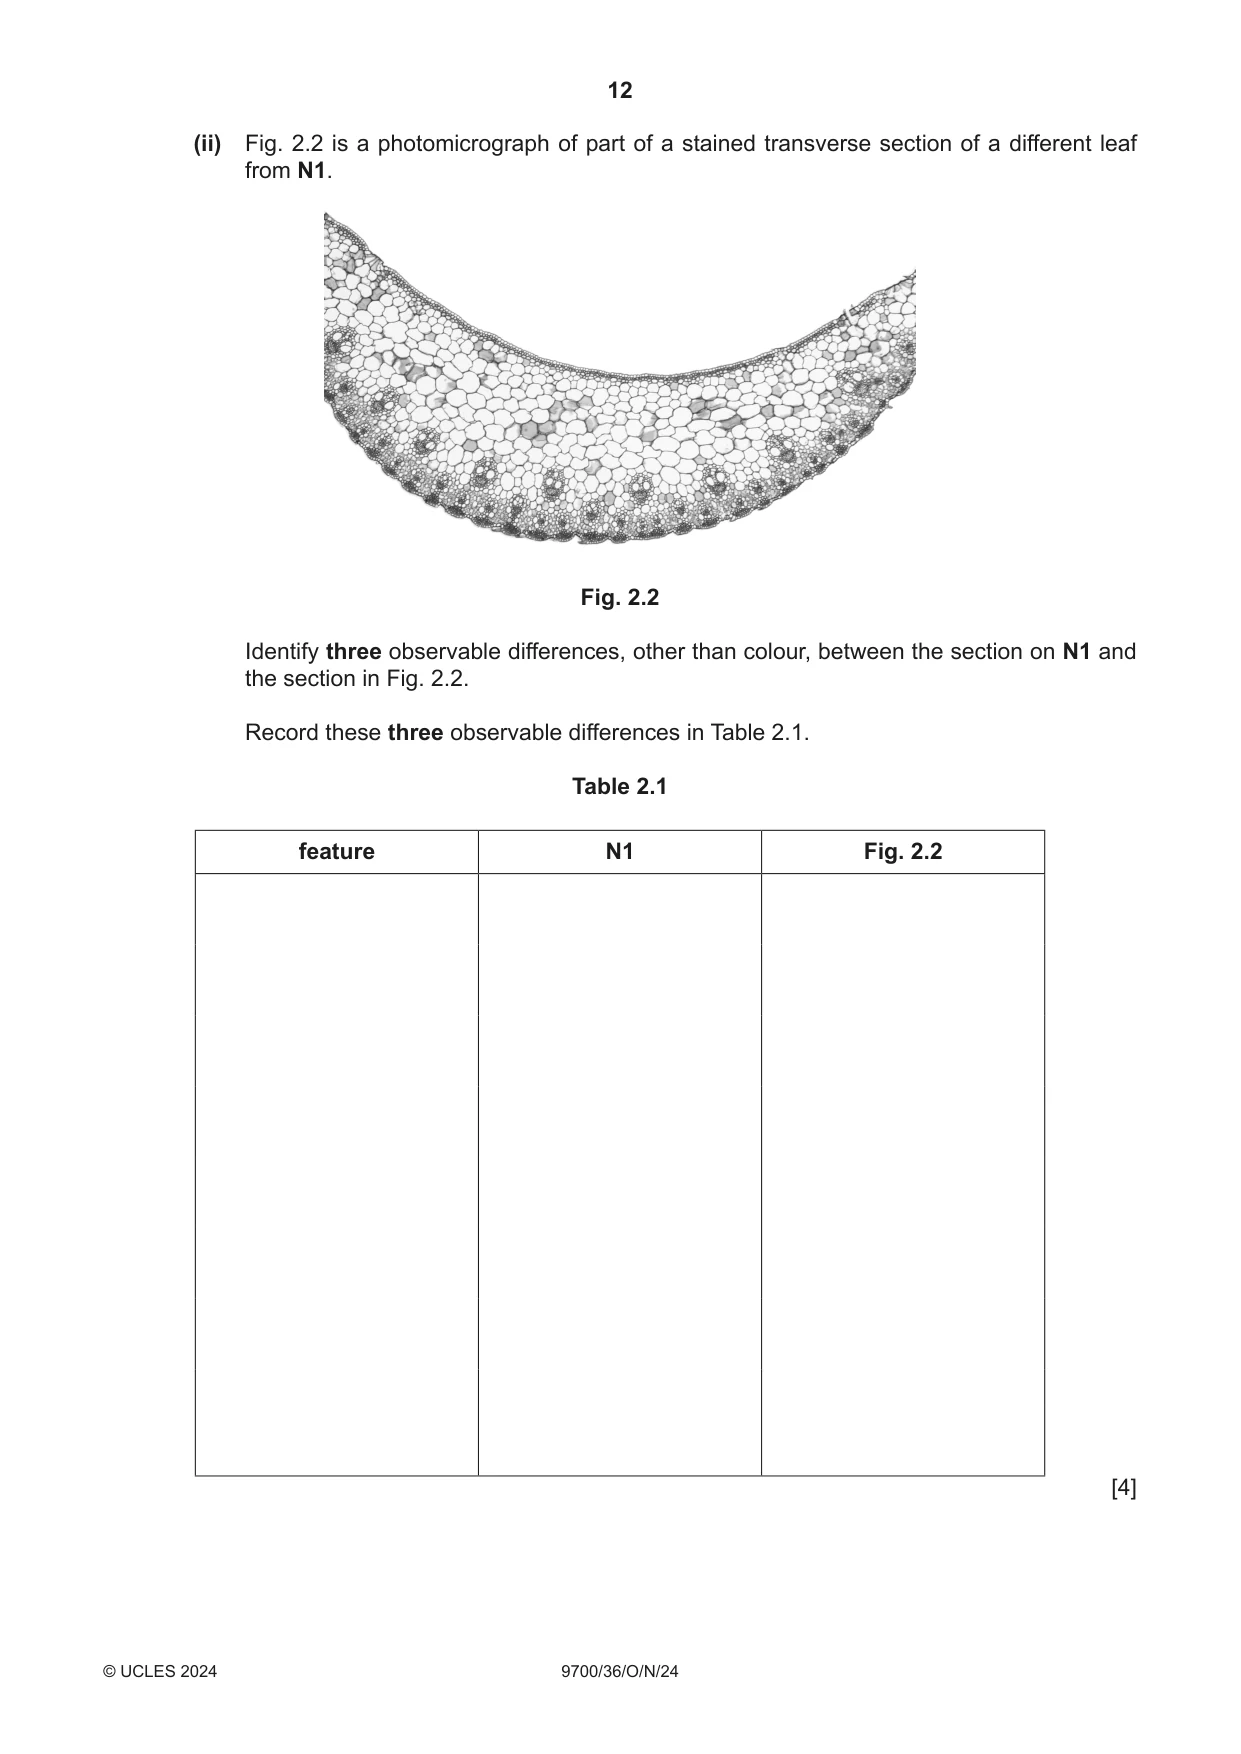
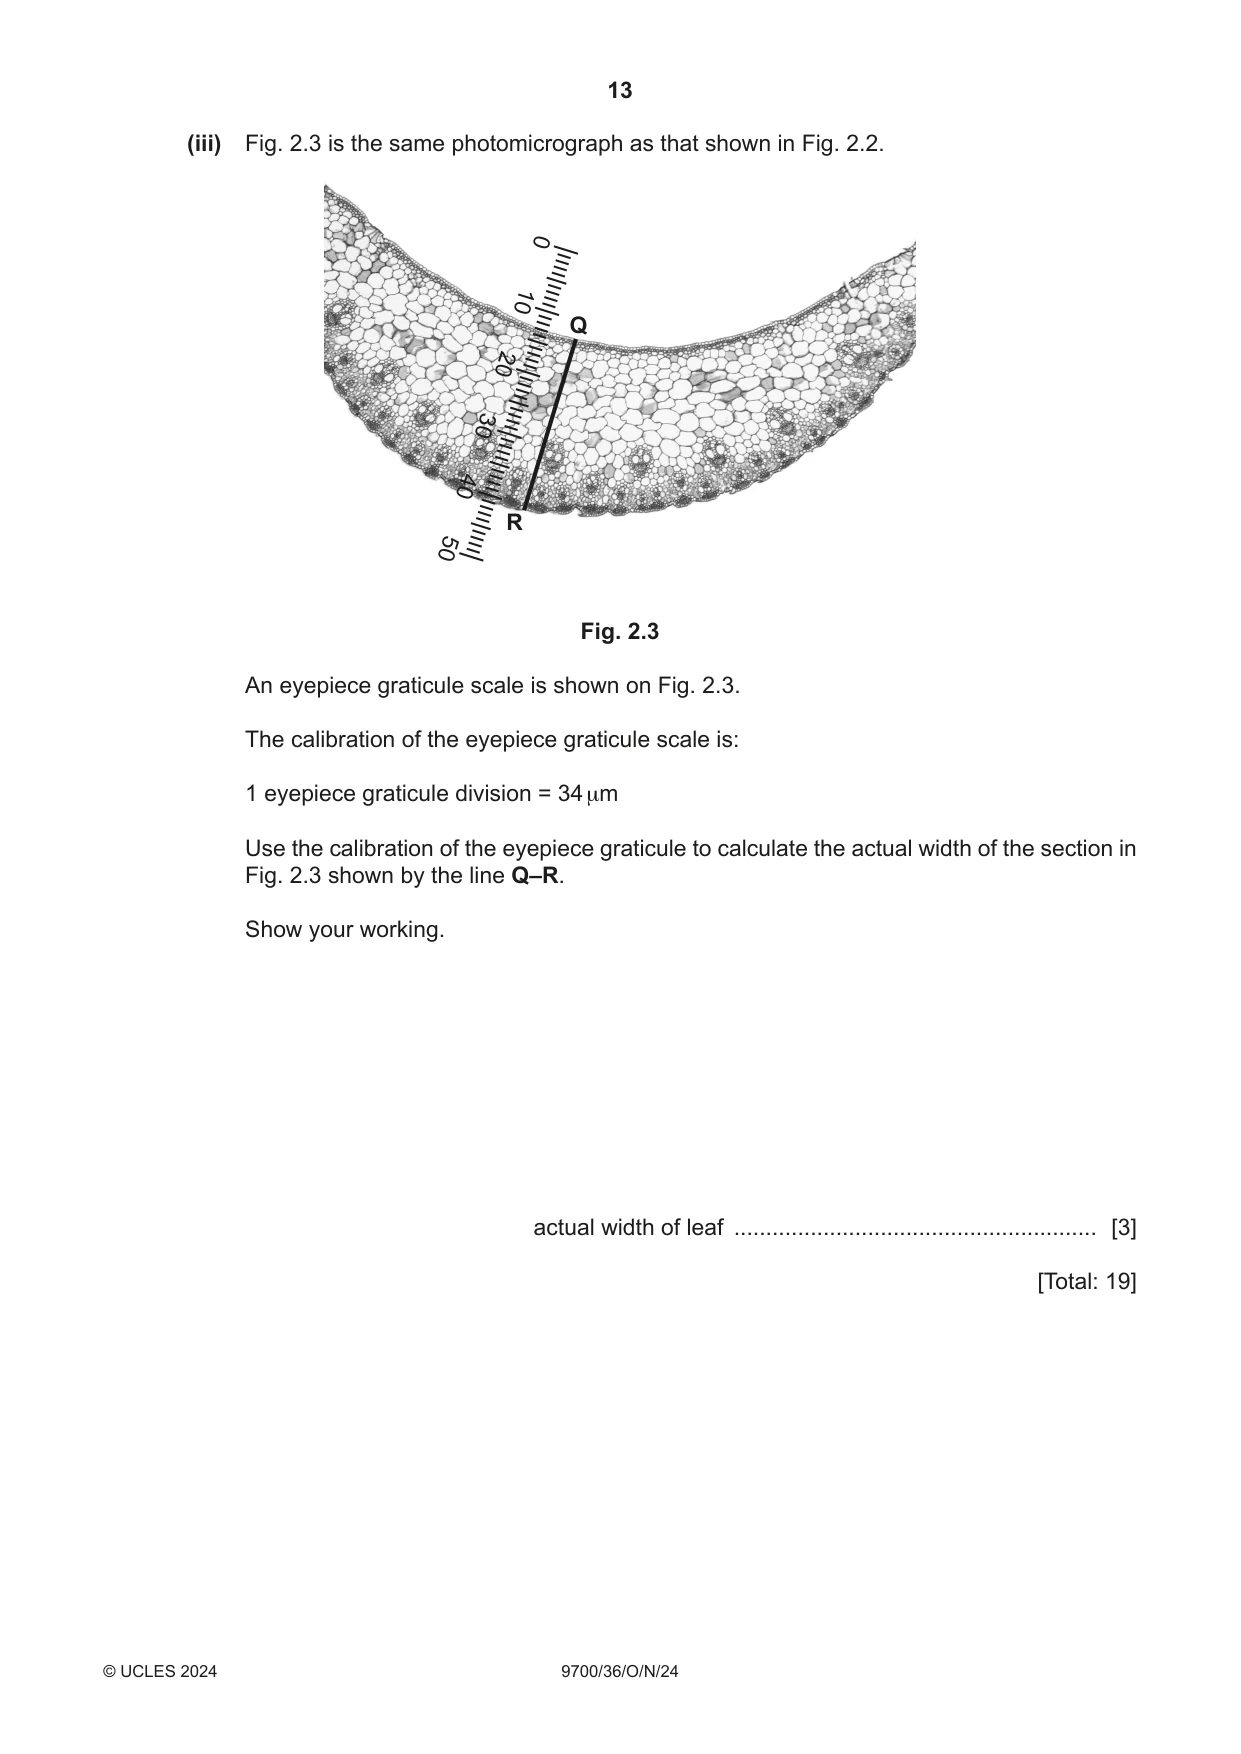



Mark scheme6 pages
Answers below. Sit the paper first if you are practising.
Questions as text
Q1 · Blood plasma contains soluble proteins such as albumin
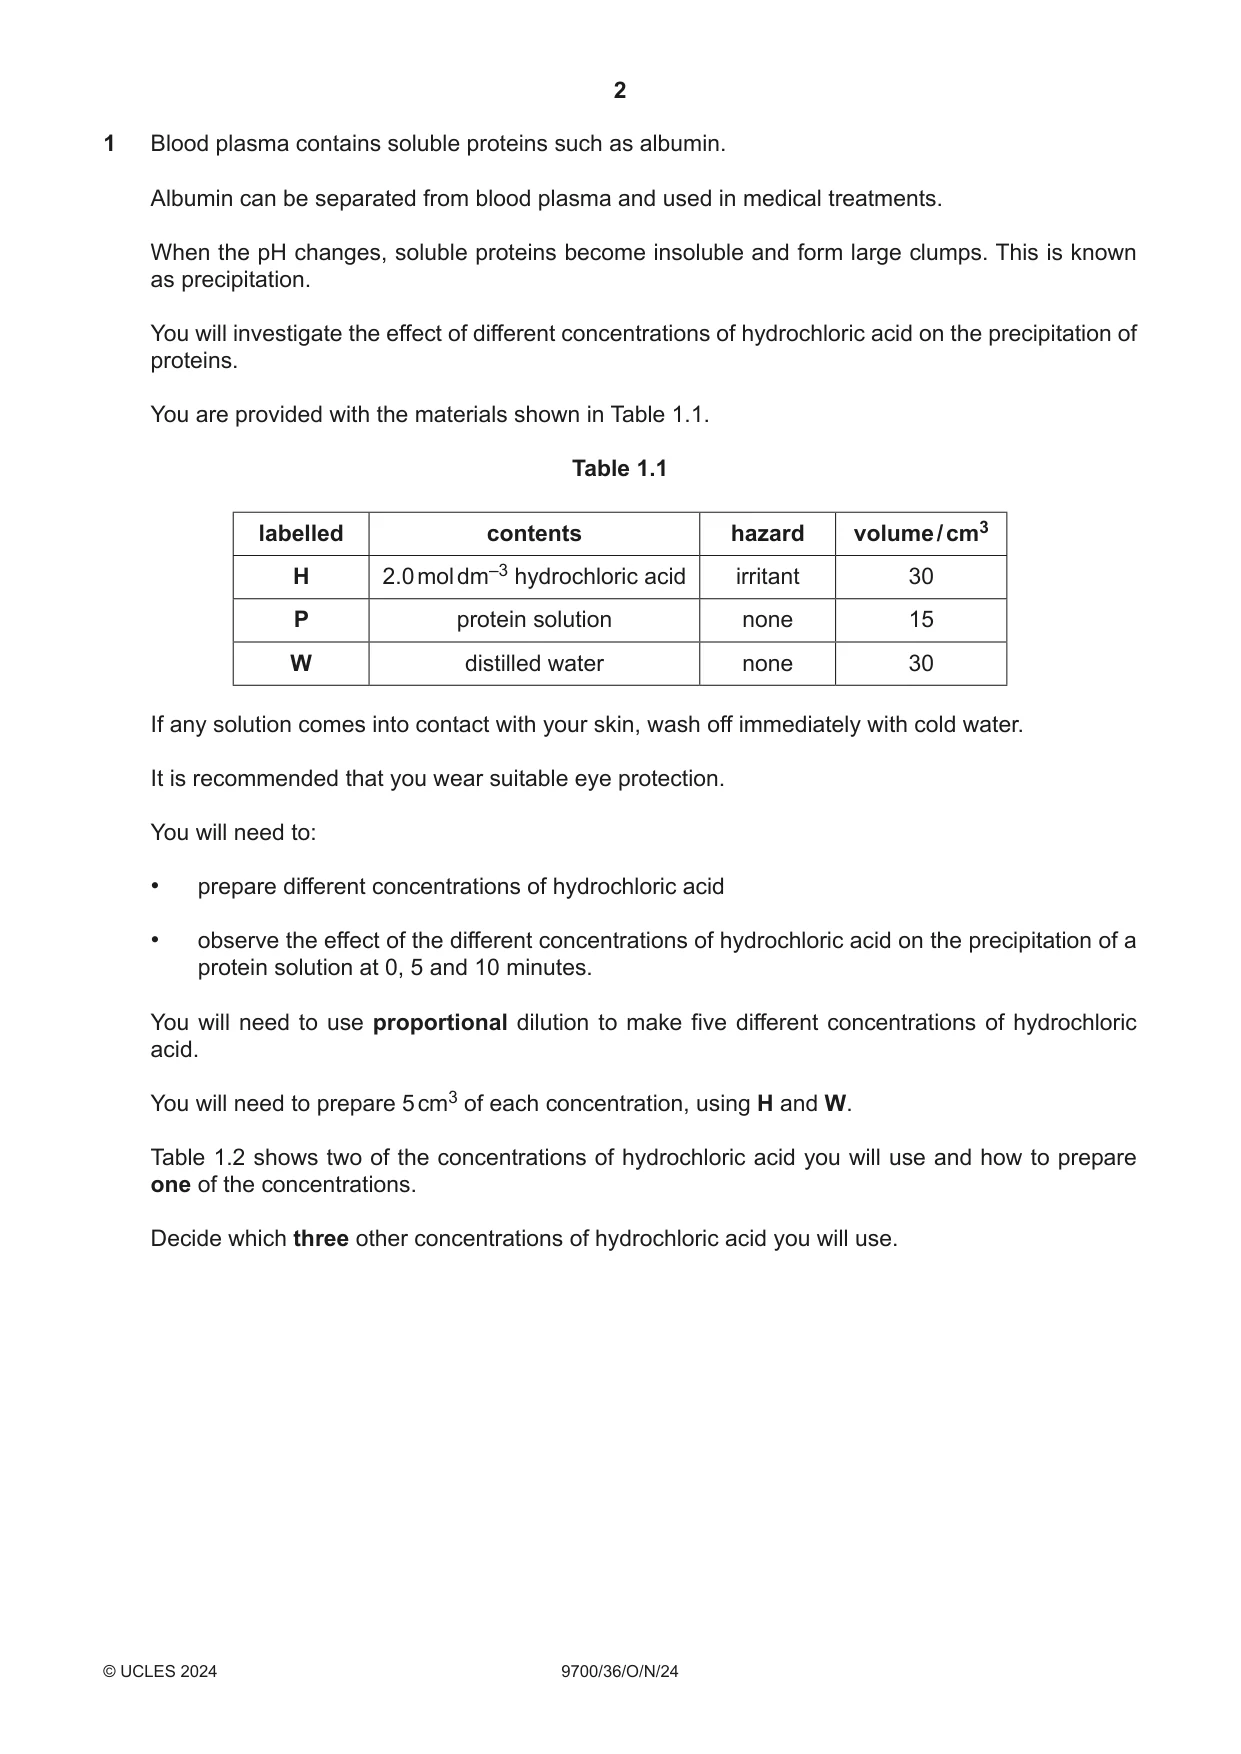
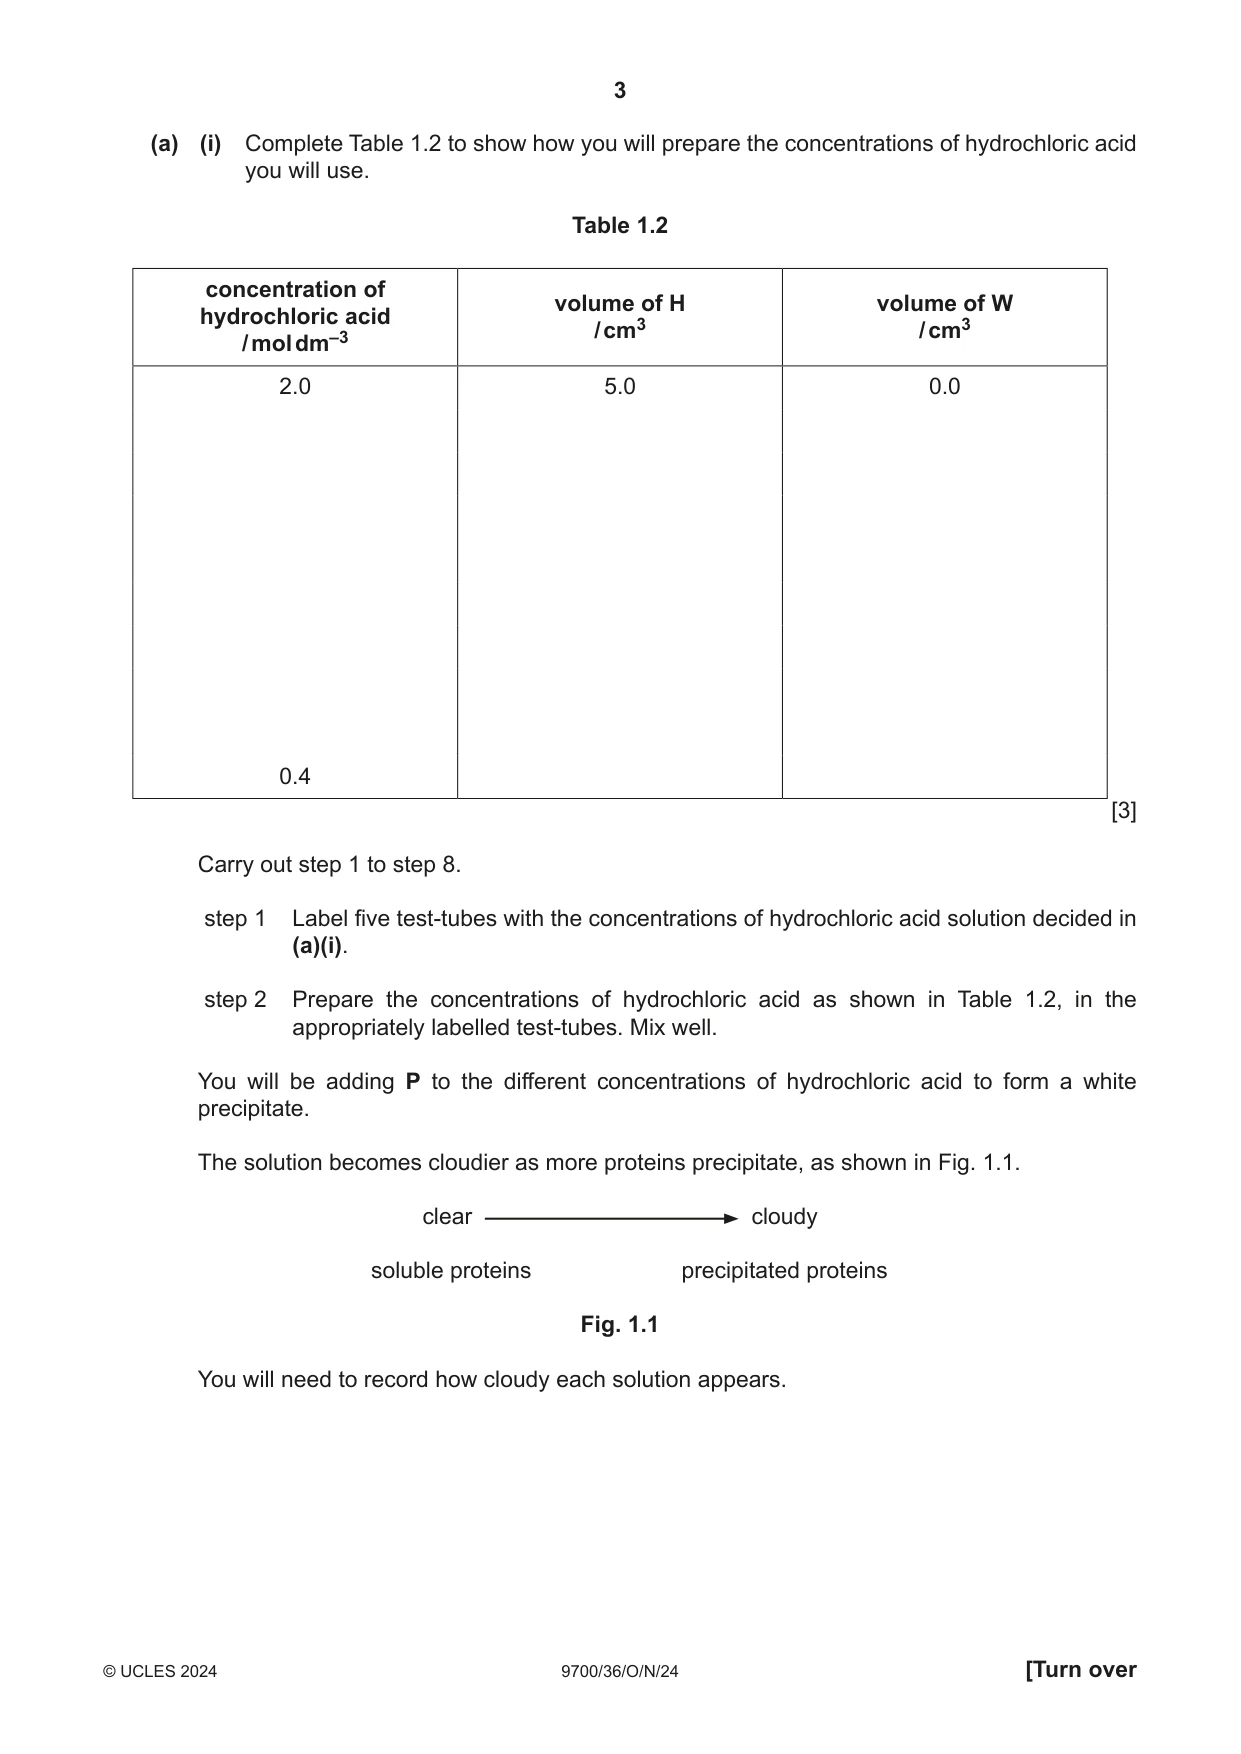
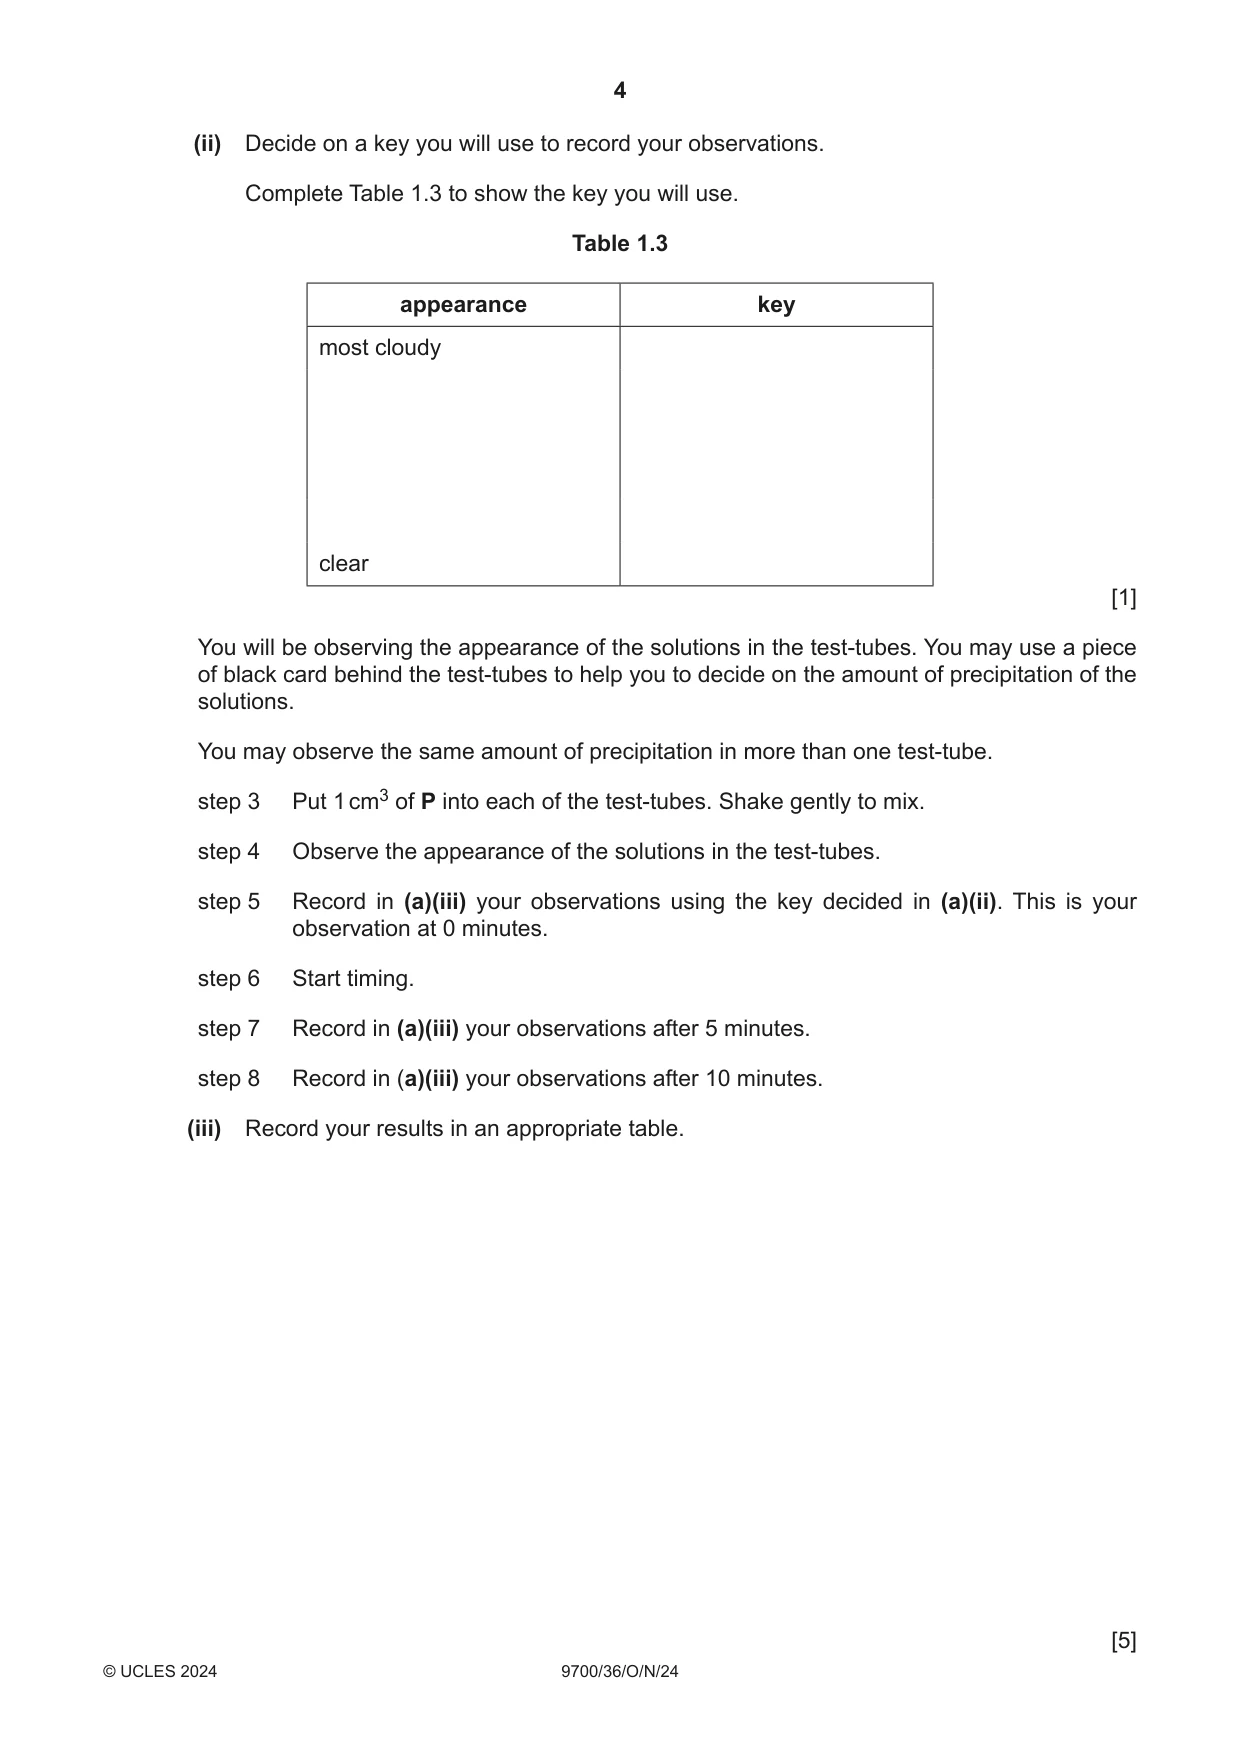
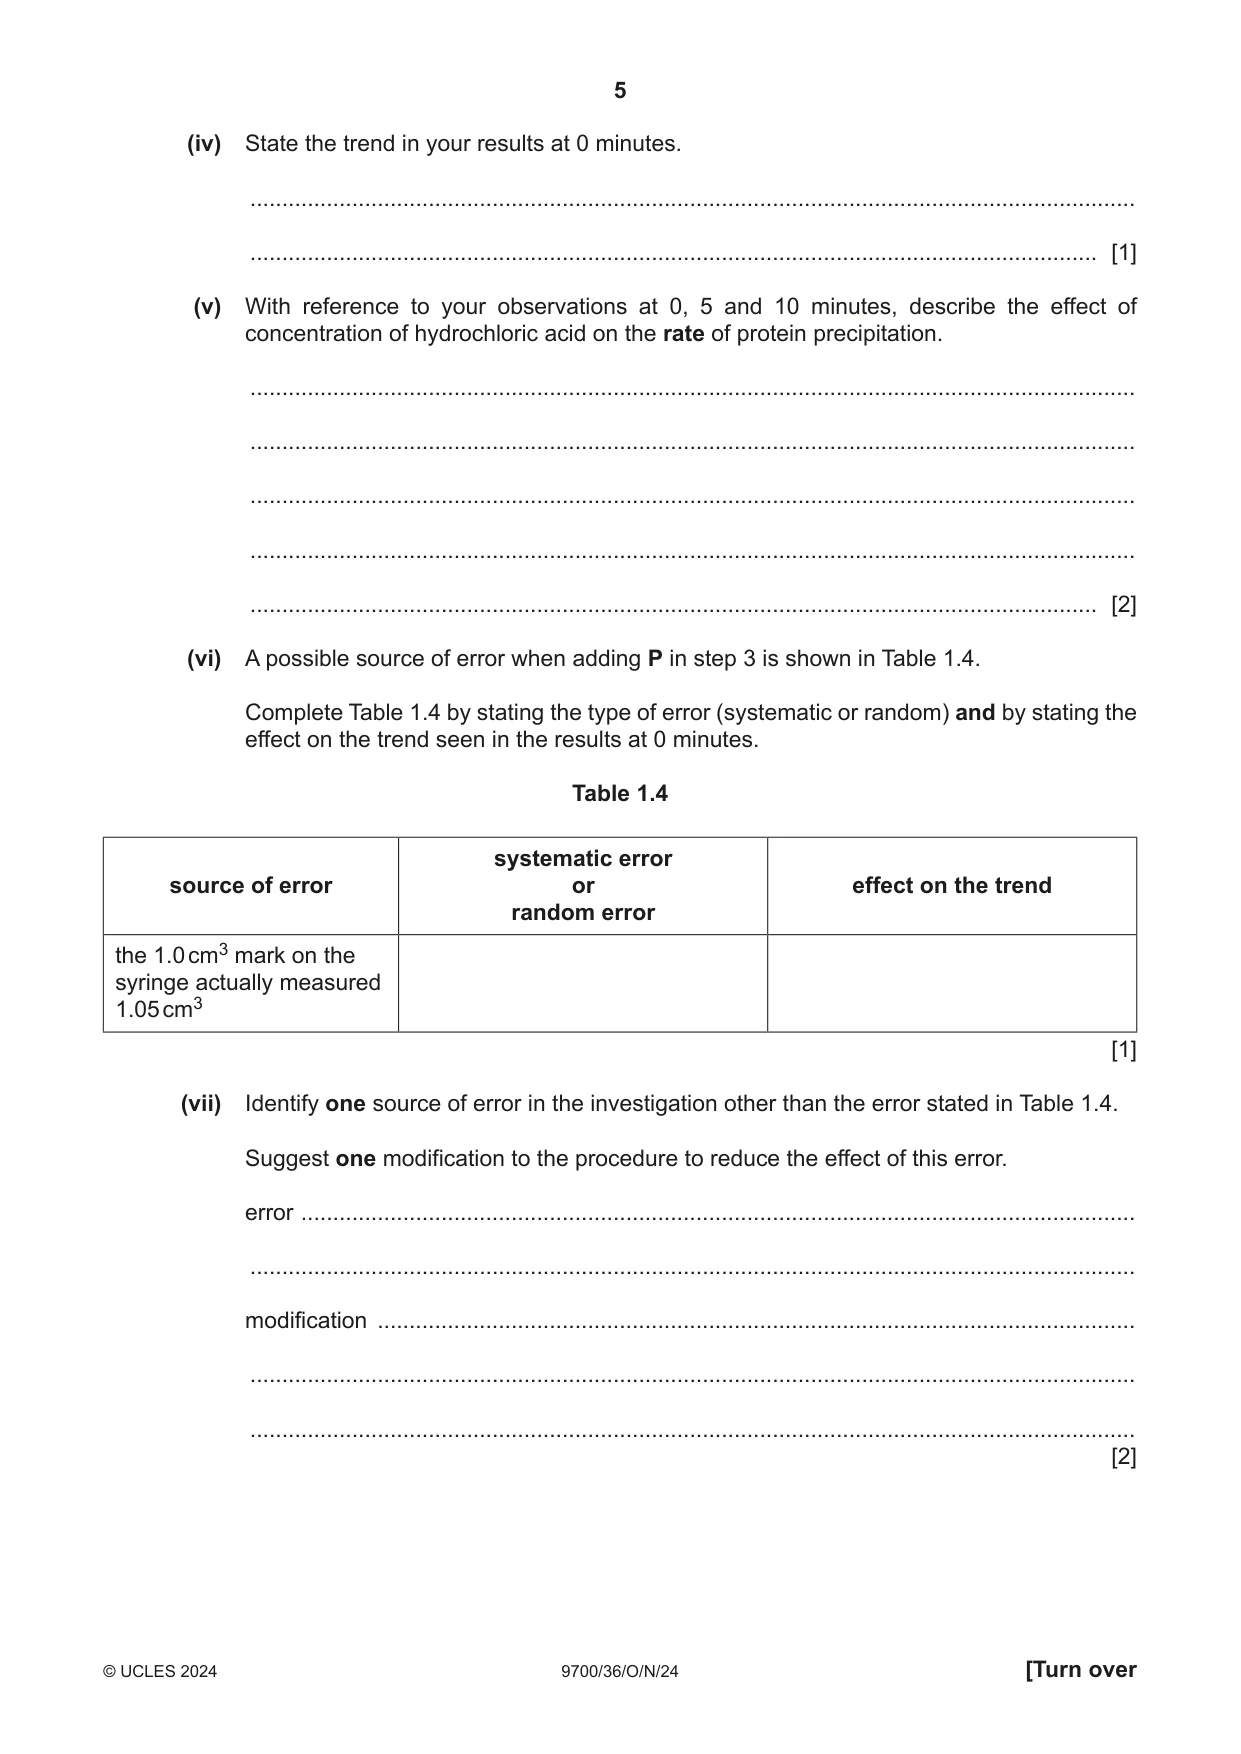
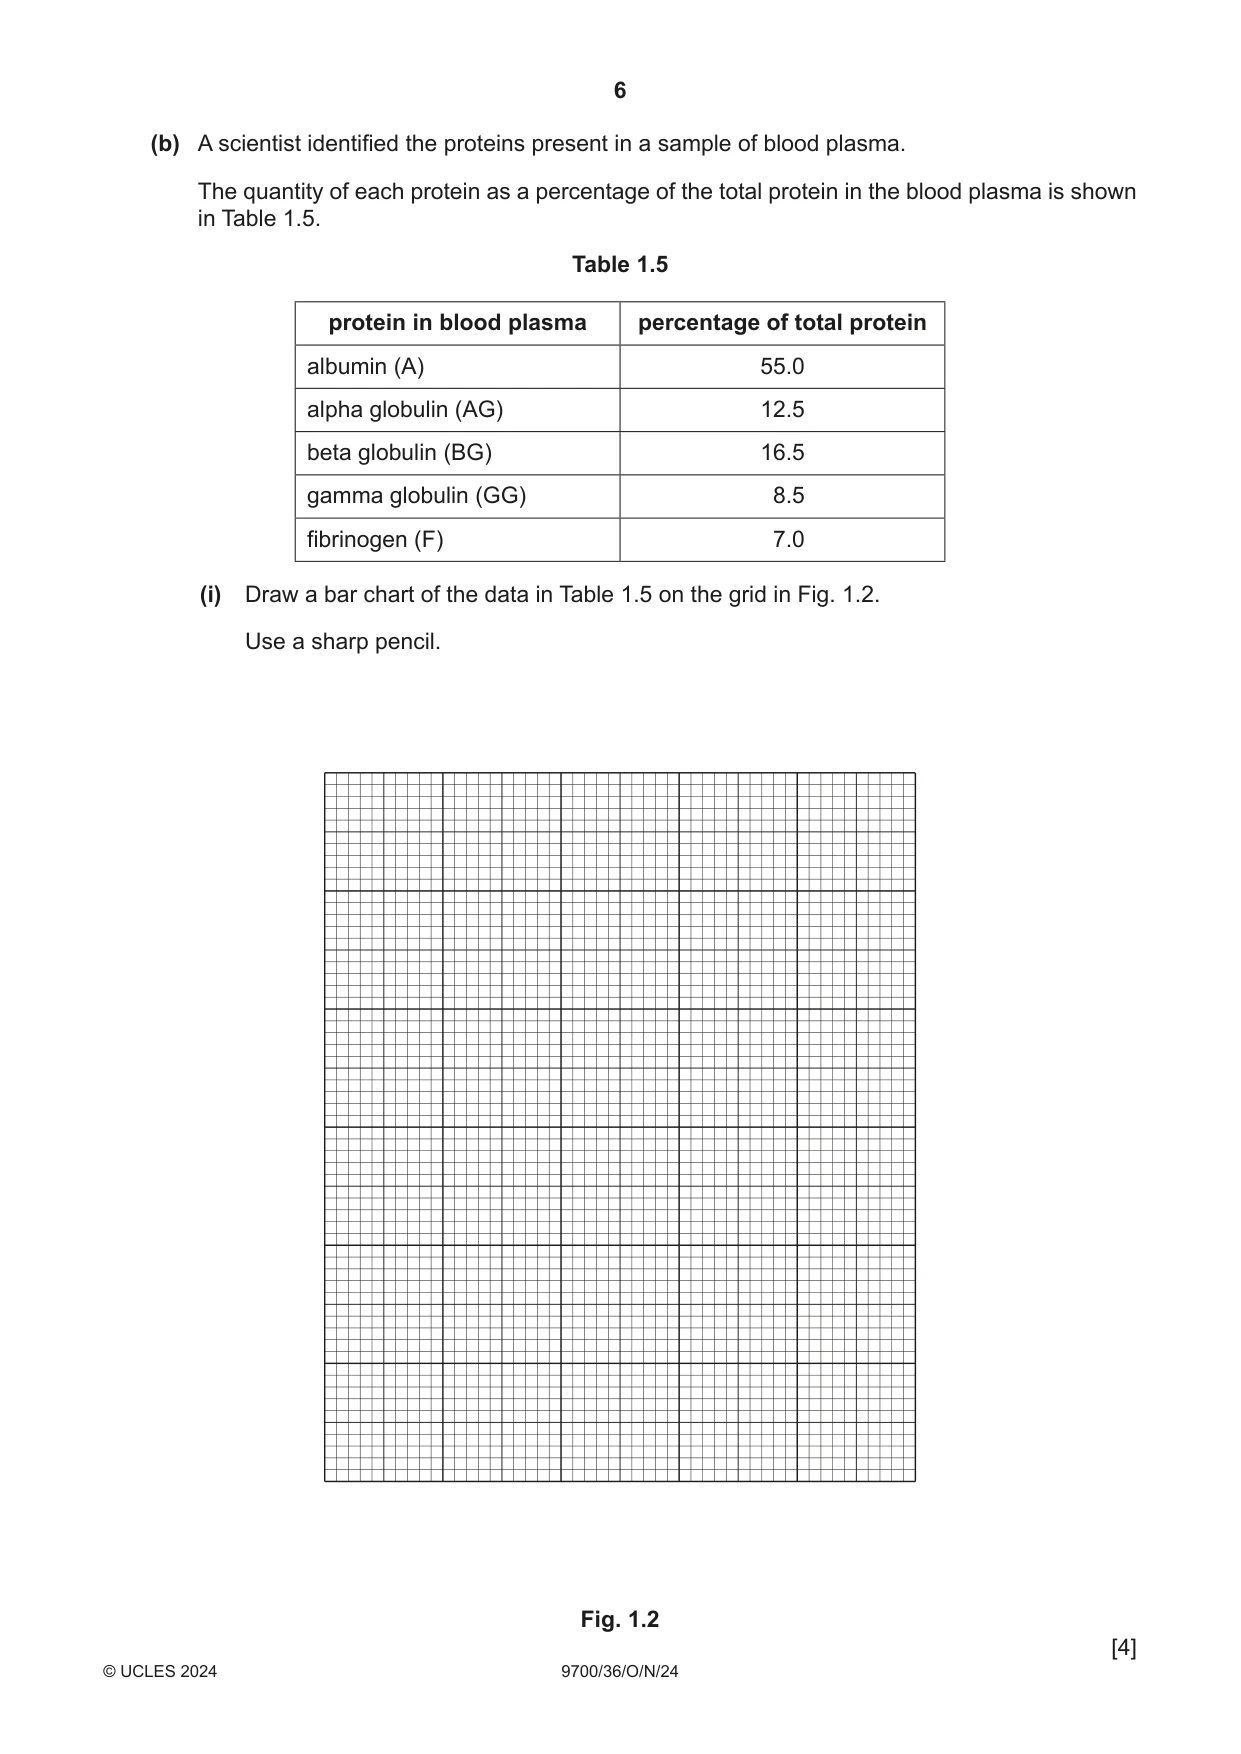
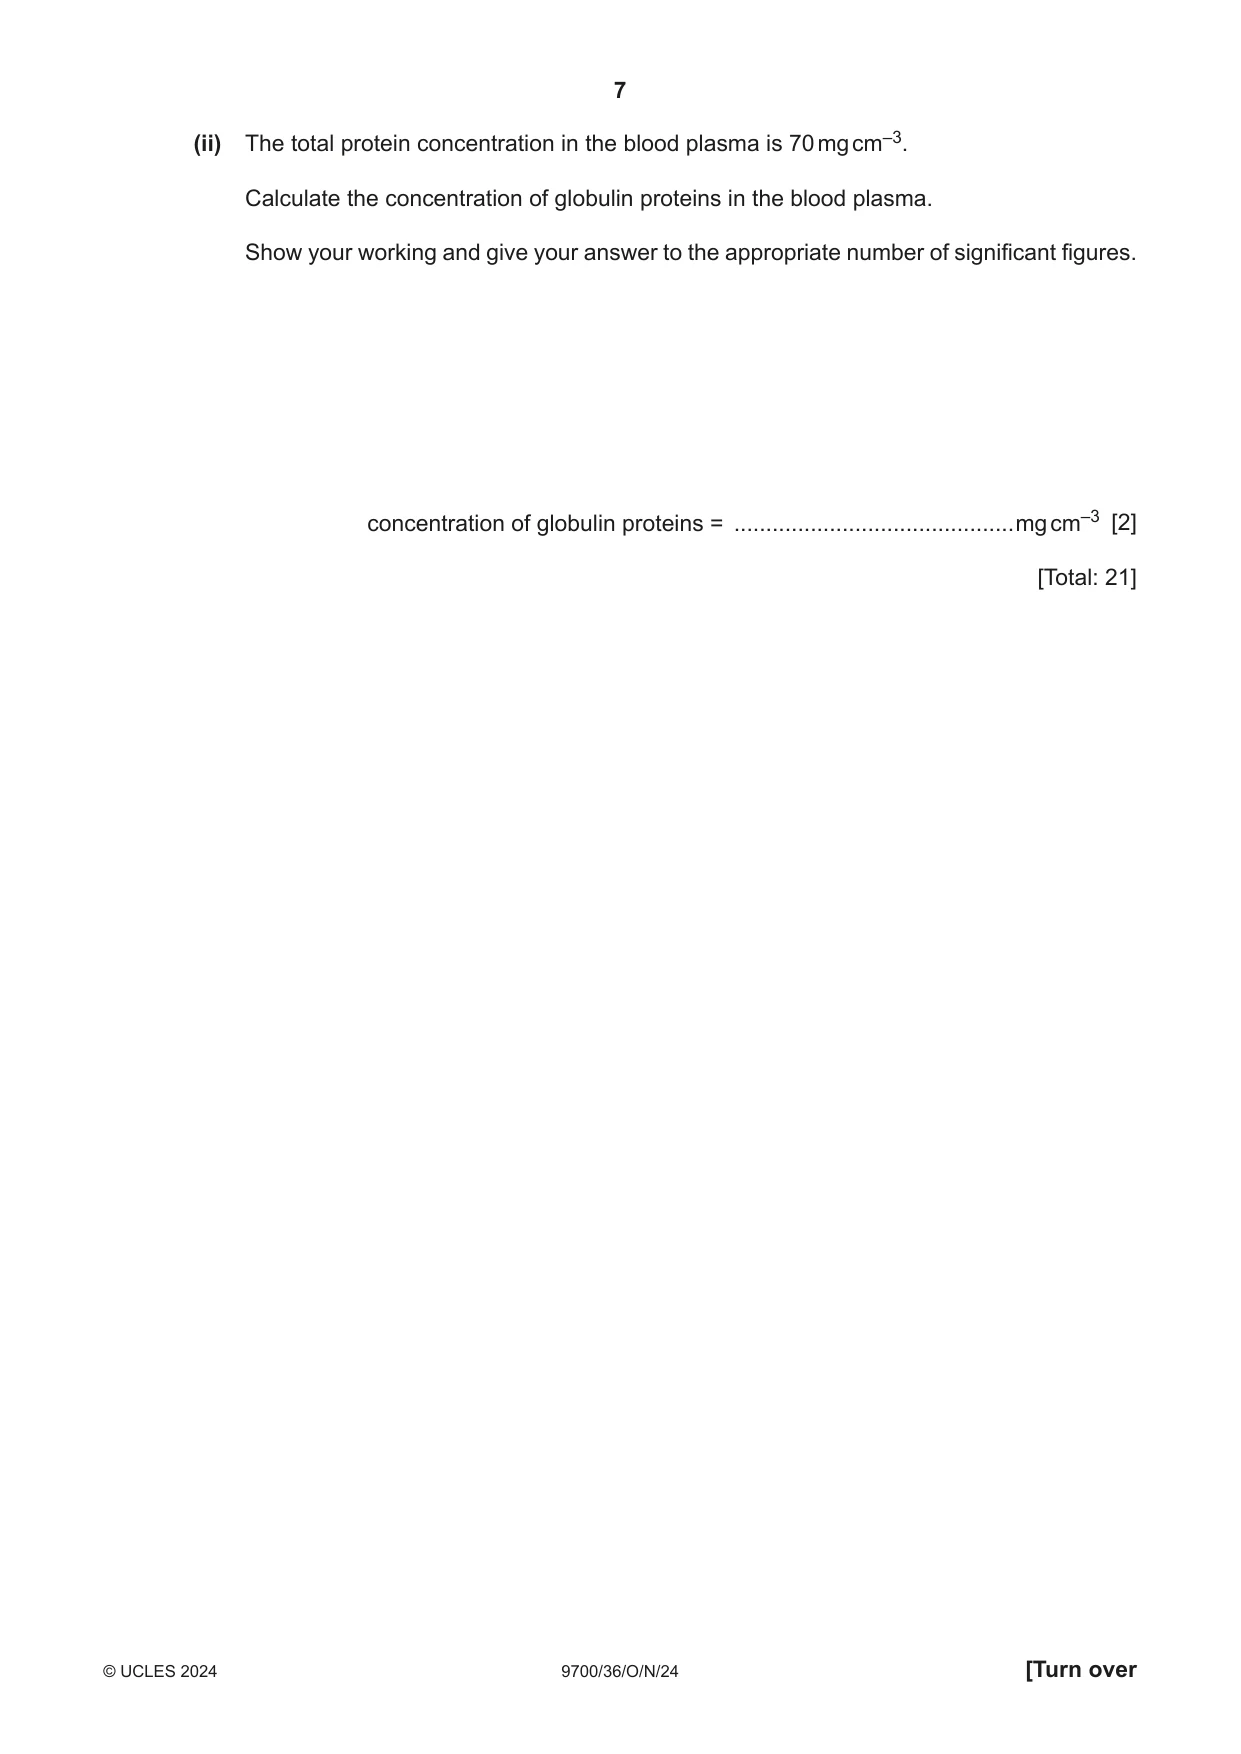
1 Blood plasma contains soluble proteins such as albumin. Albumin can be separated from blood plasma and used in medical treatments. When the pH changes, soluble proteins become insoluble and form large clumps. This is known as precipitation. You will investigate the effect of different concentrations of hydrochloric acid on the precipitation of proteins. You are provided with the materials shown in Table 1.1. Table 1.1 labelled contents hazard volume / cm3 H 2.0 mol dm–3 hydrochloric acid irritant 30 P protein solution none 15 W distilled water none 30 If any solution comes into contact with your skin, wash off immediately with cold water. It is recommended that you wear suitable eye protection. You will need to: • prepare different concentrations of hydrochloric acid • observe the effect of the different concentrations of hydrochloric acid on the precipitation of a protein solution at 0, 5 and 10 minutes. You will need to use proportional dilution to make five different concentrations of hydrochloric acid. You will need to prepare 5 cm3 of each concentration, using H and W. Table 1.2 shows two of the concentrations of hydrochloric acid you will use and how to prepare one of the concentrations. Decide which three other concentrations of hydrochloric acid you will use. (a) (i) Complete Table 1.2 to show how you will prepare the concentrations of hydrochloric acid you will use. Table 1.2 concentration of volume of H volume of W hydrochloric acid / cm3 / cm3 / mol dm–3 2.0 5.0 0.0 0.4 [3] Carry out step 1 to step 8. step 1 Label five test-tubes with the concentrations of hydrochloric acid solution decided in (a)(i). step 2 Prepare the concentrations of hydrochloric acid as shown in Table 1.2, in the appropriately labelled test-tubes. Mix well. You will be adding P to the different concentrations of hydrochloric acid to form a white precipitate. The solution becomes cloudier as more proteins precipitate, as shown in Fig. 1.1. clear cloudy soluble proteins precipitated proteins Fig. 1.1 You will need to record how cloudy each solution appears. (ii) Decide on a key you will use to record your observations. Complete Table 1.3 to show the key you will use. Table 1.3 appearance key most cloudy clear [1] You will be observing the appearance of the solutions in the test-tubes. You may use a piece of black card behind the test-tubes to help you to decide on the amount of precipitation of the solutions. You may observe the same amount of precipitation in more than one test-tube. step 3 Put 1 cm3 of P into each of the test-tubes. Shake gently to mix. step 4 Observe the appearance of the solutions in the test-tubes. step 5 Record in (a)(iii) your observations using the key decided in (a)(ii). This is your observation at 0 minutes. step 6 Start timing. step 7 Record in (a)(iii) your observations after 5 minutes. step 8 Record in (a)(iii) your observations after 10 minutes. (iii) Record your results in an appropriate table. [5] (iv) State the trend in your results at 0 minutes. ........................................................................................................................................... ..................................................................................................................................... [1] (v) With reference to your observations at 0, 5 and 10 minutes, describe the effect of concentration of hydrochloric acid on the rate of protein precipitation. ........................................................................................................................................... ........................................................................................................................................... ........................................................................................................................................... ........................................................................................................................................... ..................................................................................................................................... [2] (vi) A possible source of error when adding P in step 3 is shown in Table 1.4. Complete Table 1.4 by stating the type of error (systematic or random) and by stating the effect on the trend seen in the results at 0 minutes. Table 1.4 systematic error source of error or effect on the trend random error the 1.0 cm3 mark on the syringe actually measured 1.05 cm3 [1] (vii) Identify one source of error in the investigation other than the error stated in Table 1.4. Suggest one modification to the procedure to reduce the effect of this error. error ................................................................................................................................... ........................................................................................................................................... modification ....................................................................................................................... ........................................................................................................................................... ........................................................................................................................................... [2] (b) A scientist identified the proteins present in a sample of blood plasma. The quantity of each protein as a percentage of the total protein in the blood plasma is shown in Table 1.5. Table 1.5 protein in blood plasma percentage of total protein albumin (A) 55.0 alpha globulin (AG) 12.5 beta globulin (BG) 16.5 gamma globulin (GG) 8.5 fibrinogen (F) 7.0 (i) Draw a bar chart of the data in Table 1.5 on the grid in Fig. 1.2. Use a sharp pencil. Fig. 1.2 [4] (ii) The total protein concentration in the blood plasma is 70 mg cm–3. Calculate the concentration of globulin proteins in the blood plasma. Show your working and give your answer to the appropriate number of significant figures. concentration of globulin proteins = ............................................mg cm–3 [2] [Total: 21]
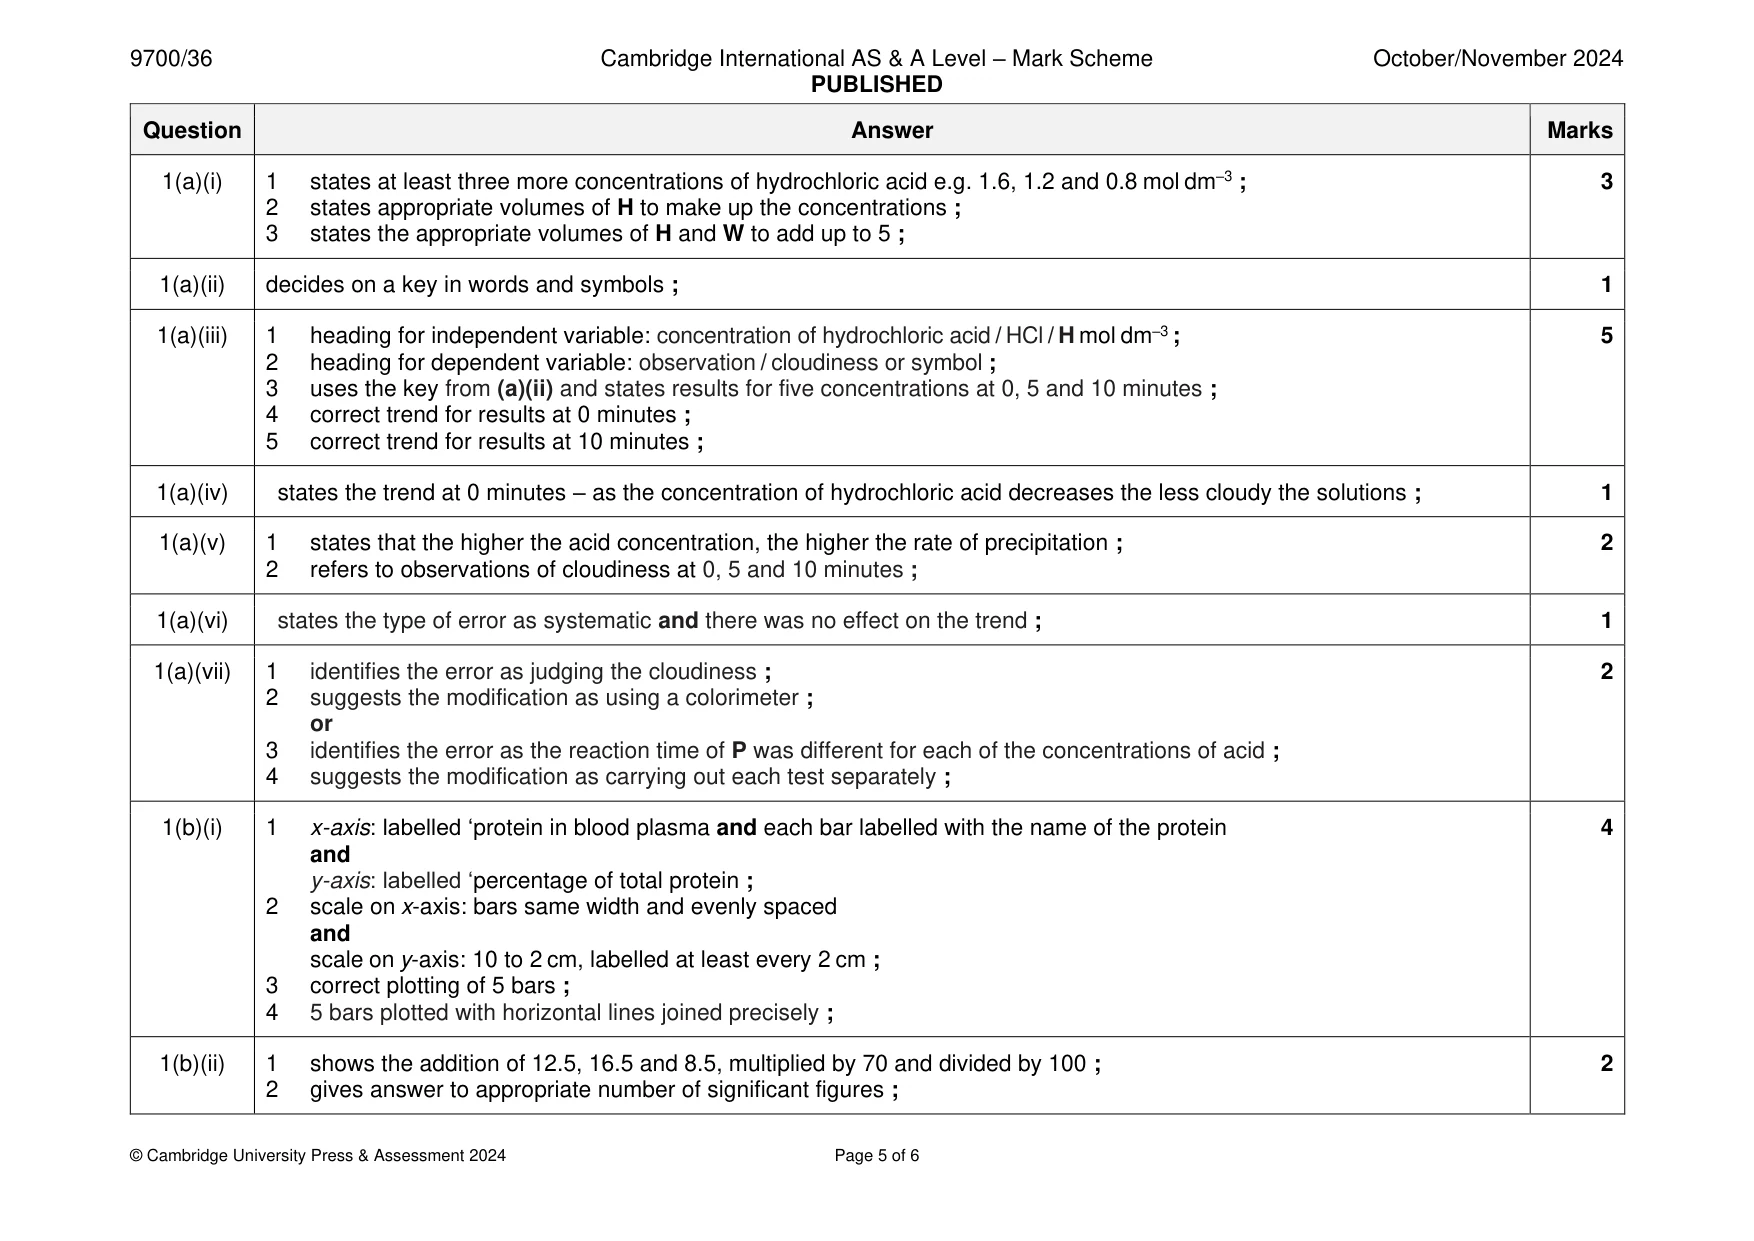
Mark scheme: Question Answer Marks 1(a)(i) 1 states at least three more concentrations of hydrochloric acid e.g. 1.6, 1.2 and 0.8 mol dm–3 ; 3 2 states appropriate volumes of H to make up the concentrations ; 3 states the appropriate volumes of H and W to add up to 5 ; 1(a)(ii) decides on a key in words and symbols ; 1 1(a)(iii) 1 heading for independent variable: concentration of hydrochloric acid / HCl / H mol dm–3 ; 5 2 heading for dependent variable: observation / cloudiness or symbol ; 3 uses the key from (a)(ii) and states results for five concentrations at 0, 5 and 10 minutes ; 4 correct trend for results at 0 minutes ; 5 correct trend for results at 10 minutes ; 1(a)(iv) states the trend at 0 minutes – as the concentration of hydrochloric acid decreases the less cloudy the solutions ; 1 1(a)(v) 1 states that the higher the acid concentration, the higher the rate of precipitation ; 2 2 refers to observations of cloudiness at 0, 5 and 10 minutes ; 1(a)(vi) states the type of error as systematic and there was no effect on the trend ; 1 1(a)(vii) 1 identifies the error as judging the cloudiness ; 2 2 suggests the modification as using a colorimeter ; or 3 identifies the error as the reaction time of P was different for each of the concentrations of acid ; 4 suggests the modification as carrying out each test separately ; 1(b)(i) 1 x-axis: labelled ‘protein in blood plasma and each bar labelled with the name of the protein 4 and y-axis: labelled ‘percentage of total protein ; 2 scale on x-axis: bars same width and evenly spaced and scale on y-axis: 10 to 2 cm, labelled at least every 2 cm ; 3 correct plotting of 5 bars ; 4 5 bars plotted with horizontal lines joined precisely ; 1(b)(ii) 1 shows the addition of 12.5, 16.5 and 8.5, multiplied by 70 and divided by 100 ; 2 2 gives answer to appropriate number of significant figures ;
Q2 · Starch grains are present in plant cells
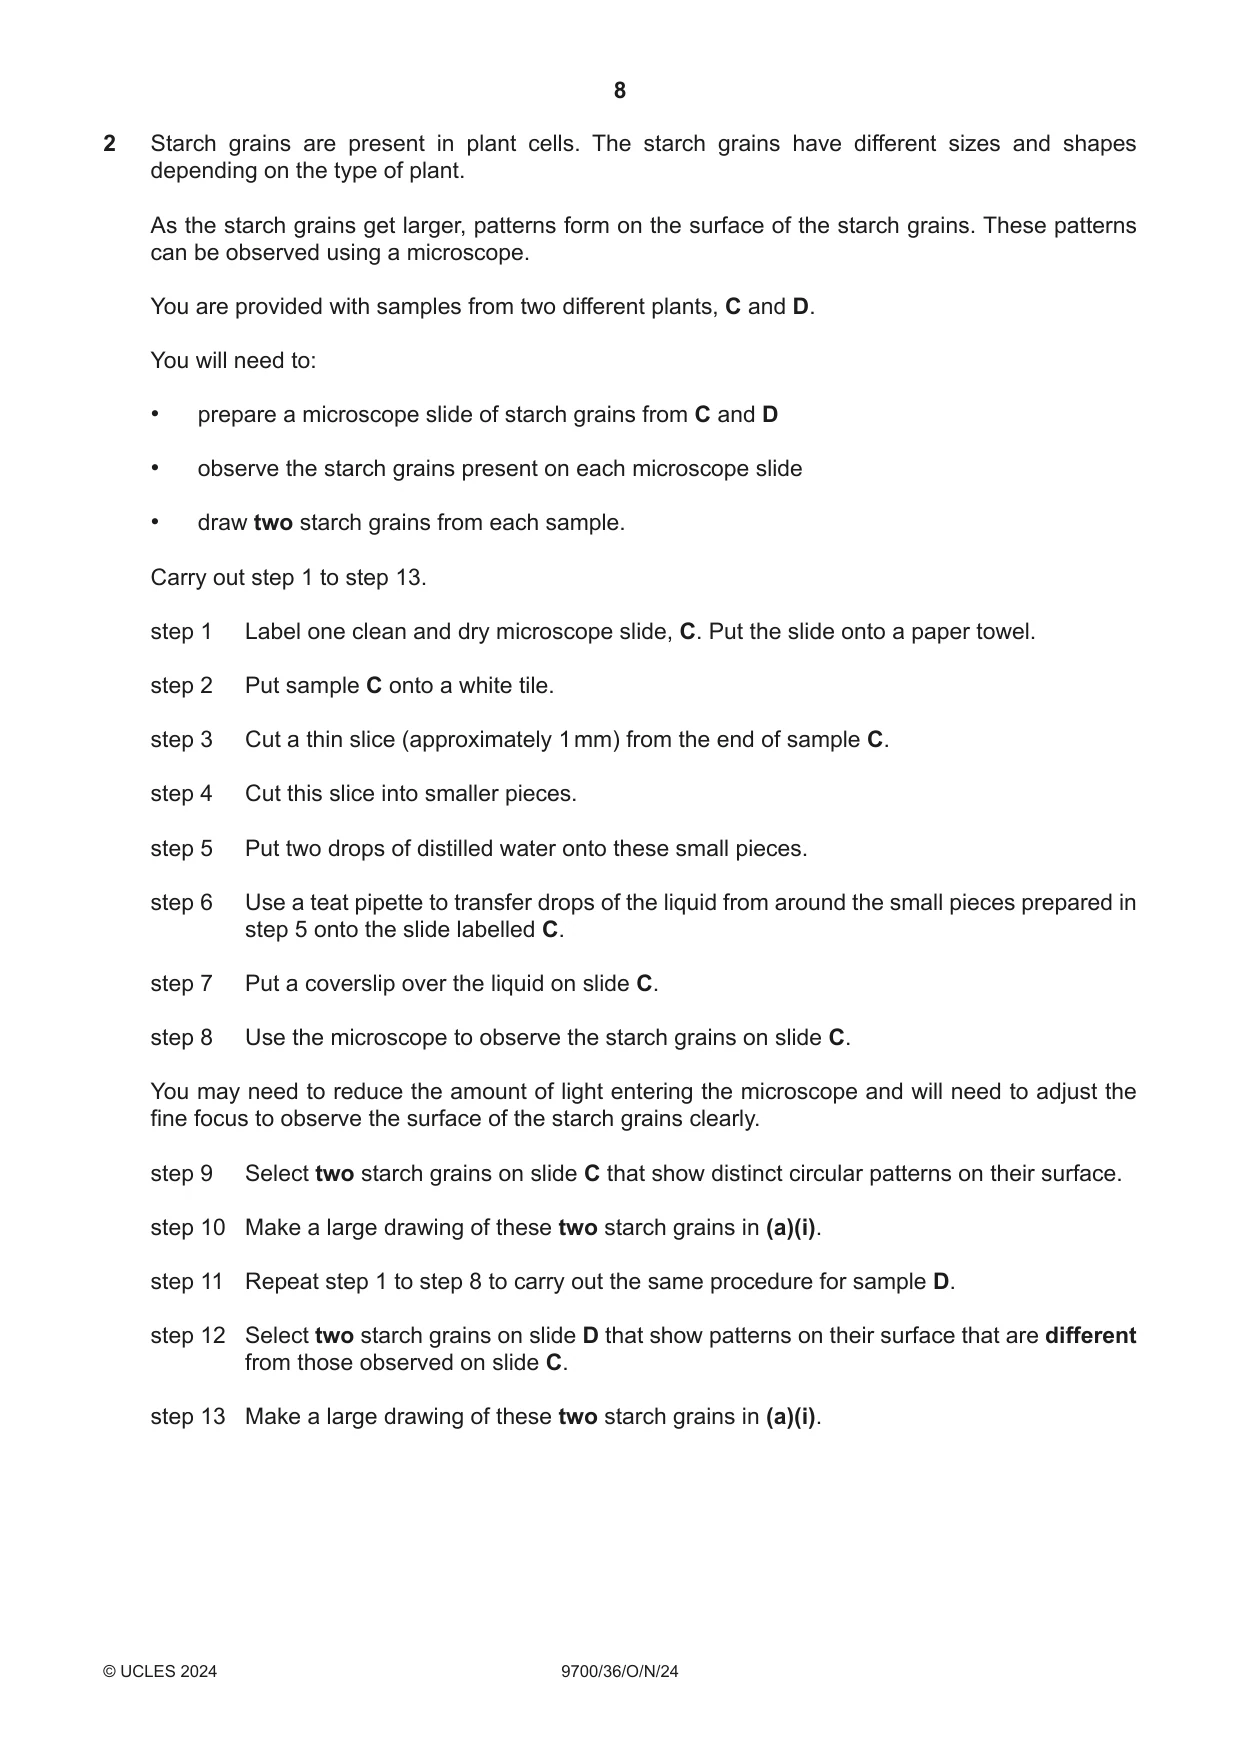
2 Starch grains are present in plant cells. The starch grains have different sizes and shapes depending on the type of plant. As the starch grains get larger, patterns form on the surface of the starch grains. These patterns can be observed using a microscope. You are provided with samples from two different plants, C and D. You will need to: • prepare a microscope slide of starch grains from C and D • observe the starch grains present on each microscope slide • draw two starch grains from each sample. Carry out step 1 to step 13. step 1 Label one clean and dry microscope slide, C. Put the slide onto a paper towel. step 2 Put sample C onto a white tile. step 3 Cut a thin slice (approximately 1 mm) from the end of sample C. step 4 Cut this slice into smaller pieces. step 5 Put two drops of distilled water onto these small pieces. step 6 Use a teat pipette to transfer drops of the liquid from around the small pieces prepared in step 5 onto the slide labelled C. step 7 Put a coverslip over the liquid on slide C. step 8 Use the microscope to observe the starch grains on slide C. You may need to reduce the amount of light entering the microscope and will need to adjust the fine focus to observe the surface of the starch grains clearly. step 9 Select two starch grains on slide C that show distinct circular patterns on their surface. step 10 Make a large drawing of these two starch grains in (a)(i). step 11 Repeat step 1 to step 8 to carry out the same procedure for sample D. step 12 Select two starch grains on slide D that show patterns on their surface that are different from those observed on slide C. step 13 Make a large drawing of these two starch grains in (a)(i). (a) (i) Make a large drawing of: • two starch grains from slide C • two starch grains from slide D. Use a sharp pencil. Slide C Slide D [5] (ii) State the reagent that is used to test for starch and the colour that is produced if starch is present. reagent ........................................................... colour ........................................................... [1] (iii) Suggest why the starch grains get smaller as plants germinate. ........................................................................................................................................... ........................................................................................................................................... ..................................................................................................................................... [1]
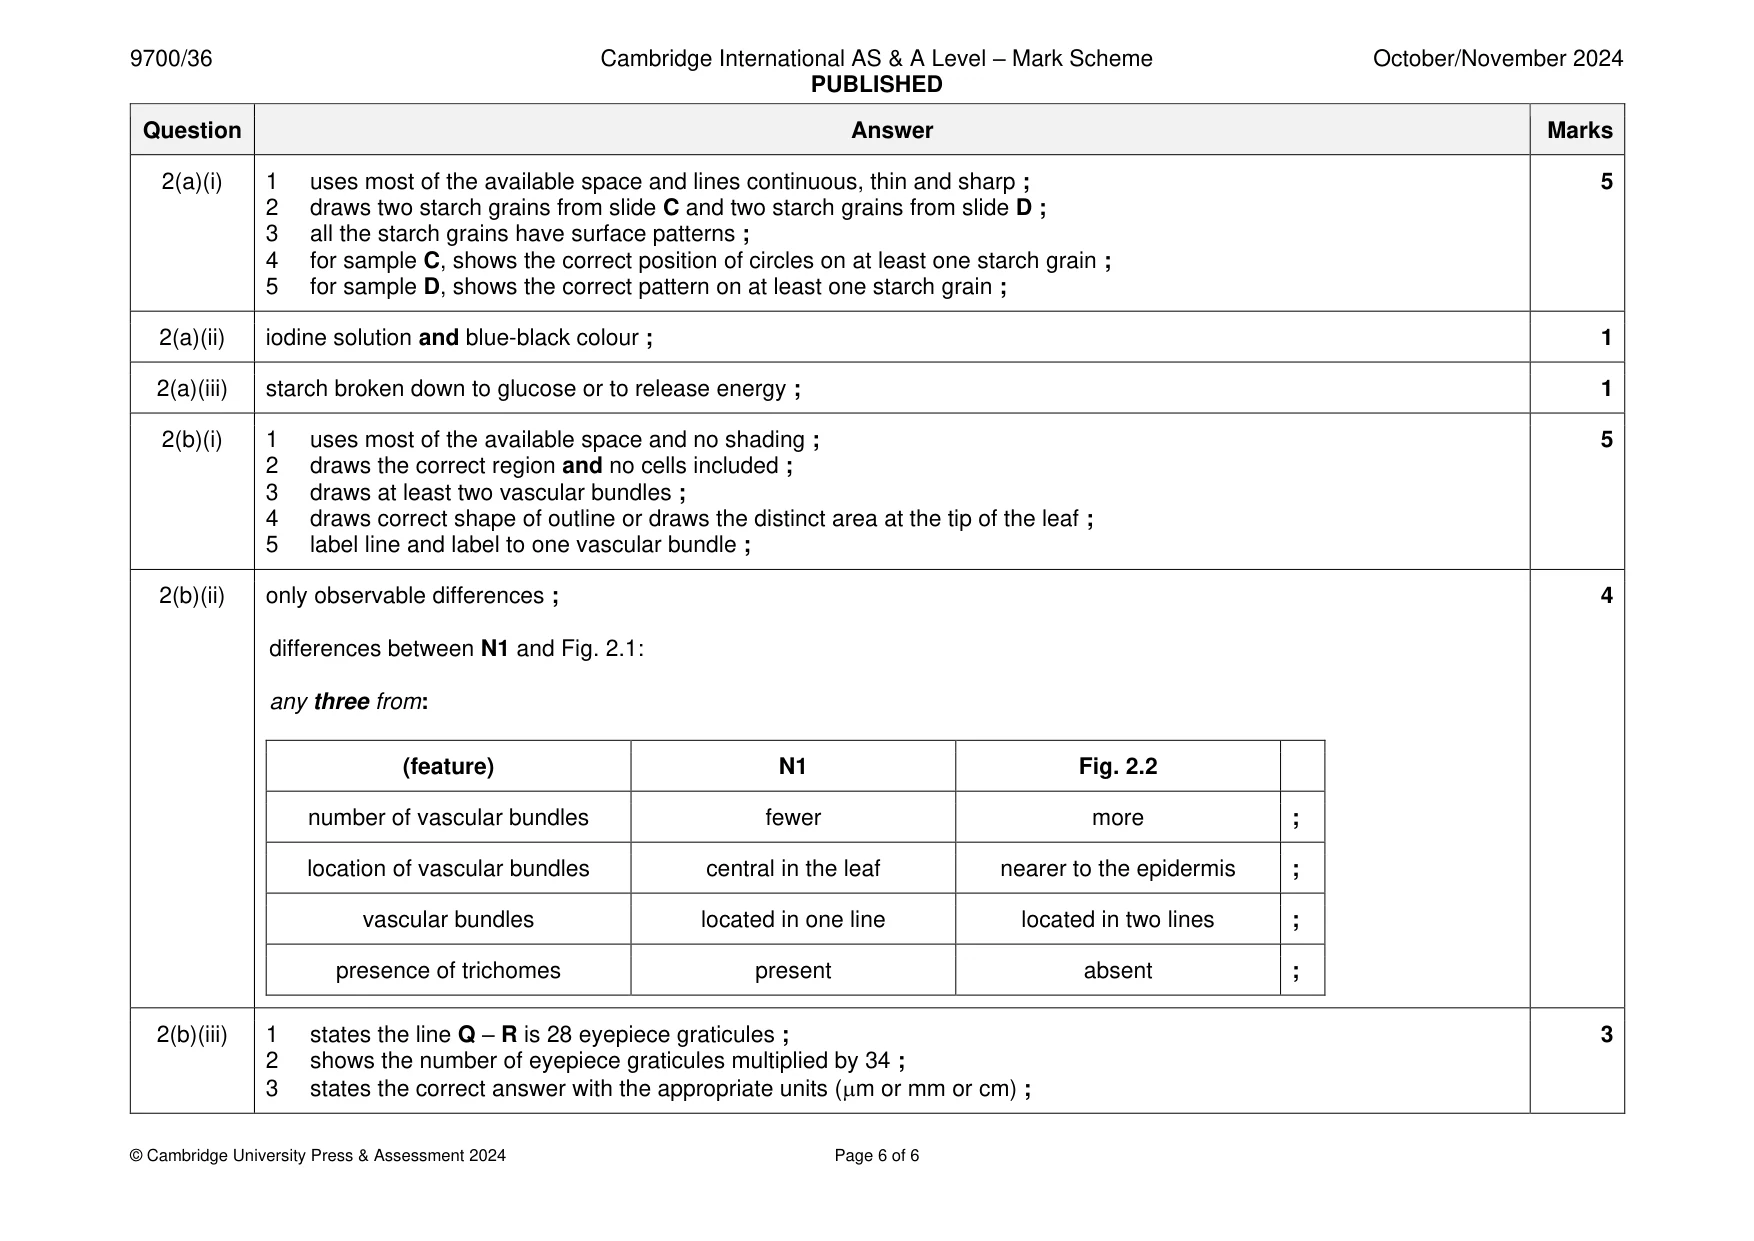
Mark scheme: 2(a)(i) 1 uses most of the available space and lines continuous, thin and sharp ; 5 2 draws two starch grains from slide C and two starch grains from slide D ; 3 all the starch grains have surface patterns ; 4 for sample C, shows the correct position of circles on at least one starch grain ; 5 for sample D, shows the correct pattern on at least one starch grain ; 2(a)(ii) iodine solution and blue-black colour ; 1 2(a)(iii) starch broken down to glucose or to release energy ; 1 2(b)(i) 1 uses most of the available space and no shading ; 5 2 draws the correct region and no cells included ; 3 draws at least two vascular bundles ; 4 draws correct shape of outline or draws the distinct area at the tip of the leaf ; 5 label line and label to one vascular bundle ; 2(b)(ii) only observable differences ; 4 differences between N1 and Fig. 2.1: any three from: (feature) N1 Fig. 2.2 number of vascular bundles fewer more ; location of vascular bundles central in the leaf nearer to the epidermis ; vascular bundles located in one line located in two lines ; presence of trichomes present absent ; 2(b)(iii) 1 states the line Q – R is 28 eyepiece graticules ; 3 2 shows the number of eyepiece graticules multiplied by 34 ; 3 states the correct answer with the appropriate units (m or mm or cm) ;
What was in this paper
The subtopics covered by these 2 questions, and how many questions each got. Open one in a new tab to see every Cambridge question on it.
What you needed in this session
Cambridge’s own grade thresholds for 2024 Oct/Nov, Paper 3 · Variant 6. A higher threshold means an easier paper — the bar moves with how the cohort did.