Cambridge A Level Biology 9700 — 2017 May/June Paper 3 · Variant 4
9700/34/M/J/17 · 2 questions · 40 marks · ≈45 min
The question paper and its mark scheme, free to read here and free to download. This is Cambridge’s own paper, exactly as it was sat.
Question paper16 pages
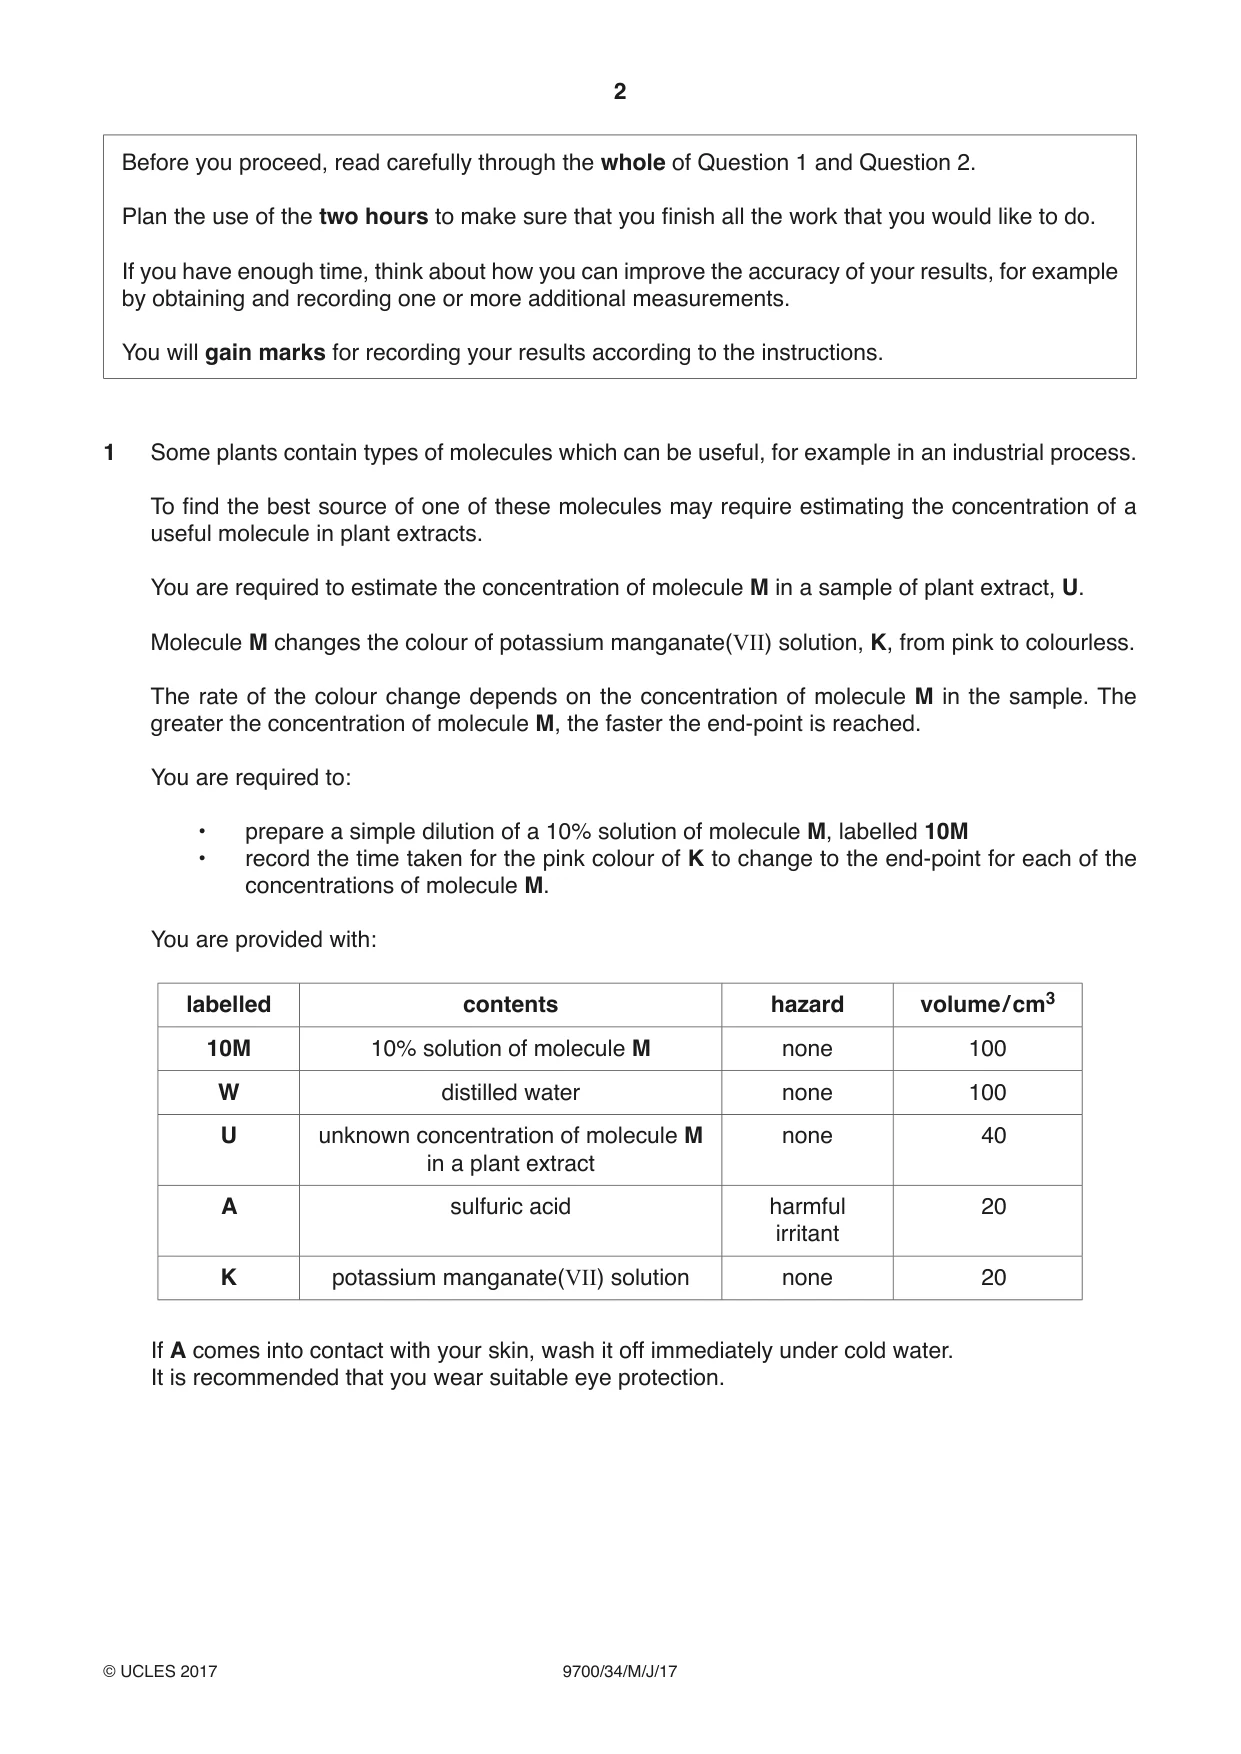
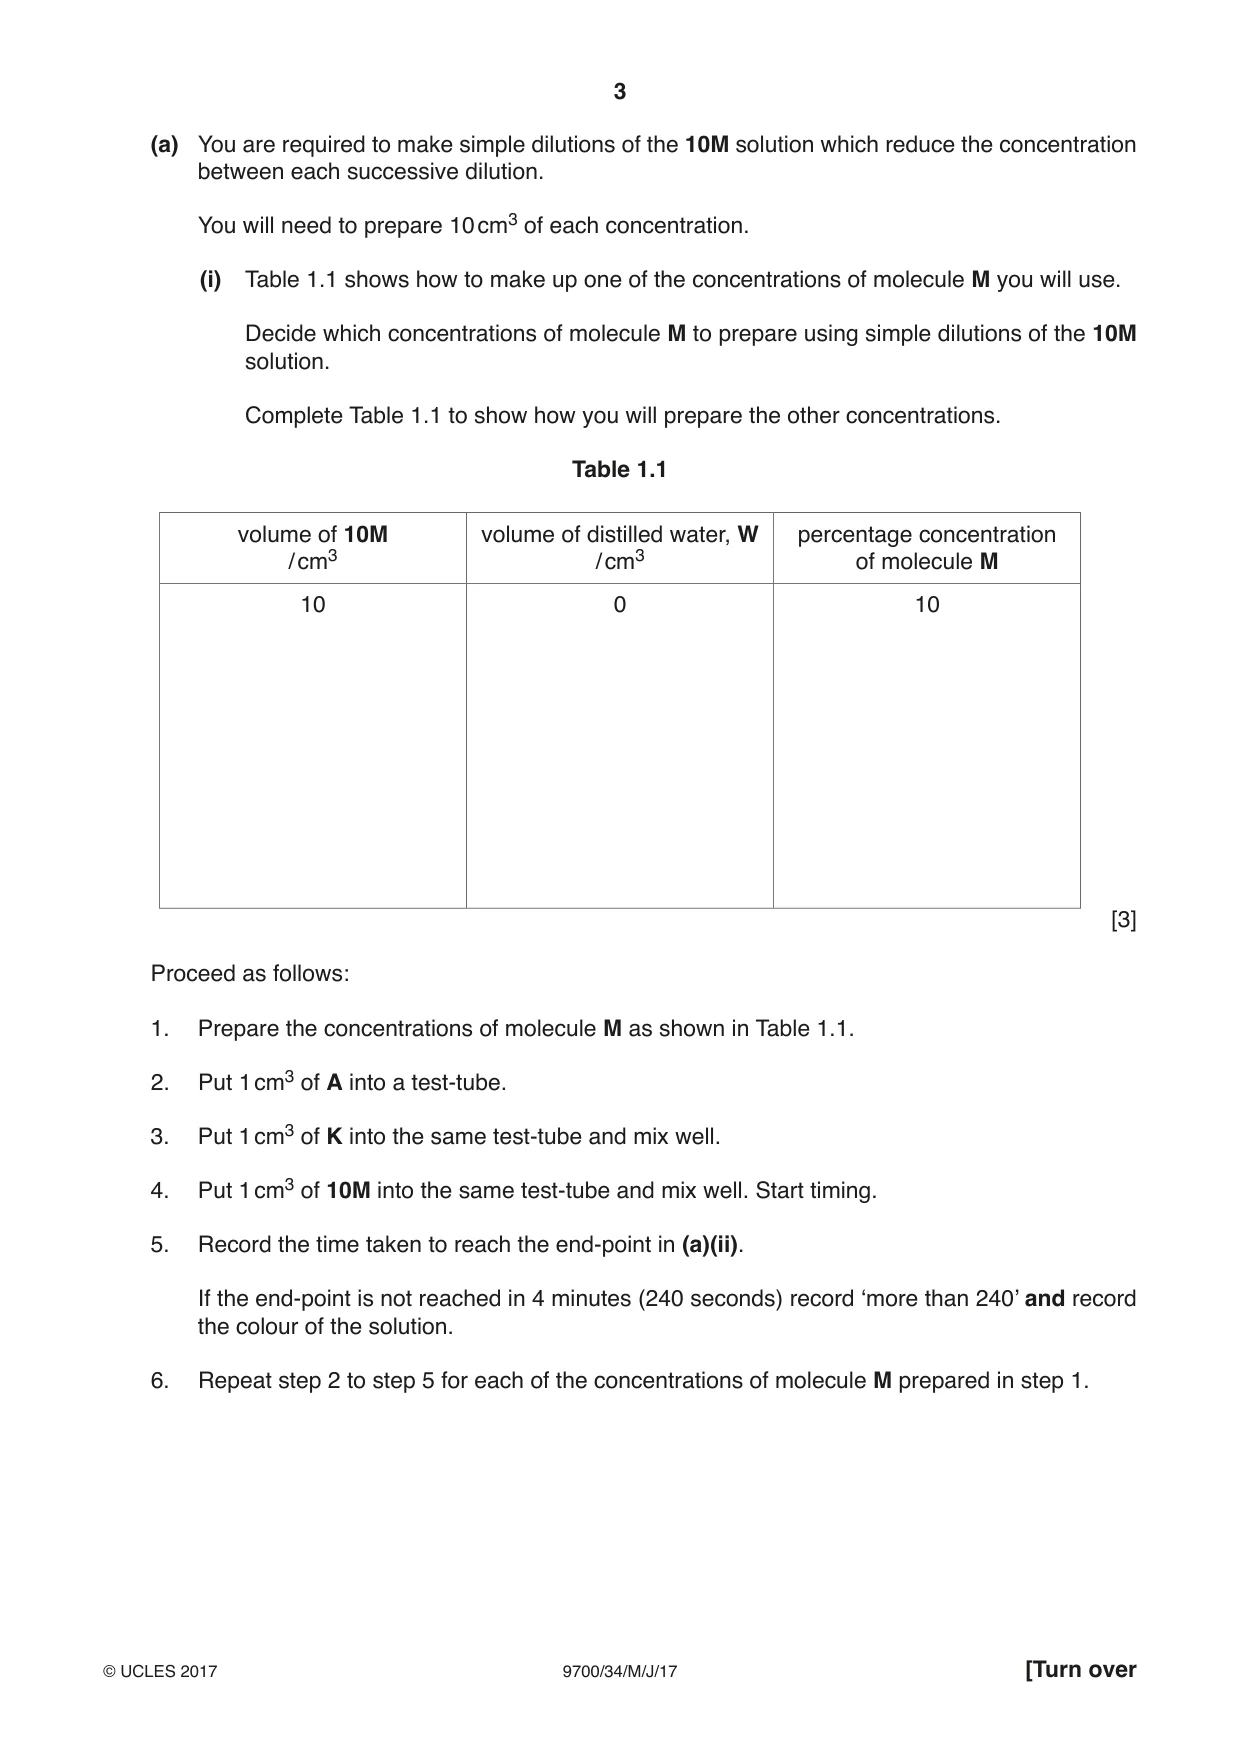
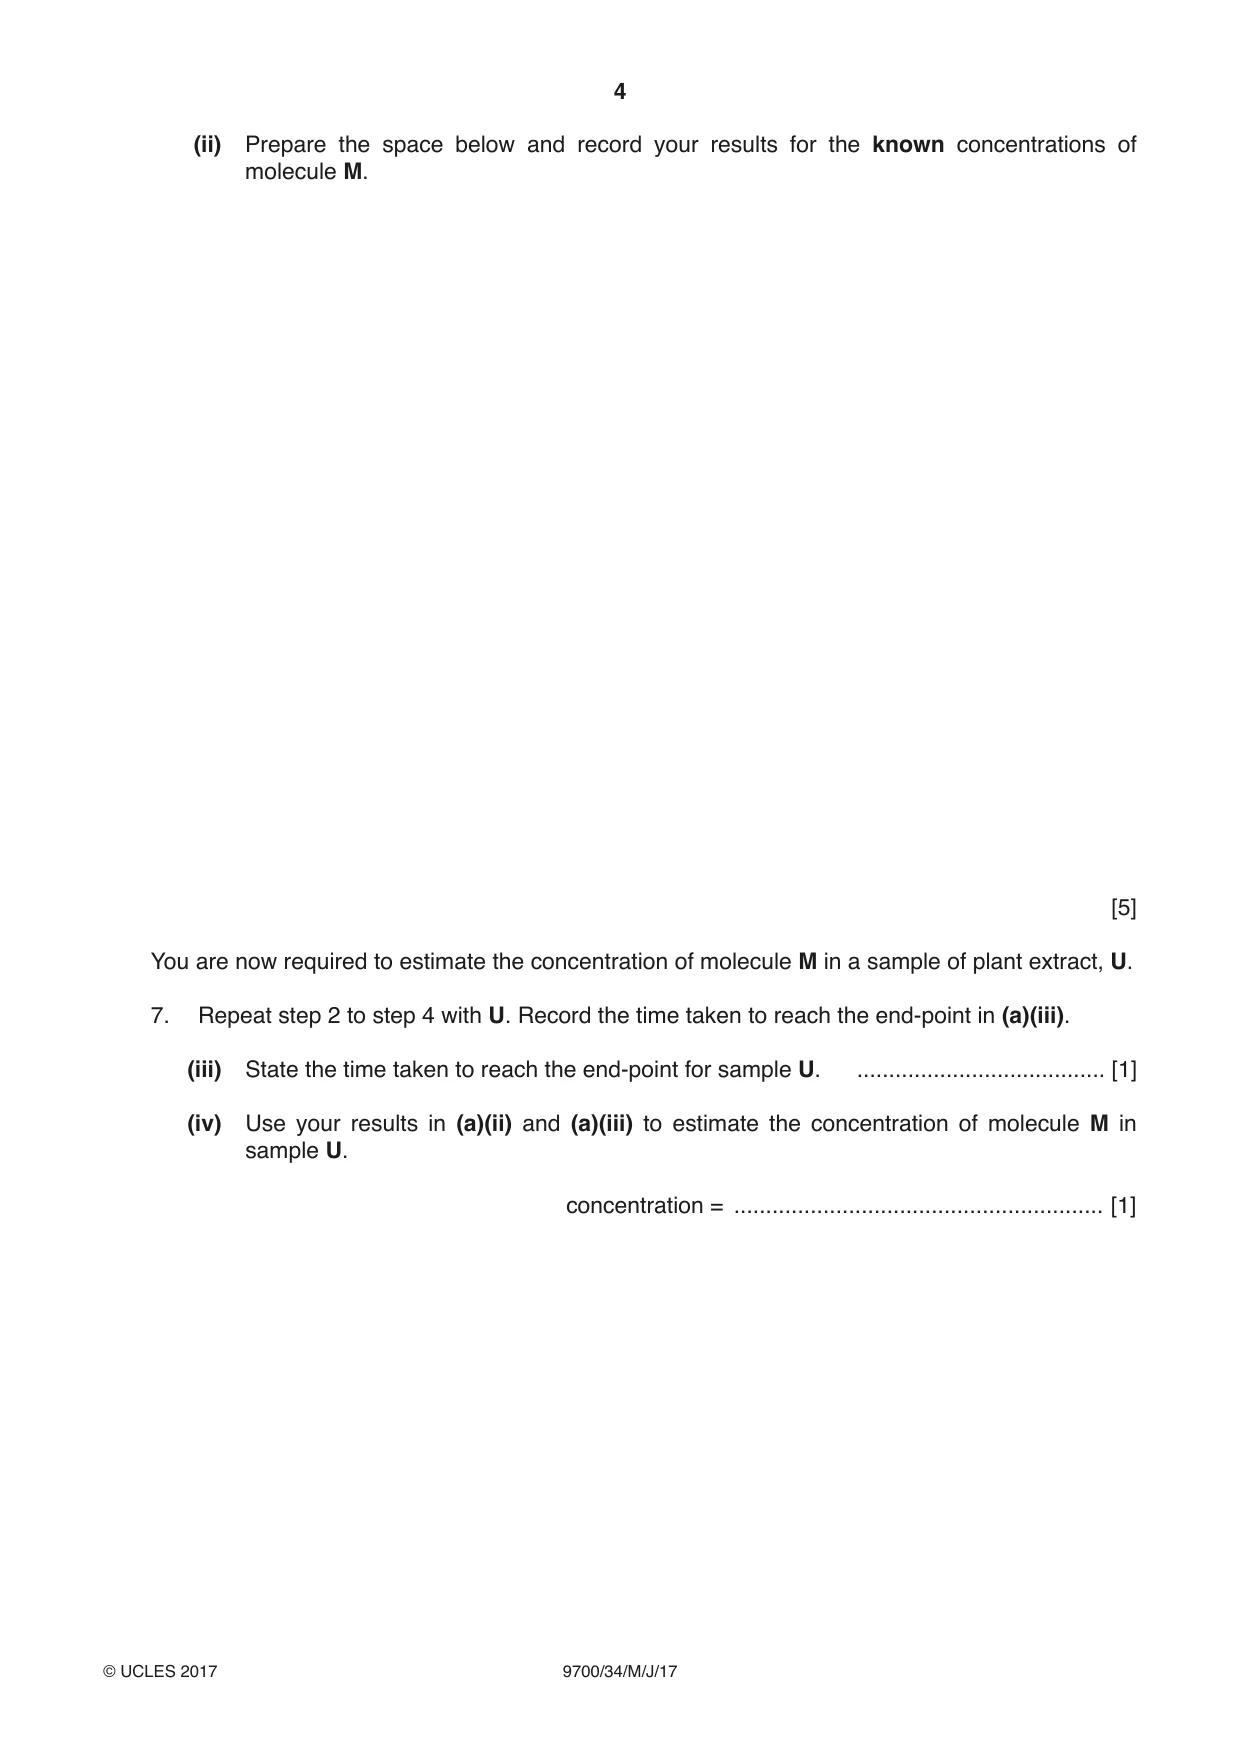




Mark scheme6 pages
Answers below. Sit the paper first if you are practising.
Questions as text
Q1 · Some plants contain types of molecules which can be useful, for example in an industrial…
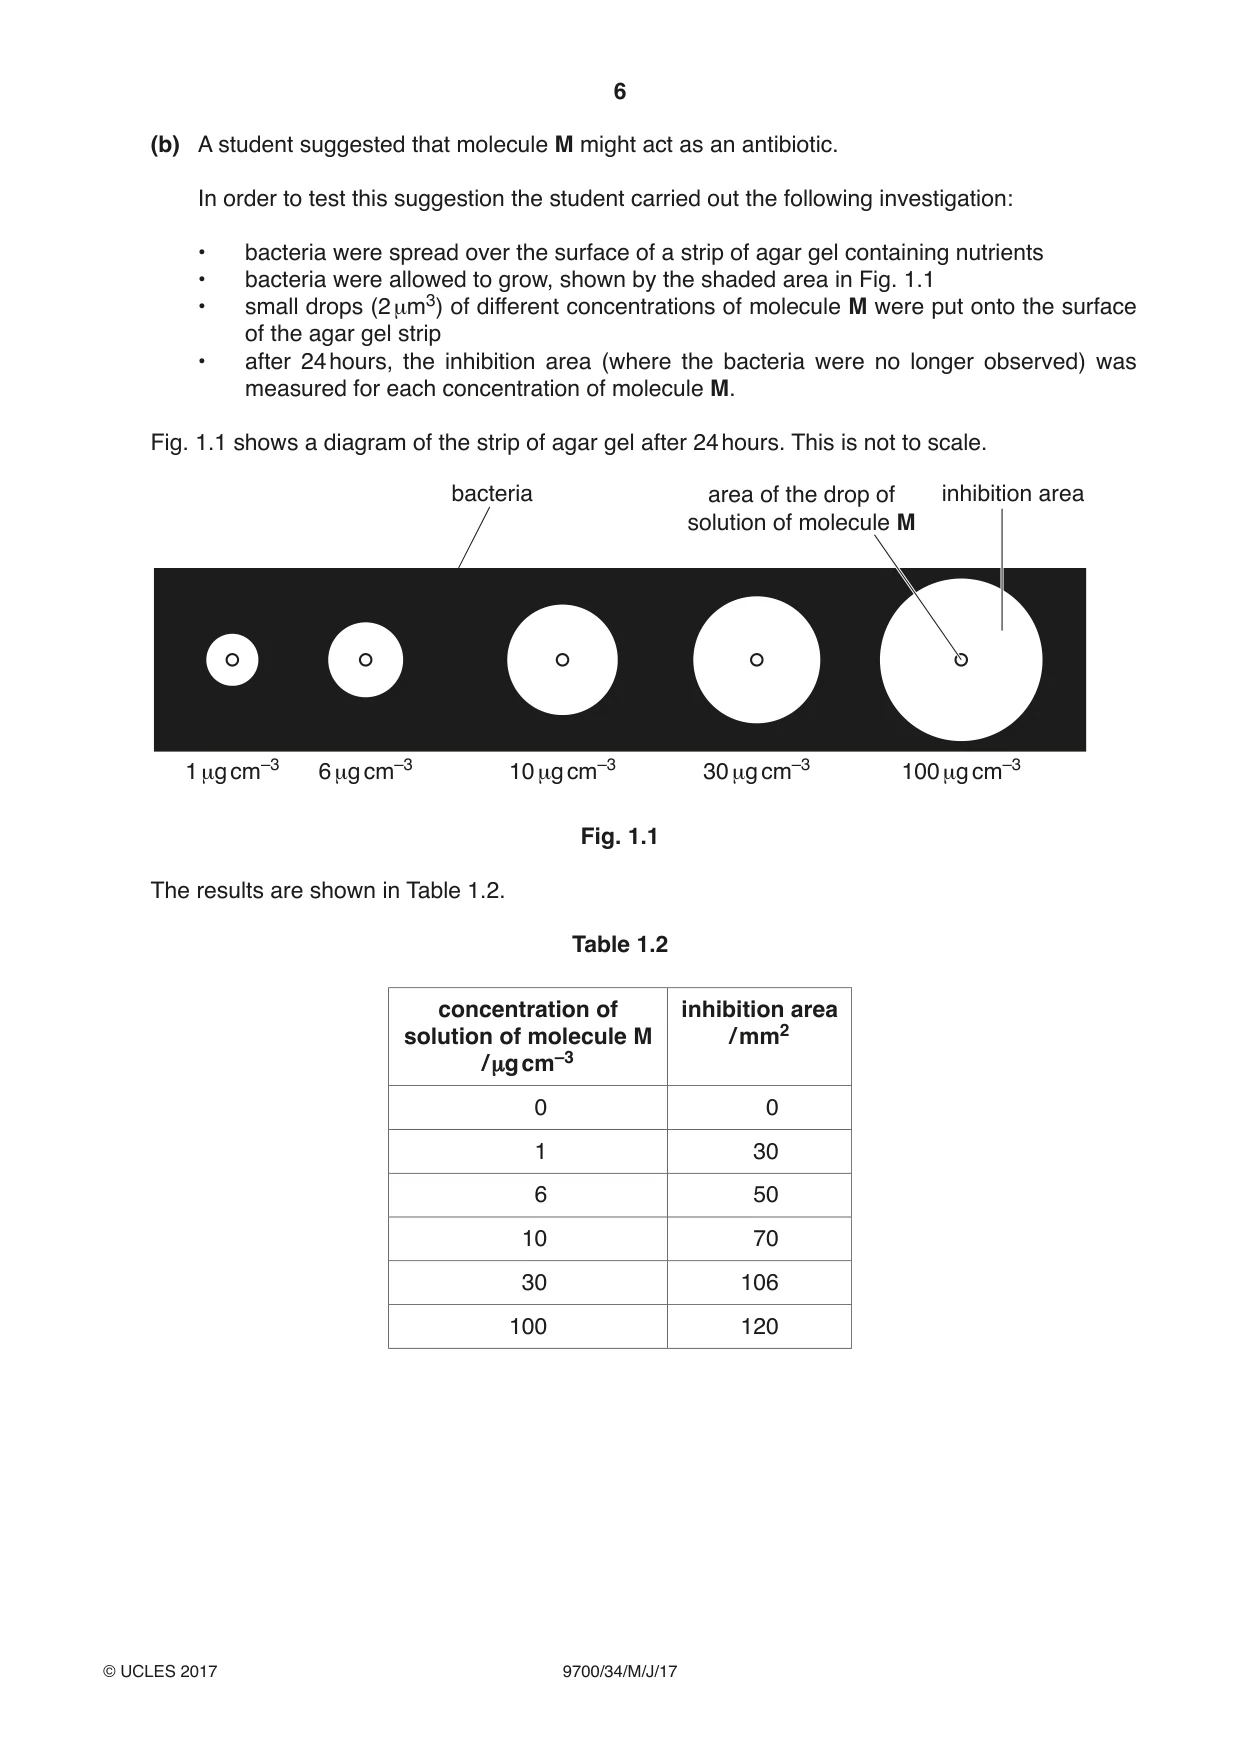
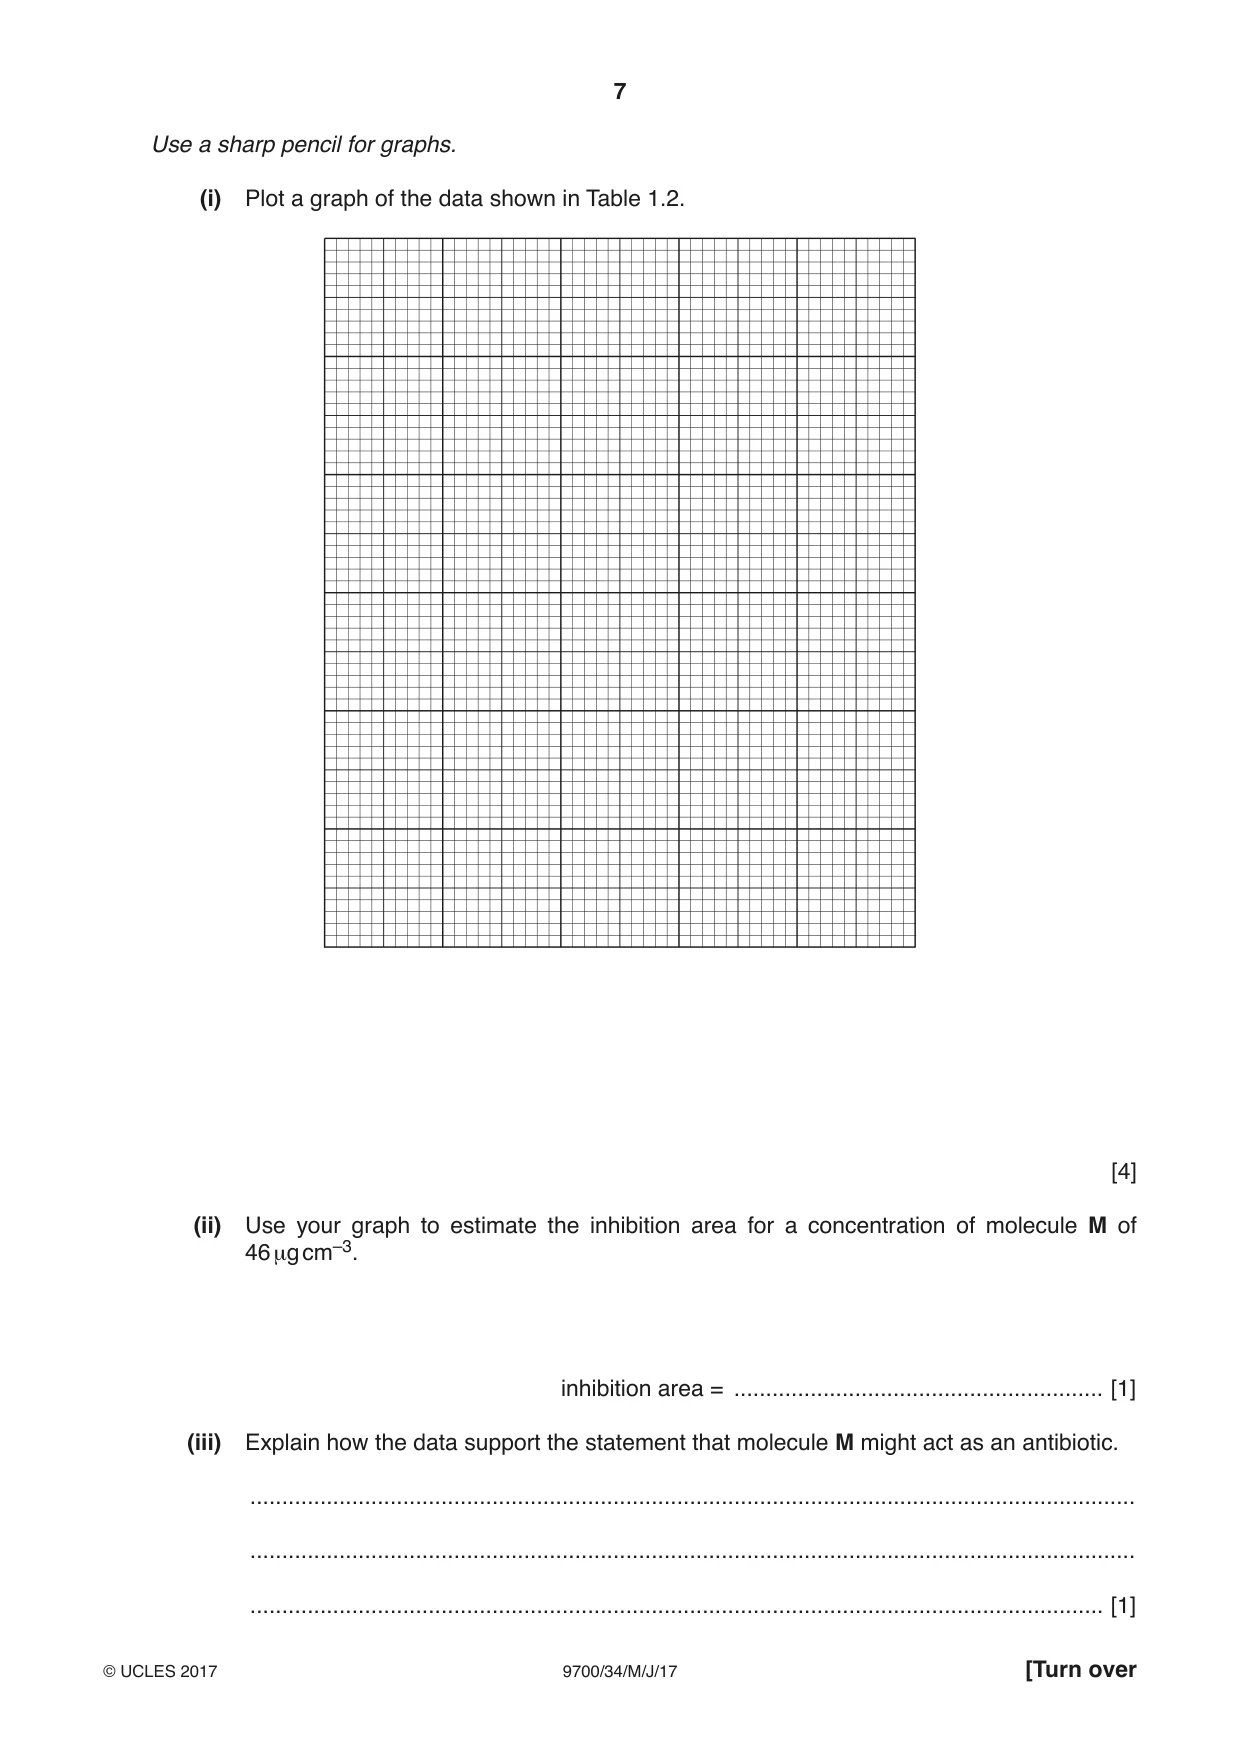
1 Some plants contain types of molecules which can be useful, for example in an industrial process. To find the best source of one of these molecules may require estimating the concentration of a useful molecule in plant extracts. You are required to estimate the concentration of molecule M in a sample of plant extract, U. Molecule M changes the colour of potassium manganate(VII) solution, K, from pink to colourless. The rate of the colour change depends on the concentration of molecule M in the sample. The greater the concentration of molecule M, the faster the end-point is reached. You are required to: • prepare a simple dilution of a 10% solution of molecule M, labelled 10M • record the time taken for the pink colour of K to change to the end-point for each of the concentrations of molecule M. You are provided with: labelled contents hazard volume / cm3 10M 10% solution of molecule M none 100 W distilled water none 100 U unknown concentration of molecule M none 40 in a plant extract A sulfuric acid harmful 20 irritant K potassium manganate(VII) solution none 20 If A comes into contact with your skin, wash it off immediately under cold water. It is recommended that you wear suitable eye protection. (a) You are required to make simple dilutions of the 10M solution which reduce the concentration between each successive dilution. You will need to prepare 10 cm3 of each concentration. (i) Table 1.1 shows how to make up one of the concentrations of molecule M you will use. Decide which concentrations of molecule M to prepare using simple dilutions of the 10M solution. Complete Table 1.1 to show how you will prepare the other concentrations. Table 1.1 volume of 10M volume of distilled water, W percentage concentration / cm3 / cm3 of molecule M 10 0 10 [3] Proceed as follows: 1. Prepare the concentrations of molecule M as shown in Table 1.1. 2. Put 1 cm3 of A into a test-tube. 3. Put 1 cm3 of K into the same test-tube and mix well. 4. Put 1 cm3 of 10M into the same test-tube and mix well. Start timing. 5. Record the time taken to reach the end-point in (a)(ii). If the end-point is not reached in 4 minutes (240 seconds) record ‘more than 240’ and record the colour of the solution. 6. Repeat step 2 to step 5 for each of the concentrations of molecule M prepared in step 1. (ii) Prepare the space below and record your results for the known concentrations of molecule M. [5] You are now required to estimate the concentration of molecule M in a sample of plant extract, U. 7. Repeat step 2 to step 4 with U. Record the time taken to reach the end-point in (a)(iii). (iii) State the time taken to reach the end-point for sample U. ....................................... [1] (iv) Use your results in (a)(ii) and (a)(iii) to estimate the concentration of molecule M in sample U. concentration = .......................................................... [1] (v) Describe how you could use this procedure to produce a more accurate estimate of the concentration of molecule M in the sample of plant extract U than the one given in (a)(iv). ........................................................................................................................................... ........................................................................................................................................... ........................................................................................................................................... ........................................................................................................................................... ........................................................................................................................................... ........................................................................................................................................... ...................................................................................................................................... [3] (b) A student suggested that molecule M might act as an antibiotic. In order to test this suggestion the student carried out the following investigation: • bacteria were spread over the surface of a strip of agar gel containing nutrients • bacteria were allowed to grow, shown by the shaded area in Fig. 1.1 • small drops (2 µm3) of different concentrations of molecule M were put onto the surface of the agar gel strip • after 24 hours, the inhibition area (where the bacteria were no longer observed) was measured for each concentration of molecule M. Fig. 1.1 shows a diagram of the strip of agar gel after 24 hours. This is not to scale. bacteria area of the drop of inhibition area solution of molecule M 1 μg cm–3 6 μg cm–3 10 μg cm–3 30 μg cm–3 100 μg cm–3 Fig. 1.1 The results are shown in Table 1.2. Table 1.2 concentration of inhibition area solution of molecule M / mm2 / µg cm–3 0 0 1 30 6 50 10 70 30 106 100 120 Use a sharp pencil for graphs. (i) Plot a graph of the data shown in Table 1.2. [4] (ii) Use your graph to estimate the inhibition area for a concentration of molecule M of 46 µg cm–3. inhibition area = .......................................................... [1] (iii) Explain how the data support the statement that molecule M might act as an antibiotic. ........................................................................................................................................... ........................................................................................................................................... ...................................................................................................................................... [1] (iv) Suggest how molecule M may act as an antibiotic. ........................................................................................................................................... ........................................................................................................................................... ........................................................................................................................................... ........................................................................................................................................... ...................................................................................................................................... [2] [Total: 21] Question 2 starts on page 10
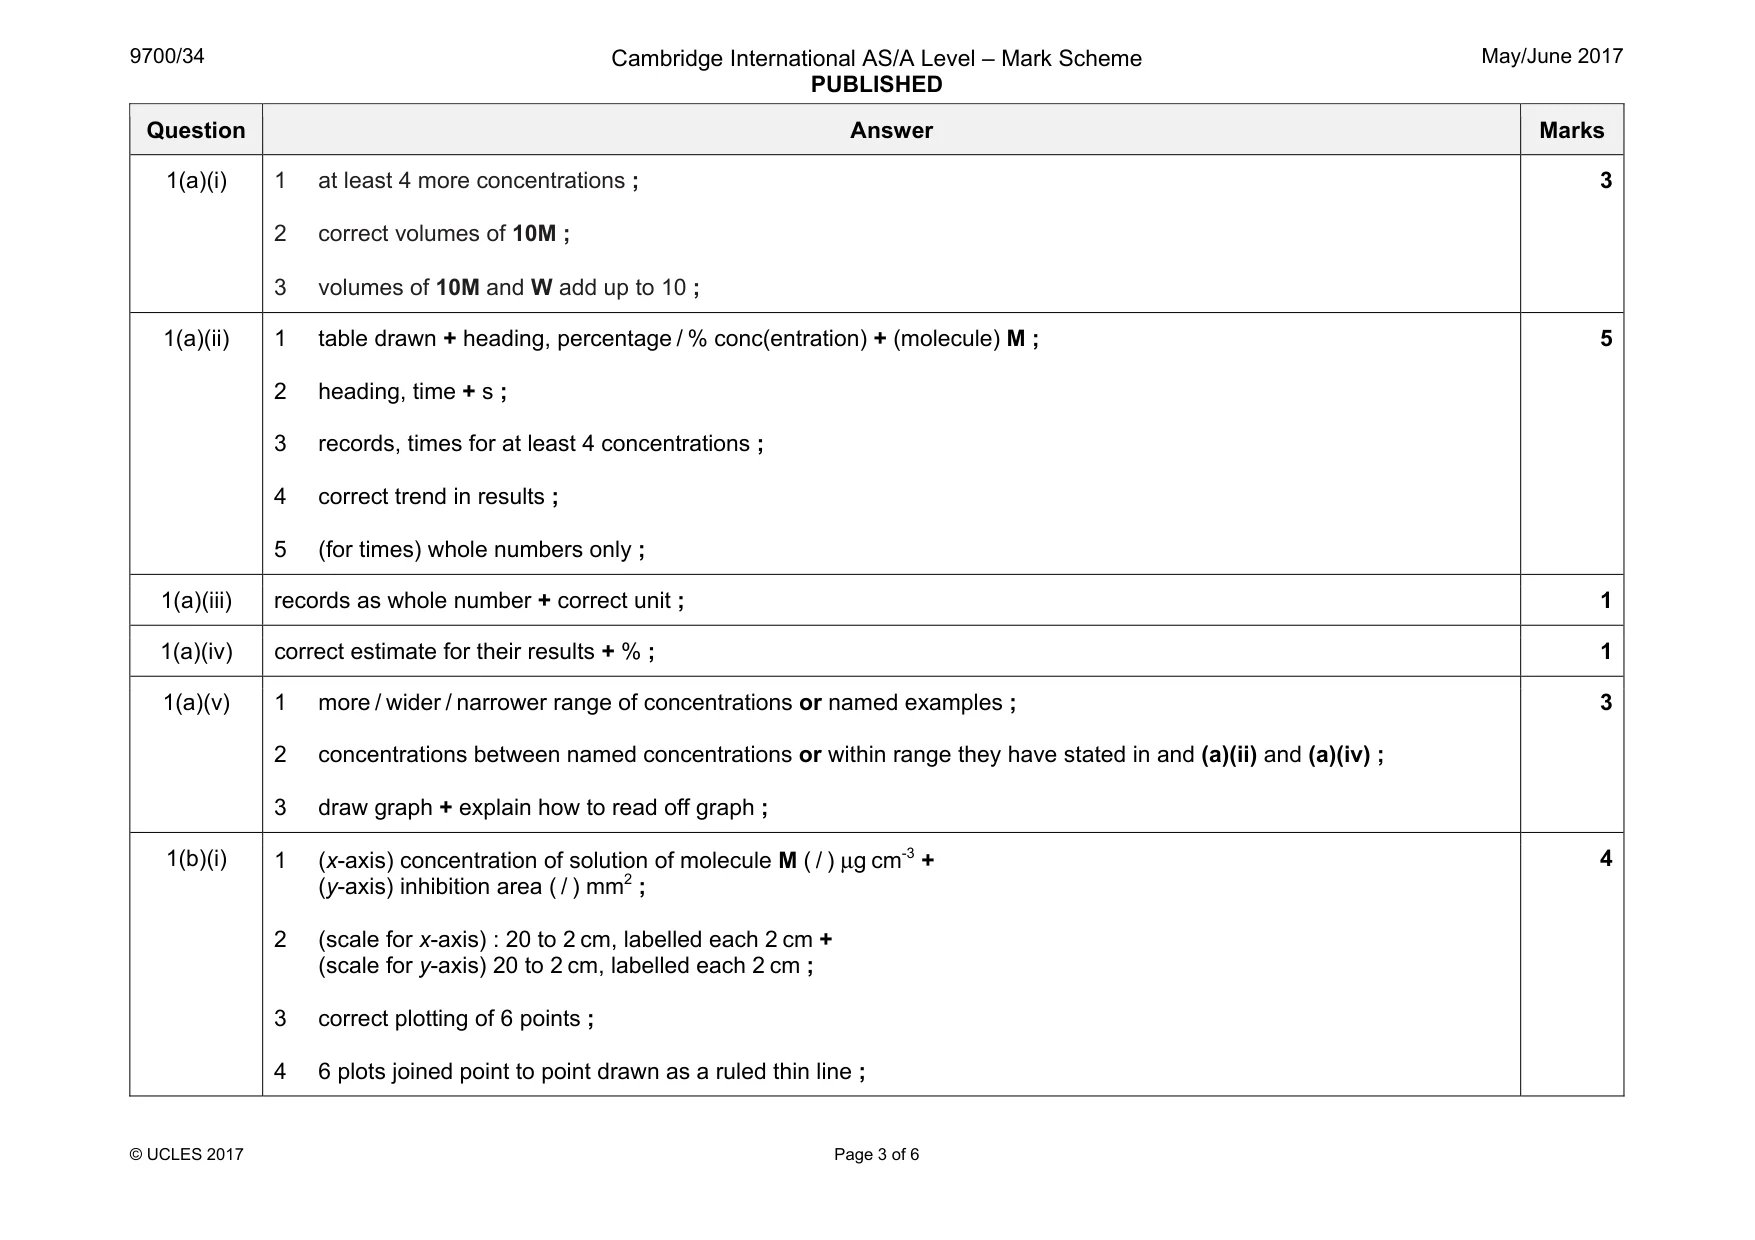
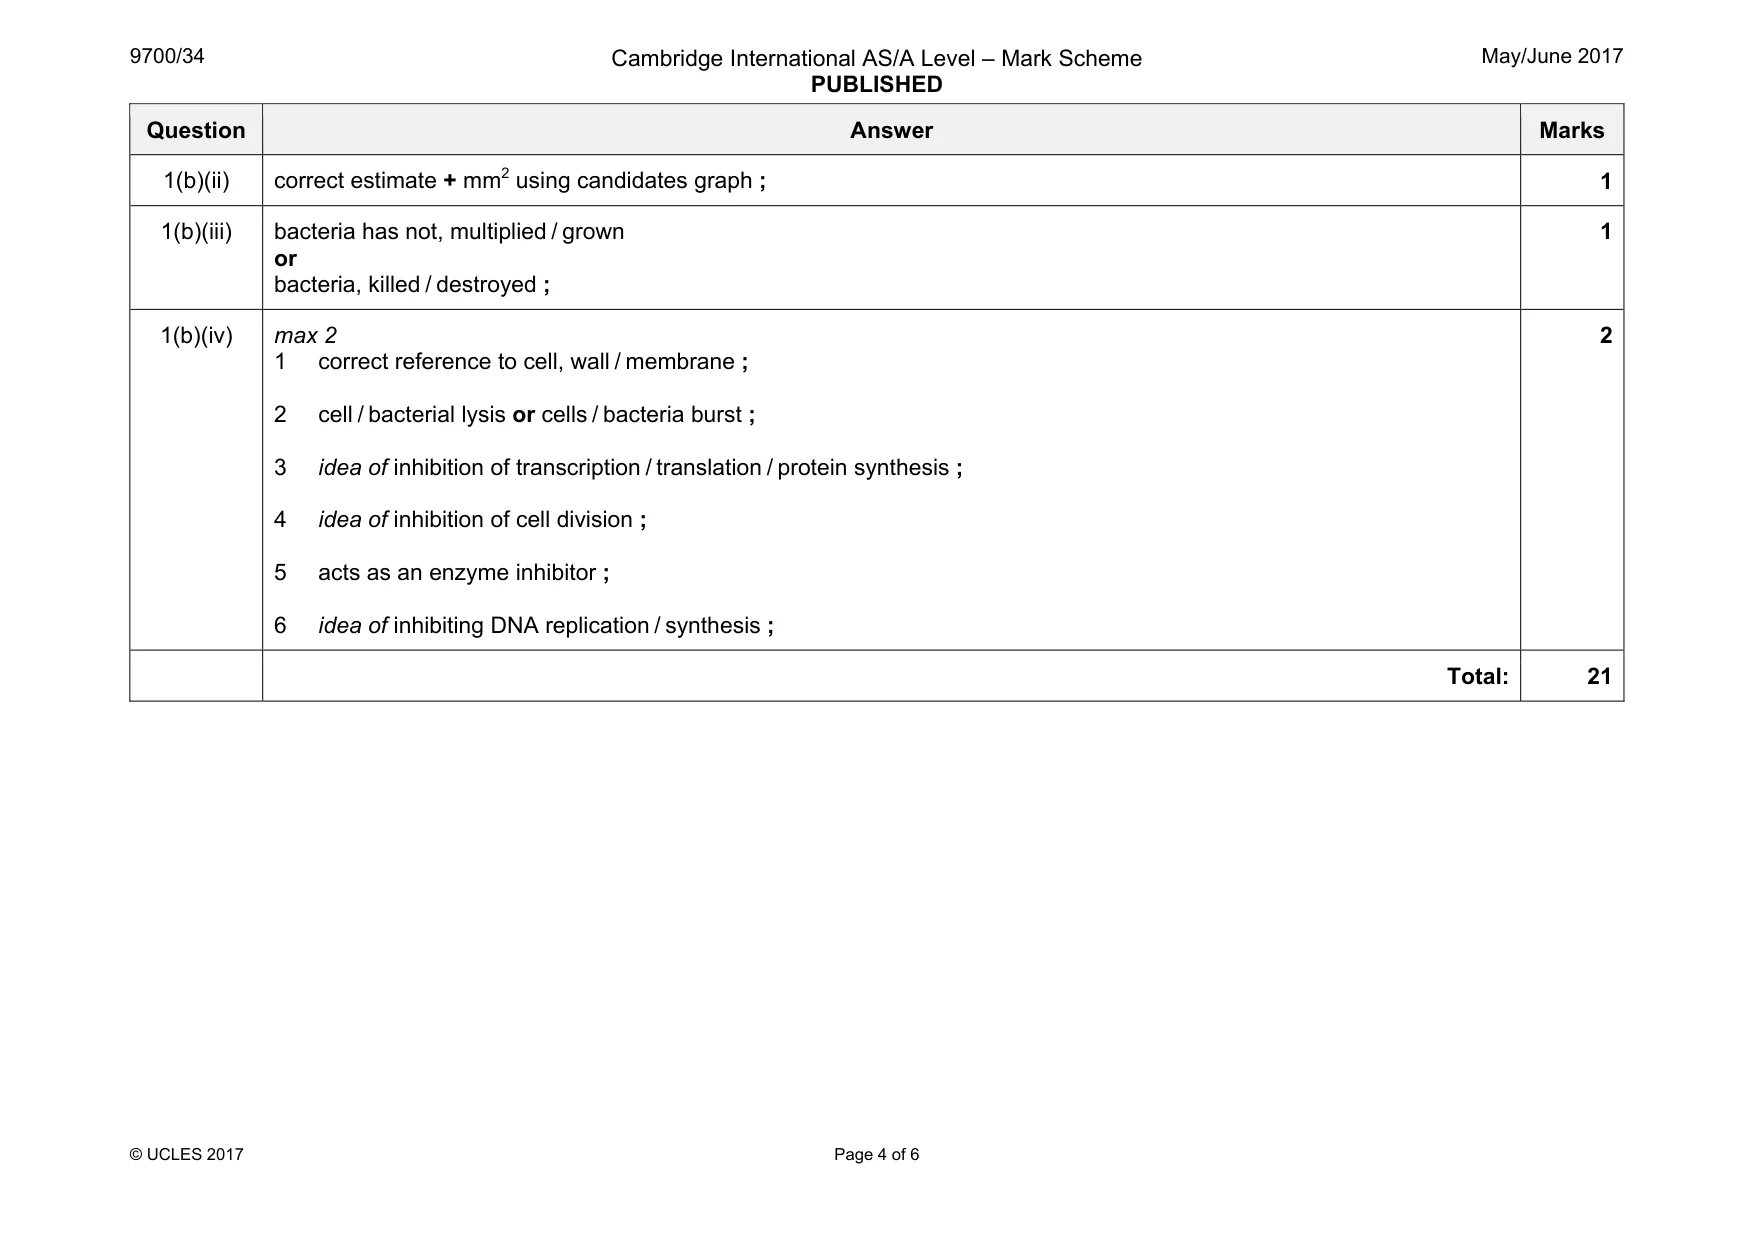
Mark scheme: 1(a)(i) 1 at least 4 more concentrations ; 2 correct volumes of 10M ; 3 volumes of 10M and W add up to 10 ; 3 1(a)(ii) 1 table drawn + heading, percentage / % conc(entration) + (molecule) M ; 2 heading, time + s ; 3 records, times for at least 4 concentrations ; 4 correct trend in results ; 5 (for times) whole numbers only ; 5 1(a)(iii) records as whole number + correct unit ; 1 1(a)(iv) correct estimate for their results + % ; 1 1(a)(v) 1 more / wider / narrower range of concentrations or named examples ; 2 concentrations between named concentrations or within range they have stated in and (a)(ii) and (a)(iv) ; 3 draw graph + explain how to read off graph ; 3 1(b)(i) 1 (x-axis) concentration of solution of molecule M ( / ) µg cm-3 + (y-axis) inhibition area ( / ) mm2 ; 2 (scale for x-axis) : 20 to 2 cm, labelled each 2 cm + (scale for y-axis) 20 to 2 cm, labelled each 2 cm ; 3 correct plotting of 6 points ; 4 6 plots joined point to point drawn as a ruled thin line ; 4 Question Answer Marks 1(b)(ii) correct estimate + mm2 using candidates graph ; 1 1(b)(iii) bacteria has not, multiplied / grown or bacteria, killed / destroyed ; 1 1(b)(iv) max 2 1 correct reference to cell, wall / membrane ; 2 cell / bacterial lysis or cells / bacteria burst ; 3 idea of inhibition of transcription / translation / protein synthesis ; 4 idea of inhibition of cell division ; 5 acts as an enzyme inhibitor ; 6 idea of inhibiting DNA replication / synthesis ; 2 Total: 21
Q2 · N1 is a slide of a stained transverse section through a plant leaf
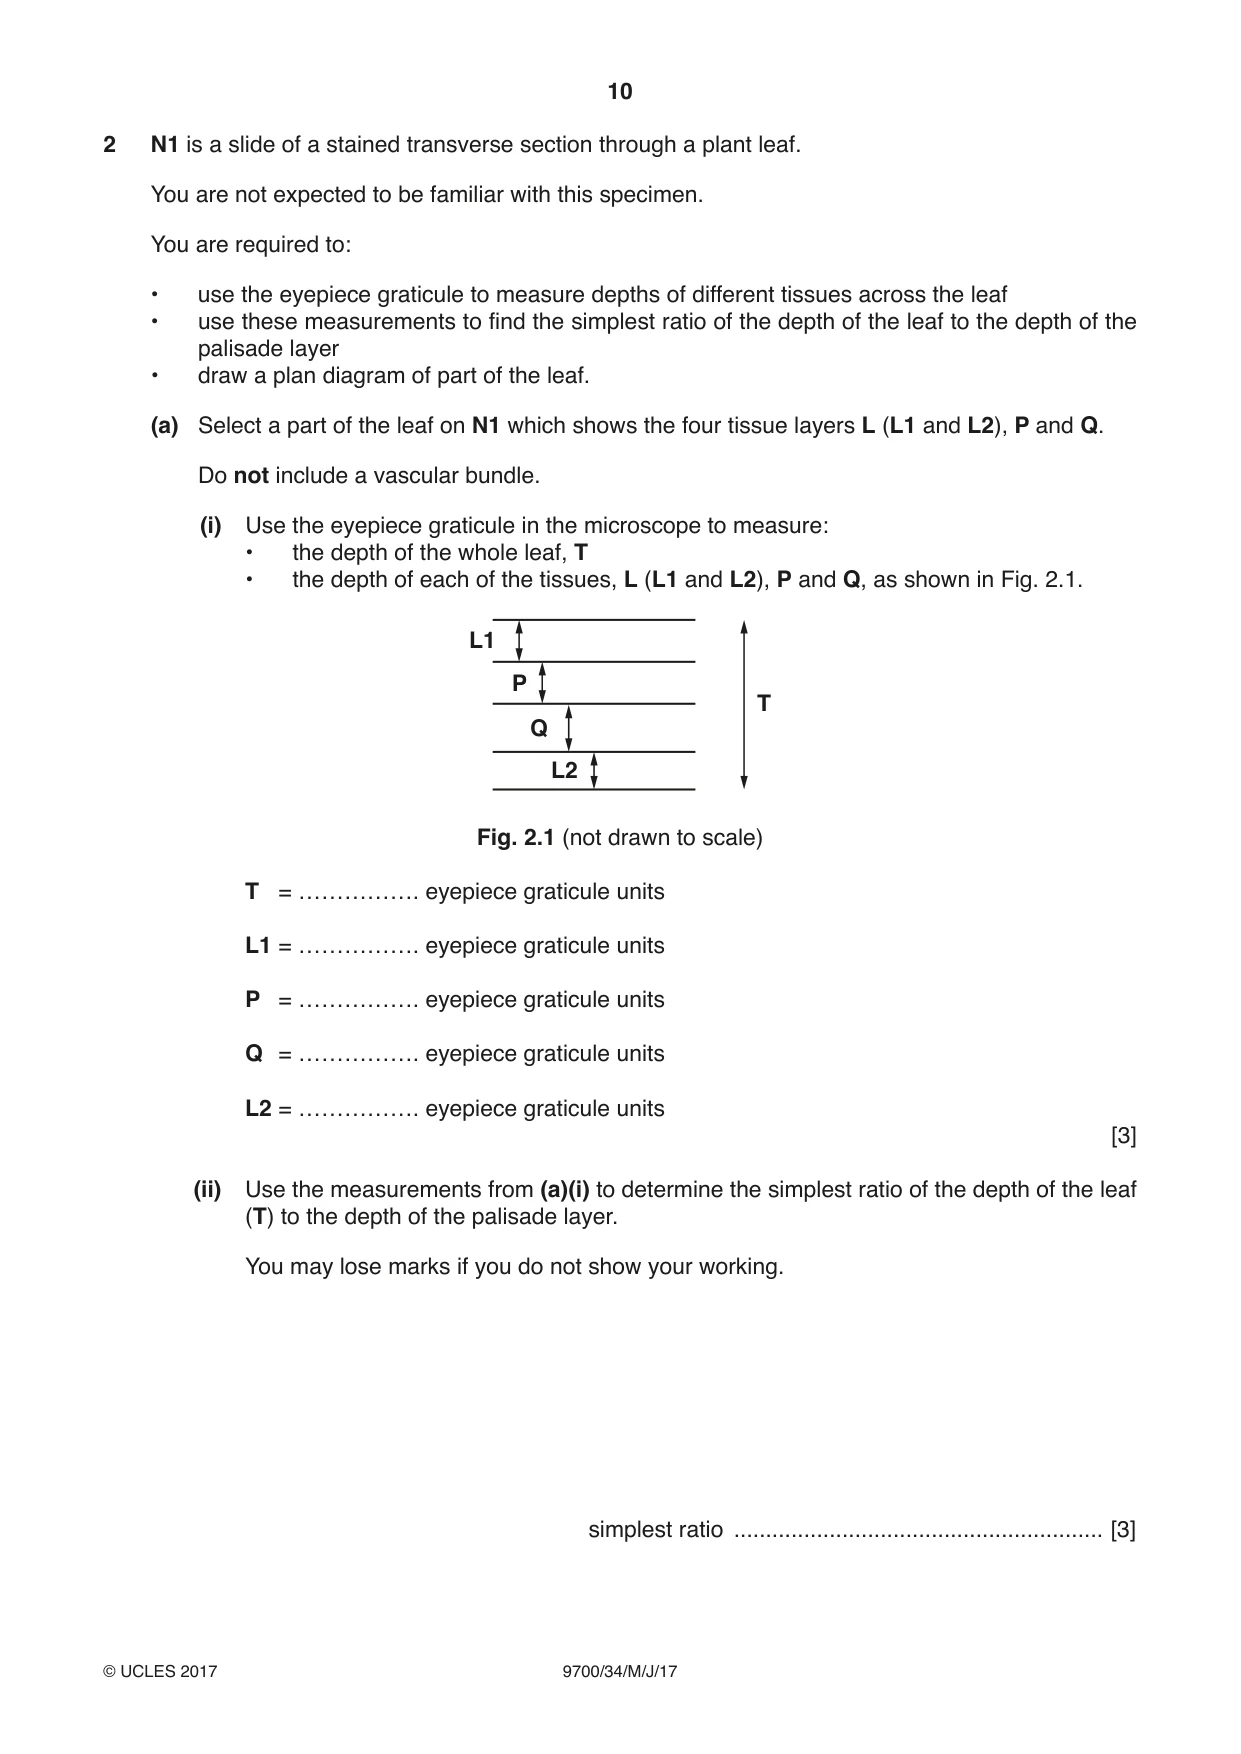
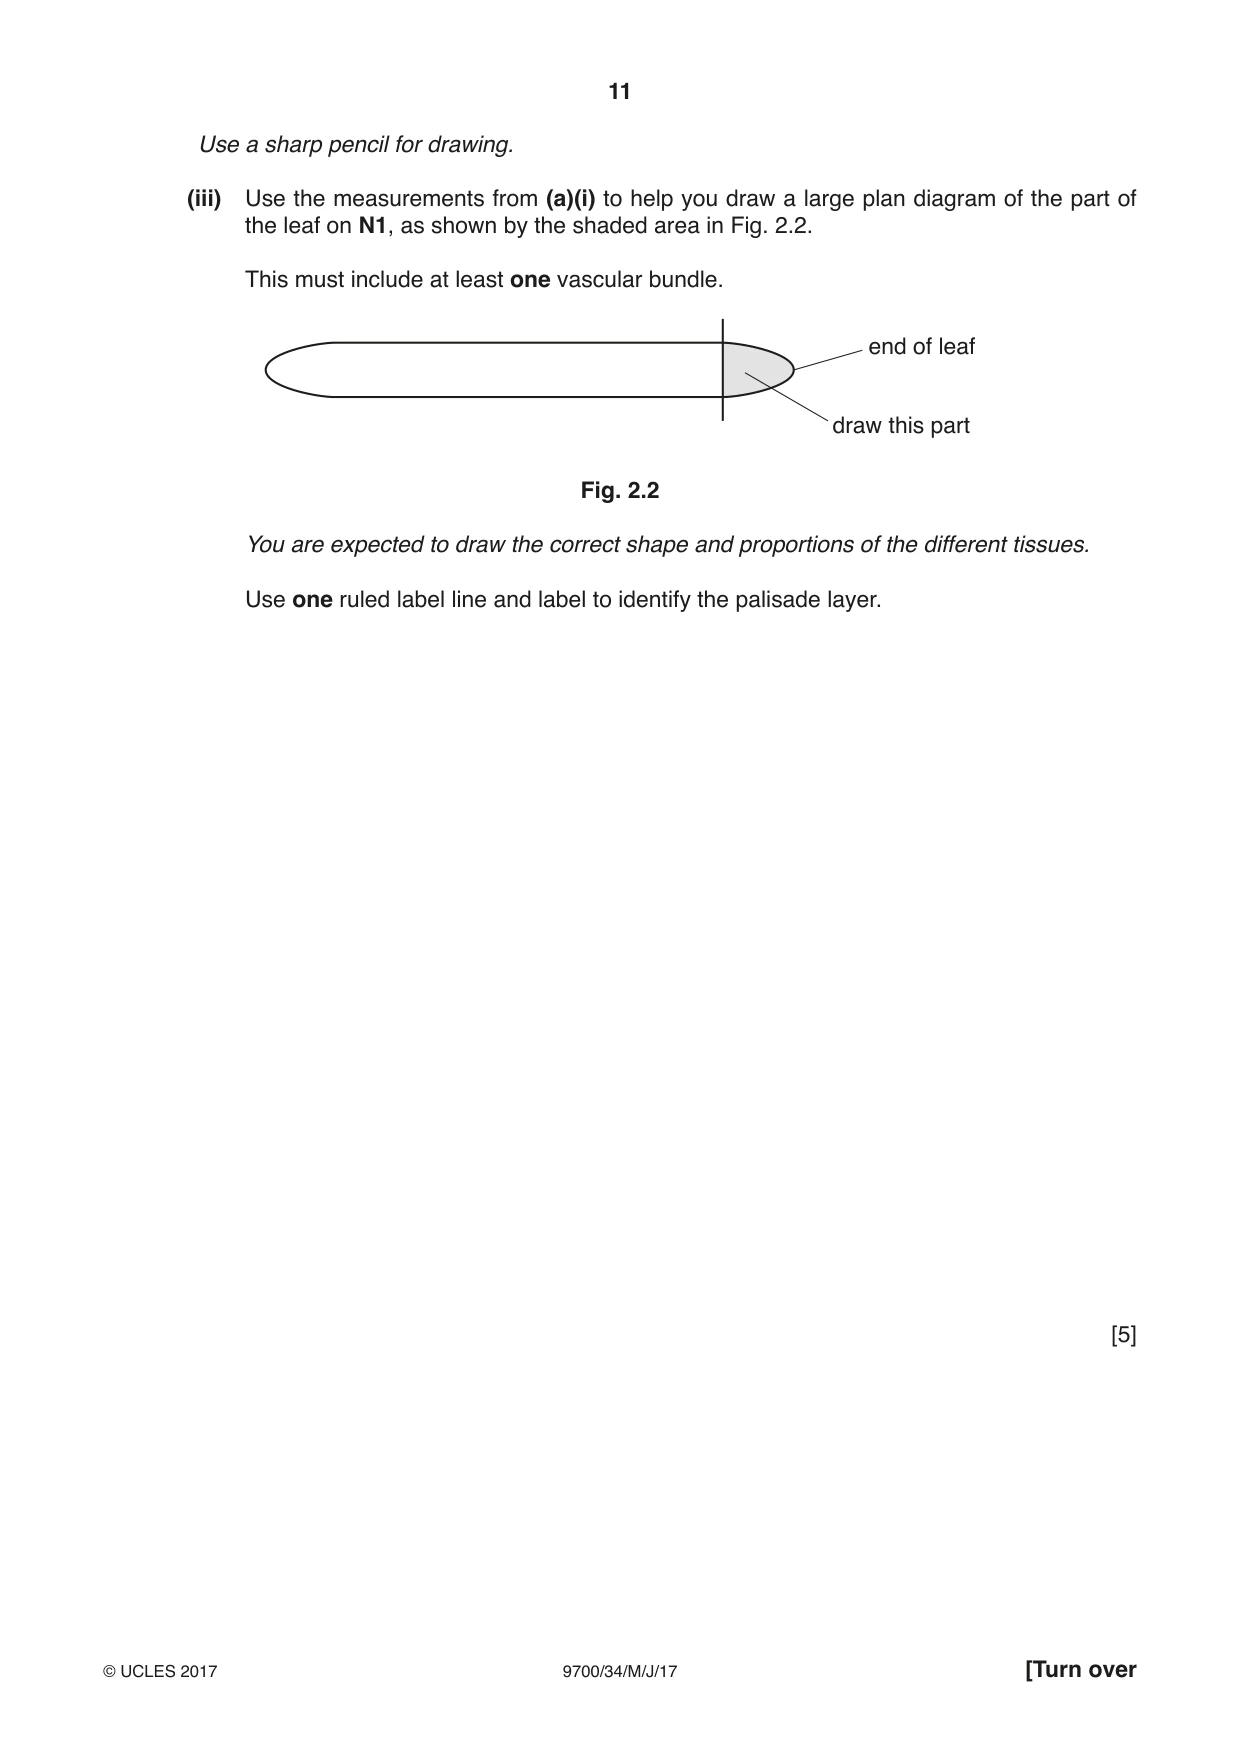
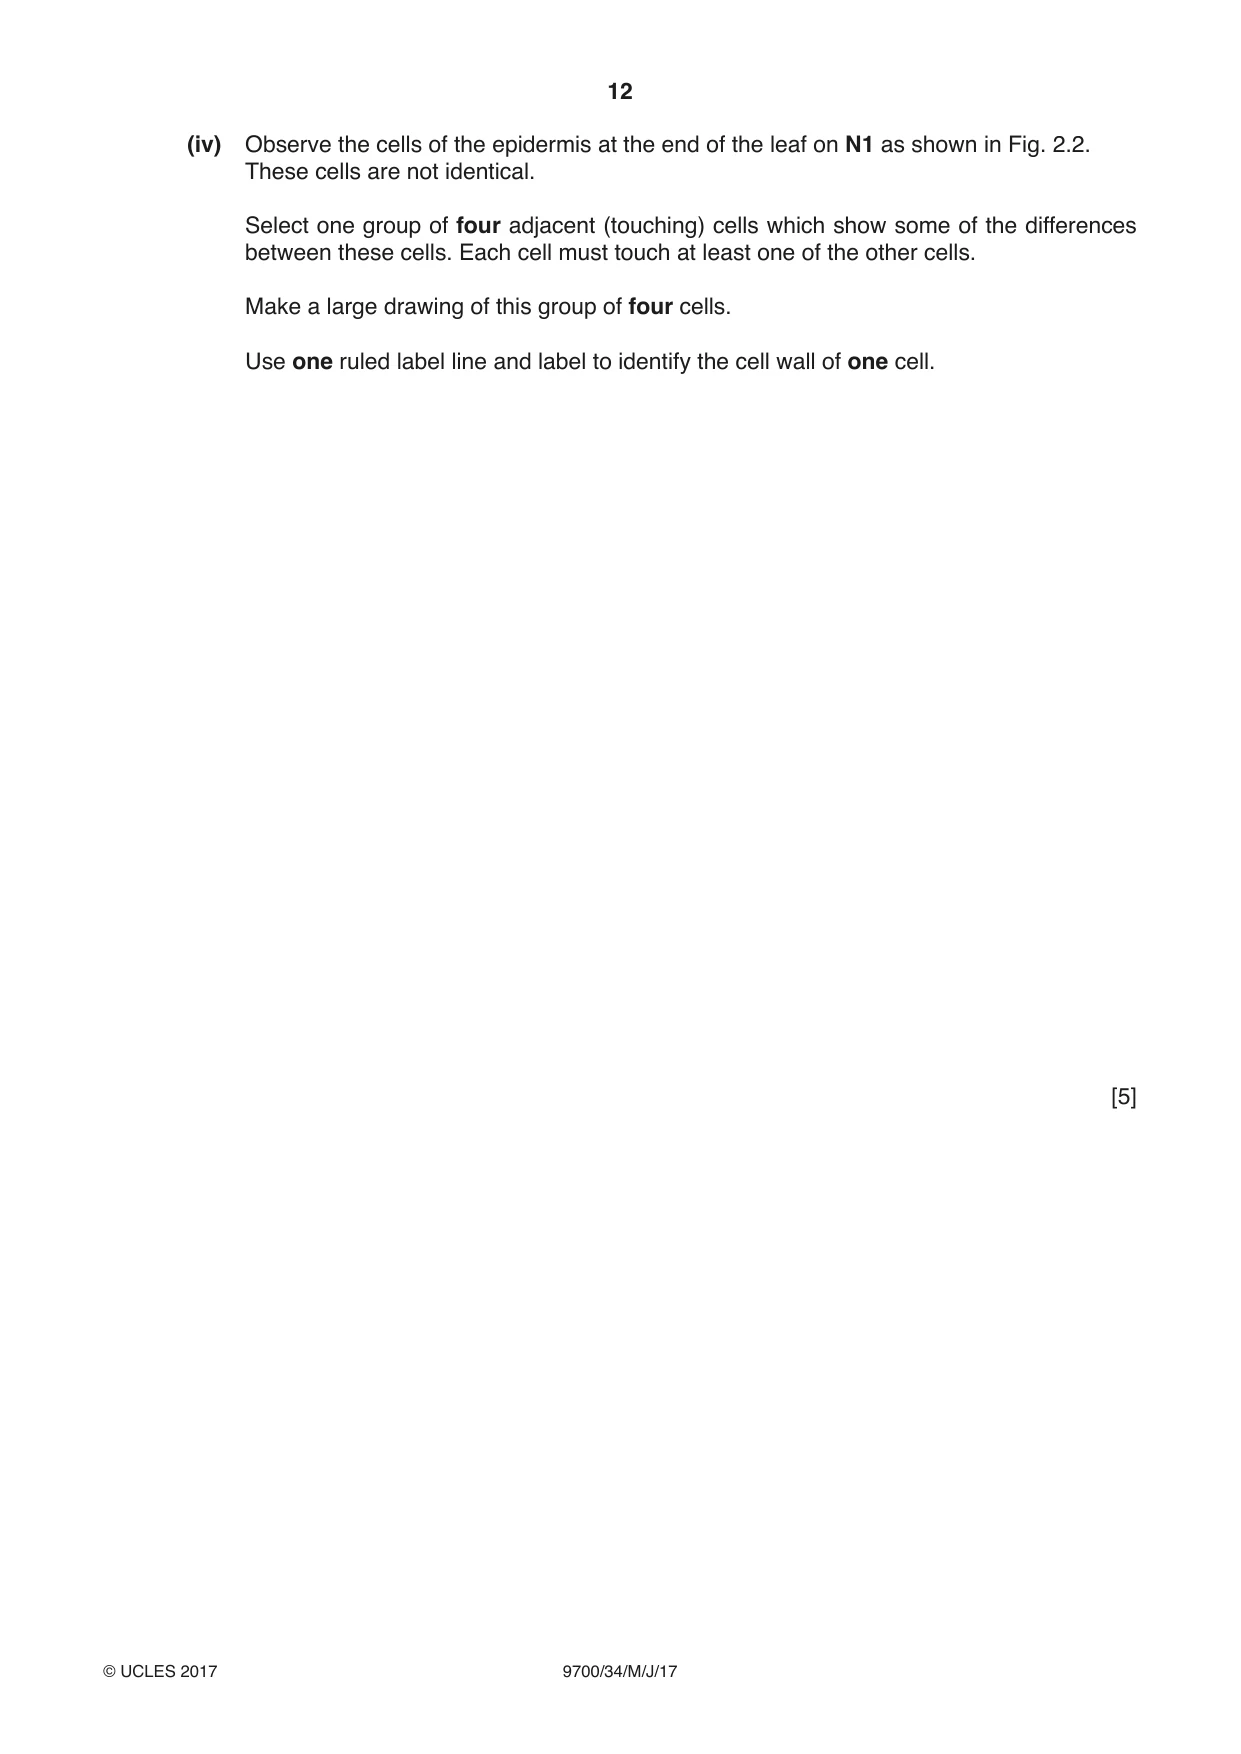
2 N1 is a slide of a stained transverse section through a plant leaf. You are not expected to be familiar with this specimen. You are required to: • use the eyepiece graticule to measure depths of different tissues across the leaf • use these measurements to find the simplest ratio of the depth of the leaf to the depth of the palisade layer • draw a plan diagram of part of the leaf. (a) Select a part of the leaf on N1 which shows the four tissue layers L (L1 and L2), P and Q. Do not include a vascular bundle. (i) Use the eyepiece graticule in the microscope to measure: • the depth of the whole leaf, T • the depth of each of the tissues, L (L1 and L2), P and Q, as shown in Fig. 2.1. L1 P T Q L2 Fig. 2.1 (not drawn to scale) T = ……………. eyepiece graticule units L1 = ……………. eyepiece graticule units P = ……………. eyepiece graticule units Q = ……………. eyepiece graticule units L2 = ……………. eyepiece graticule units [3] (ii) Use the measurements from (a)(i) to determine the simplest ratio of the depth of the leaf (T) to the depth of the palisade layer. You may lose marks if you do not show your working. simplest ratio .......................................................... [3] Use a sharp pencil for drawing. (iii) Use the measurements from (a)(i) to help you draw a large plan diagram of the part of the leaf on N1, as shown by the shaded area in Fig. 2.2. This must include at least one vascular bundle. end of leaf draw this part Fig. 2.2 You are expected to draw the correct shape and proportions of the different tissues. Use one ruled label line and label to identify the palisade layer. [5] (iv) Observe the cells of the epidermis at the end of the leaf on N1 as shown in Fig. 2.2. These cells are not identical. Select one group of four adjacent (touching) cells which show some of the differences between these cells. Each cell must touch at least one of the other cells. Make a large drawing of this group of four cells. Use one ruled label line and label to identify the cell wall of one cell. [5]
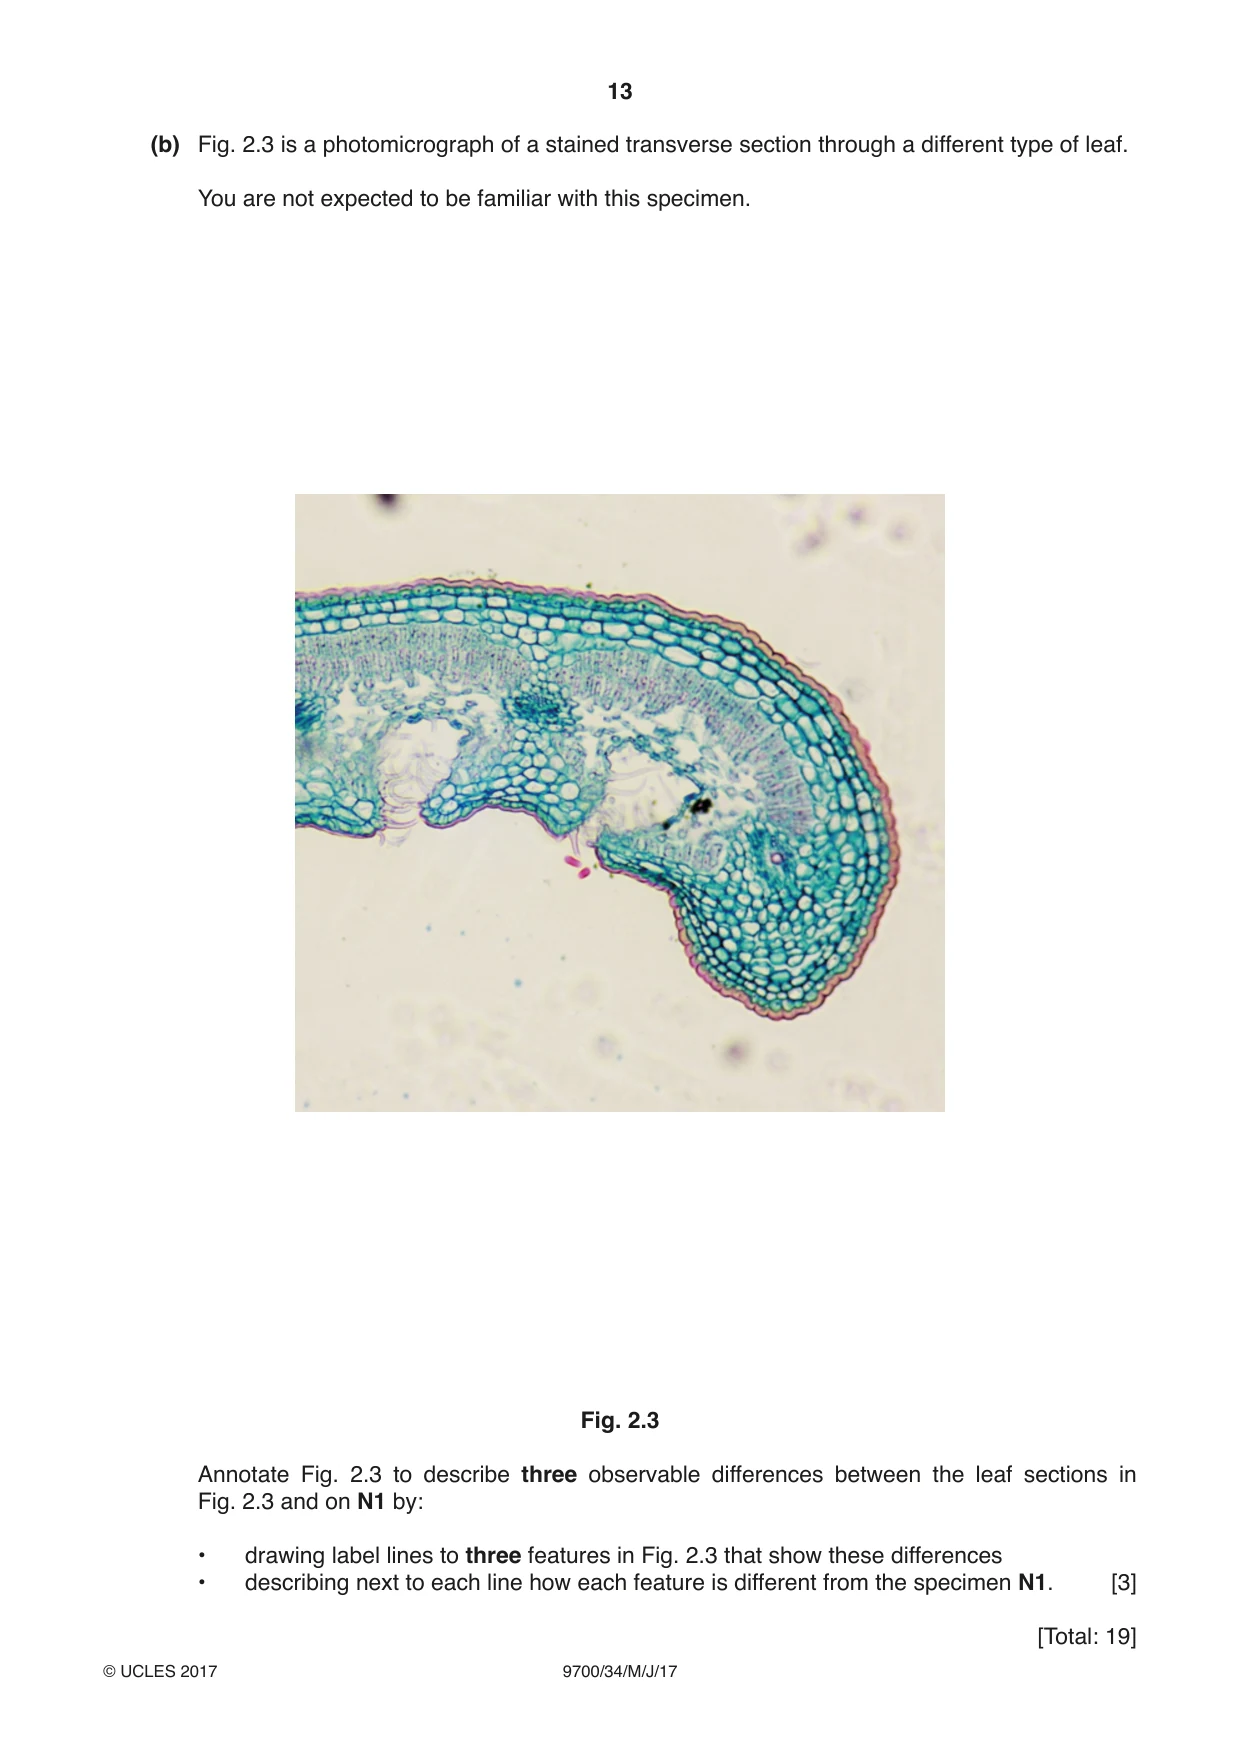
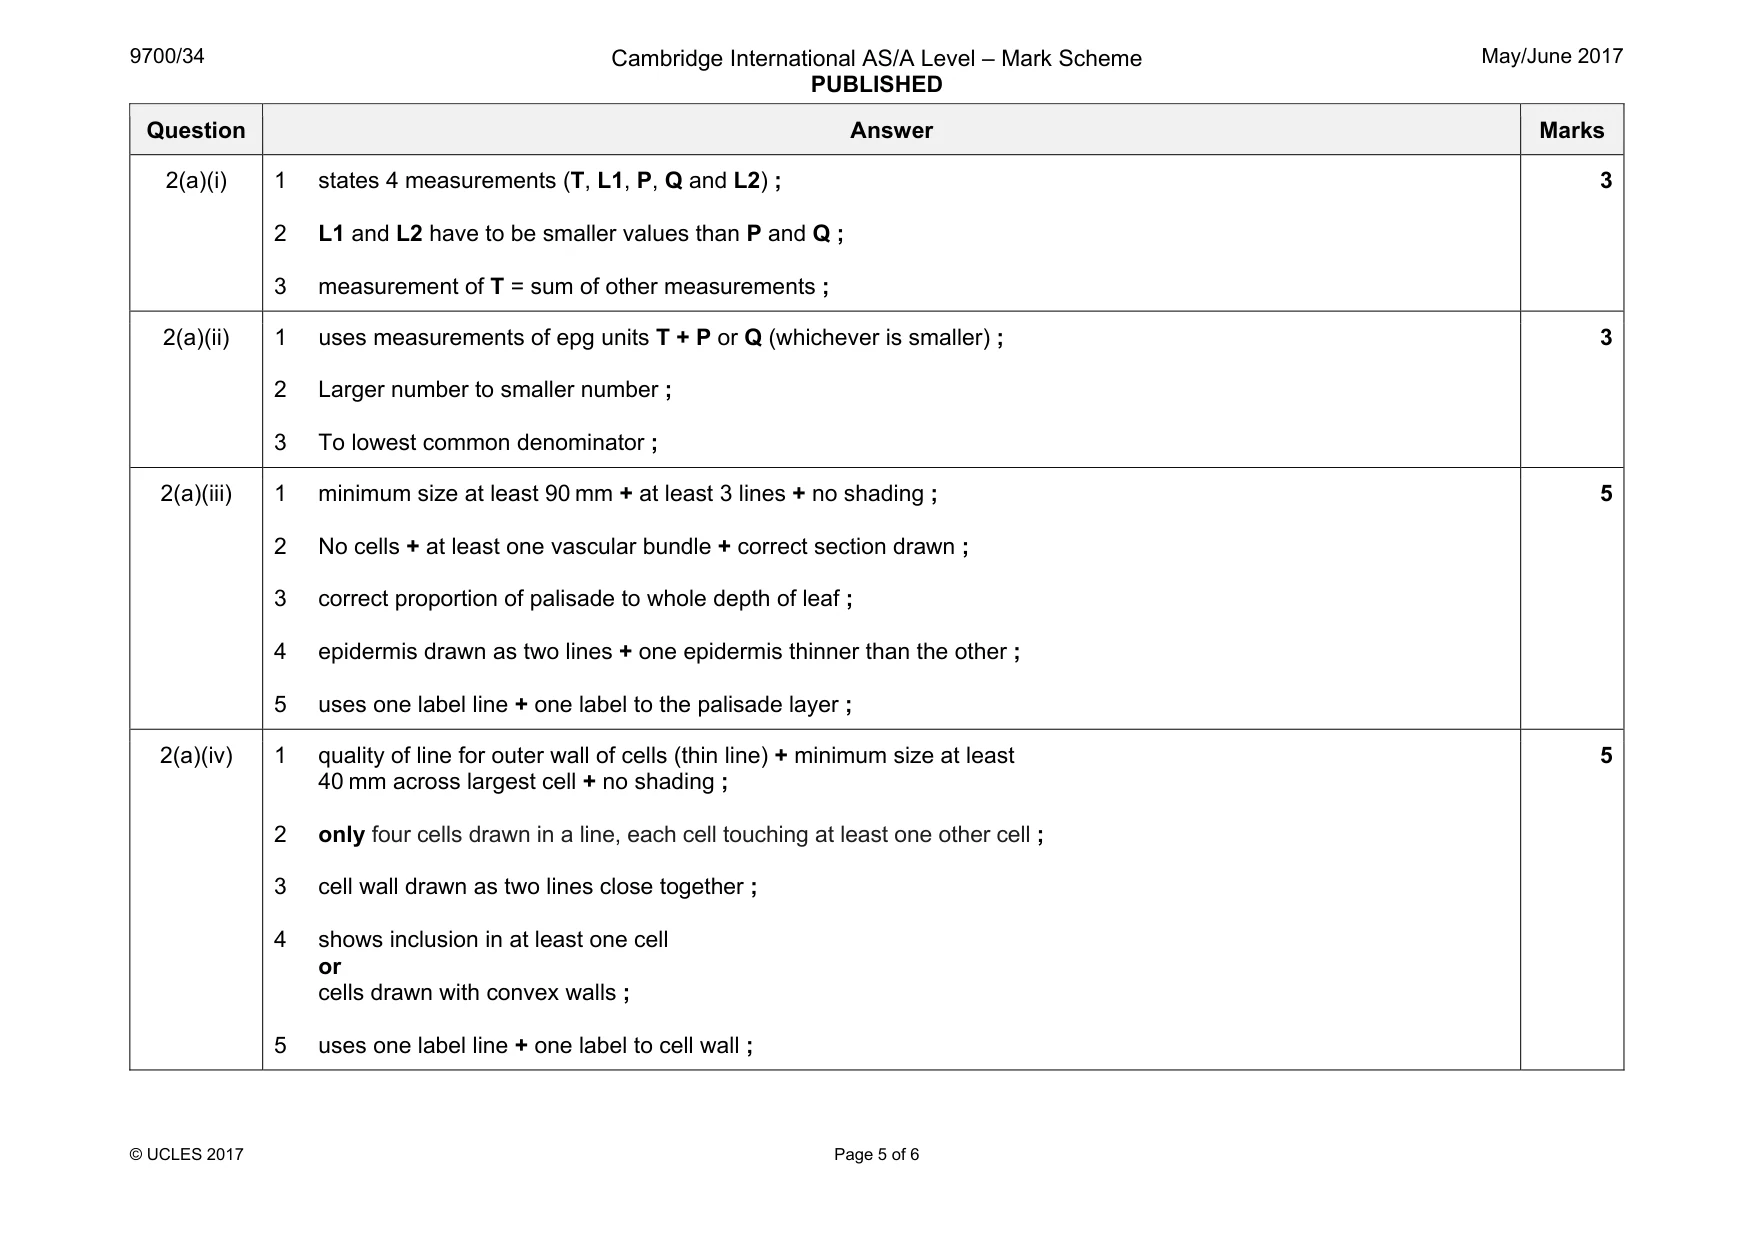
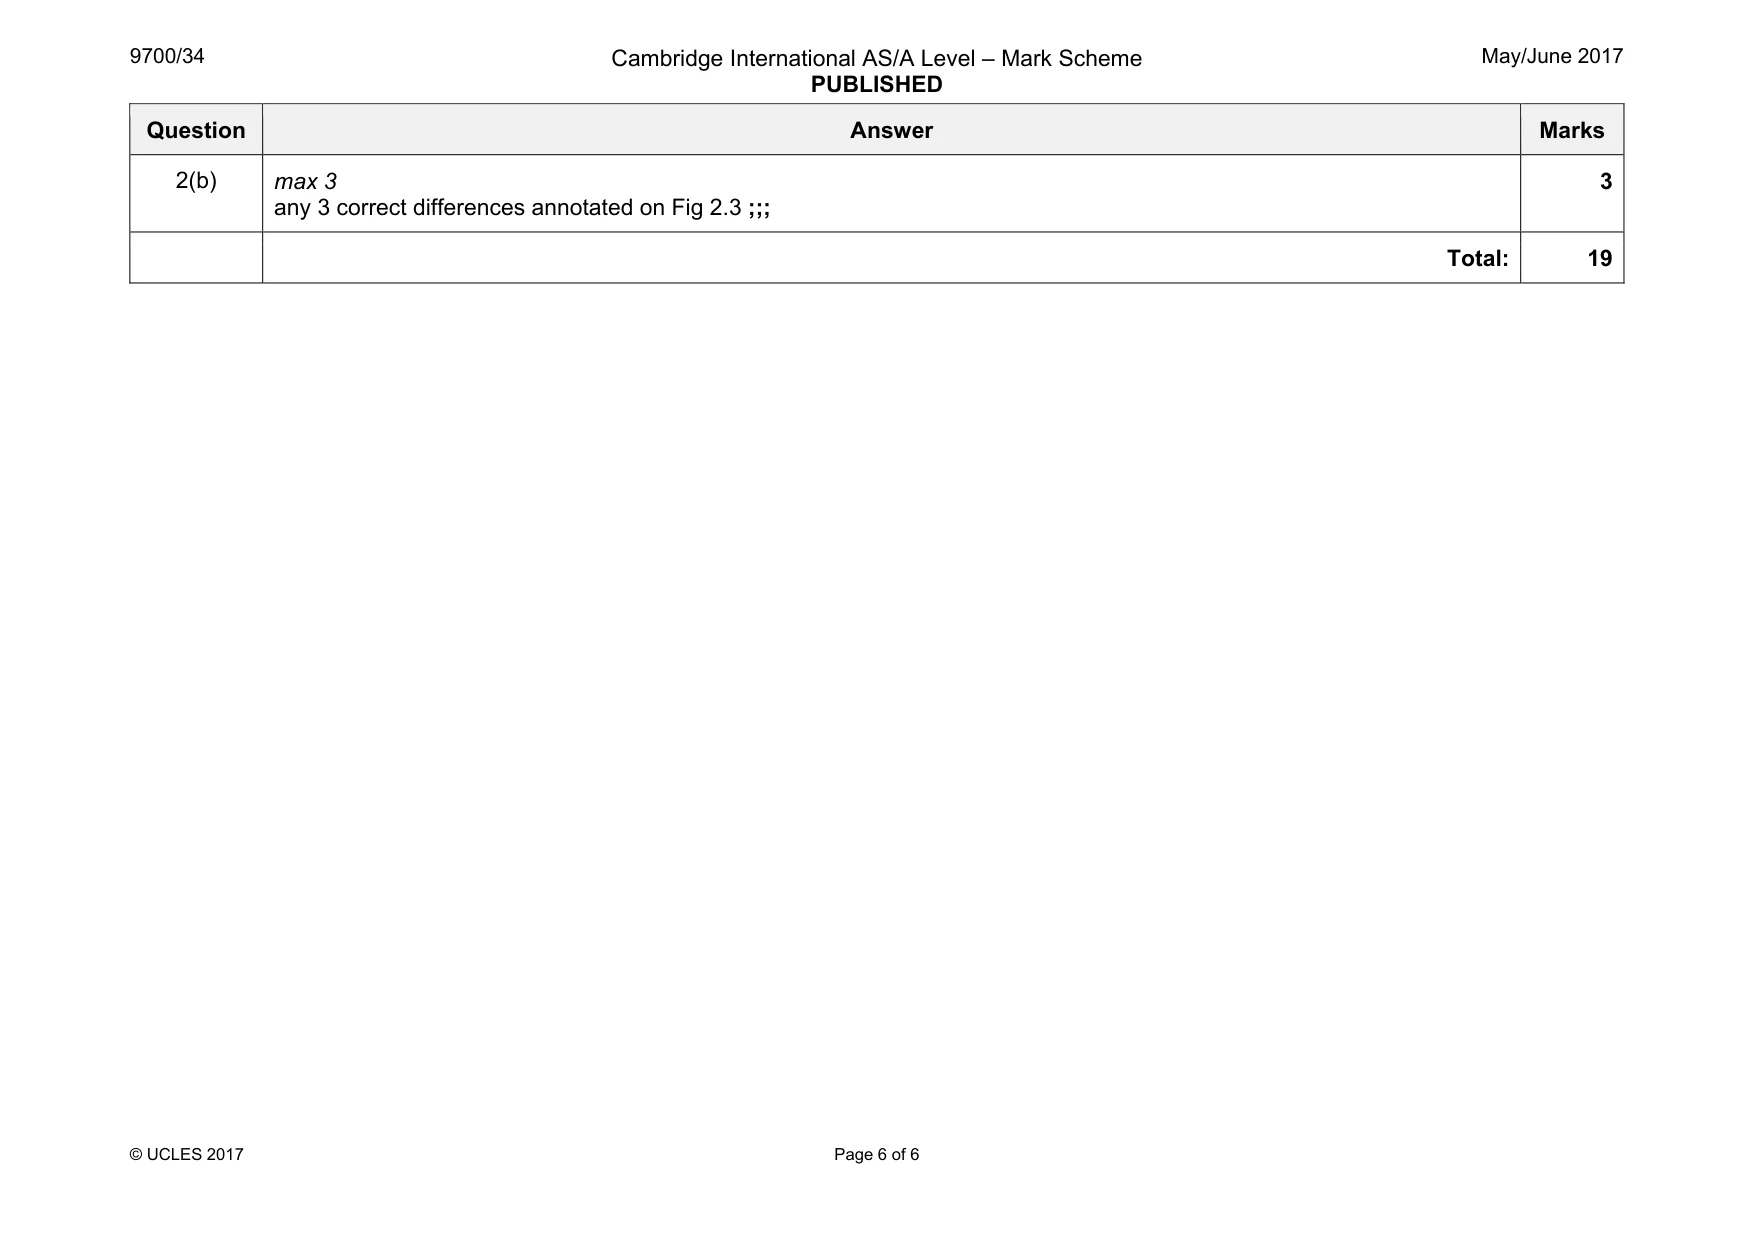
Mark scheme: 2(a)(i) 1 states 4 measurements (T, L1, P, Q and L2) ; 2 L1 and L2 have to be smaller values than P and Q ; 3 measurement of T = sum of other measurements ; 3 2(a)(ii) 1 uses measurements of epg units T + P or Q (whichever is smaller) ; 2 Larger number to smaller number ; 3 To lowest common denominator ; 3 2(a)(iii) 1 minimum size at least 90 mm + at least 3 lines + no shading ; 2 No cells + at least one vascular bundle + correct section drawn ; 3 correct proportion of palisade to whole depth of leaf ; 4 epidermis drawn as two lines + one epidermis thinner than the other ; 5 uses one label line + one label to the palisade layer ; 5 2(a)(iv) 1 quality of line for outer wall of cells (thin line) + minimum size at least 40 mm across largest cell + no shading ; 2 only four cells drawn in a line, each cell touching at least one other cell ; 3 cell wall drawn as two lines close together ; 4 shows inclusion in at least one cell or cells drawn with convex walls ; 5 uses one label line + one label to cell wall ; 5 Question Answer Marks 2(b) max 3 any 3 correct differences annotated on Fig 2.3 ;;; 3 Total: 19
What was in this paper
The subtopics covered by these 2 questions, and how many questions each got. Open one in a new tab to see every Cambridge question on it.
What you needed in this session
Cambridge’s own grade thresholds for 2017 May/June, Paper 3 · Variant 4. A higher threshold means an easier paper — the bar moves with how the cohort did.