Cambridge A Level Biology 9700 — 2017 May/June Paper 3 · Variant 2
9700/32/M/J/17 · 2 questions · 40 marks · ≈45 min
The question paper and its mark scheme, free to read here and free to download. This is Cambridge’s own paper, exactly as it was sat.
Question paper16 pages



Mark scheme5 pages
Answers below. Sit the paper first if you are practising.
Questions as text
Q1 · The enzyme, E, catalyses the reaction of urea with water to form ammonium carbonate
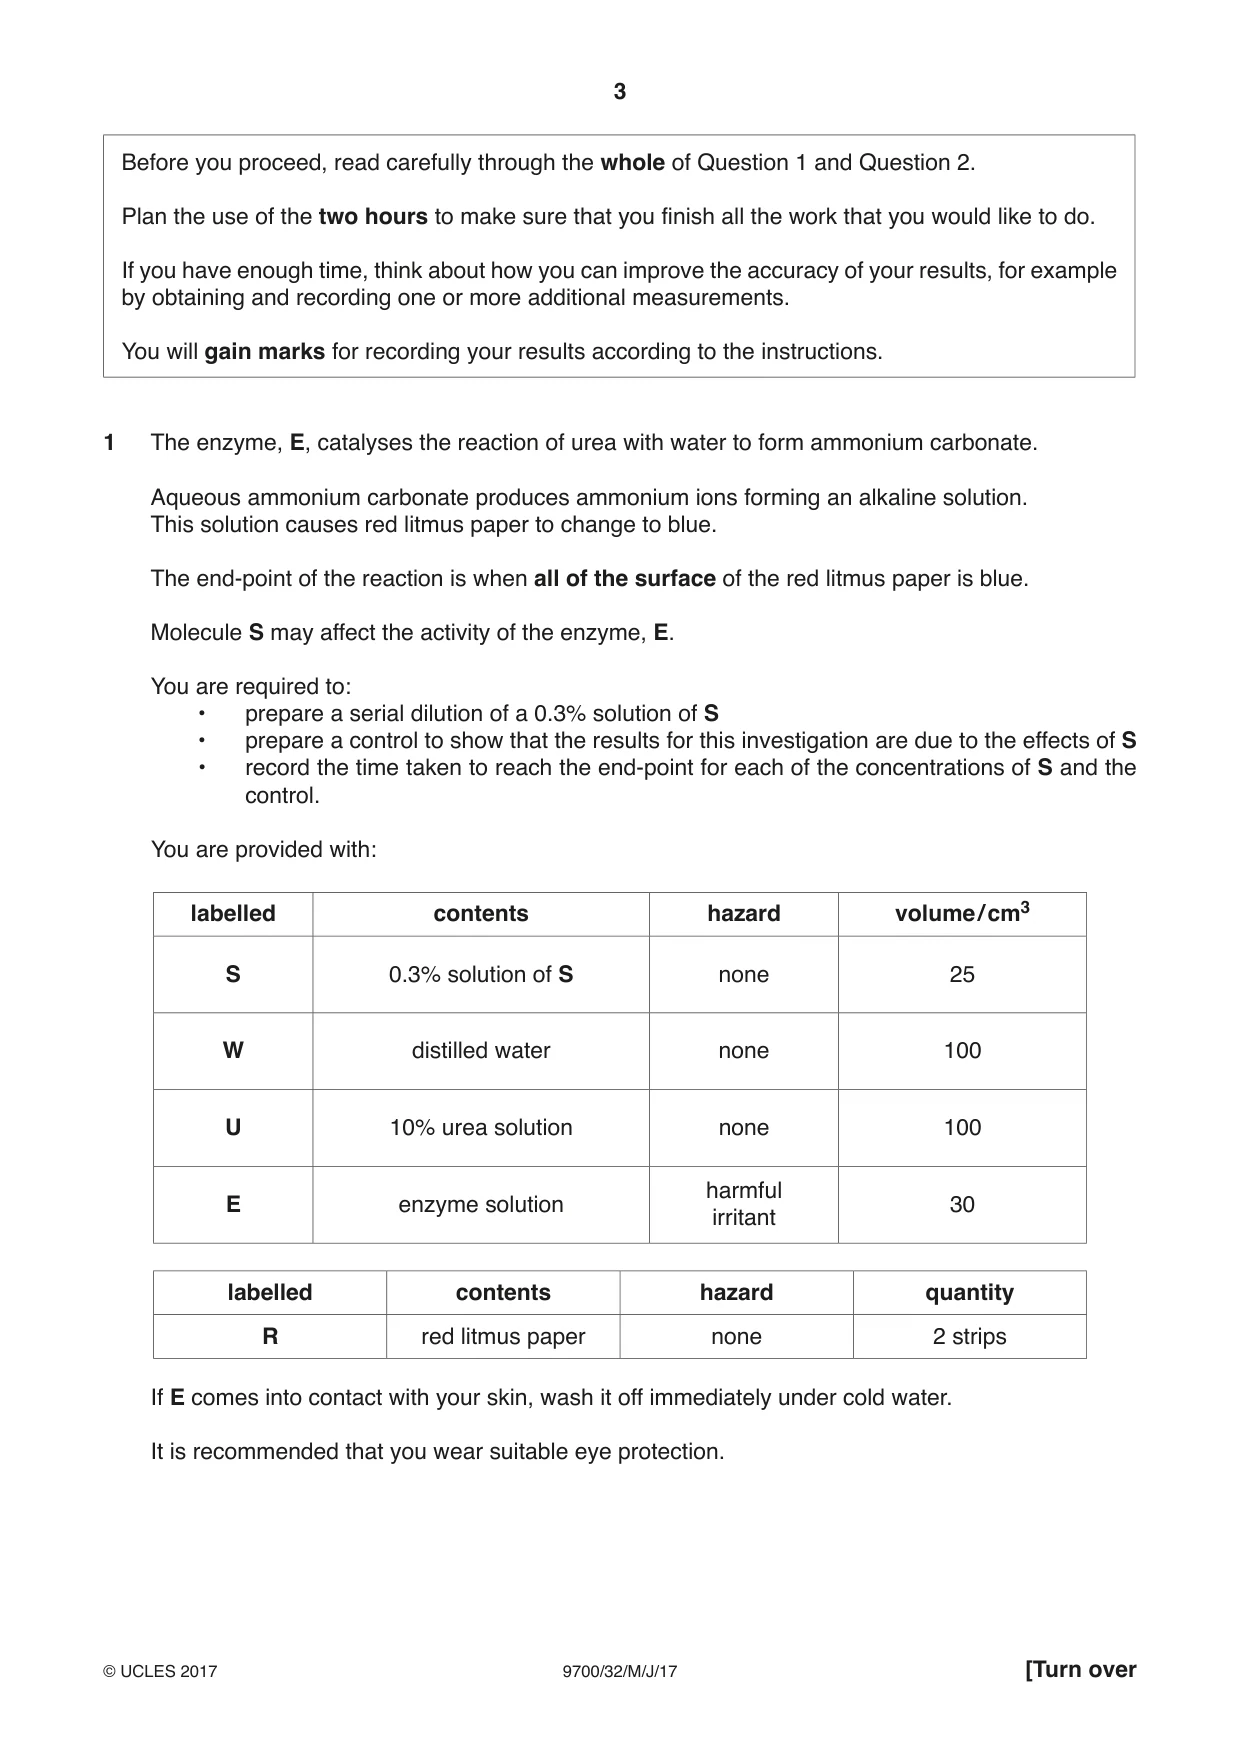
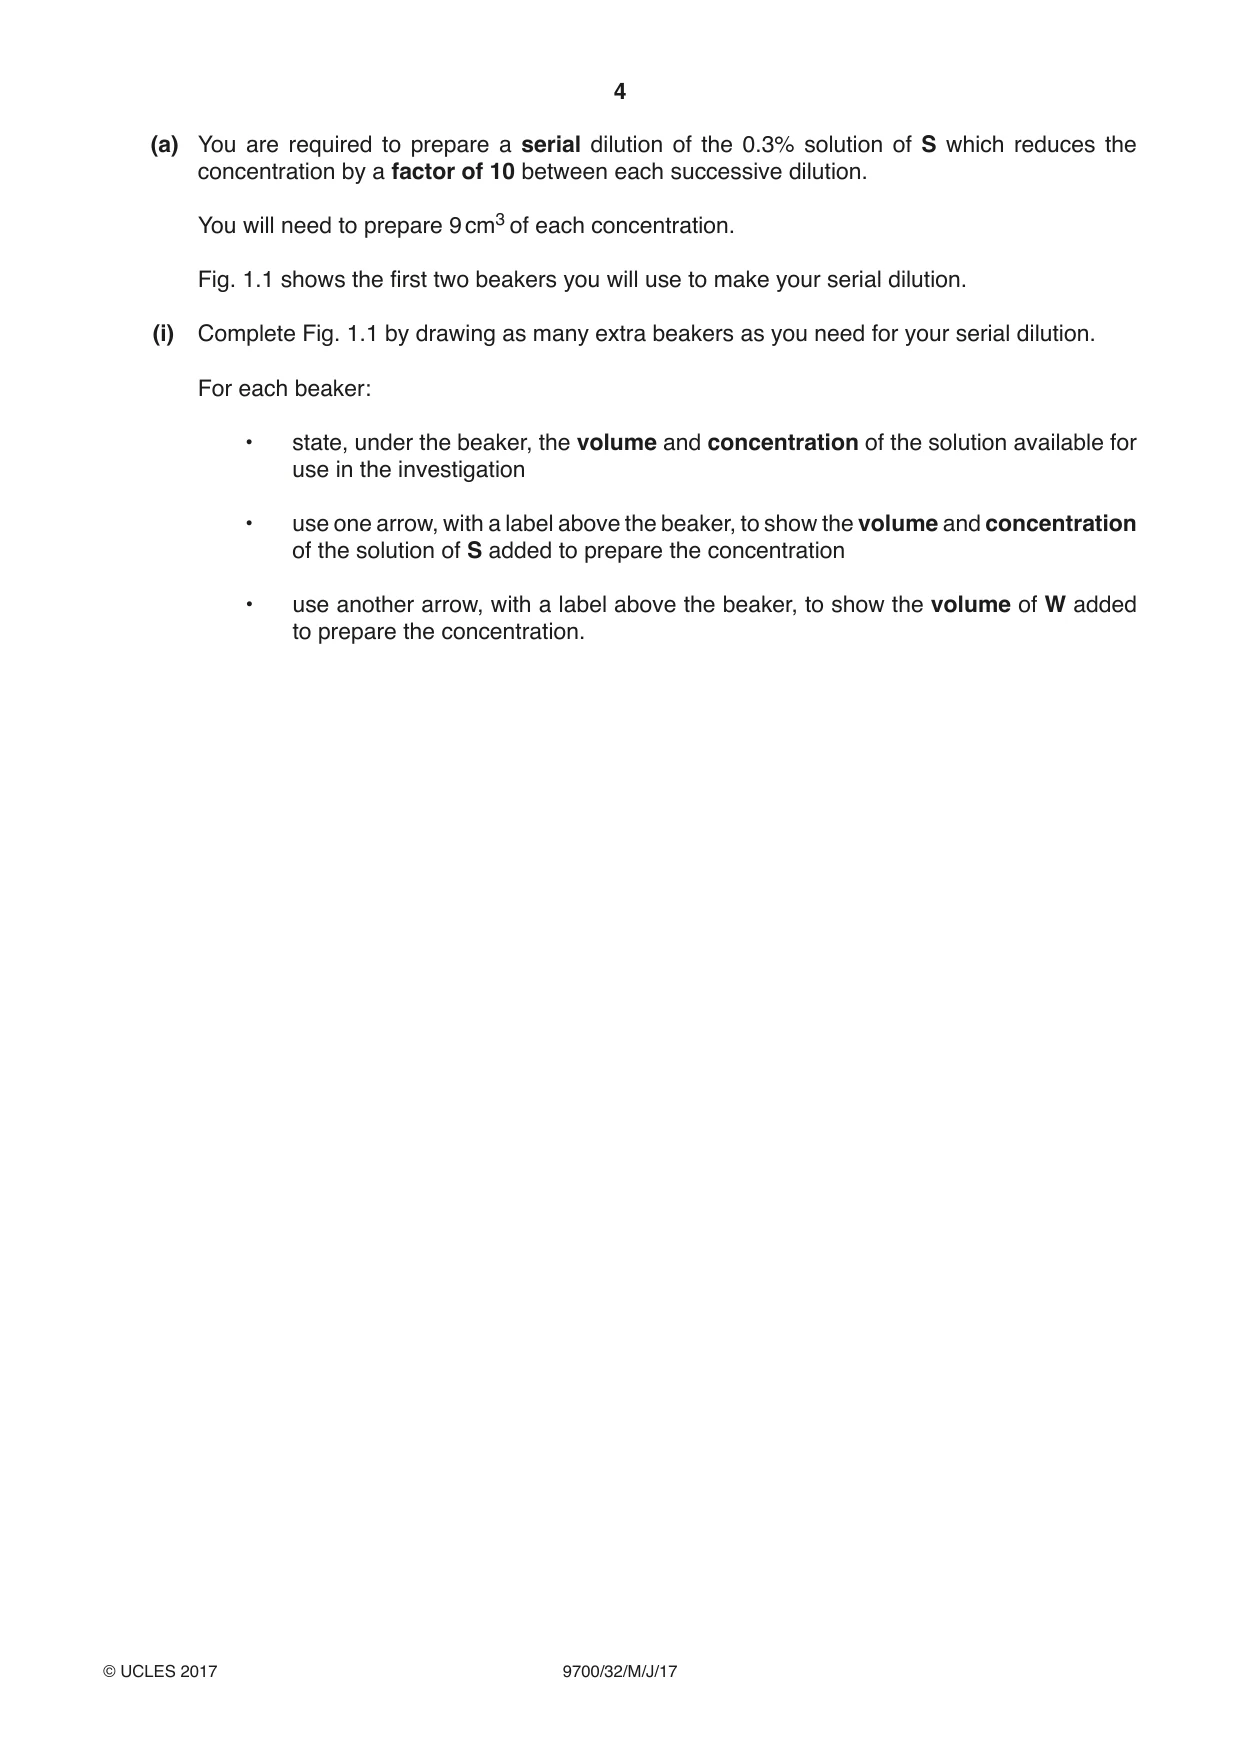
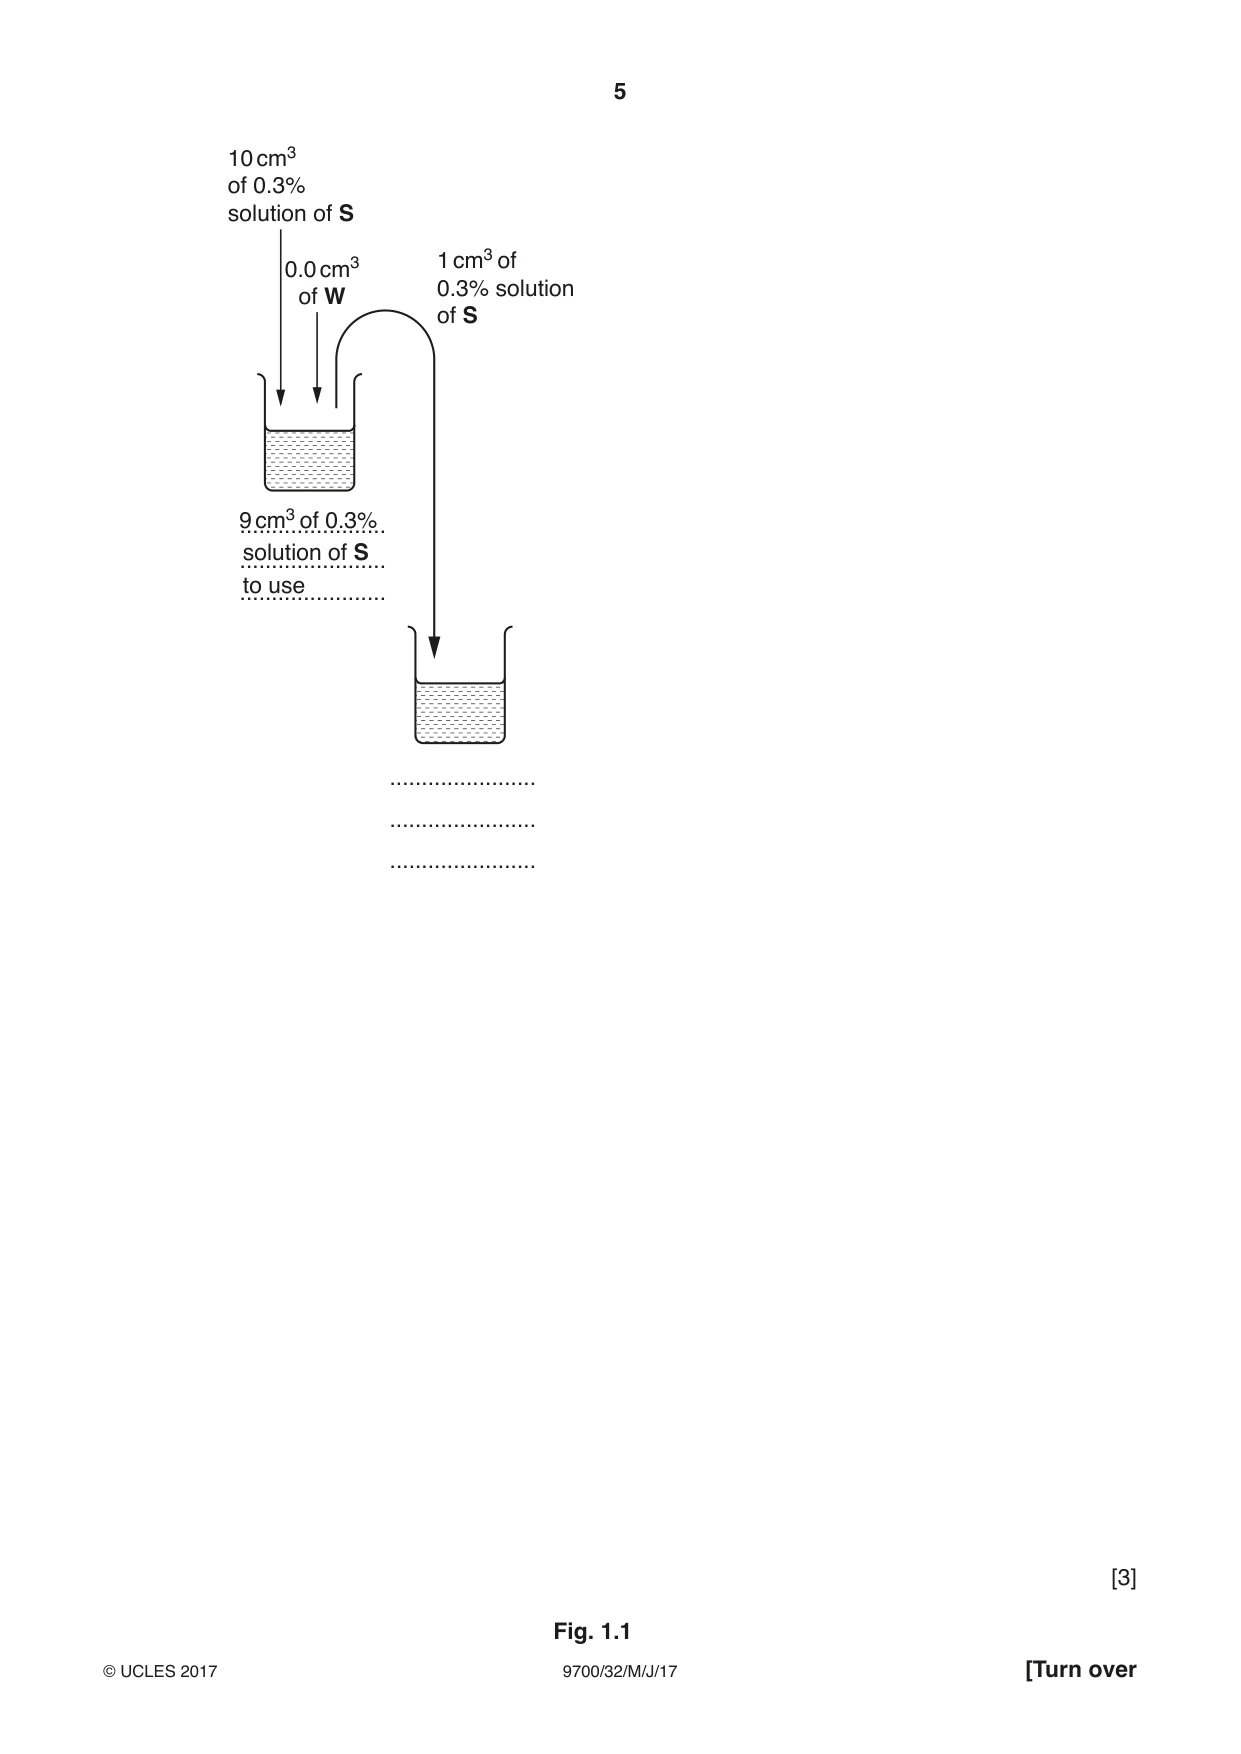
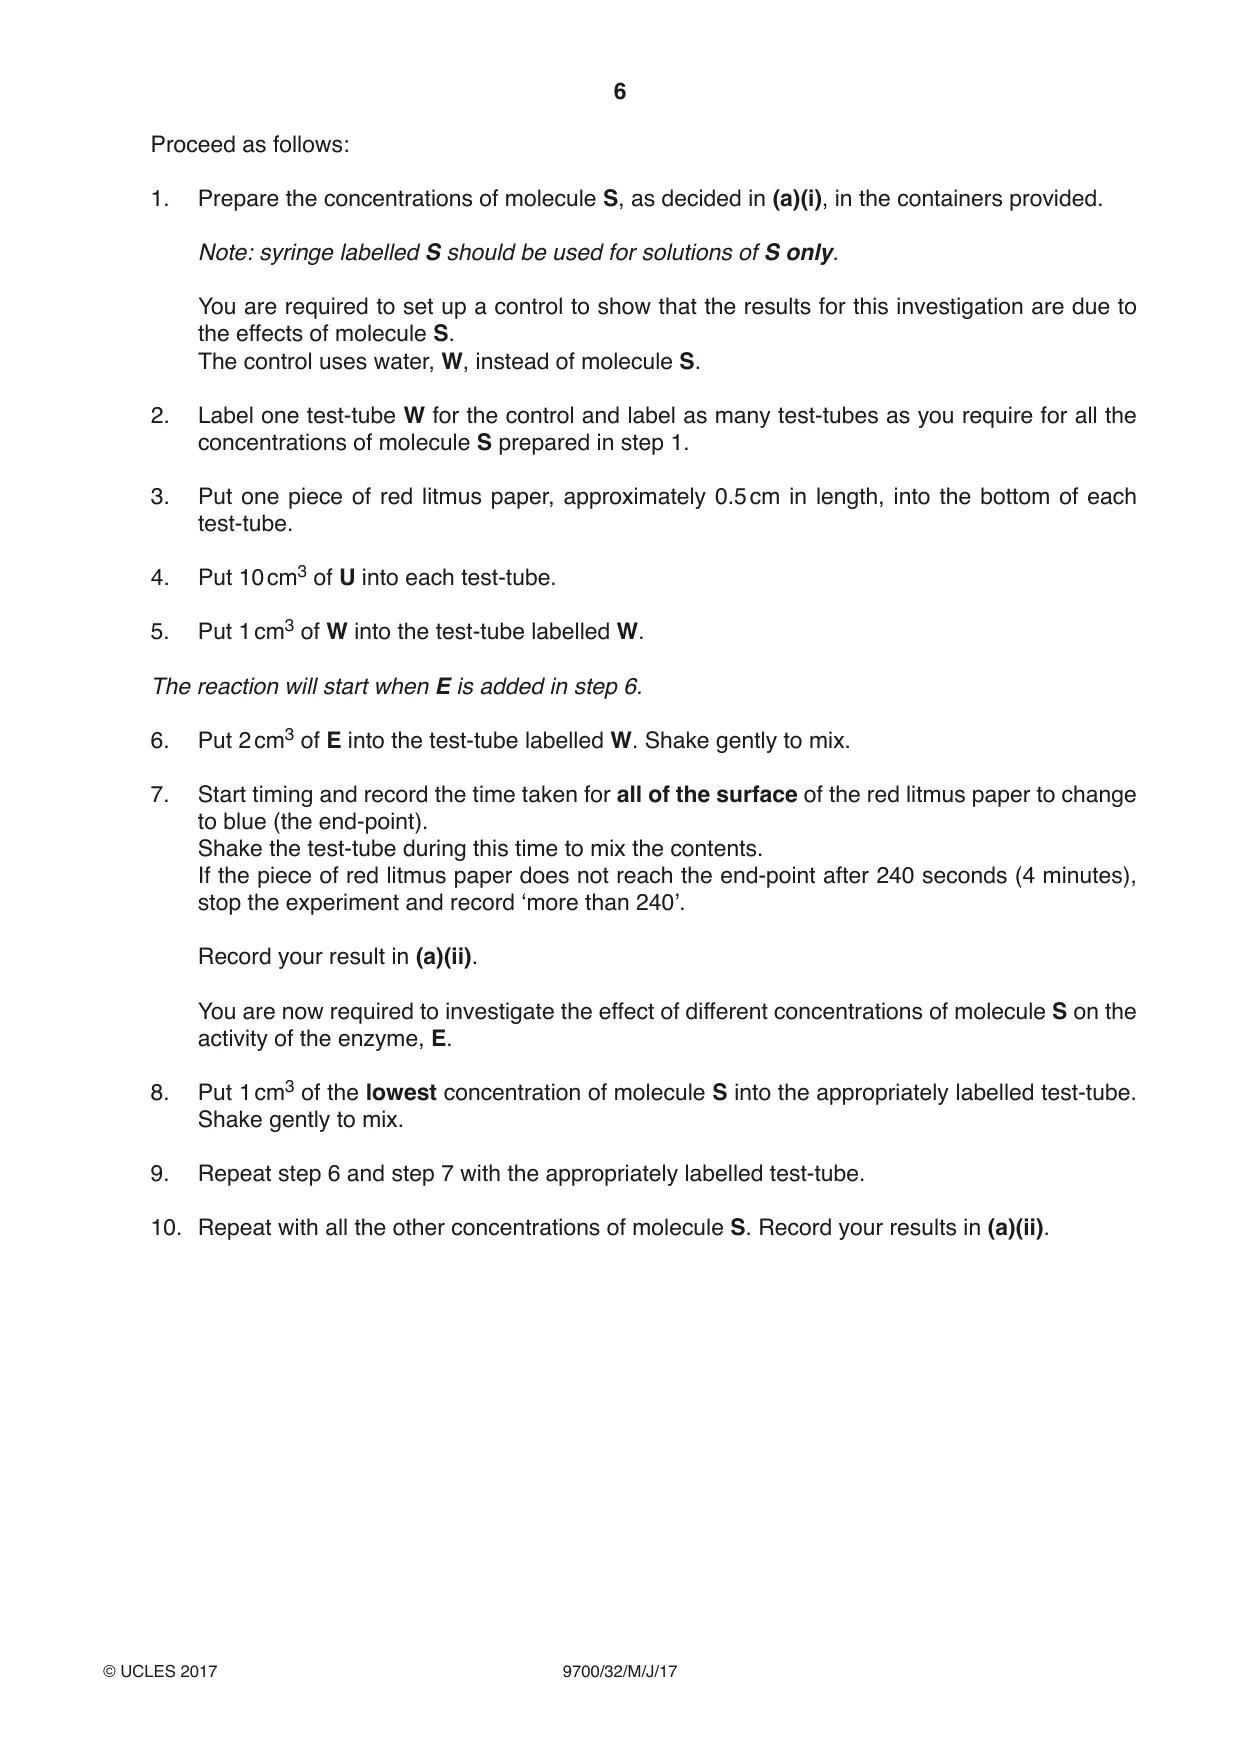
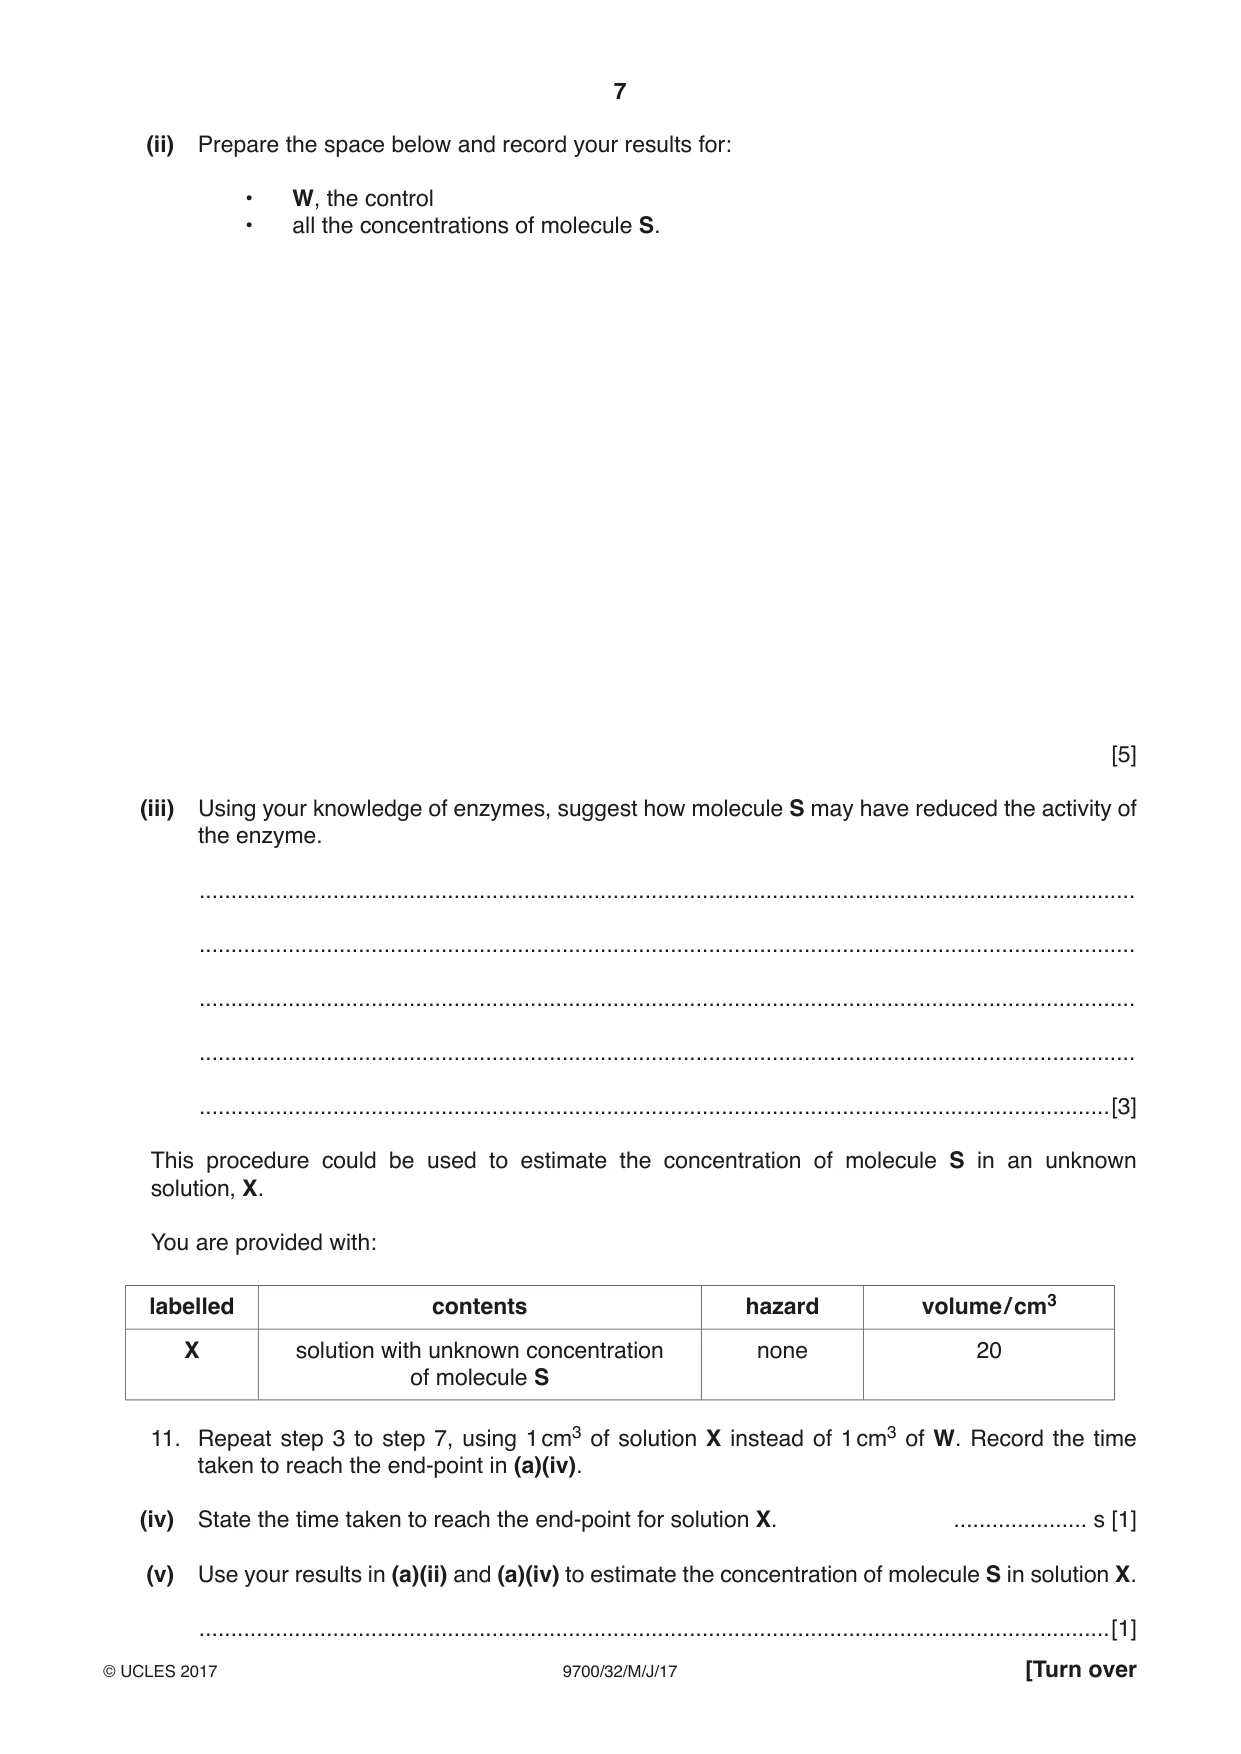
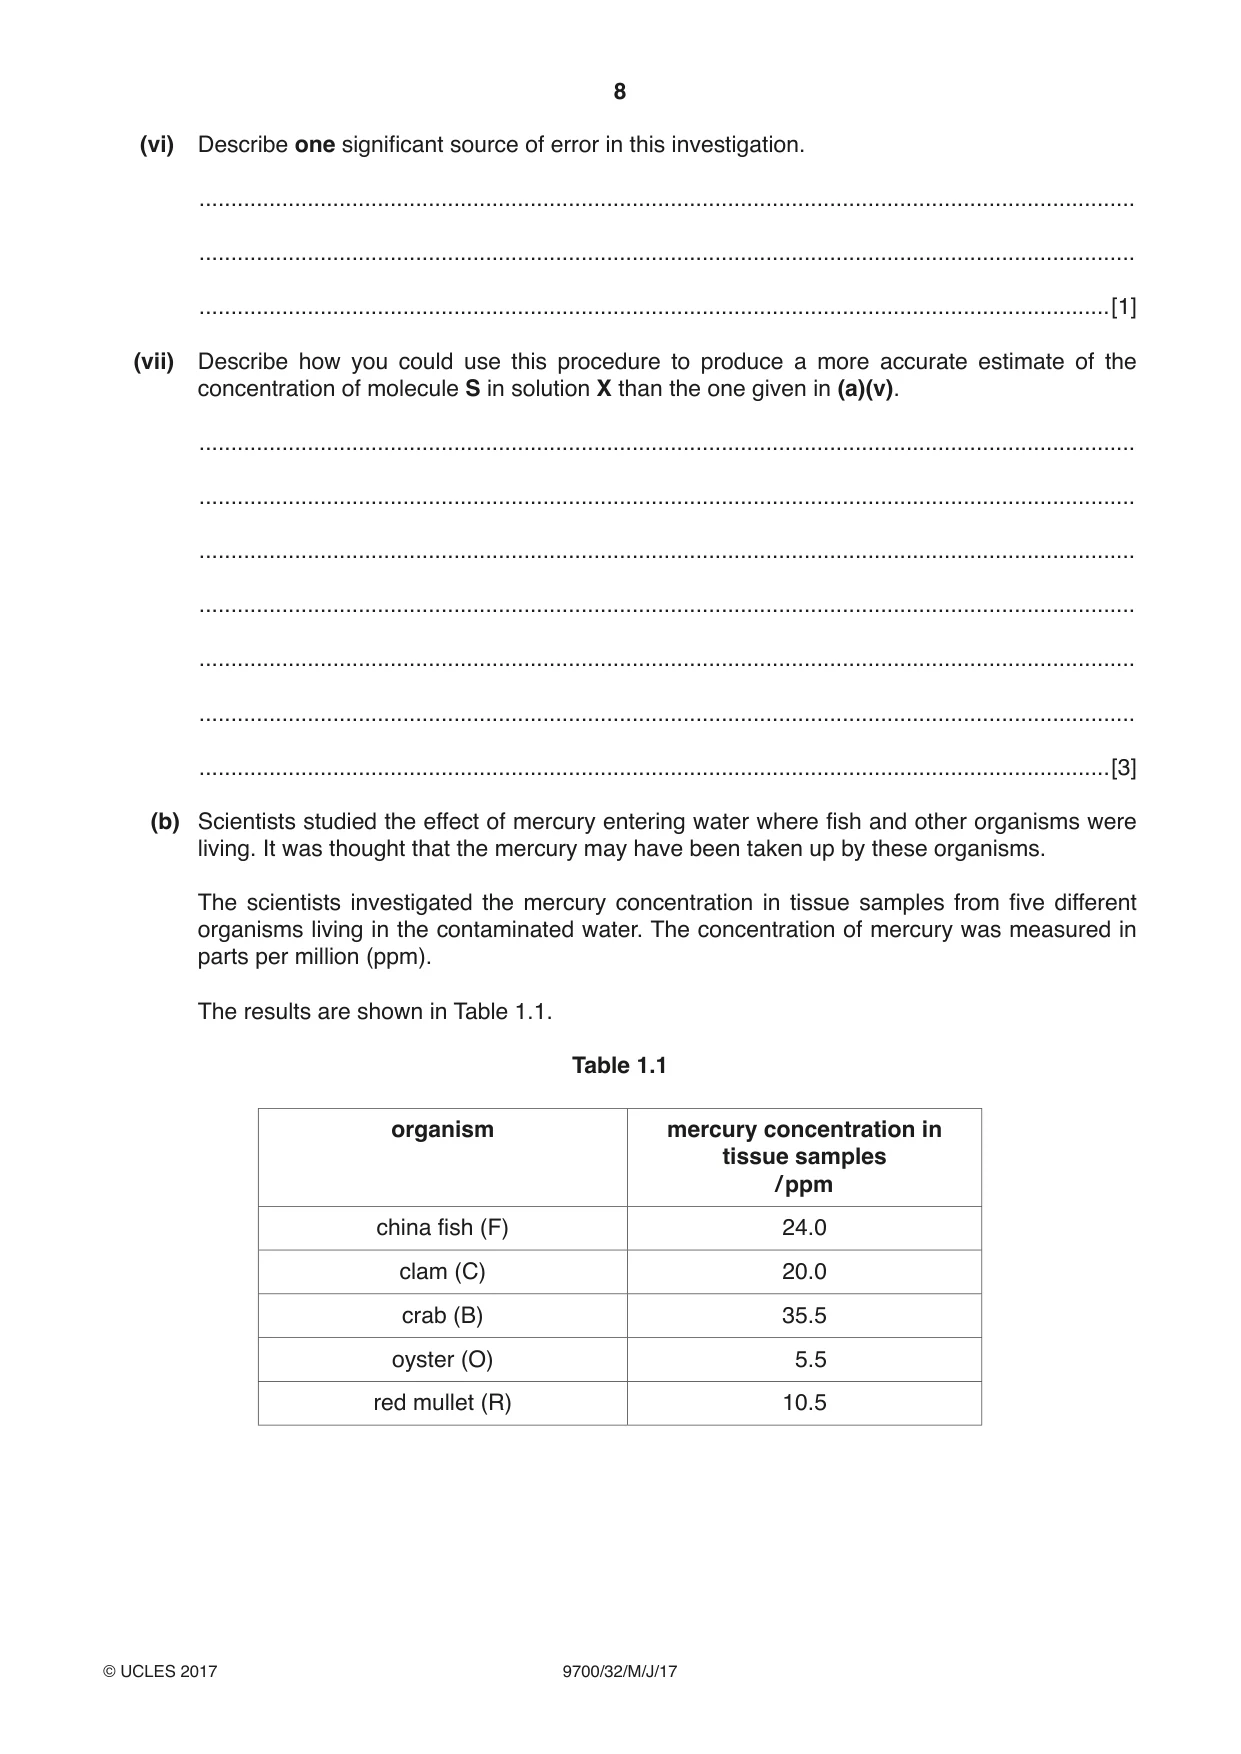
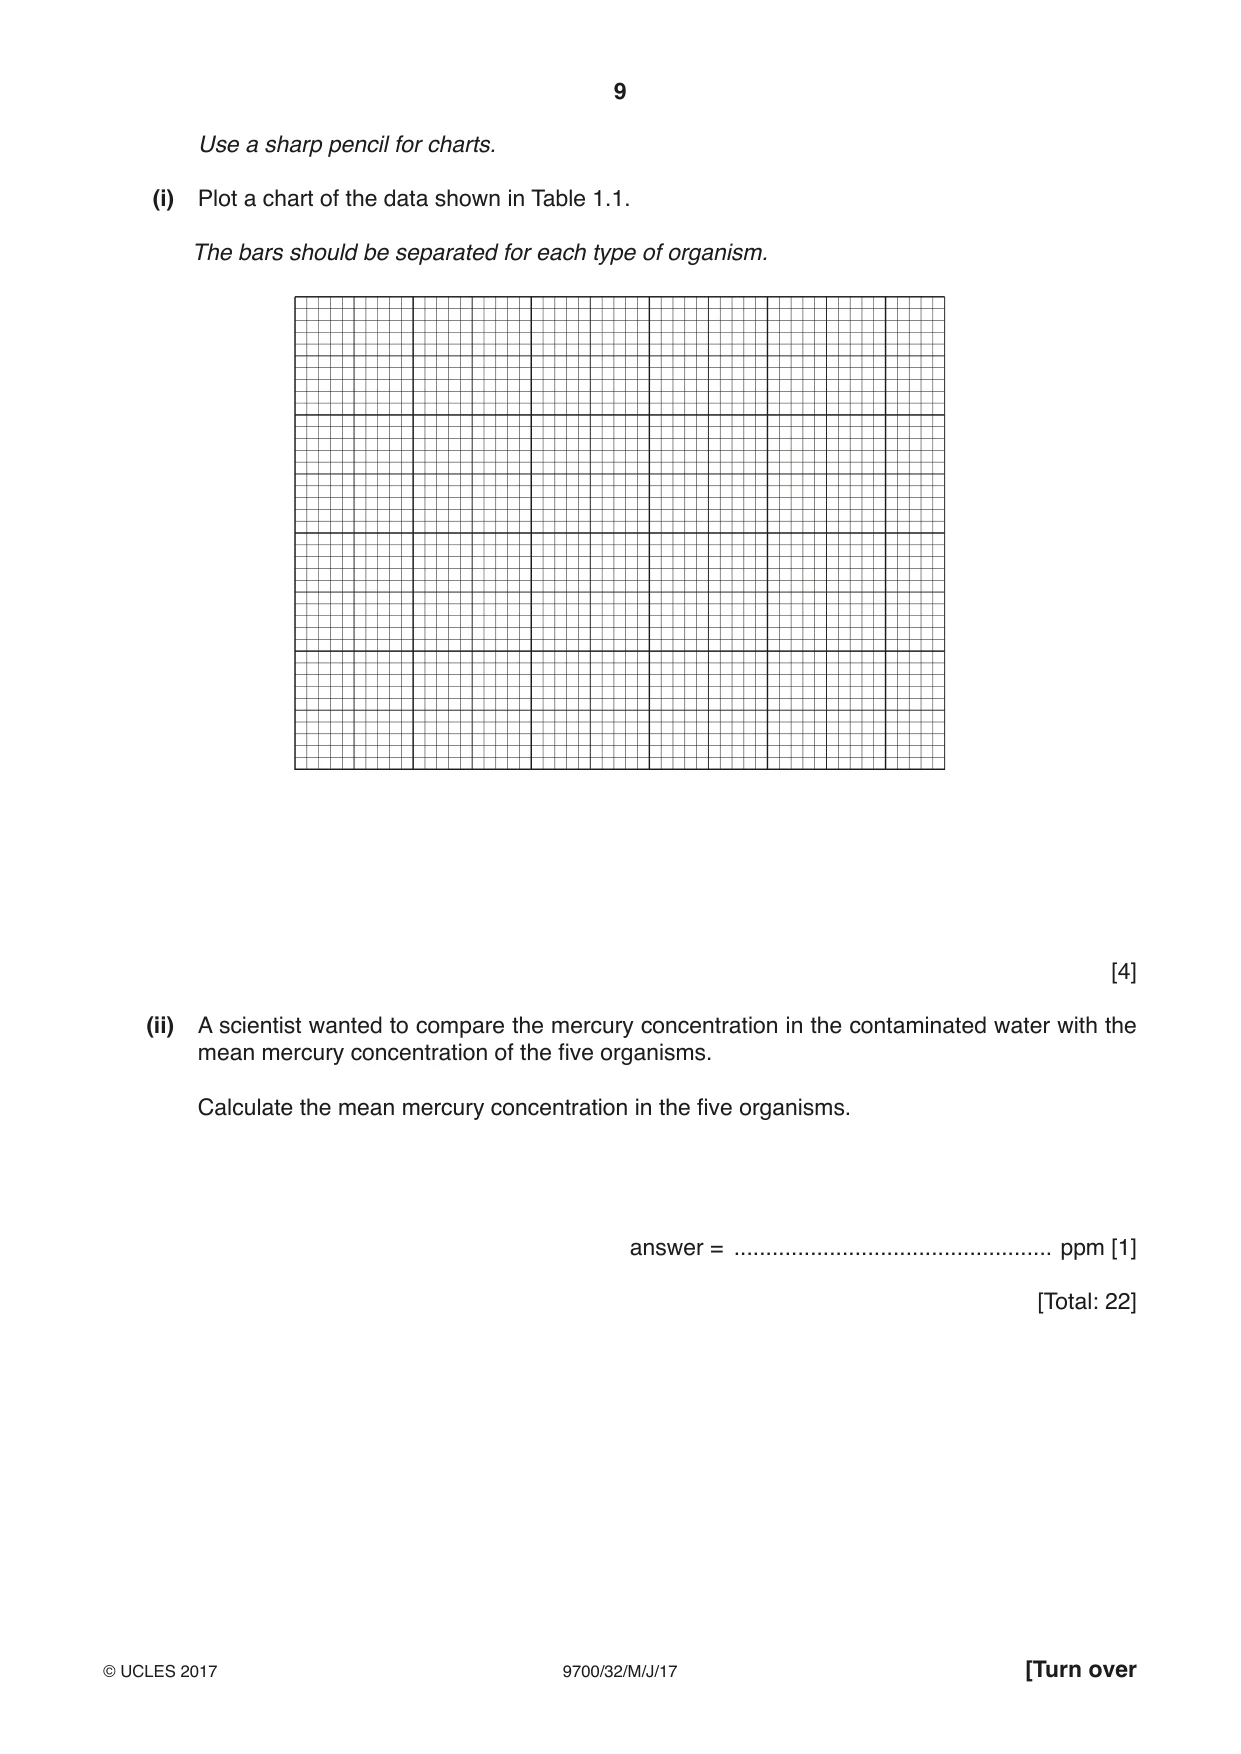
1 The enzyme, E, catalyses the reaction of urea with water to form ammonium carbonate. Aqueous ammonium carbonate produces ammonium ions forming an alkaline solution. This solution causes red litmus paper to change to blue. The end-point of the reaction is when all of the surface of the red litmus paper is blue. Molecule S may affect the activity of the enzyme, E. You are required to: • prepare a serial dilution of a 0.3% solution of S • prepare a control to show that the results for this investigation are due to the effects of S • record the time taken to reach the end-point for each of the concentrations of S and the control. You are provided with: labelled contents hazard volume / cm3 S 0.3% solution of S none 25 W distilled water none 100 U 10% urea solution none 100 harmful E enzyme solution 30 irritant labelled contents hazard quantity R red litmus paper none 2 strips If E comes into contact with your skin, wash it off immediately under cold water. It is recommended that you wear suitable eye protection. (a) You are required to prepare a serial dilution of the 0.3% solution of S which reduces the concentration by a factor of 10 between each successive dilution. You will need to prepare 9 cm3 of each concentration. Fig. 1.1 shows the first two beakers you will use to make your serial dilution. (i) Complete Fig. 1.1 by drawing as many extra beakers as you need for your serial dilution. For each beaker: • state, under the beaker, the volume and concentration of the solution available for use in the investigation • use one arrow, with a label above the beaker, to show the volume and concentration of the solution of S added to prepare the concentration • use another arrow, with a label above the beaker, to show the volume of W added to prepare the concentration. 10 cm3 of 0.3% solution of S 1 cm3 of 0.0 cm3 0.3% solution of W of S 9.......................cm3 of 0.3% solution of S ....................... to use ....................... ....................... ....................... ....................... [3] Fig. 1.1 Proceed as follows: 1. Prepare the concentrations of molecule S, as decided in (a)(i), in the containers provided. Note: syringe labelled S should be used for solutions of S only. You are required to set up a control to show that the results for this investigation are due to the effects of molecule S. The control uses water, W, instead of molecule S. 2. Label one test-tube W for the control and label as many test-tubes as you require for all the concentrations of molecule S prepared in step 1. 3. Put one piece of red litmus paper, approximately 0.5 cm in length, into the bottom of each test-tube. 4. Put 10 cm3 of U into each test-tube. 5. Put 1 cm3 of W into the test-tube labelled W. The reaction will start when E is added in step 6. 6. Put 2 cm3 of E into the test-tube labelled W. Shake gently to mix. 7. Start timing and record the time taken for all of the surface of the red litmus paper to change to blue (the end-point). Shake the test-tube during this time to mix the contents. If the piece of red litmus paper does not reach the end-point after 240 seconds (4 minutes), stop the experiment and record ‘more than 240’. Record your result in (a)(ii). You are now required to investigate the effect of different concentrations of molecule S on the activity of the enzyme, E. 8. Put 1 cm3 of the lowest concentration of molecule S into the appropriately labelled test-tube. Shake gently to mix. 9. Repeat step 6 and step 7 with the appropriately labelled test-tube. 10. Repeat with all the other concentrations of molecule S. Record your results in (a)(ii). (ii) Prepare the space below and record your results for: • W, the control • all the concentrations of molecule S. [5] (iii) Using your knowledge of enzymes, suggest how molecule S may have reduced the activity of the enzyme. ................................................................................................................................................... ................................................................................................................................................... ................................................................................................................................................... ................................................................................................................................................... ...............................................................................................................................................[3] This procedure could be used to estimate the concentration of molecule S in an unknown solution, X. You are provided with: labelled contents hazard volume / cm3 X solution with unknown concentration none 20 of molecule S 11. Repeat step 3 to step 7, using 1 cm3 of solution X instead of 1 cm3 of W. Record the time taken to reach the end-point in (a)(iv). (iv) State the time taken to reach the end-point for solution X. ..................... s [1] (v) Use your results in (a)(ii) and (a)(iv) to estimate the concentration of molecule S in solution X. ...............................................................................................................................................[1] (vi) Describe one significant source of error in this investigation. ................................................................................................................................................... ................................................................................................................................................... ...............................................................................................................................................[1] (vii) Describe how you could use this procedure to produce a more accurate estimate of the concentration of molecule S in solution X than the one given in (a)(v). ................................................................................................................................................... ................................................................................................................................................... ................................................................................................................................................... ................................................................................................................................................... ................................................................................................................................................... ................................................................................................................................................... ...............................................................................................................................................[3] (b) Scientists studied the effect of mercury entering water where fish and other organisms were living. It was thought that the mercury may have been taken up by these organisms. The scientists investigated the mercury concentration in tissue samples from five different organisms living in the contaminated water. The concentration of mercury was measured in parts per million (ppm). The results are shown in Table 1.1. Table 1.1 organism mercury concentration in tissue samples / ppm china fish (F) 24.0 clam (C) 20.0 crab (B) 35.5 oyster (O) 5.5 red mullet (R) 10.5 Use a sharp pencil for charts. (i) Plot a chart of the data shown in Table 1.1. The bars should be separated for each type of organism. [4] (ii) A scientist wanted to compare the mercury concentration in the contaminated water with the mean mercury concentration of the five organisms. Calculate the mean mercury concentration in the five organisms. answer = .................................................. ppm [1] [Total: 22]
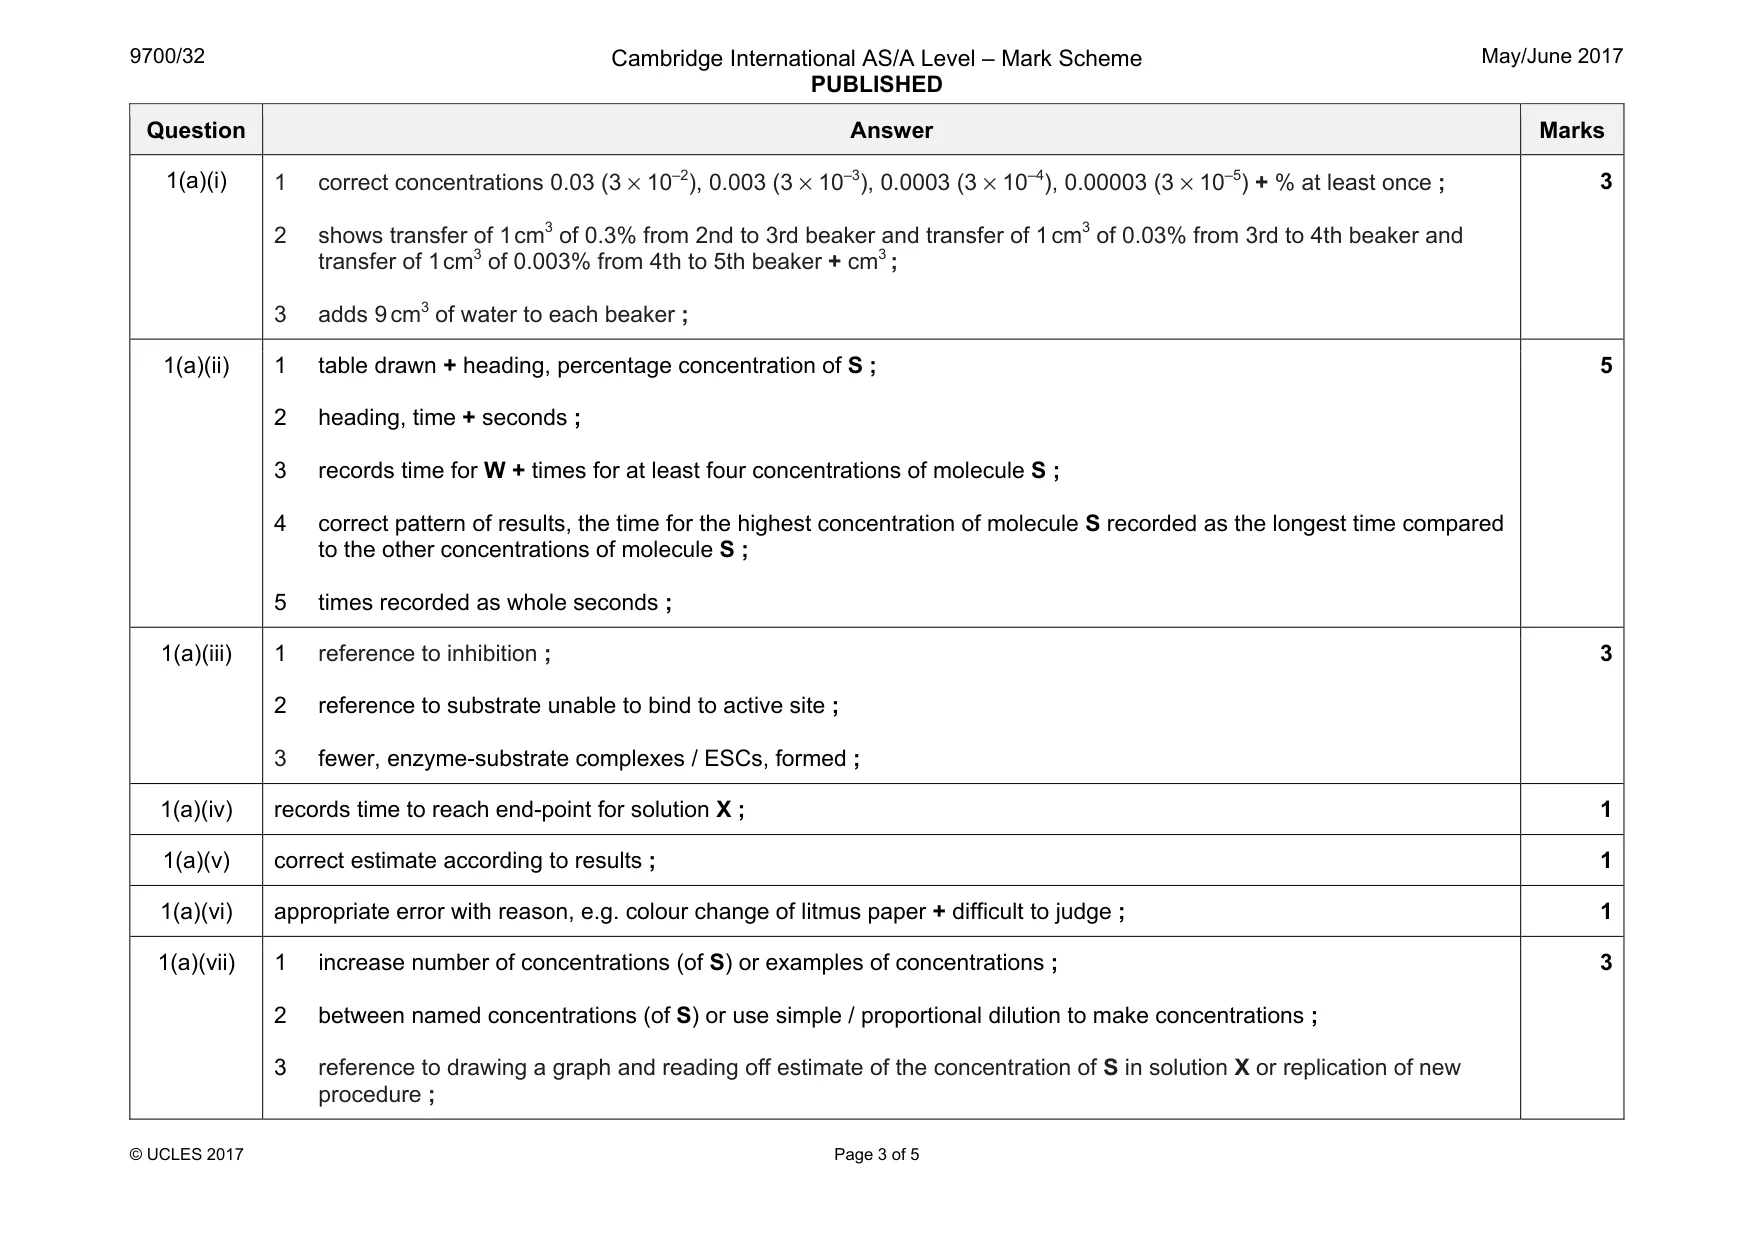
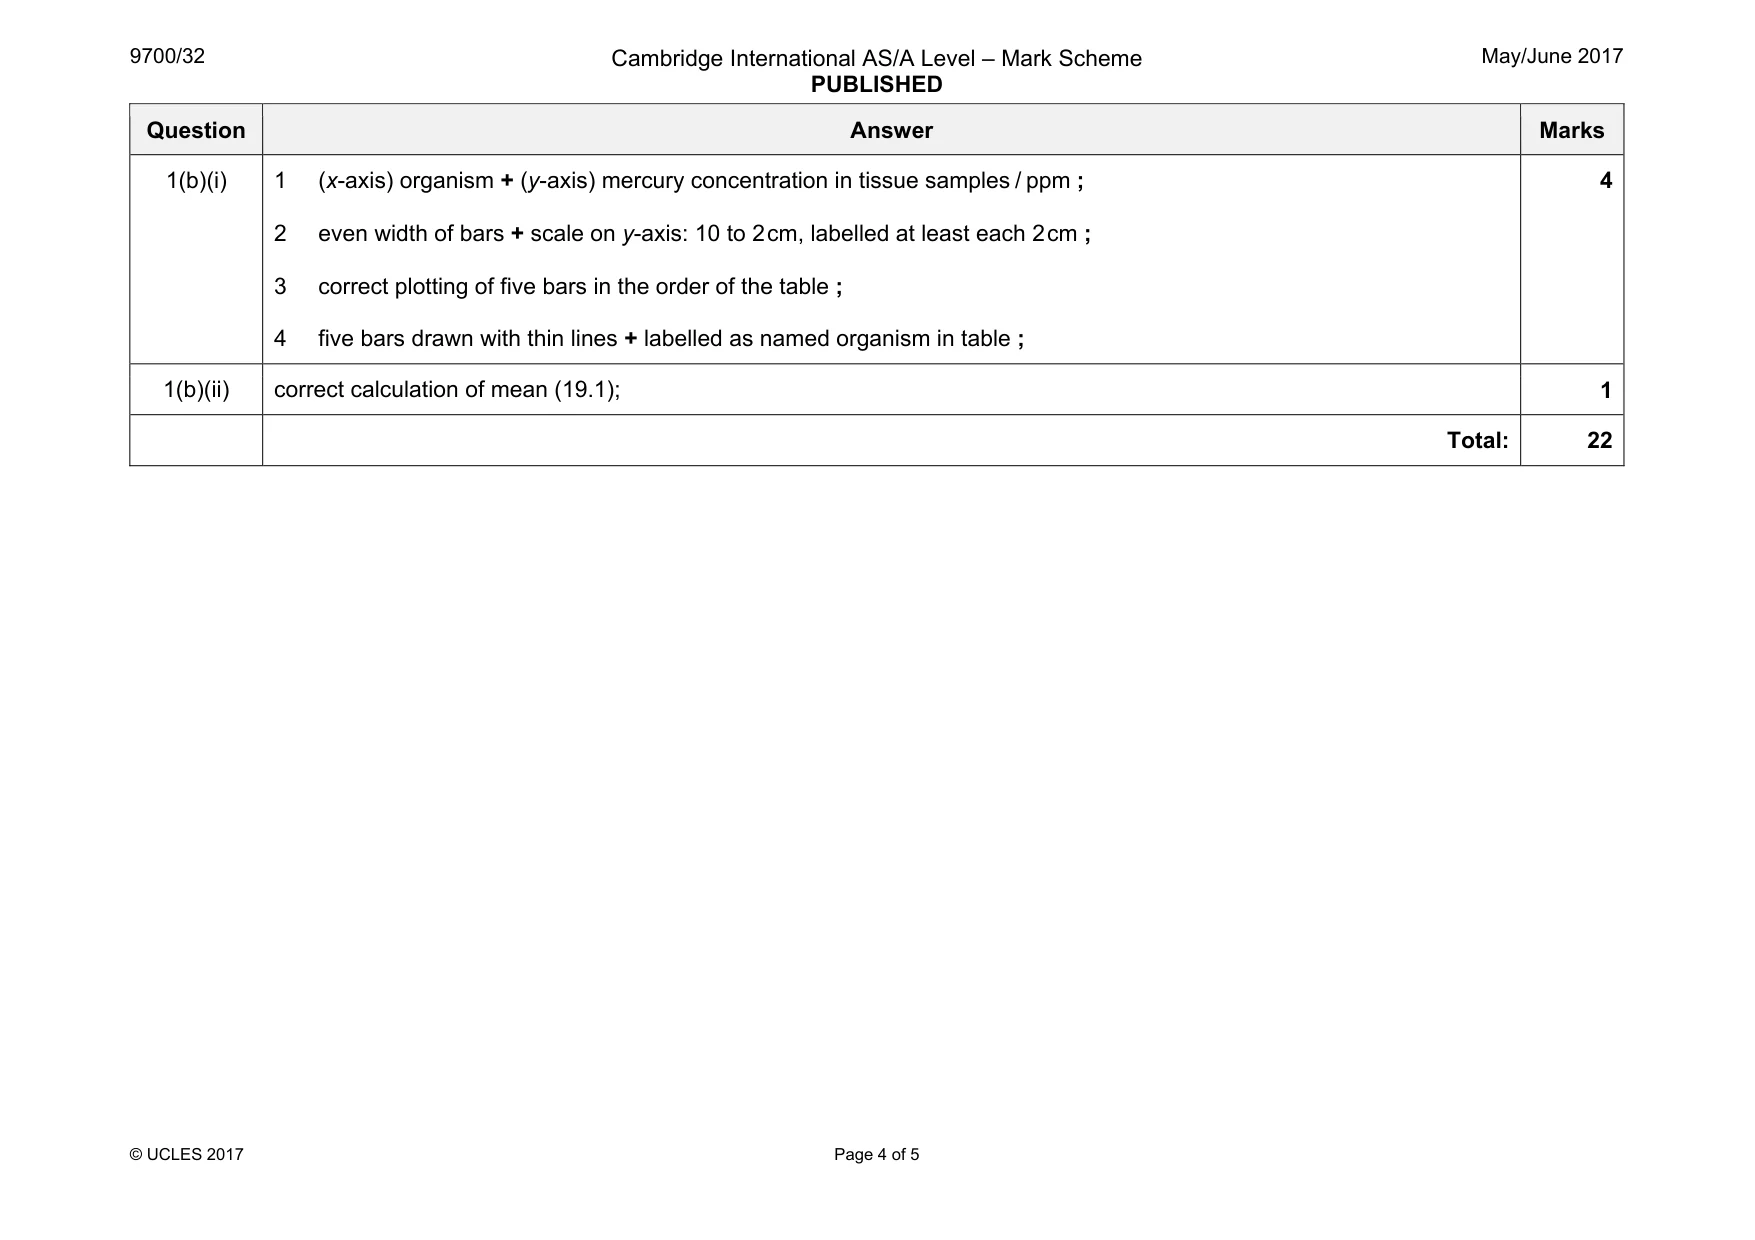
Mark scheme: 1(a)(i) 1 2 shows transfer of 1 cm3 of 0.3% from 2nd to 3rd beaker and transfer of 1 cm3 of 0.03% from 3rd to 4th beaker and transfer of 1 cm3 of 0.003% from 4th to 5th beaker + cm3 ; 3 adds 9 cm3 of water to each beaker ; 3 1(a)(ii) 1 table drawn + heading, percentage concentration of S ; 2 heading, time + seconds ; 3 records time for W + times for at least four concentrations of molecule S ; 4 correct pattern of results, the time for the highest concentration of molecule S recorded as the longest time compared to the other concentrations of molecule S ; 5 times recorded as whole seconds ; 5 1(a)(iii) 1 reference to inhibition ; 2 reference to substrate unable to bind to active site ; 3 fewer, enzyme-substrate complexes / ESCs, formed ; 3 1(a)(iv) records time to reach end-point for solution X ; 1 1(a)(v) correct estimate according to results ; 1 1(a)(vi) appropriate error with reason, e.g. colour change of litmus paper + difficult to judge ; 1 1(a)(vii) 1 increase number of concentrations (of S) or examples of concentrations ; 2 between named concentrations (of S) or use simple / proportional dilution to make concentrations ; 3 reference to drawing a graph and reading off estimate of the concentration of S in solution X or replication of new procedure ; 3 Question Answer Marks 1(b)(i) 1 (x-axis) organism + (y-axis) mercury concentration in tissue samples / ppm ; 2 even width of bars + scale on y-axis: 10 to 2 cm, labelled at least each 2 cm ; 3 correct plotting of five bars in the order of the table ; 4 five bars drawn with thin lines + labelled as named organism in table ; 4 1(b)(ii) correct calculation of mean (19.1); 1 Total: 22
Q2 · M1 is a slide of a stained transverse section through a plant stem
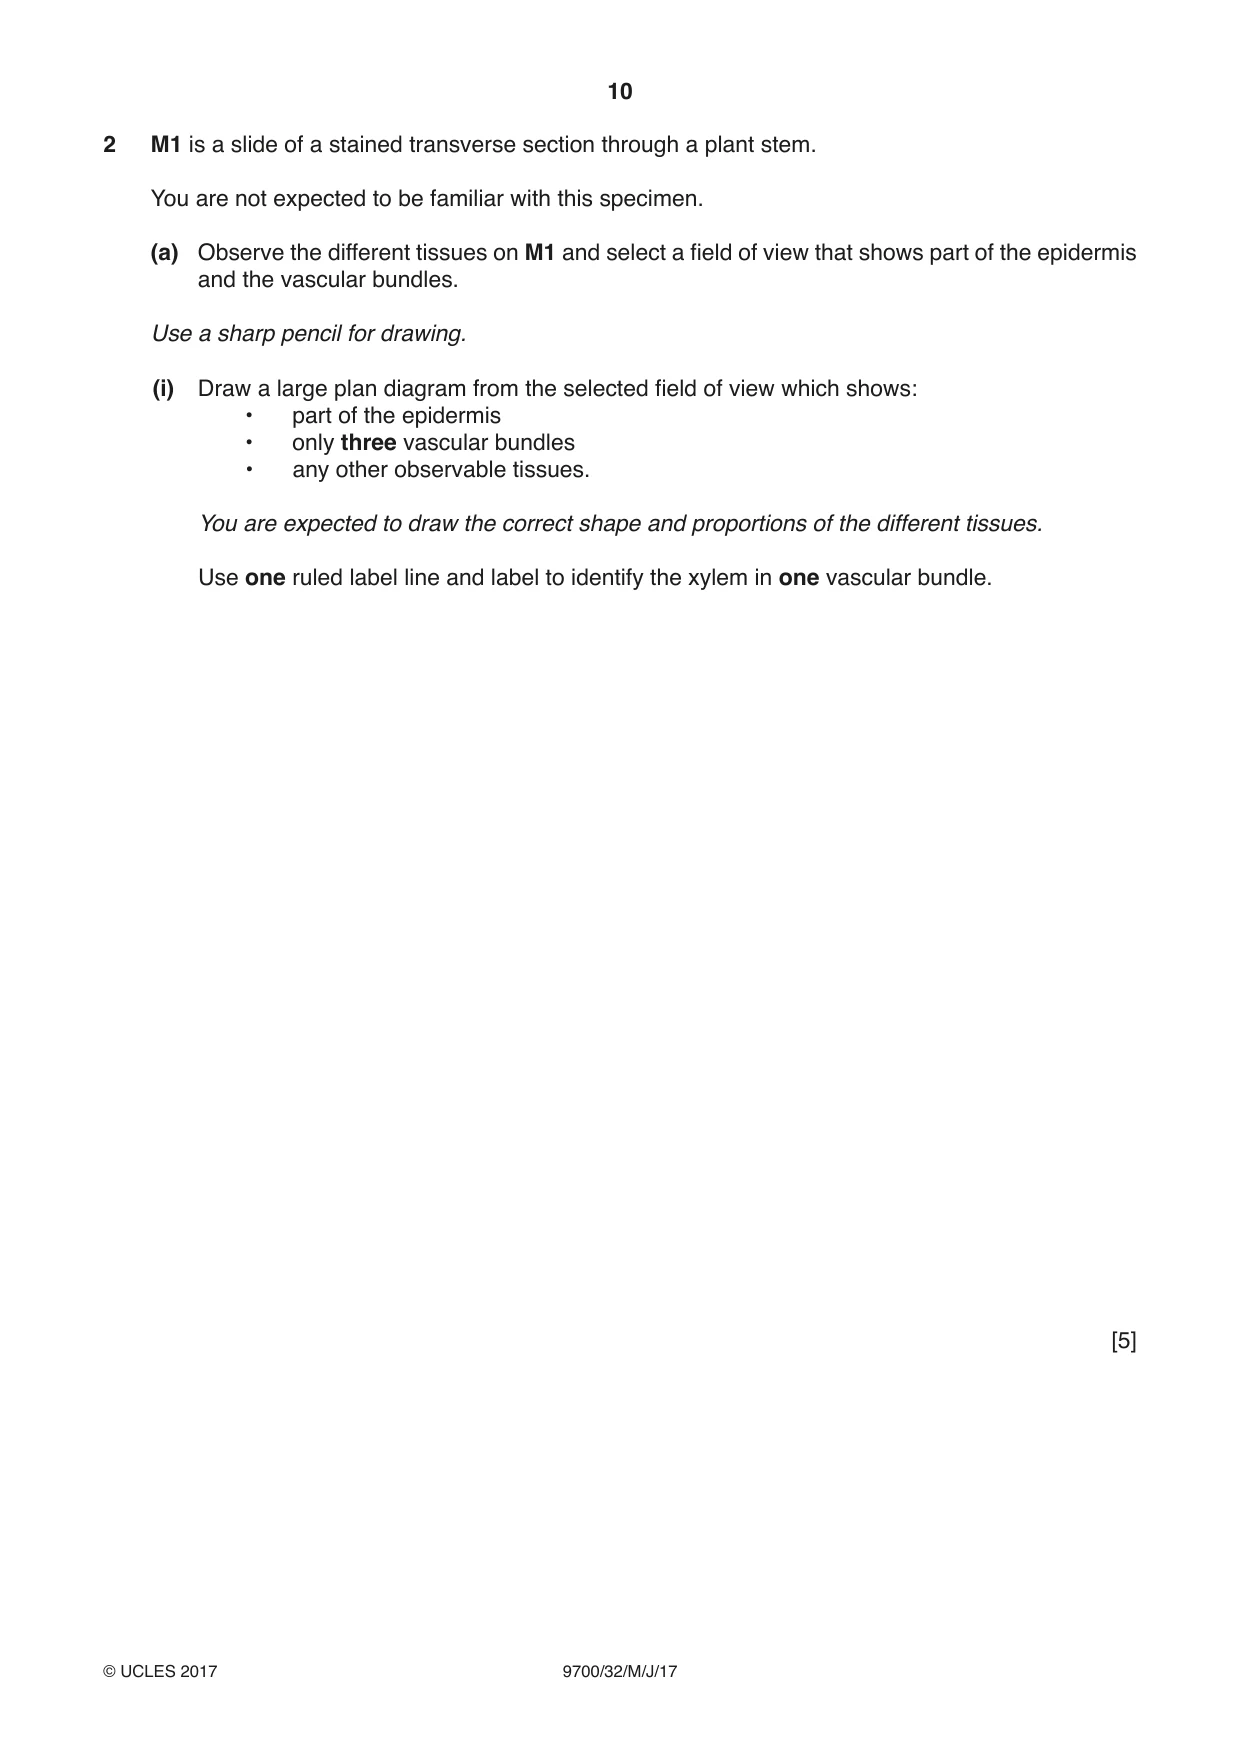
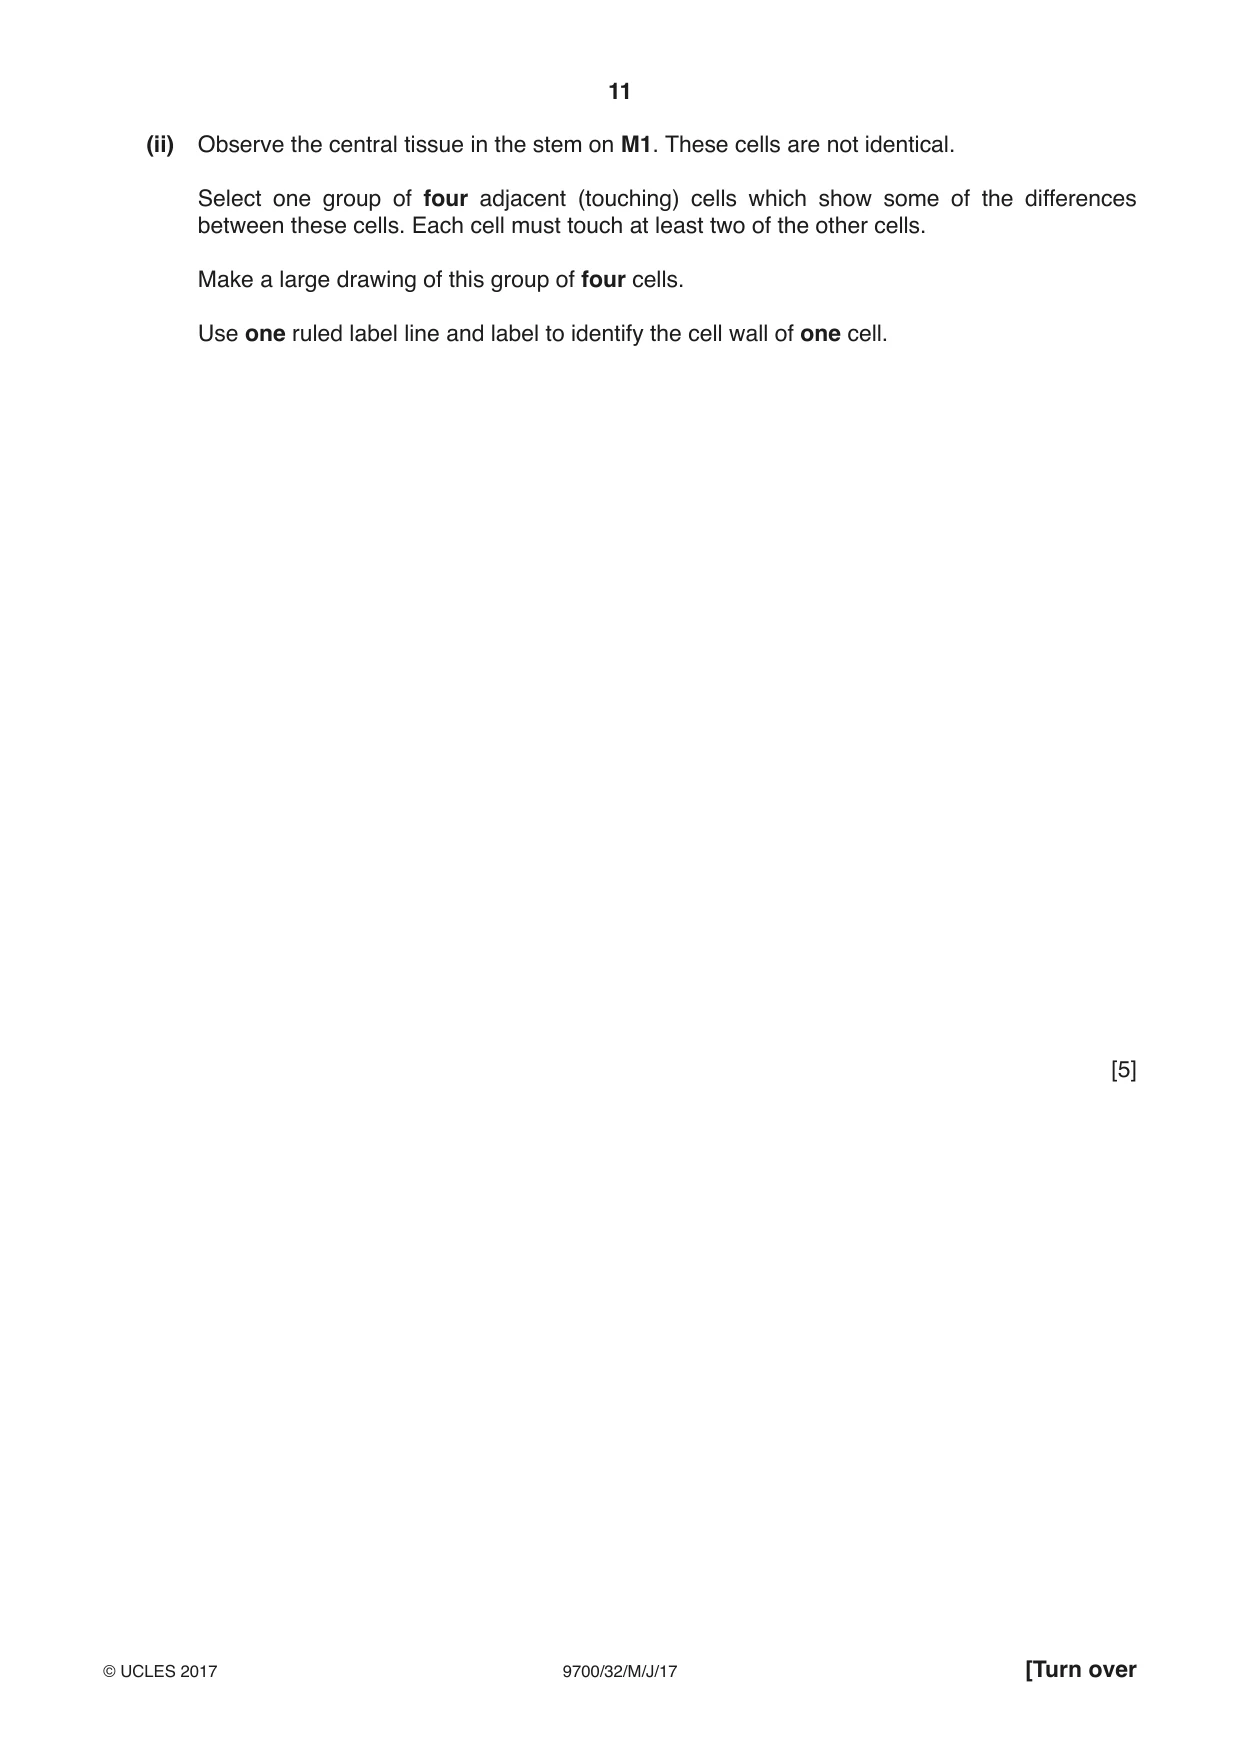
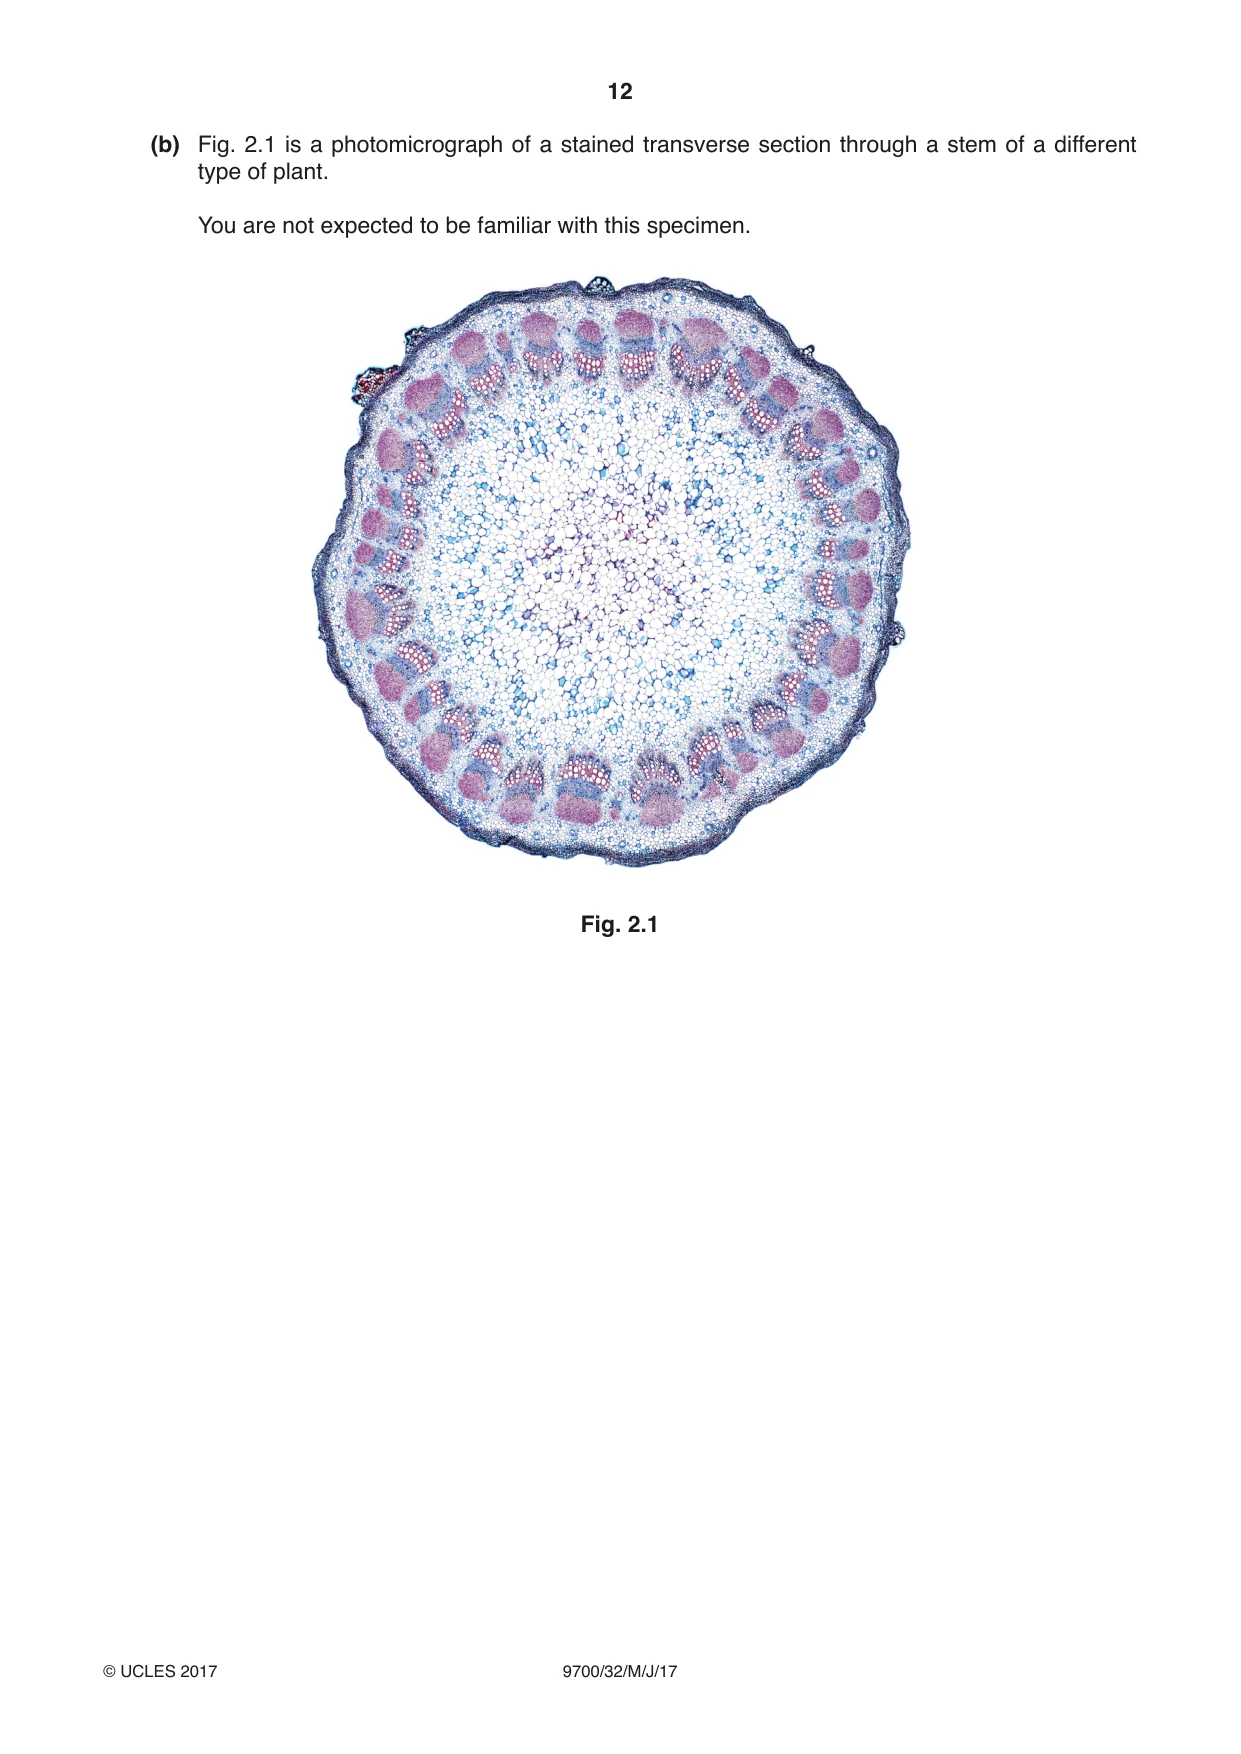
2 M1 is a slide of a stained transverse section through a plant stem. You are not expected to be familiar with this specimen. (a) Observe the different tissues on M1 and select a field of view that shows part of the epidermis and the vascular bundles. Use a sharp pencil for drawing. (i) Draw a large plan diagram from the selected field of view which shows: • part of the epidermis • only three vascular bundles • any other observable tissues. You are expected to draw the correct shape and proportions of the different tissues. Use one ruled label line and label to identify the xylem in one vascular bundle. [5] (ii) Observe the central tissue in the stem on M1. These cells are not identical. Select one group of four adjacent (touching) cells which show some of the differences between these cells. Each cell must touch at least two of the other cells. Make a large drawing of this group of four cells. Use one ruled label line and label to identify the cell wall of one cell. [5] (b) Fig. 2.1 is a photomicrograph of a stained transverse section through a stem of a different type of plant. You are not expected to be familiar with this specimen. Fig. 2.1
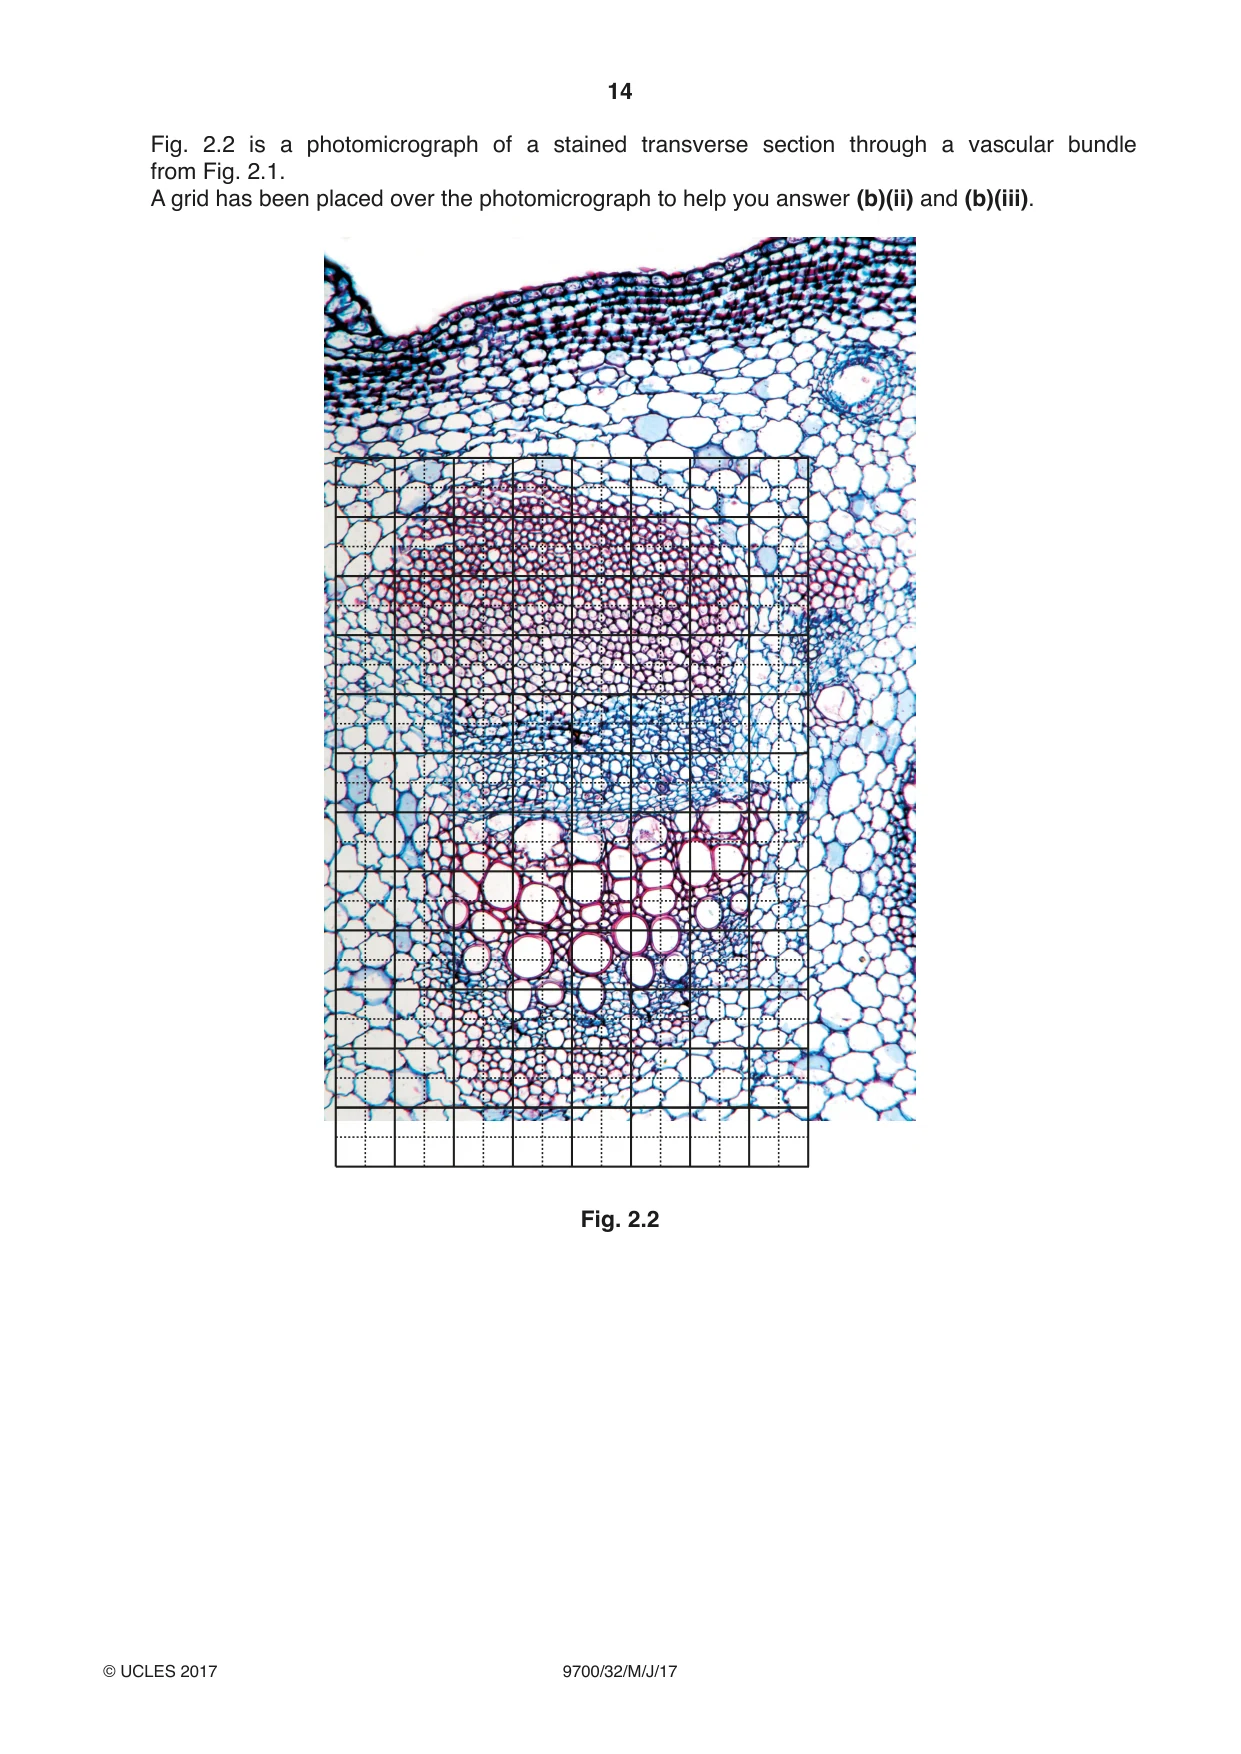
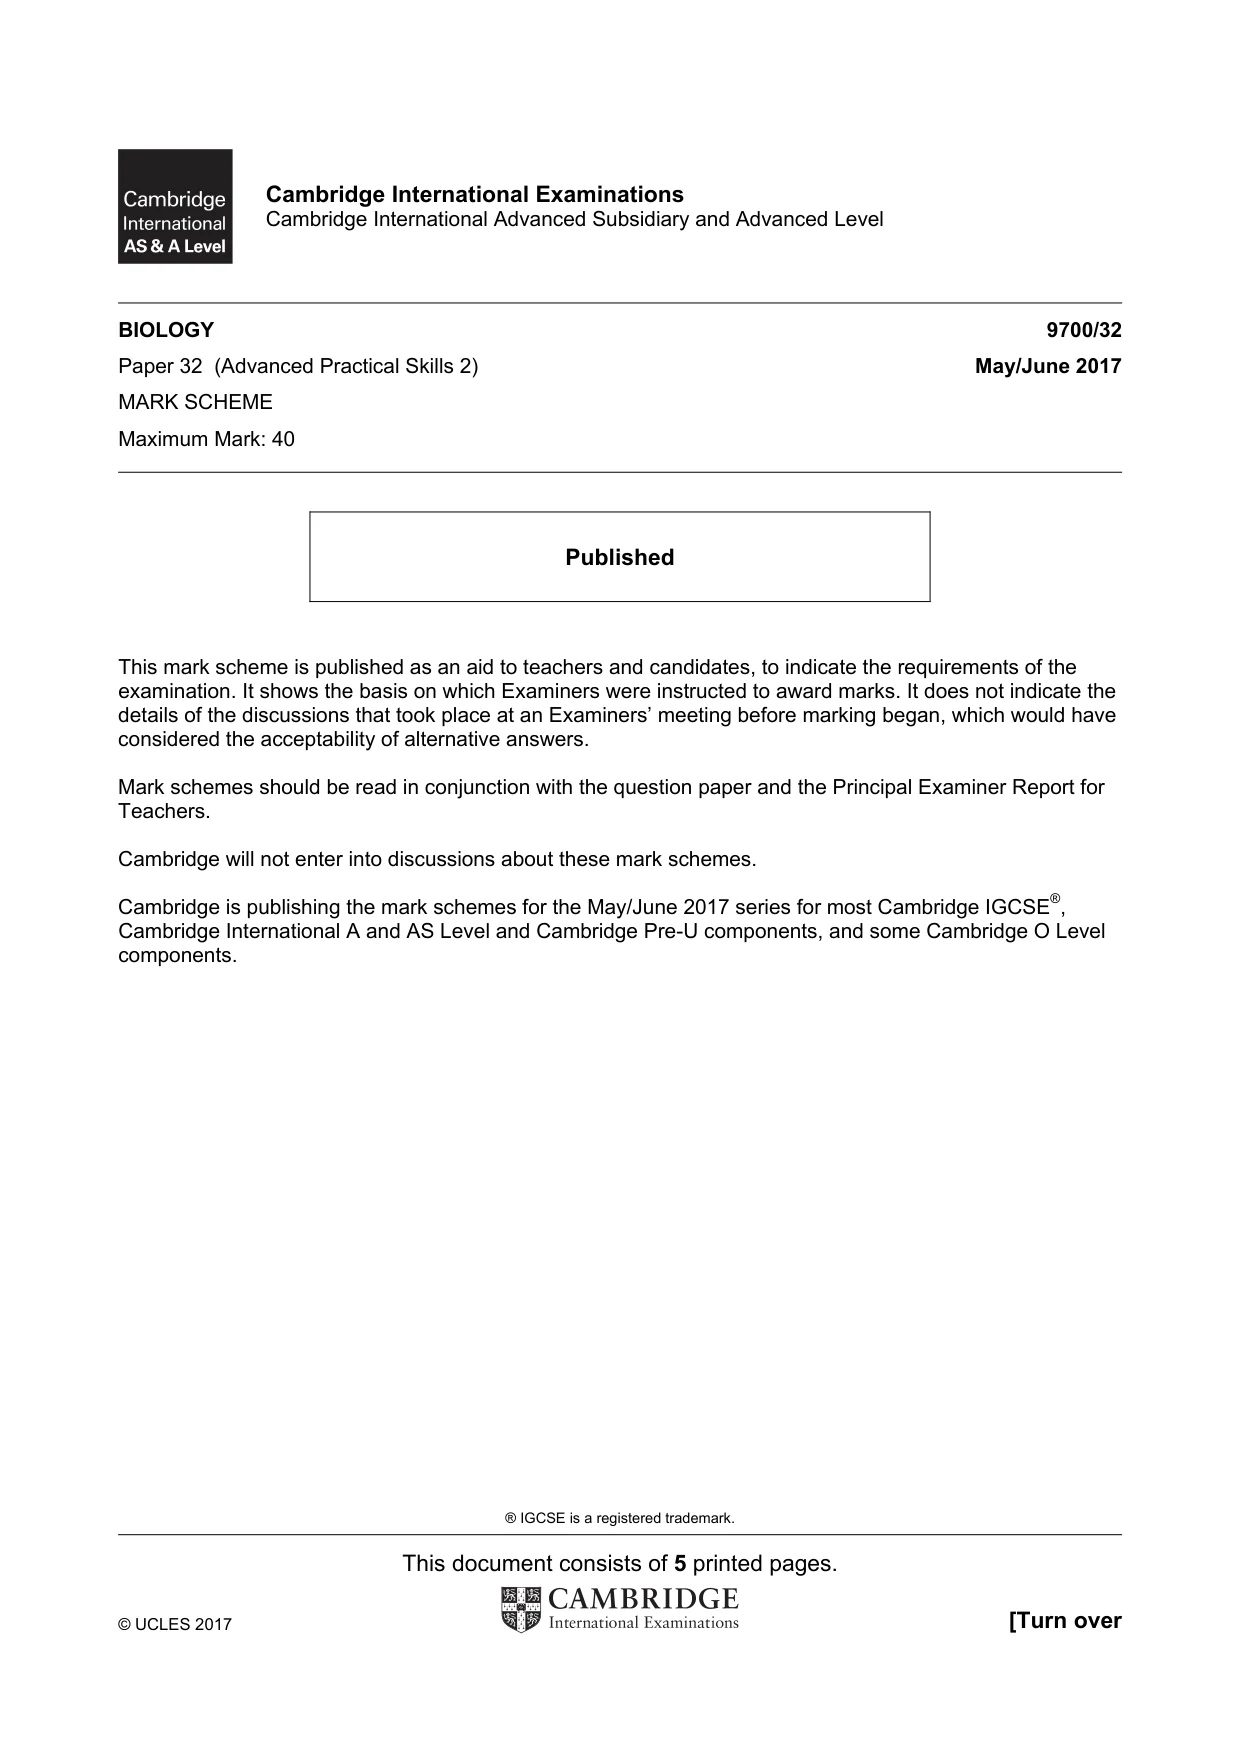
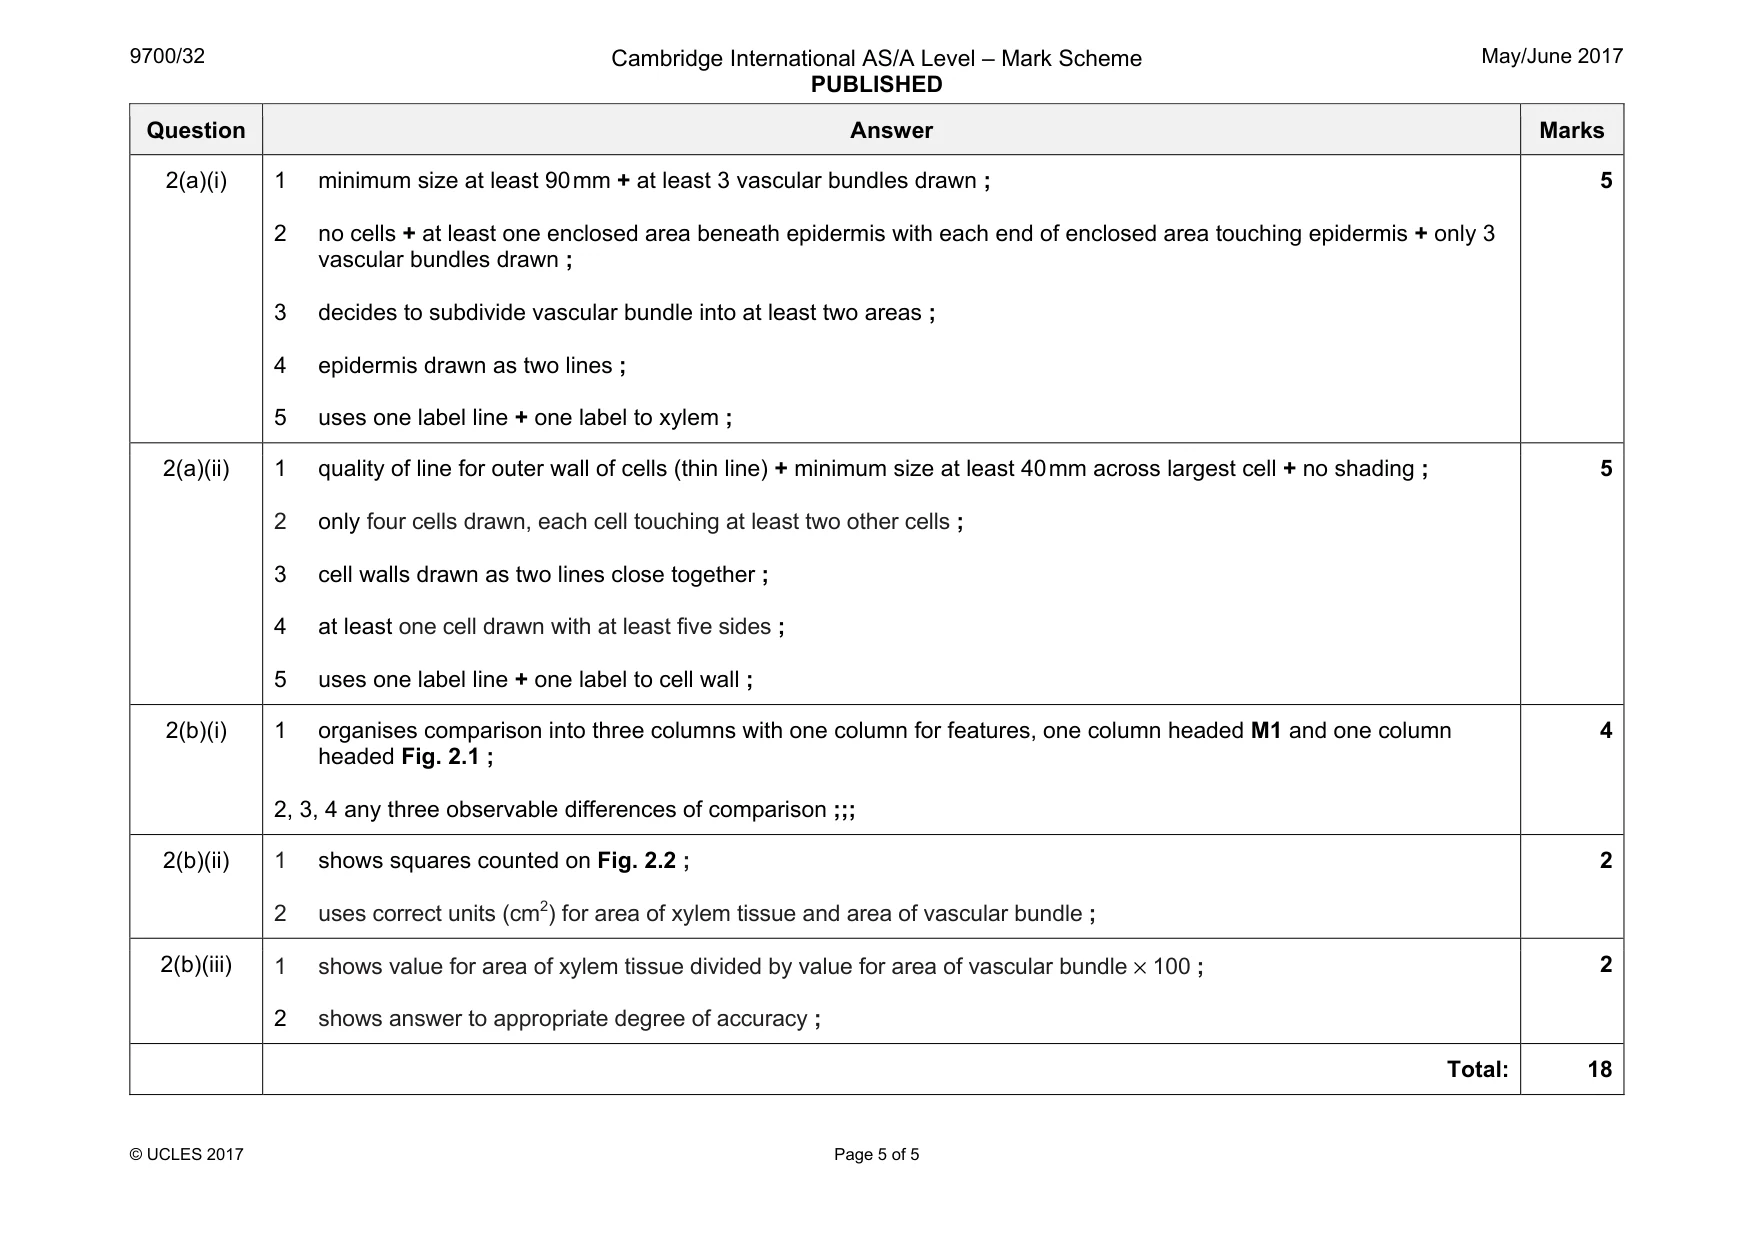
Mark scheme: 2(a)(i) 1 minimum size at least 90 mm + at least 3 vascular bundles drawn ; 2 no cells + at least one enclosed area beneath epidermis with each end of enclosed area touching epidermis + only 3 vascular bundles drawn ; 3 decides to subdivide vascular bundle into at least two areas ; 4 epidermis drawn as two lines ; 5 uses one label line + one label to xylem ; 5 2(a)(ii) 1 quality of line for outer wall of cells (thin line) + minimum size at least 40 mm across largest cell + no shading ; 2 only four cells drawn, each cell touching at least two other cells ; 3 cell walls drawn as two lines close together ; 4 at least one cell drawn with at least five sides ; 5 uses one label line + one label to cell wall ; 5 2(b)(i) 1 organises comparison into three columns with one column for features, one column headed M1 and one column headed Fig. 2.1 ; 2, 3, 4 any three observable differences of comparison ;;; 4 2(b)(ii) 1 shows squares counted on Fig. 2.2 ; 2 uses correct units (cm2) for area of xylem tissue and area of vascular bundle ; 2 2(b)(iii) 1 shows value for area of xylem tissue divided by value for area of vascular bundle × 100 ; 2 shows answer to appropriate degree of accuracy ; 2 Total: 18
What was in this paper
The subtopics covered by these 2 questions, and how many questions each got. Open one in a new tab to see every Cambridge question on it.
What you needed in this session
Cambridge’s own grade thresholds for 2017 May/June, Paper 3 · Variant 2. A higher threshold means an easier paper — the bar moves with how the cohort did.