Cambridge A Level Biology 9700 — 2017 May/June Paper 3 · Variant 1
9700/31/M/J/17 · 2 questions · 40 marks · ≈45 min
The question paper and its mark scheme, free to read here and free to download. This is Cambridge’s own paper, exactly as it was sat.
Question paper16 pages




Mark scheme5 pages
Answers below. Sit the paper first if you are practising.
Questions as text
Q1 · Some plant cells contain vitamin C (ascorbic acid), which has many functions for…
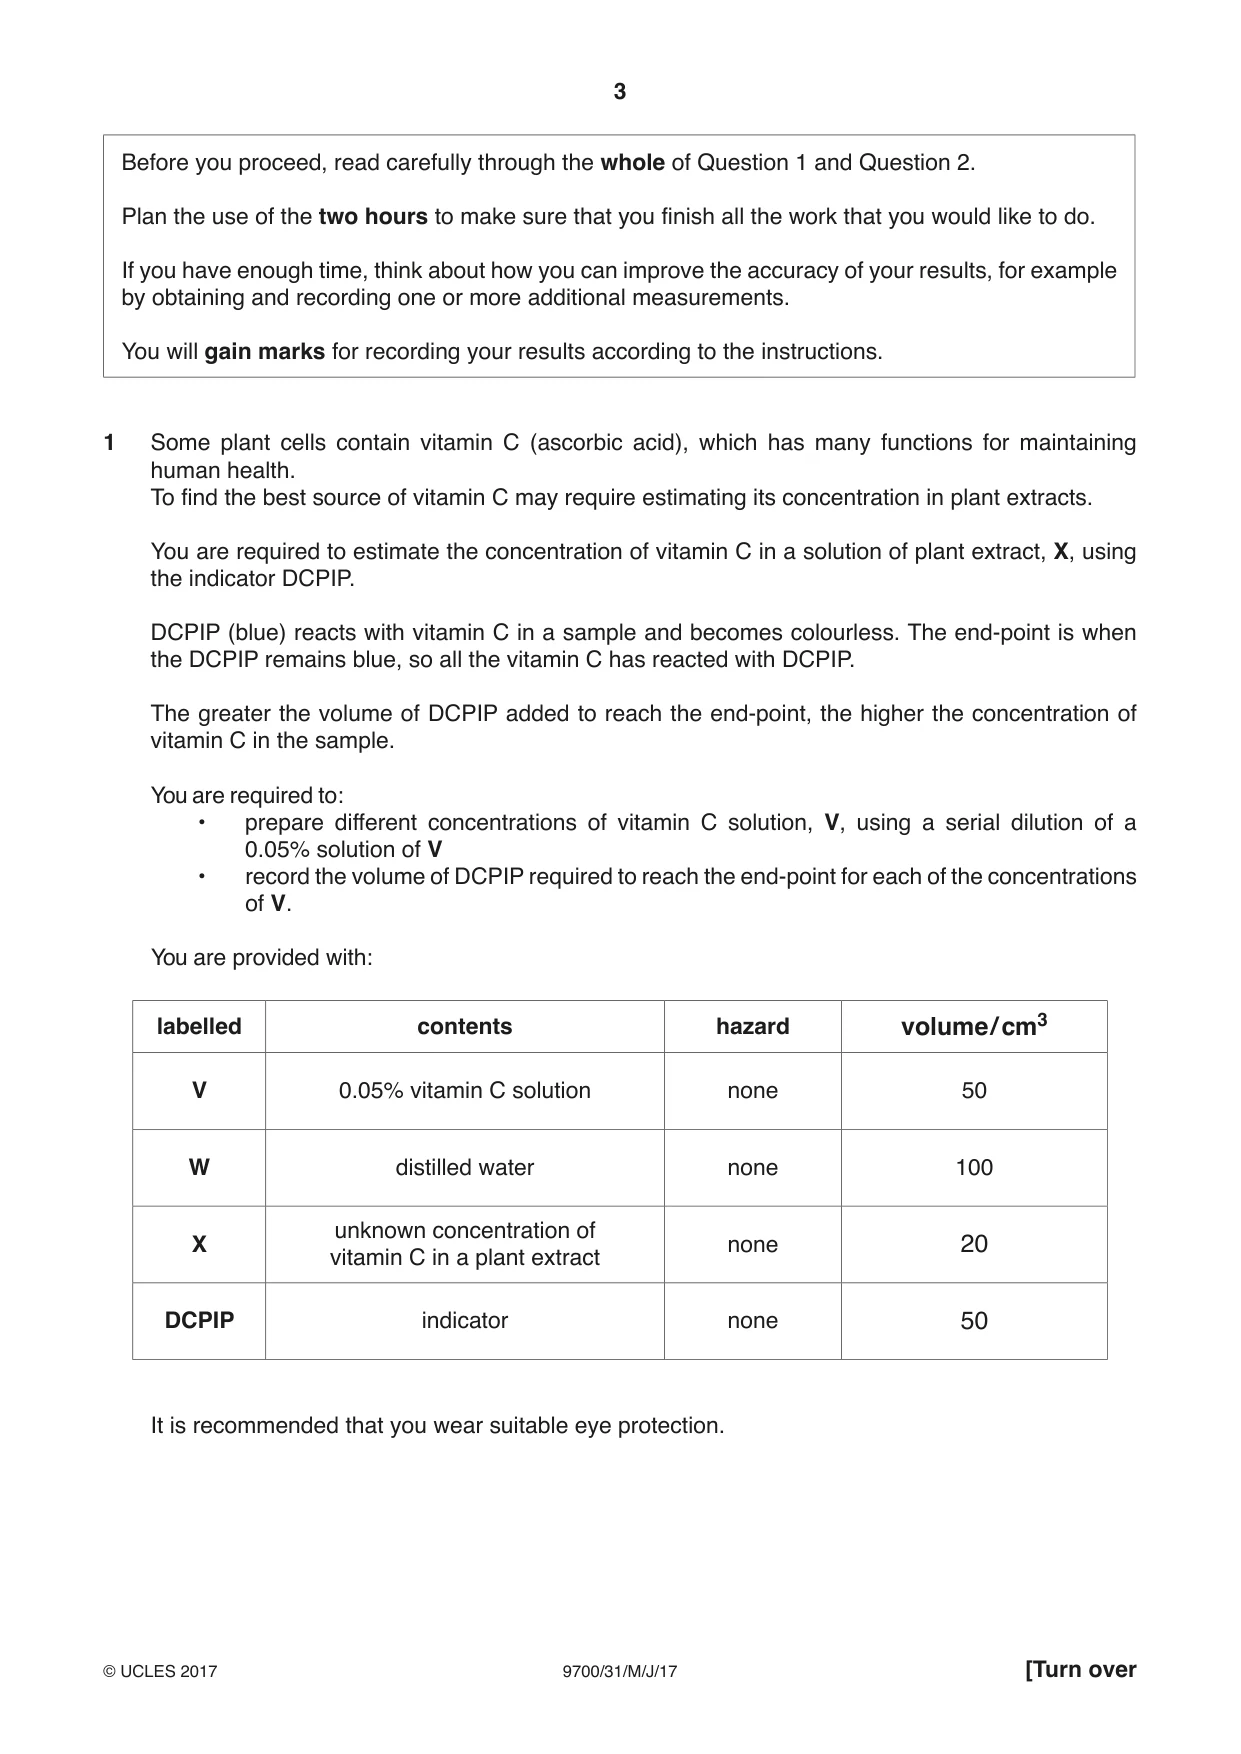
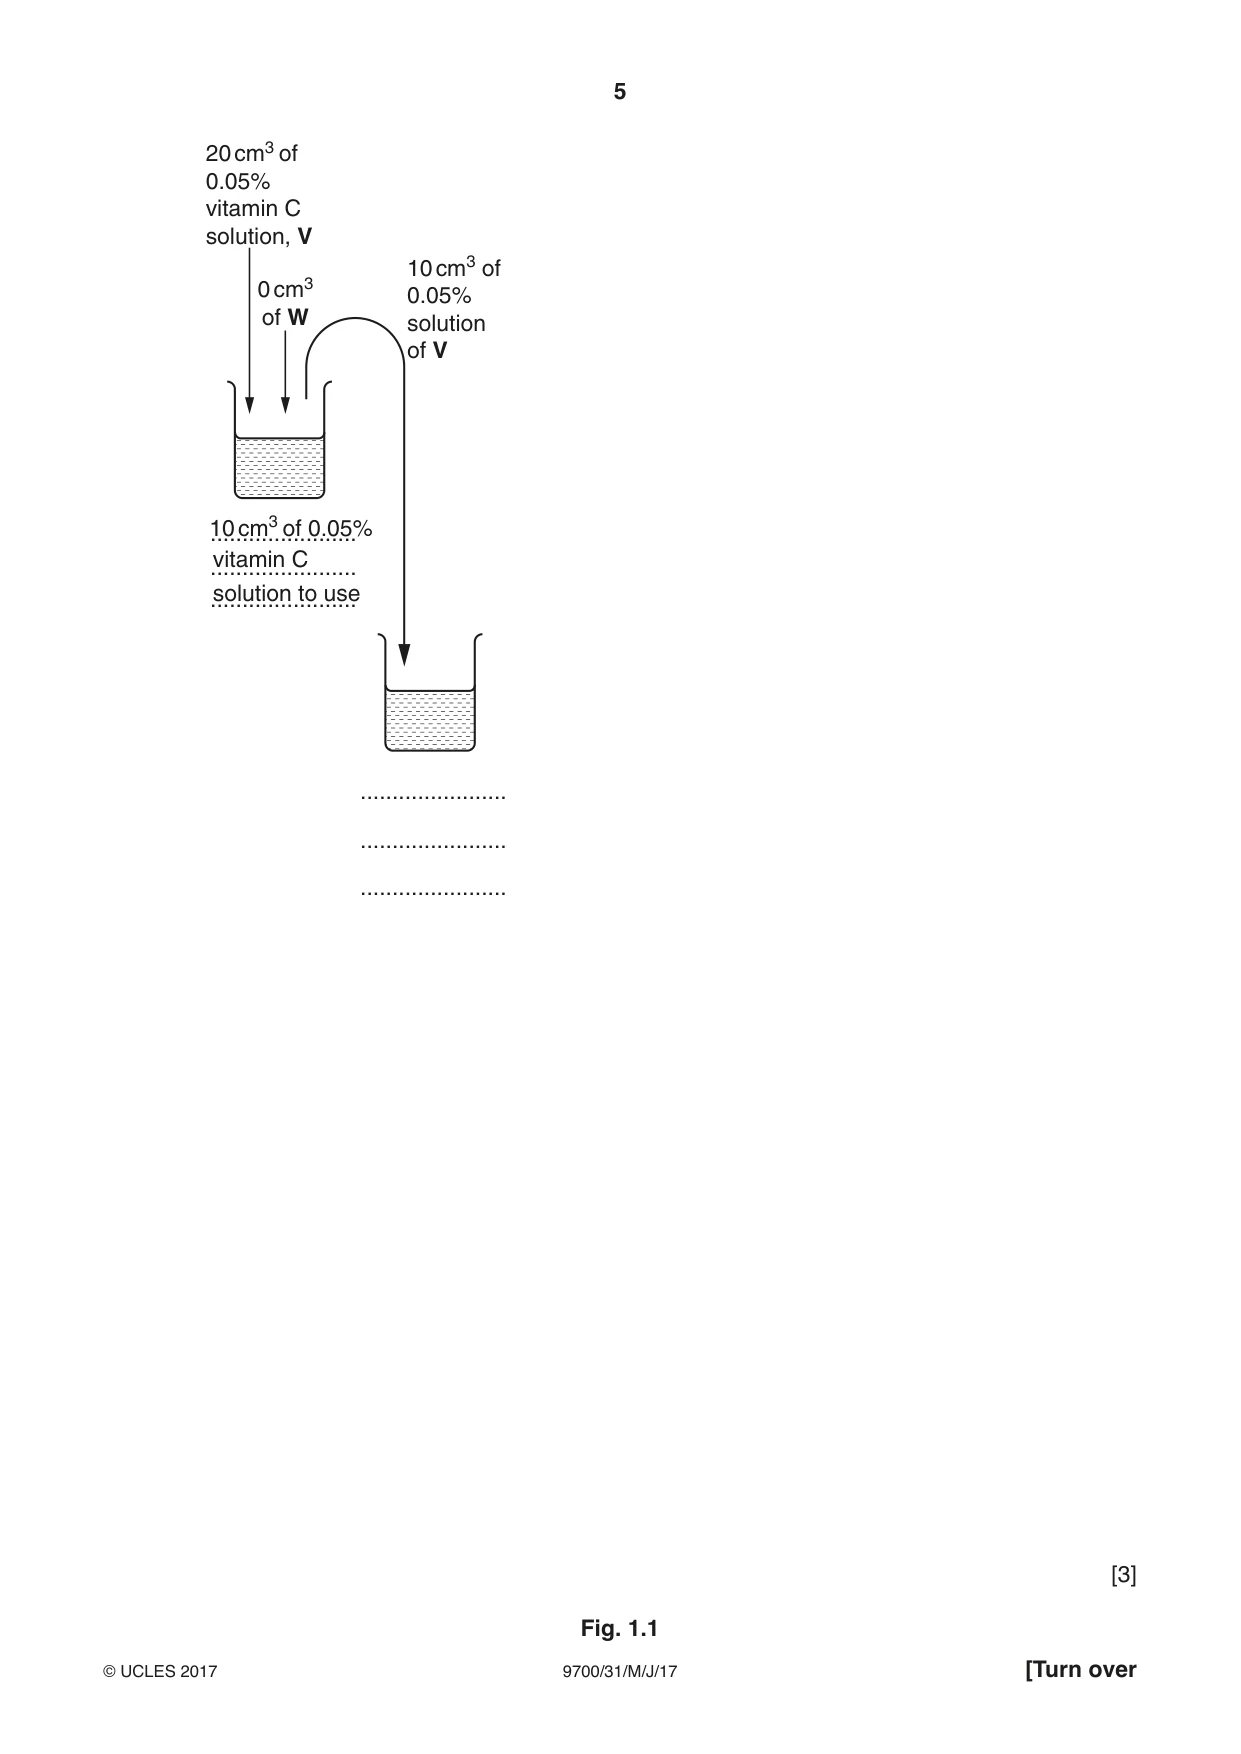
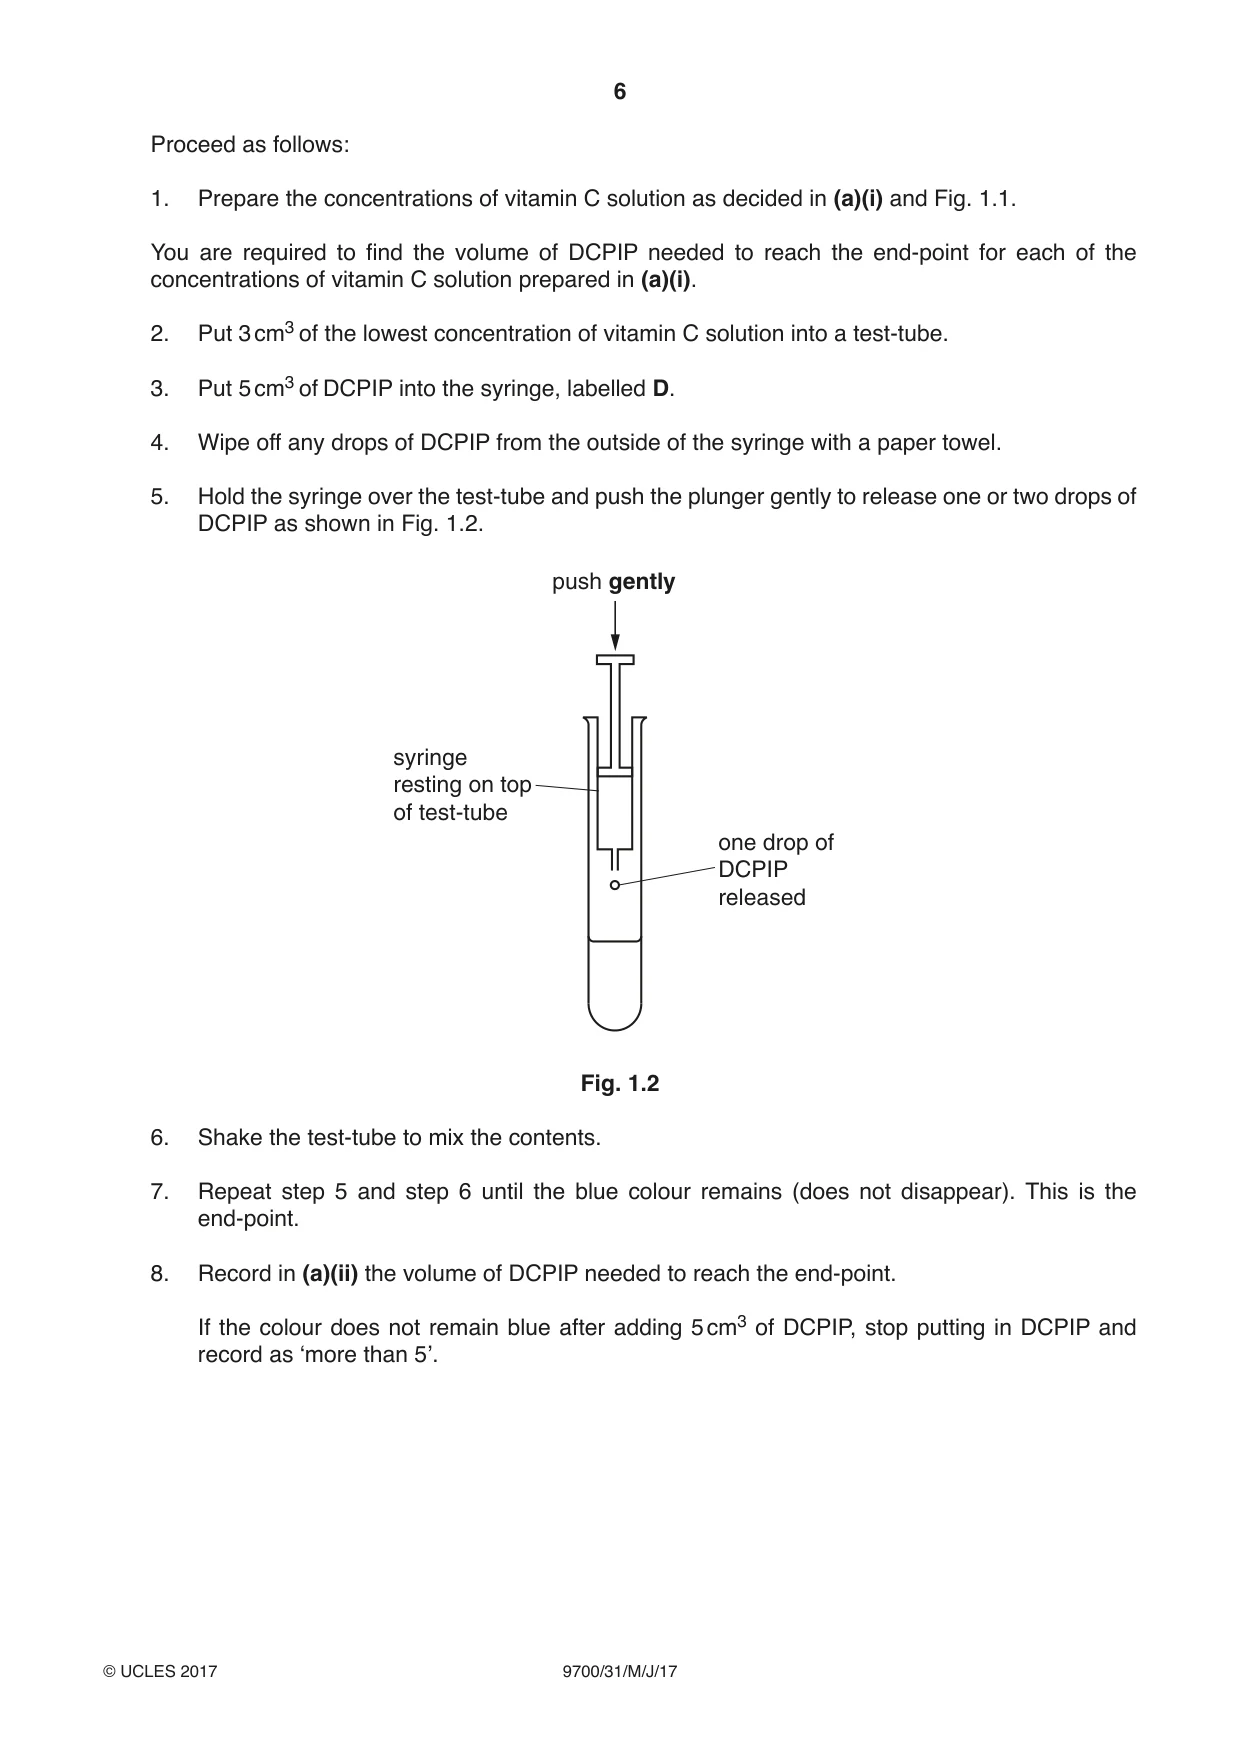
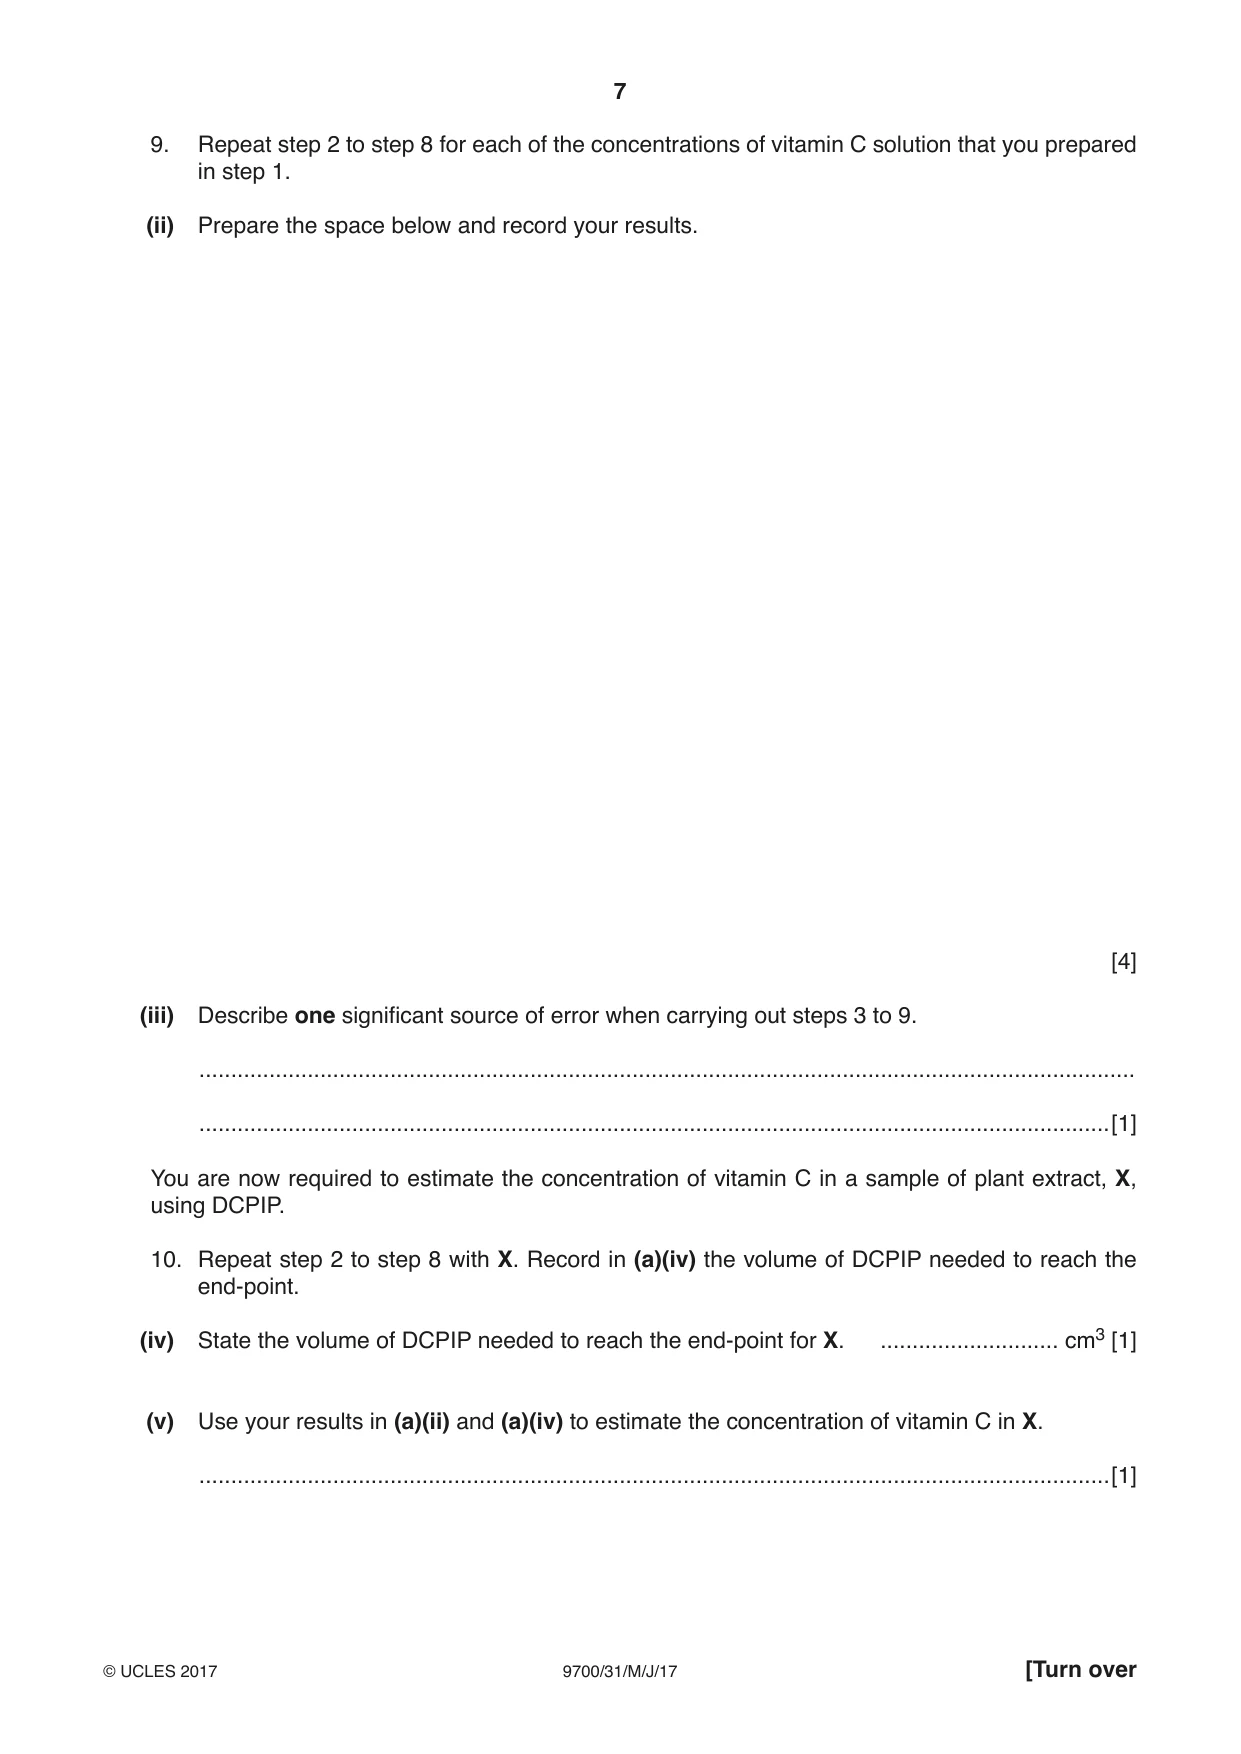
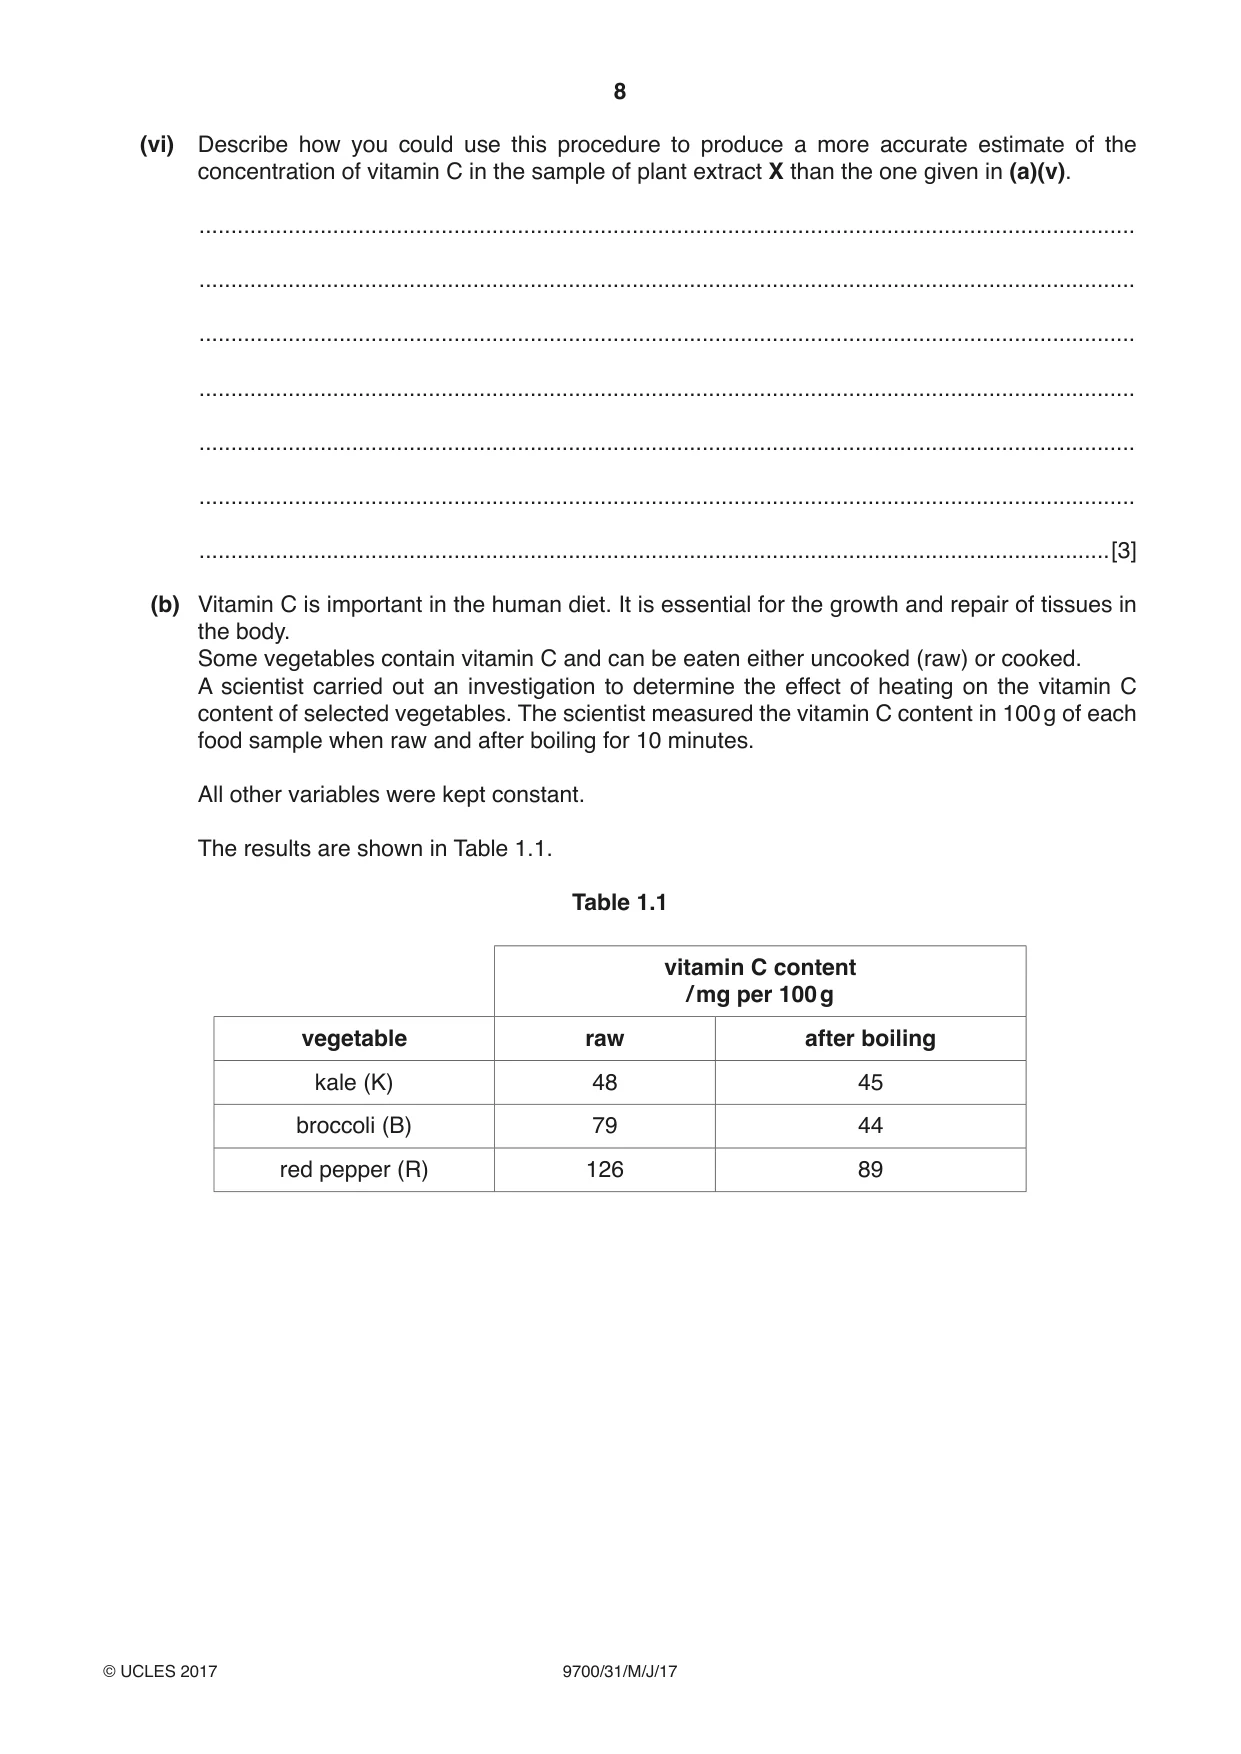
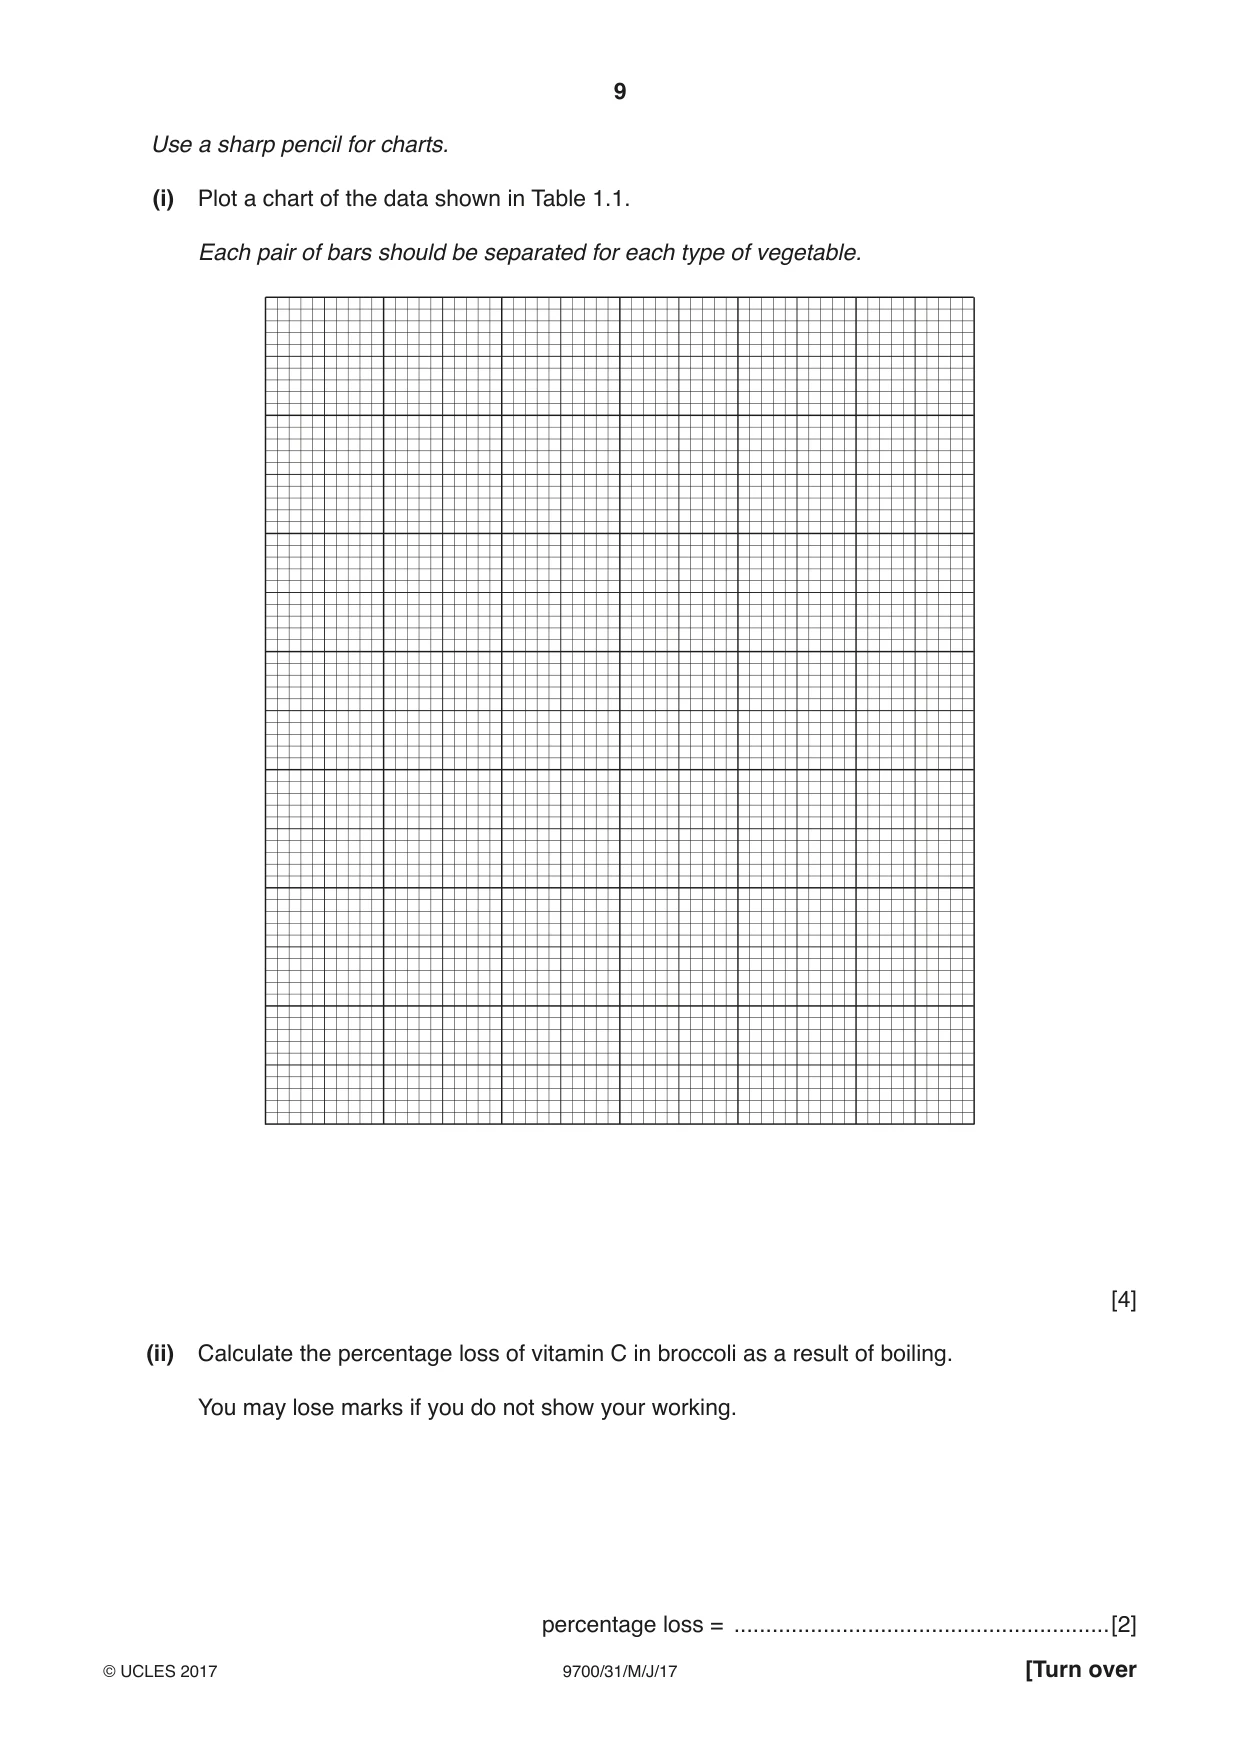
1 Some plant cells contain vitamin C (ascorbic acid), which has many functions for maintaining human health. To find the best source of vitamin C may require estimating its concentration in plant extracts. You are required to estimate the concentration of vitamin C in a solution of plant extract, X, using the indicator DCPIP. DCPIP (blue) reacts with vitamin C in a sample and becomes colourless. The end-point is when the DCPIP remains blue, so all the vitamin C has reacted with DCPIP. The greater the volume of DCPIP added to reach the end-point, the higher the concentration of vitamin C in the sample. You are required to: • prepare different concentrations of vitamin C solution, V, using a serial dilution of a 0.05% solution of V • record the volume of DCPIP required to reach the end-point for each of the concentrations of V. You are provided with: labelled contents hazard volume / cm3 V 0.05% vitamin C solution none 50 W distilled water none 100 unknown concentration of X none 20 vitamin C in a plant extract DCPIP indicator none 50 It is recommended that you wear suitable eye protection. (a) You are required to prepare a serial dilution of the 0.05% vitamin C solution, V, which reduces the concentration of V by half between each successive dilution. You will need to prepare 10 cm3 of each concentration. Fig. 1.1 shows the first two beakers you will use to make your serial dilution. (i) Complete Fig. 1.1 by drawing as many extra beakers as you need for your serial dilution. For each beaker: • state, under the beaker, the volume and concentration of the solution available for use in the investigation • use one arrow, with a label above the beaker, to show the volume and concentration of vitamin C solution added to prepare the concentration • use another arrow, with a label above the beaker, to show the volume of W added to prepare the concentration. 20 cm3 of 0.05% vitamin C solution, V 10 cm3 of 0 cm3 0.05% of W solution of V 10.......................cm3 of 0.05% vitamin C ....................... solution to use ....................... ....................... ....................... ....................... [3] Fig. 1.1 Proceed as follows: 1. Prepare the concentrations of vitamin C solution as decided in (a)(i) and Fig. 1.1. You are required to find the volume of DCPIP needed to reach the end-point for each of the concentrations of vitamin C solution prepared in (a)(i). 2. Put 3 cm3 of the lowest concentration of vitamin C solution into a test-tube. 3. Put 5 cm3 of DCPIP into the syringe, labelled D. 4. Wipe off any drops of DCPIP from the outside of the syringe with a paper towel. 5. Hold the syringe over the test-tube and push the plunger gently to release one or two drops of DCPIP as shown in Fig. 1.2. push gently syringe resting on top of test-tube one drop of DCPIP released Fig. 1.2 6. Shake the test-tube to mix the contents. 7. Repeat step 5 and step 6 until the blue colour remains (does not disappear). This is the end-point. 8. Record in (a)(ii) the volume of DCPIP needed to reach the end-point. If the colour does not remain blue after adding 5 cm3 of DCPIP, stop putting in DCPIP and record as ‘more than 5’. 9. Repeat step 2 to step 8 for each of the concentrations of vitamin C solution that you prepared in step 1. (ii) Prepare the space below and record your results. [4] (iii) Describe one significant source of error when carrying out steps 3 to 9. ................................................................................................................................................... ...............................................................................................................................................[1] You are now required to estimate the concentration of vitamin C in a sample of plant extract, X, using DCPIP. 10. Repeat step 2 to step 8 with X. Record in (a)(iv) the volume of DCPIP needed to reach the end-point. (iv) State the volume of DCPIP needed to reach the end-point for X. ............................ cm3 [1] (v) Use your results in (a)(ii) and (a)(iv) to estimate the concentration of vitamin C in X. ...............................................................................................................................................[1] (vi) Describe how you could use this procedure to produce a more accurate estimate of the concentration of vitamin C in the sample of plant extract X than the one given in (a)(v). ................................................................................................................................................... ................................................................................................................................................... ................................................................................................................................................... ................................................................................................................................................... ................................................................................................................................................... ................................................................................................................................................... ...............................................................................................................................................[3] (b) Vitamin C is important in the human diet. It is essential for the growth and repair of tissues in the body. Some vegetables contain vitamin C and can be eaten either uncooked (raw) or cooked. A scientist carried out an investigation to determine the effect of heating on the vitamin C content of selected vegetables. The scientist measured the vitamin C content in 100 g of each food sample when raw and after boiling for 10 minutes. All other variables were kept constant. The results are shown in Table 1.1. Table 1.1 vitamin C content / mg per 100 g vegetable raw after boiling kale (K) 48 45 broccoli (B) 79 44 red pepper (R) 126 89 Use a sharp pencil for charts. (i) Plot a chart of the data shown in Table 1.1. Each pair of bars should be separated for each type of vegetable. [4] (ii) Calculate the percentage loss of vitamin C in broccoli as a result of boiling. You may lose marks if you do not show your working. percentage loss = ...........................................................[2] (iii) In raw vegetables vitamin C is contained within the cells of the tissues. Suggest how boiling causes the loss of vitamin C in broccoli. ................................................................................................................................................... ................................................................................................................................................... ................................................................................................................................................... ................................................................................................................................................... ...............................................................................................................................................[2] [Total: 21]
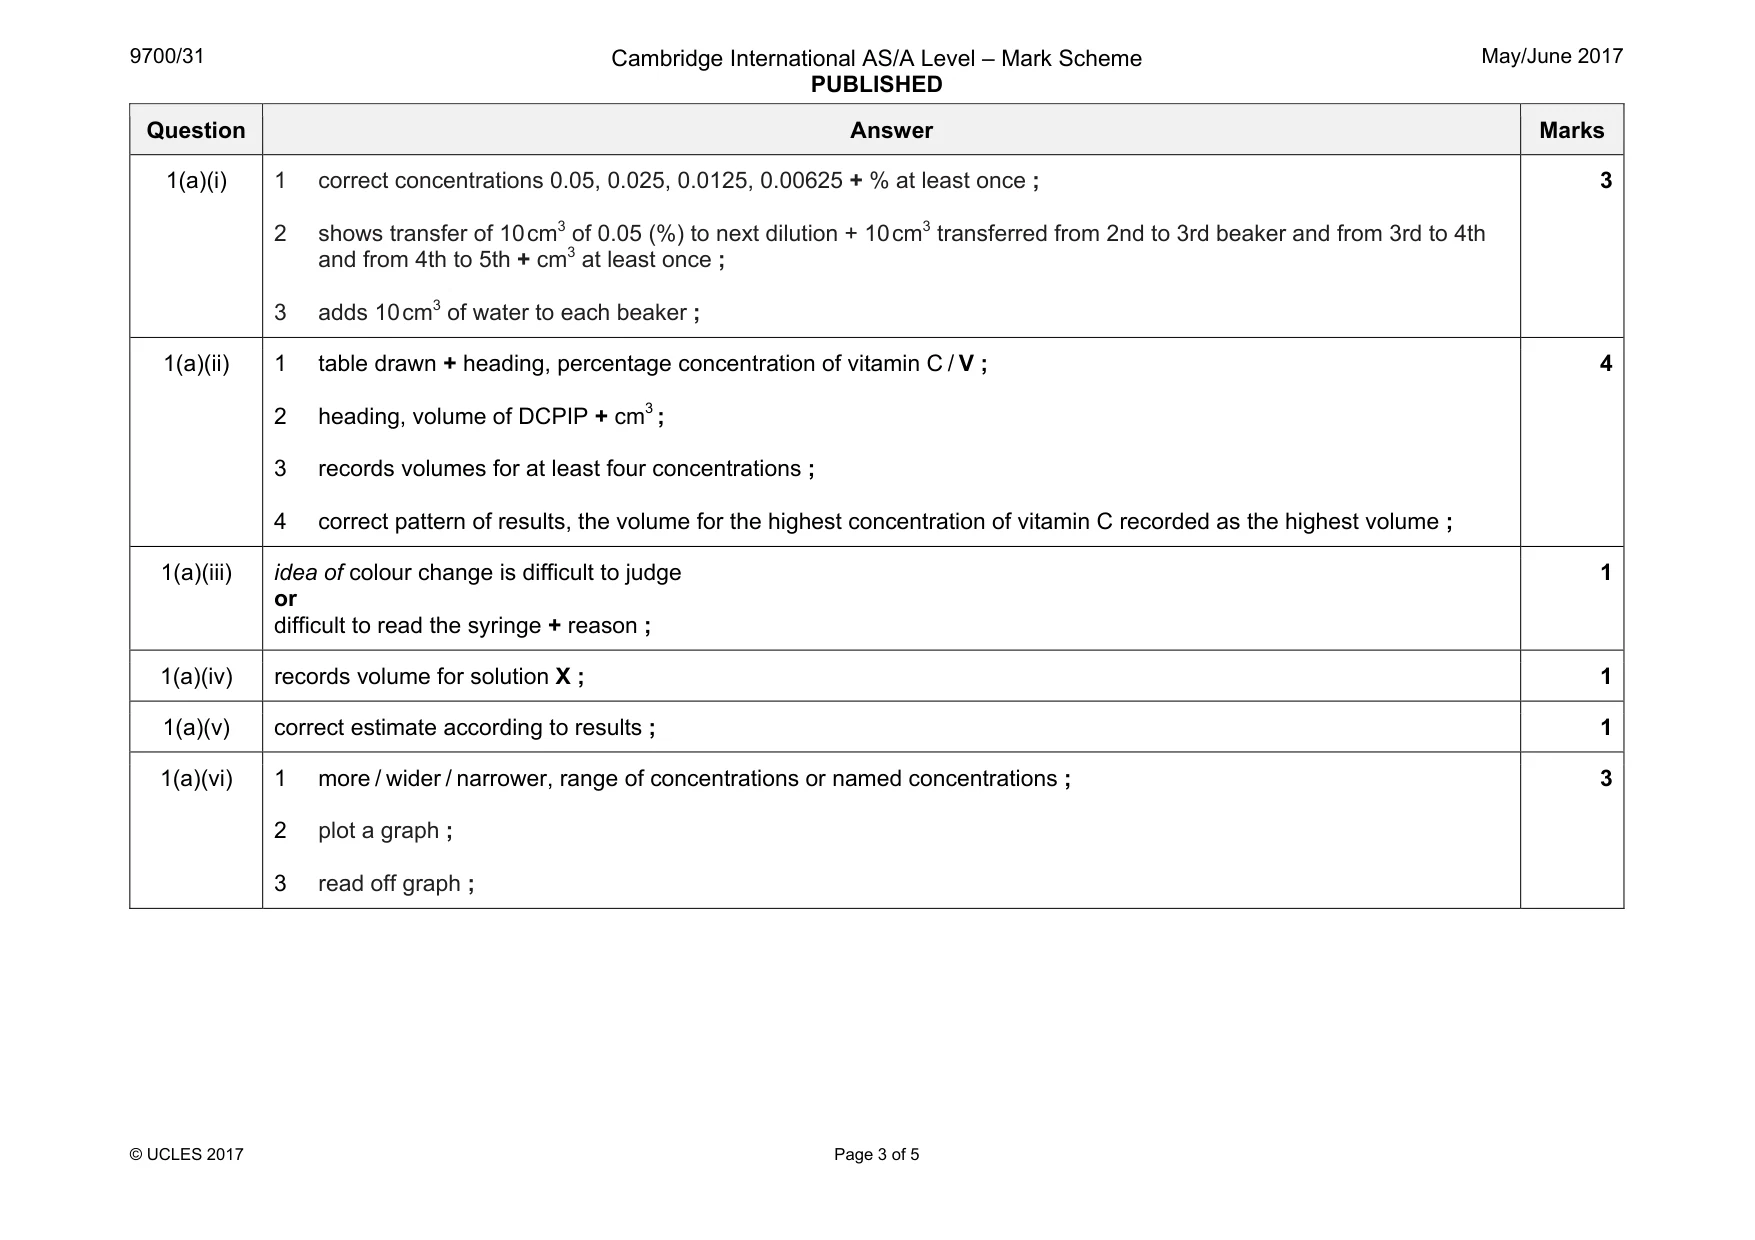
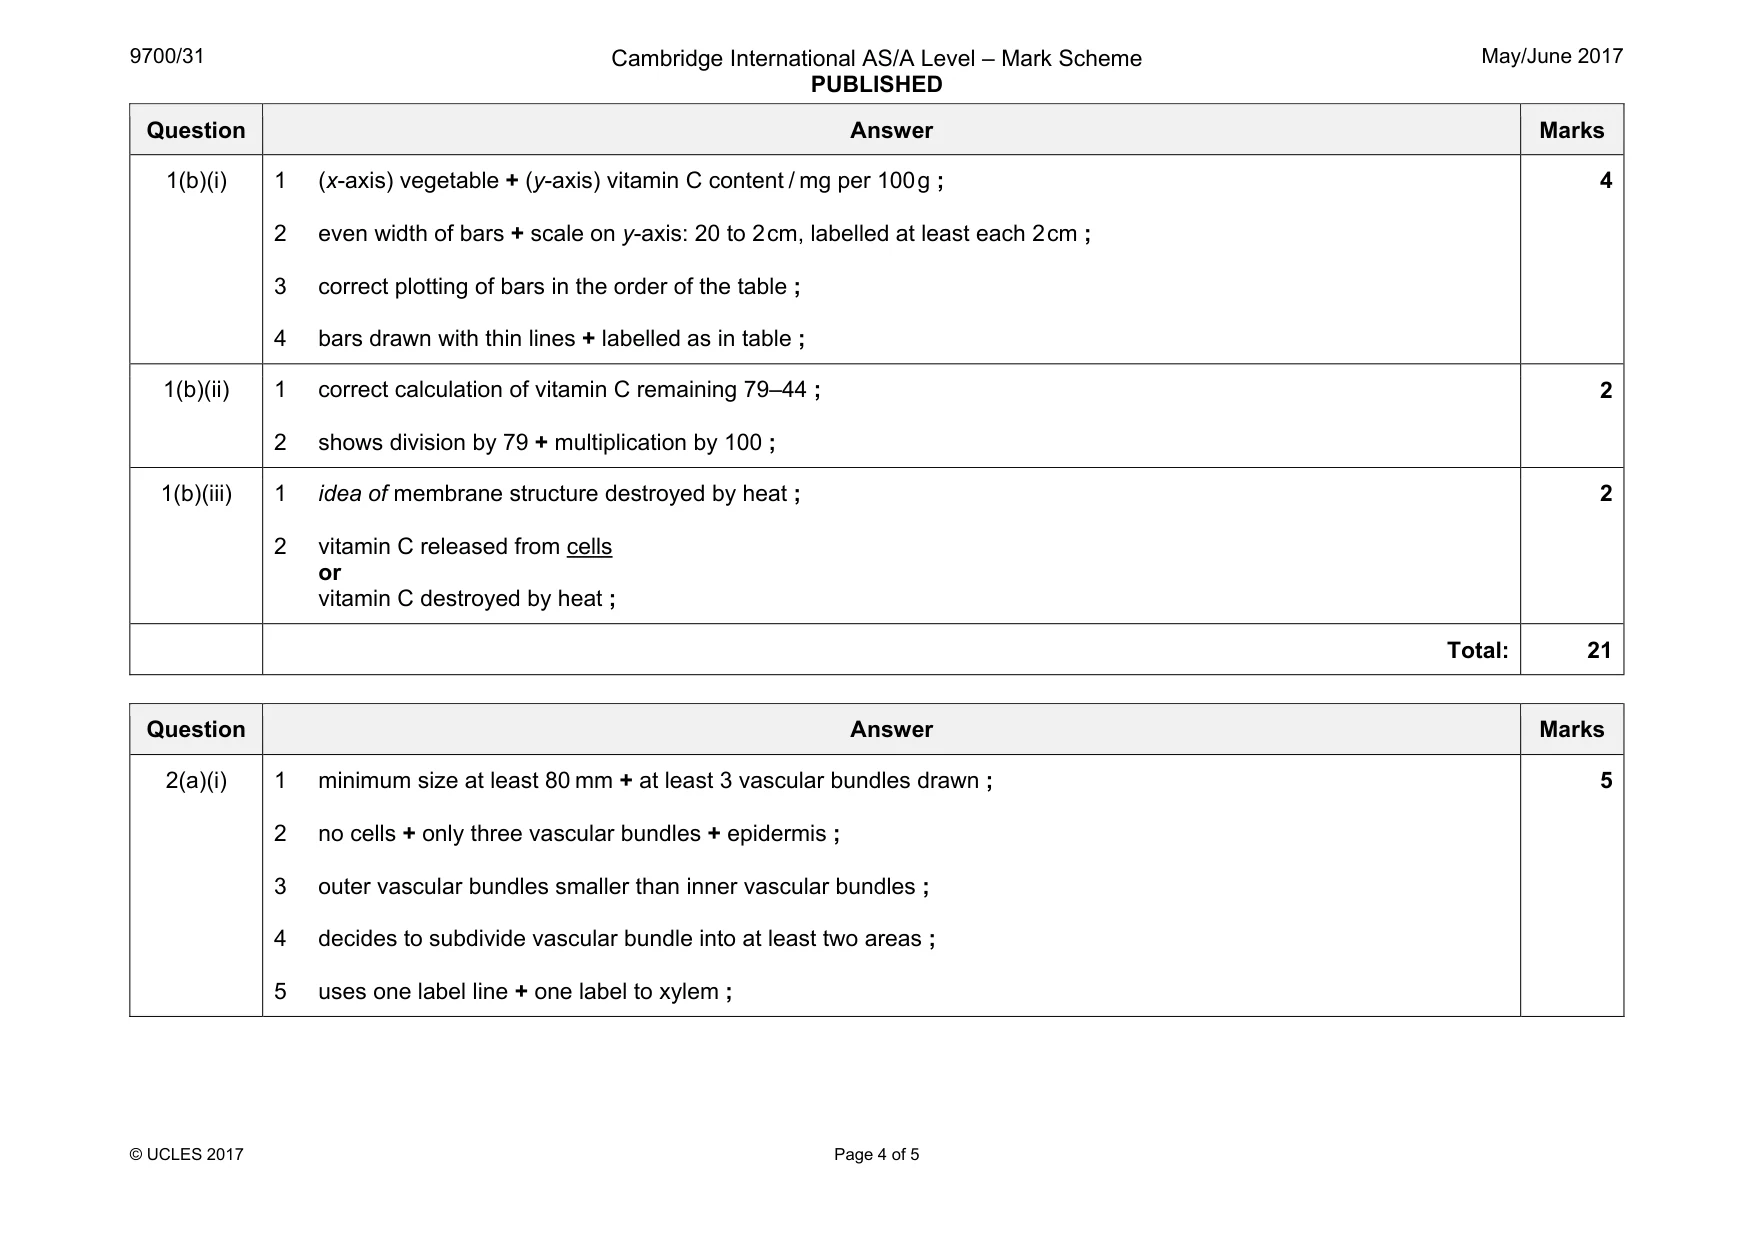
Mark scheme: 1(a)(i) 1 correct concentrations 0.05, 0.025, 0.0125, 0.00625 + % at least once ; 2 shows transfer of 10 cm3 of 0.05 (%) to next dilution + 10 cm3 transferred from 2nd to 3rd beaker and from 3rd to 4th and from 4th to 5th + cm3 at least once ; 3 adds 10 cm3 of water to each beaker ; 3 1(a)(ii) 1 table drawn + heading, percentage concentration of vitamin C / V ; 2 heading, volume of DCPIP + cm3 ; 3 records volumes for at least four concentrations ; 4 correct pattern of results, the volume for the highest concentration of vitamin C recorded as the highest volume ; 4 1(a)(iii) idea of colour change is difficult to judge or difficult to read the syringe + reason ; 1 1(a)(iv) records volume for solution X ; 1 1(a)(v) correct estimate according to results ; 1 1(a)(vi) 1 more / wider / narrower, range of concentrations or named concentrations ; 2 plot a graph ; 3 read off graph ; 3 Question Answer Marks 1(b)(i) 1 (x-axis) vegetable + (y-axis) vitamin C content / mg per 100 g ; 2 even width of bars + scale on y-axis: 20 to 2 cm, labelled at least each 2 cm ; 3 correct plotting of bars in the order of the table ; 4 bars drawn with thin lines + labelled as in table ; 4 1(b)(ii) 1 correct calculation of vitamin C remaining 79–44 ; 2 shows division by 79 + multiplication by 100 ; 2 1(b)(iii) 1 idea of membrane structure destroyed by heat ; 2 vitamin C released from cells or vitamin C destroyed by heat ; 2 Total: 21
Q2 · J1 is a slide of a stained transverse section through a plant stem
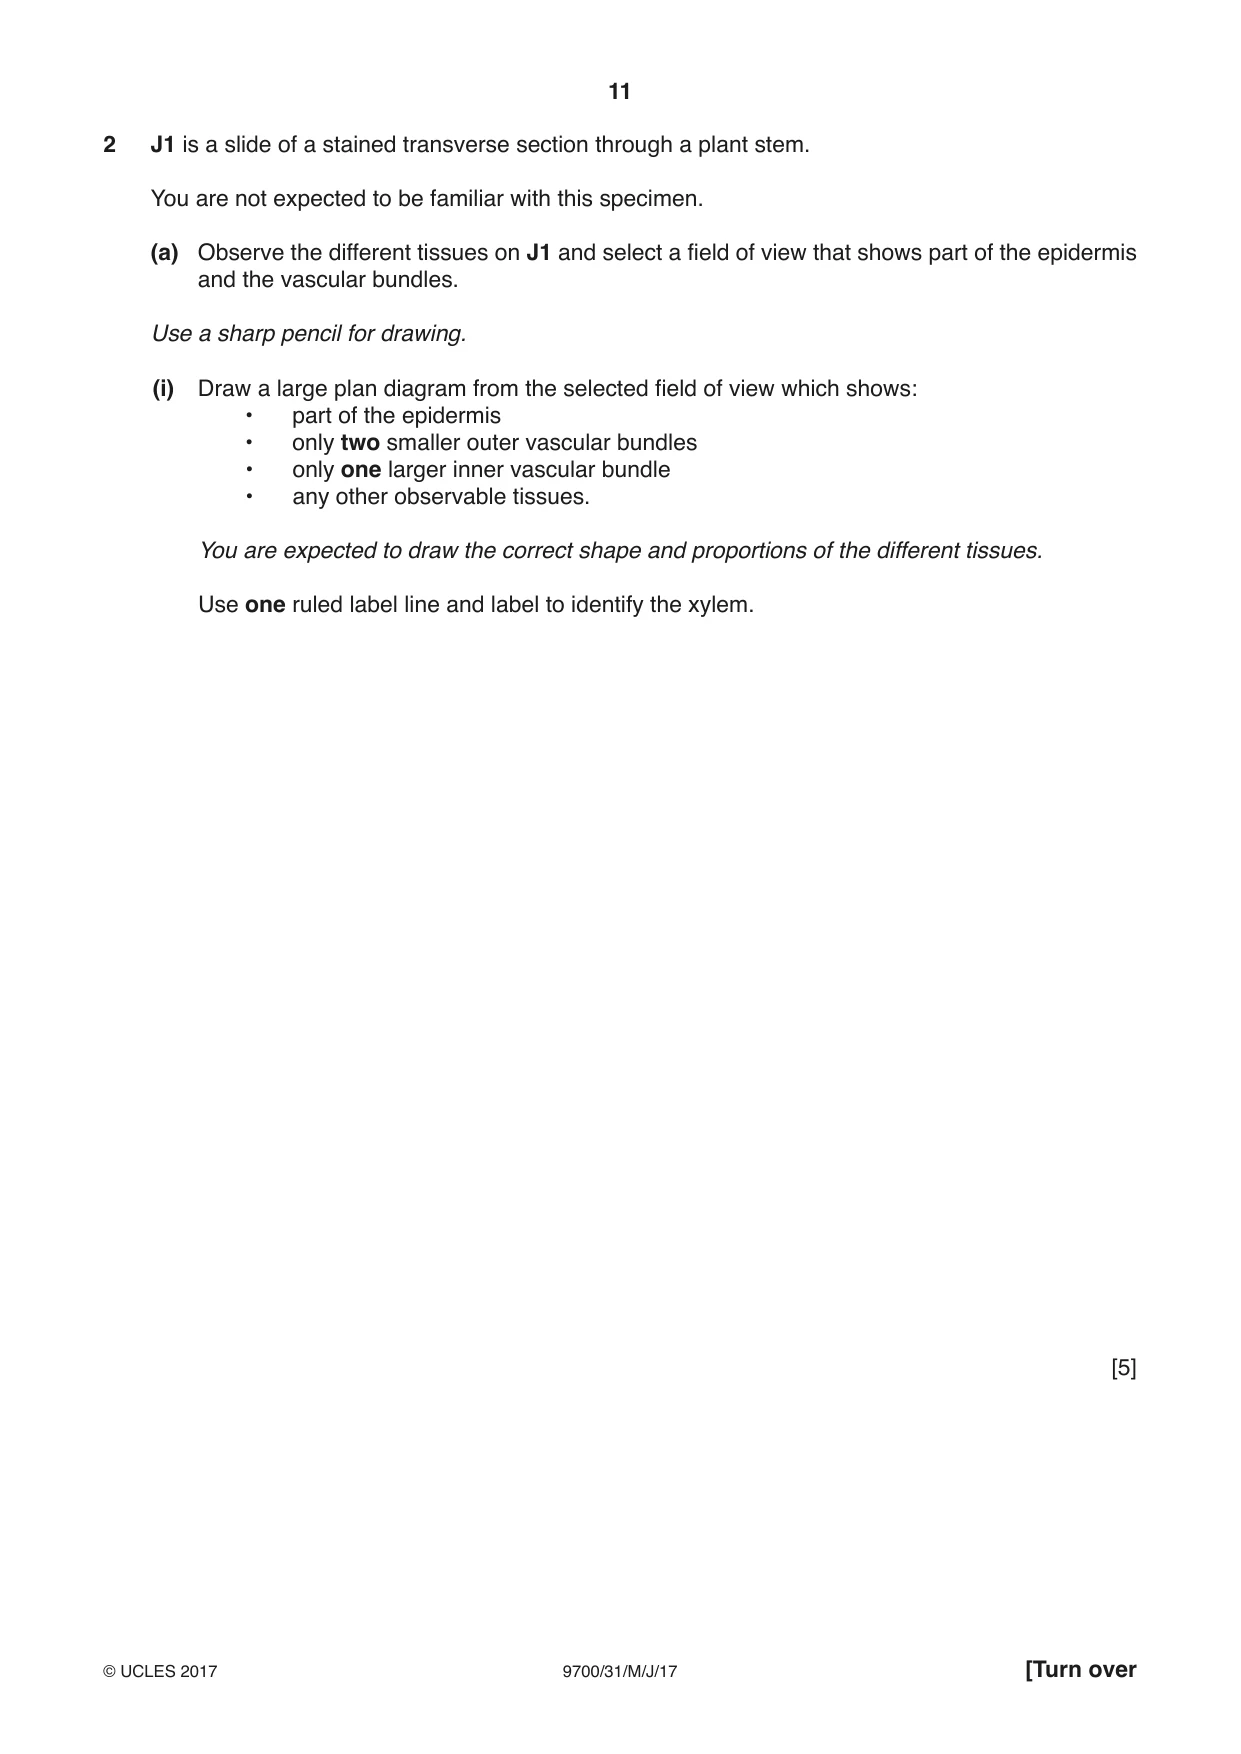
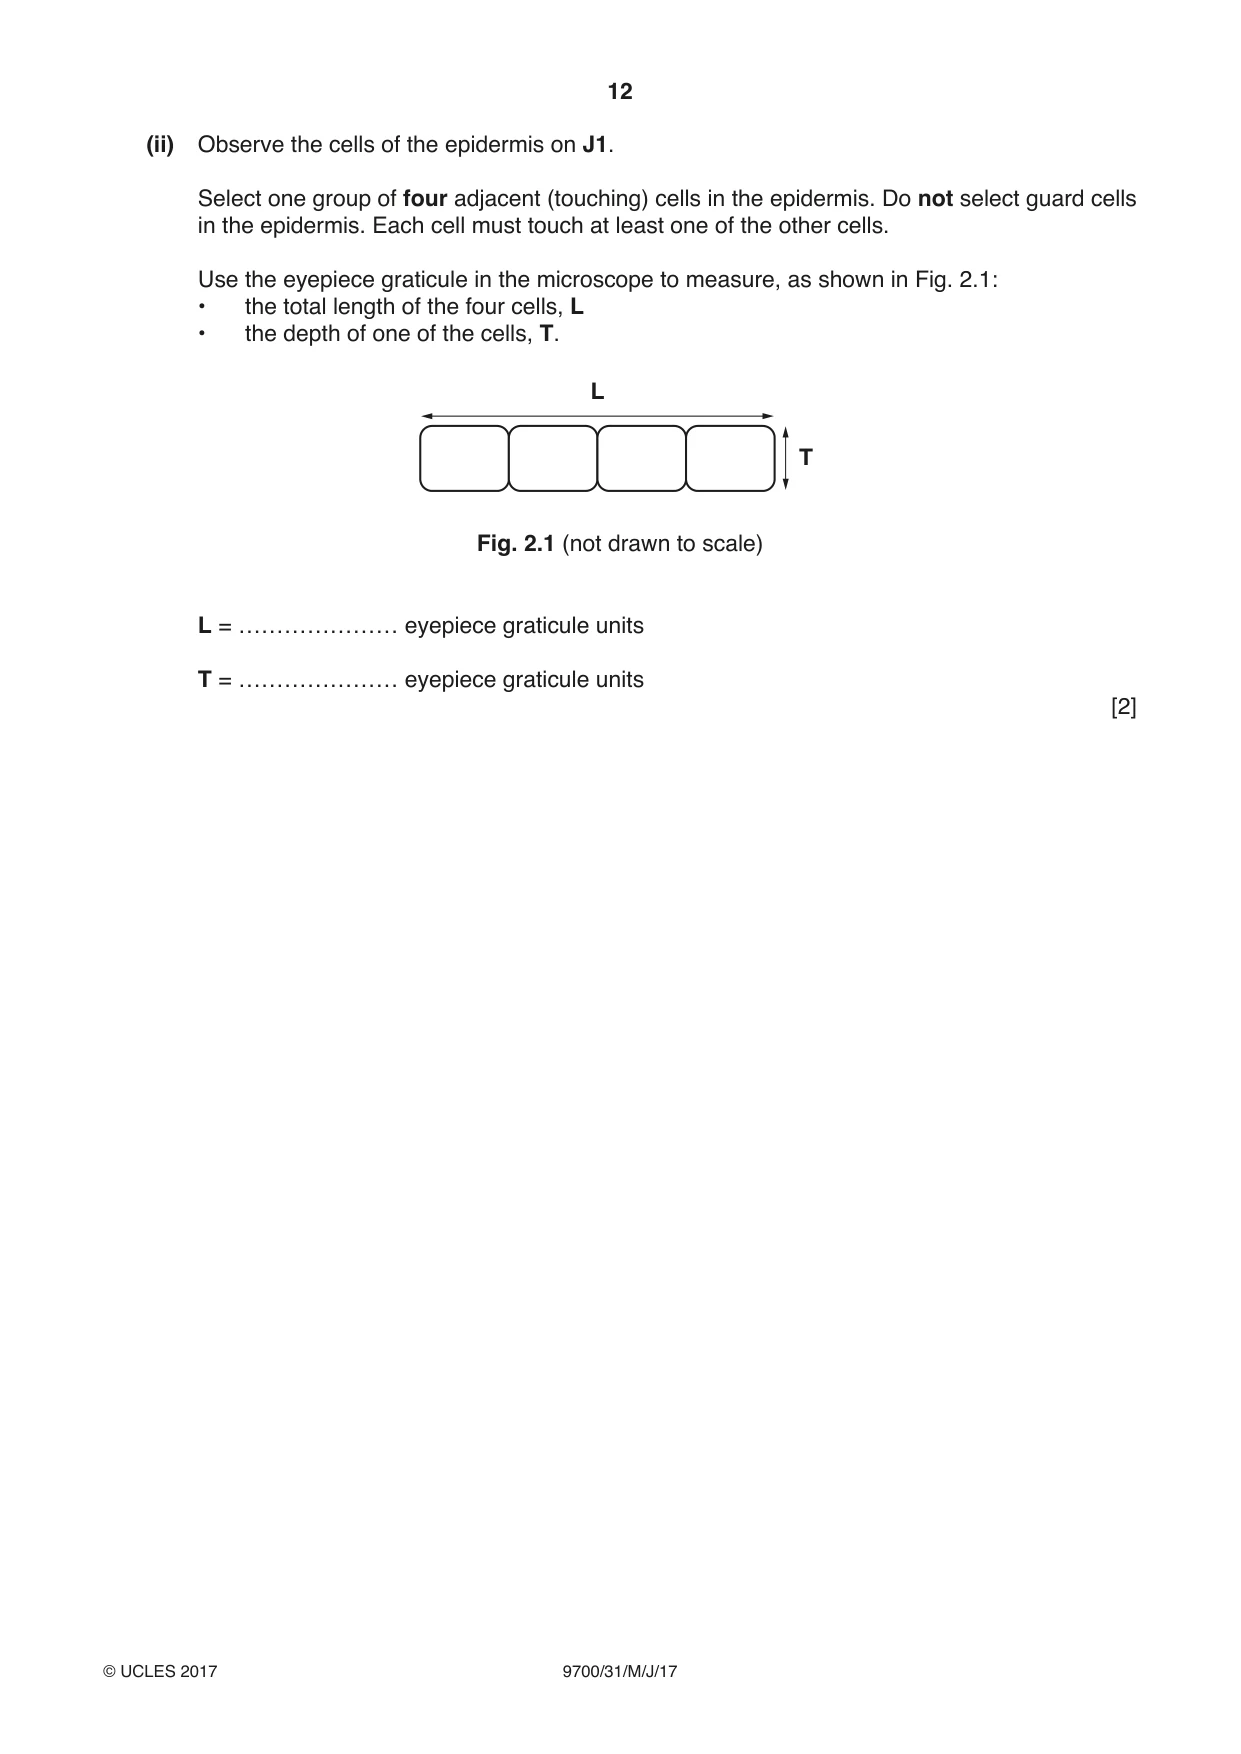
2 J1 is a slide of a stained transverse section through a plant stem. You are not expected to be familiar with this specimen. (a) Observe the different tissues on J1 and select a field of view that shows part of the epidermis and the vascular bundles. Use a sharp pencil for drawing. (i) Draw a large plan diagram from the selected field of view which shows: • part of the epidermis • only two smaller outer vascular bundles • only one larger inner vascular bundle • any other observable tissues. You are expected to draw the correct shape and proportions of the different tissues. Use one ruled label line and label to identify the xylem. [5] (ii) Observe the cells of the epidermis on J1. Select one group of four adjacent (touching) cells in the epidermis. Do not select guard cells in the epidermis. Each cell must touch at least one of the other cells. Use the eyepiece graticule in the microscope to measure, as shown in Fig. 2.1: • the total length of the four cells, L • the depth of one of the cells, T. L T Fig. 2.1 (not drawn to scale) L = ………………… eyepiece graticule units T = ………………… eyepiece graticule units [2] (iii) Use the measurements from (a)(ii) to help you make a large drawing of this group of four cells on J1. Use one ruled label line and label to identify the cell wall of one cell. [5] (iv) Suggest one observable feature of J1 which supports the conclusion that this plant exchanges gases through its stem. ................................................................................................................................................... ................................................................................................................................................... ...............................................................................................................................................[1]
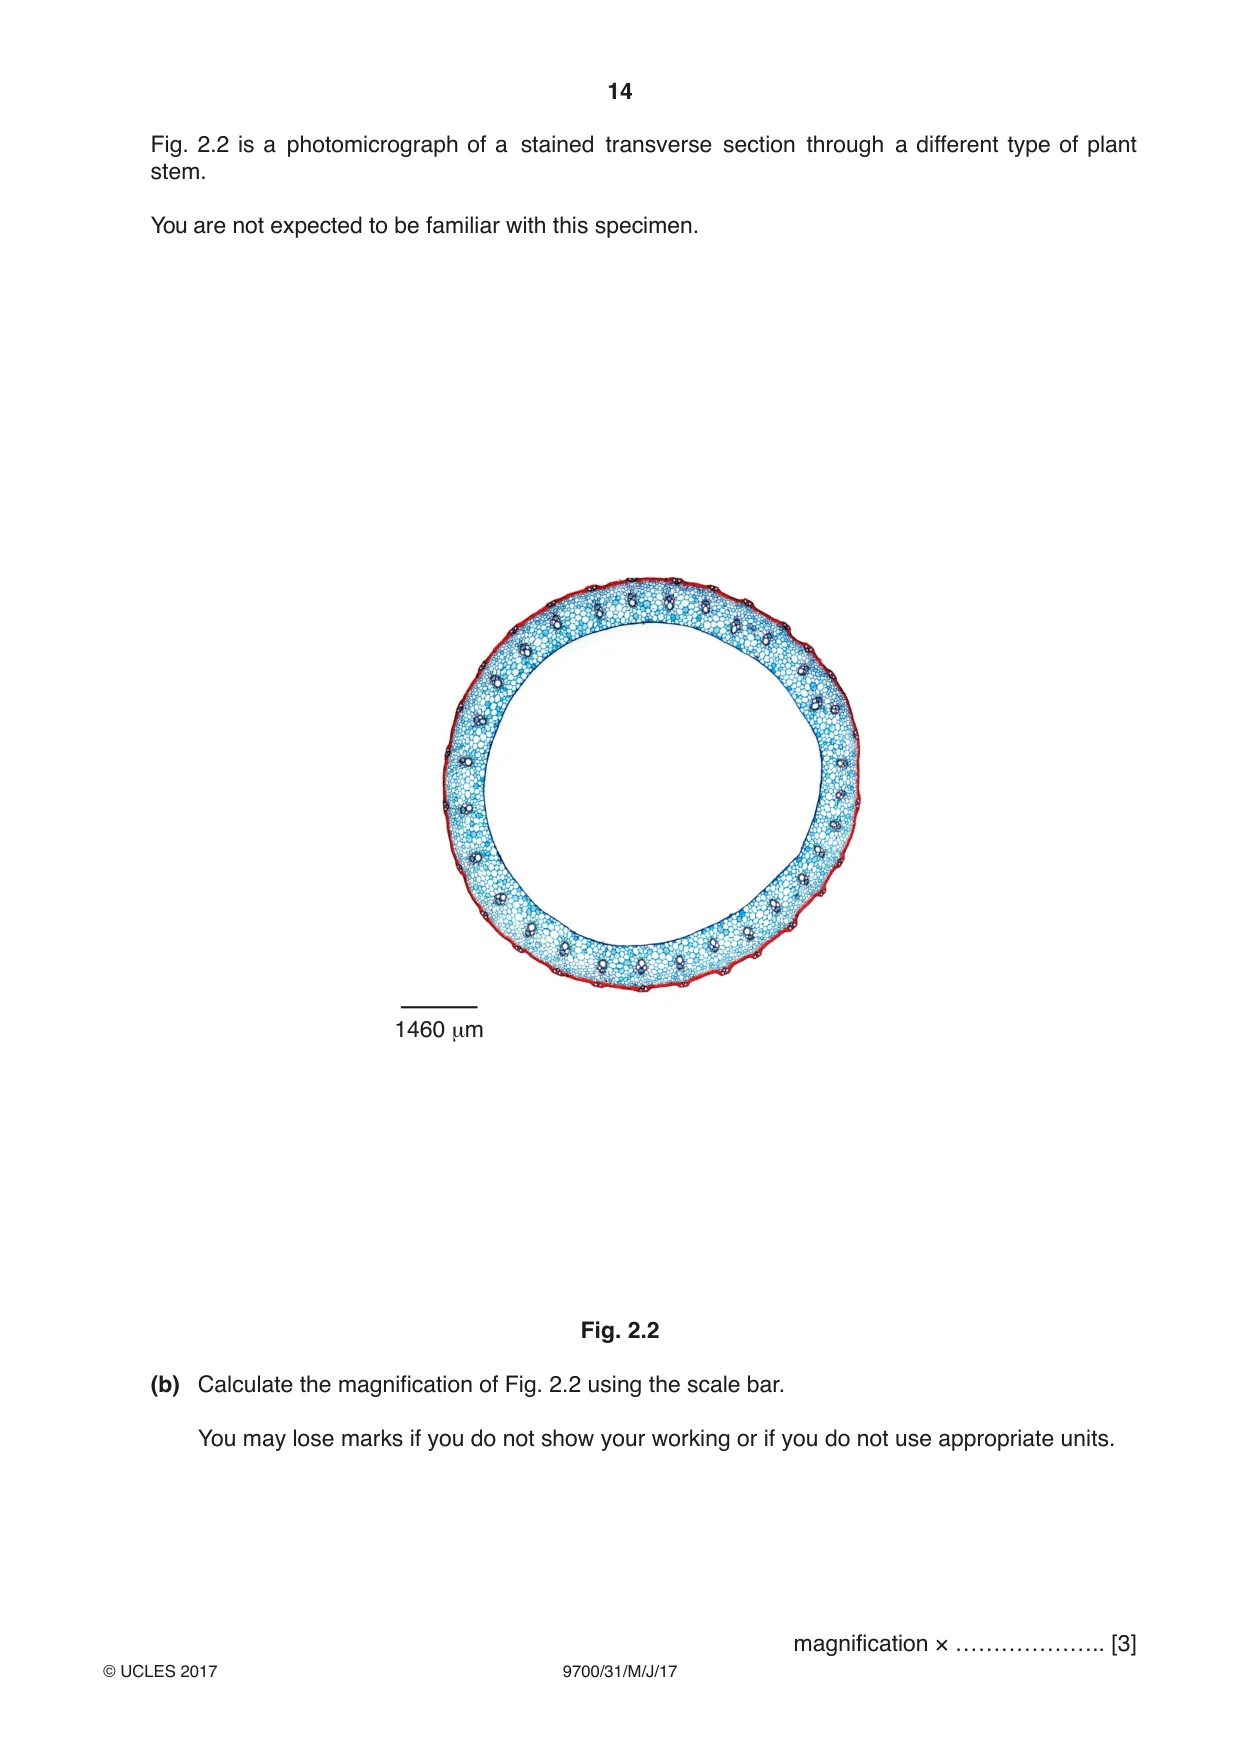
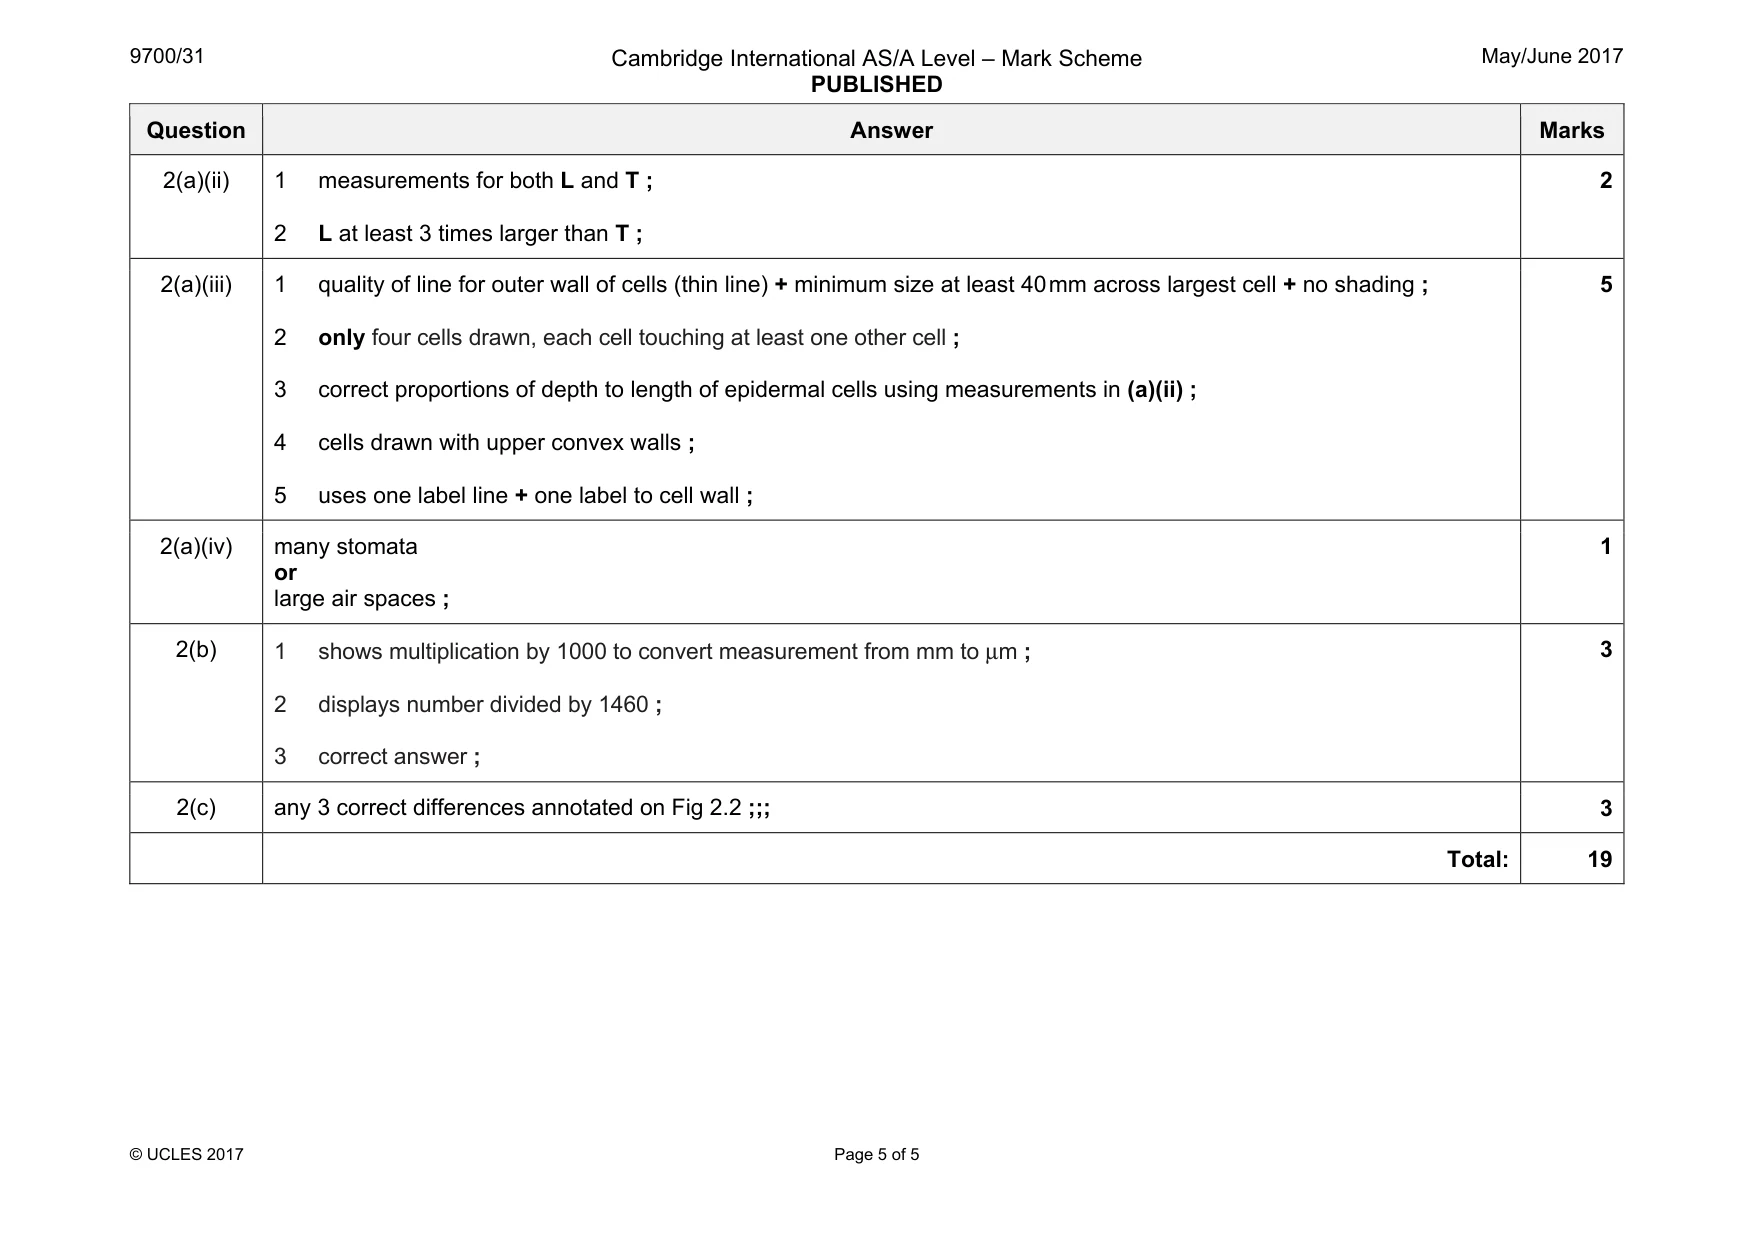
Mark scheme: 2(a)(i) 1 minimum size at least 80 mm + at least 3 vascular bundles drawn ; 2 no cells + only three vascular bundles + epidermis ; 3 outer vascular bundles smaller than inner vascular bundles ; 4 decides to subdivide vascular bundle into at least two areas ; 5 uses one label line + one label to xylem ; 5 Question Answer Marks 2(a)(ii) 1 measurements for both L and T ; 2 L at least 3 times larger than T ; 2 2(a)(iii) 1 quality of line for outer wall of cells (thin line) + minimum size at least 40 mm across largest cell + no shading ; 2 only four cells drawn, each cell touching at least one other cell ; 3 correct proportions of depth to length of epidermal cells using measurements in (a)(ii) ; 4 cells drawn with upper convex walls ; 5 uses one label line + one label to cell wall ; 5 2(a)(iv) many stomata or large air spaces ; 1 2(b) 1 shows multiplication by 1000 to convert measurement from mm to µm ; 2 displays number divided by 1460 ; 3 correct answer ; 3 2(c) any 3 correct differences annotated on Fig 2.2 ;;; 3 Total: 19
What was in this paper
The subtopics covered by these 2 questions, and how many questions each got. Open one in a new tab to see every Cambridge question on it.
What you needed in this session
Cambridge’s own grade thresholds for 2017 May/June, Paper 3 · Variant 1. A higher threshold means an easier paper — the bar moves with how the cohort did.