Cambridge A Level Biology 9700 — 2017 May/June Paper 3 · Variant 3
9700/33/M/J/17 · 2 questions · 40 marks · ≈45 min
The question paper and its mark scheme, free to read here and free to download. This is Cambridge’s own paper, exactly as it was sat.
Question paper12 pages



Mark scheme5 pages
Answers below. Sit the paper first if you are practising.
Questions as text
Q1 · When a person eats food containing starch, the enzyme amylase is released to hydrolyse…
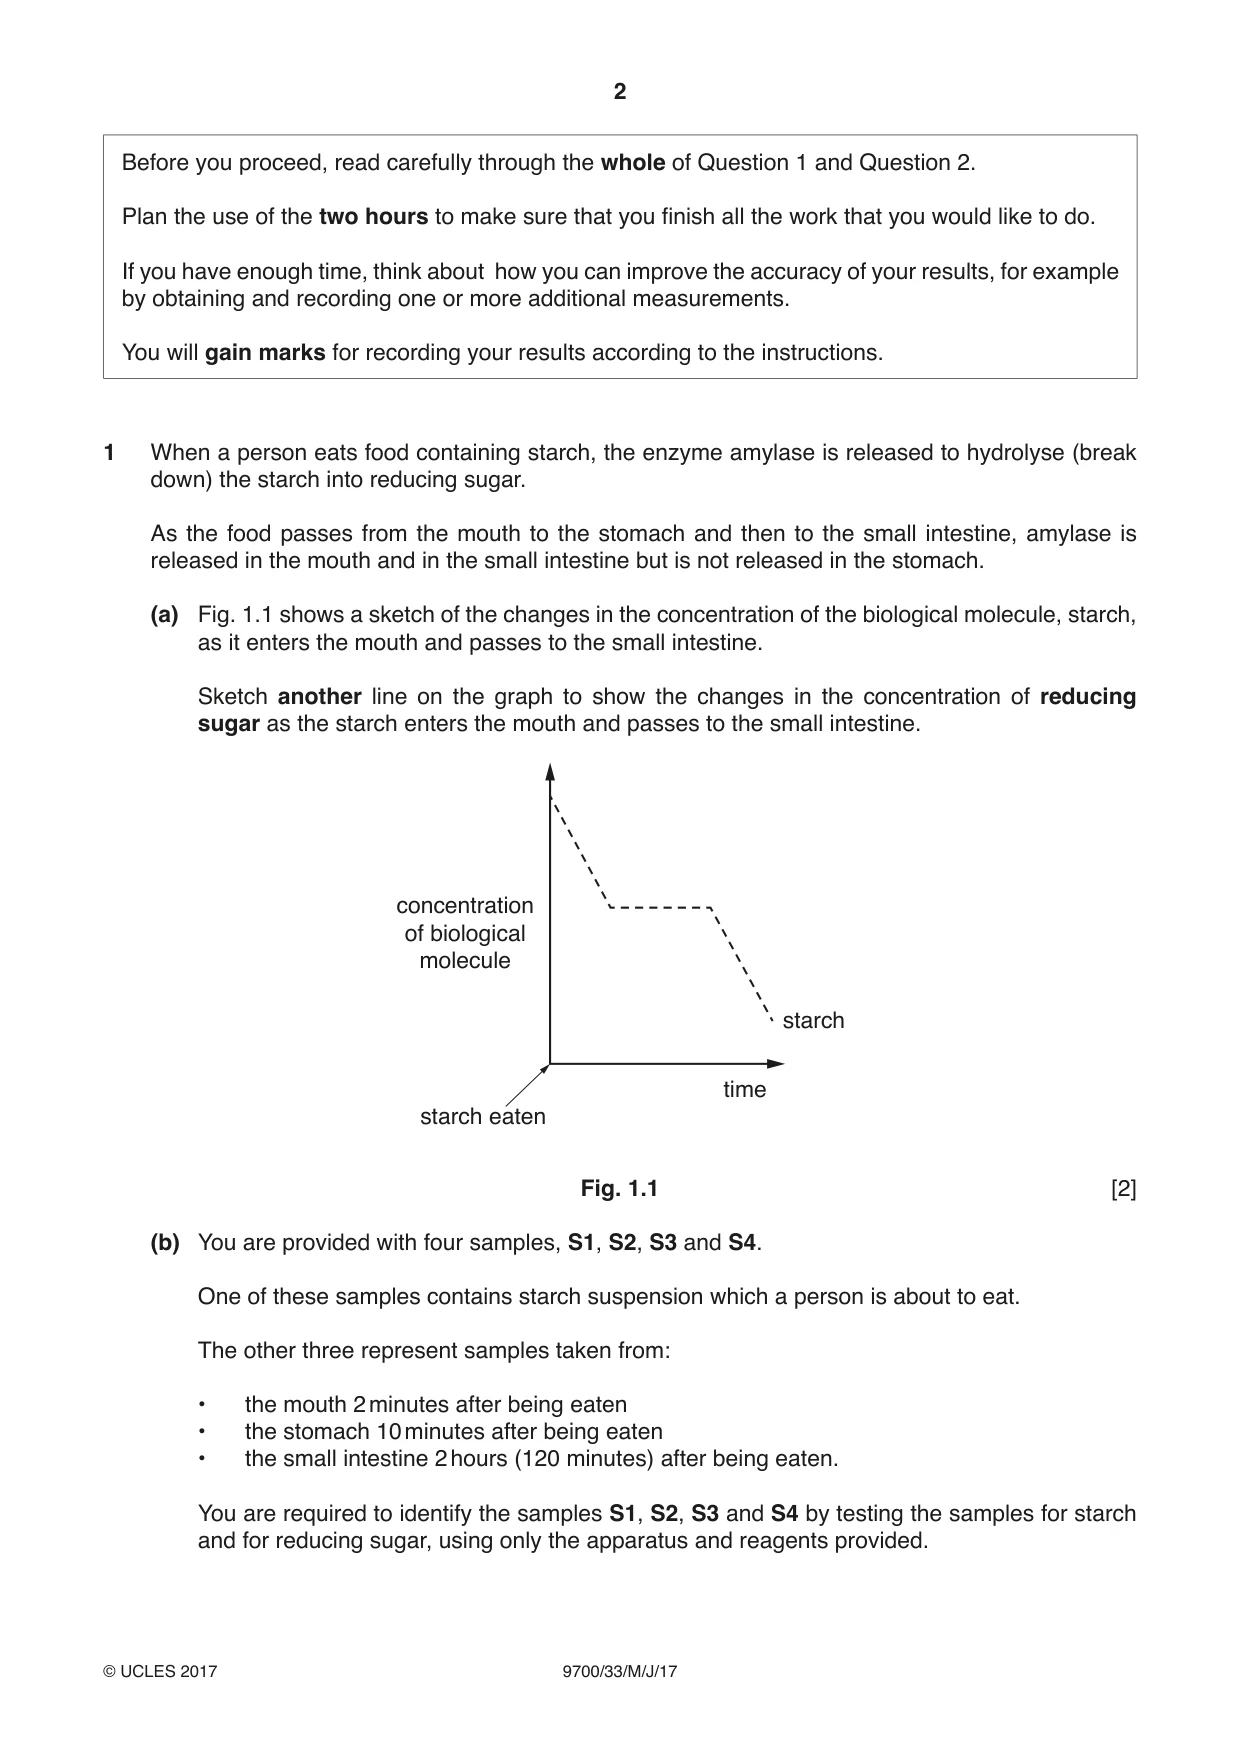
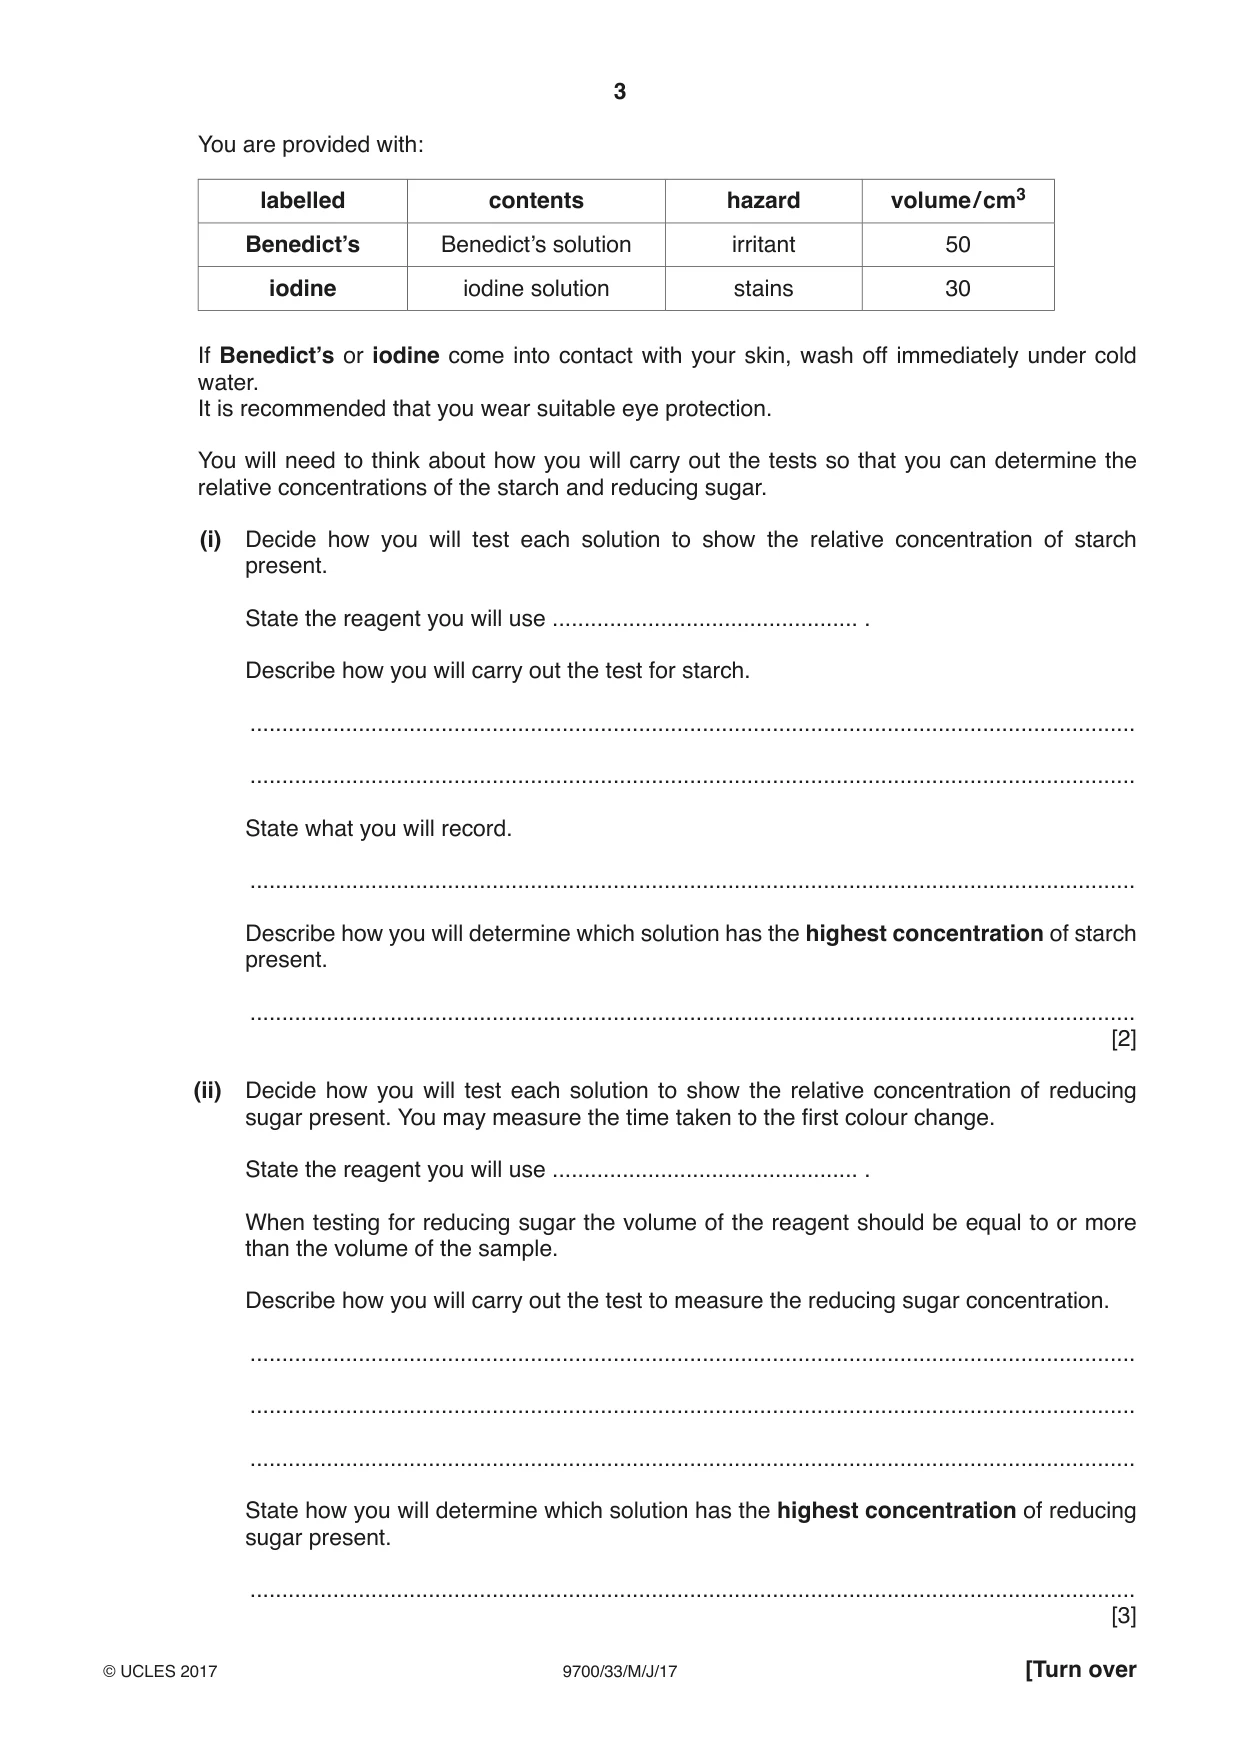
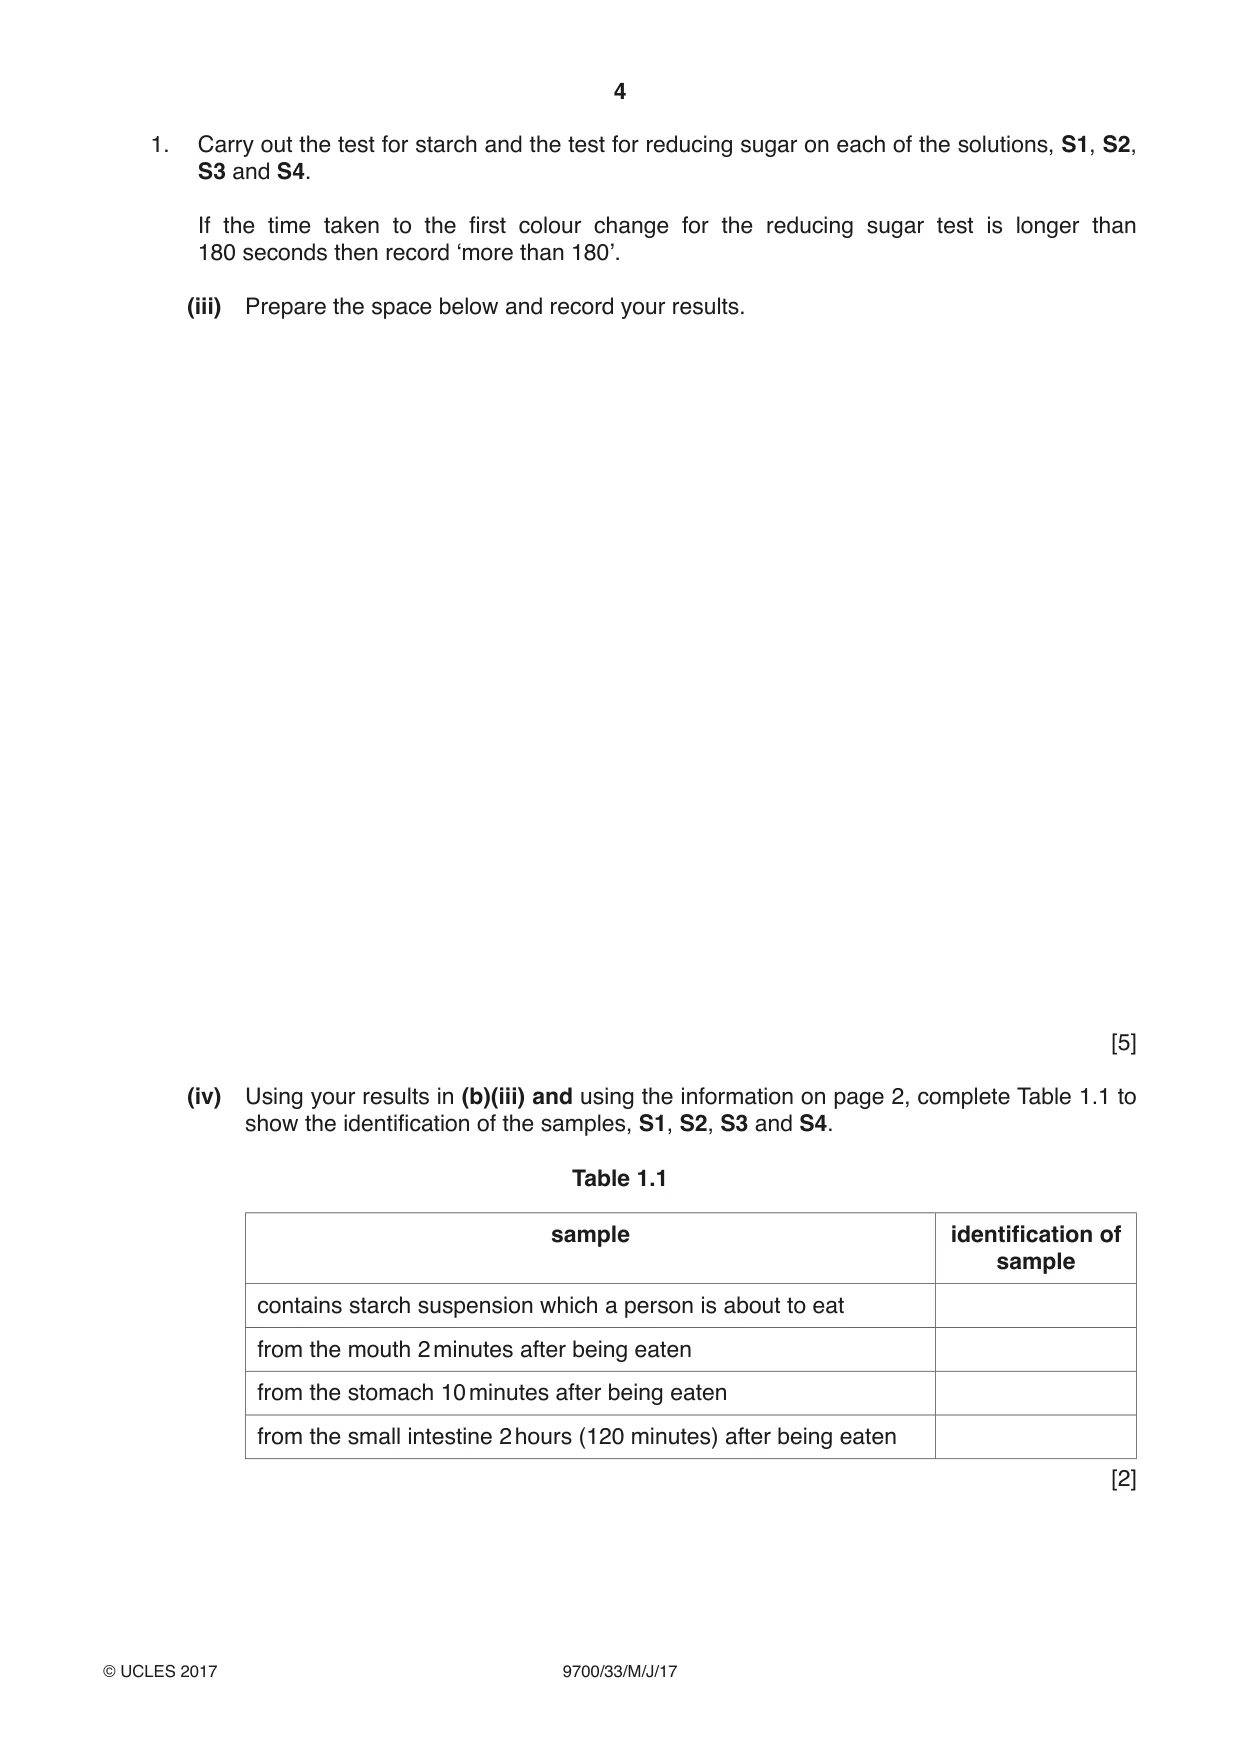
1 When a person eats food containing starch, the enzyme amylase is released to hydrolyse (break down) the starch into reducing sugar. As the food passes from the mouth to the stomach and then to the small intestine, amylase is released in the mouth and in the small intestine but is not released in the stomach. (a) Fig. 1.1 shows a sketch of the changes in the concentration of the biological molecule, starch, as it enters the mouth and passes to the small intestine. Sketch another line on the graph to show the changes in the concentration of reducing sugar as the starch enters the mouth and passes to the small intestine. concentration of biological molecule starch time starch eaten Fig. 1.1 [2] (b) You are provided with four samples, S1, S2, S3 and S4. One of these samples contains starch suspension which a person is about to eat. The other three represent samples taken from: • the mouth 2 minutes after being eaten • the stomach 10 minutes after being eaten • the small intestine 2 hours (120 minutes) after being eaten. You are required to identify the samples S1, S2, S3 and S4 by testing the samples for starch and for reducing sugar, using only the apparatus and reagents provided. You are provided with: labelled contents hazard volume / cm3 Benedict’s Benedict’s solution irritant 50 iodine iodine solution stains 30 If Benedict’s or iodine come into contact with your skin, wash off immediately under cold water. It is recommended that you wear suitable eye protection. You will need to think about how you will carry out the tests so that you can determine the relative concentrations of the starch and reducing sugar. (i) Decide how you will test each solution to show the relative concentration of starch present. State the reagent you will use ................................................ . Describe how you will carry out the test for starch. ........................................................................................................................................... ........................................................................................................................................... State what you will record. ........................................................................................................................................... Describe how you will determine which solution has the highest concentration of starch present. ........................................................................................................................................... [2] (ii) Decide how you will test each solution to show the relative concentration of reducing sugar present. You may measure the time taken to the first colour change. State the reagent you will use ................................................ . When testing for reducing sugar the volume of the reagent should be equal to or more than the volume of the sample. Describe how you will carry out the test to measure the reducing sugar concentration. ........................................................................................................................................... ........................................................................................................................................... ........................................................................................................................................... State how you will determine which solution has the highest concentration of reducing sugar present. ........................................................................................................................................... [3] 1. Carry out the test for starch and the test for reducing sugar on each of the solutions, S1, S2, S3 and S4. If the time taken to the first colour change for the reducing sugar test is longer than 180 seconds then record ‘more than 180’. (iii) Prepare the space below and record your results. [5] (iv) Using your results in (b)(iii) and using the information on page 2, complete Table 1.1 to show the identification of the samples, S1, S2, S3 and S4. Table 1.1 sample identification of sample contains starch suspension which a person is about to eat from the mouth 2 minutes after being eaten from the stomach 10 minutes after being eaten from the small intestine 2 hours (120 minutes) after being eaten [2] (v) Explain how you decided which sample was taken from the small intestine. ........................................................................................................................................... ........................................................................................................................................... .......................................................................................................................................[1] (c) A student wanted to obtain a quantitative estimate of the reducing sugar concentration in a sample. Describe how the student could obtain a quantitative estimate of the concentration of reducing sugar in a sample. ................................................................................................................................................... ................................................................................................................................................... ................................................................................................................................................... ................................................................................................................................................... ................................................................................................................................................... ................................................................................................................................................... ................................................................................................................................................... ...............................................................................................................................................[3] [Total: 18]
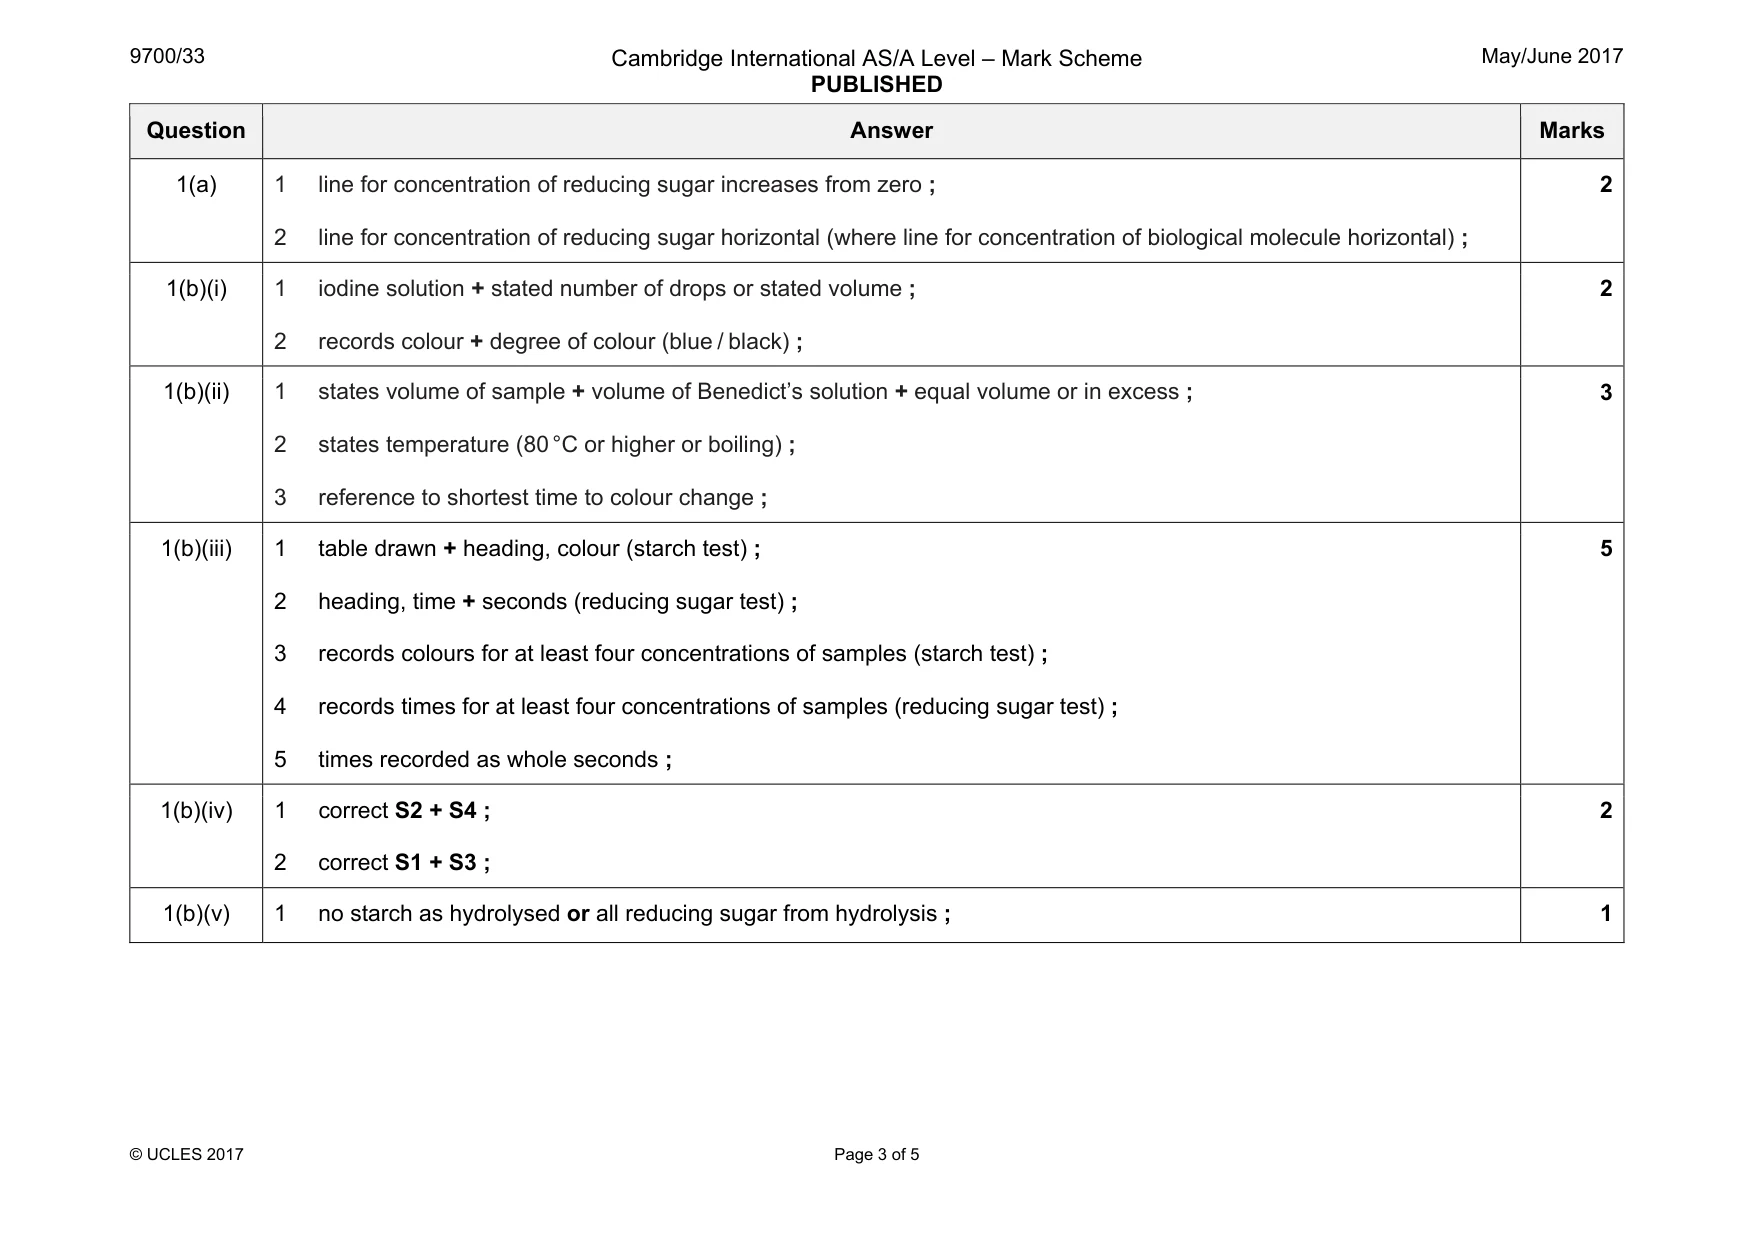
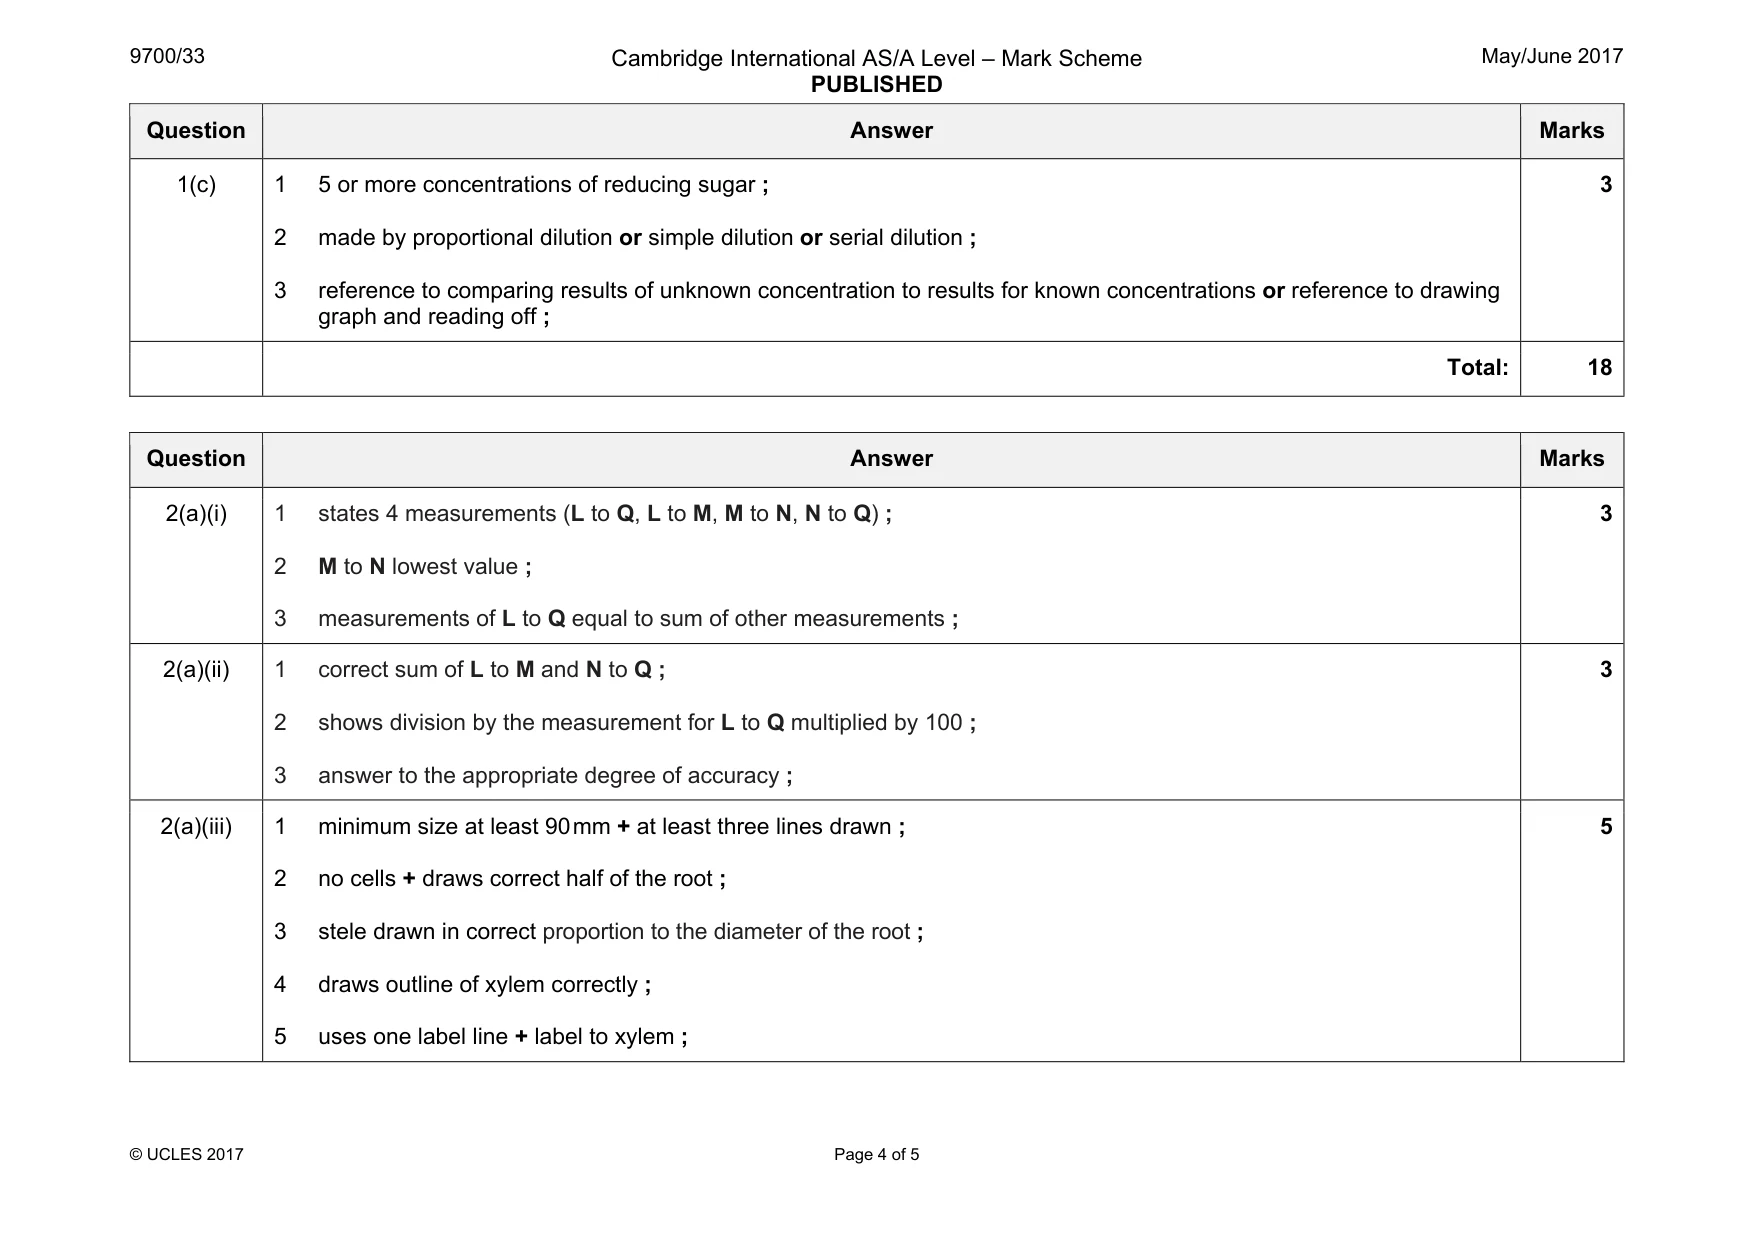
Mark scheme: 1(a) 1 line for concentration of reducing sugar increases from zero ; 2 line for concentration of reducing sugar horizontal (where line for concentration of biological molecule horizontal) ; 2 1(b)(i) 1 iodine solution + stated number of drops or stated volume ; 2 records colour + degree of colour (blue / black) ; 2 1(b)(ii) 1 states volume of sample + volume of Benedict’s solution + equal volume or in excess ; 2 states temperature (80 °C or higher or boiling) ; 3 reference to shortest time to colour change ; 3 1(b)(iii) 1 table drawn + heading, colour (starch test) ; 2 heading, time + seconds (reducing sugar test) ; 3 records colours for at least four concentrations of samples (starch test) ; 4 records times for at least four concentrations of samples (reducing sugar test) ; 5 times recorded as whole seconds ; 5 1(b)(iv) 1 correct S2 + S4 ; 2 correct S1 + S3 ; 2 1(b)(v) 1 no starch as hydrolysed or all reducing sugar from hydrolysis ; 1 Question Answer Marks 1(c) 1 5 or more concentrations of reducing sugar ; 2 made by proportional dilution or simple dilution or serial dilution ; 3 reference to comparing results of unknown concentration to results for known concentrations or reference to drawing graph and reading off ; 3 Total: 18
Q2 · K1 is a slide of a stained transverse section through a plant root
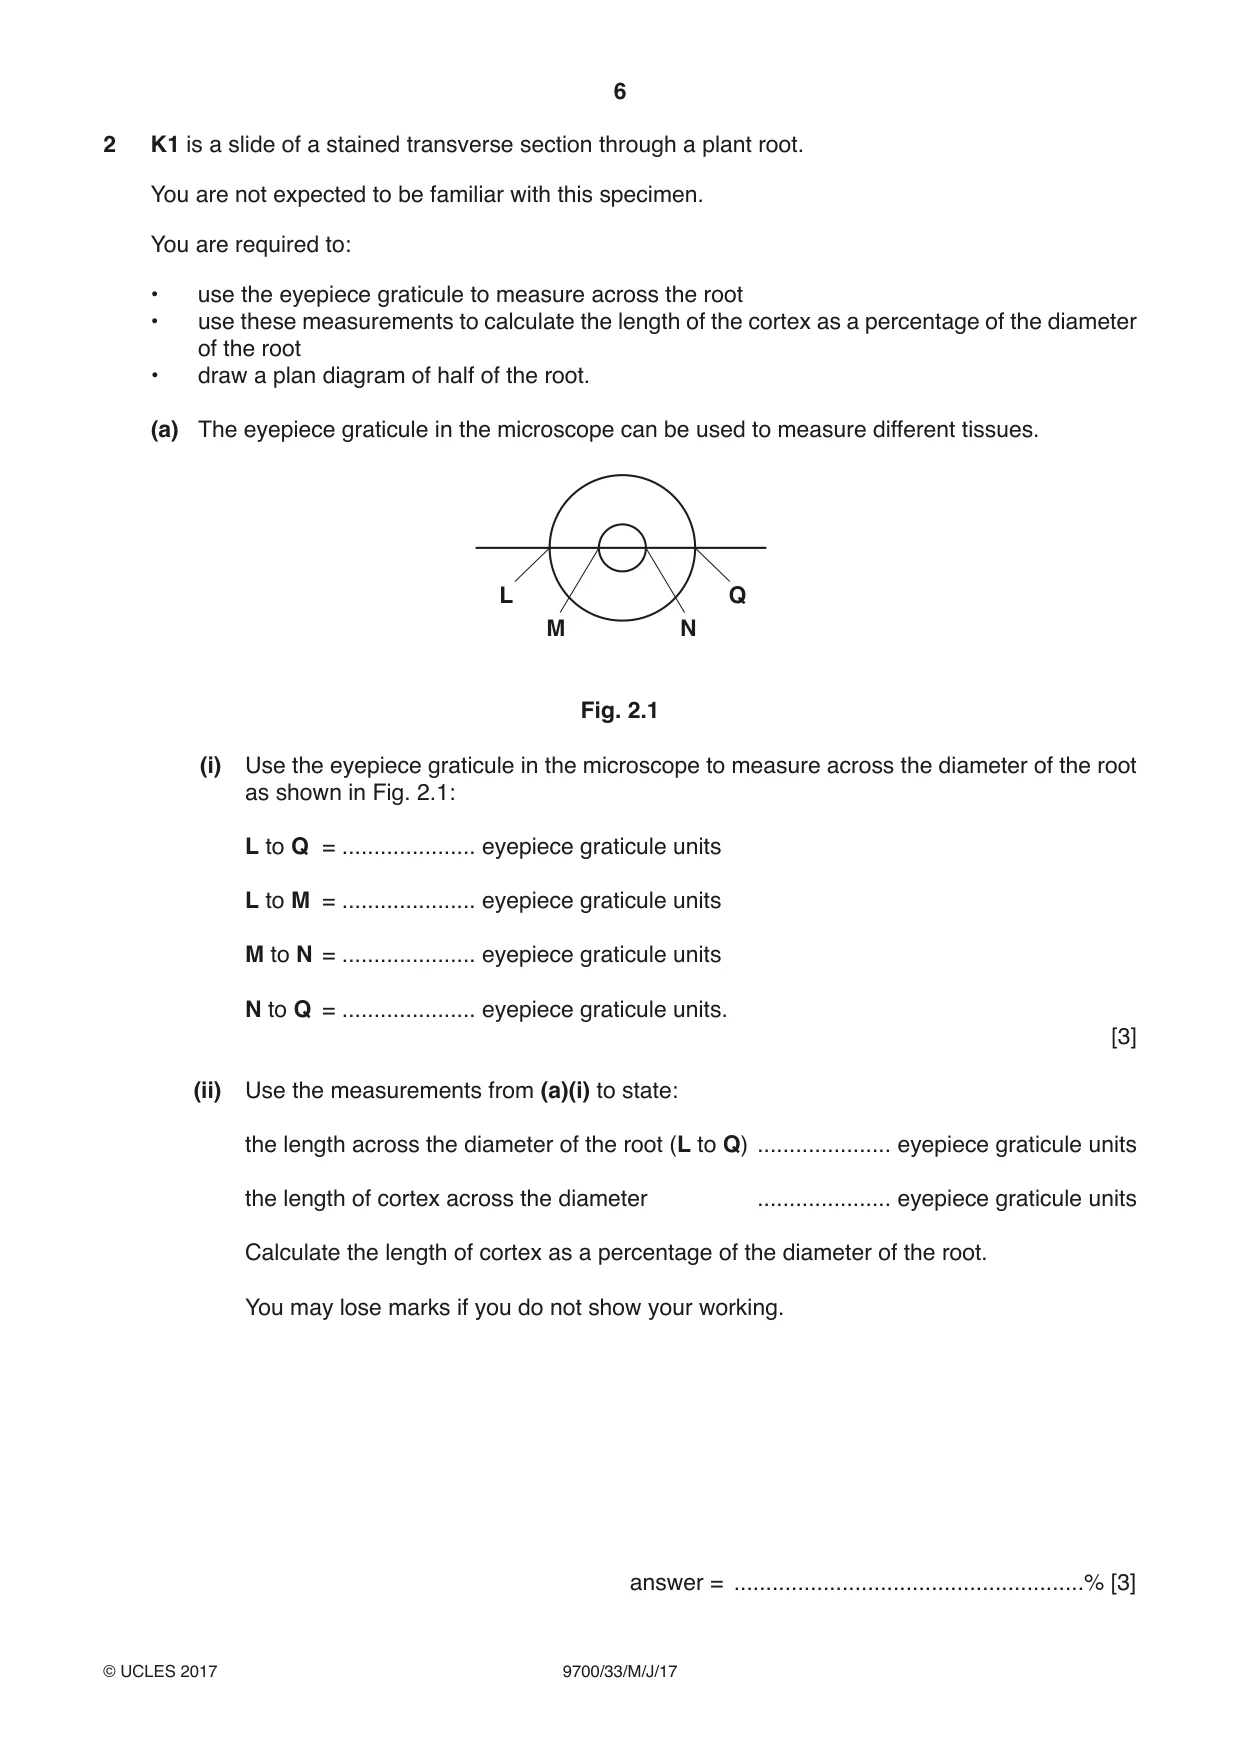
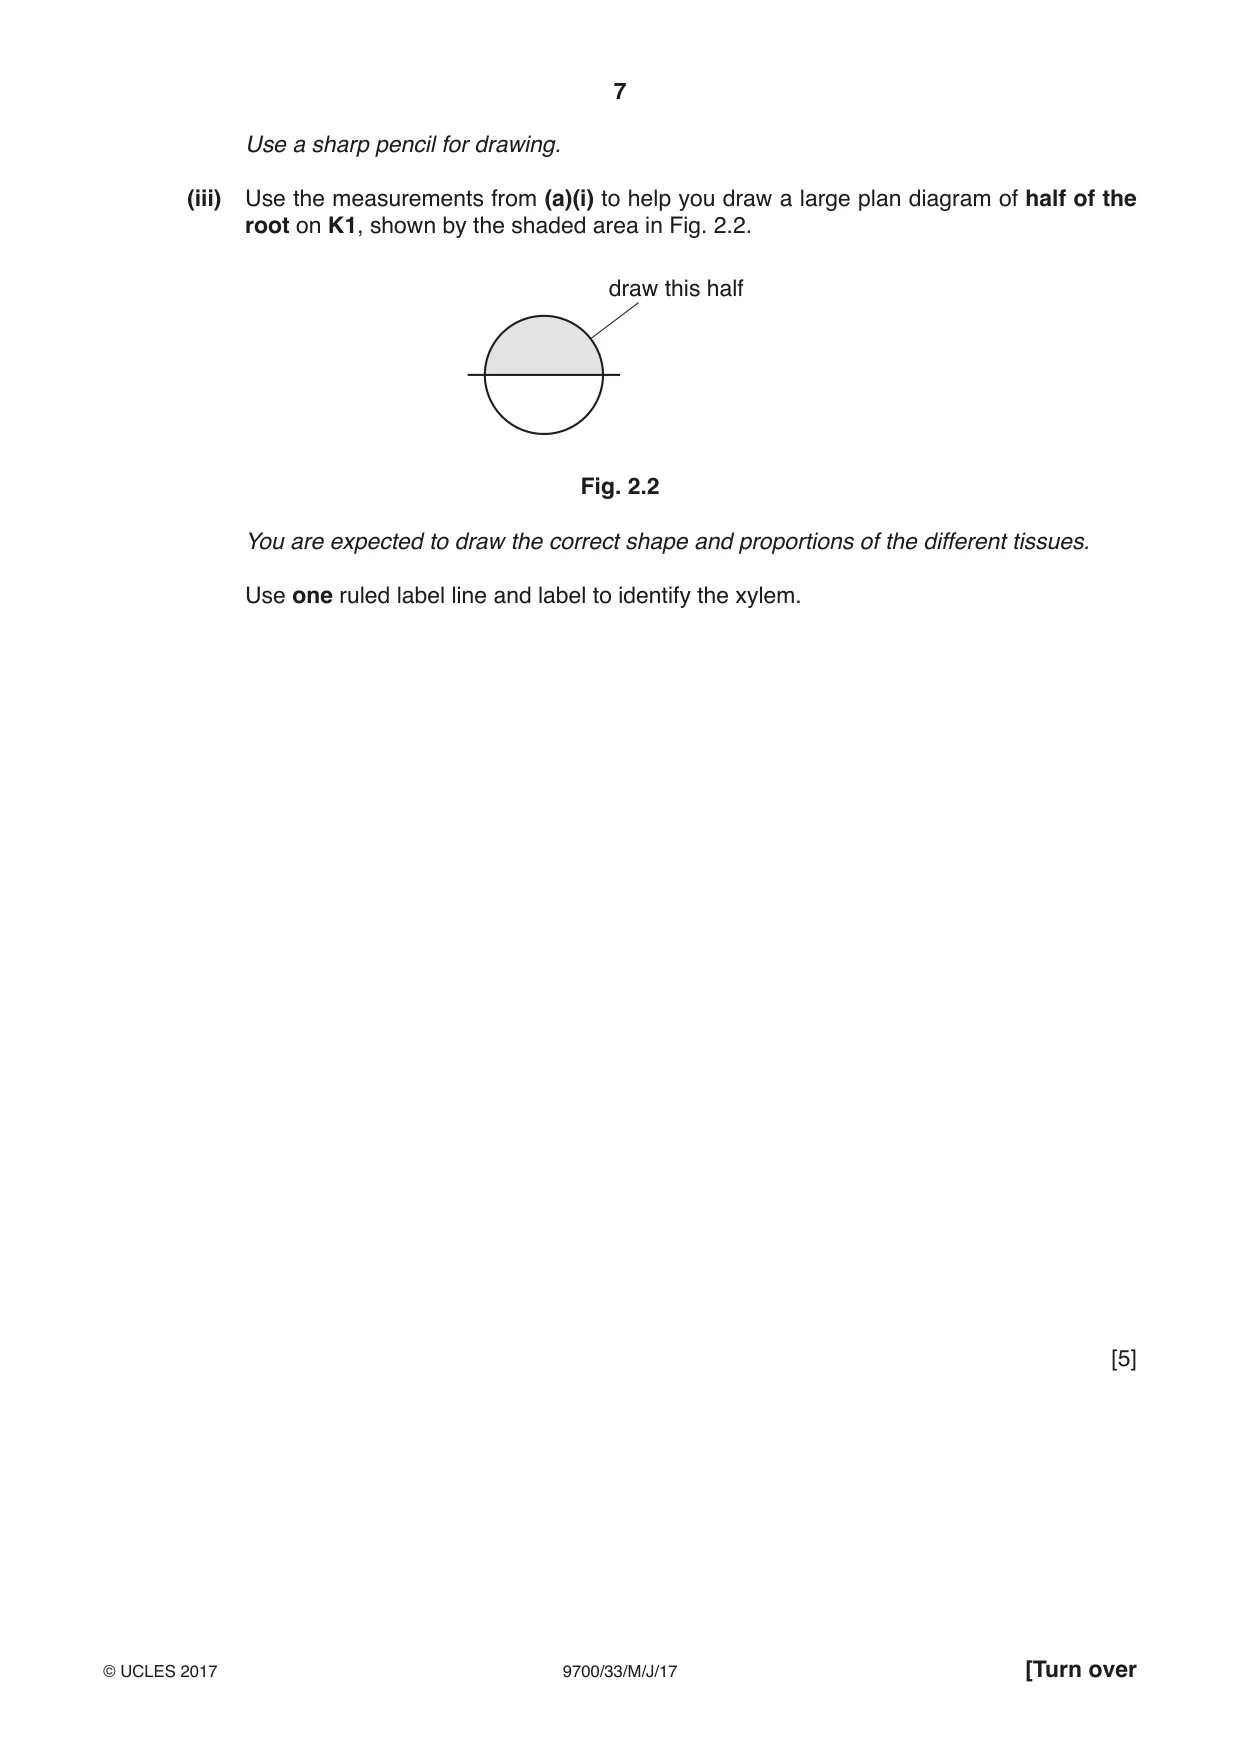
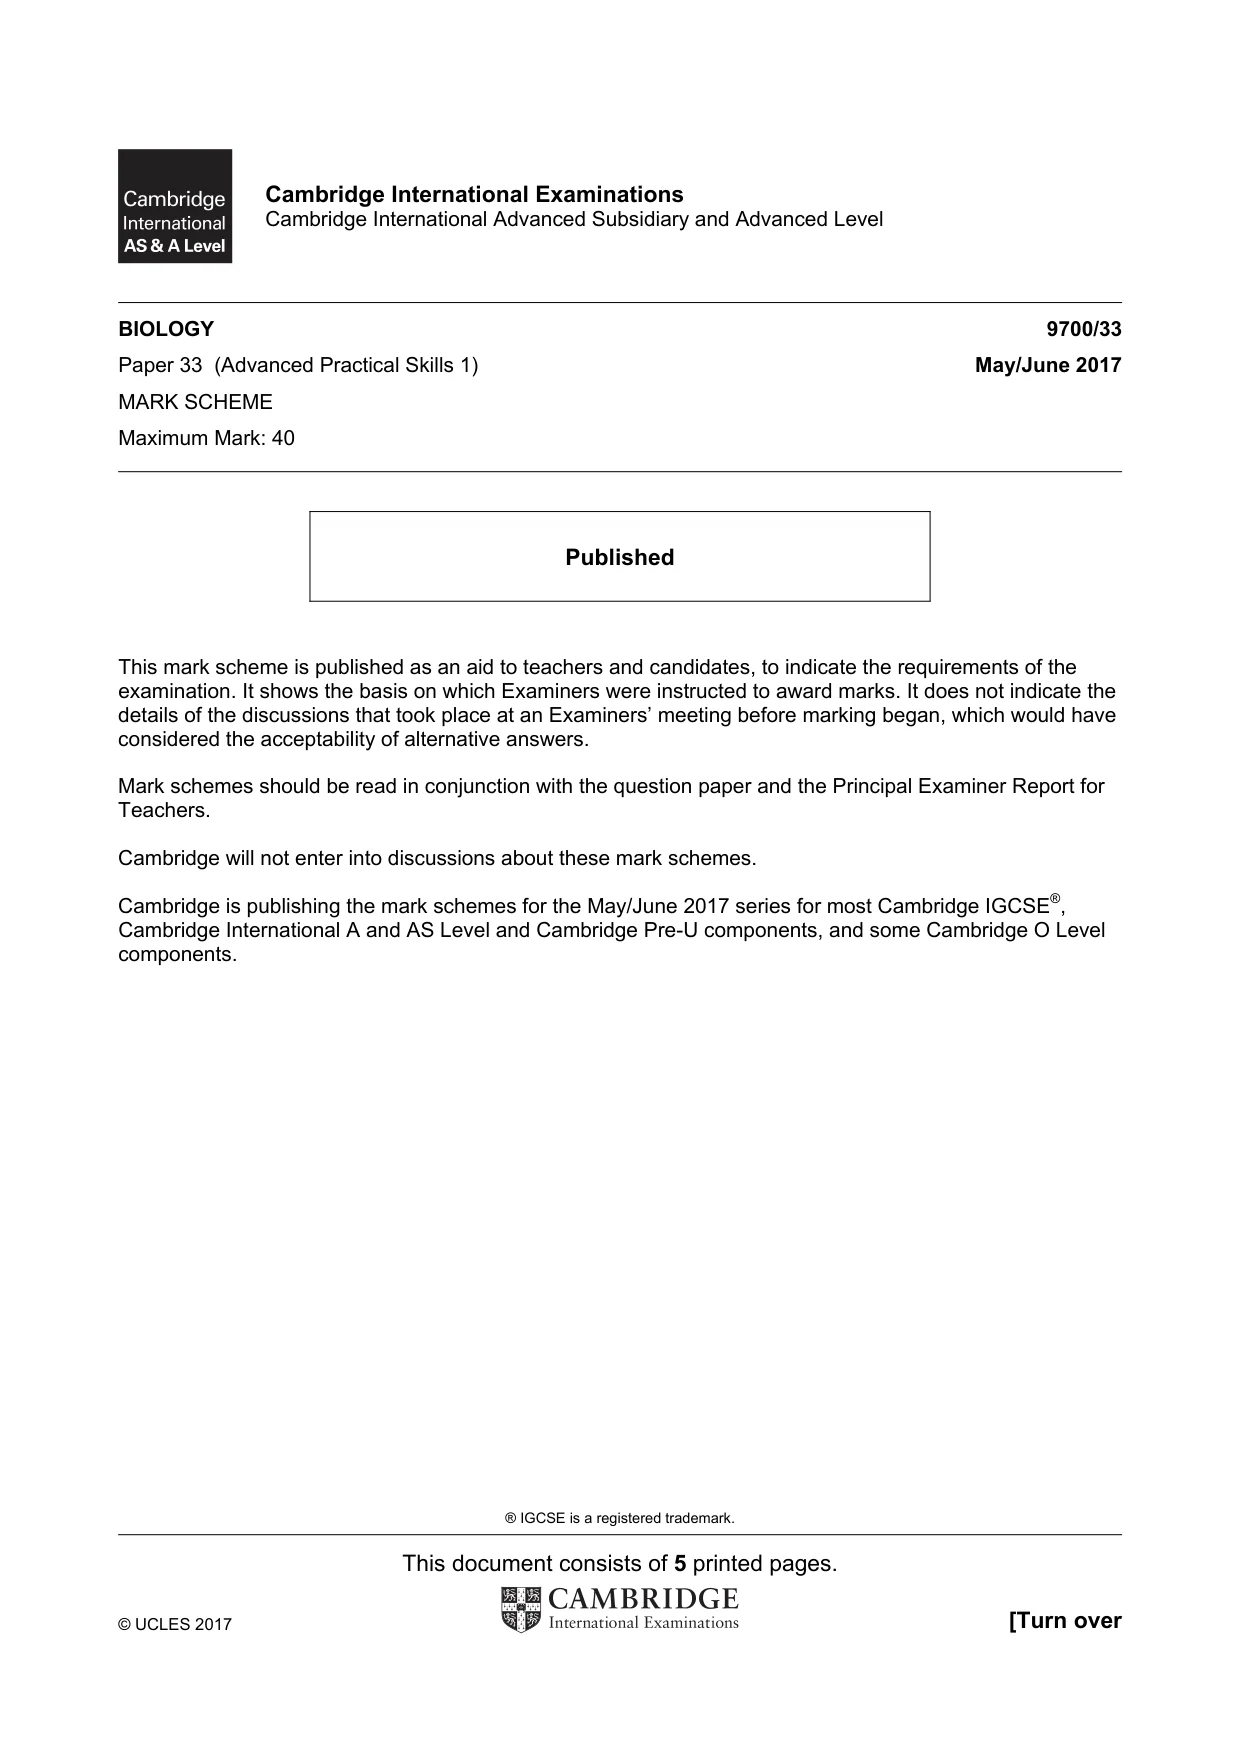
2 K1 is a slide of a stained transverse section through a plant root. You are not expected to be familiar with this specimen. You are required to: • use the eyepiece graticule to measure across the root • use these measurements to calculate the length of the cortex as a percentage of the diameter of the root • draw a plan diagram of half of the root. (a) The eyepiece graticule in the microscope can be used to measure different tissues. L Q M N Fig. 2.1 (i) Use the eyepiece graticule in the microscope to measure across the diameter of the root as shown in Fig. 2.1: L to Q = ..................... eyepiece graticule units L to M = ..................... eyepiece graticule units M to N = ..................... eyepiece graticule units N to Q = ..................... eyepiece graticule units. [3] (ii) Use the measurements from (a)(i) to state: the length across the diameter of the root (L to Q) ..................... eyepiece graticule units the length of cortex across the diameter ..................... eyepiece graticule units Calculate the length of cortex as a percentage of the diameter of the root. You may lose marks if you do not show your working. answer = .......................................................% [3] Use a sharp pencil for drawing. (iii) Use the measurements from (a)(i) to help you draw a large plan diagram of half of the root on K1, shown by the shaded area in Fig. 2.2. draw this half Fig. 2.2 You are expected to draw the correct shape and proportions of the different tissues. Use one ruled label line and label to identify the xylem. [5] (iv) Observe the central tissue in the root on K1. These cells are not identical. Select one group of four adjacent (touching) cells which show some of the differences between these cells. Each cell must touch at least two of the other cells. Make a large drawing of this group of four cells. Use one ruled label line and label to identify the cell wall of one cell. [5] (b) The xylem vessel elements transport water and minerals from the roots to the leaves. This transport depends on the negative pressure in the xylem being greater than the force of gravity. Scientists measured the xylem pressure at different heights in a tree. This was repeated for a number of trees of the same species.
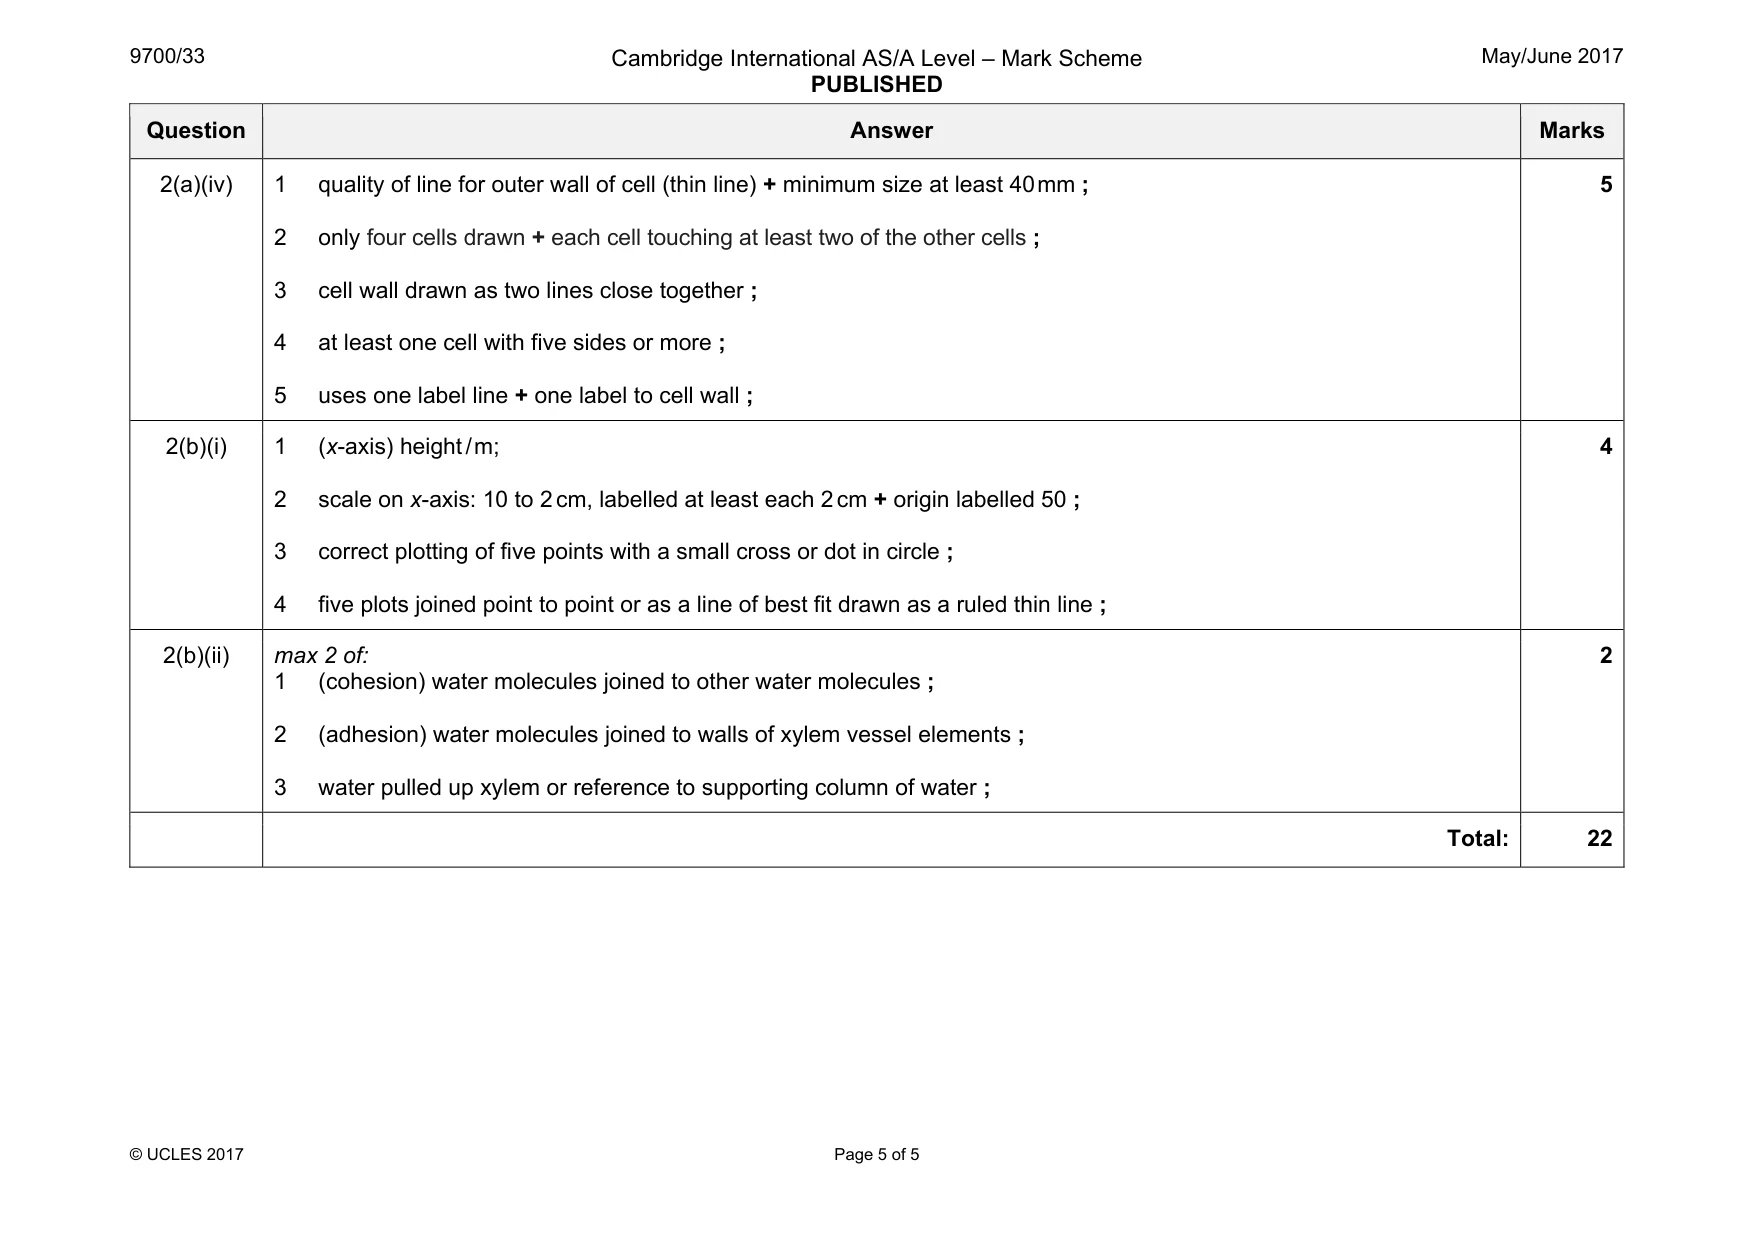
Mark scheme: 2(a)(i) 1 states 4 measurements (L to Q, L to M, M to N, N to Q) ; 2 M to N lowest value ; 3 measurements of L to Q equal to sum of other measurements ; 3 2(a)(ii) 1 correct sum of L to M and N to Q ; 2 shows division by the measurement for L to Q multiplied by 100 ; 3 answer to the appropriate degree of accuracy ; 3 2(a)(iii) 1 minimum size at least 90 mm + at least three lines drawn ; 2 no cells + draws correct half of the root ; 3 stele drawn in correct proportion to the diameter of the root ; 4 draws outline of xylem correctly ; 5 uses one label line + label to xylem ; 5 Question Answer Marks 2(a)(iv) 1 quality of line for outer wall of cell (thin line) + minimum size at least 40 mm ; 2 only four cells drawn + each cell touching at least two of the other cells ; 3 cell wall drawn as two lines close together ; 4 at least one cell with five sides or more ; 5 uses one label line + one label to cell wall ; 5 2(b)(i) 1 (x-axis) height / m; 2 scale on x-axis: 10 to 2 cm, labelled at least each 2 cm + origin labelled 50 ; 3 correct plotting of five points with a small cross or dot in circle ; 4 five plots joined point to point or as a line of best fit drawn as a ruled thin line ; 4 2(b)(ii) max 2 of: 1 (cohesion) water molecules joined to other water molecules ; 2 (adhesion) water molecules joined to walls of xylem vessel elements ; 3 water pulled up xylem or reference to supporting column of water ; 2 Total: 22
What was in this paper
The subtopics covered by these 2 questions, and how many questions each got. Open one in a new tab to see every Cambridge question on it.
What you needed in this session
Cambridge’s own grade thresholds for 2017 May/June, Paper 3 · Variant 3. A higher threshold means an easier paper — the bar moves with how the cohort did.