Cambridge A Level Biology 9700 — 2017 May/June Paper 3 · Variant 5
9700/35/M/J/17 · 2 questions · 40 marks · ≈45 min
The question paper and its mark scheme, free to read here and free to download. This is Cambridge’s own paper, exactly as it was sat.
Question paper16 pages


Mark scheme5 pages
Answers below. Sit the paper first if you are practising.
Questions as text
Q1 · The enzyme amylase, E, hydrolyses (breaks down) starch, to a reducing sugar
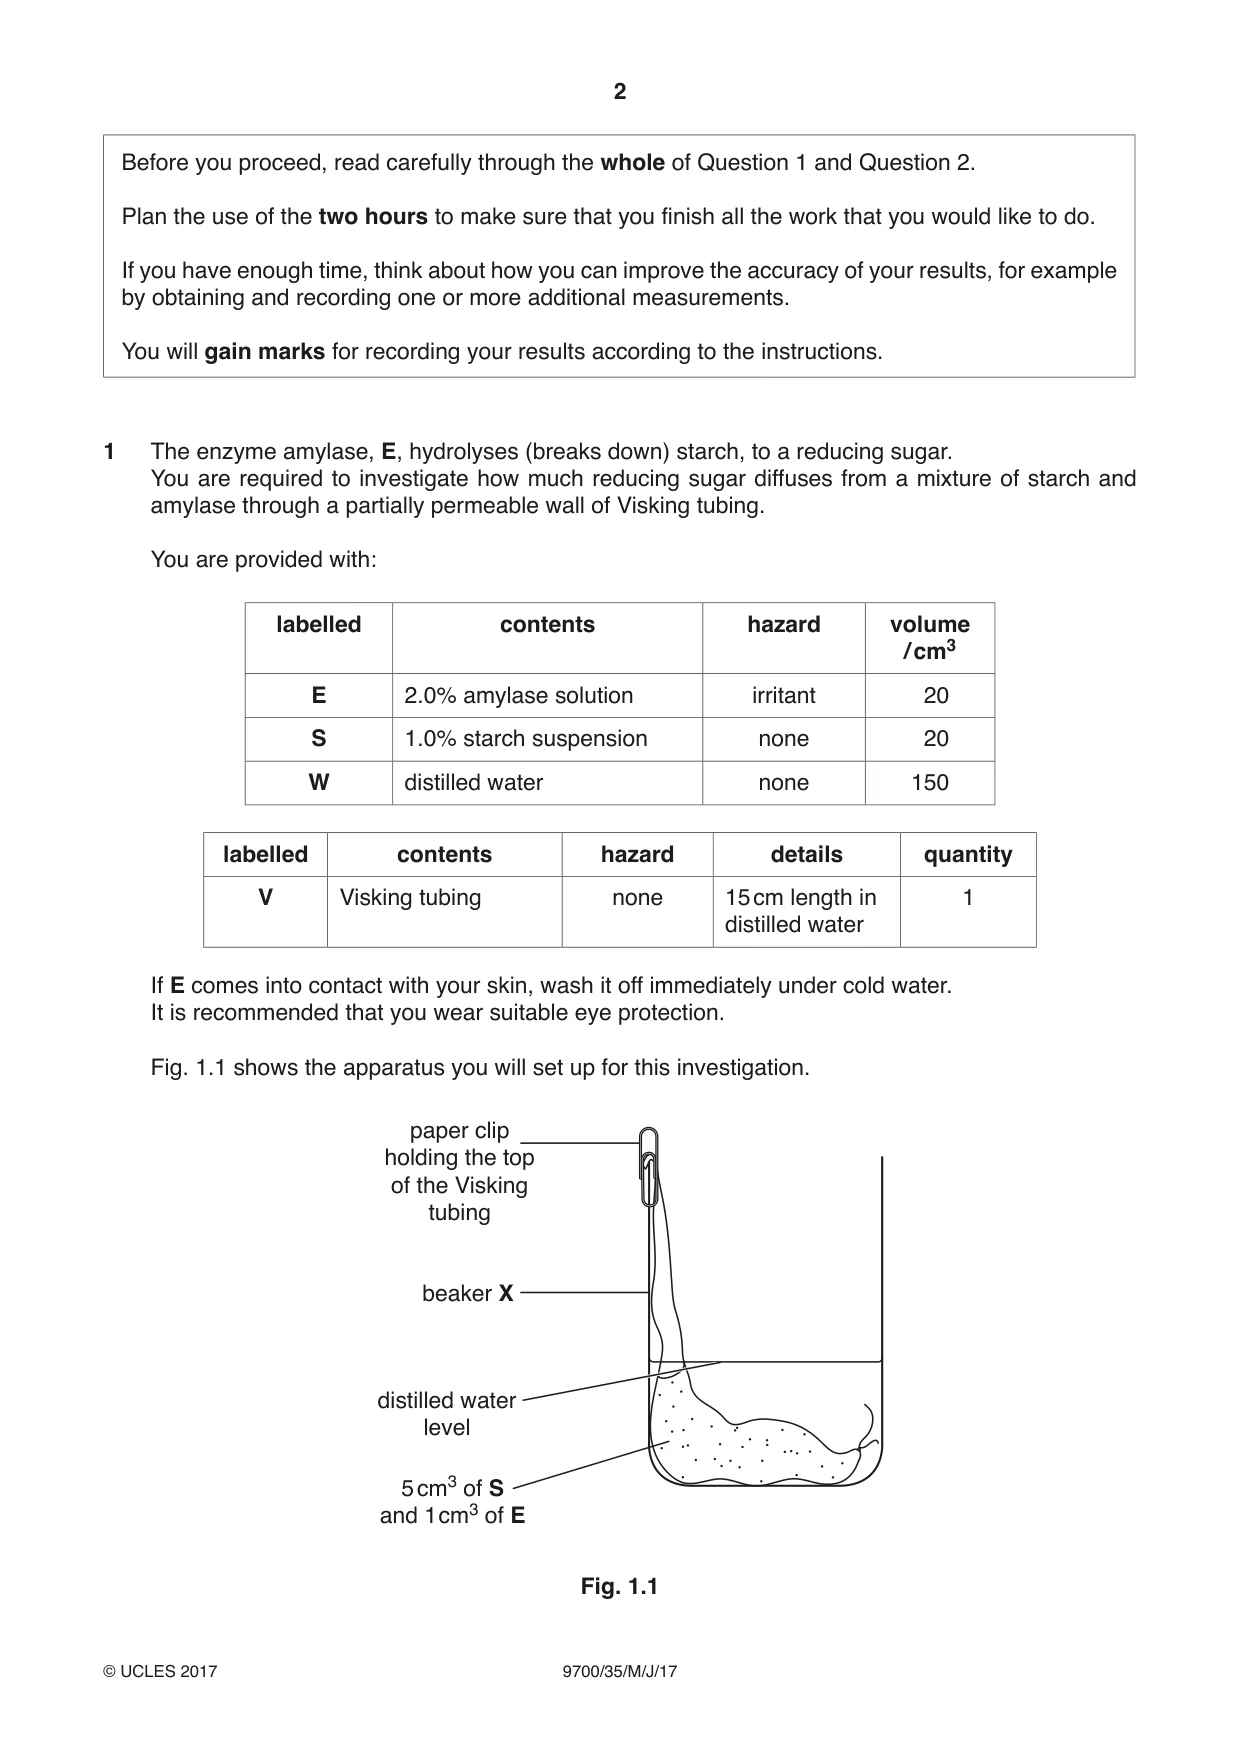
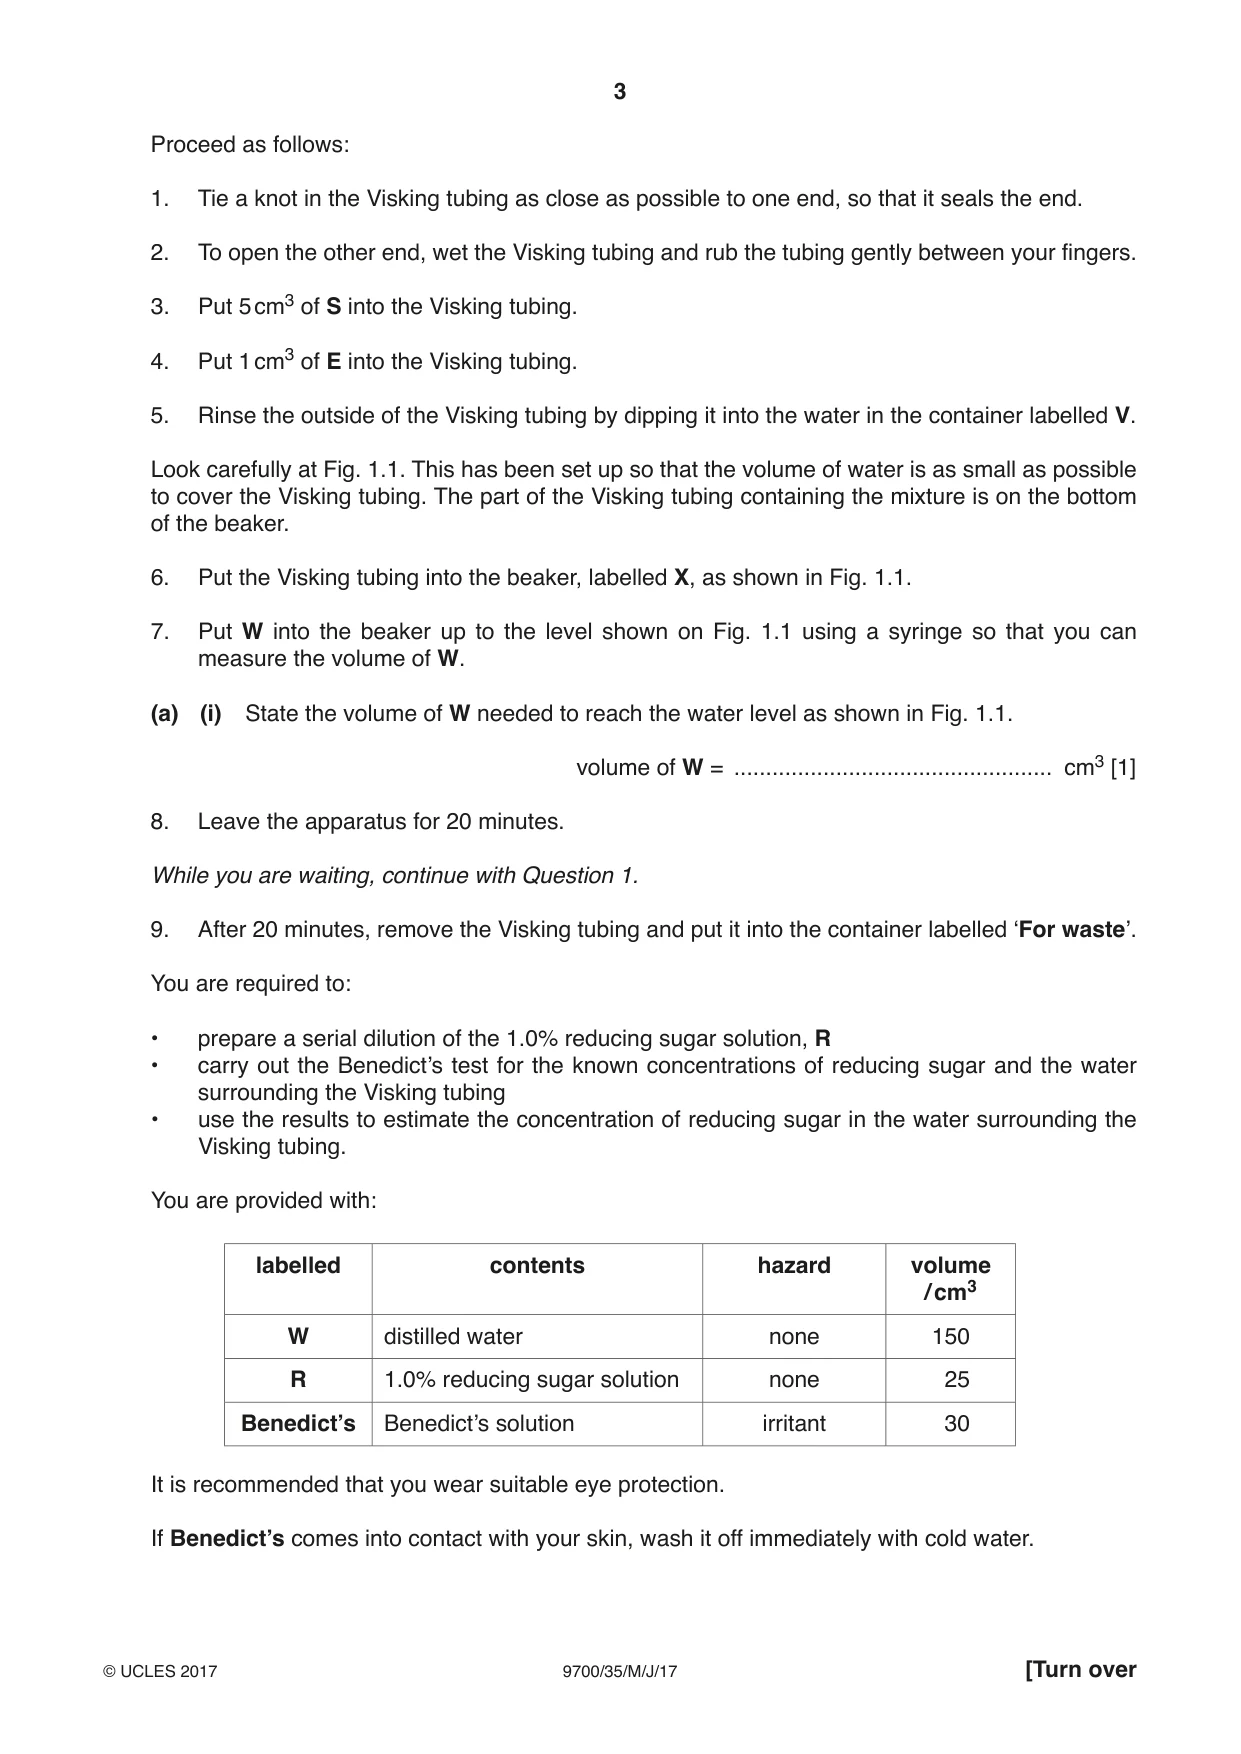
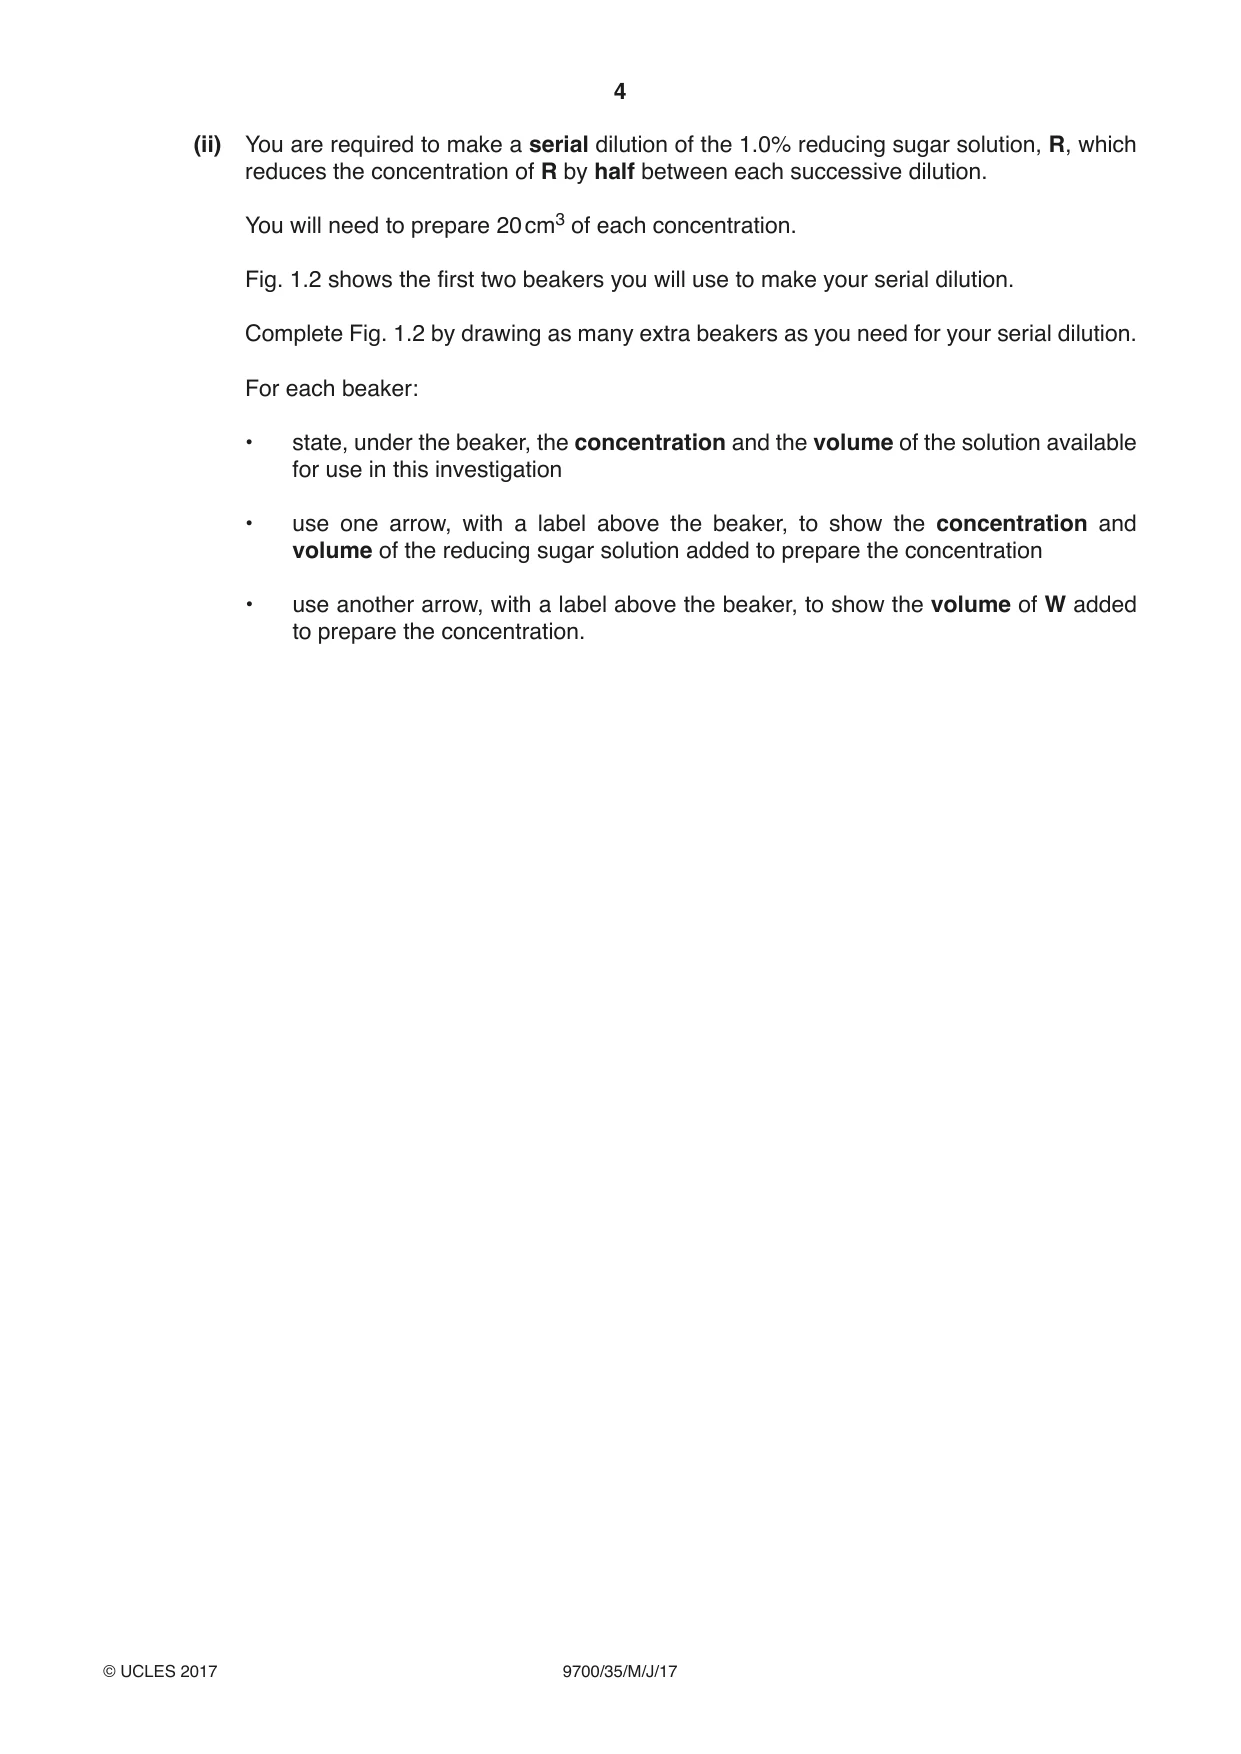
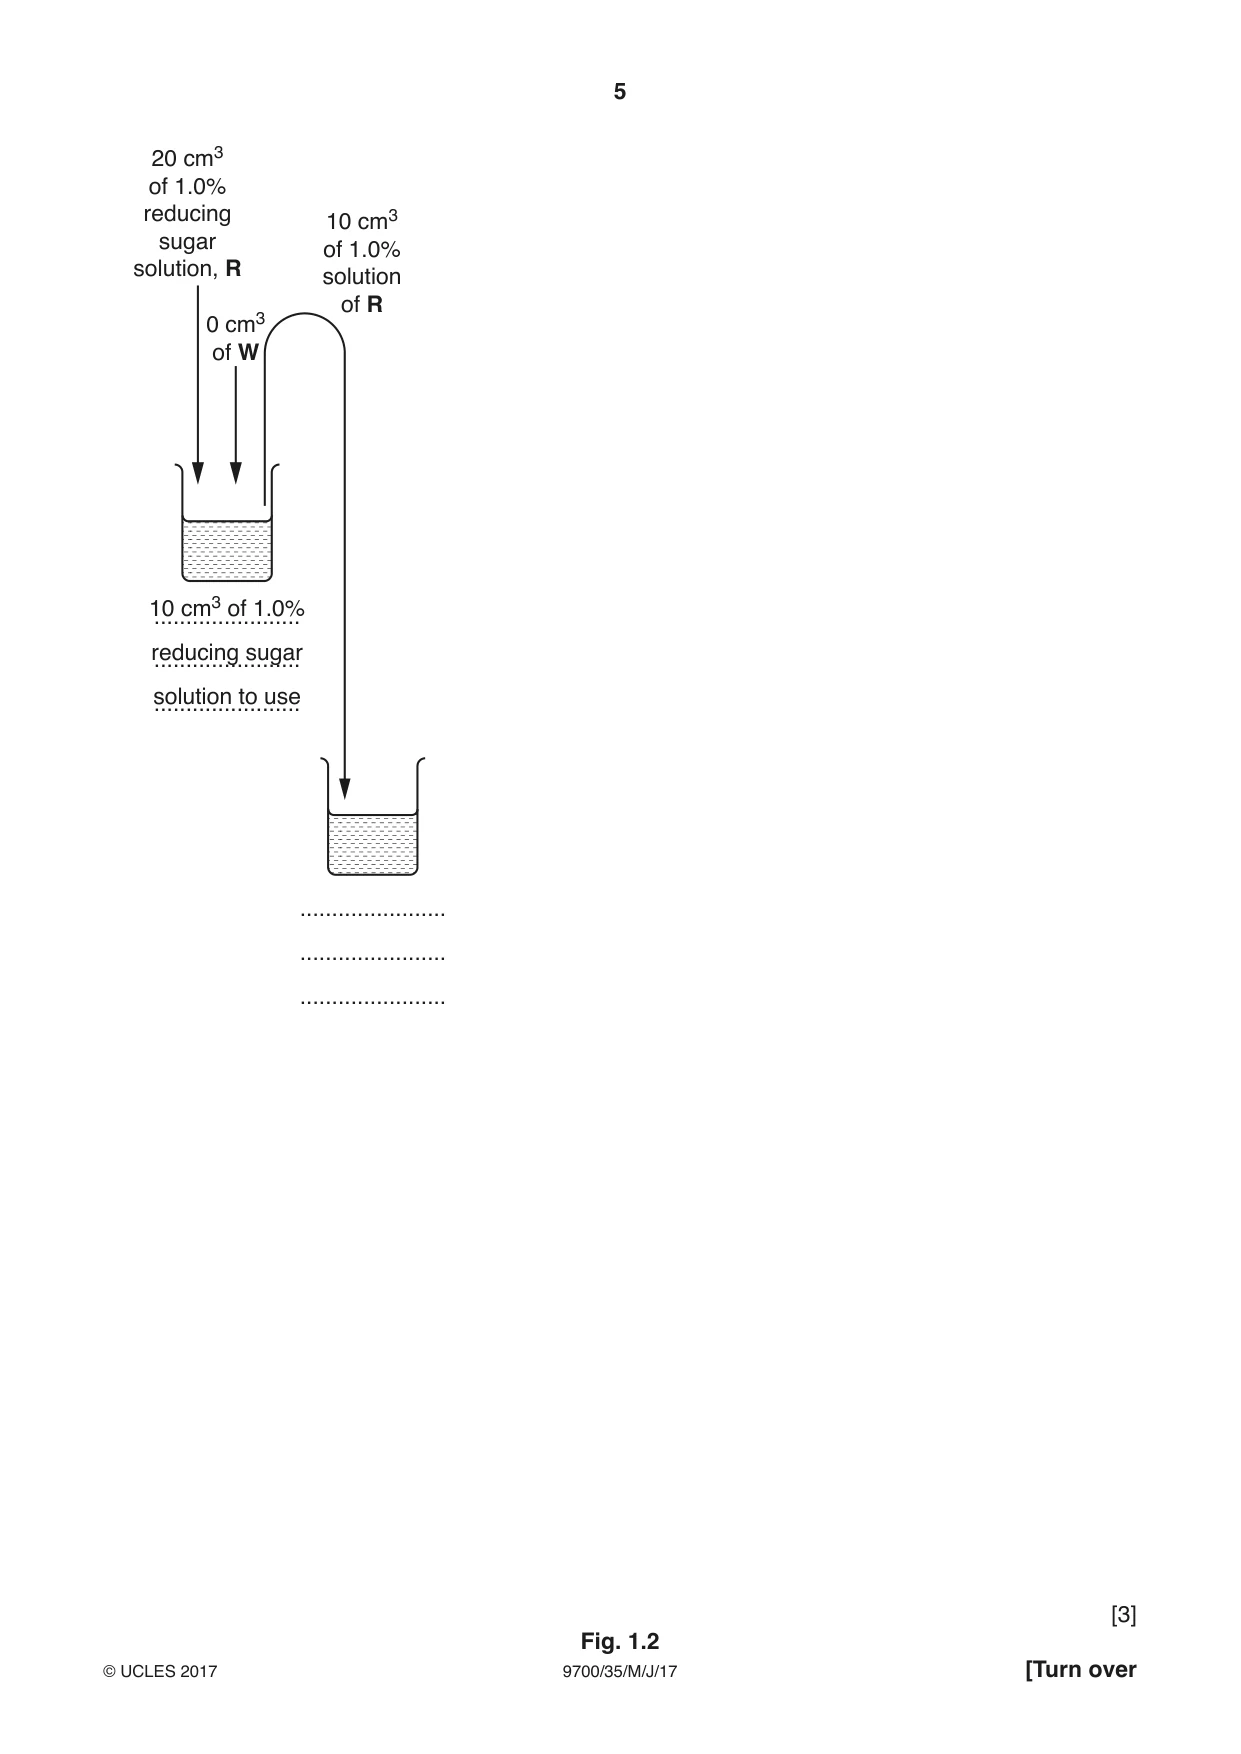
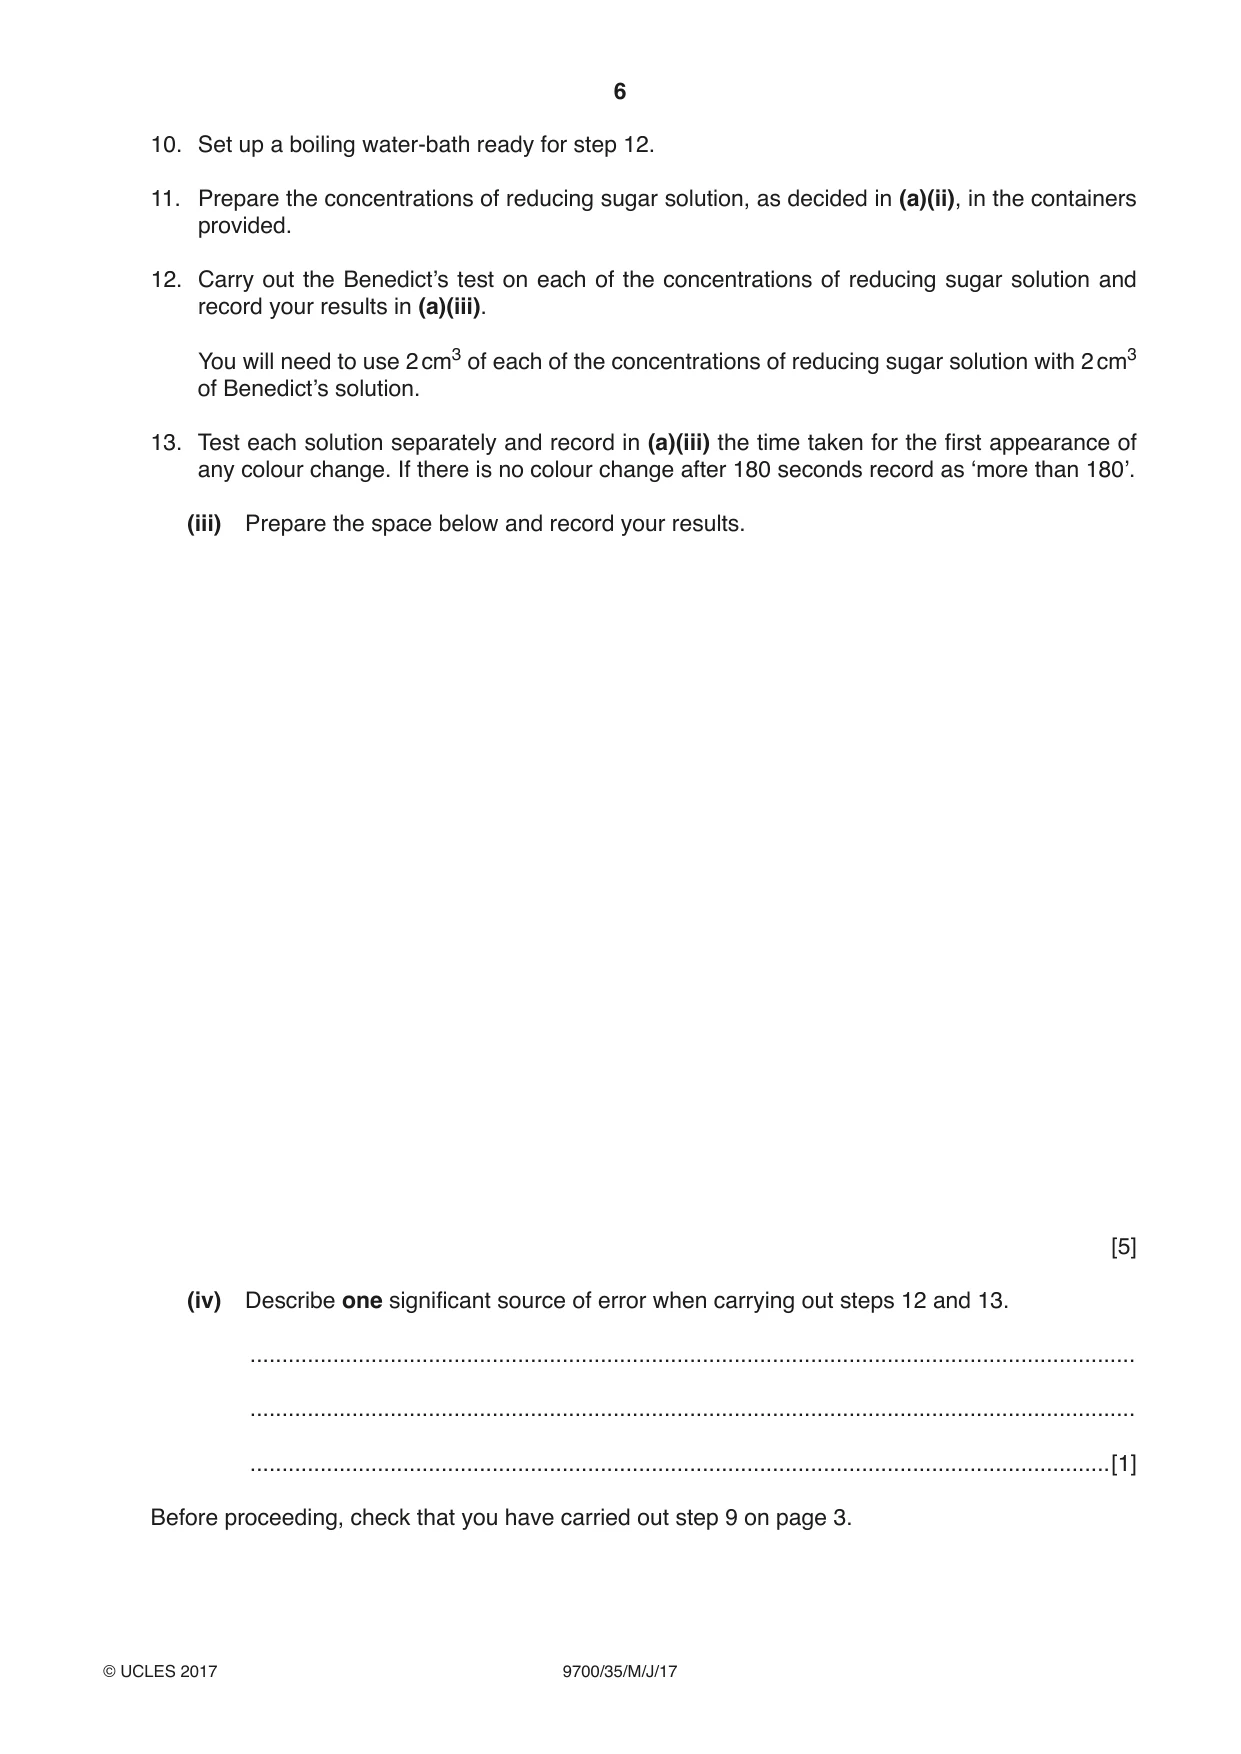
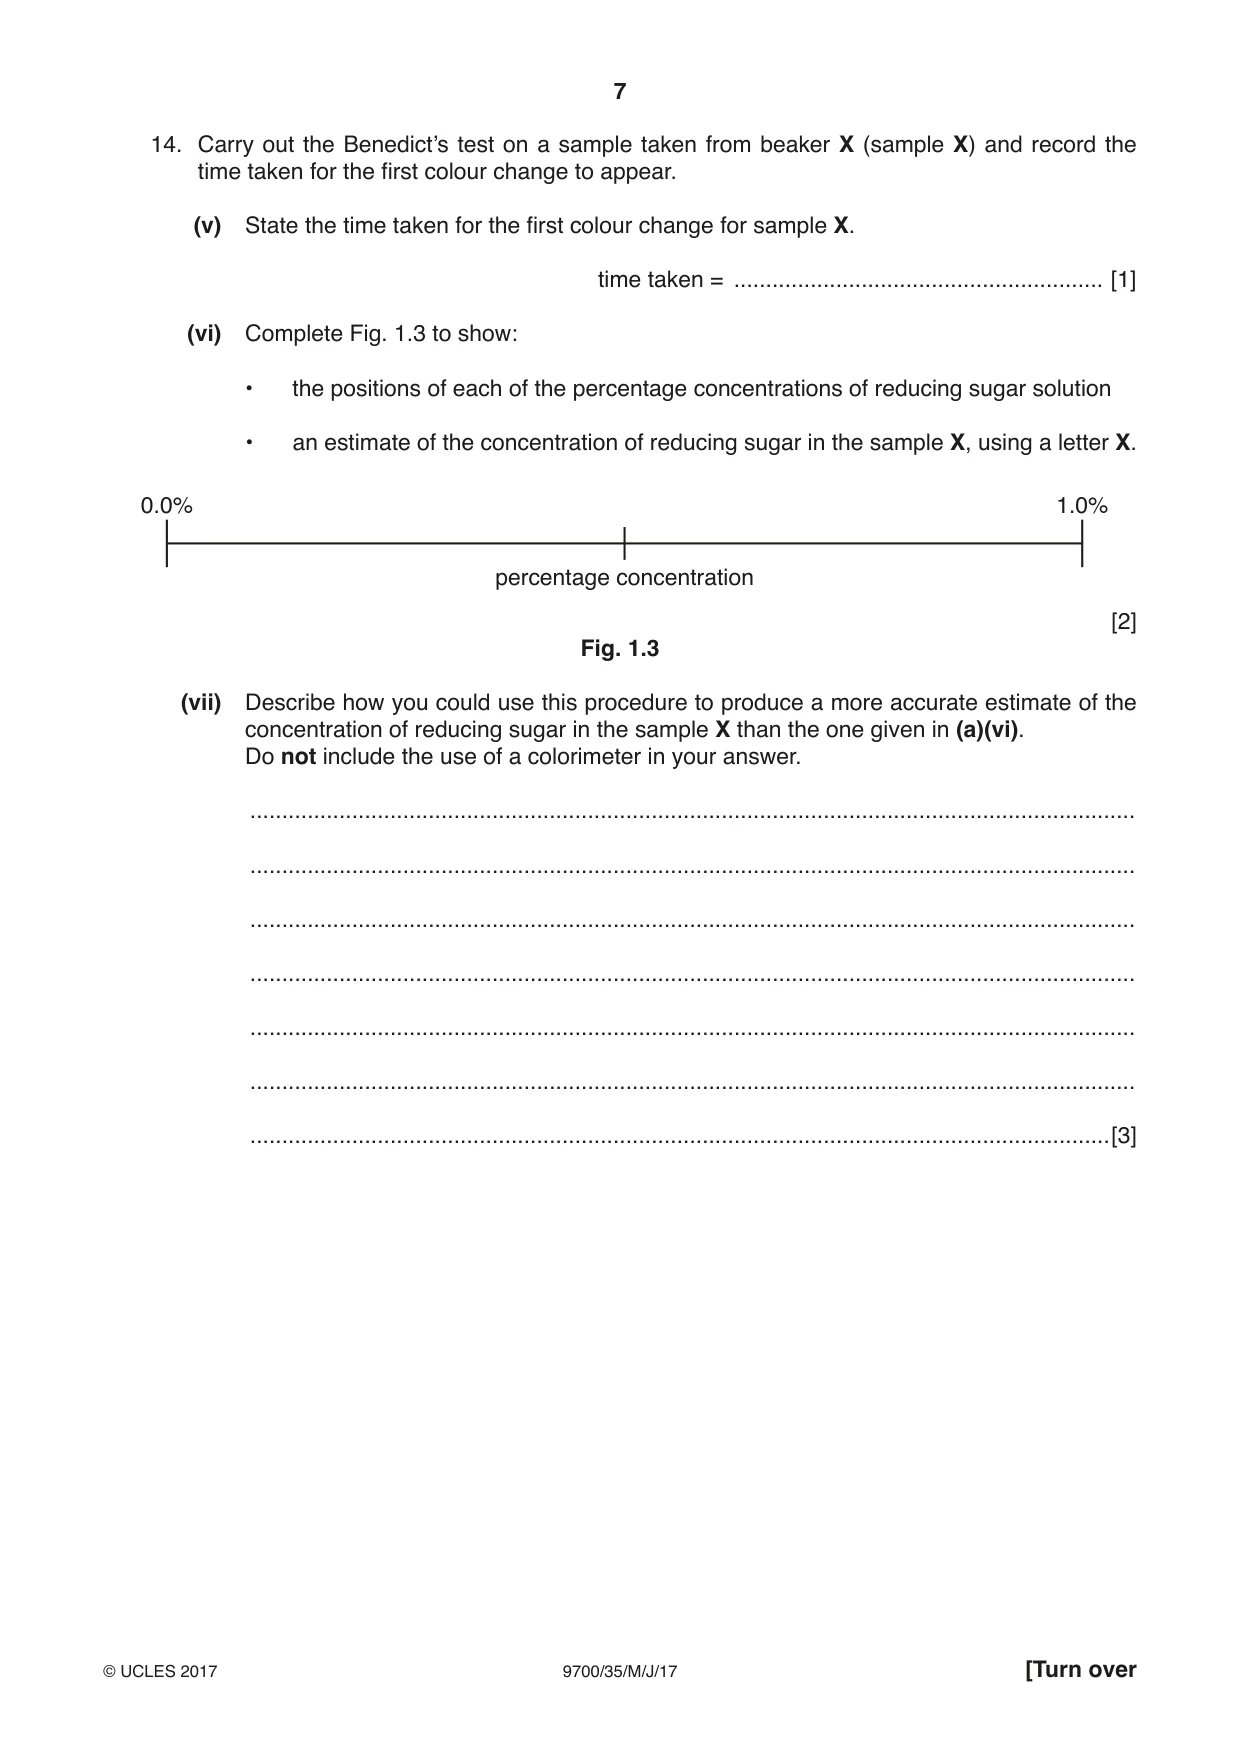
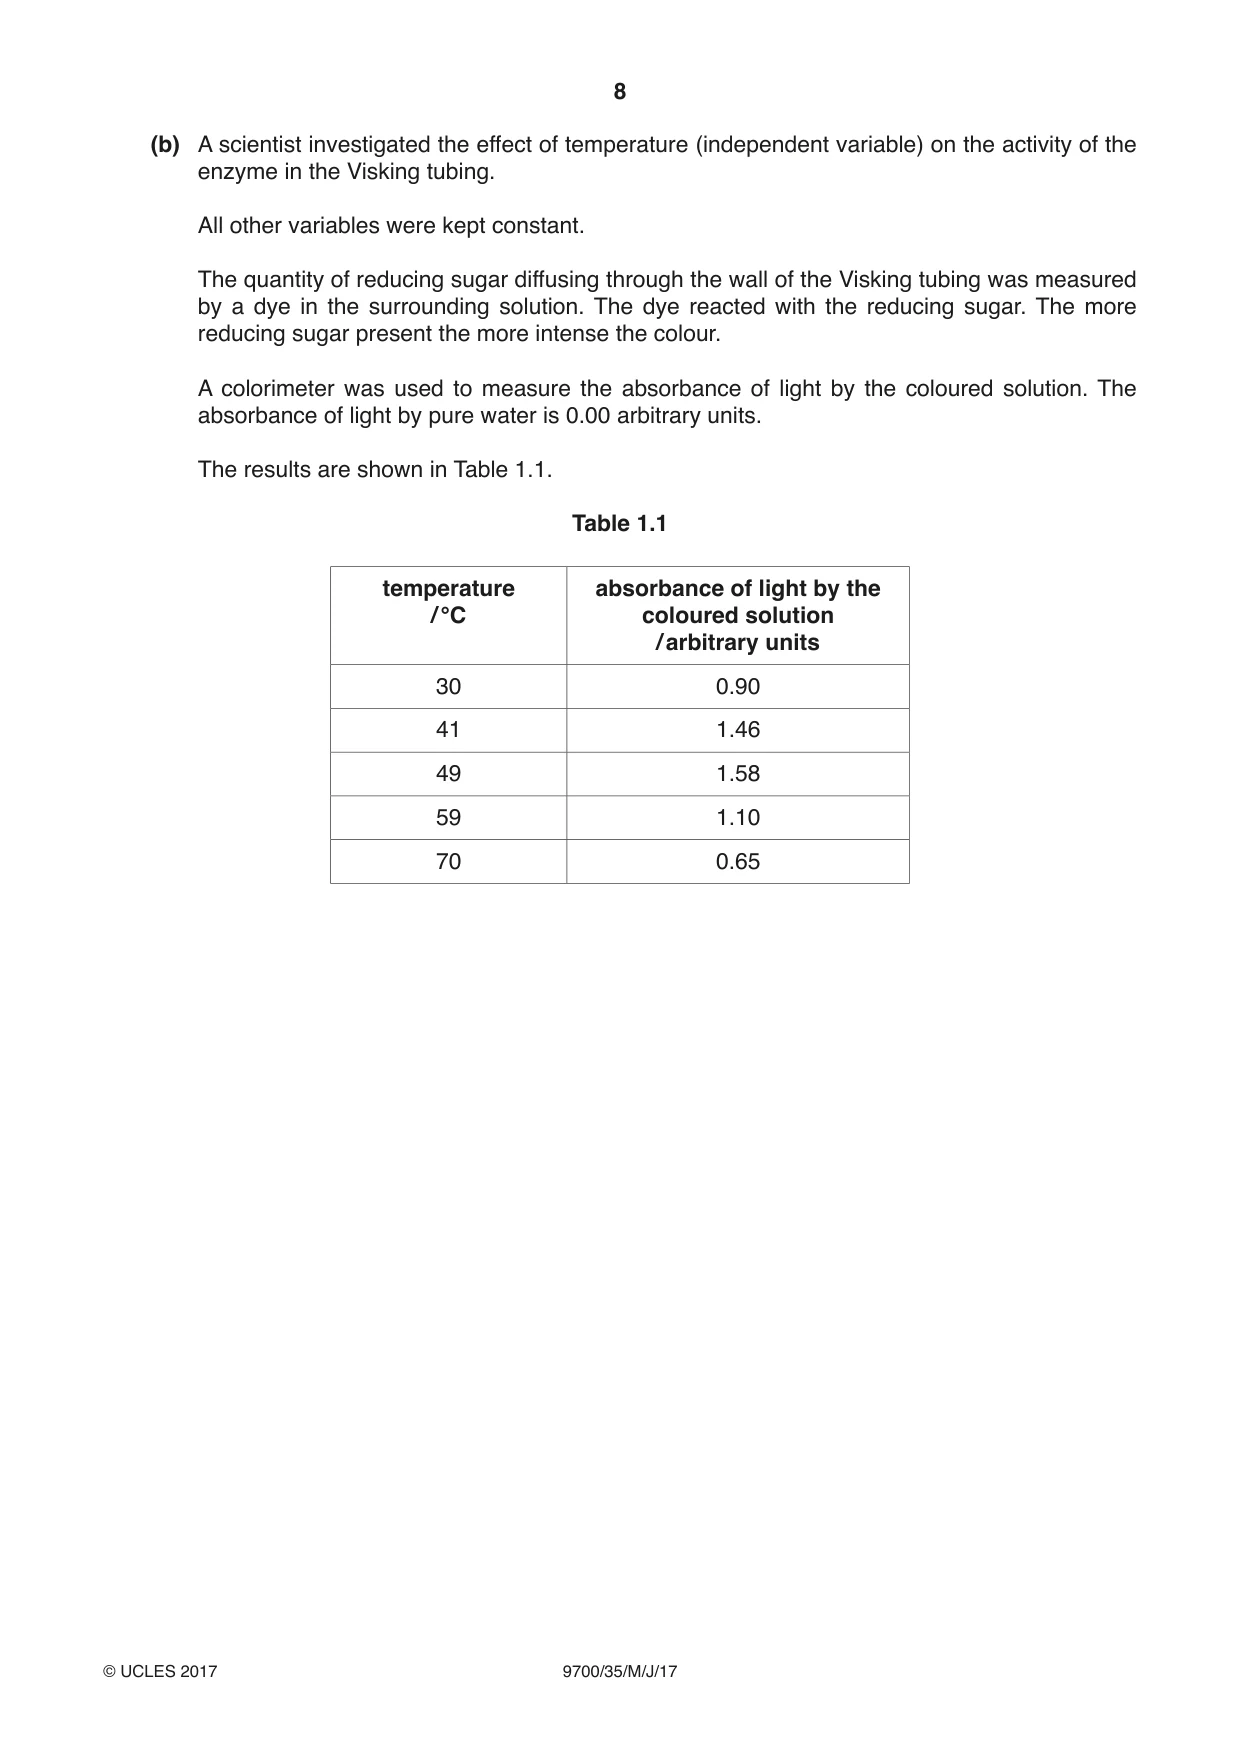
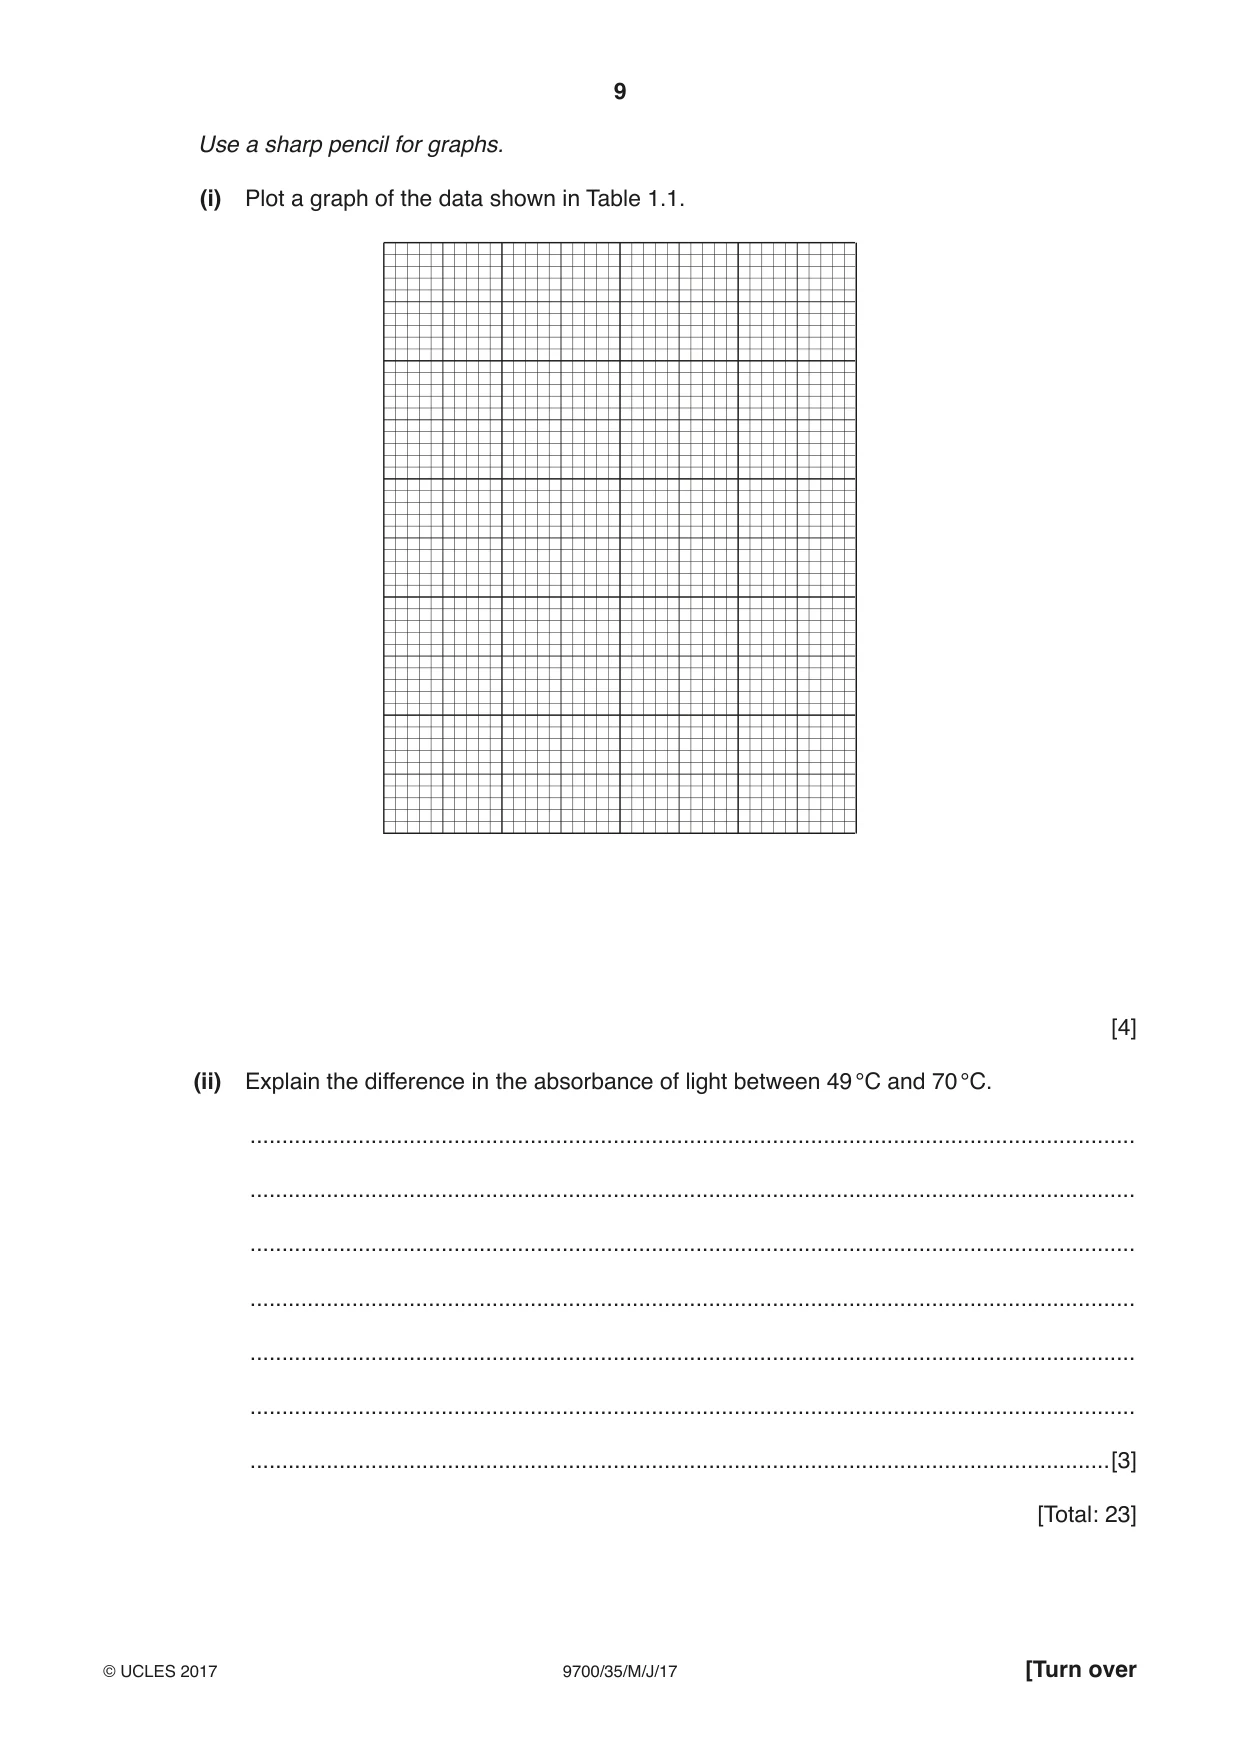
1 The enzyme amylase, E, hydrolyses (breaks down) starch, to a reducing sugar. You are required to investigate how much reducing sugar diffuses from a mixture of starch and amylase through a partially permeable wall of Visking tubing. You are provided with: labelled contents hazard volume / cm3 E 2.0% amylase solution irritant 20 S 1.0% starch suspension none 20 W distilled water none 150 labelled contents hazard details quantity V Visking tubing none 15 cm length in 1 distilled water If E comes into contact with your skin, wash it off immediately under cold water. It is recommended that you wear suitable eye protection. Fig. 1.1 shows the apparatus you will set up for this investigation. paper clip holding the top of the Visking tubing beaker X distilled water level 5 cm3 of S and 1 cm3 of E Fig. 1.1 Proceed as follows: 1. Tie a knot in the Visking tubing as close as possible to one end, so that it seals the end. 2. To open the other end, wet the Visking tubing and rub the tubing gently between your fingers. 3. Put 5 cm3 of S into the Visking tubing. 4. Put 1 cm3 of E into the Visking tubing. 5. Rinse the outside of the Visking tubing by dipping it into the water in the container labelled V. Look carefully at Fig. 1.1. This has been set up so that the volume of water is as small as possible to cover the Visking tubing. The part of the Visking tubing containing the mixture is on the bottom of the beaker. 6. Put the Visking tubing into the beaker, labelled X, as shown in Fig. 1.1. 7. Put W into the beaker up to the level shown on Fig. 1.1 using a syringe so that you can measure the volume of W. (a) (i) State the volume of W needed to reach the water level as shown in Fig. 1.1. volume of W = .................................................. cm3 [1] 8. Leave the apparatus for 20 minutes. While you are waiting, continue with Question 1. 9. After 20 minutes, remove the Visking tubing and put it into the container labelled ‘For waste’. You are required to: • prepare a serial dilution of the 1.0% reducing sugar solution, R • carry out the Benedict’s test for the known concentrations of reducing sugar and the water surrounding the Visking tubing • use the results to estimate the concentration of reducing sugar in the water surrounding the Visking tubing. You are provided with: labelled contents hazard volume / cm3 W distilled water none 150 R 1.0% reducing sugar solution none 25 Benedict’s Benedict’s solution irritant 30 It is recommended that you wear suitable eye protection. If Benedict’s comes into contact with your skin, wash it off immediately with cold water. (ii) You are required to make a serial dilution of the 1.0% reducing sugar solution, R, which reduces the concentration of R by half between each successive dilution. You will need to prepare 20 cm3 of each concentration. Fig. 1.2 shows the first two beakers you will use to make your serial dilution. Complete Fig. 1.2 by drawing as many extra beakers as you need for your serial dilution. For each beaker: • state, under the beaker, the concentration and the volume of the solution available for use in this investigation • use one arrow, with a label above the beaker, to show the concentration and volume of the reducing sugar solution added to prepare the concentration • use another arrow, with a label above the beaker, to show the volume of W added to prepare the concentration. 20 cm3 of 1.0% reducing 10 cm3 sugar of 1.0% solution, R solution of R 0 cm3 of W 10 cm3 of 1.0% ....................... reducing sugar ....................... solution to use ....................... ....................... ....................... ....................... [3] 10. Set up a boiling water-bath ready for step 12. 11. Prepare the concentrations of reducing sugar solution, as decided in (a)(ii), in the containers provided. 12. Carry out the Benedict’s test on each of the concentrations of reducing sugar solution and record your results in (a)(iii). You will need to use 2 cm3 of each of the concentrations of reducing sugar solution with 2 cm3 of Benedict’s solution. 13. Test each solution separately and record in (a)(iii) the time taken for the first appearance of any colour change. If there is no colour change after 180 seconds record as ‘more than 180’. (iii) Prepare the space below and record your results. [5] (iv) Describe one significant source of error when carrying out steps 12 and 13. ........................................................................................................................................... ........................................................................................................................................... .......................................................................................................................................[1] Before proceeding, check that you have carried out step 9 on page 3. 14. Carry out the Benedict’s test on a sample taken from beaker X (sample X) and record the time taken for the first colour change to appear. (v) State the time taken for the first colour change for sample X. time taken = .......................................................... [1] (vi) Complete Fig. 1.3 to show: • the positions of each of the percentage concentrations of reducing sugar solution • an estimate of the concentration of reducing sugar in the sample X, using a letter X. 0.0% 1.0% percentage concentration [2] Fig. 1.3 (vii) Describe how you could use this procedure to produce a more accurate estimate of the concentration of reducing sugar in the sample X than the one given in (a)(vi). Do not include the use of a colorimeter in your answer. ........................................................................................................................................... ........................................................................................................................................... ........................................................................................................................................... ........................................................................................................................................... ........................................................................................................................................... ........................................................................................................................................... .......................................................................................................................................[3] (b) A scientist investigated the effect of temperature (independent variable) on the activity of the enzyme in the Visking tubing. All other variables were kept constant. The quantity of reducing sugar diffusing through the wall of the Visking tubing was measured by a dye in the surrounding solution. The dye reacted with the reducing sugar. The more reducing sugar present the more intense the colour. A colorimeter was used to measure the absorbance of light by the coloured solution. The absorbance of light by pure water is 0.00 arbitrary units. The results are shown in Table 1.1. Table 1.1 temperature absorbance of light by the / °C coloured solution / arbitrary units 30 0.90 41 1.46 49 1.58 59 1.10 70 0.65 Use a sharp pencil for graphs. (i) Plot a graph of the data shown in Table 1.1. [4] (ii) Explain the difference in the absorbance of light between 49 °C and 70 °C. ........................................................................................................................................... ........................................................................................................................................... ........................................................................................................................................... ........................................................................................................................................... ........................................................................................................................................... ........................................................................................................................................... .......................................................................................................................................[3] [Total: 23]
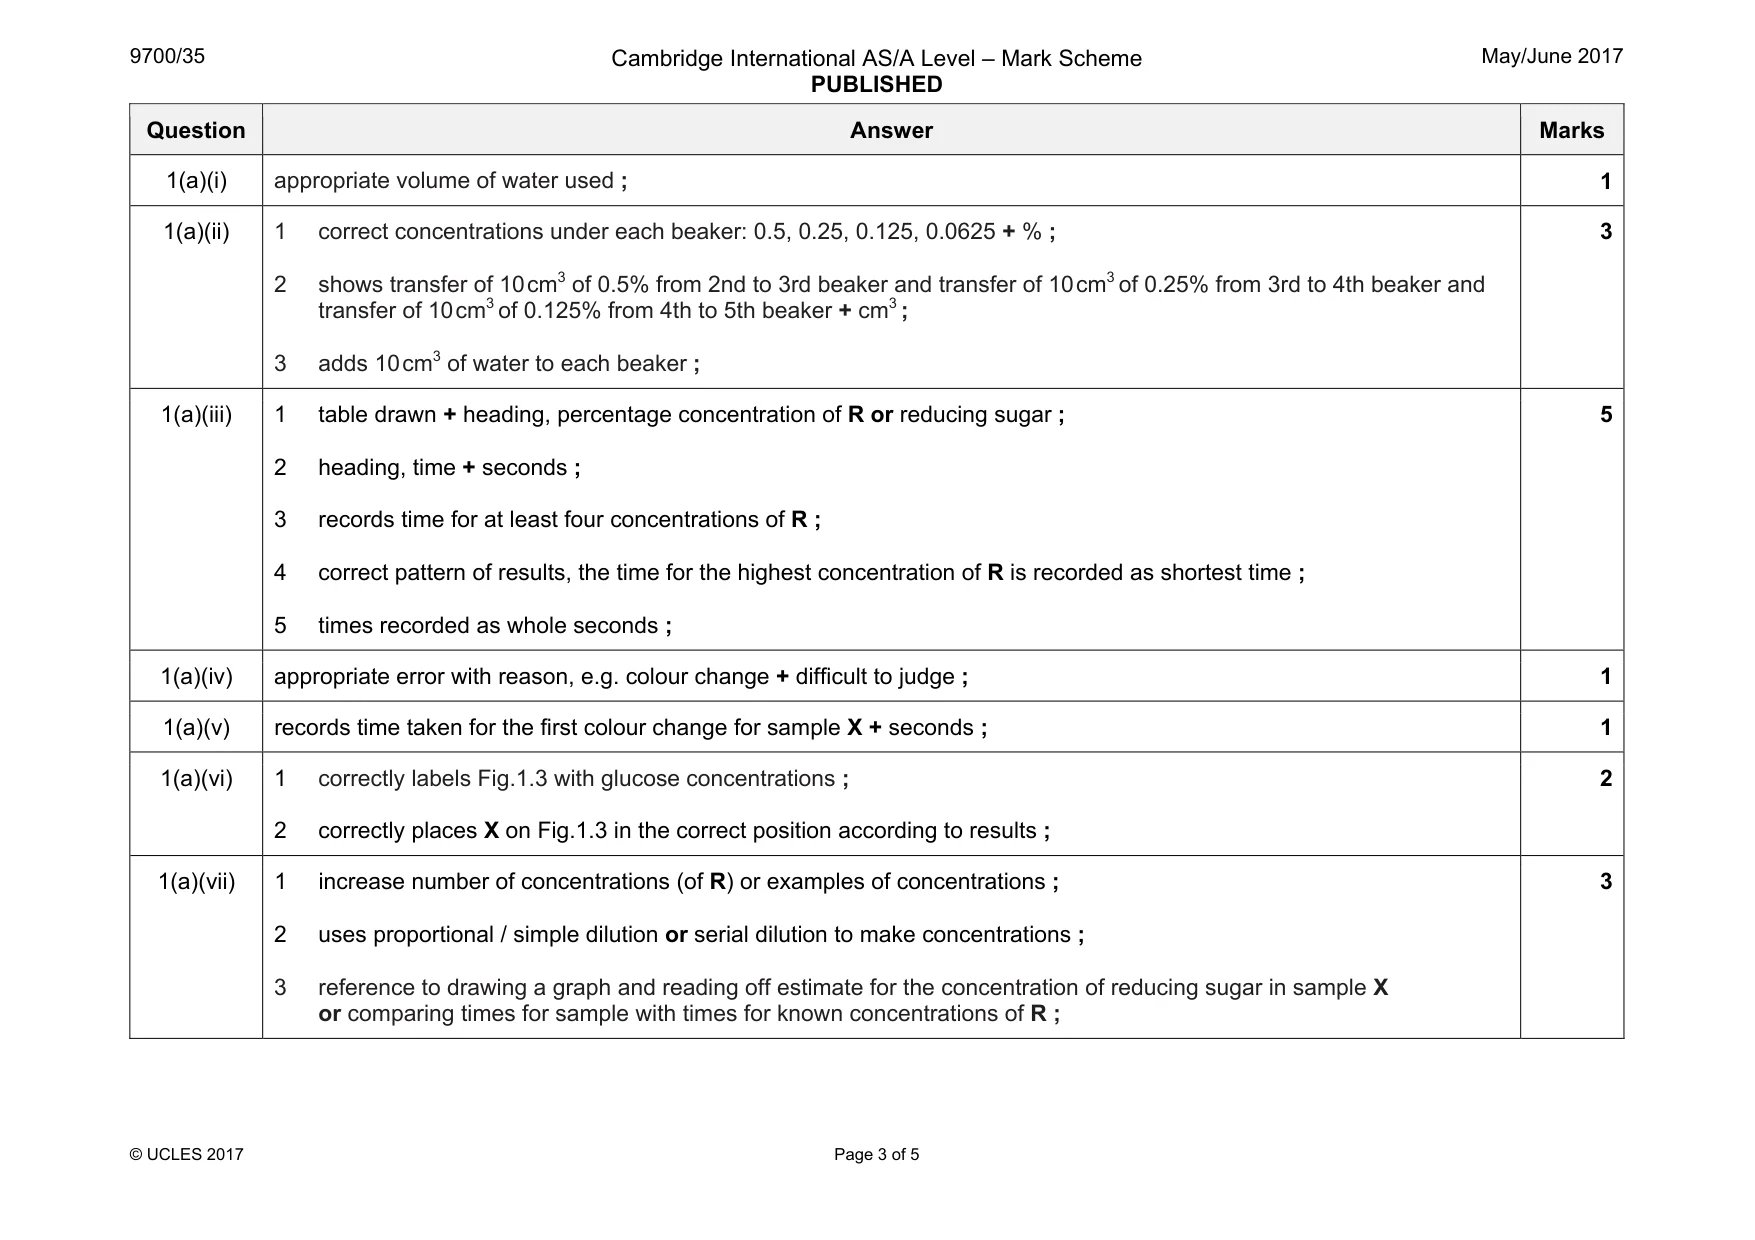
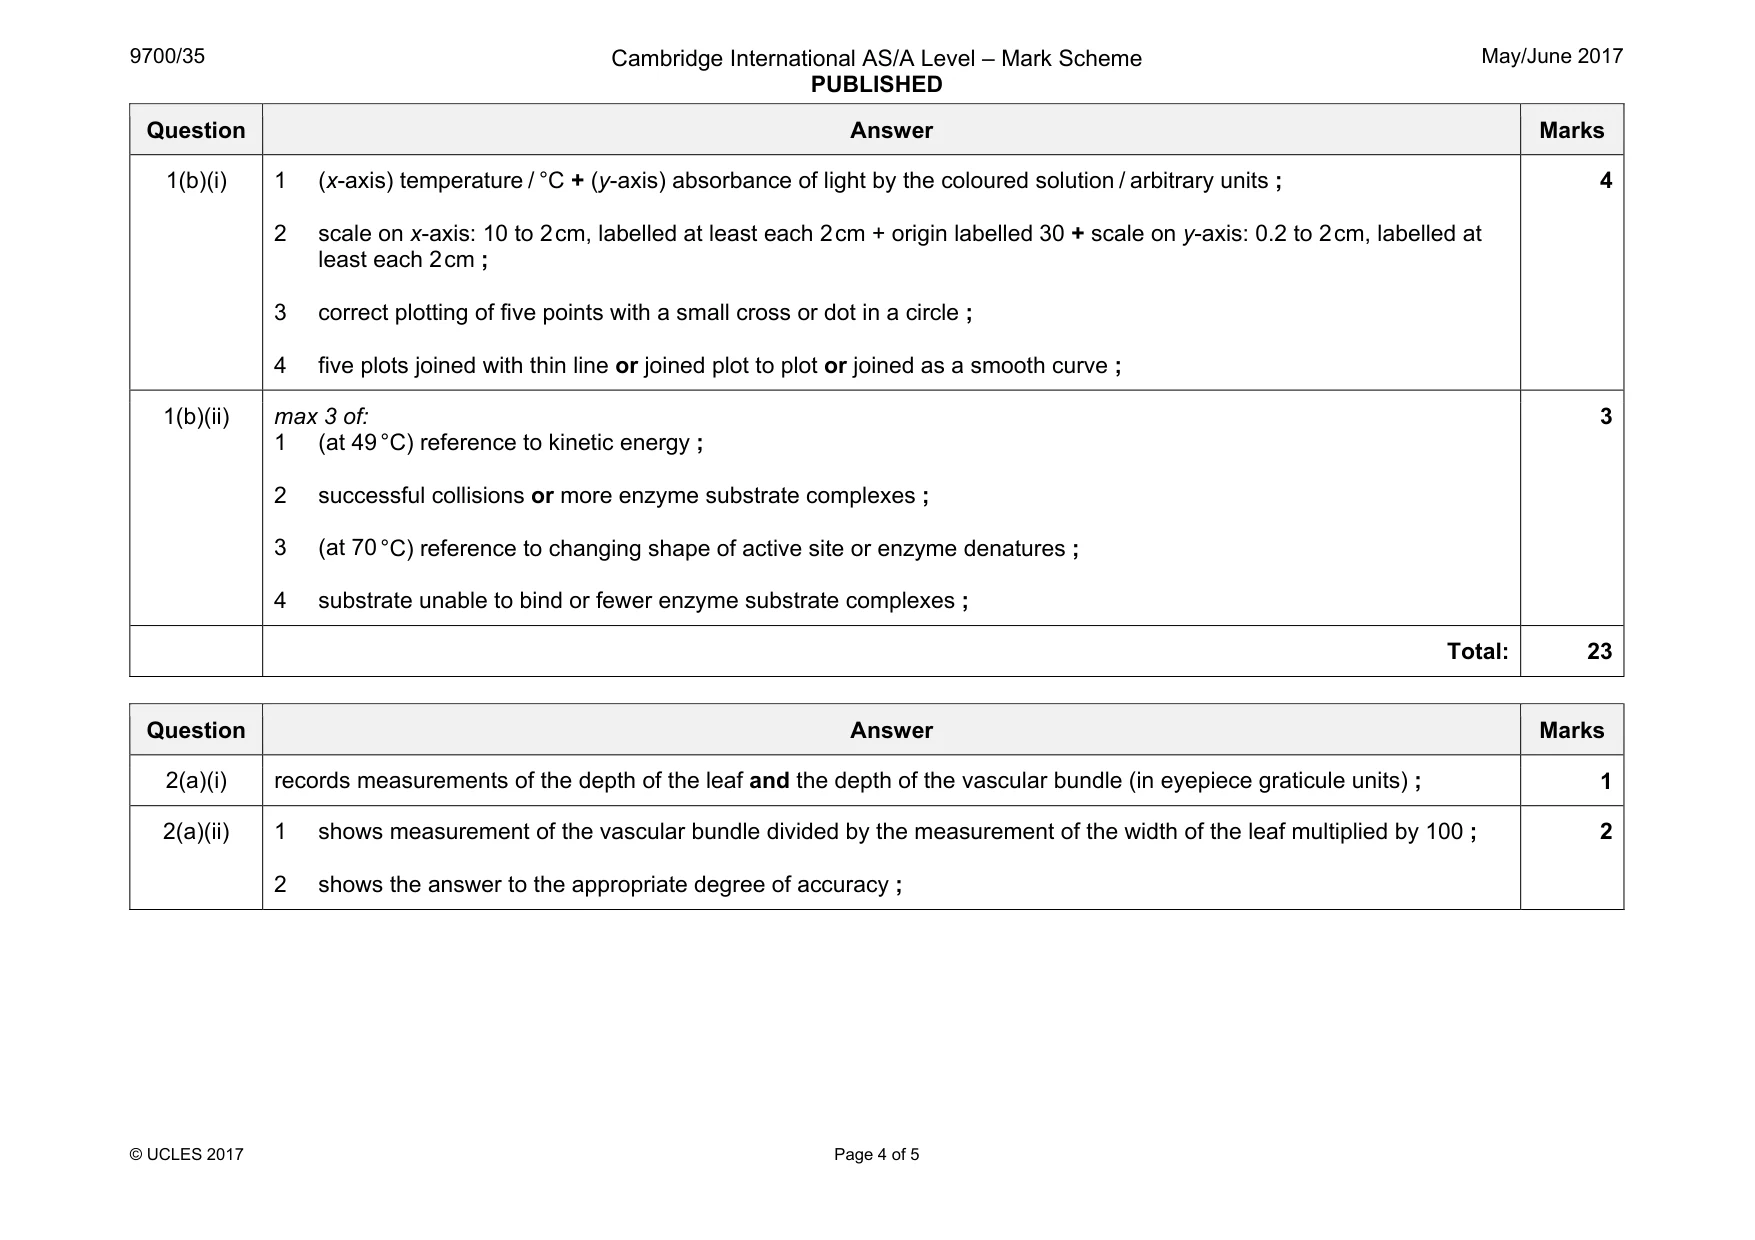
Mark scheme: 1(a)(i) appropriate volume of water used ; 1 1(a)(ii) 1 correct concentrations under each beaker: 0.5, 0.25, 0.125, 0.0625 + % ; 2 shows transfer of 10 cm3 of 0.5% from 2nd to 3rd beaker and transfer of 10 cm3 of 0.25% from 3rd to 4th beaker and transfer of 10 cm3 of 0.125% from 4th to 5th beaker + cm3 ; 3 adds 10 cm3 of water to each beaker ; 3 1(a)(iii) 1 table drawn + heading, percentage concentration of R or reducing sugar ; 2 heading, time + seconds ; 3 records time for at least four concentrations of R ; 4 correct pattern of results, the time for the highest concentration of R is recorded as shortest time ; 5 times recorded as whole seconds ; 5 1(a)(iv) appropriate error with reason, e.g. colour change + difficult to judge ; 1 1(a)(v) records time taken for the first colour change for sample X + seconds ; 1 1(a)(vi) 1 correctly labels Fig.1.3 with glucose concentrations ; 2 correctly places X on Fig.1.3 in the correct position according to results ; 2 1(a)(vii) 1 increase number of concentrations (of R) or examples of concentrations ; 2 uses proportional / simple dilution or serial dilution to make concentrations ; 3 reference to drawing a graph and reading off estimate for the concentration of reducing sugar in sample X or comparing times for sample with times for known concentrations of R ; 3 Question Answer Marks 1(b)(i) 1 (x-axis) temperature / °C + (y-axis) absorbance of light by the coloured solution / arbitrary units ; 2 scale on x-axis: 10 to 2 cm, labelled at least each 2 cm + origin labelled 30 + scale on y-axis: 0.2 to 2 cm, labelled at least each 2 cm ; 3 correct plotting of five points with a small cross or dot in a circle ; 4 five plots joined with thin line or joined plot to plot or joined as a smooth curve ; 4 1(b)(ii) max 3 of: 1 (at 49 °C) reference to kinetic energy ; 2 successful collisions or more enzyme substrate complexes ; 3 (at 70 °C) reference to changing shape of active site or enzyme denatures ; 4 substrate unable to bind or fewer enzyme substrate complexes ; 3 Total: 23
Q2 · L1 is a slide of a stained transverse section through a plant leaf
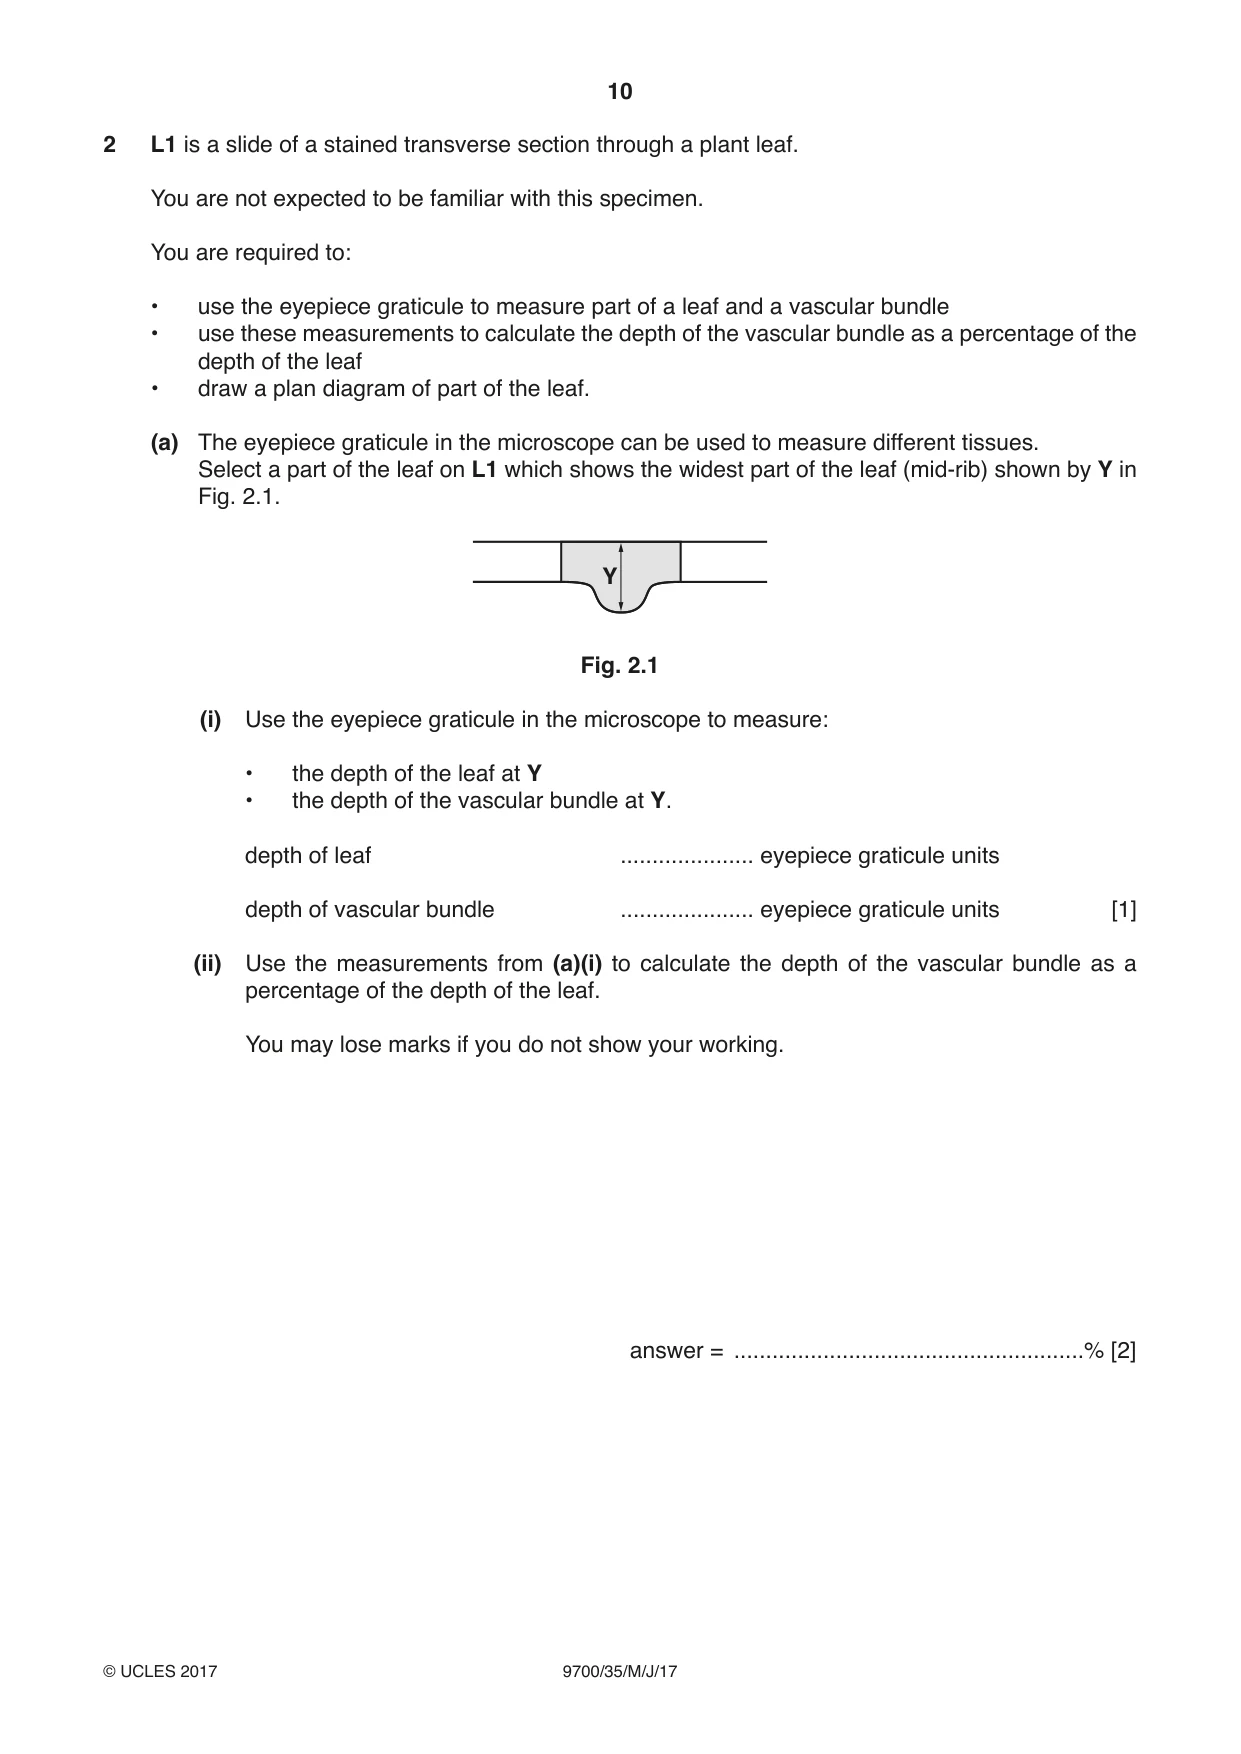
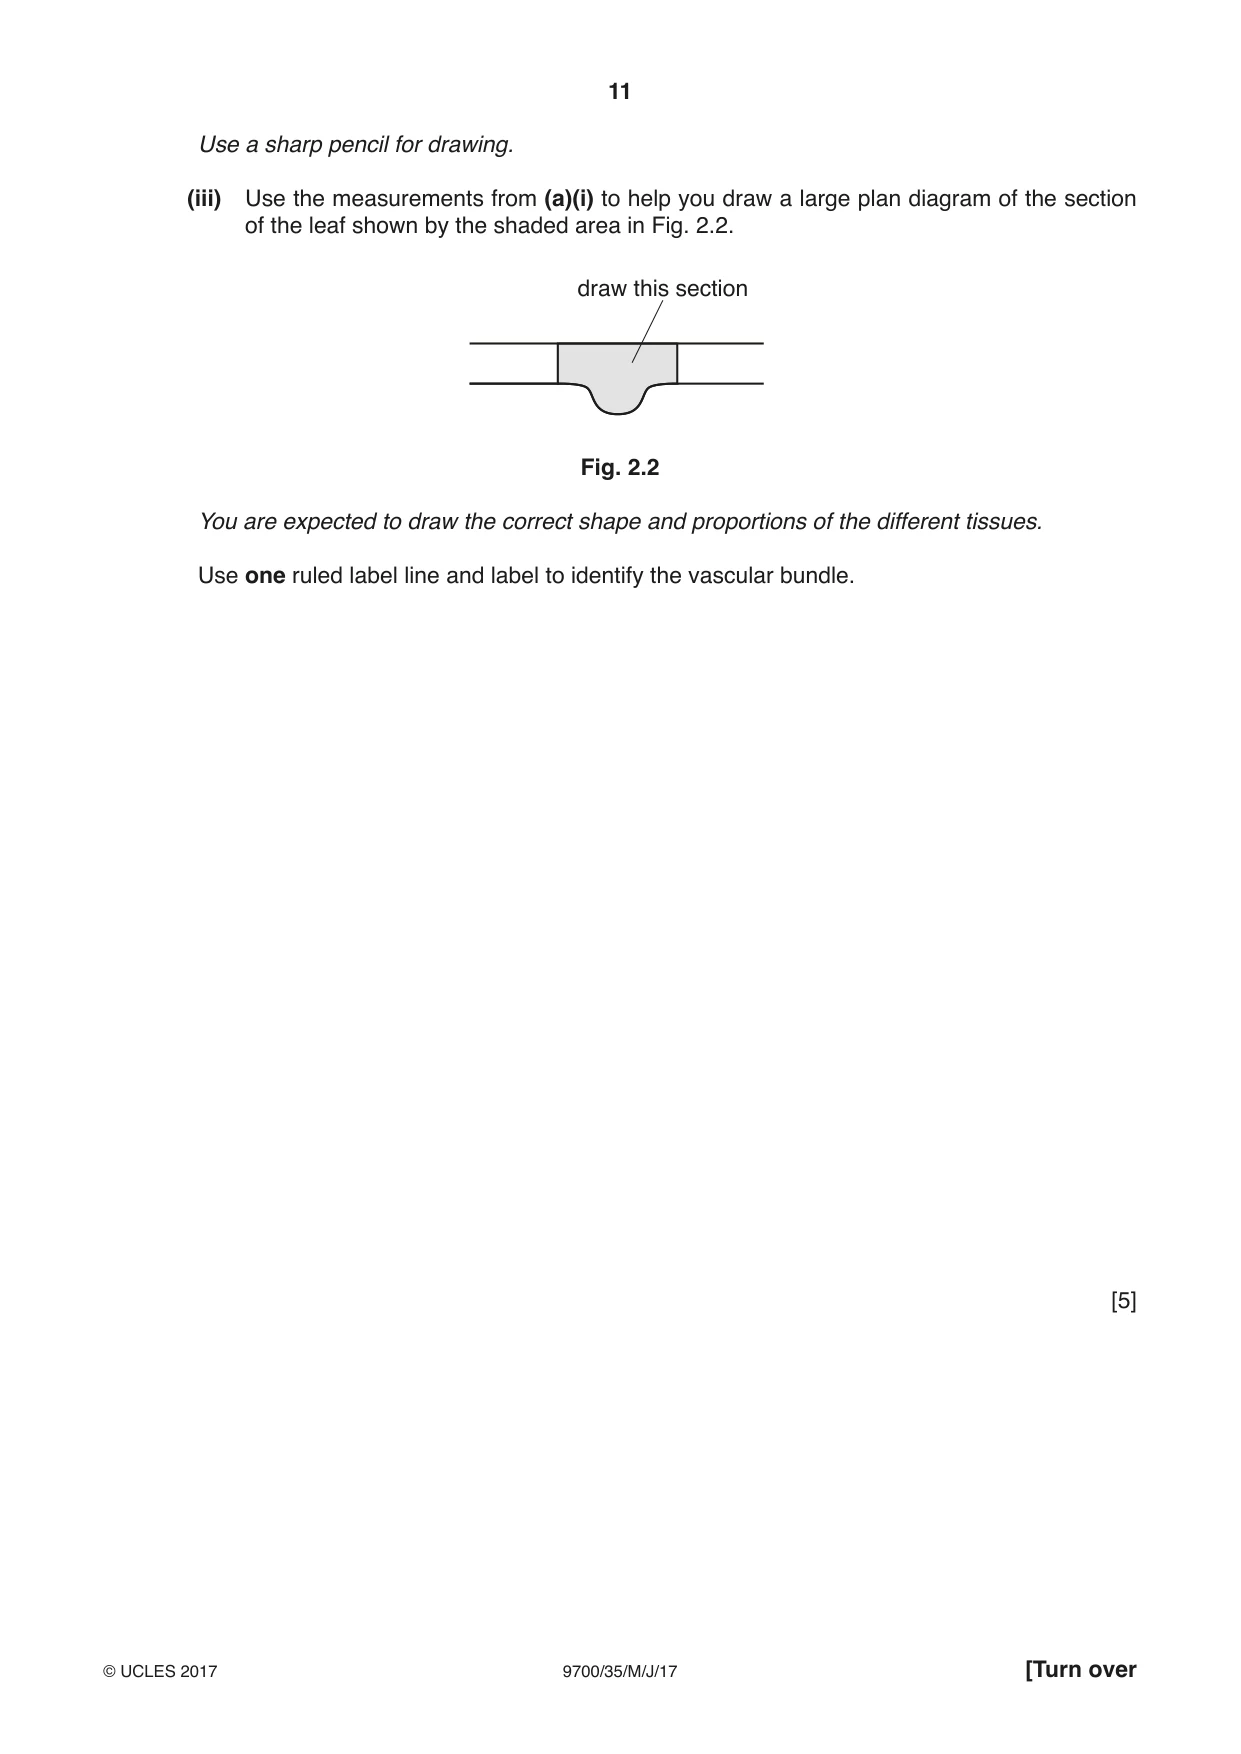
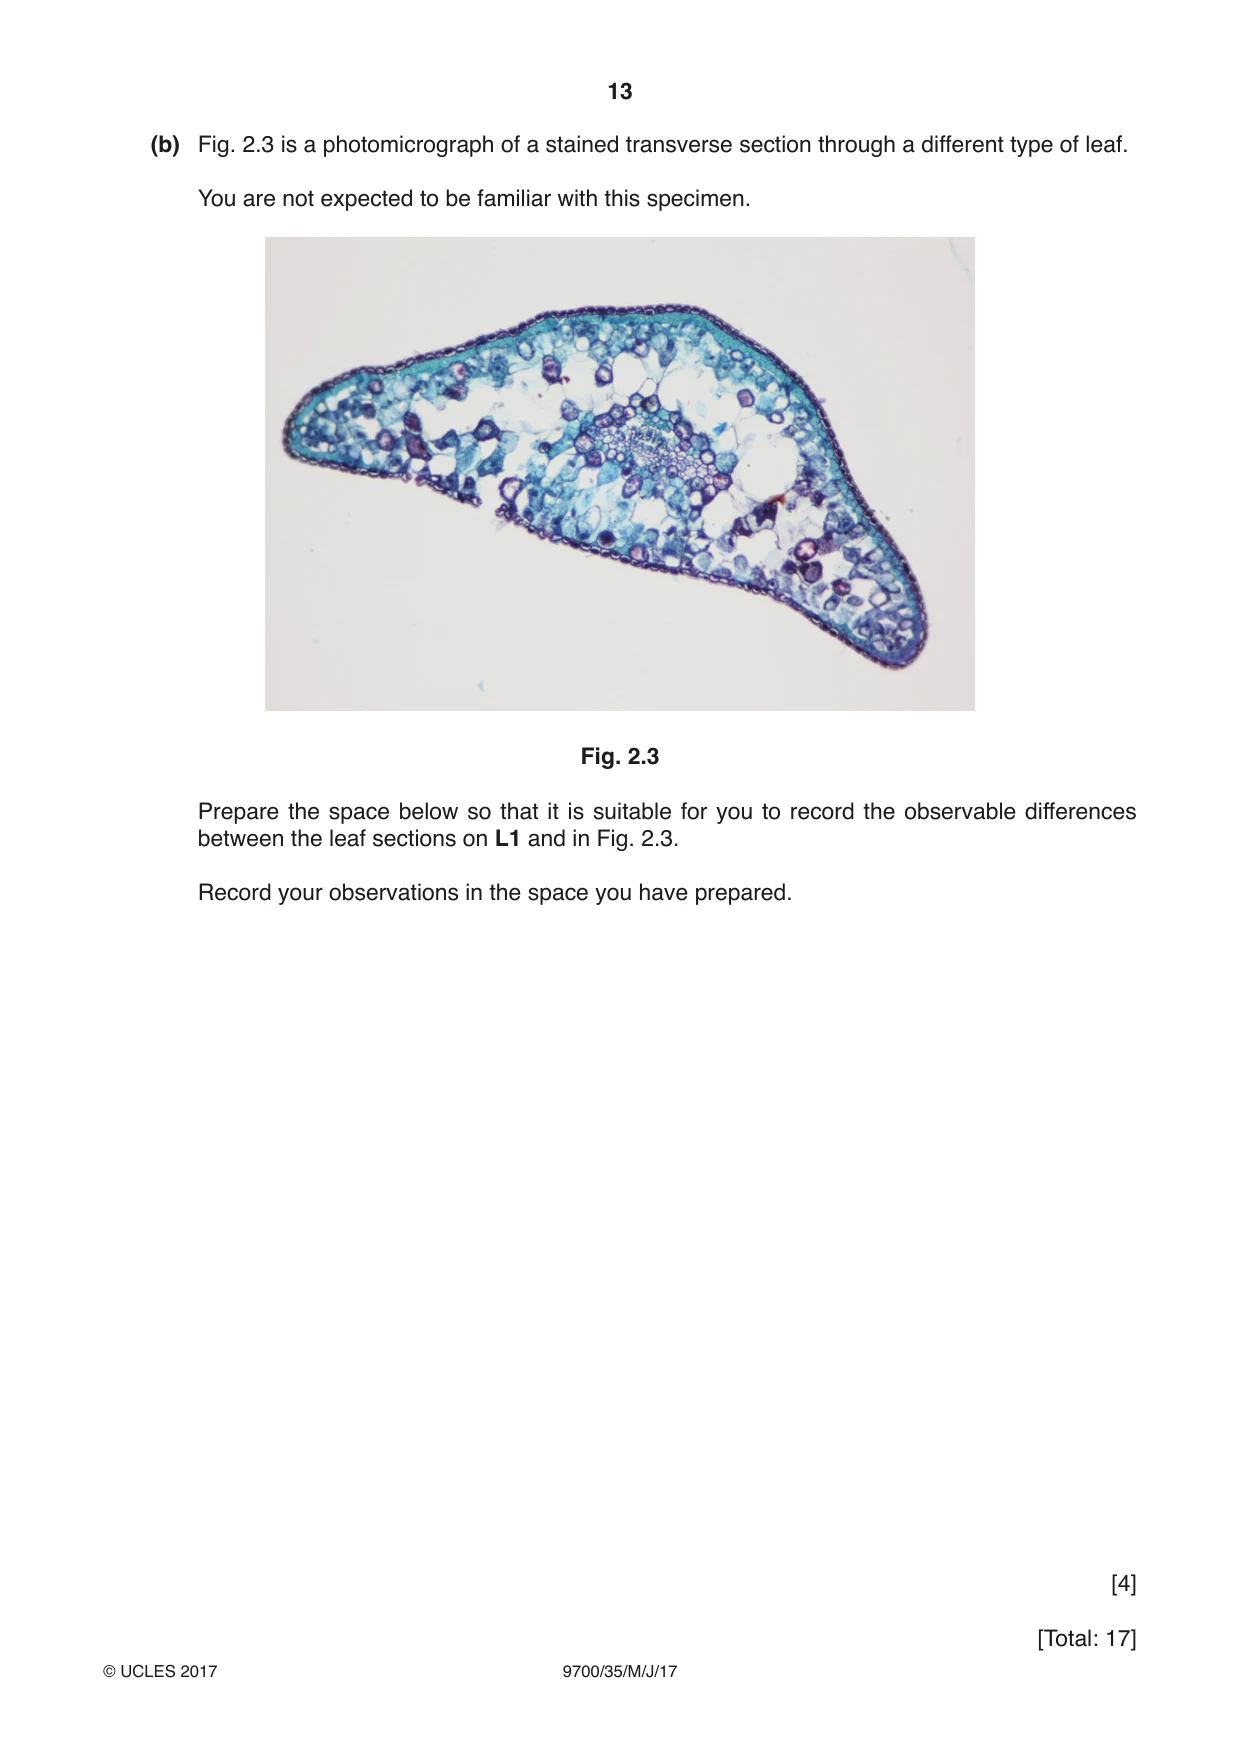
2 L1 is a slide of a stained transverse section through a plant leaf. You are not expected to be familiar with this specimen. You are required to: • use the eyepiece graticule to measure part of a leaf and a vascular bundle • use these measurements to calculate the depth of the vascular bundle as a percentage of the depth of the leaf • draw a plan diagram of part of the leaf. (a) The eyepiece graticule in the microscope can be used to measure different tissues. Select a part of the leaf on L1 which shows the widest part of the leaf (mid-rib) shown by Y in Fig. 2.1. Y Fig. 2.1 (i) Use the eyepiece graticule in the microscope to measure: • the depth of the leaf at Y • the depth of the vascular bundle at Y. depth of leaf ..................... eyepiece graticule units depth of vascular bundle ..................... eyepiece graticule units [1] (ii) Use the measurements from (a)(i) to calculate the depth of the vascular bundle as a percentage of the depth of the leaf. You may lose marks if you do not show your working. answer = .......................................................% [2] Use a sharp pencil for drawing. (iii) Use the measurements from (a)(i) to help you draw a large plan diagram of the section of the leaf shown by the shaded area in Fig. 2.2. draw this section Fig. 2.2 You are expected to draw the correct shape and proportions of the different tissues. Use one ruled label line and label to identify the vascular bundle. [5] (iv) Observe the vascular bundle in the central part of the leaf on L1. Select one group of four adjacent (touching) xylem vessel elements. Each element must touch at least one of the other elements. Make a large drawing of this group of four xylem vessel elements. Use one ruled label line and label to identify the lumen of one xylem vessel element. [5]
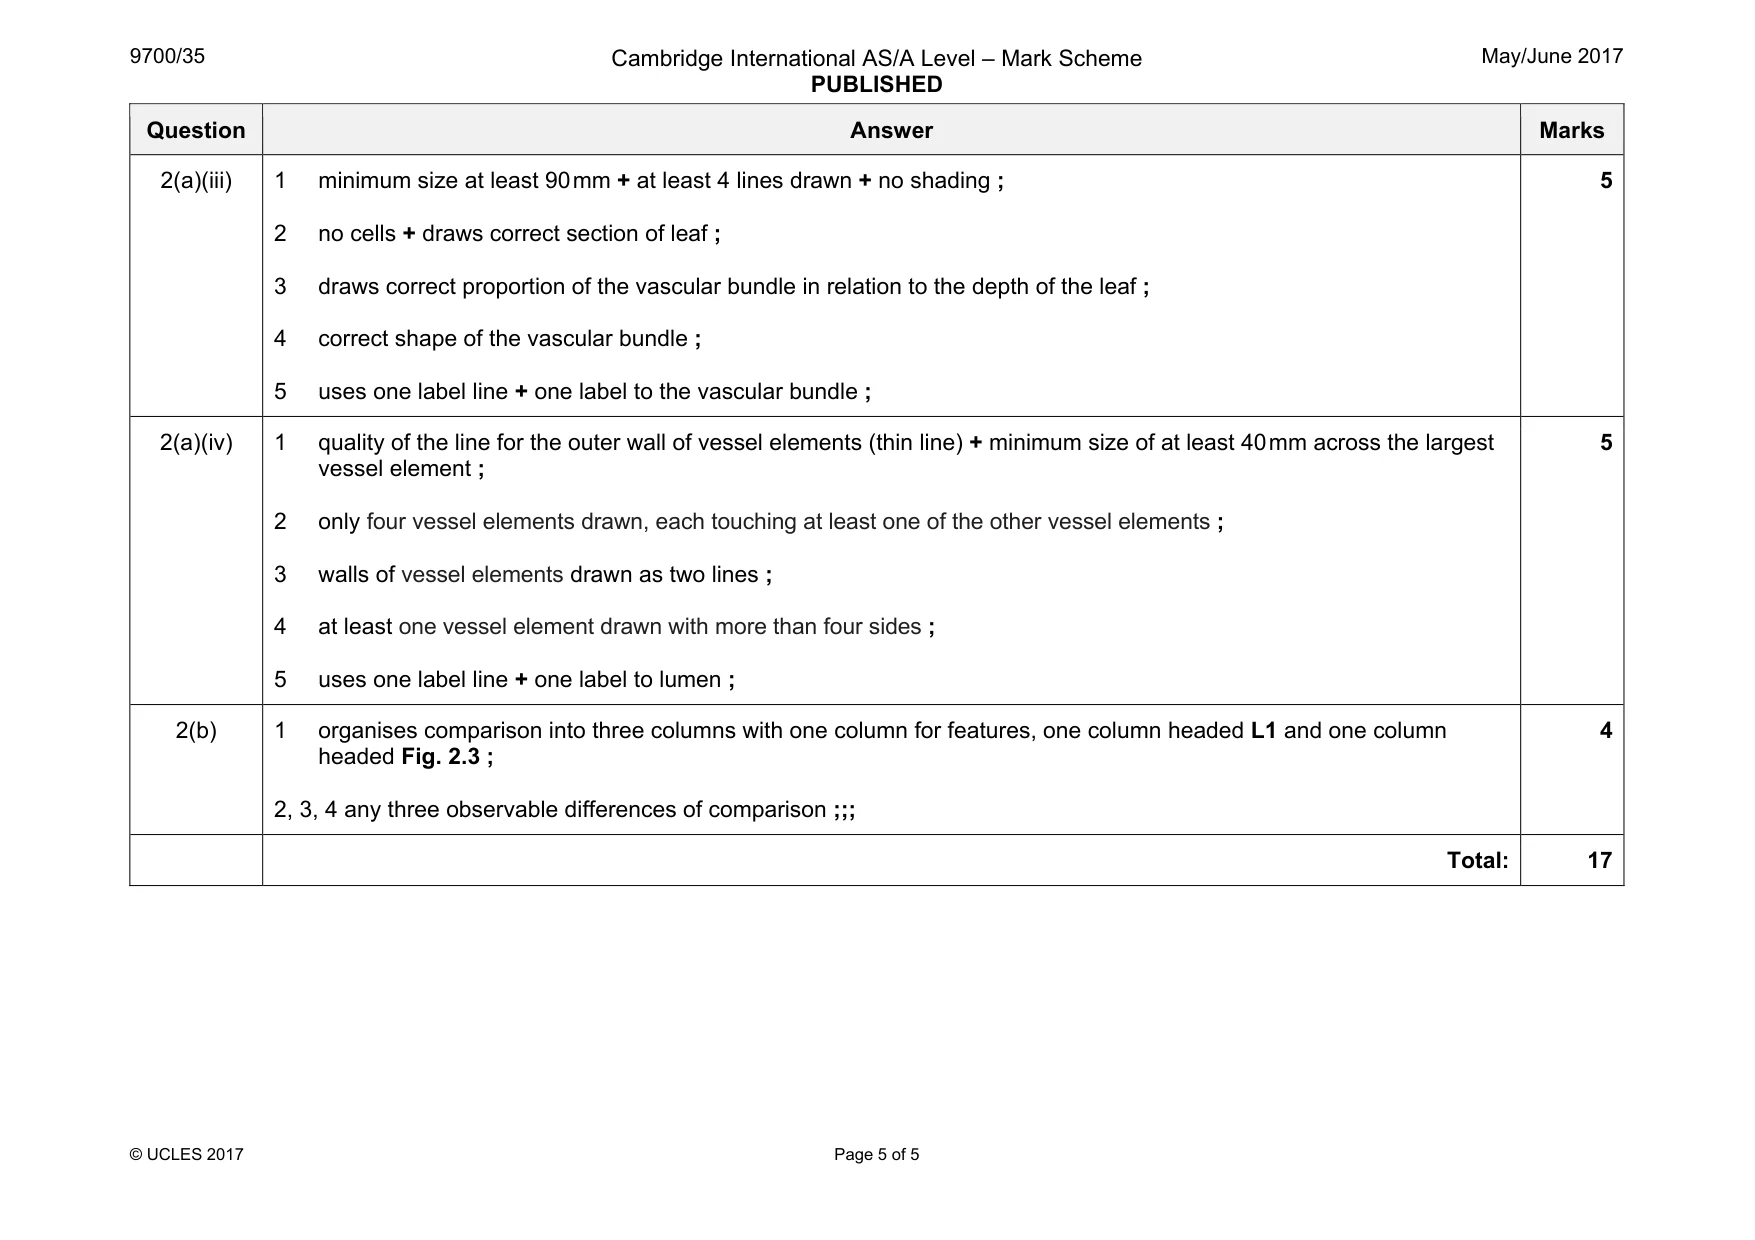
Mark scheme: 2(a)(i) records measurements of the depth of the leaf and the depth of the vascular bundle (in eyepiece graticule units) ; 1 2(a)(ii) 1 shows measurement of the vascular bundle divided by the measurement of the width of the leaf multiplied by 100 ; 2 shows the answer to the appropriate degree of accuracy ; 2 Question Answer Marks 2(a)(iii) 1 minimum size at least 90 mm + at least 4 lines drawn + no shading ; 2 no cells + draws correct section of leaf ; 3 draws correct proportion of the vascular bundle in relation to the depth of the leaf ; 4 correct shape of the vascular bundle ; 5 uses one label line + one label to the vascular bundle ; 5 2(a)(iv) 1 quality of the line for the outer wall of vessel elements (thin line) + minimum size of at least 40 mm across the largest vessel element ; 2 only four vessel elements drawn, each touching at least one of the other vessel elements ; 3 walls of vessel elements drawn as two lines ; 4 at least one vessel element drawn with more than four sides ; 5 uses one label line + one label to lumen ; 5 2(b) 1 organises comparison into three columns with one column for features, one column headed L1 and one column headed Fig. 2.3 ; 2, 3, 4 any three observable differences of comparison ;;; 4 Total: 17
What was in this paper
The subtopics covered by these 2 questions, and how many questions each got. Open one in a new tab to see every Cambridge question on it.
What you needed in this session
Cambridge’s own grade thresholds for 2017 May/June, Paper 3 · Variant 5. A higher threshold means an easier paper — the bar moves with how the cohort did.