Cambridge A Level Accounting 9706 — 2011 May/June Paper 2 · Variant 2
9706/22/M/J/11 · 90 marks · ≈101 min
The question paper and its mark scheme, free to read here and free to download. This is Cambridge’s own paper, exactly as it was sat.
Question paper12 pages
Mark scheme6 pages
Answers below. Sit the paper first if you are practising.
Paper as text
Question paper, page 1
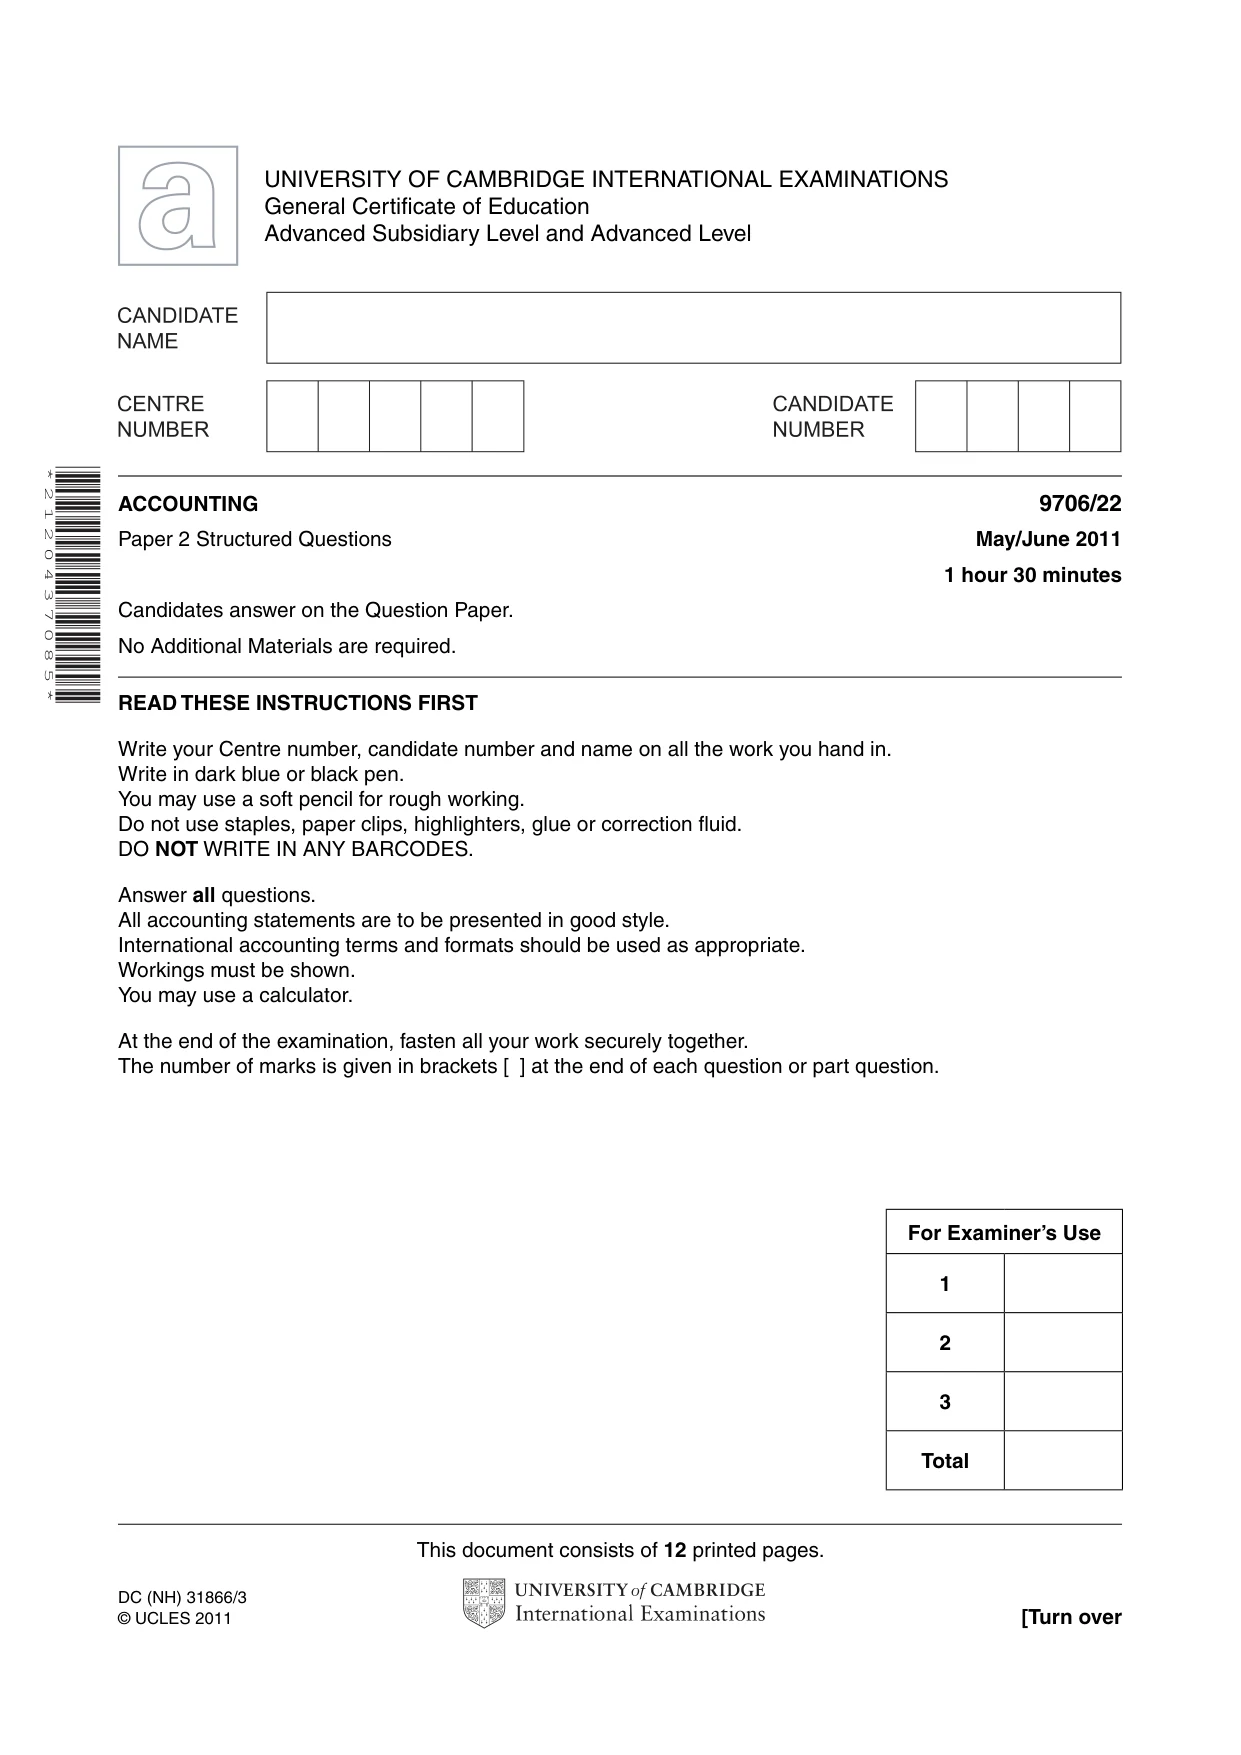
This document consists of 12 printed pages. DC (NH) 31866/3 © UCLES 2011 [Turn over UNIVERSITY OF CAMBRIDGE INTERNATIONAL EXAMINATIONS General Certificate of Education Advanced Subsidiary Level and Advanced Level * 2 1 2 0 4 3 7 0 8 5 * ACCOUNTING 9706/22 Paper 2 Structured Questions May/June 2011 1 hour 30 minutes Candidates answer on the Question Paper. No Additional Materials are required. READ THESE INSTRUCTIONS FIRST Write your Centre number, candidate number and name on all the work you hand in. Write in dark blue or black pen. You may use a soft pencil for rough working. Do not use staples, paper clips, highlighters, glue or correction fluid. DO NOT WRITE IN ANY BARCODES. Answer all questions. All accounting statements are to be presented in good style. International accounting terms and formats should be used as appropriate. Workings must be shown. You may use a calculator. At the end of the examination, fasten all your work securely together. The number of marks is given in brackets [ ] at the end of each question or part question. For Examiner’s Use 1 2 3 Total
Question paper, page 2
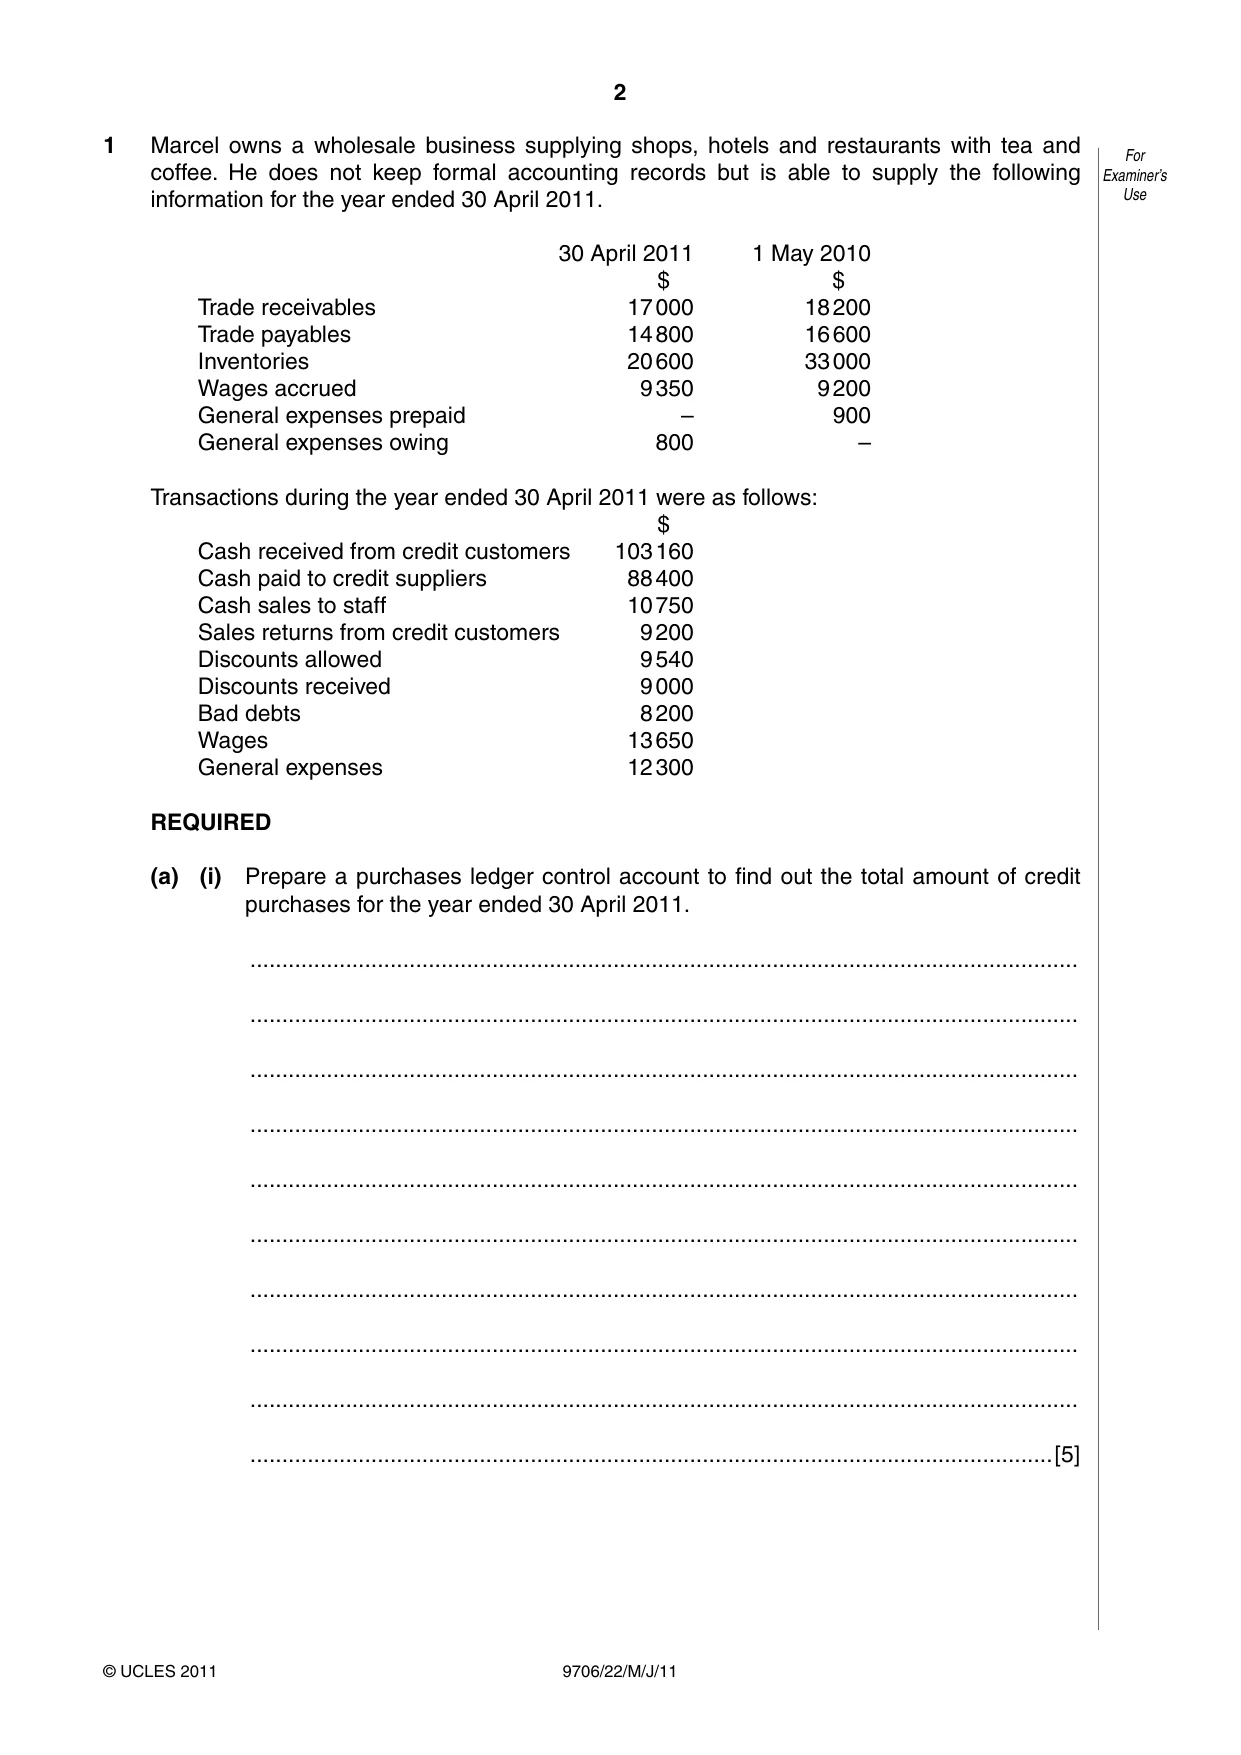
2 9706/22/M/J/11 © UCLES 2011 For Examiner’s Use 1 Marcel owns a wholesale business supplying shops, hotels and restaurants with tea and coffee. He does not keep formal accounting records but is able to supply the following information for the year ended 30 April 2011. 30 April 2011 1 May 2010 $ $ Trade receivables 17 000 18 200 Trade payables 14 800 16 600 Inventories 20 600 33 000 Wages accrued 9 350 9 200 General expenses prepaid – 900 General expenses owing 800 – Transactions during the year ended 30 April 2011 were as follows: $ Cash received from credit customers 103 160 Cash paid to credit suppliers 88 400 Cash sales to staff 10 750 Sales returns from credit customers 9 200 Discounts allowed 9 540 Discounts received 9 000 Bad debts 8 200 Wages 13 650 General expenses 12 300 REQUIRED (a) (i) Prepare a purchases ledger control account to find out the total amount of credit purchases for the year ended 30 April 2011. … … … … … … … … … …[5]
Question paper, page 3
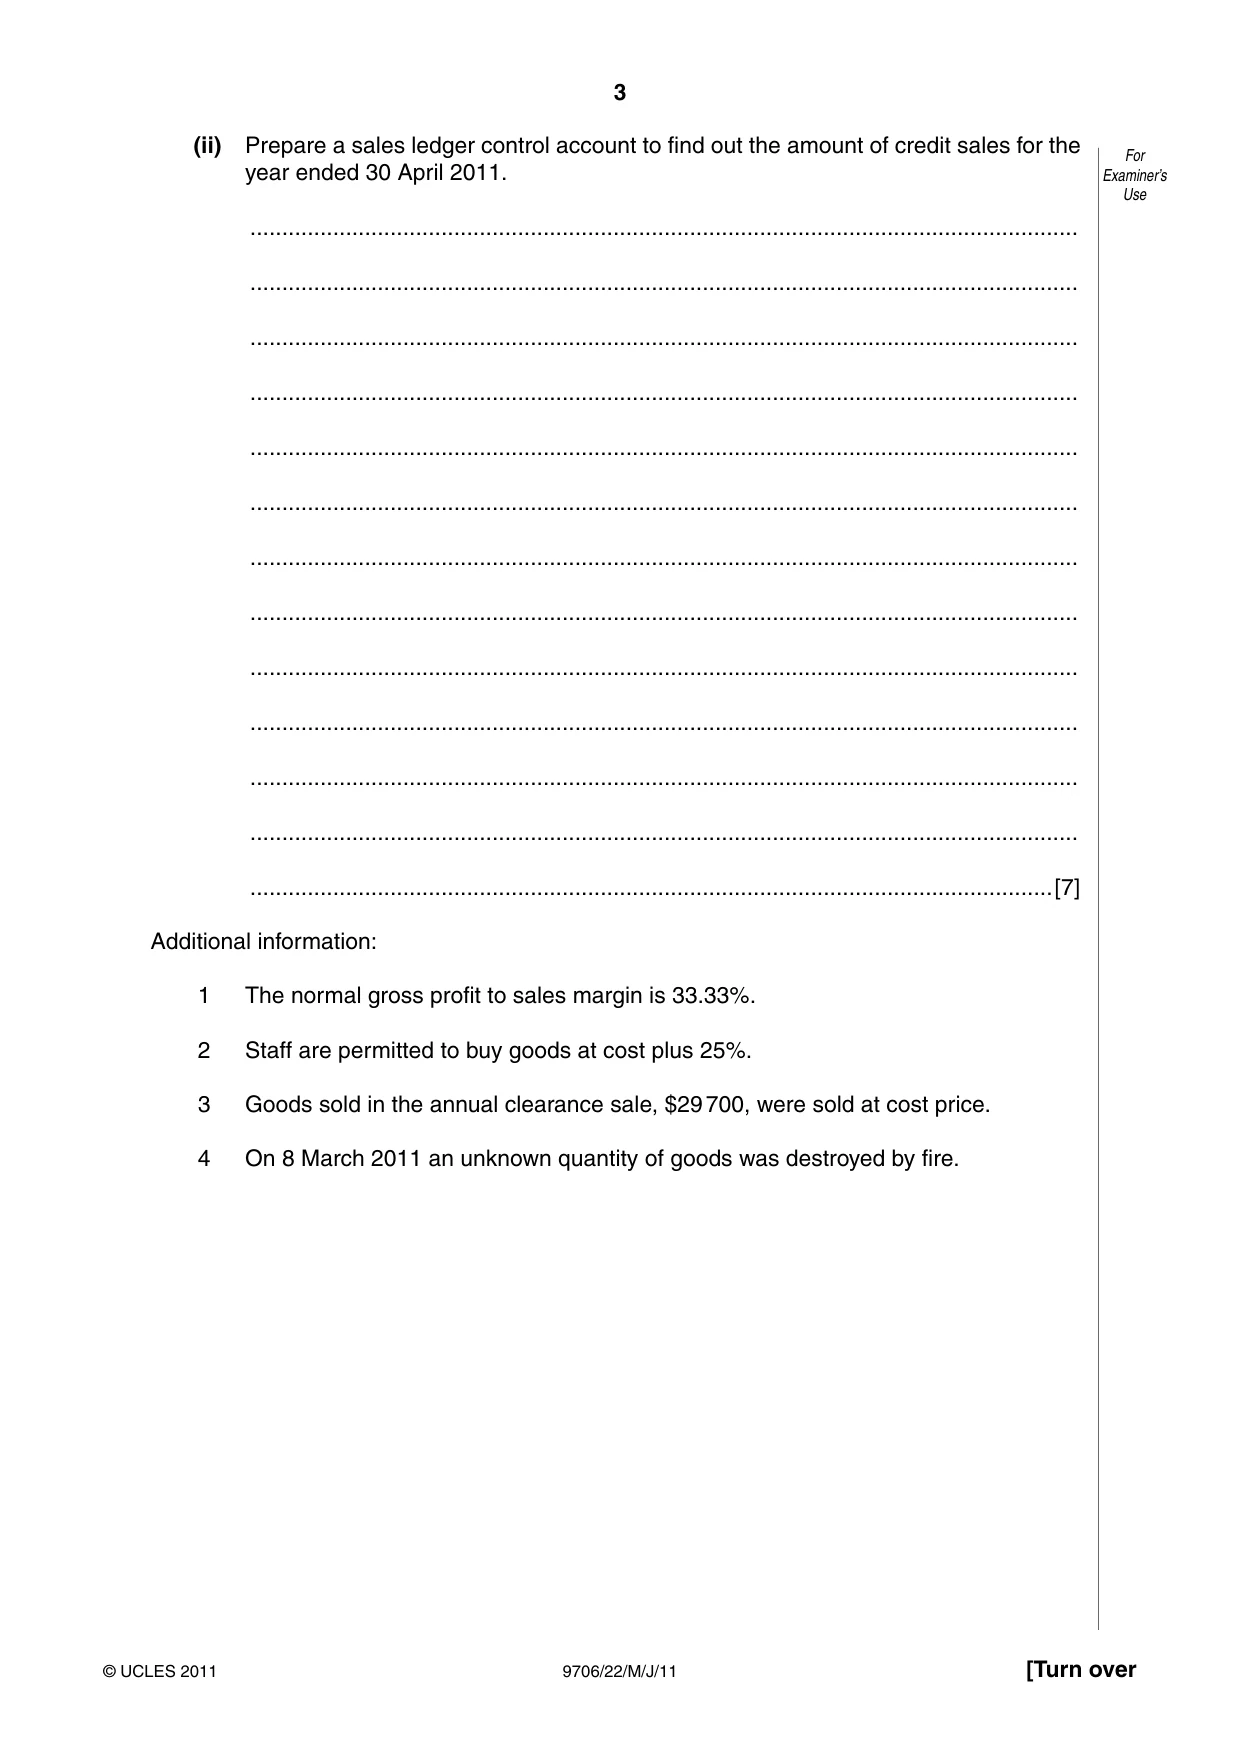
3 9706/22/M/J/11 © UCLES 2011 [Turn over For Examiner’s Use (ii) Prepare a sales ledger control account to find out the amount of credit sales for the year ended 30 April 2011. … … … … … … … … … … … … …[7] Additional information: 1 The normal gross profit to sales margin is 33.33%. 2 Staff are permitted to buy goods at cost plus 25%. 3 Goods sold in the annual clearance sale, $29 700, were sold at cost price. 4 On 8 March 2011 an unknown quantity of goods was destroyed by fire.
Question paper, page 4
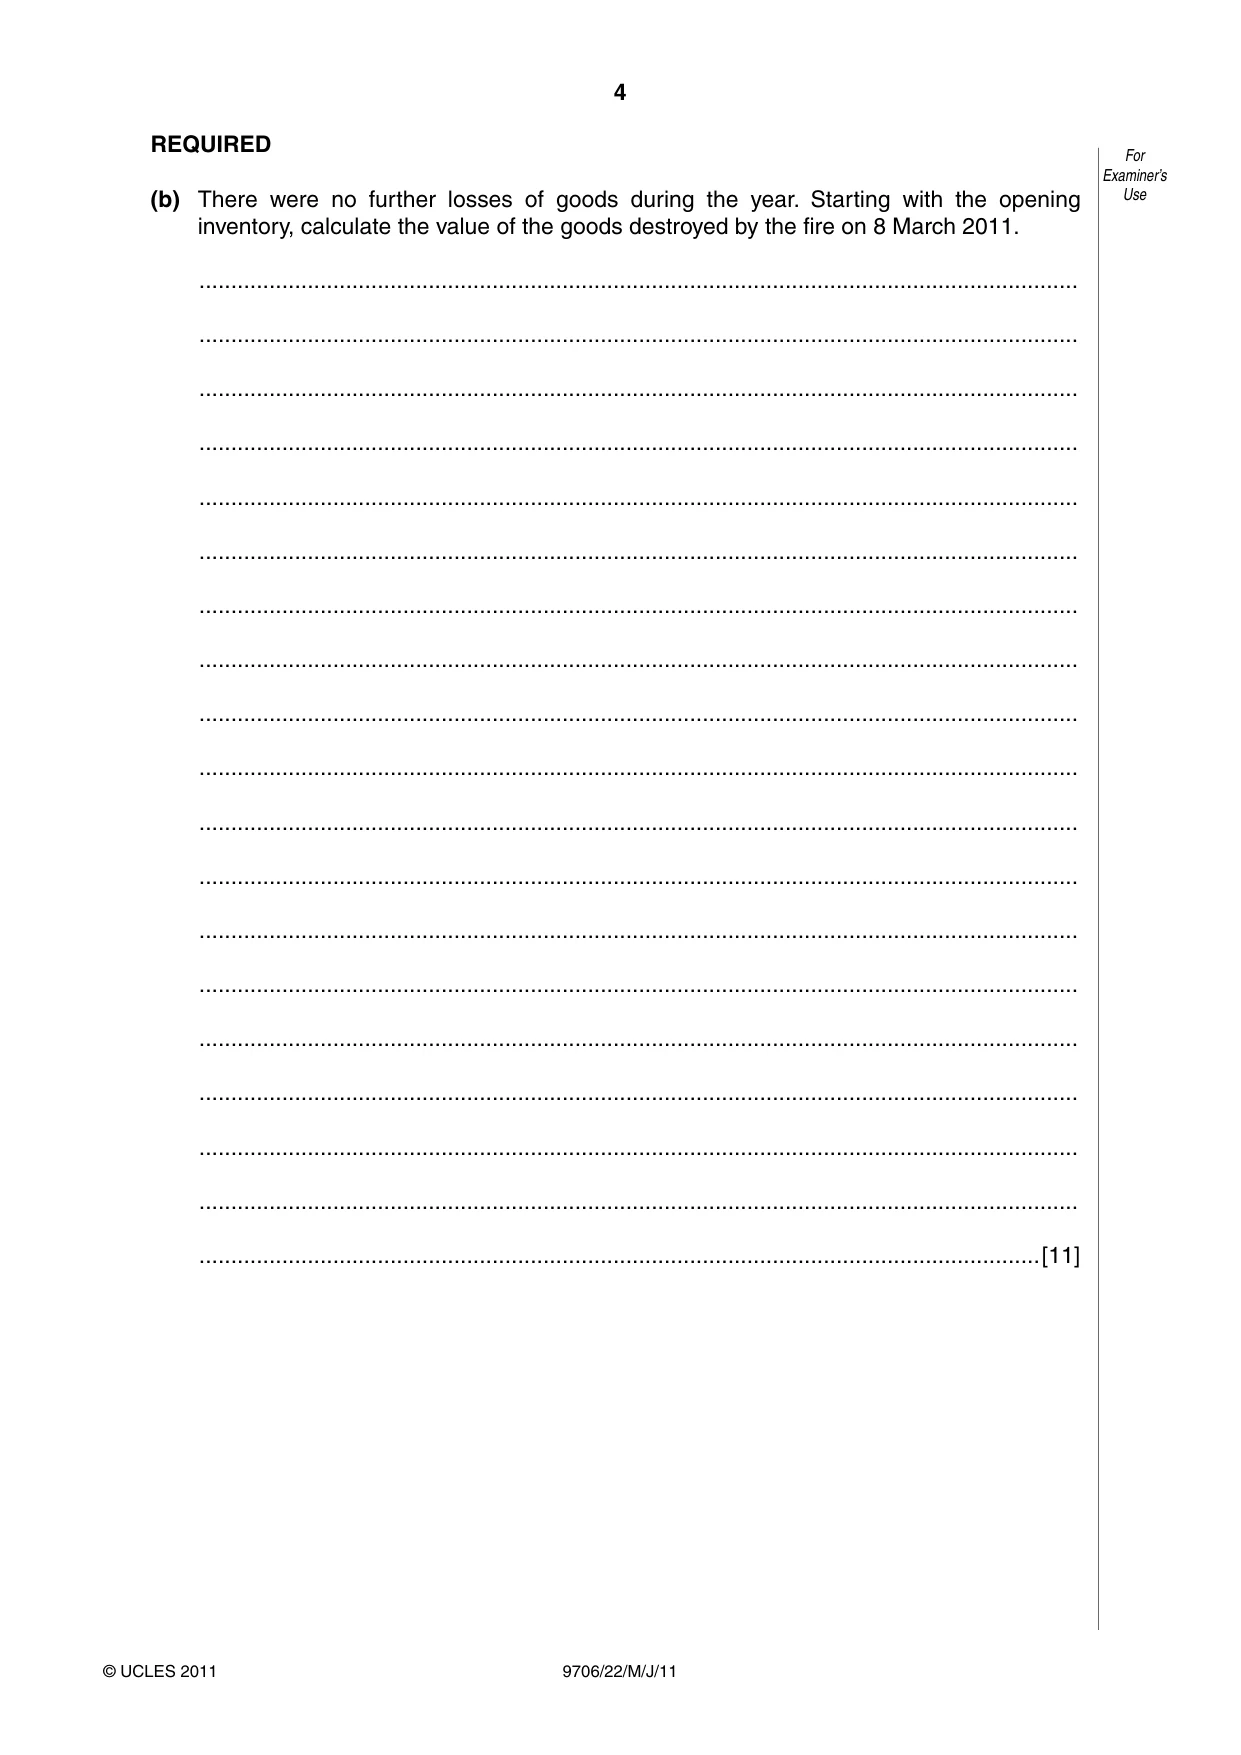
4 9706/22/M/J/11 © UCLES 2011 For Examiner’s Use REQUIRED (b) There were no further losses of goods during the year. Starting with the opening inventory, calculate the value of the goods destroyed by the fire on 8 March 2011. … … … … … … … … … … … … … … … … … … …[11]
Question paper, page 5
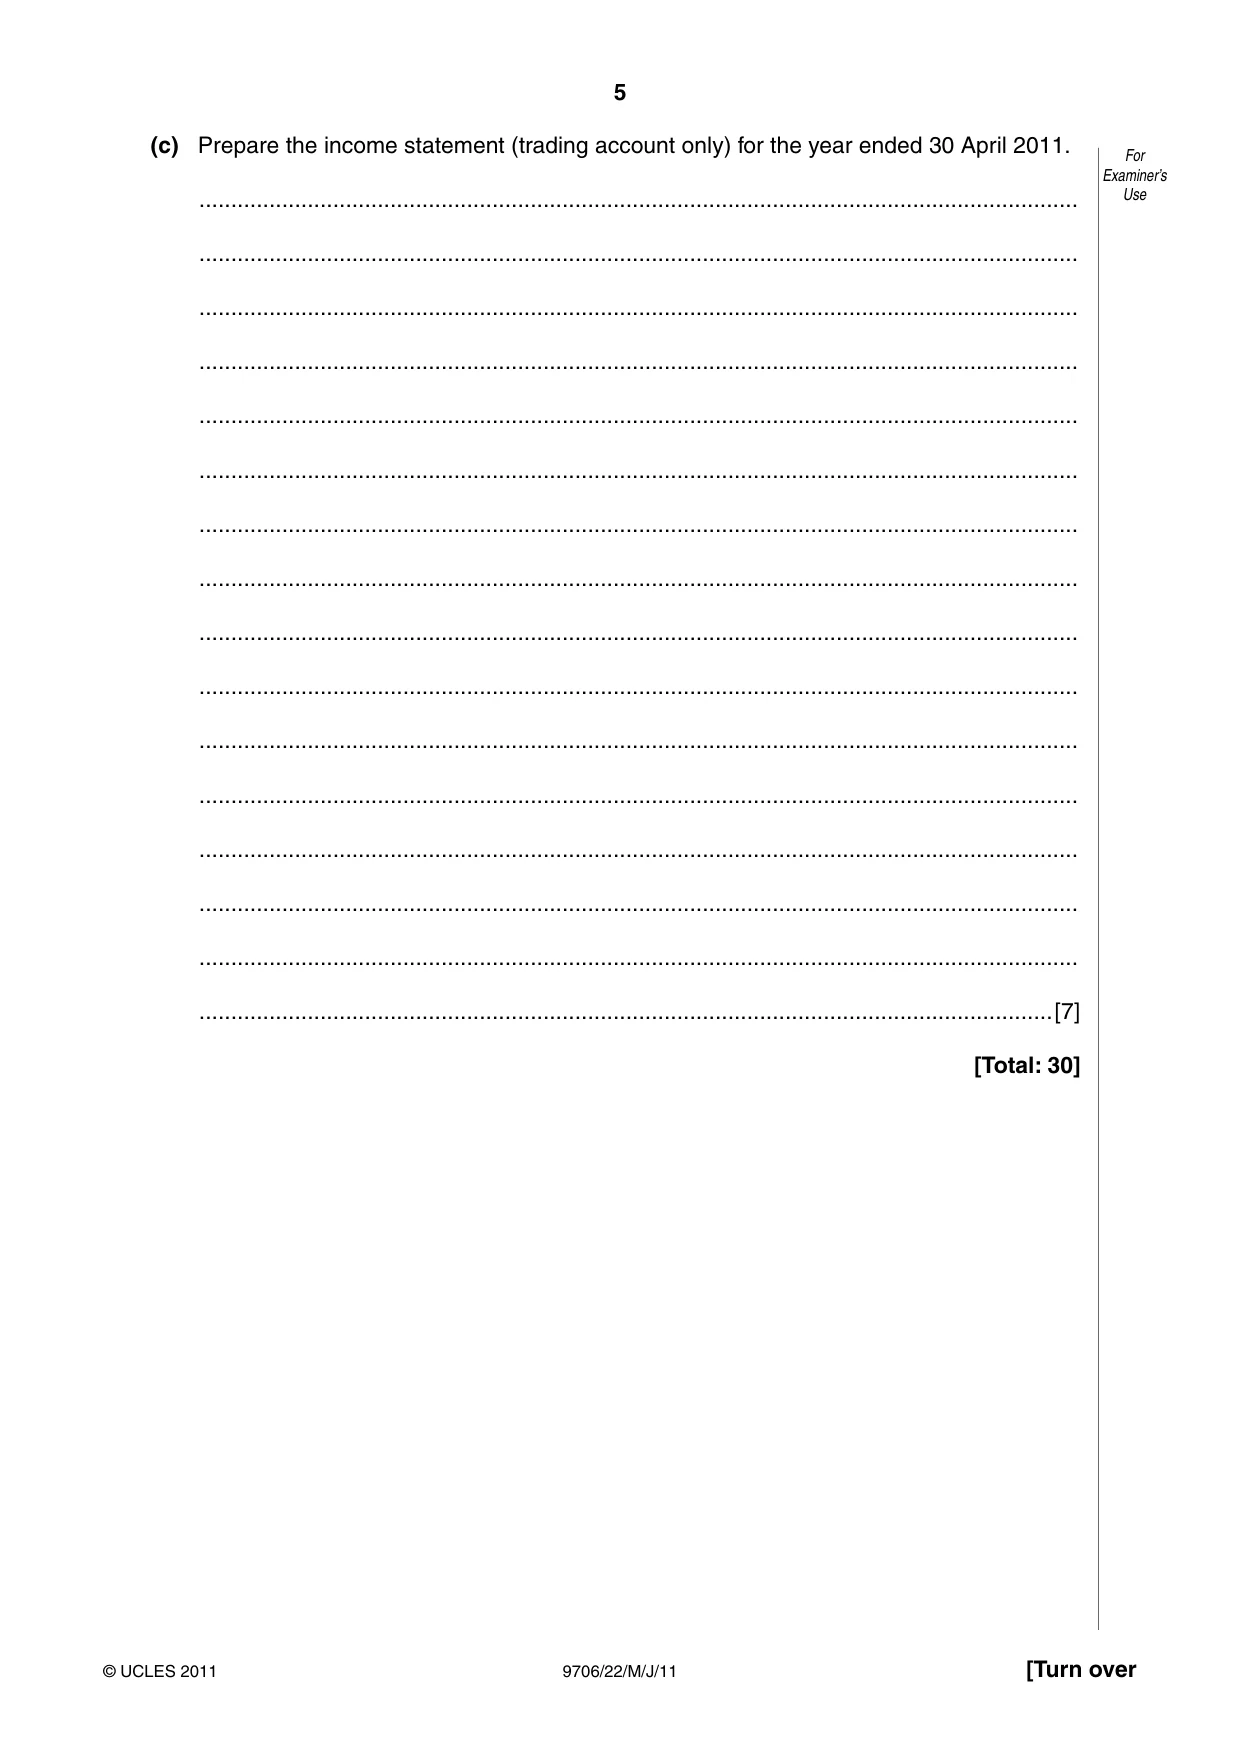
5 9706/22/M/J/11 © UCLES 2011 [Turn over For Examiner’s Use (c) Prepare the income statement (trading account only) for the year ended 30 April 2011. … … … … … … … … … … … … … … … …[7] [Total: 30]
Question paper, page 6
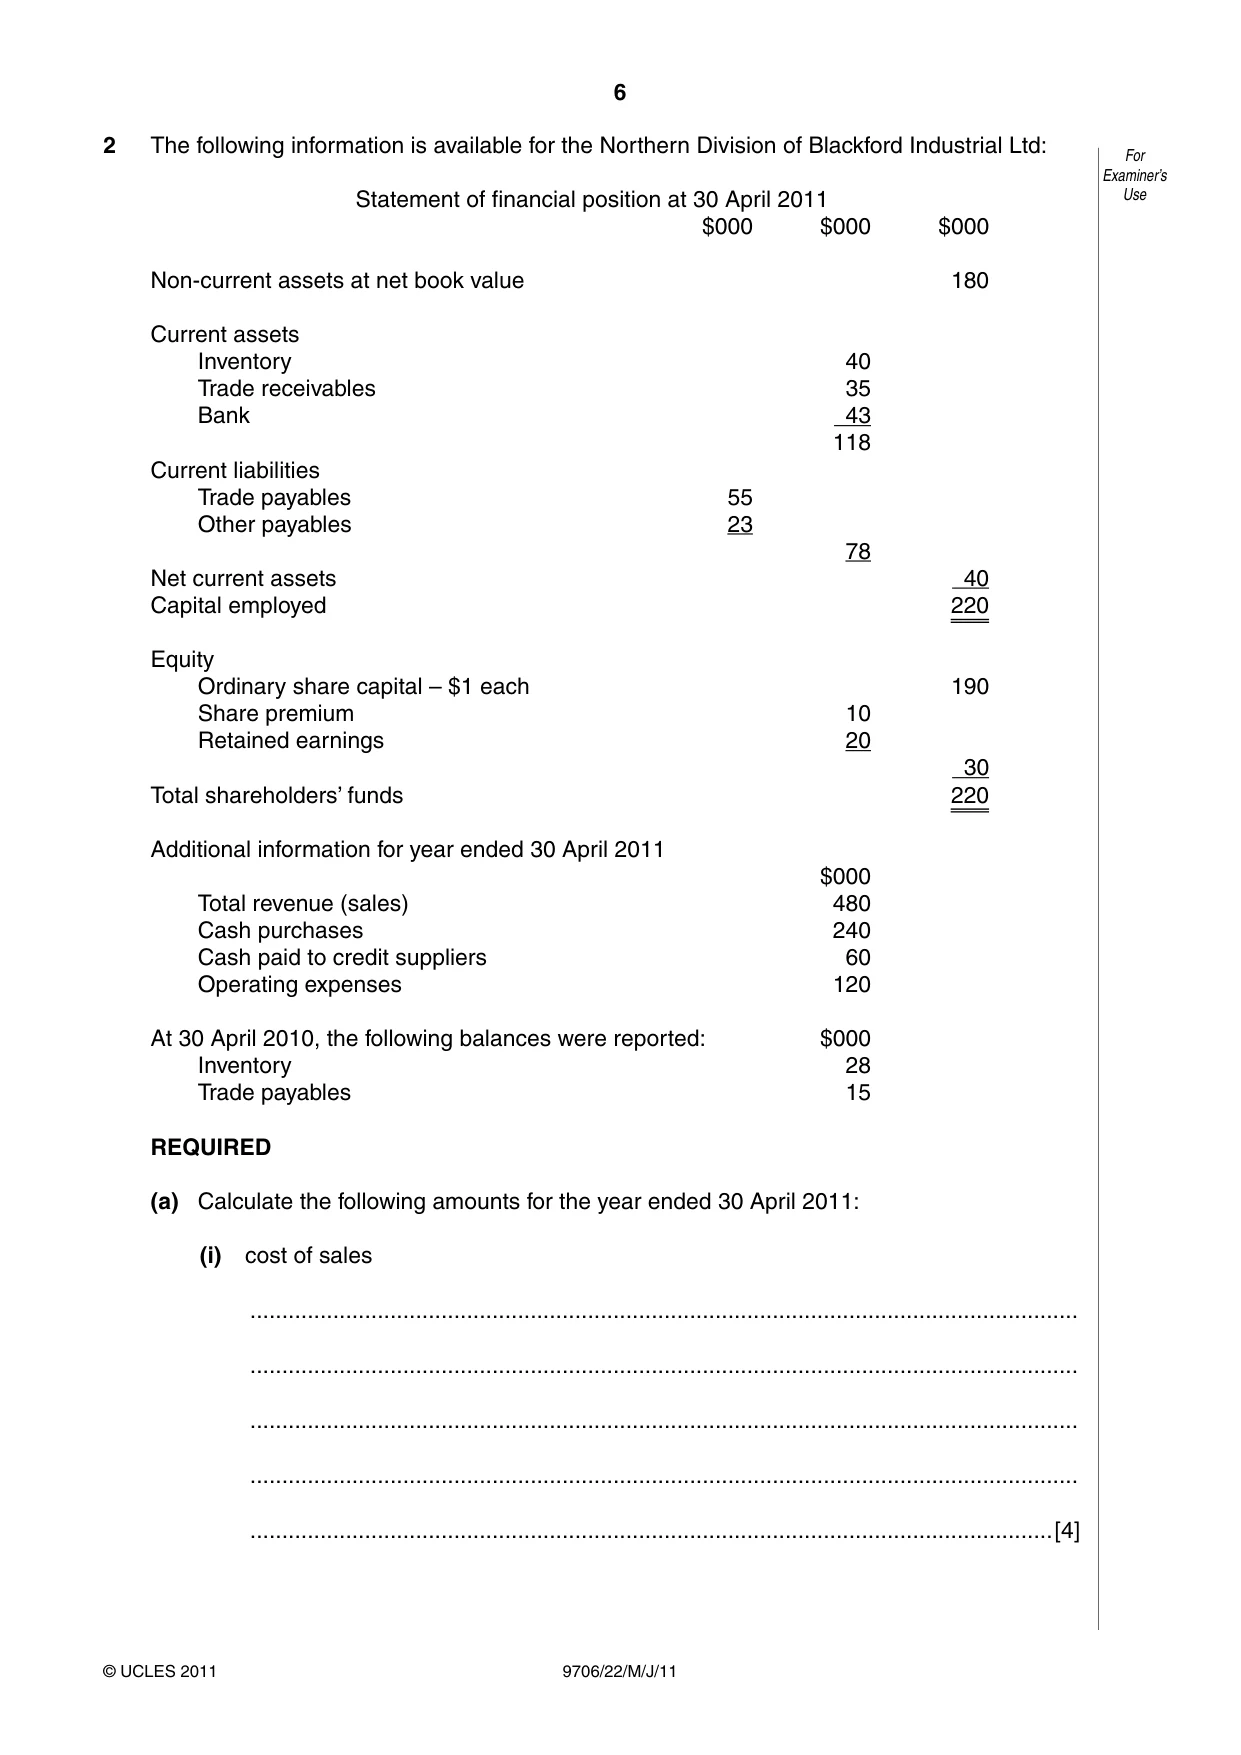
6 9706/22/M/J/11 © UCLES 2011 For Examiner’s Use 2 The following information is available for the Northern Division of Blackford Industrial Ltd: Statement of financial position at 30 April 2011 $000 $000 $000 Non-current assets at net book value 180 Current assets Inventory 40 Trade receivables 35 Bank 43 118 Current liabilities Trade payables 55 Other payables 23 78 Net current assets 40 Capital employed 220 Equity Ordinary share capital – $1 each 190 Share premium 10 Retained earnings 20 30 Total shareholders’ funds 220 Additional information for year ended 30 April 2011 $000 Total revenue (sales) 480 Cash purchases 240 Cash paid to credit suppliers 60 Operating expenses 120 At 30 April 2010, the following balances were reported: $000 Inventory 28 Trade payables 15 REQUIRED (a) Calculate the following amounts for the year ended 30 April 2011: (i) cost of sales … … … … …[4]
Question paper, page 7
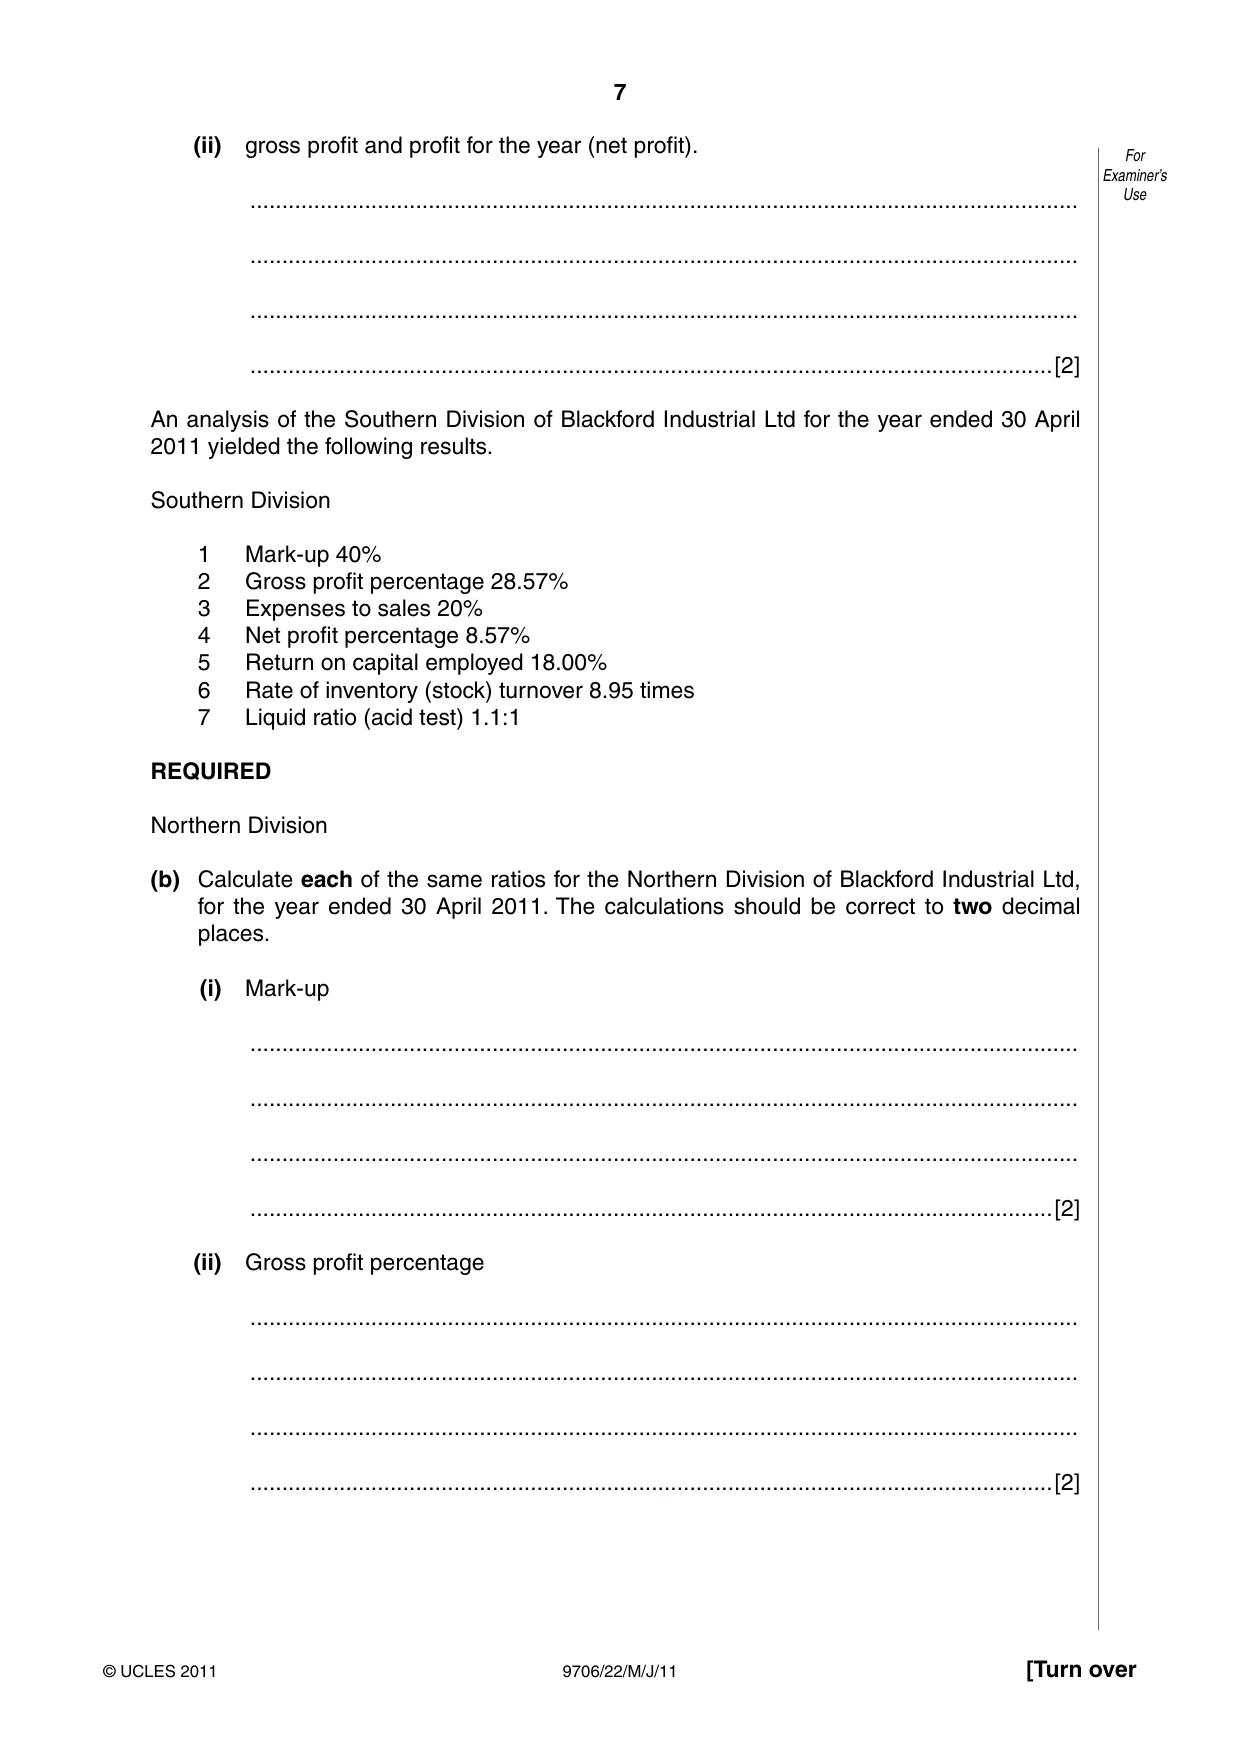
7 9706/22/M/J/11 © UCLES 2011 [Turn over For Examiner’s Use (ii) gross profit and profit for the year (net profit). … … … …[2] An analysis of the Southern Division of Blackford Industrial Ltd for the year ended 30 April 2011 yielded the following results. Southern Division 1 Mark-up 40% 2 Gross profit percentage 28.57% 3 Expenses to sales 20% 4 Net profit percentage 8.57% 5 Return on capital employed 18.00% 6 Rate of inventory (stock) turnover 8.95 times 7 Liquid ratio (acid test) 1.1:1 REQUIRED Northern Division (b) Calculate each of the same ratios for the Northern Division of Blackford Industrial Ltd, for the year ended 30 April 2011. The calculations should be correct to two decimal places. (i) Mark-up … … … …[2] (ii) Gross profit percentage … … … …[2]
Question paper, page 8
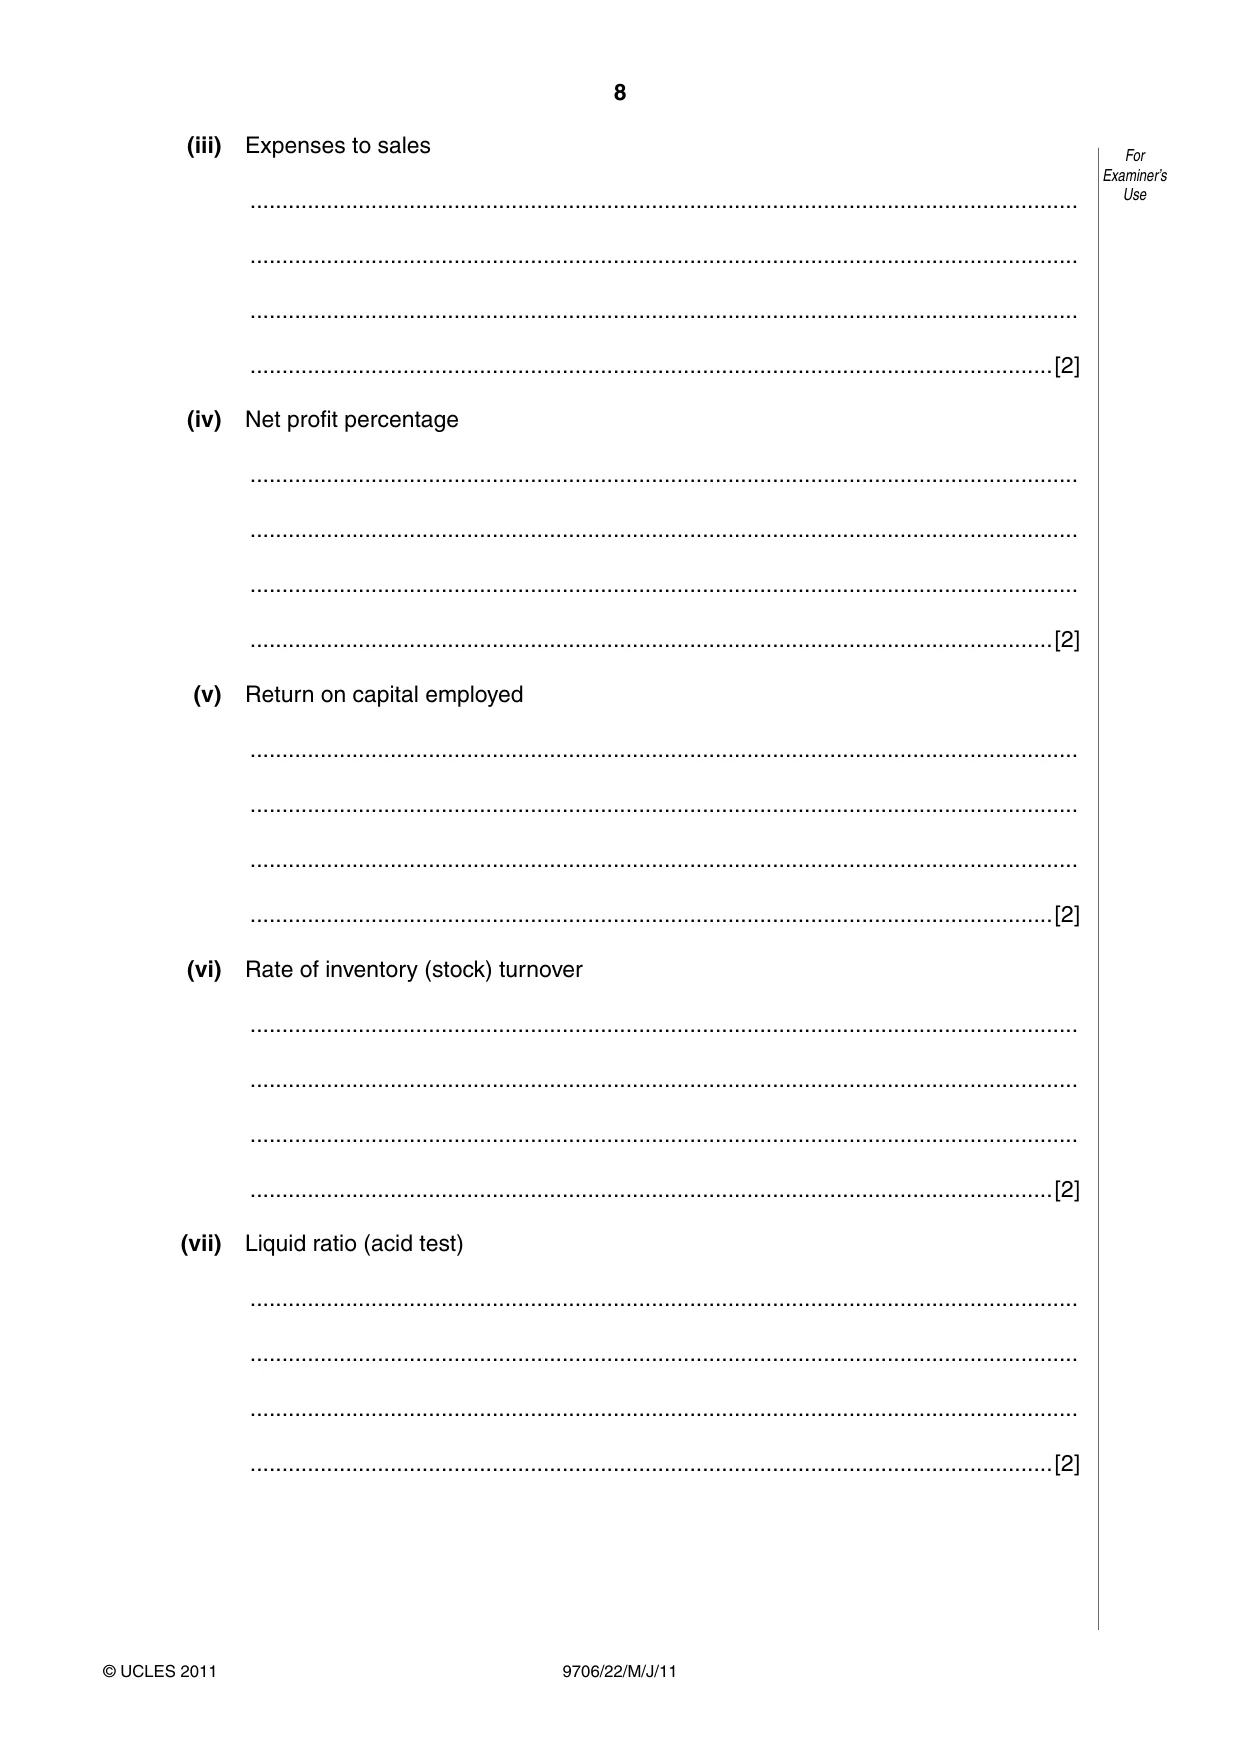
8 9706/22/M/J/11 © UCLES 2011 For Examiner’s Use (iii) Expenses to sales … … … …[2] (iv) Net profit percentage … … … …[2] (v) Return on capital employed … … … …[2] (vi) Rate of inventory (stock) turnover … … … …[2] (vii) Liquid ratio (acid test) … … … …[2]
Question paper, page 9
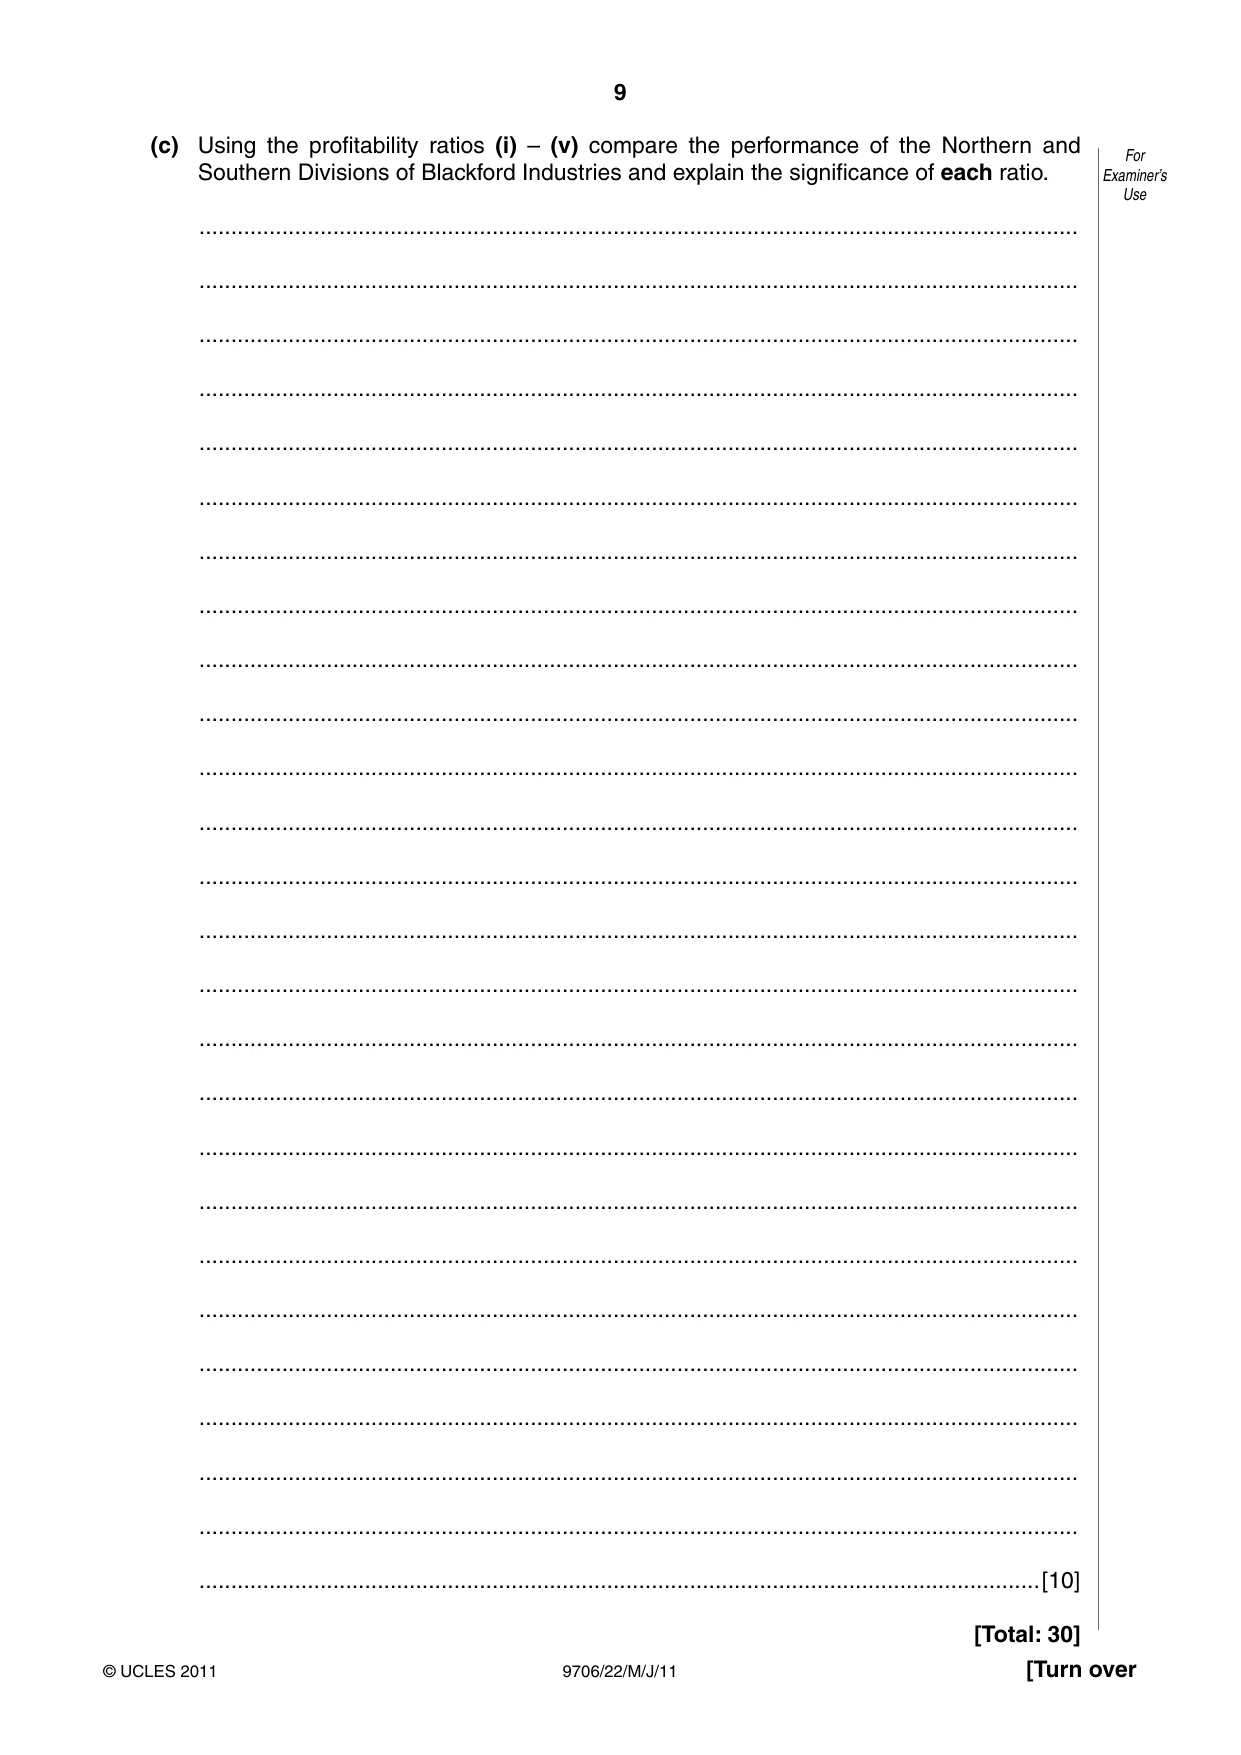
9 9706/22/M/J/11 © UCLES 2011 [Turn over For Examiner’s Use (c) Using the profitability ratios (i) – (v) compare the performance of the Northern and Southern Divisions of Blackford Industries and explain the significance of each ratio. … … … … … … … … … … … … … … … … … … … … … … … … … …[10] [Total: 30]
Question paper, page 10
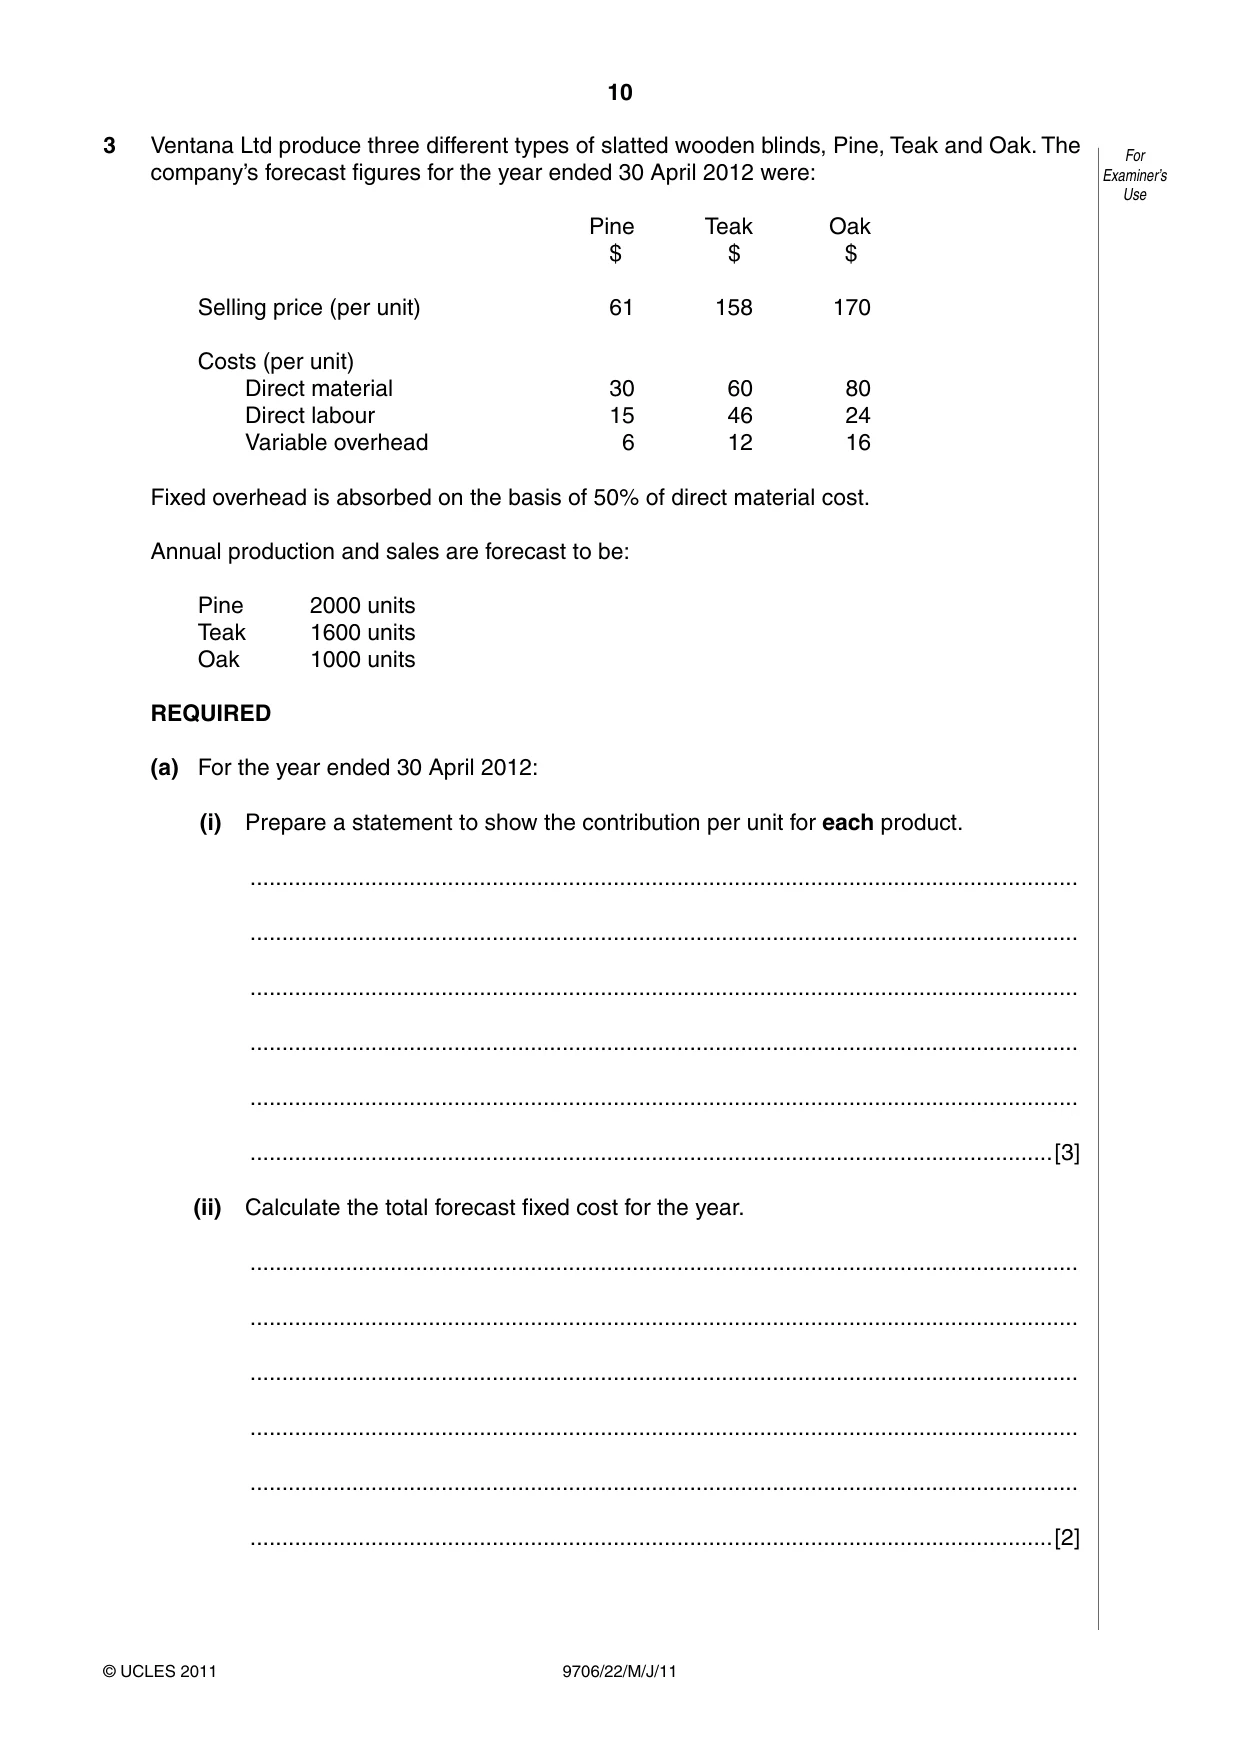
10 9706/22/M/J/11 © UCLES 2011 For Examiner’s Use 3 Ventana Ltd produce three different types of slatted wooden blinds, Pine, Teak and Oak. The company’s forecast figures for the year ended 30 April 2012 were: Pine Teak Oak $ $ $ Selling price (per unit) 61 158 170 Costs (per unit) Direct material 30 60 80 Direct labour 15 46 24 Variable overhead 6 12 16 Fixed overhead is absorbed on the basis of 50% of direct material cost. Annual production and sales are forecast to be: Pine 2000 units Teak 1600 units Oak 1000 units REQUIRED (a) For the year ended 30 April 2012: (i) Prepare a statement to show the contribution per unit for each product. … … … … … …[3] (ii) Calculate the total forecast fixed cost for the year. … … … … … …[2]
Question paper, page 11
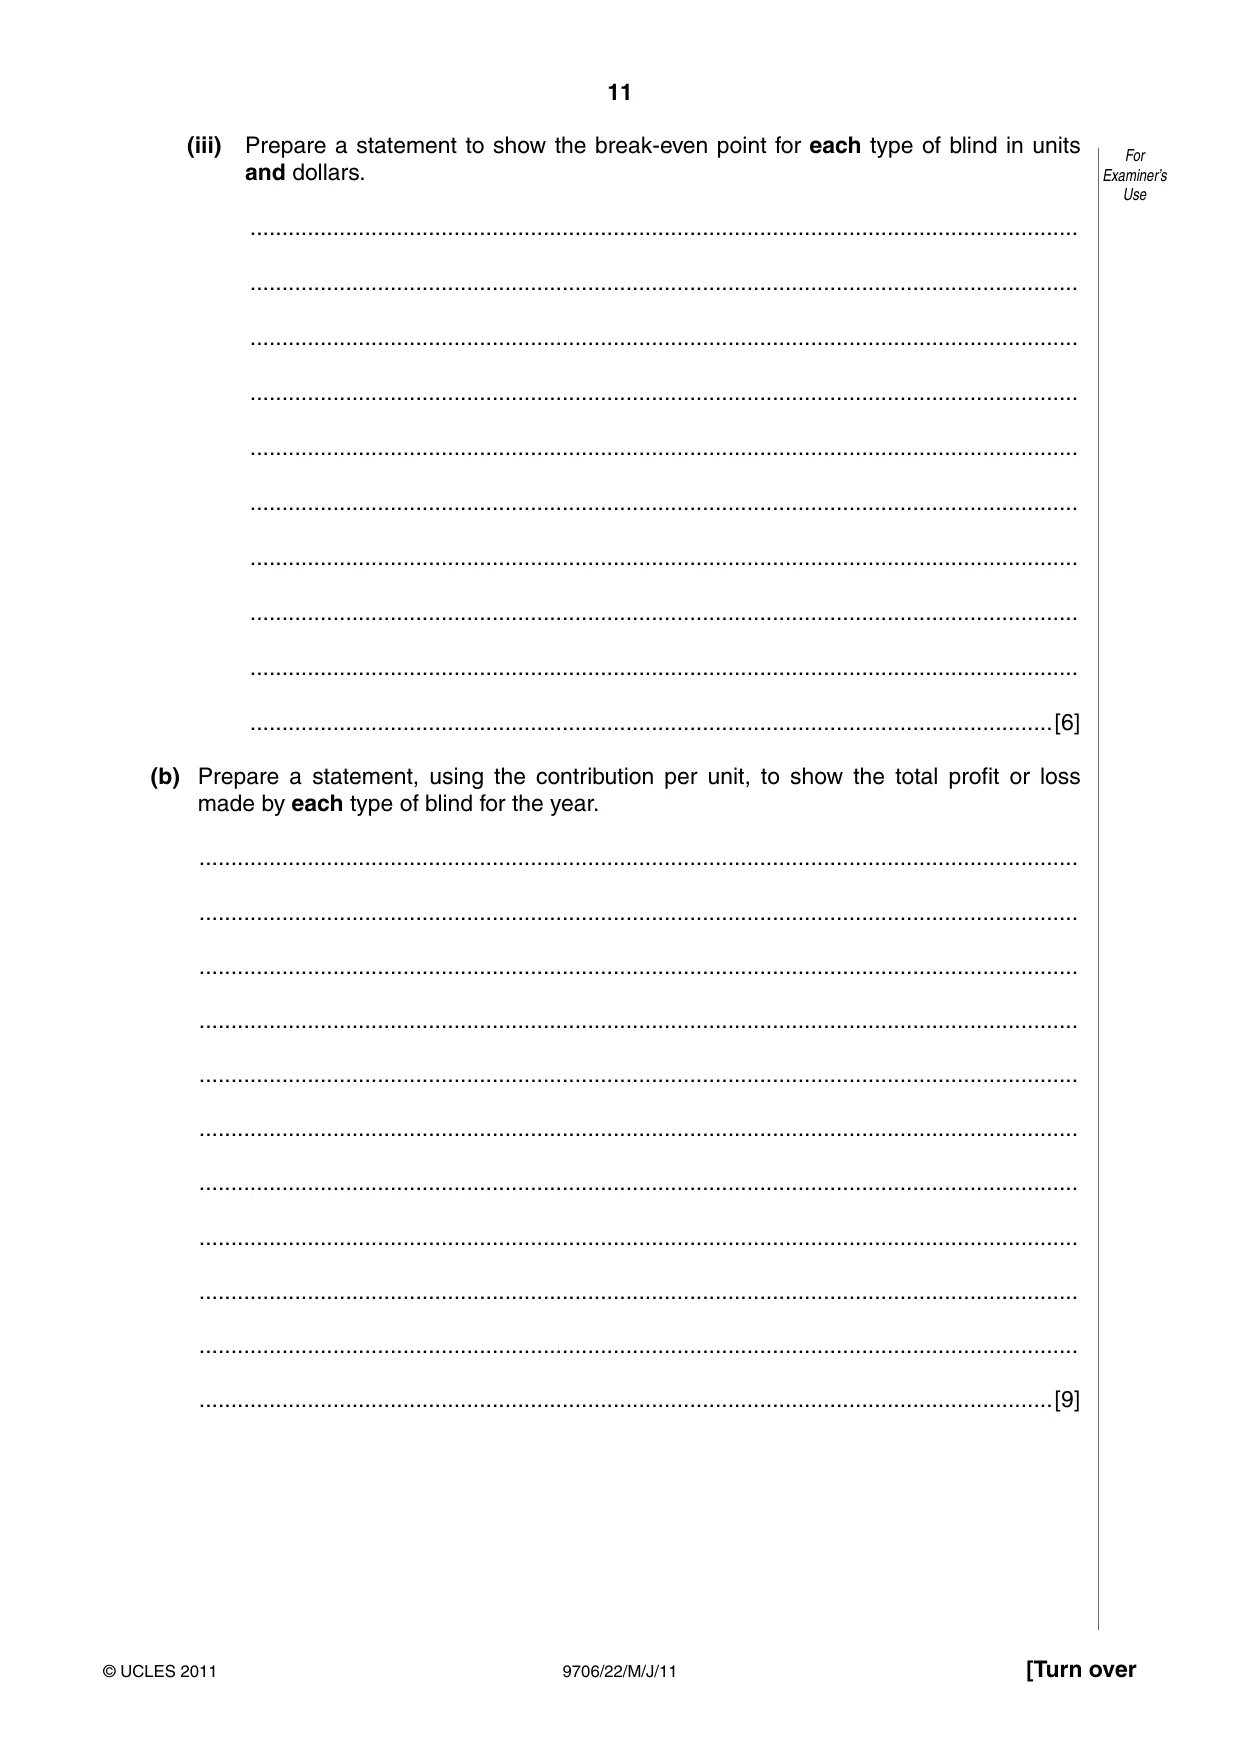
11 9706/22/M/J/11 © UCLES 2011 [Turn over For Examiner’s Use (iii) Prepare a statement to show the break-even point for each type of blind in units and dollars. … … … … … … … … … …[6] (b) Prepare a statement, using the contribution per unit, to show the total profit or loss made by each type of blind for the year. … … … … … … … … … … …[9]
Question paper, page 12
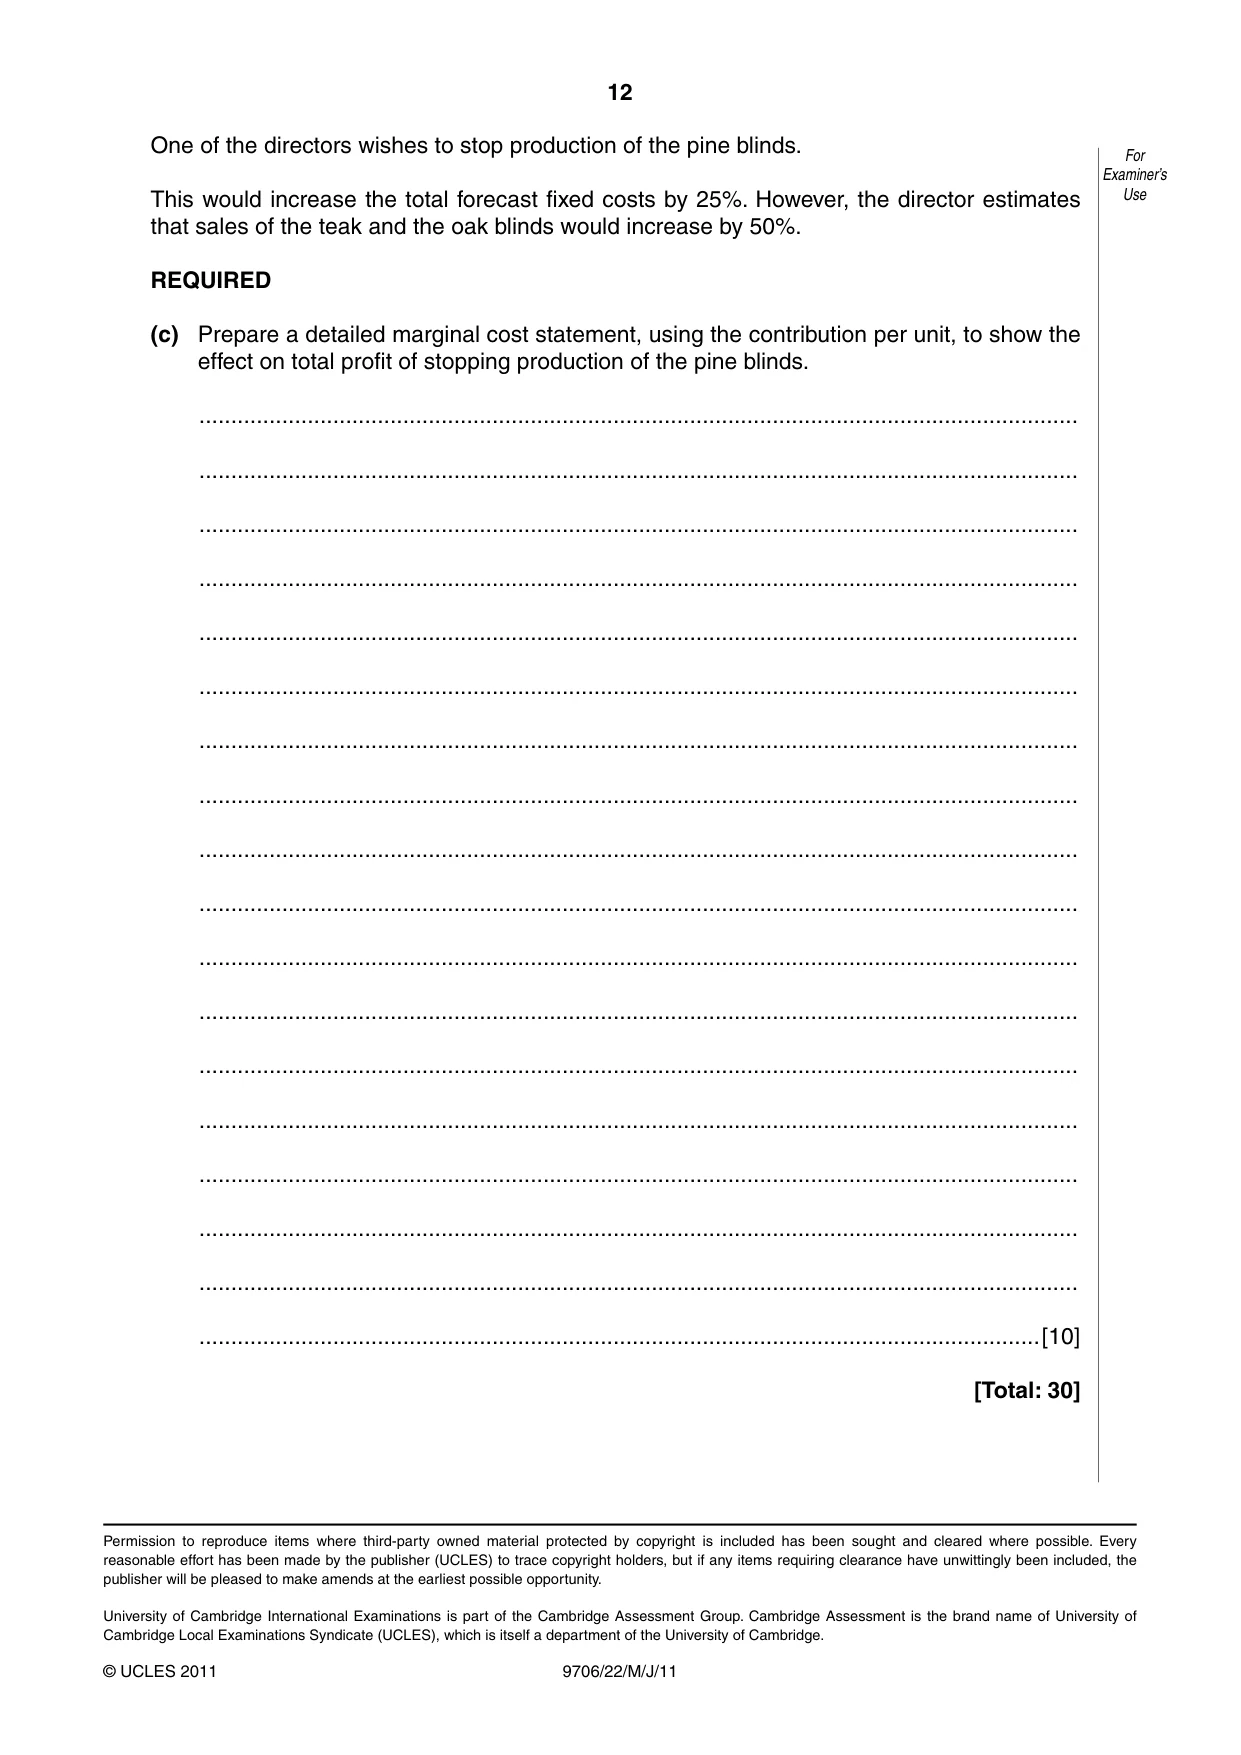
12 9706/22/M/J/11 © UCLES 2011 For Examiner’s Use One of the directors wishes to stop production of the pine blinds. This would increase the total forecast fixed costs by 25%. However, the director estimates that sales of the teak and the oak blinds would increase by 50%. REQUIRED (c) Prepare a detailed marginal cost statement, using the contribution per unit, to show the effect on total profit of stopping production of the pine blinds. … … … … … … … … … … … … … … … … … …[10] [Total: 30] Permission to reproduce items where third-party owned material protected by copyright is included has been sought and cleared where possible. Every reasonable effort has been made by the publisher (UCLES) to trace copyright holders, but if any items requiring clearance have unwittingly been included, the publisher will be pleased to make amends at the earliest possible opportunity. University of Cambridge International Examinations is part of the Cambridge Assessment Group. Cambridge Assessment is the brand name of University of Cambridge Local Examinations Syndicate (UCLES), which is itself a department of the University of Cambridge.
Mark scheme, page 1
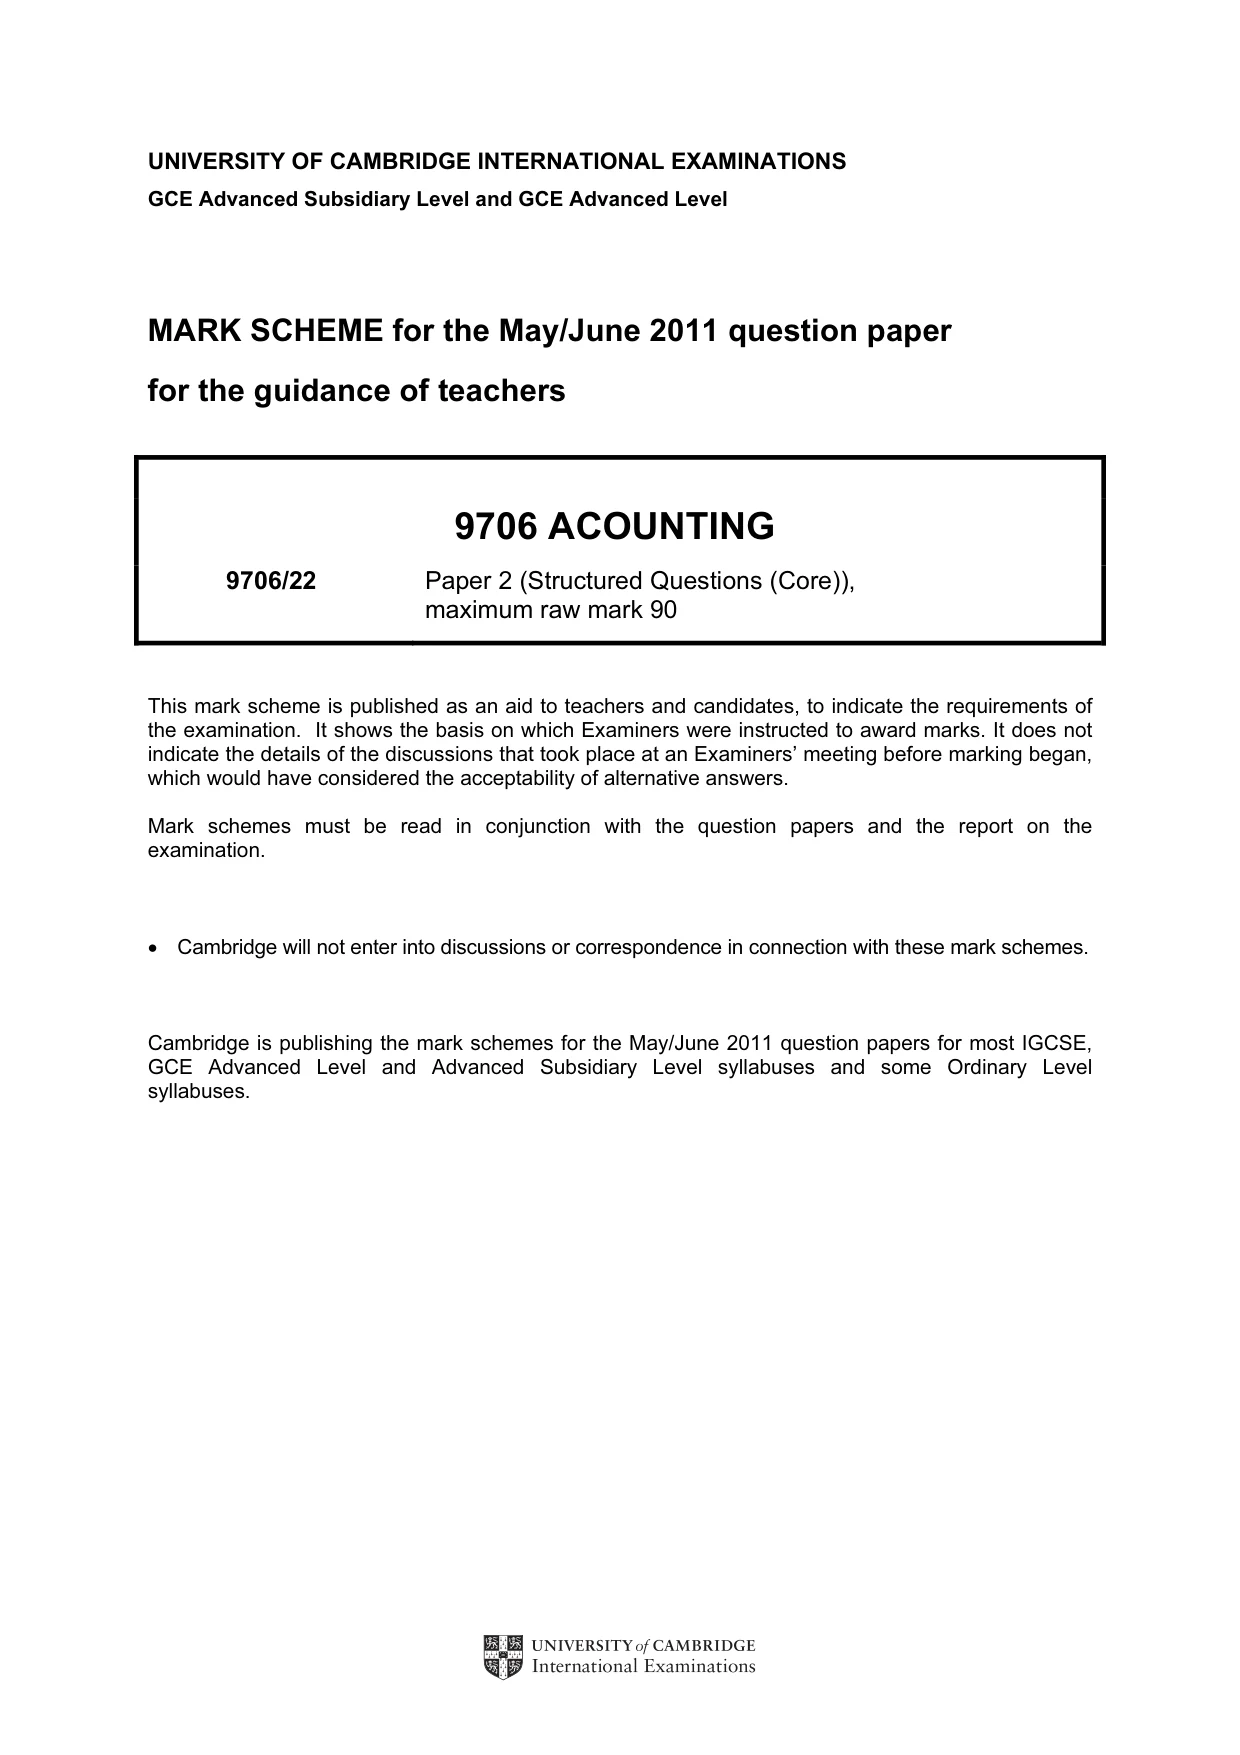
UNIVERSITY OF CAMBRIDGE INTERNATIONAL EXAMINATIONS GCE Advanced Subsidiary Level and GCE Advanced Level MARK SCHEME for the May/June 2011 question paper for the guidance of teachers 9706 ACOUNTING 9706/22 Paper 2 (Structured Questions (Core)), maximum raw mark 90 This mark scheme is published as an aid to teachers and candidates, to indicate the requirements of the examination. It shows the basis on which Examiners were instructed to award marks. It does not indicate the details of the discussions that took place at an Examiners’ meeting before marking began, which would have considered the acceptability of alternative answers. Mark schemes must be read in conjunction with the question papers and the report on the examination. • Cambridge will not enter into discussions or correspondence in connection with these mark schemes. Cambridge is publishing the mark schemes for the May/June 2011 question papers for most IGCSE, GCE Advanced Level and Advanced Subsidiary Level syllabuses and some Ordinary Level syllabuses.
Mark scheme, page 2
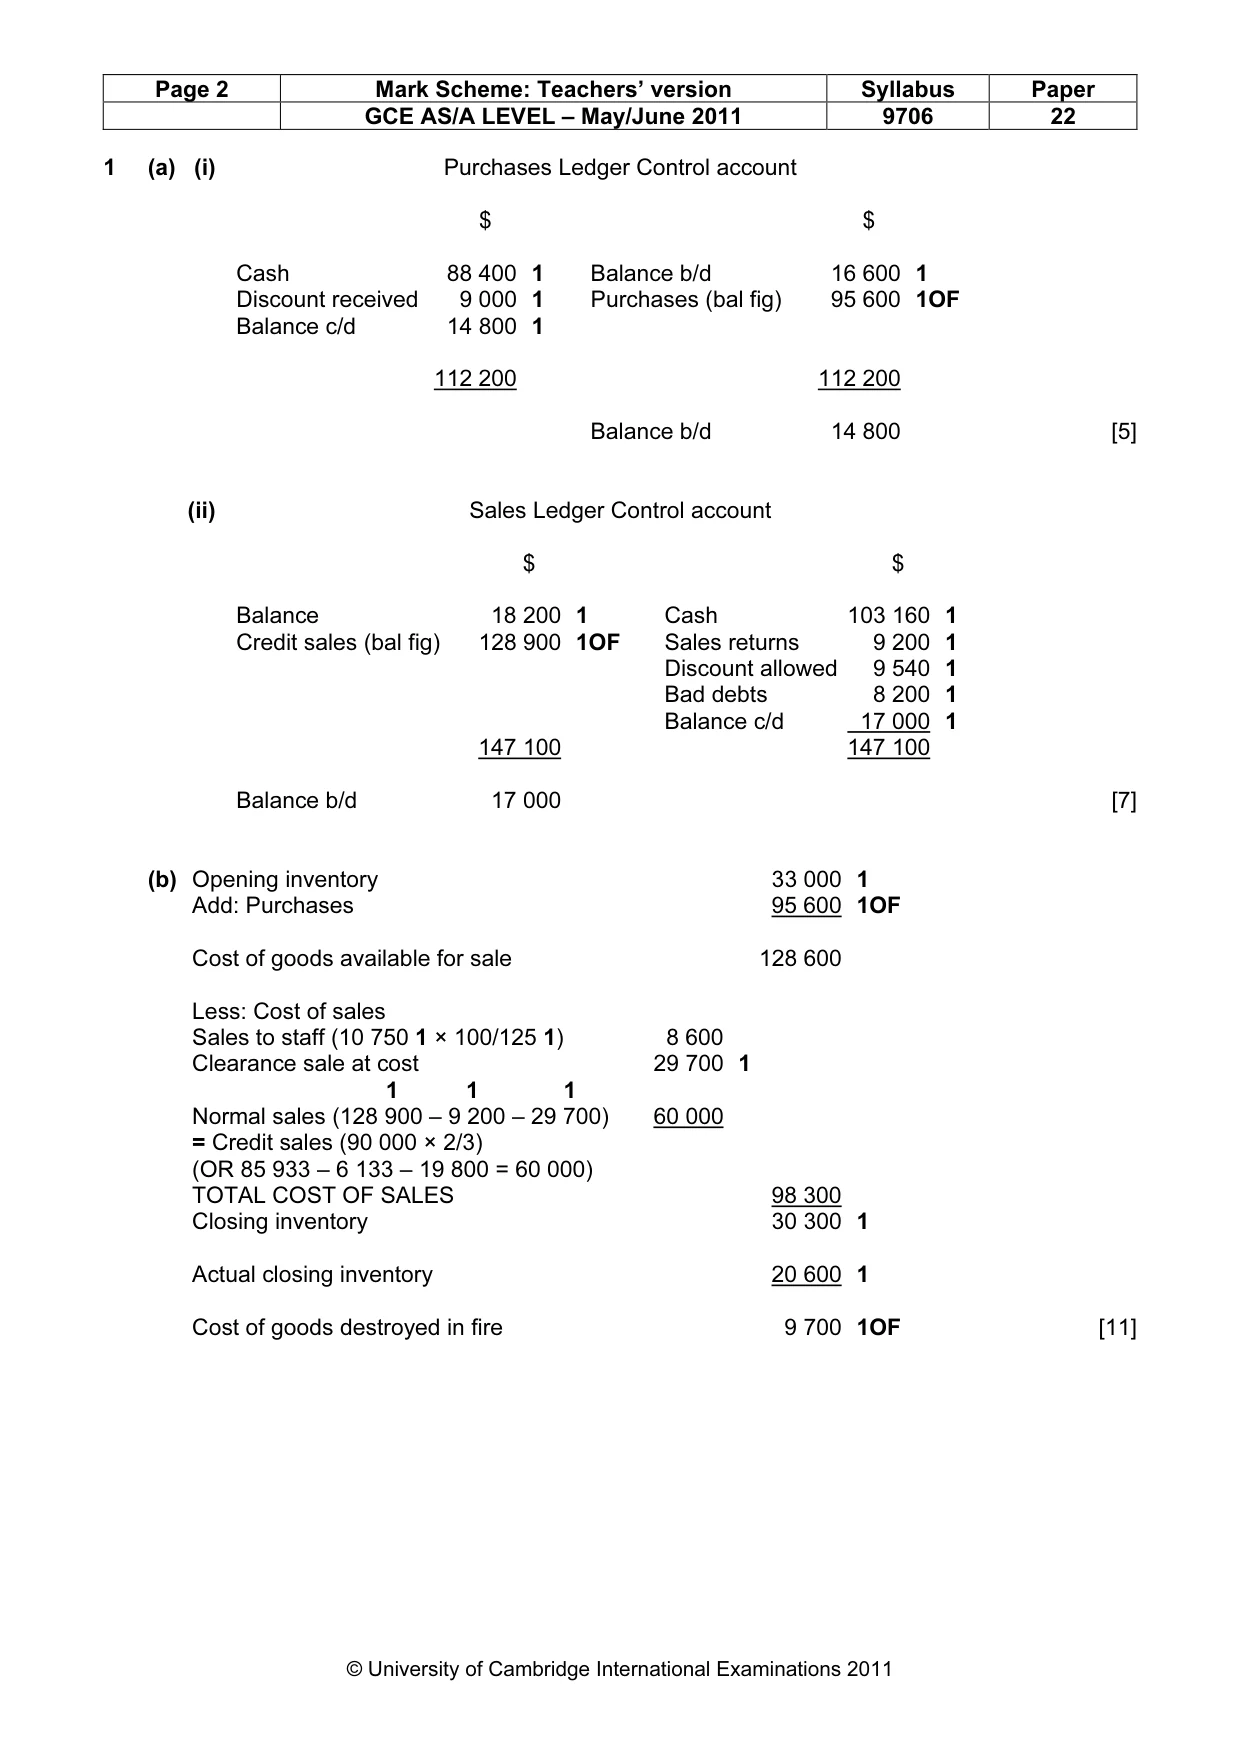
Page 2 Mark Scheme: Teachers’ version Syllabus Paper GCE AS/A LEVEL – May/June 2011 9706 22 © University of Cambridge International Examinations 2011 1 (a) (i) Purchases Ledger Control account $ $ Cash 88 400 1 Balance b/d 16 600 1 Discount received 9 000 1 Purchases (bal fig) 95 600 1OF Balance c/d 14 800 1 112 200 112 200 Balance b/d 14 800 [5] (ii) Sales Ledger Control account $ $ Balance 18 200 1 Cash 103 160 1 Credit sales (bal fig) 128 900 1OF Sales returns 9 200 1 Discount allowed 9 540 1 Bad debts 8 200 1 Balance c/d 17 000 1 147 100 147 100 Balance b/d 17 000 [7] (b) Opening inventory 33 000 1 Add: Purchases 95 600 1OF Cost of goods available for sale 128 600 Less: Cost of sales Sales to staff (10 750 1 × 100/125 1) 8 600 Clearance sale at cost 29 700 1 1 1 1 Normal sales (128 900 – 9 200 – 29 700) 60 000 = Credit sales (90 000 × 2/3) (OR 85 933 – 6 133 – 19 800 = 60 000) TOTAL COST OF SALES 98 300 Closing inventory 30 300 1 Actual closing inventory 20 600 1 Cost of goods destroyed in fire 9 700 1OF [11]
Mark scheme, page 3
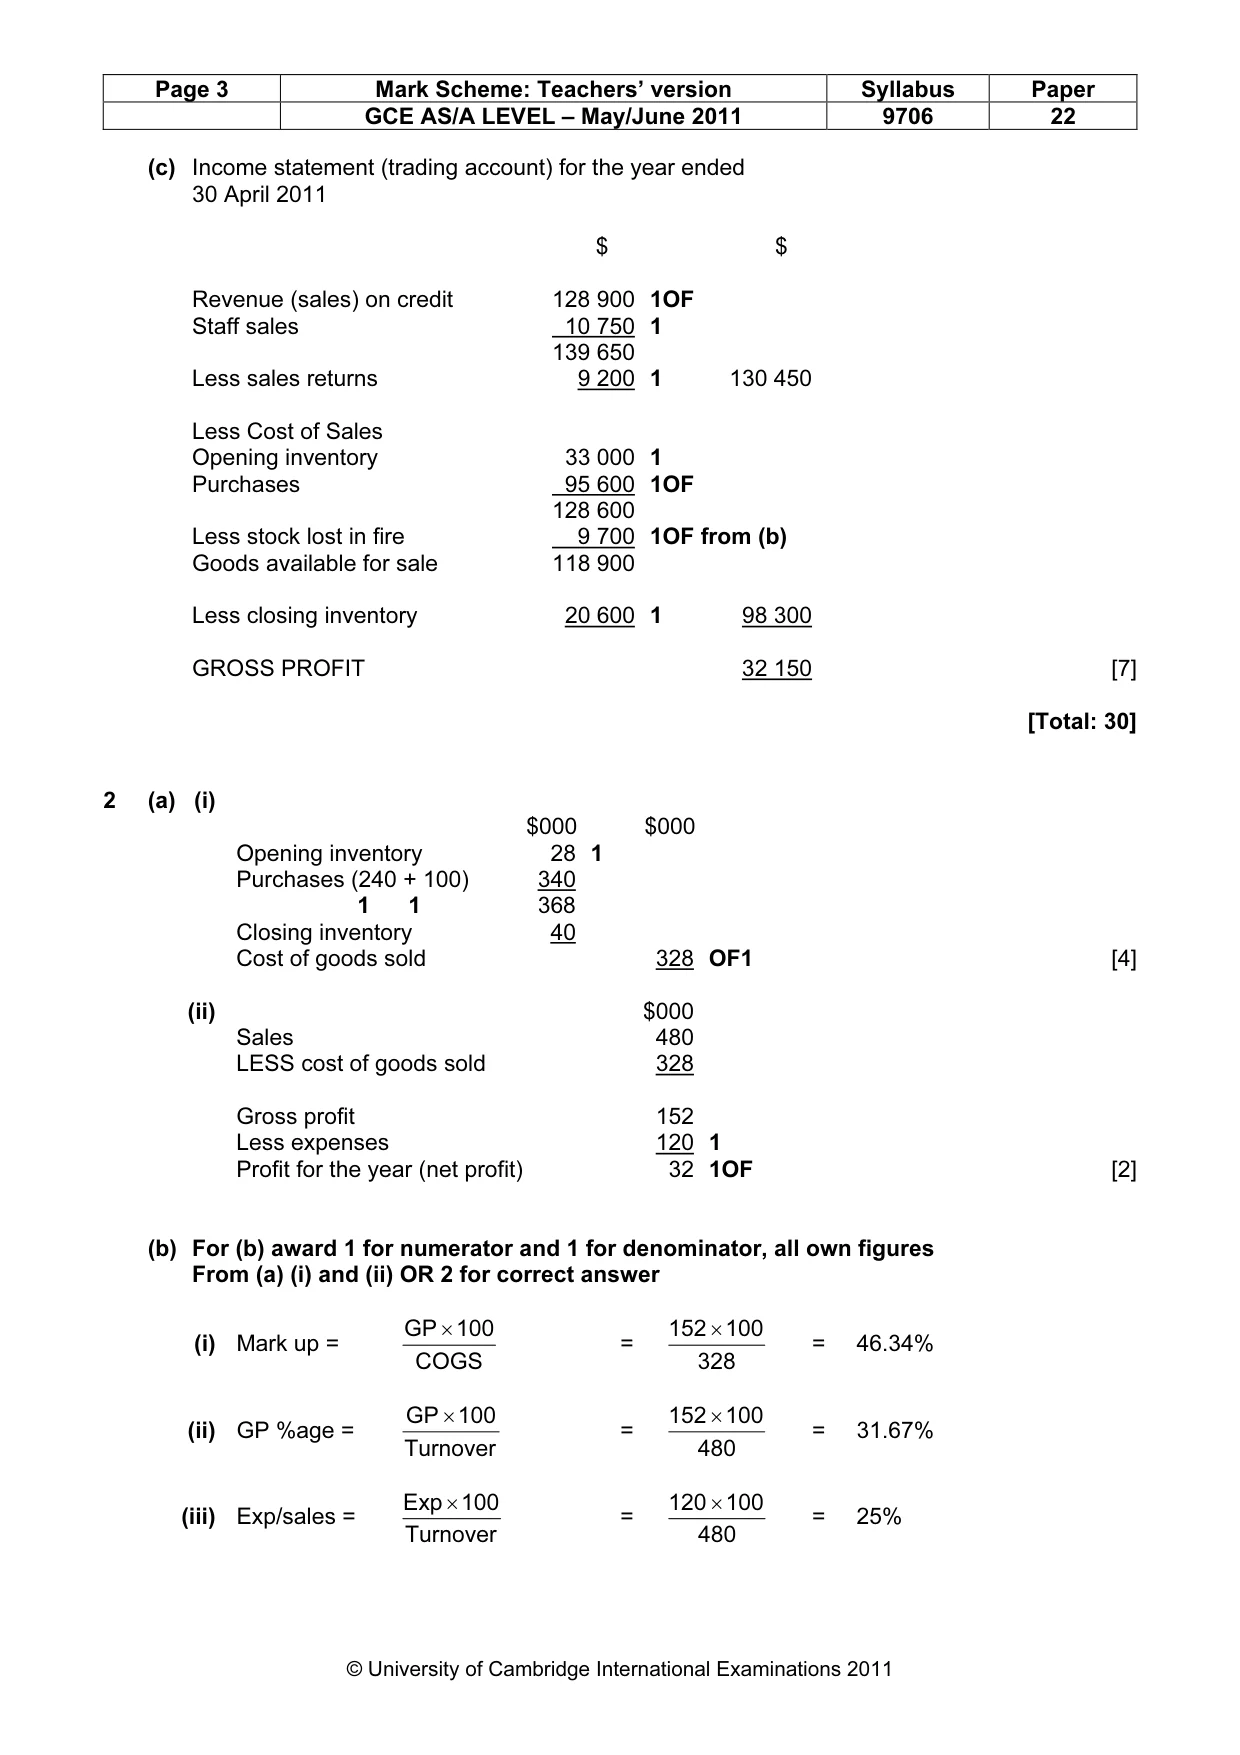
Page 3 Mark Scheme: Teachers’ version Syllabus Paper GCE AS/A LEVEL – May/June 2011 9706 22 © University of Cambridge International Examinations 2011 (c) Income statement (trading account) for the year ended 30 April 2011 $ $ Revenue (sales) on credit 128 900 1OF Staff sales 10 750 1 139 650 Less sales returns 9 200 1 130 450 Less Cost of Sales Opening inventory 33 000 1 Purchases 95 600 1OF 128 600 Less stock lost in fire 9 700 1OF from (b) Goods available for sale 118 900 Less closing inventory 20 600 1 98 300 GROSS PROFIT 32 150 [7] [Total: 30] 2 (a) (i) $000 $000 Opening inventory 28 1 Purchases (240 + 100) 340 1 1 368 Closing inventory 40 Cost of goods sold 328 OF1 [4] (ii) $000 Sales 480 LESS cost of goods sold 328 Gross profit 152 Less expenses 120 1 Profit for the year (net profit) 32 1OF [2] (b) For (b) award 1 for numerator and 1 for denominator, all own figures From (a) (i) and (ii) OR 2 for correct answer (i) Mark up = COGS 100 GP × = 328 100 152 × = 46.34% (ii) GP %age = Turnover 100 GP × = 480 100 152 × = 31.67% (iii) Exp/sales = Turnover 100 Exp× = 480 100 120 × = 25%
Mark scheme, page 4
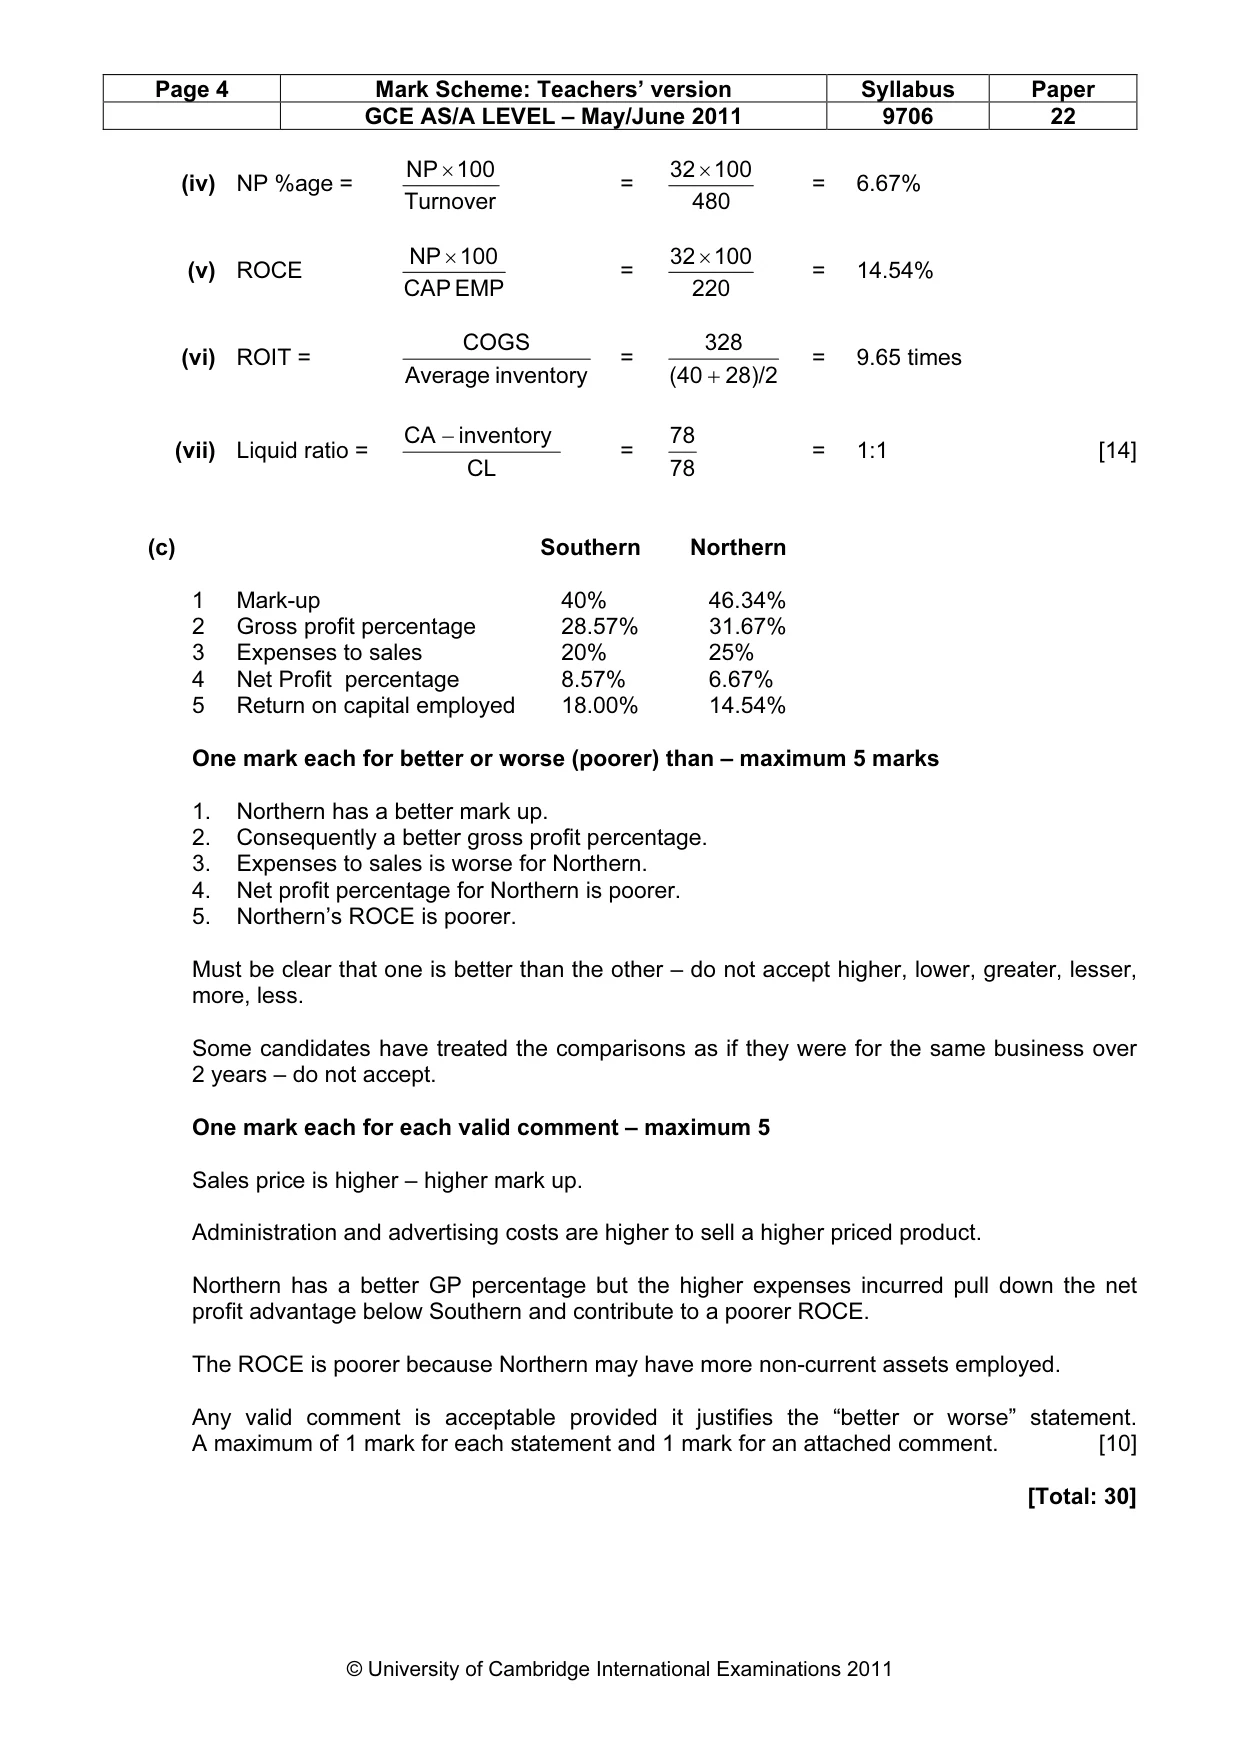
Page 4 Mark Scheme: Teachers’ version Syllabus Paper GCE AS/A LEVEL – May/June 2011 9706 22 © University of Cambridge International Examinations 2011 (iv) NP %age = Turnover 100 NP × = 480 100 32 × = 6.67% (v) ROCE EMP CAP 100 NP × = 220 100 32 × = 14.54% (vi) ROIT = inventory Average COGS = 28)/2 (40 328 + = 9.65 times (vii) Liquid ratio = CL inventory CA − = 78 78 = 1:1 [14] (c) Southern Northern 1 Mark-up 40% 46.34% 2 Gross profit percentage 28.57% 31.67% 3 Expenses to sales 20% 25% 4 Net Profit percentage 8.57% 6.67% 5 Return on capital employed 18.00% 14.54% One mark each for better or worse (poorer) than – maximum 5 marks 1. Northern has a better mark up. 2. Consequently a better gross profit percentage. 3. Expenses to sales is worse for Northern. 4. Net profit percentage for Northern is poorer. 5. Northern’s ROCE is poorer. Must be clear that one is better than the other – do not accept higher, lower, greater, lesser, more, less. Some candidates have treated the comparisons as if they were for the same business over 2 years – do not accept. One mark each for each valid comment – maximum 5 Sales price is higher – higher mark up. Administration and advertising costs are higher to sell a higher priced product. Northern has a better GP percentage but the higher expenses incurred pull down the net profit advantage below Southern and contribute to a poorer ROCE. The ROCE is poorer because Northern may have more non-current assets employed. Any valid comment is acceptable provided it justifies the “better or worse” statement. A maximum of 1 mark for each statement and 1 mark for an attached comment. [10] [Total: 30]
Mark scheme, page 5
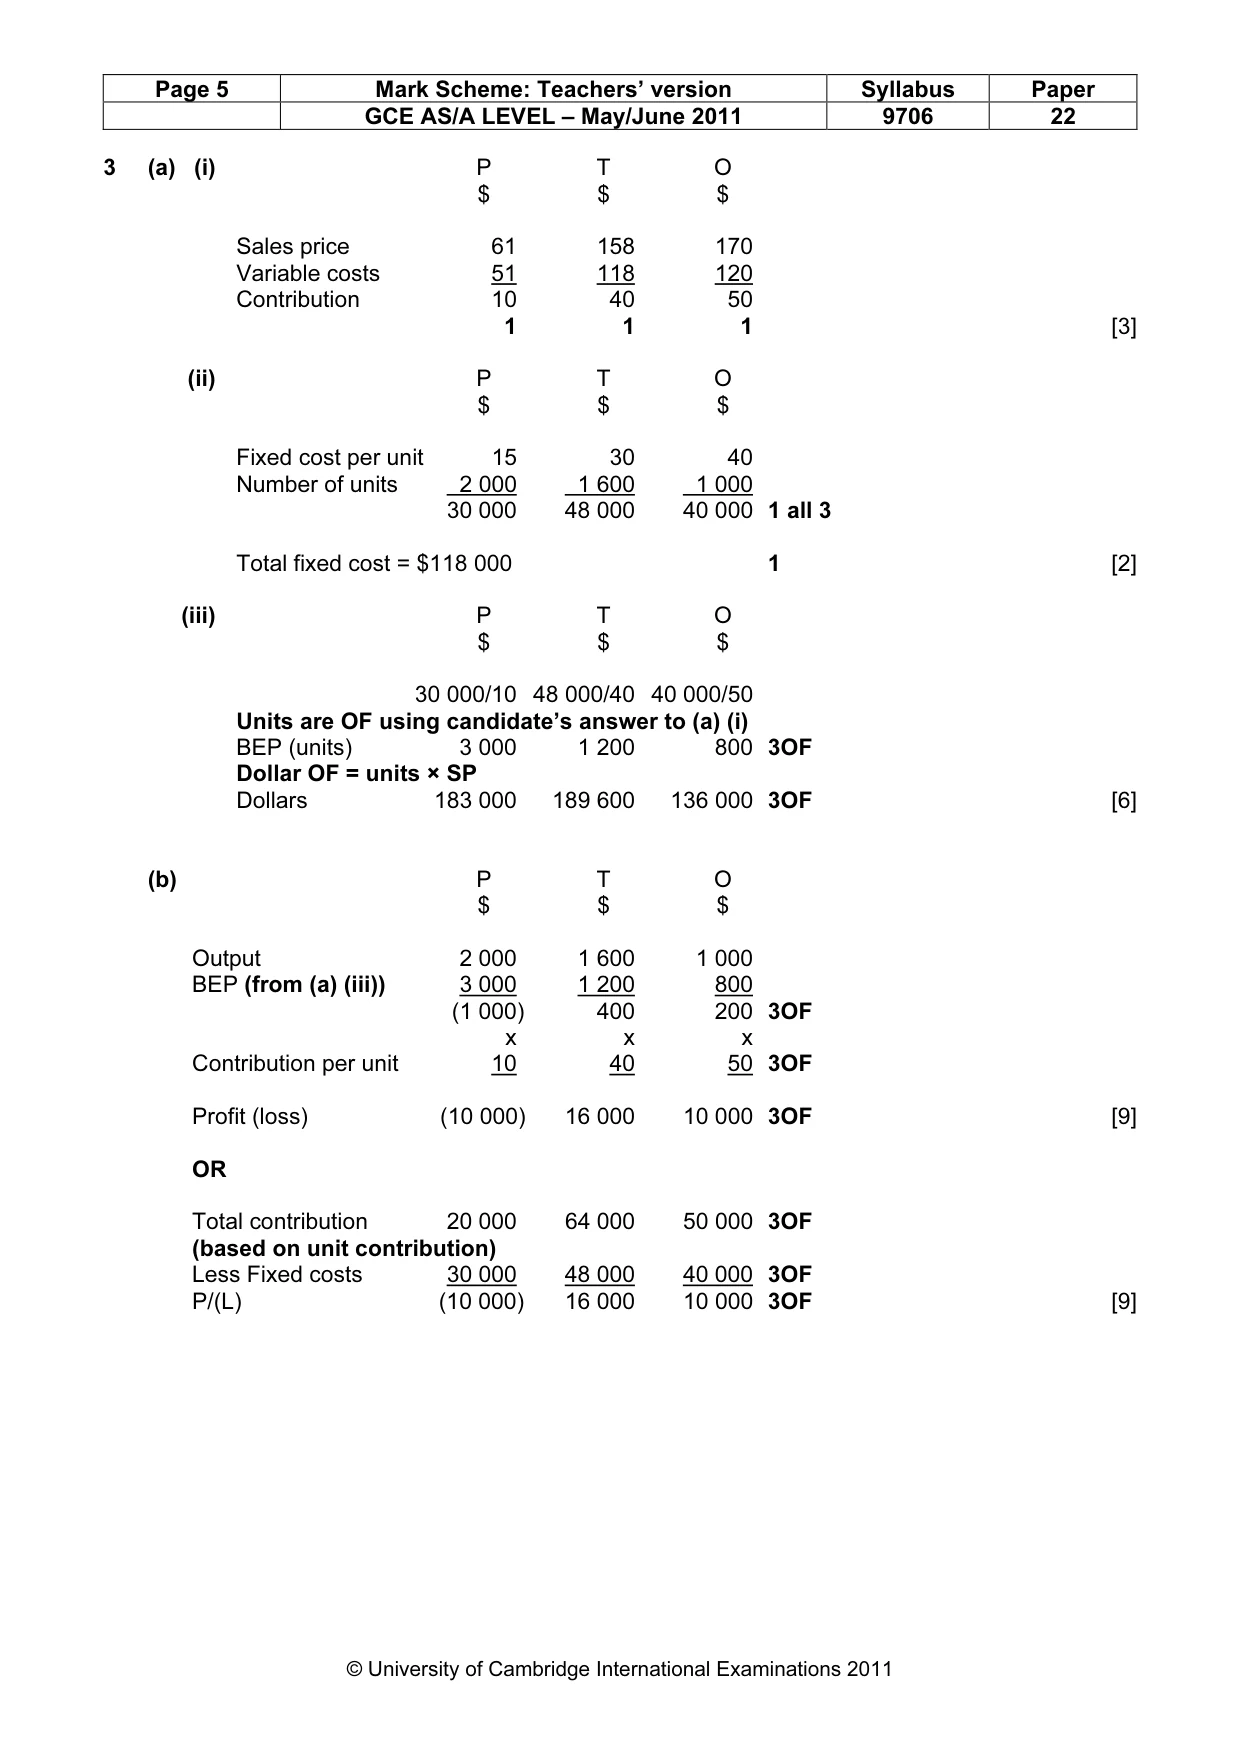
Page 5 Mark Scheme: Teachers’ version Syllabus Paper GCE AS/A LEVEL – May/June 2011 9706 22 © University of Cambridge International Examinations 2011 3 (a) (i) P T O $ $ $ Sales price 61 158 170 Variable costs 51 118 120 Contribution 10 40 50 1 1 1 [3] (ii) P T O $ $ $ Fixed cost per unit 15 30 40 Number of units 2 000 1 600 1 000 30 000 48 000 40 000 1 all 3 Total fixed cost = $118 000 1 [2] (iii) P T O $ $ $ 30 000/10 48 000/40 40 000/50 Units are OF using candidate’s answer to (a) (i) BEP (units) 3 000 1 200 800 3OF Dollar OF = units × SP Dollars 183 000 189 600 136 000 3OF [6] (b) P T O $ $ $ Output 2 000 1 600 1 000 BEP (from (a) (iii)) 3 000 1 200 800 (1 000) 400 200 3OF x x x Contribution per unit 10 40 50 3OF Profit (loss) (10 000) 16 000 10 000 3OF [9] OR Total contribution 20 000 64 000 50 000 3OF (based on unit contribution) Less Fixed costs 30 000 48 000 40 000 3OF P/(L) (10 000) 16 000 10 000 3OF [9]
Mark scheme, page 6
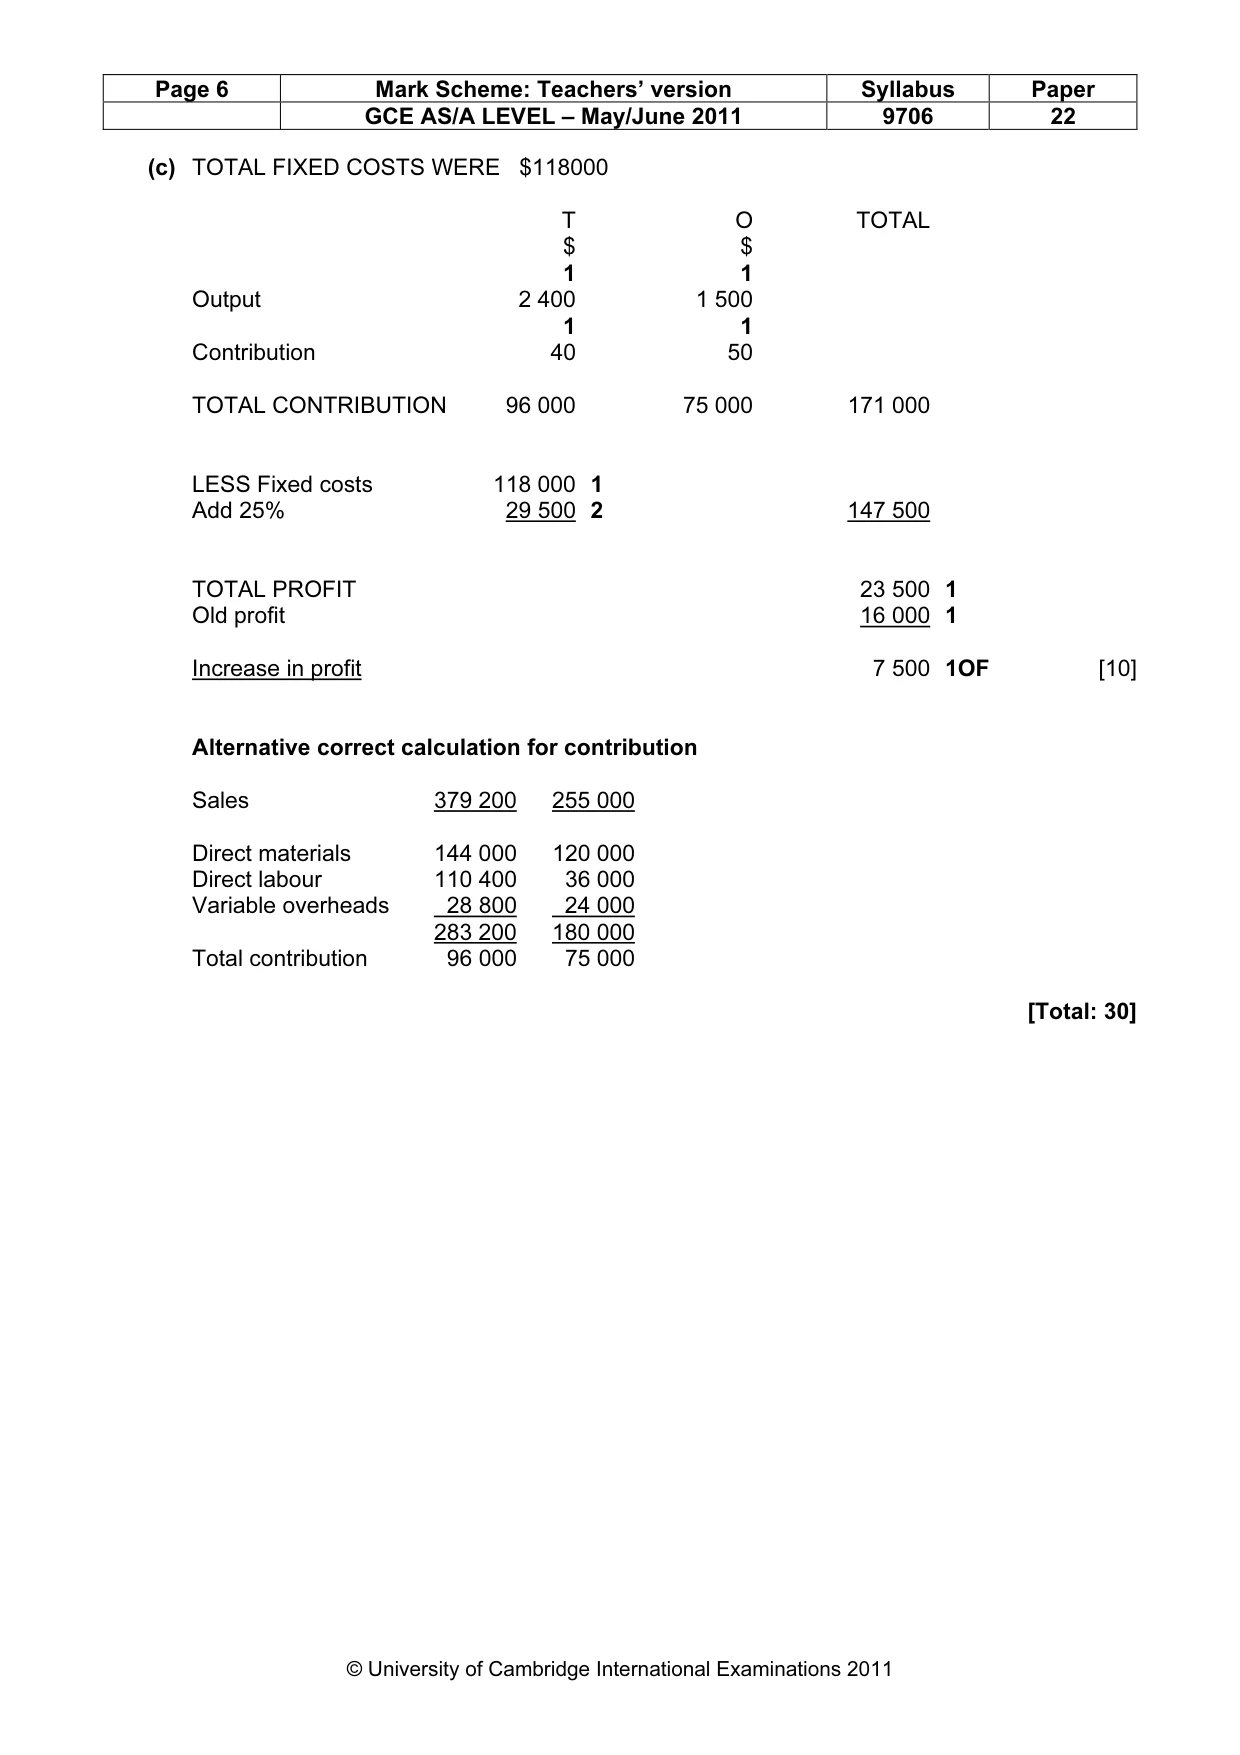
Page 6 Mark Scheme: Teachers’ version Syllabus Paper GCE AS/A LEVEL – May/June 2011 9706 22 © University of Cambridge International Examinations 2011 (c) TOTAL FIXED COSTS WERE $118000 T O TOTAL $ $ 1 1 Output 2 400 1 500 1 1 Contribution 40 50 TOTAL CONTRIBUTION 96 000 75 000 171 000 LESS Fixed costs 118 000 1 Add 25% 29 500 2 147 500 TOTAL PROFIT 23 500 1 Old profit 16 000 1 Increase in profit 7 500 1OF [10] Alternative correct calculation for contribution Sales 379 200 255 000 Direct materials 144 000 120 000 Direct labour 110 400 36 000 Variable overheads 28 800 24 000 283 200 180 000 Total contribution 96 000 75 000 [Total: 30]
What you needed in this session
Cambridge’s own grade thresholds for 2011 May/June, Paper 2 · Variant 2. A higher threshold means an easier paper — the bar moves with how the cohort did.