Cambridge A Level Accounting 9706 — 2010 May/June Paper 2 · Variant 2
9706/22/M/J/10 · 90 marks · ≈101 min
The question paper and its mark scheme, free to read here and free to download. This is Cambridge’s own paper, exactly as it was sat.
Question paper12 pages
Mark scheme7 pages
Answers below. Sit the paper first if you are practising.
Paper as text
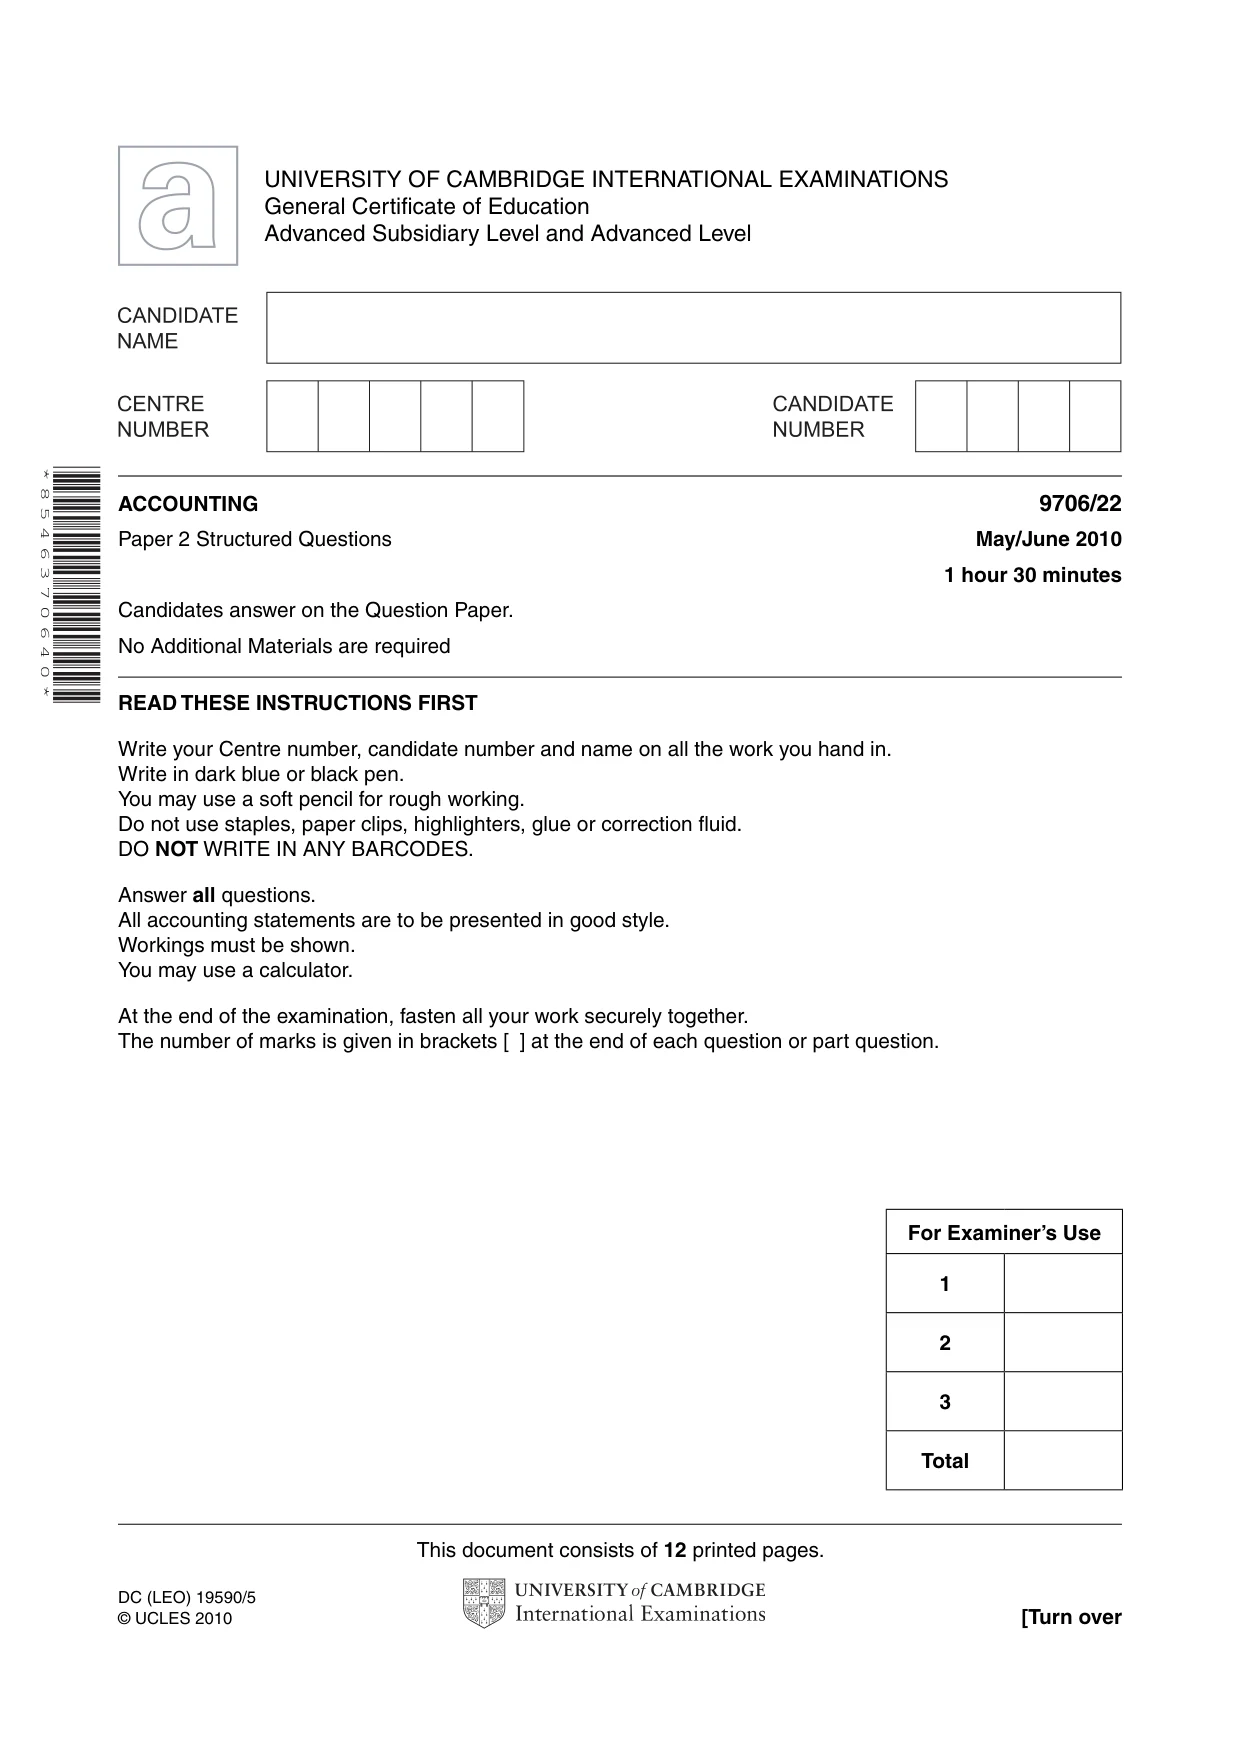
Question paper, page 1
This document consists of 12 printed pages. DC (LEO) 19590/5 © UCLES 2010 [Turn over UNIVERSITY OF CAMBRIDGE INTERNATIONAL EXAMINATIONS General Certificate of Education Advanced Subsidiary Level and Advanced Level * 8 5 4 6 3 7 0 6 4 0 * ACCOUNTING 9706/22 Paper 2 Structured Questions May/June 2010 1 hour 30 minutes Candidates answer on the Question Paper. No Additional Materials are required READ THESE INSTRUCTIONS FIRST Write your Centre number, candidate number and name on all the work you hand in. Write in dark blue or black pen. You may use a soft pencil for rough working. Do not use staples, paper clips, highlighters, glue or correction fluid. DO NOT WRITE IN ANY BARCODES. Answer all questions. All accounting statements are to be presented in good style. Workings must be shown. You may use a calculator. At the end of the examination, fasten all your work securely together. The number of marks is given in brackets [ ] at the end of each question or part question. For Examiner’s Use 1 2 3 Total
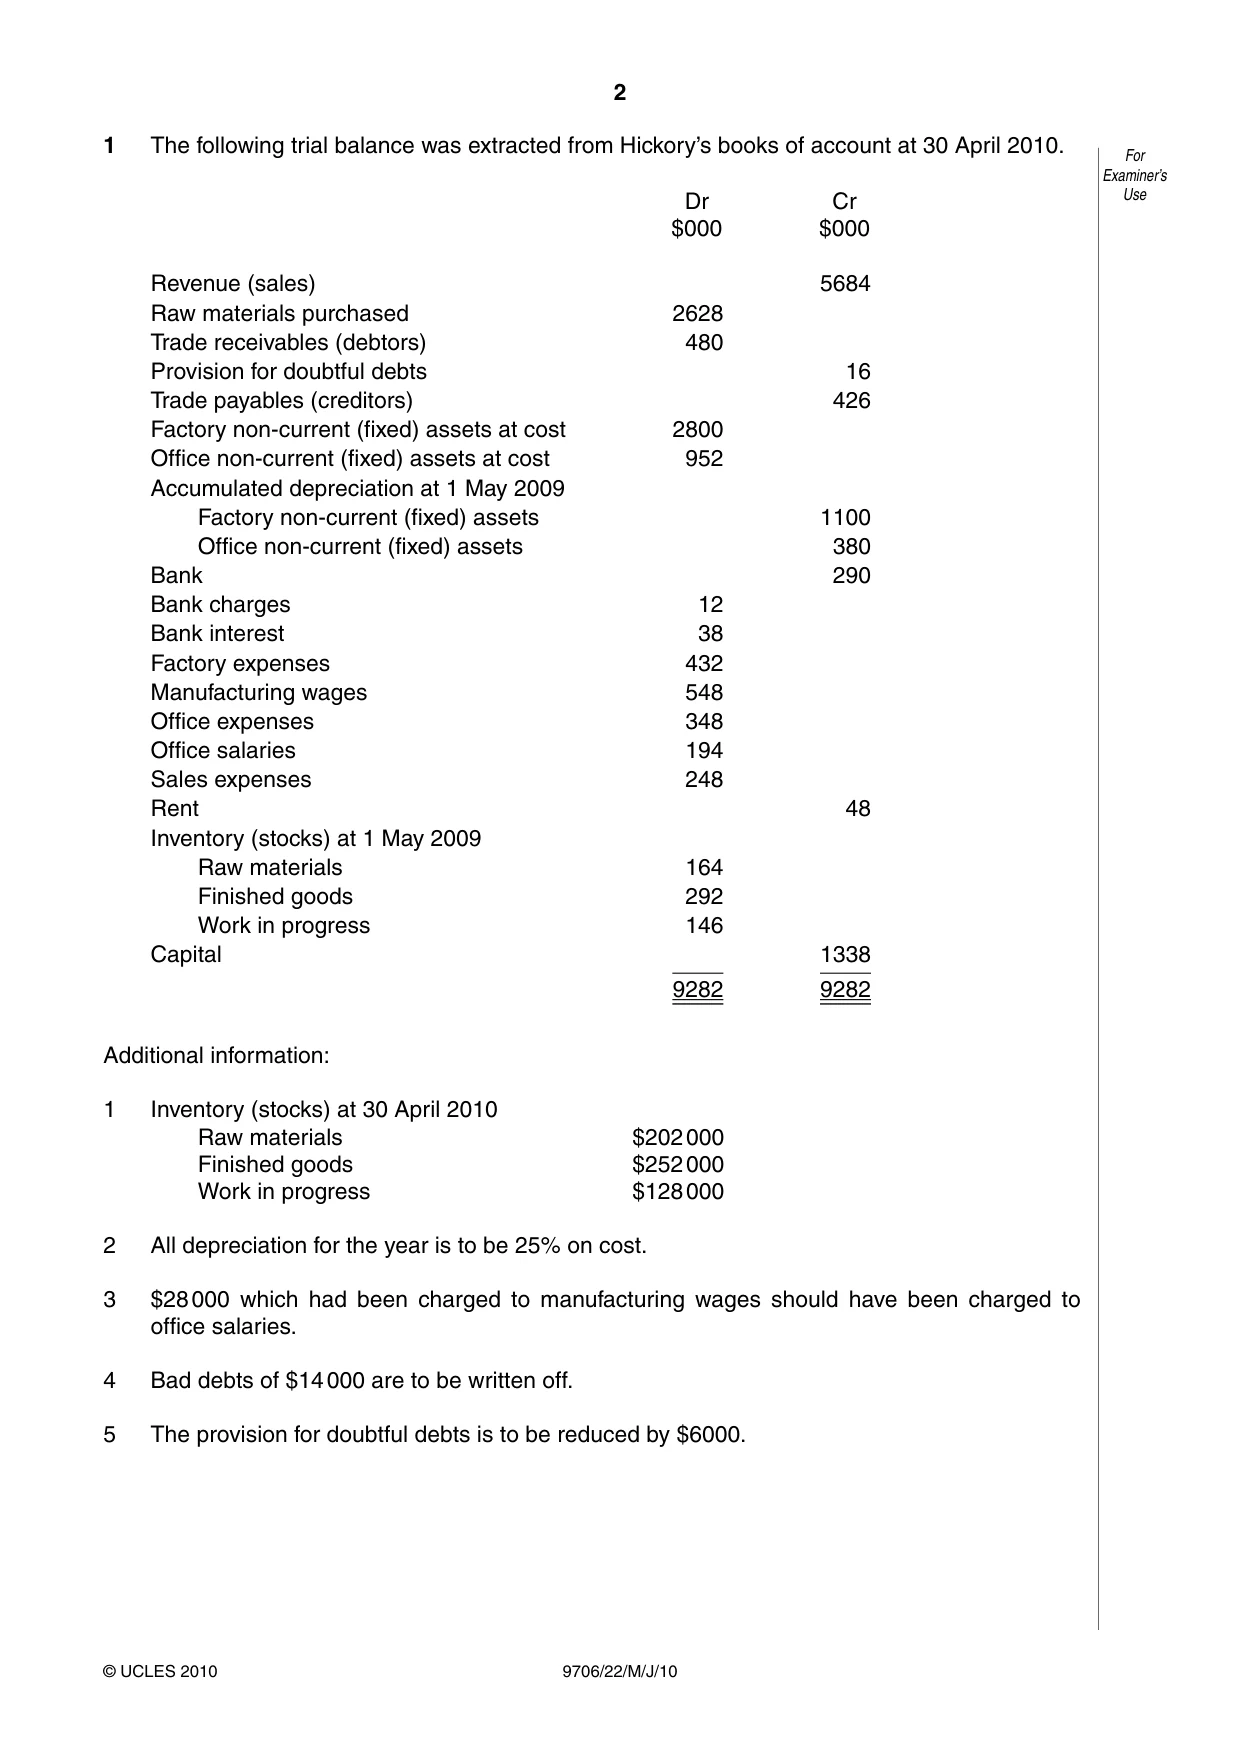
Question paper, page 2
2 9706/22/M/J/10 © UCLES 2010 For Examiner’s Use 1 The following trial balance was extracted from Hickory’s books of account at 30 April 2010. Dr $000 Cr $000 Revenue (sales) 5684 Raw materials purchased 2628 Trade receivables (debtors) 480 Provision for doubtful debts 16 Trade payables (creditors) 426 Factory non-current (fixed) assets at cost 2800 Office non-current (fixed) assets at cost 952 Accumulated depreciation at 1 May 2009 Factory non-current (fixed) assets 1100 Office non-current (fixed) assets 380 Bank 290 Bank charges 12 Bank interest 38 Factory expenses 432 Manufacturing wages 548 Office expenses 348 Office salaries 194 Sales expenses 248 Rent 48 Inventory (stocks) at 1 May 2009 Raw materials 164 Finished goods 292 Work in progress 146 Capital 1338 9282 9282 Additional information: 1 Inventory (stocks) at 30 April 2010 Raw materials $202 000 Finished goods $252 000 Work in progress $128 000 2 All depreciation for the year is to be 25% on cost. 3 $28 000 which had been charged to manufacturing wages should have been charged to office salaries. 4 Bad debts of $14 000 are to be written off. 5 The provision for doubtful debts is to be reduced by $6000.
Question paper, page 3
3 9706/22/M/J/10 © UCLES 2010 [Turn over For Examiner’s Use REQUIRED (a) Prepare Hickory’s manufacturing account for the year ended 30 April 2010. … … … … … … … … … … … … … … … … … … … … … … … … … …[8]
Question paper, page 4
4 9706/22/M/J/10 © UCLES 2010 For Examiner’s Use (b) Prepare Hickory’s income statement (trading and profit and loss account) for the year ended 30 April 2010. … … … … … … … … … … … … … … … … … … … … … … … … … …[11]
Question paper, page 5
5 9706/22/M/J/10 © UCLES 2010 [Turn over For Examiner’s Use (c) Prepare Hickory’s balance sheet at 30 April 2010. … … … … … … … … … … … … … … … … … … … … … … … … … …[11] [Total: 30]
Question paper, page 6
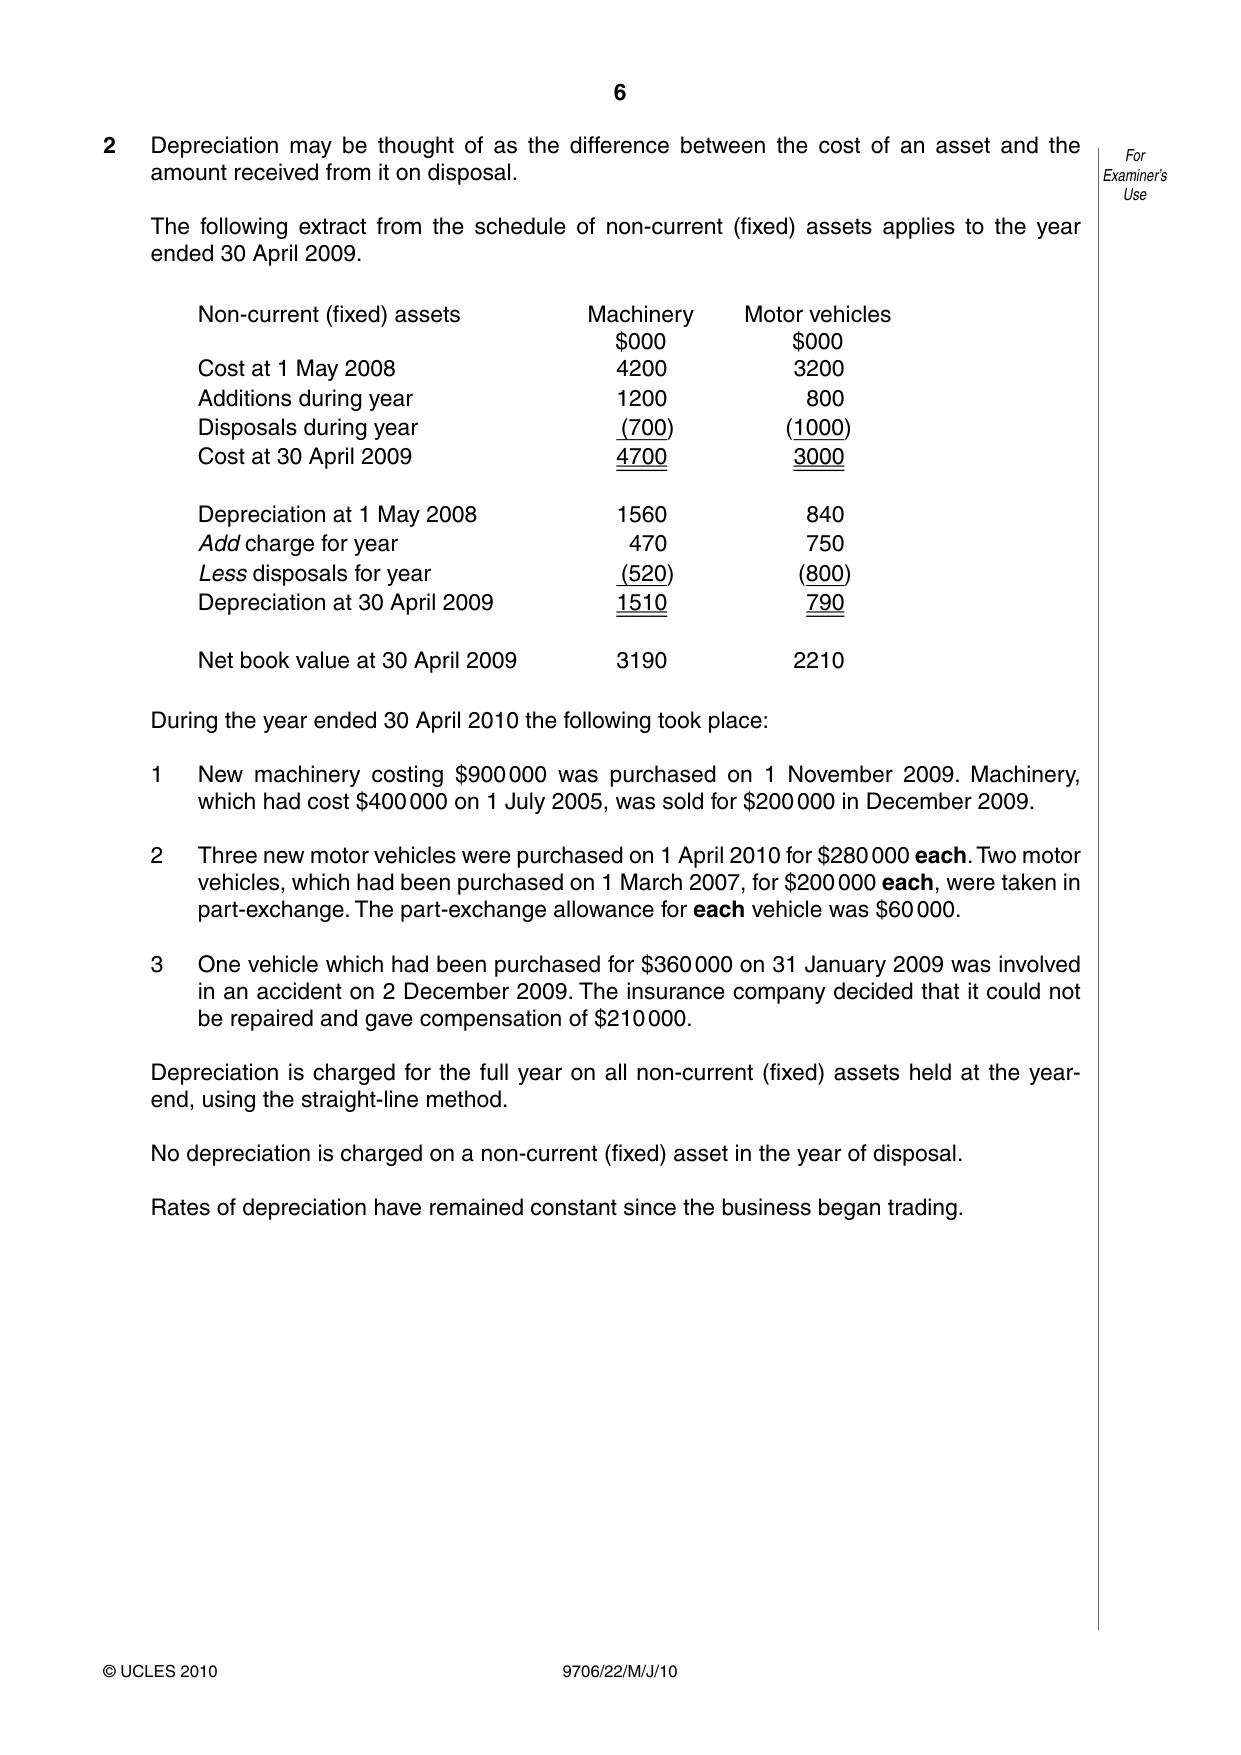
6 9706/22/M/J/10 © UCLES 2010 For Examiner’s Use 2 Depreciation may be thought of as the difference between the cost of an asset and the amount received from it on disposal. The following extract from the schedule of non-current (fixed) assets applies to the year ended 30 April 2009. Non-current (fixed) assets Machinery $000 Motor vehicles $000 Cost at 1 May 2008 4200 3200 Additions during year 1200 800 Disposals during year (700) (1000) Cost at 30 April 2009 4700 3000 Depreciation at 1 May 2008 1560 840 Add charge for year 470 750 Less disposals for year (520) (800) Depreciation at 30 April 2009 1510 790 Net book value at 30 April 2009 3190 2210 During the year ended 30 April 2010 the following took place: 1 New machinery costing $900 000 was purchased on 1 November 2009. Machinery, which had cost $400 000 on 1 July 2005, was sold for $200 000 in December 2009. 2 Three new motor vehicles were purchased on 1 April 2010 for $280 000 each. Two motor vehicles, which had been purchased on 1 March 2007, for $200 000 each, were taken in part-exchange. The part-exchange allowance for each vehicle was $60 000. 3 One vehicle which had been purchased for $360 000 on 31 January 2009 was involved in an accident on 2 December 2009. The insurance company decided that it could not be repaired and gave compensation of $210 000. Depreciation is charged for the full year on all non-current (fixed) assets held at the year- end, using the straight-line method. No depreciation is charged on a non-current (fixed) asset in the year of disposal. Rates of depreciation have remained constant since the business began trading.
Question paper, page 7
7 9706/22/M/J/10 © UCLES 2010 [Turn over For Examiner’s Use REQUIRED (a) (i) Calculate the profits or losses on disposals during the year ended 30 April 2010. … … … … … … … … … … … … … … … … … … … … … … … … … …[12]
Question paper, page 8
8 9706/22/M/J/10 © UCLES 2010 For Examiner’s Use (ii) Prepare a schedule of non-current (fixed) assets for the year ended 30 April 2010, using the layout given at the beginning of the question. … … … … … … … … … … … … … … … … … … … … … … … … … …[8]
Question paper, page 9
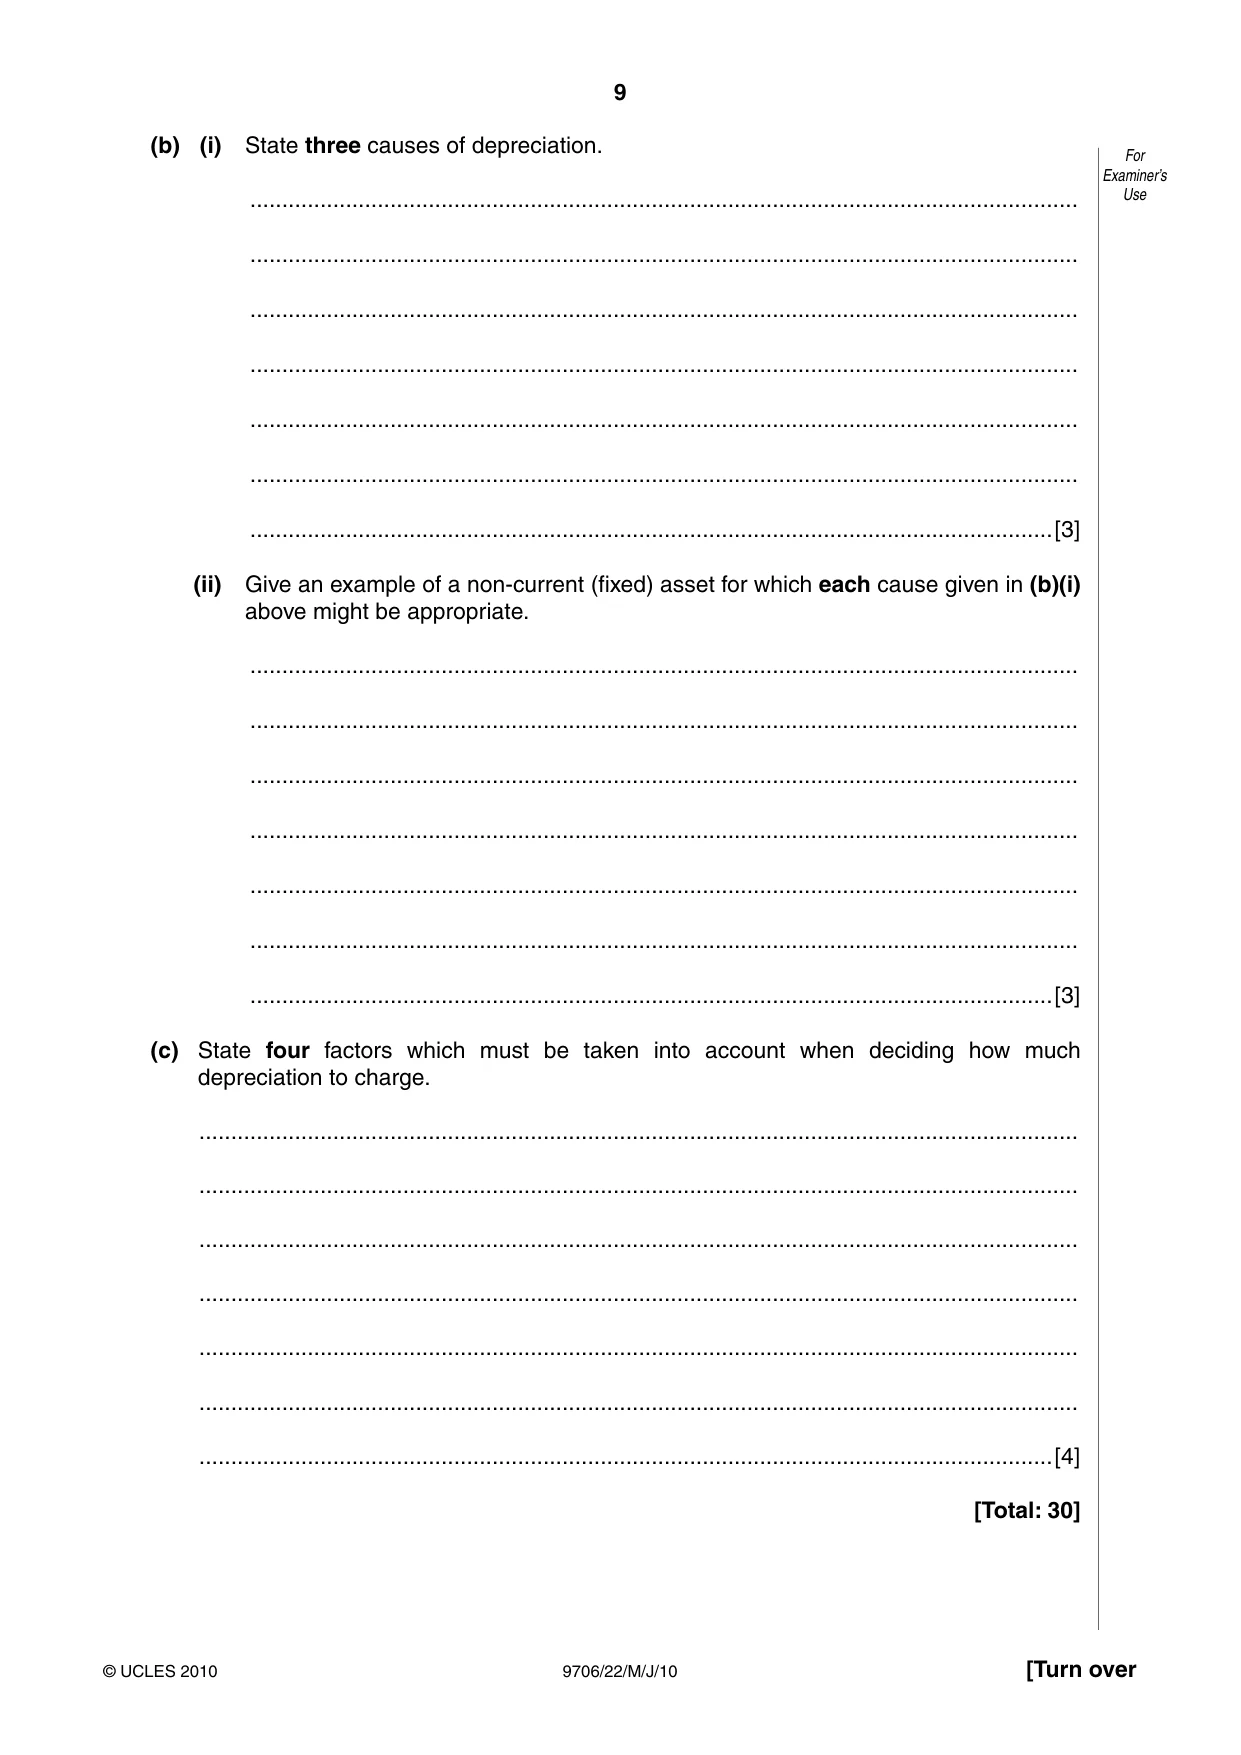
9 9706/22/M/J/10 © UCLES 2010 [Turn over For Examiner’s Use (b) (i) State three causes of depreciation. … … … … … … …[3] (ii) Give an example of a non-current (fixed) asset for which each cause given in (b)(i) above might be appropriate. … … … … … … …[3] (c) State four factors which must be taken into account when deciding how much depreciation to charge. … … … … … … …[4] [Total: 30]
Question paper, page 10
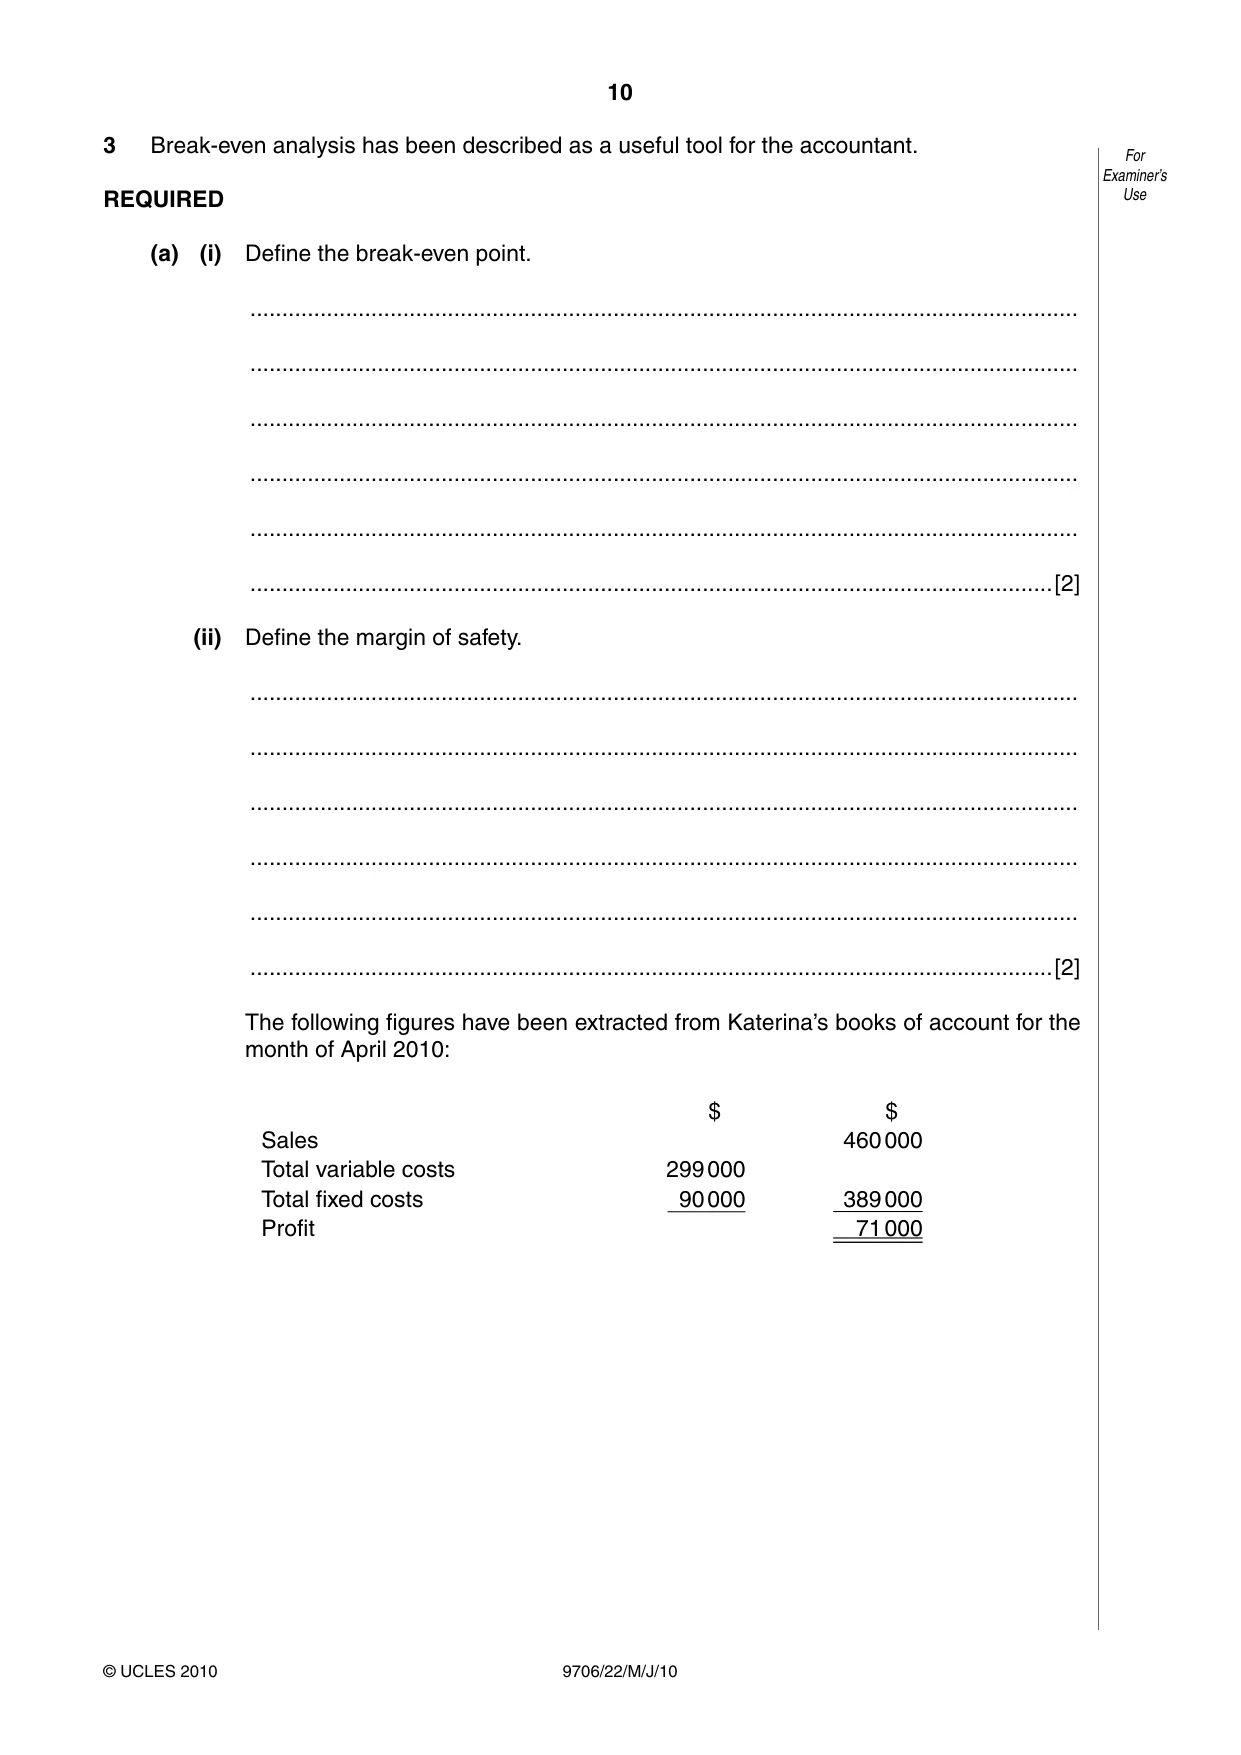
10 9706/22/M/J/10 © UCLES 2010 For Examiner’s Use 3 Break-even analysis has been described as a useful tool for the accountant. REQUIRED (a) (i) Define the break-even point. … … … … … …[2] (ii) Define the margin of safety. … … … … … …[2] The following figures have been extracted from Katerina’s books of account for the month of April 2010: $ $ Sales 460 000 Total variable costs 299 000 Total fixed costs 90 000 389 000 Profit 71 000
Question paper, page 11
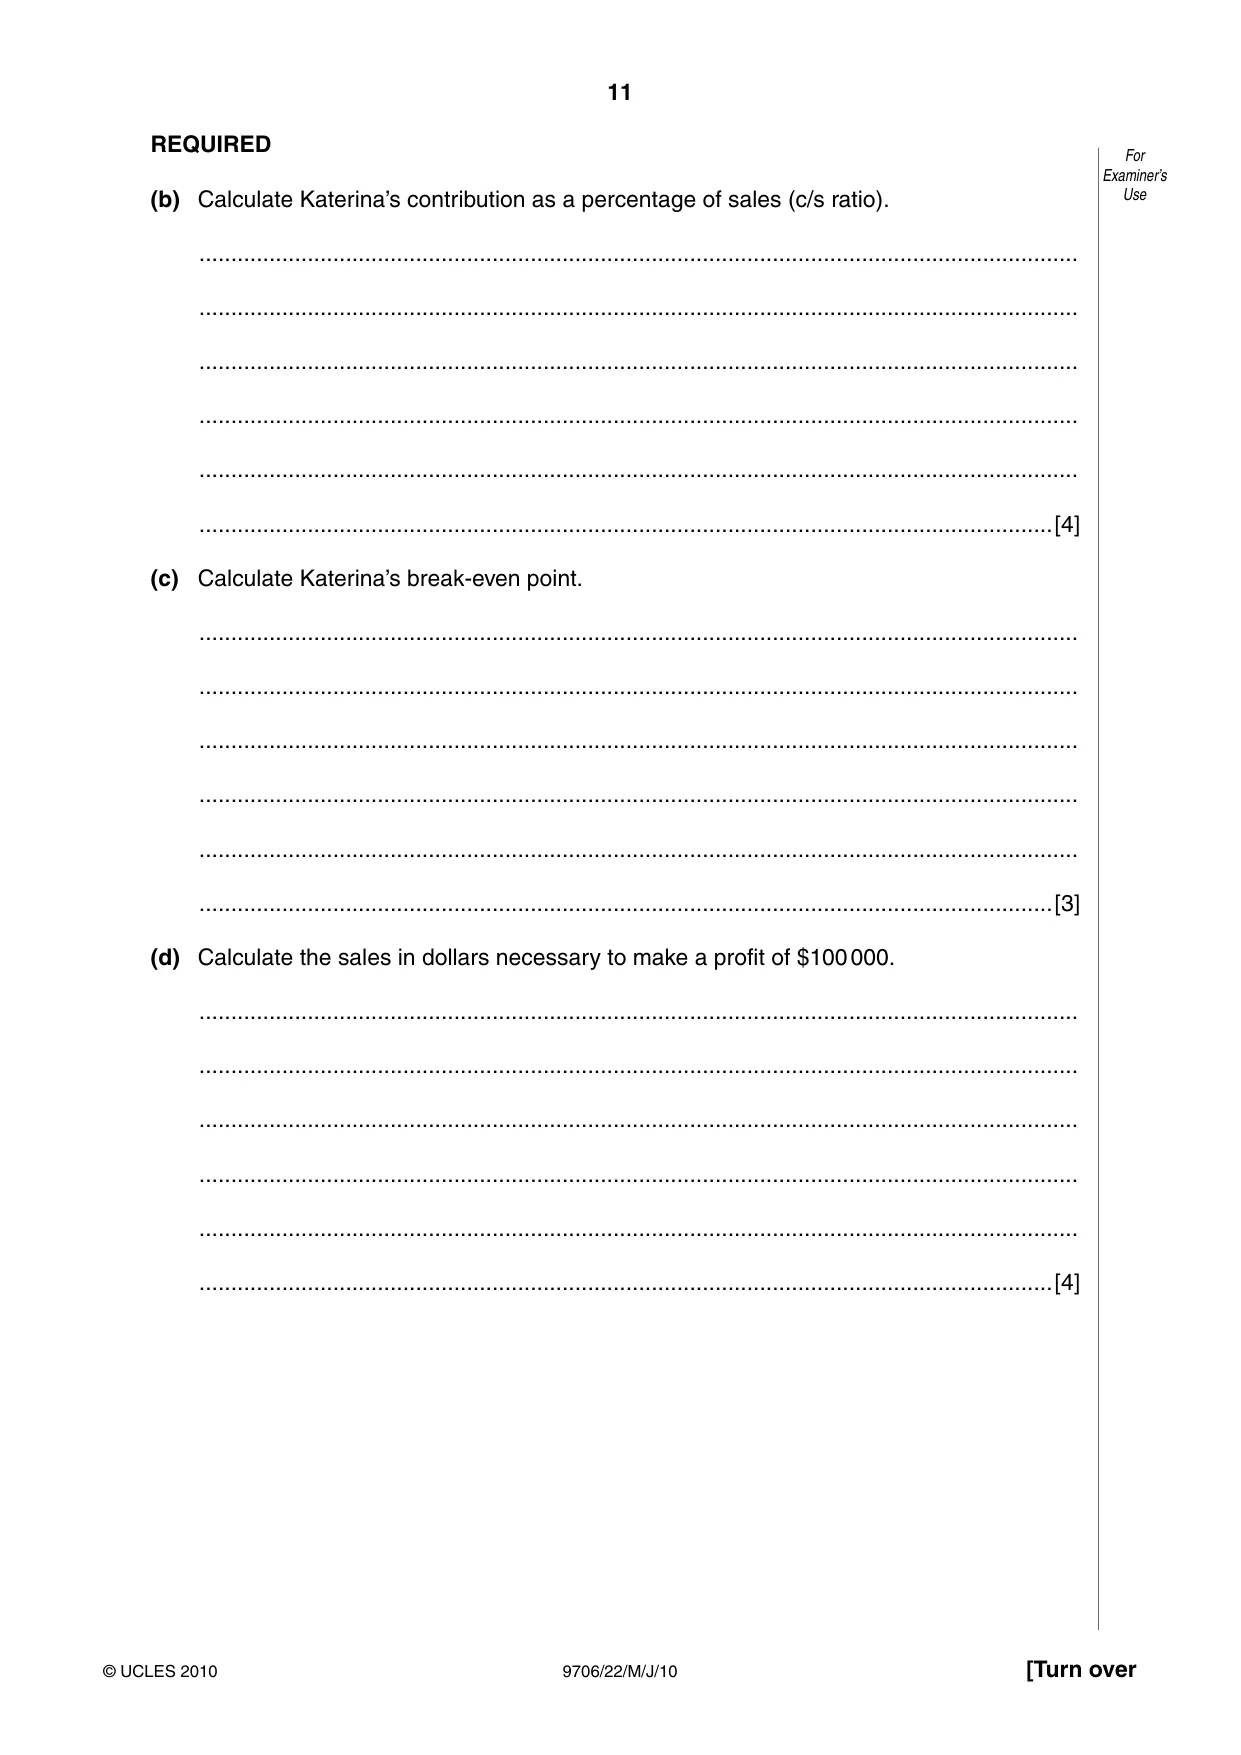
11 9706/22/M/J/10 © UCLES 2010 [Turn over For Examiner’s Use REQUIRED (b) Calculate Katerina’s contribution as a percentage of sales (c/s ratio). … … … … … …[4] (c) Calculate Katerina’s break-even point. … … … … … …[3] (d) Calculate the sales in dollars necessary to make a profit of $100 000. … … … … … …[4]
Question paper, page 12
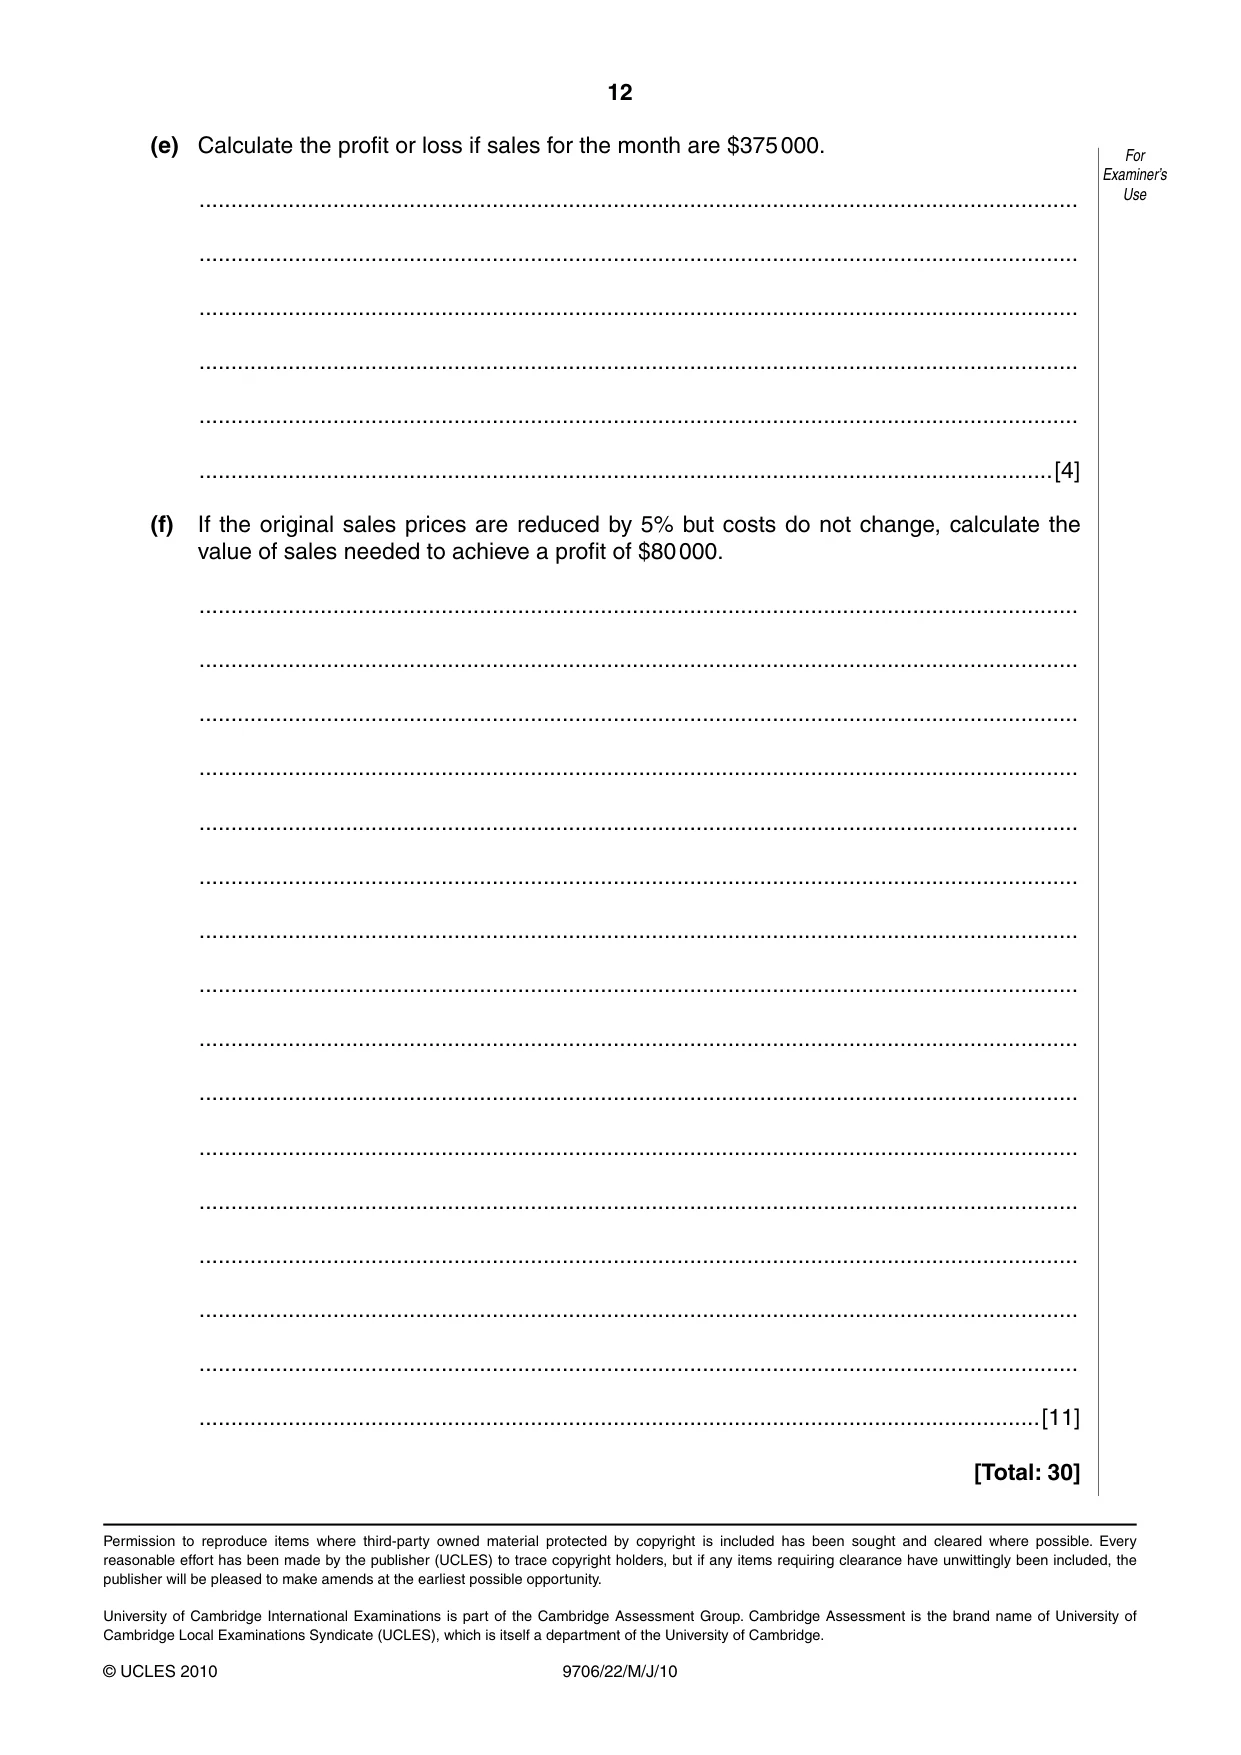
12 9706/22/M/J/10 © UCLES 2010 For Examiner’s Use (e) Calculate the profit or loss if sales for the month are $375 000. … … … … … …[4] (f) If the original sales prices are reduced by 5% but costs do not change, calculate the value of sales needed to achieve a profit of $80 000. … … … … … … … … … … … … … … … …[11] [Total: 30] Permission to reproduce items where third-party owned material protected by copyright is included has been sought and cleared where possible. Every reasonable effort has been made by the publisher (UCLES) to trace copyright holders, but if any items requiring clearance have unwittingly been included, the publisher will be pleased to make amends at the earliest possible opportunity. University of Cambridge International Examinations is part of the Cambridge Assessment Group. Cambridge Assessment is the brand name of University of Cambridge Local Examinations Syndicate (UCLES), which is itself a department of the University of Cambridge.
Mark scheme, page 1
UNIVERSITY OF CAMBRIDGE INTERNATIONAL EXAMINATIONS GCE Advanced Subsidiary Level and GCE Advanced Level MARK SCHEME for the May/June 2010 question paper for the guidance of teachers 9706 ACCOUNTING 9706/22 Paper 22 (Structured Questions (Core)), maximum raw mark 90 This mark scheme is published as an aid to teachers and candidates, to indicate the requirements of the examination. It shows the basis on which Examiners were instructed to award marks. It does not indicate the details of the discussions that took place at an Examiners’ meeting before marking began, which would have considered the acceptability of alternative answers. Mark schemes must be read in conjunction with the question papers and the report on the examination. • CIE will not enter into discussions or correspondence in connection with these mark schemes. CIE is publishing the mark schemes for the May/June 2010 question papers for most IGCSE, GCE Advanced Level and Advanced Subsidiary Level syllabuses and some Ordinary Level syllabuses.
Mark scheme, page 2
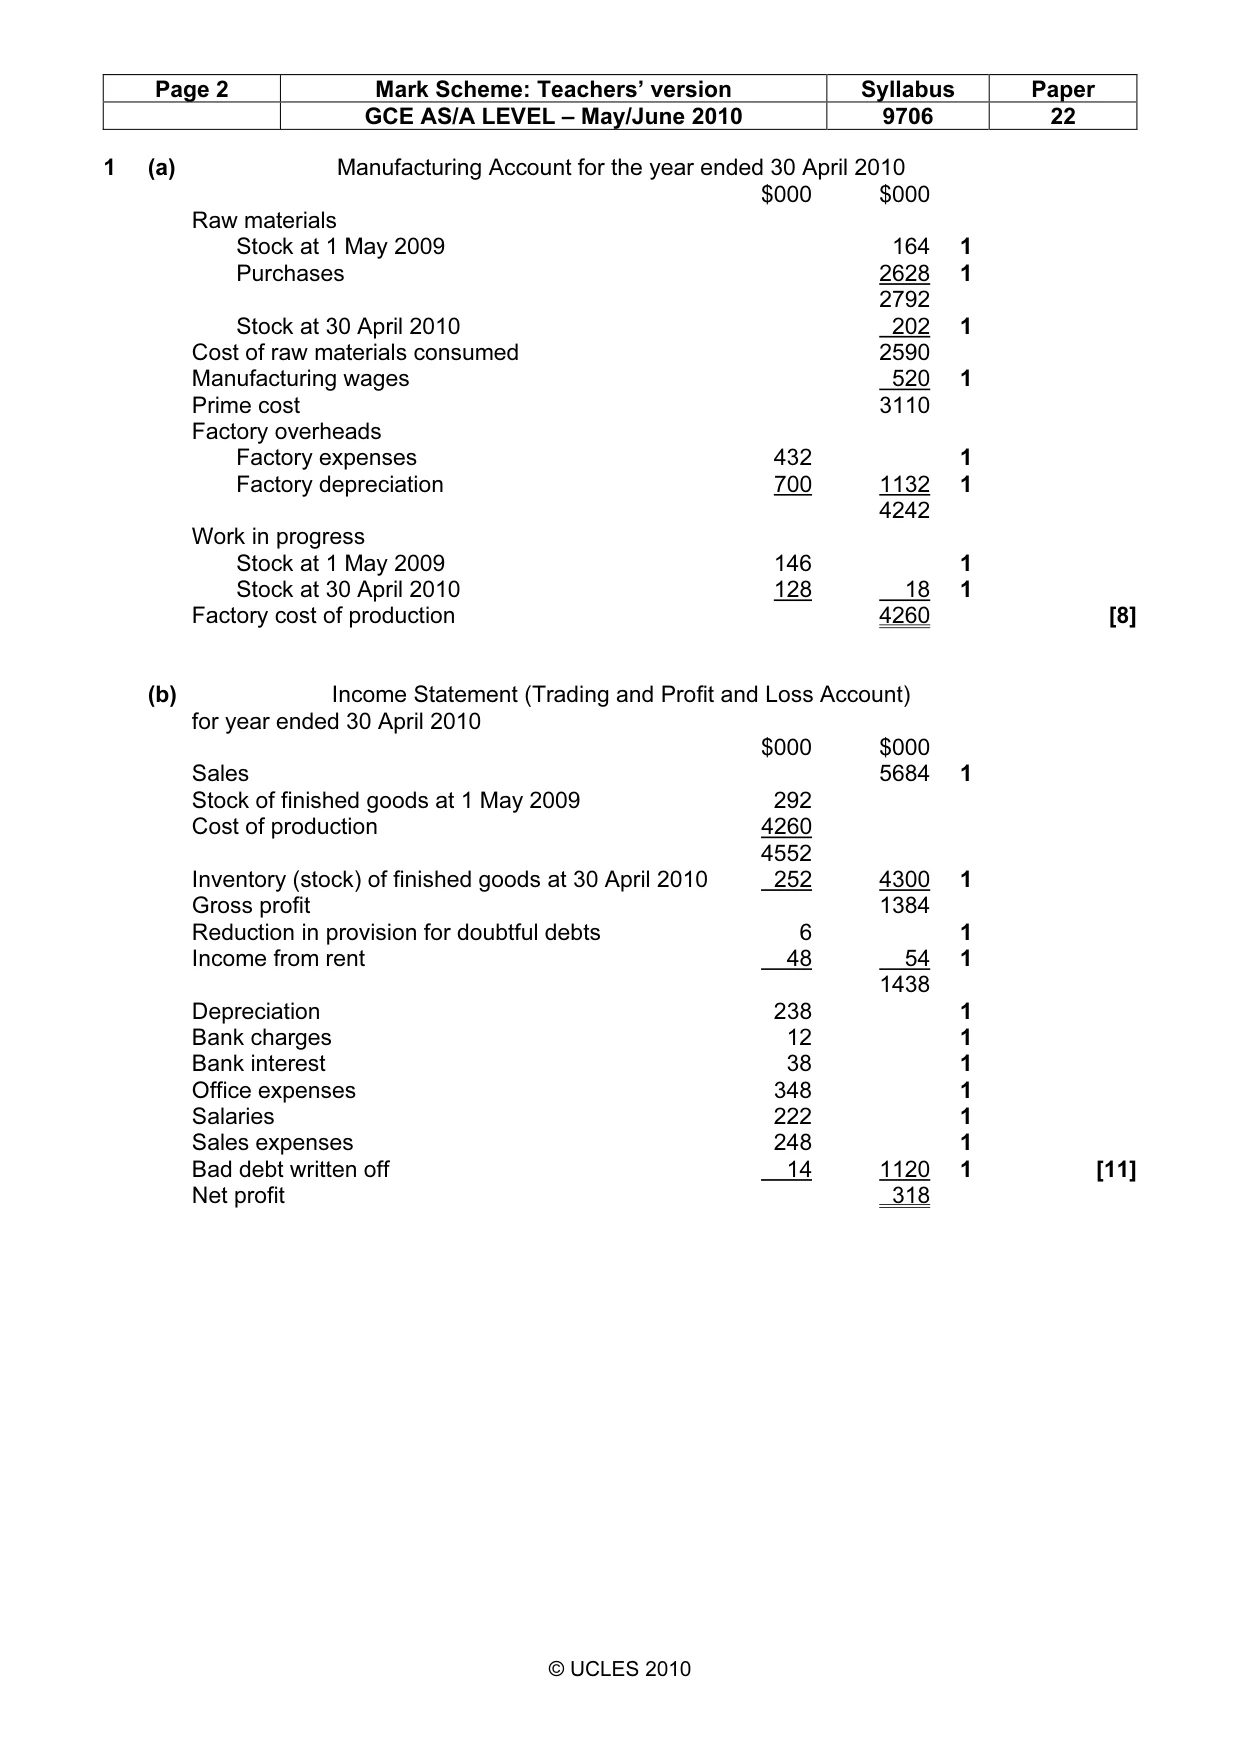
Page 2 Mark Scheme: Teachers’ version Syllabus Paper GCE AS/A LEVEL – May/June 2010 9706 22 © UCLES 2010 1 (a) Manufacturing Account for the year ended 30 April 2010 $000 $000 Raw materials Stock at 1 May 2009 164 1 Purchases 2628 1 2792 Stock at 30 April 2010 202 1 Cost of raw materials consumed 2590 Manufacturing wages 520 1 Prime cost 3110 Factory overheads Factory expenses 432 1 Factory depreciation 700 1132 1 4242 Work in progress Stock at 1 May 2009 146 1 Stock at 30 April 2010 128 18 1 Factory cost of production 4260 [8] (b) Income Statement (Trading and Profit and Loss Account) for year ended 30 April 2010 $000 $000 Sales 5684 1 Stock of finished goods at 1 May 2009 292 Cost of production 4260 4552 Inventory (stock) of finished goods at 30 April 2010 252 4300 1 Gross profit 1384 Reduction in provision for doubtful debts 6 1 Income from rent 48 54 1 1438 Depreciation 238 1 Bank charges 12 1 Bank interest 38 1 Office expenses 348 1 Salaries 222 1 Sales expenses 248 1 Bad debt written off 14 1120 1 [11] Net profit 318
Mark scheme, page 3
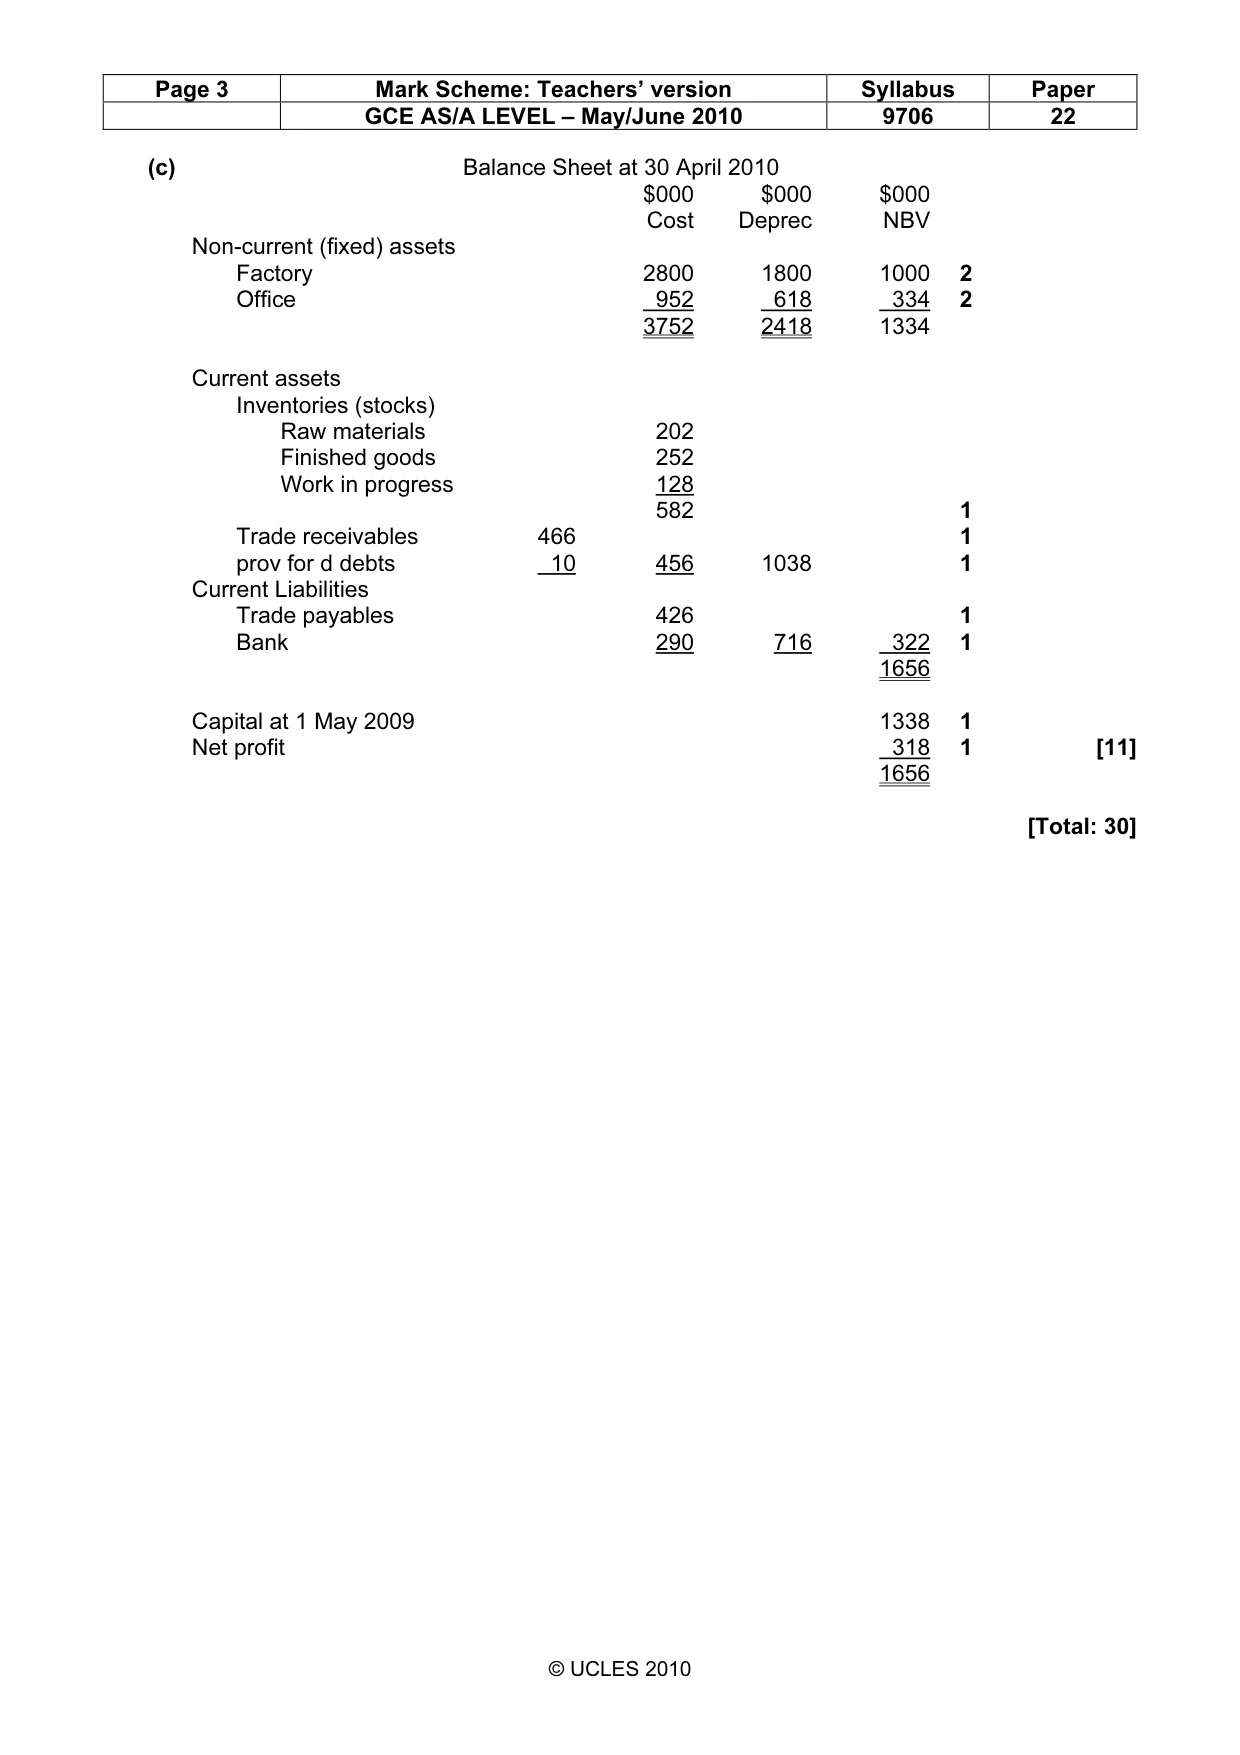
Page 3 Mark Scheme: Teachers’ version Syllabus Paper GCE AS/A LEVEL – May/June 2010 9706 22 © UCLES 2010 (c) Balance Sheet at 30 April 2010 $000 $000 $000 Cost Deprec NBV Non-current (fixed) assets Factory 2800 1800 1000 2 Office 952 618 334 2 3752 2418 1334 Current assets Inventories (stocks) Raw materials 202 Finished goods 252 Work in progress 128 582 1 Trade receivables 466 1 prov for d debts 10 456 1038 1 Current Liabilities Trade payables 426 1 Bank 290 716 322 1 1656 Capital at 1 May 2009 1338 1 Net profit 318 1 [11] 1656 [Total: 30]
Mark scheme, page 4
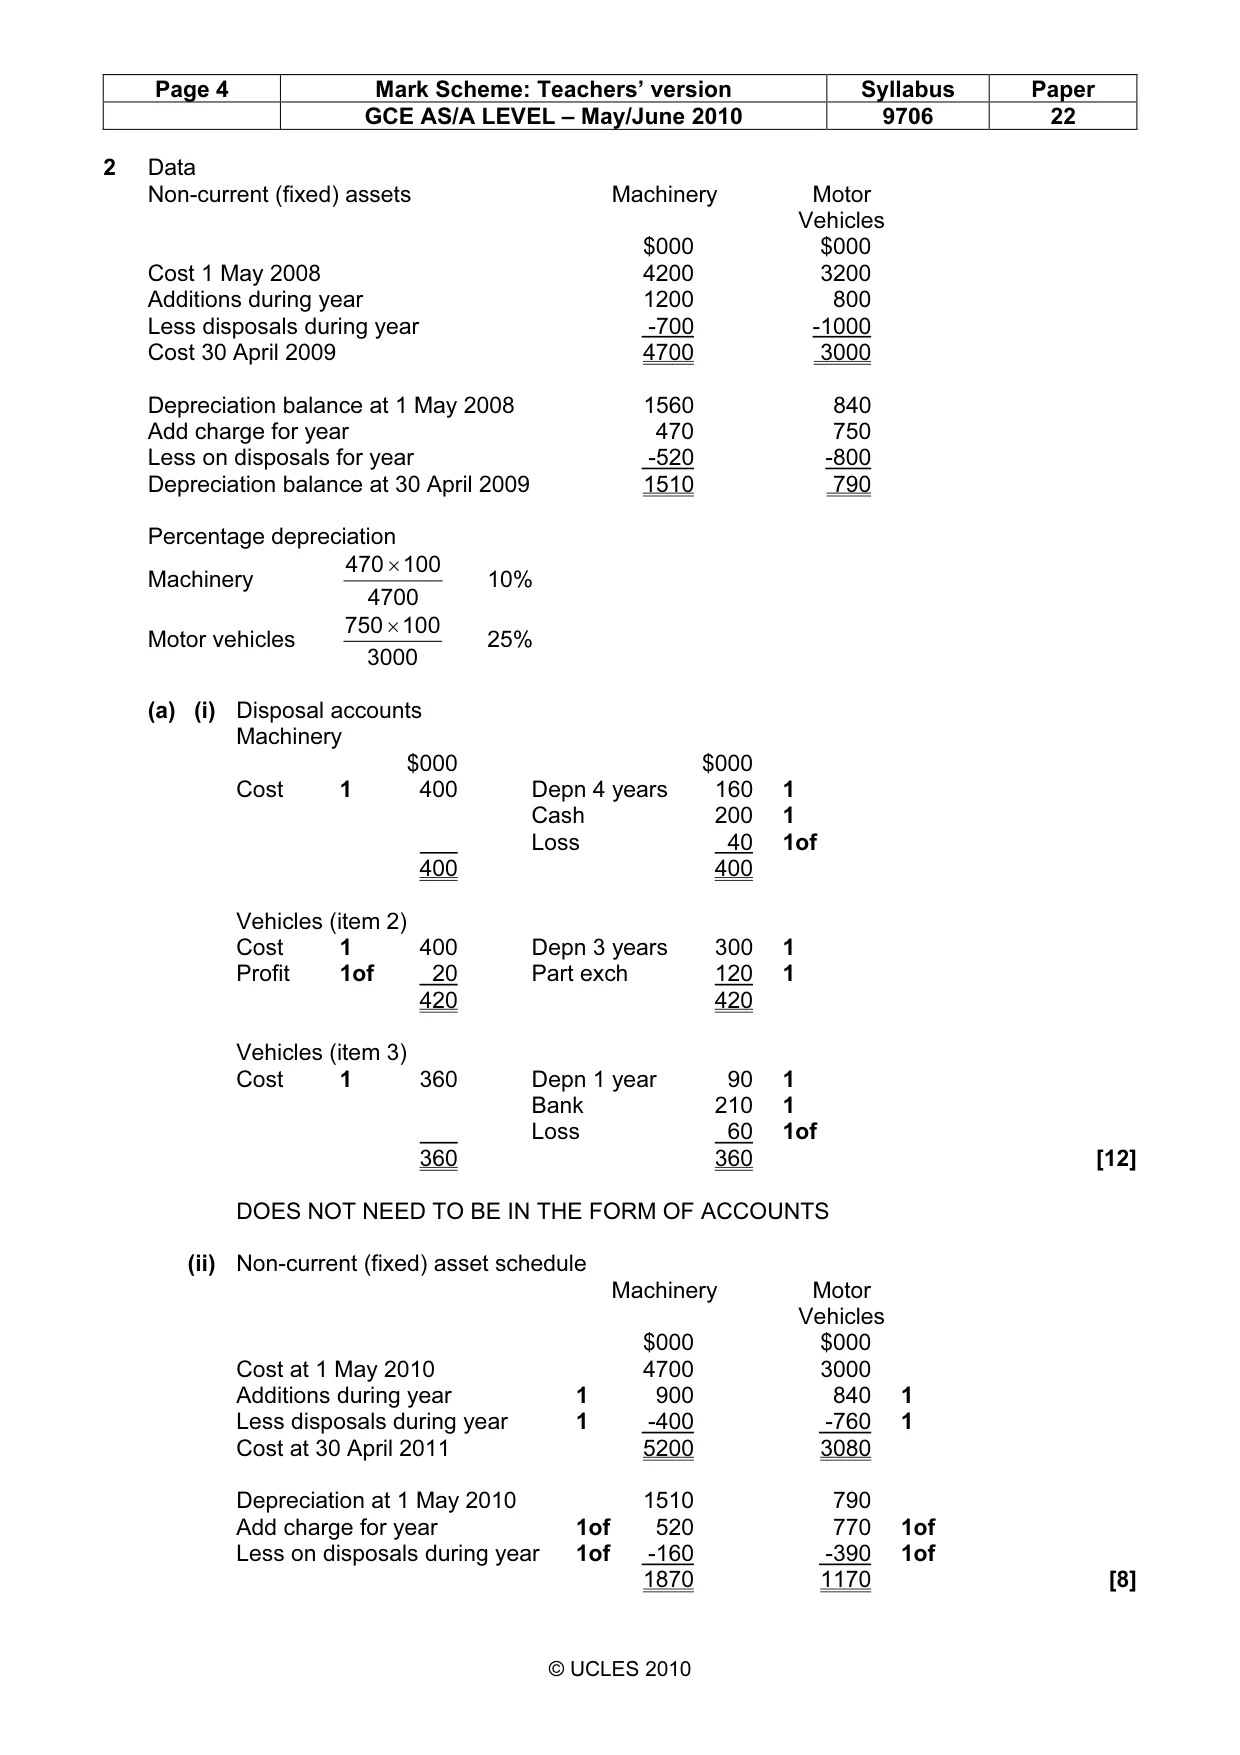
Page 4 Mark Scheme: Teachers’ version Syllabus Paper GCE AS/A LEVEL – May/June 2010 9706 22 © UCLES 2010 2 Data Non-current (fixed) assets Machinery Motor Vehicles $000 $000 Cost 1 May 2008 4200 3200 Additions during year 1200 800 Less disposals during year -700 -1000 Cost 30 April 2009 4700 3000 Depreciation balance at 1 May 2008 1560 840 Add charge for year 470 750 Less on disposals for year -520 -800 Depreciation balance at 30 April 2009 1510 790 Percentage depreciation Machinery 4700 100 470 × 10% Motor vehicles 3000 100 750 × 25% (a) (i) Disposal accounts Machinery $000 $000 Cost 1 400 Depn 4 years 160 1 Cash 200 1 Loss 40 1of 400 400 Vehicles (item 2) Cost 1 400 Depn 3 years 300 1 Profit 1of 20 Part exch 120 1 420 420 Vehicles (item 3) Cost 1 360 Depn 1 year 90 1 Bank 210 1 Loss 60 1of 360 360 [12] DOES NOT NEED TO BE IN THE FORM OF ACCOUNTS (ii) Non-current (fixed) asset schedule Machinery Motor Vehicles $000 $000 Cost at 1 May 2010 4700 3000 Additions during year 1 900 840 1 Less disposals during year 1 -400 -760 1 Cost at 30 April 2011 5200 3080 Depreciation at 1 May 2010 1510 790 Add charge for year 1of 520 770 1of Less on disposals during year 1of -160 -390 1of 1870 1170 [8]
Mark scheme, page 5
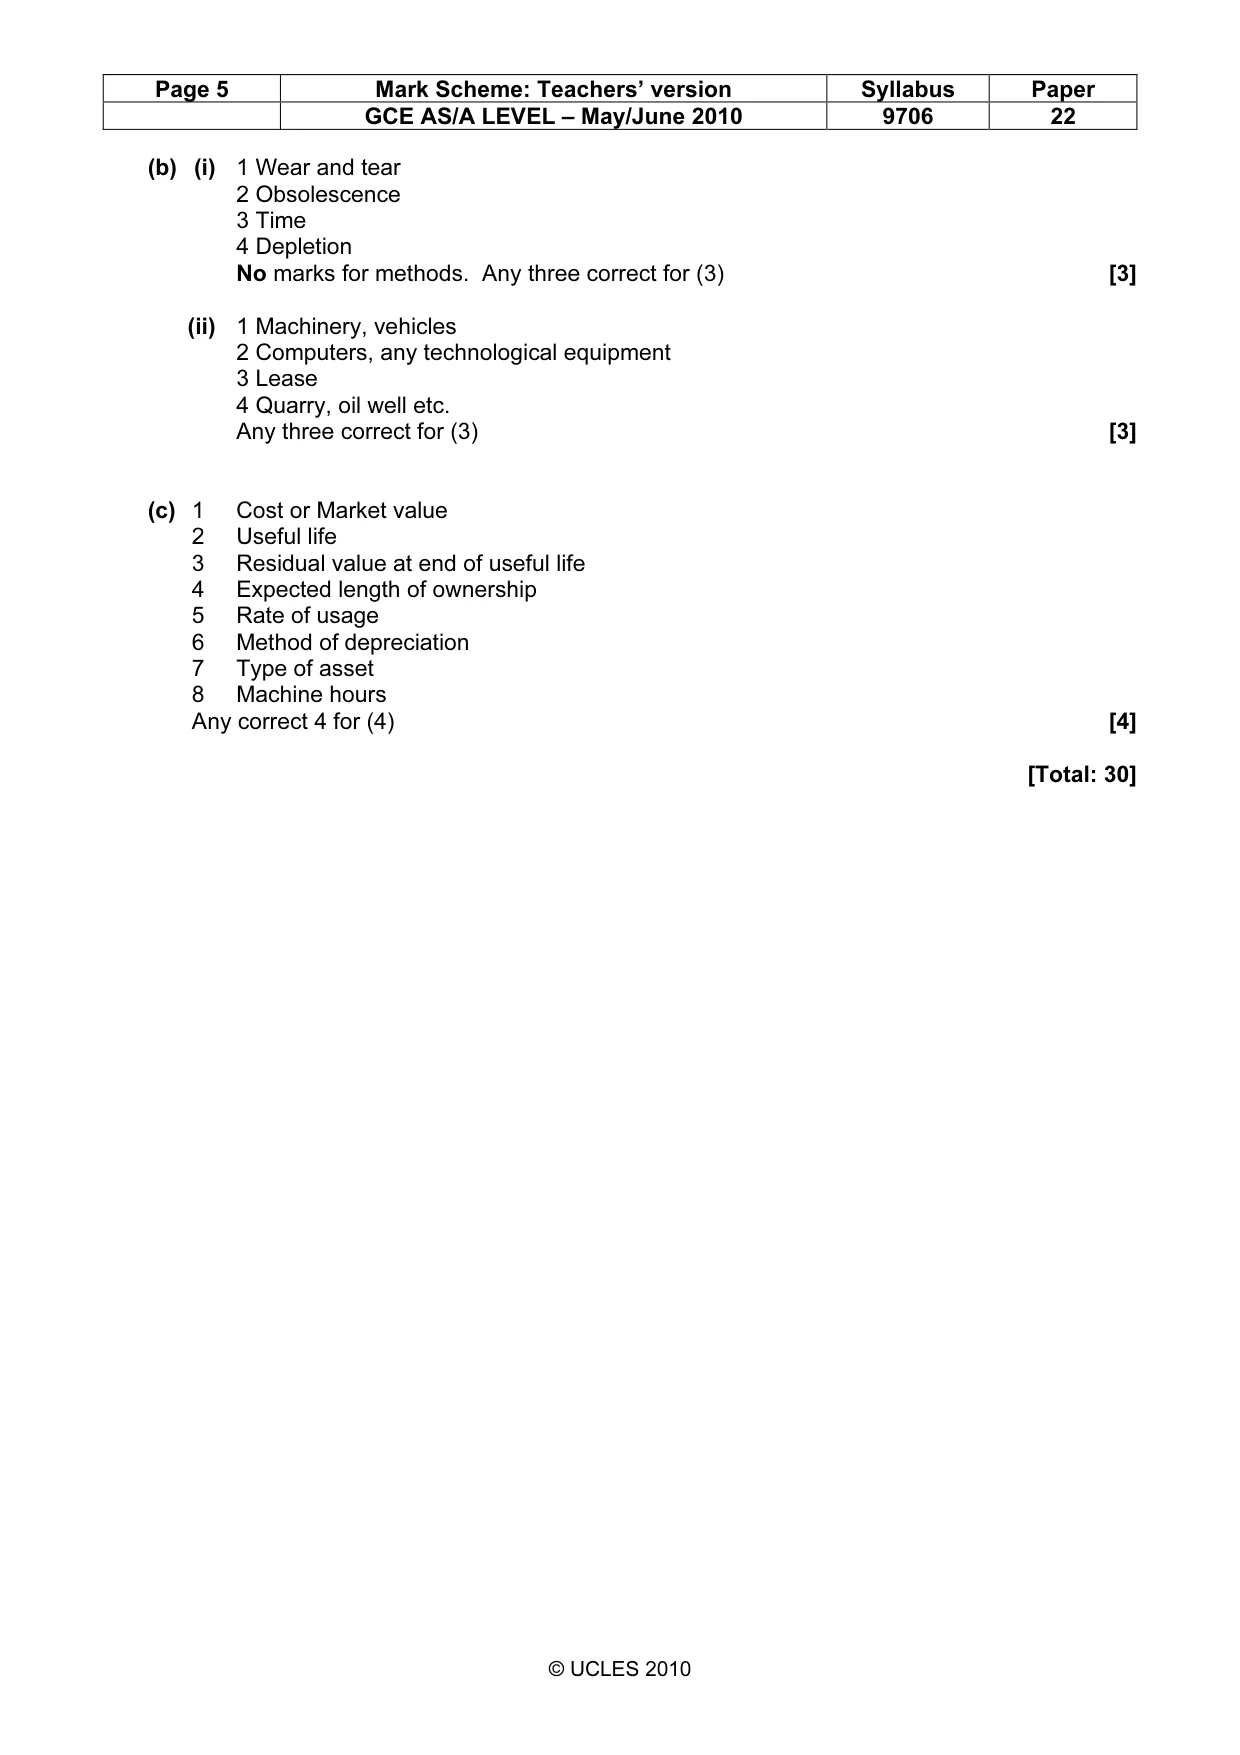
Page 5 Mark Scheme: Teachers’ version Syllabus Paper GCE AS/A LEVEL – May/June 2010 9706 22 © UCLES 2010 (b) (i) 1 Wear and tear 2 Obsolescence 3 Time 4 Depletion No marks for methods. Any three correct for (3) [3] (ii) 1 Machinery, vehicles 2 Computers, any technological equipment 3 Lease 4 Quarry, oil well etc. Any three correct for (3) [3] (c) 1 Cost or Market value 2 Useful life 3 Residual value at end of useful life 4 Expected length of ownership 5 Rate of usage 6 Method of depreciation 7 Type of asset 8 Machine hours Any correct 4 for (4) [4] [Total: 30]
Mark scheme, page 6
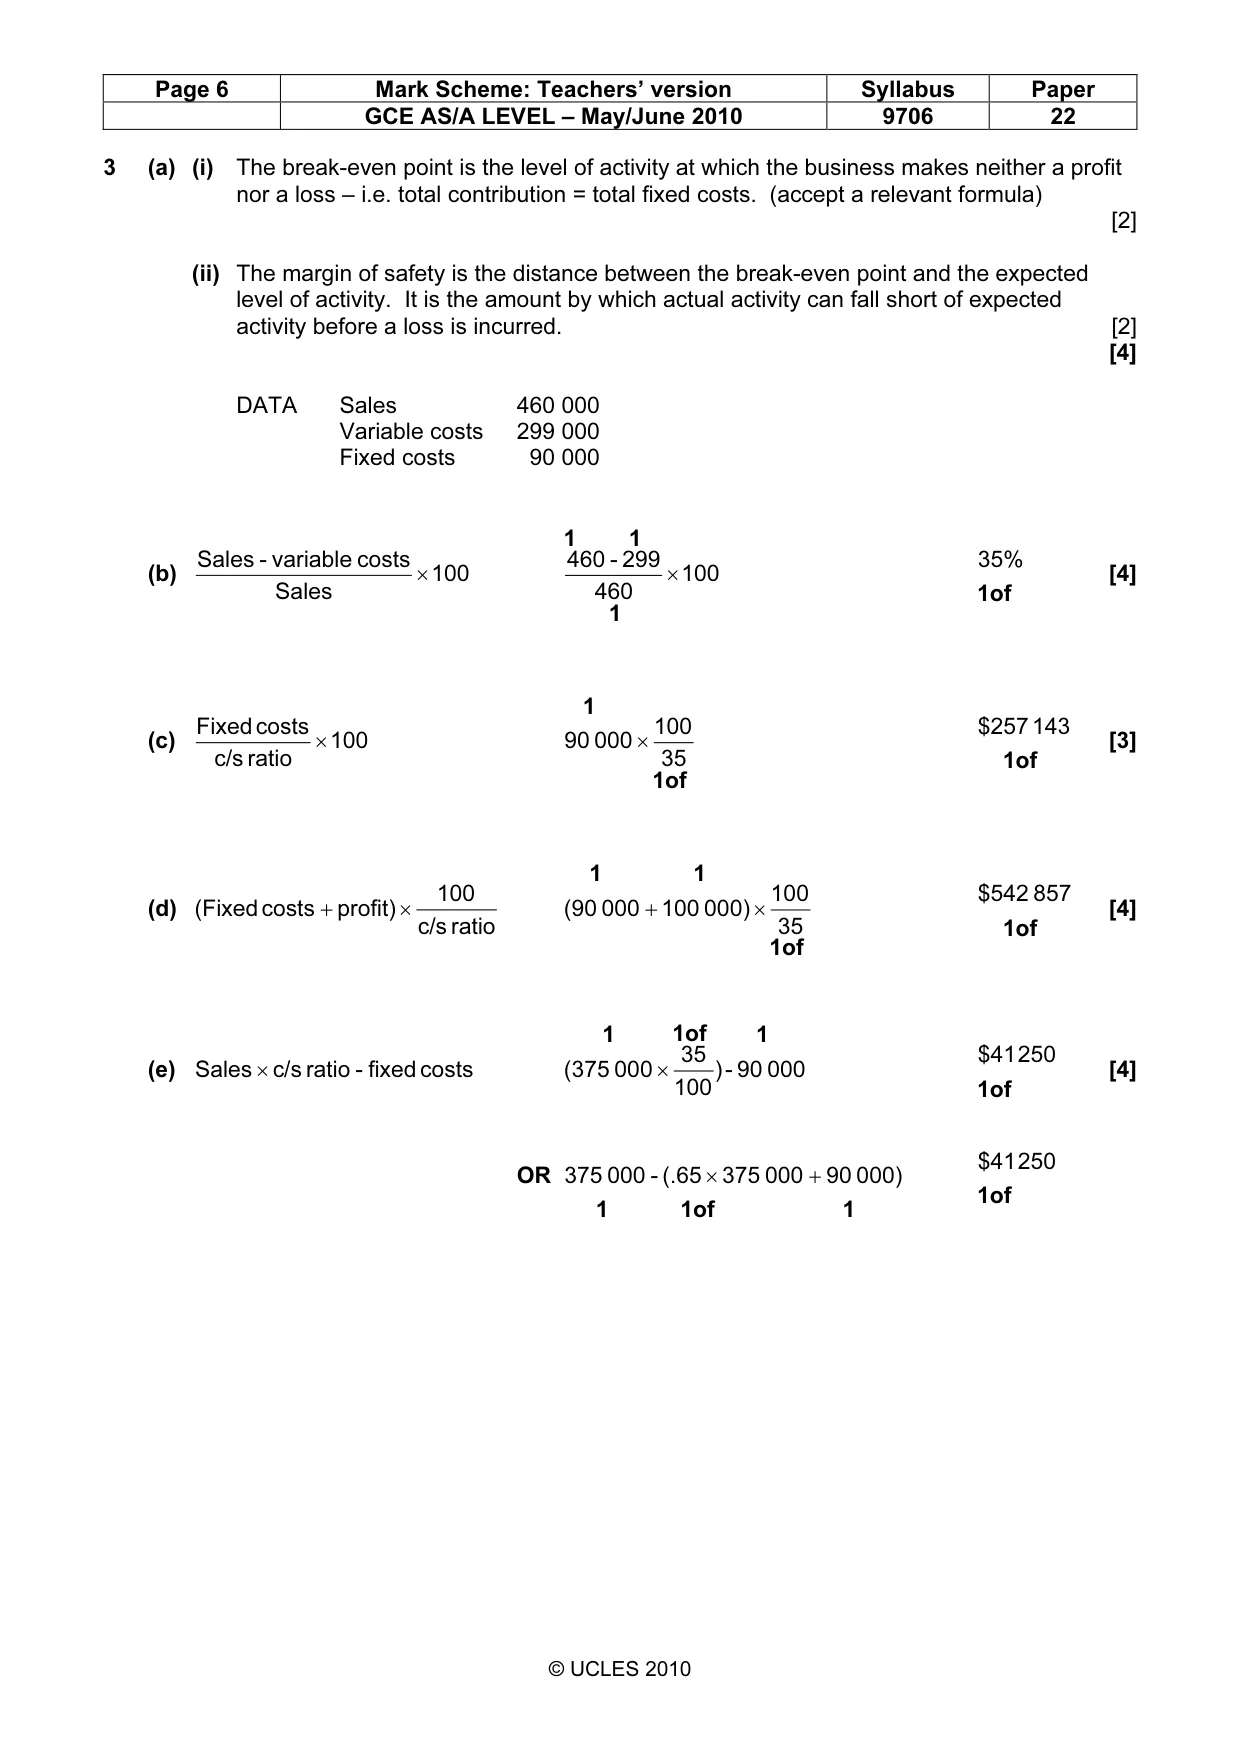
Page 6 Mark Scheme: Teachers’ version Syllabus Paper GCE AS/A LEVEL – May/June 2010 9706 22 © UCLES 2010 3 (a) (i) The break-even point is the level of activity at which the business makes neither a profit nor a loss – i.e. total contribution = total fixed costs. (accept a relevant formula) [2] (ii) The margin of safety is the distance between the break-even point and the expected level of activity. It is the amount by which actual activity can fall short of expected activity before a loss is incurred. [2] [4] DATA Sales 460 000 Variable costs 299 000 Fixed costs 90 000 (b) 100 Sales costs variable - Sales × 1 1 1 100 460 299 - 460 × 1of 35% [4] (c) 100 ratio c/s costs Fixed × 1of 1 35 100 000 90 × 1of 143 $257 [3] (d) ratio c/s 100 profit) costs (Fixed × + 1of 1 1 35 100 000) 100 000 (90 × + 1of 857 $542 [4] (e) costs fixed - ratio c/s Sales × 000 90 -) 100 35 000 (375 1 1of 1 × 1of 250 $41 [4] OR 1 1of 1 000) 90 000 375 (.65 - 000 375 + × 1of 250 $41
Mark scheme, page 7
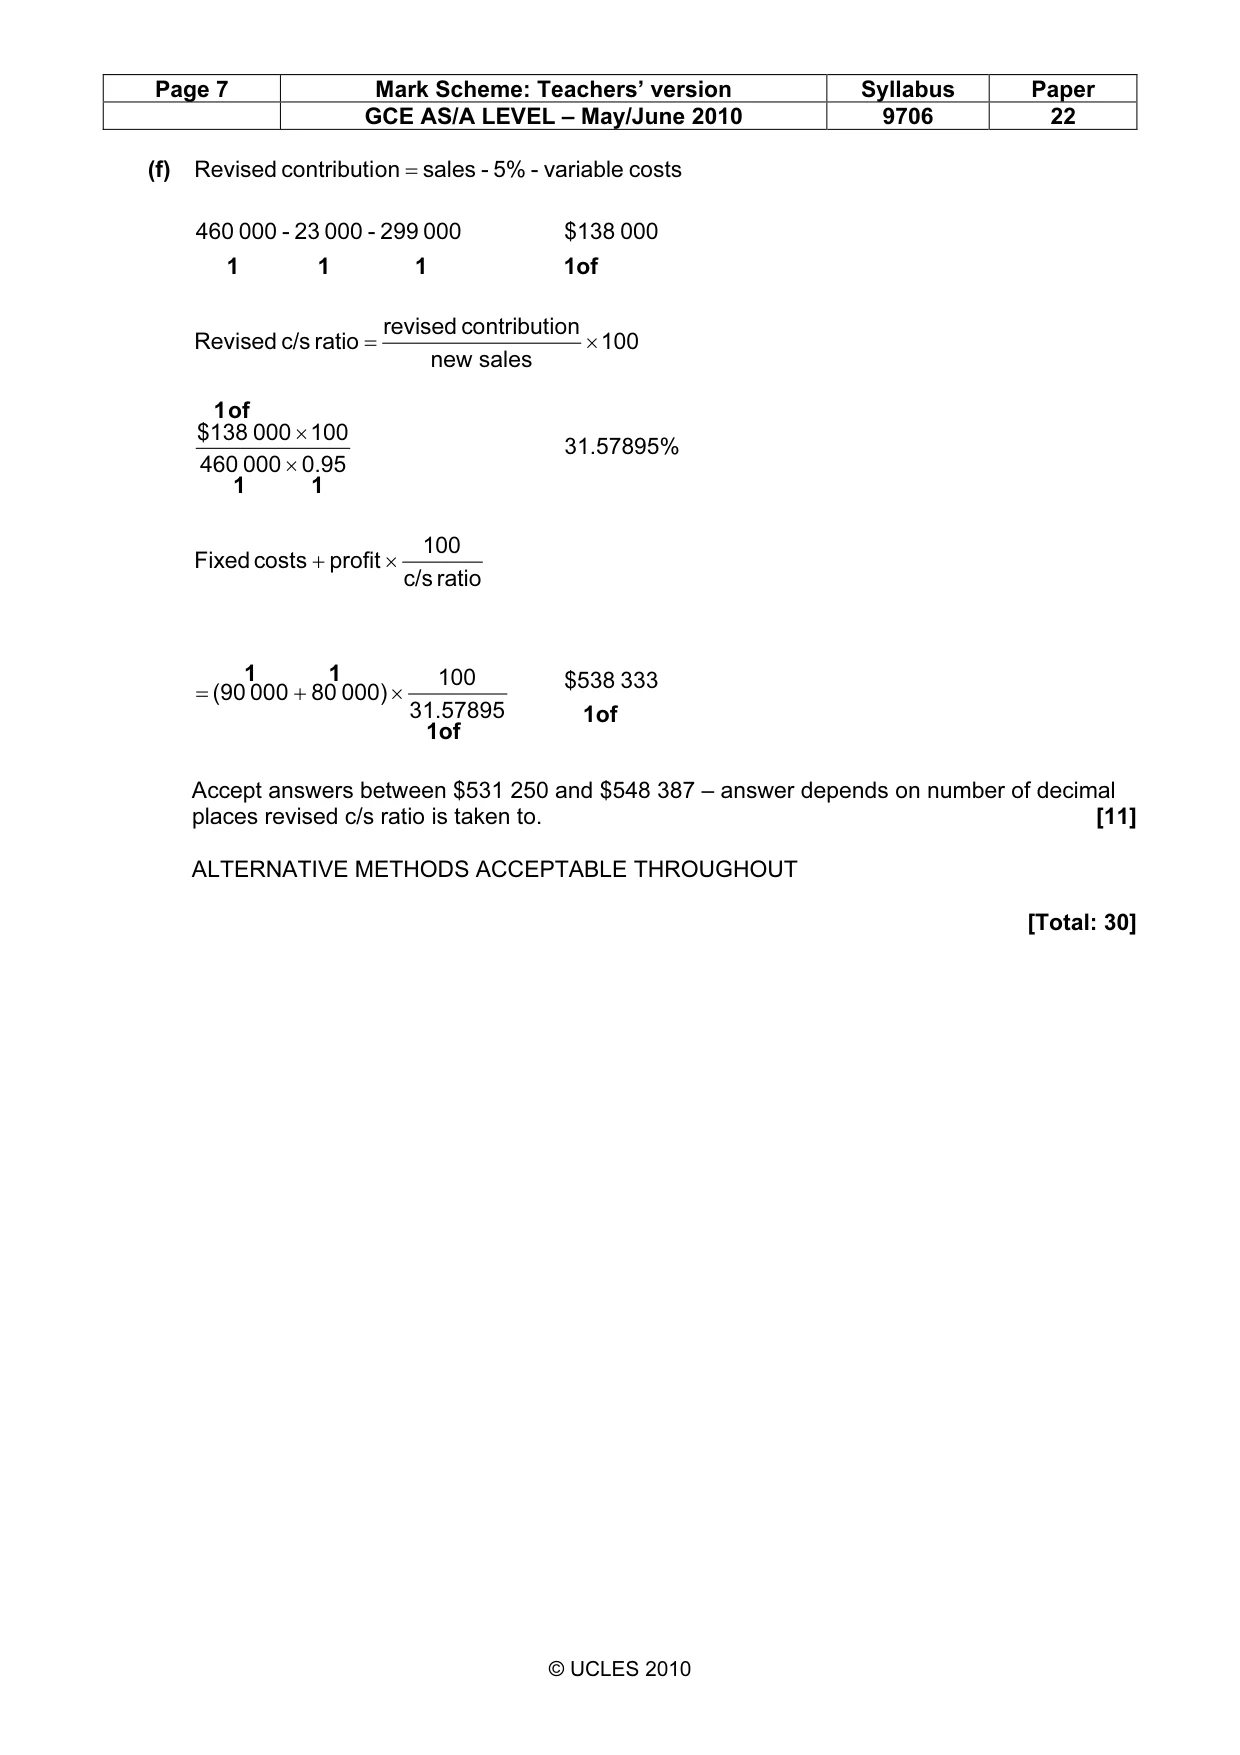
Page 7 Mark Scheme: Teachers’ version Syllabus Paper GCE AS/A LEVEL – May/June 2010 9706 22 © UCLES 2010 (f) costs variable - 5% - sales on contributi Revised = 1 1 1 000 299 - 000 23 - 000 460 1of 000 $138 100 sales new on contributi revised ratio c/s Revised × = 1 1 of 1 0.95 000 460 100 000 $138 × × 31.57895% ratio c/s 100 profit costs Fixed × + 1of 1 1 31.57895 100 000) 80 000 (90 × + = 1of 333 $538 Accept answers between $531 250 and $548 387 – answer depends on number of decimal places revised c/s ratio is taken to. [11] ALTERNATIVE METHODS ACCEPTABLE THROUGHOUT [Total: 30]
What you needed in this session
Cambridge’s own grade thresholds for 2010 May/June, Paper 2 · Variant 2. A higher threshold means an easier paper — the bar moves with how the cohort did.