Cambridge A Level Accounting 9706 — 2010 May/June Paper 2 · Variant 1
9706/21/M/J/10 · 90 marks · ≈101 min
The question paper and its mark scheme, free to read here and free to download. This is Cambridge’s own paper, exactly as it was sat.
Question paper12 pages
Mark scheme5 pages
Answers below. Sit the paper first if you are practising.
Paper as text
Question paper, page 1
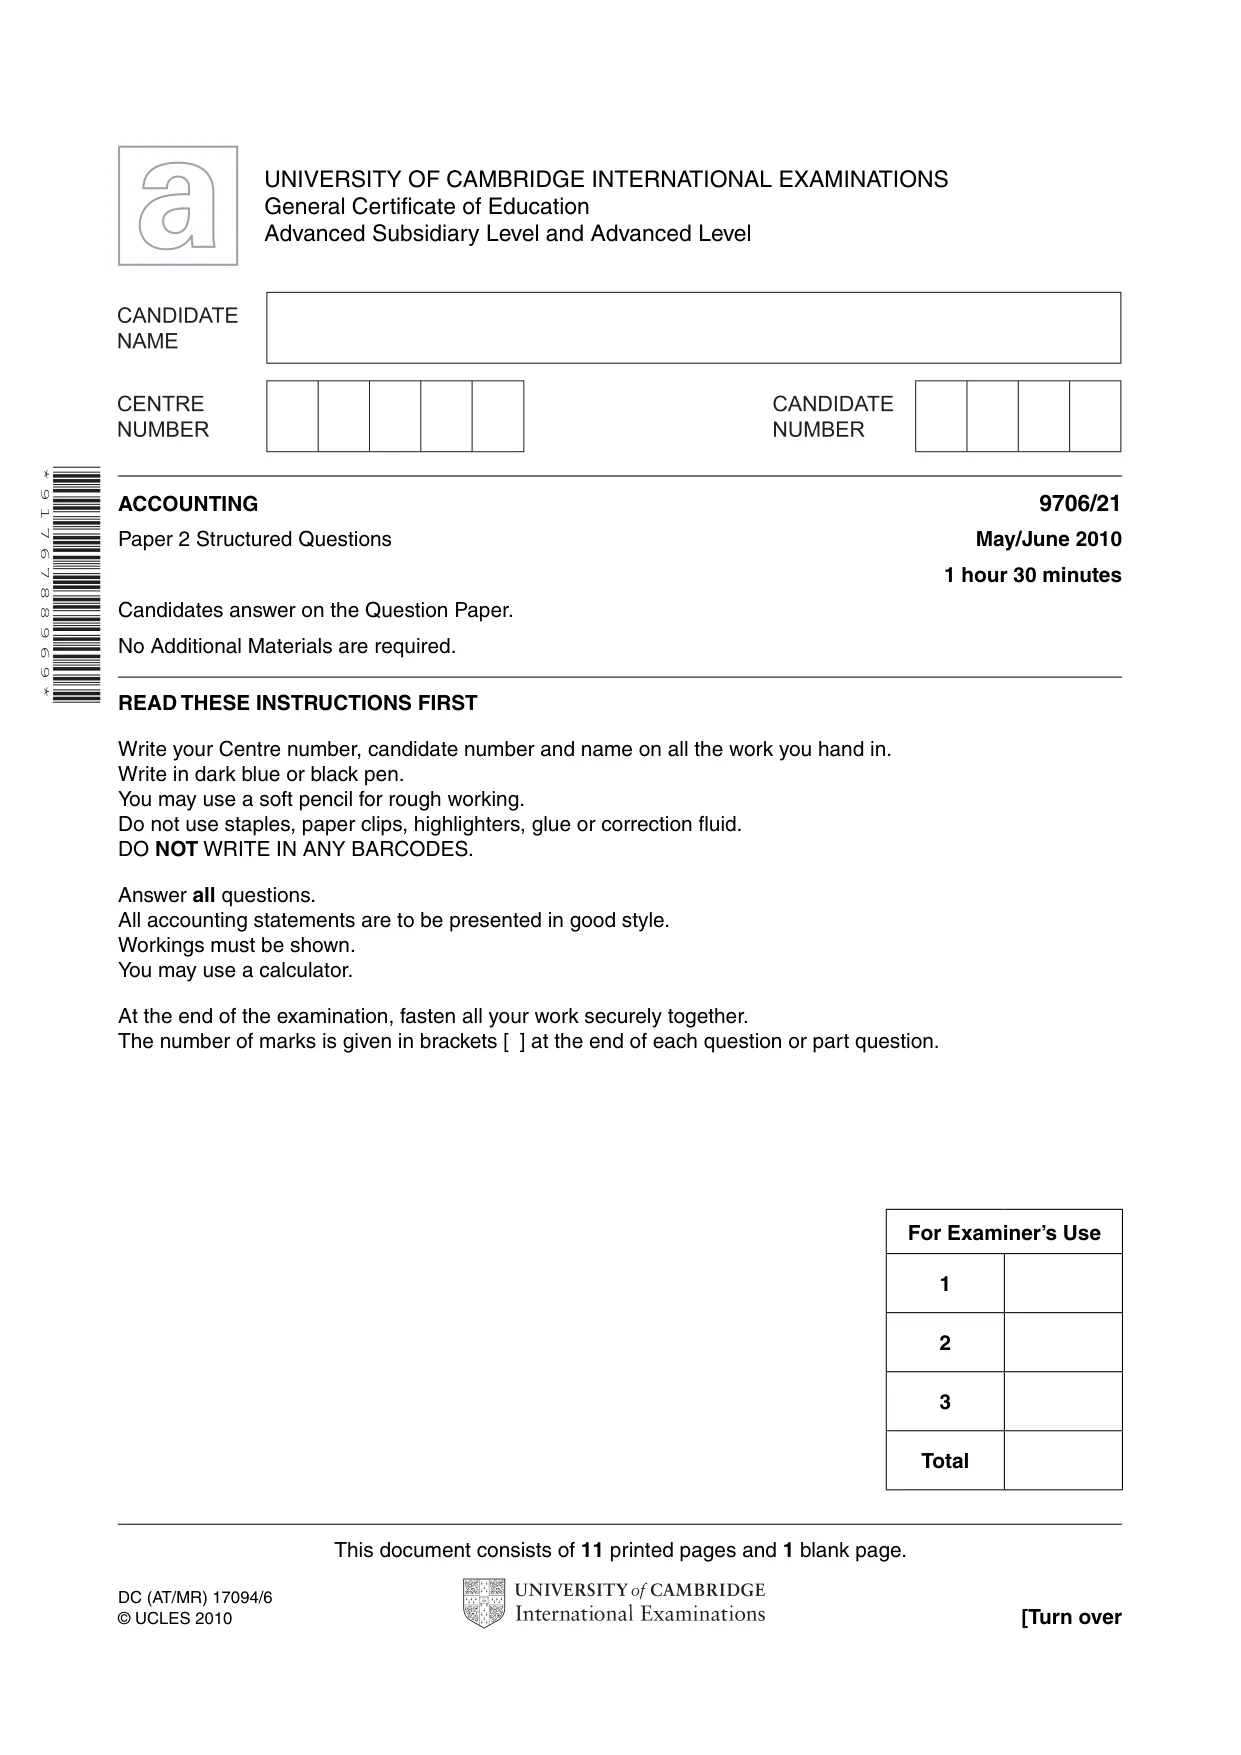
This document consists of 11 printed pages and 1 blank page. DC (AT/MR) 17094/6 © UCLES 2010 [Turn over UNIVERSITY OF CAMBRIDGE INTERNATIONAL EXAMINATIONS General Certificate of Education Advanced Subsidiary Level and Advanced Level * 9 1 7 6 7 8 8 9 6 9 * ACCOUNTING 9706/21 Paper 2 Structured Questions May/June 2010 1 hour 30 minutes Candidates answer on the Question Paper. No Additional Materials are required. READ THESE INSTRUCTIONS FIRST Write your Centre number, candidate number and name on all the work you hand in. Write in dark blue or black pen. You may use a soft pencil for rough working. Do not use staples, paper clips, highlighters, glue or correction fluid. DO NOT WRITE IN ANY BARCODES. Answer all questions. All accounting statements are to be presented in good style. Workings must be shown. You may use a calculator. At the end of the examination, fasten all your work securely together. The number of marks is given in brackets [ ] at the end of each question or part question. For Examiner’s Use 1 2 3 Total
Question paper, page 2
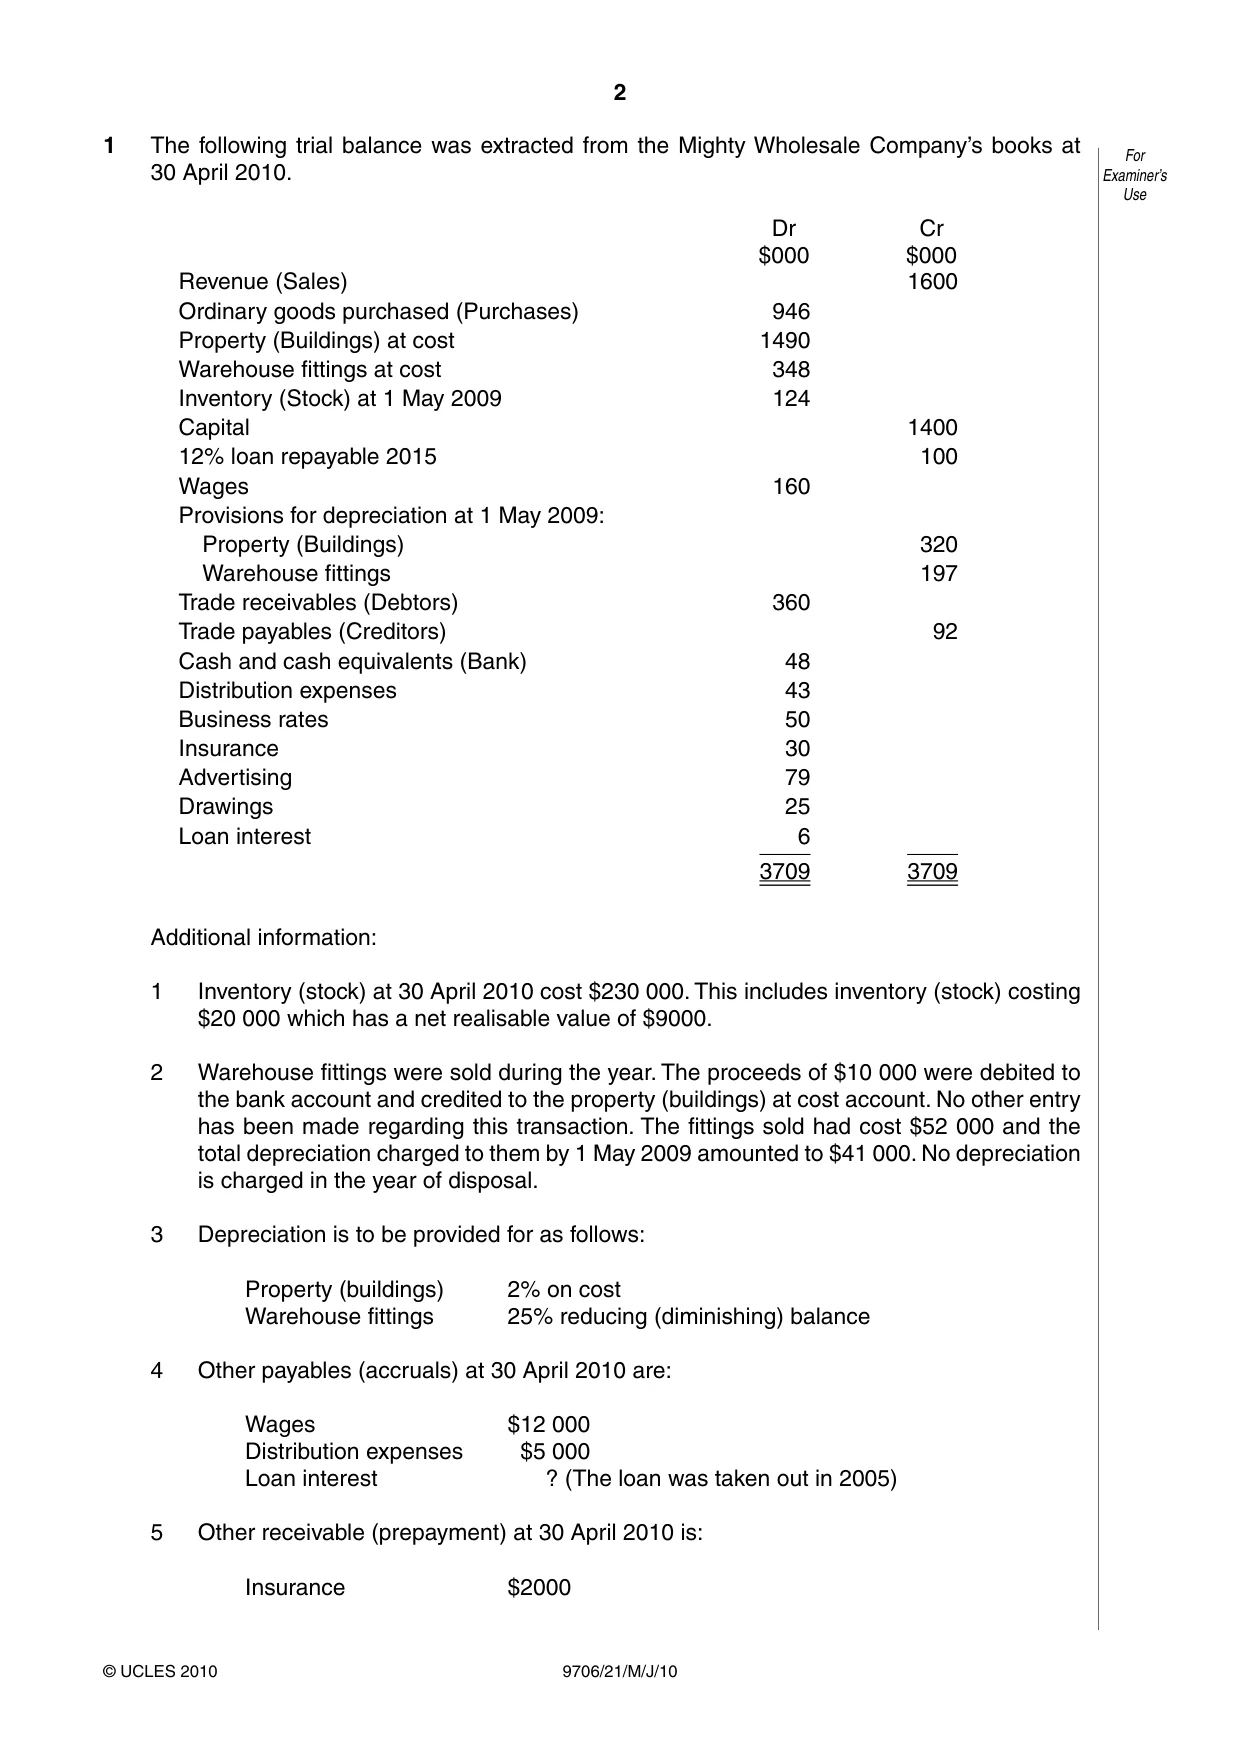
2 9706/21/M/J/10 © UCLES 2010 For Examiner’s Use 1 The following trial balance was extracted from the Mighty Wholesale Company’s books at 30 April 2010. Dr $000 Cr $000 Revenue (Sales) 1600 Ordinary goods purchased (Purchases) 946 Property (Buildings) at cost 1490 Warehouse fittings at cost 348 Inventory (Stock) at 1 May 2009 124 Capital 1400 12% loan repayable 2015 100 Wages 160 Provisions for depreciation at 1 May 2009: Property (Buildings) 320 Warehouse fittings 197 Trade receivables (Debtors) 360 Trade payables (Creditors) 92 Cash and cash equivalents (Bank) 48 Distribution expenses 43 Business rates 50 Insurance 30 Advertising 79 Drawings 25 Loan interest 6 3709 3709 Additional information: 1 Inventory (stock) at 30 April 2010 cost $230 000. This includes inventory (stock) costing $20 000 which has a net realisable value of $9000. 2 Warehouse fittings were sold during the year. The proceeds of $10 000 were debited to the bank account and credited to the property (buildings) at cost account. No other entry has been made regarding this transaction. The fittings sold had cost $52 000 and the total depreciation charged to them by 1 May 2009 amounted to $41 000. No depreciation is charged in the year of disposal. 3 Depreciation is to be provided for as follows: Property (buildings) 2% on cost Warehouse fittings 25% reducing (diminishing) balance 4 Other payables (accruals) at 30 April 2010 are: Wages $12 000 Distribution expenses $5 000 Loan interest ? (The loan was taken out in 2005) 5 Other receivable (prepayment) at 30 April 2010 is: Insurance $2000
Question paper, page 3
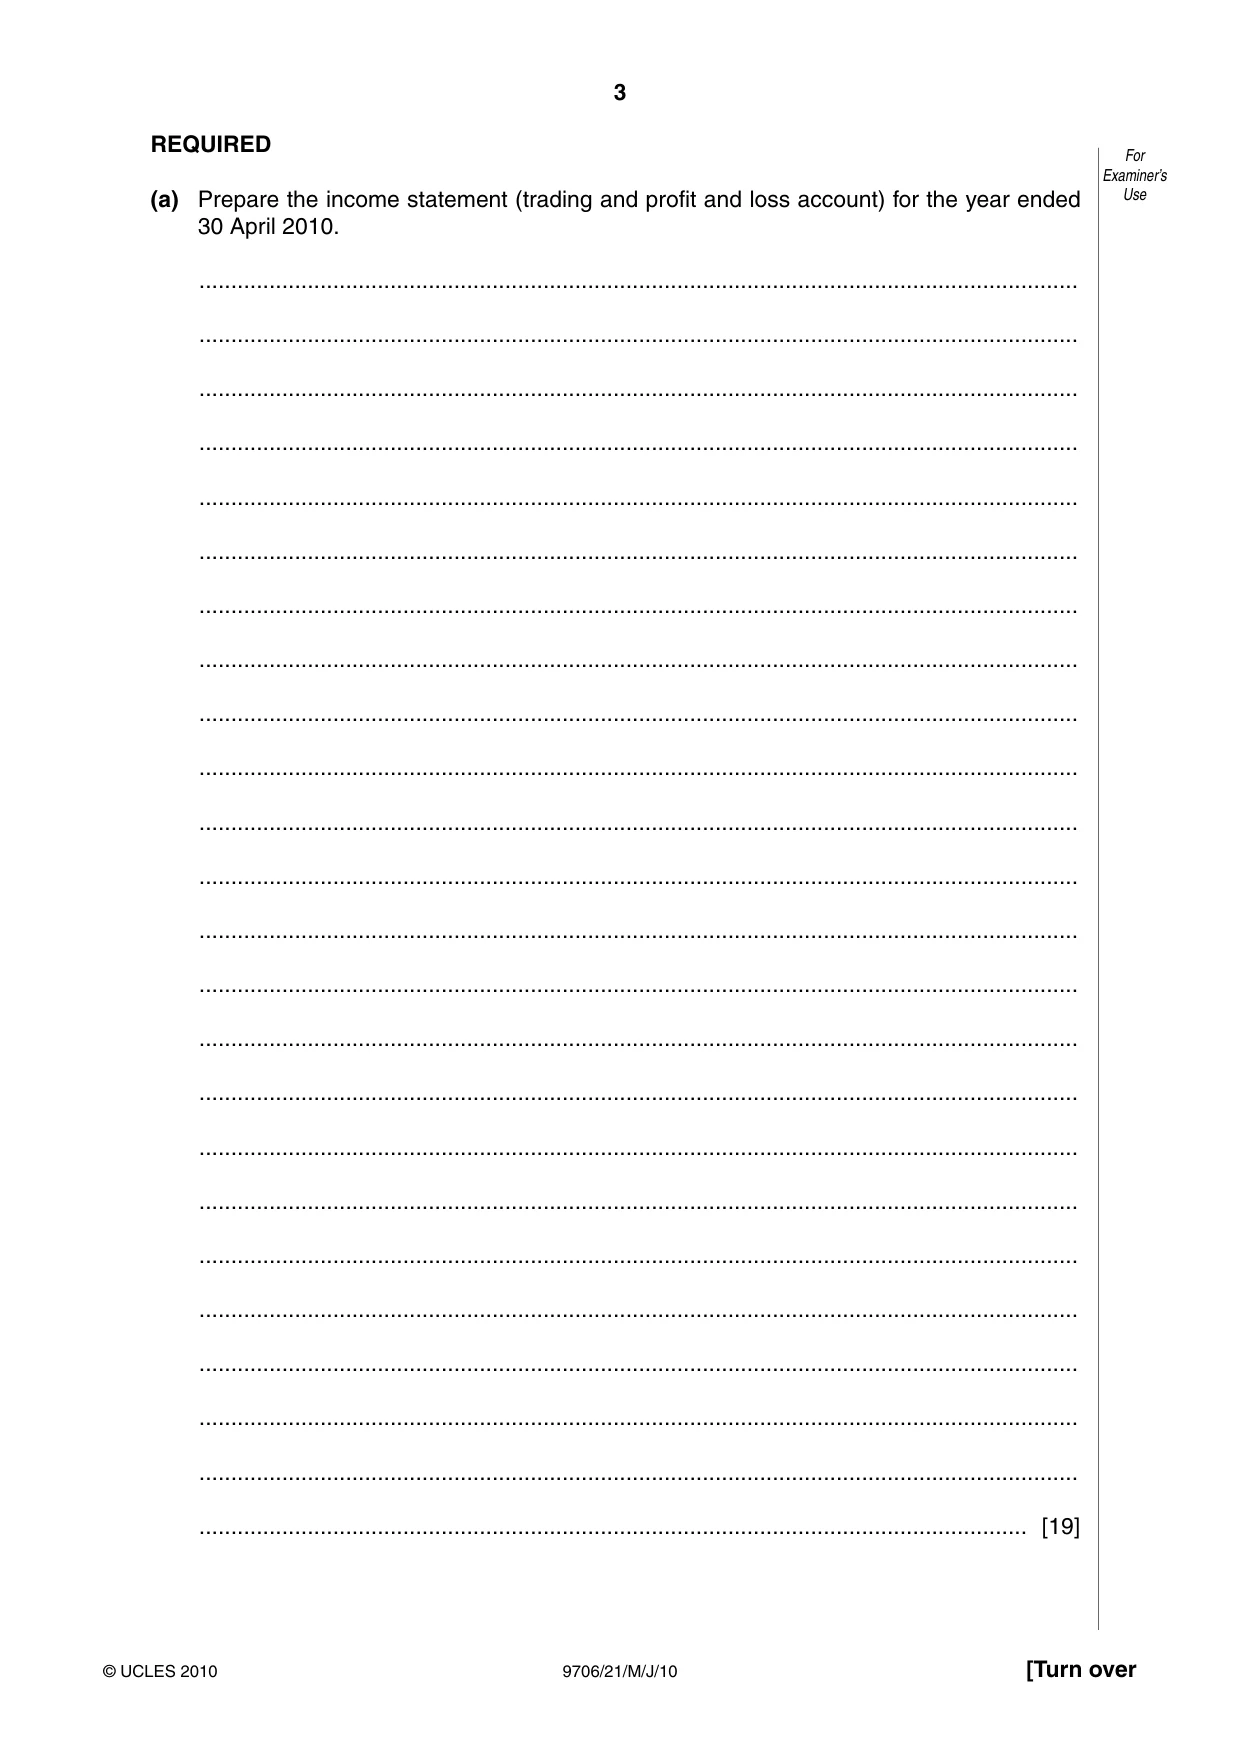
3 9706/21/M/J/10 © UCLES 2010 [Turn over For Examiner’s Use REQUIRED (a) Prepare the income statement (trading and profit and loss account) for the year ended 30 April 2010. … … … … … … … … … … … … … … … … … … … … … … … … [19]
Question paper, page 4
4 9706/21/M/J/10 © UCLES 2010 For Examiner’s Use (b) Prepare the balance sheet at 30 April 2010. … … … … … … … … … … … … … … … … … … … … … … … … [11] [Total: 30]
Question paper, page 5
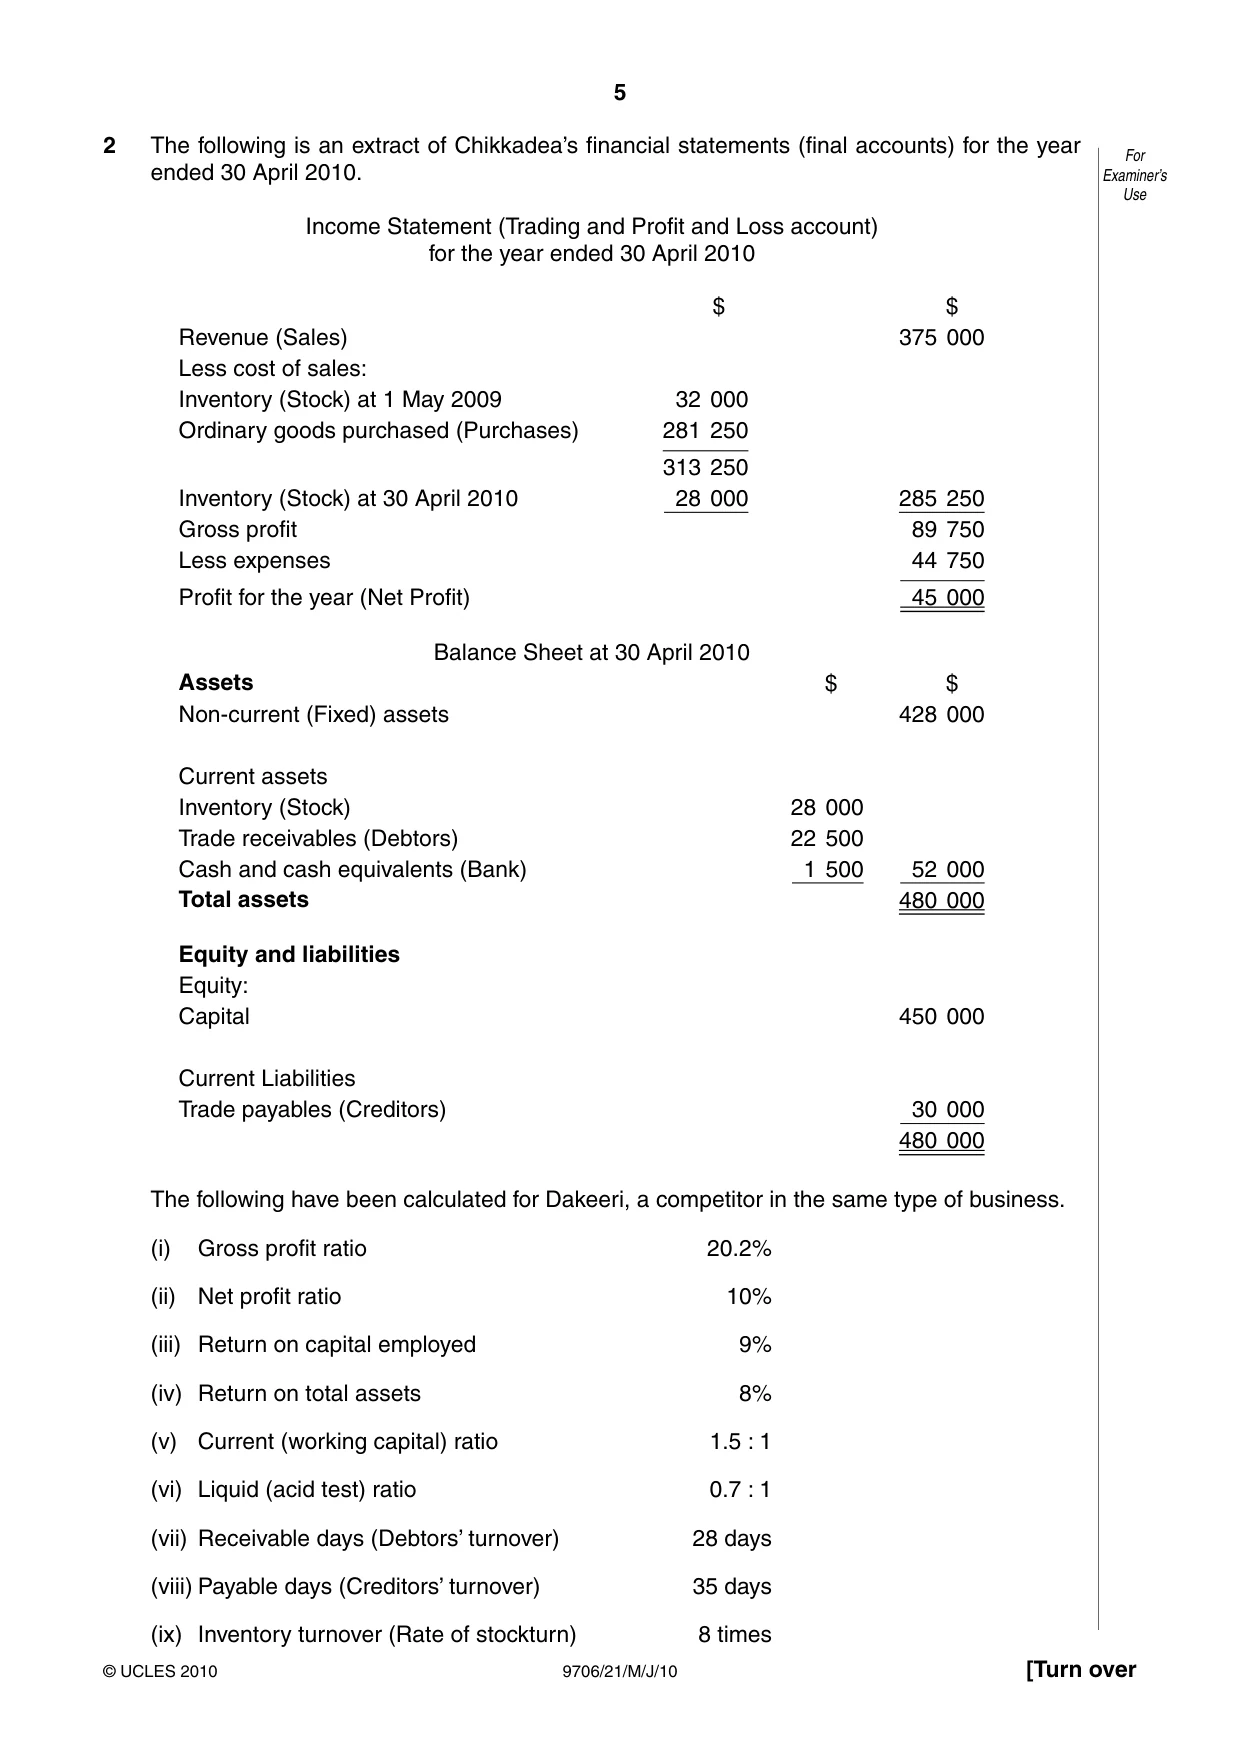
5 9706/21/M/J/10 © UCLES 2010 [Turn over For Examiner’s Use 2 The following is an extract of Chikkadea’s financial statements (final accounts) for the year ended 30 April 2010. Income Statement (Trading and Profit and Loss account) for the year ended 30 April 2010 $ $ Revenue (Sales) 375 000 Less cost of sales: Inventory (Stock) at 1 May 2009 32 000 Ordinary goods purchased (Purchases) 281 250 313 250 Inventory (Stock) at 30 April 2010 28 000 285 250 Gross profit 89 750 Less expenses 44 750 Profit for the year (Net Profit) 45 000 Balance Sheet at 30 April 2010 Assets $ $ Non-current (Fixed) assets 428 000 Current assets Inventory (Stock) 28 000 Trade receivables (Debtors) 22 500 Cash and cash equivalents (Bank) 1 500 52 000 Total assets 480 000 Equity and liabilities Equity: Capital 450 000 Current Liabilities Trade payables (Creditors) 30 000 480 000 The following have been calculated for Dakeeri, a competitor in the same type of business. (i) Gross profit ratio 20.2% (ii) Net profit ratio 10% (iii) Return on capital employed 9% (iv) Return on total assets 8% (v) Current (working capital) ratio 1.5 : 1 (vi) Liquid (acid test) ratio 0.7 : 1 (vii) Receivable days (Debtors’ turnover) 28 days (viii) Payable days (Creditors’ turnover) 35 days (ix) Inventory turnover (Rate of stockturn) 8 times
Question paper, page 6
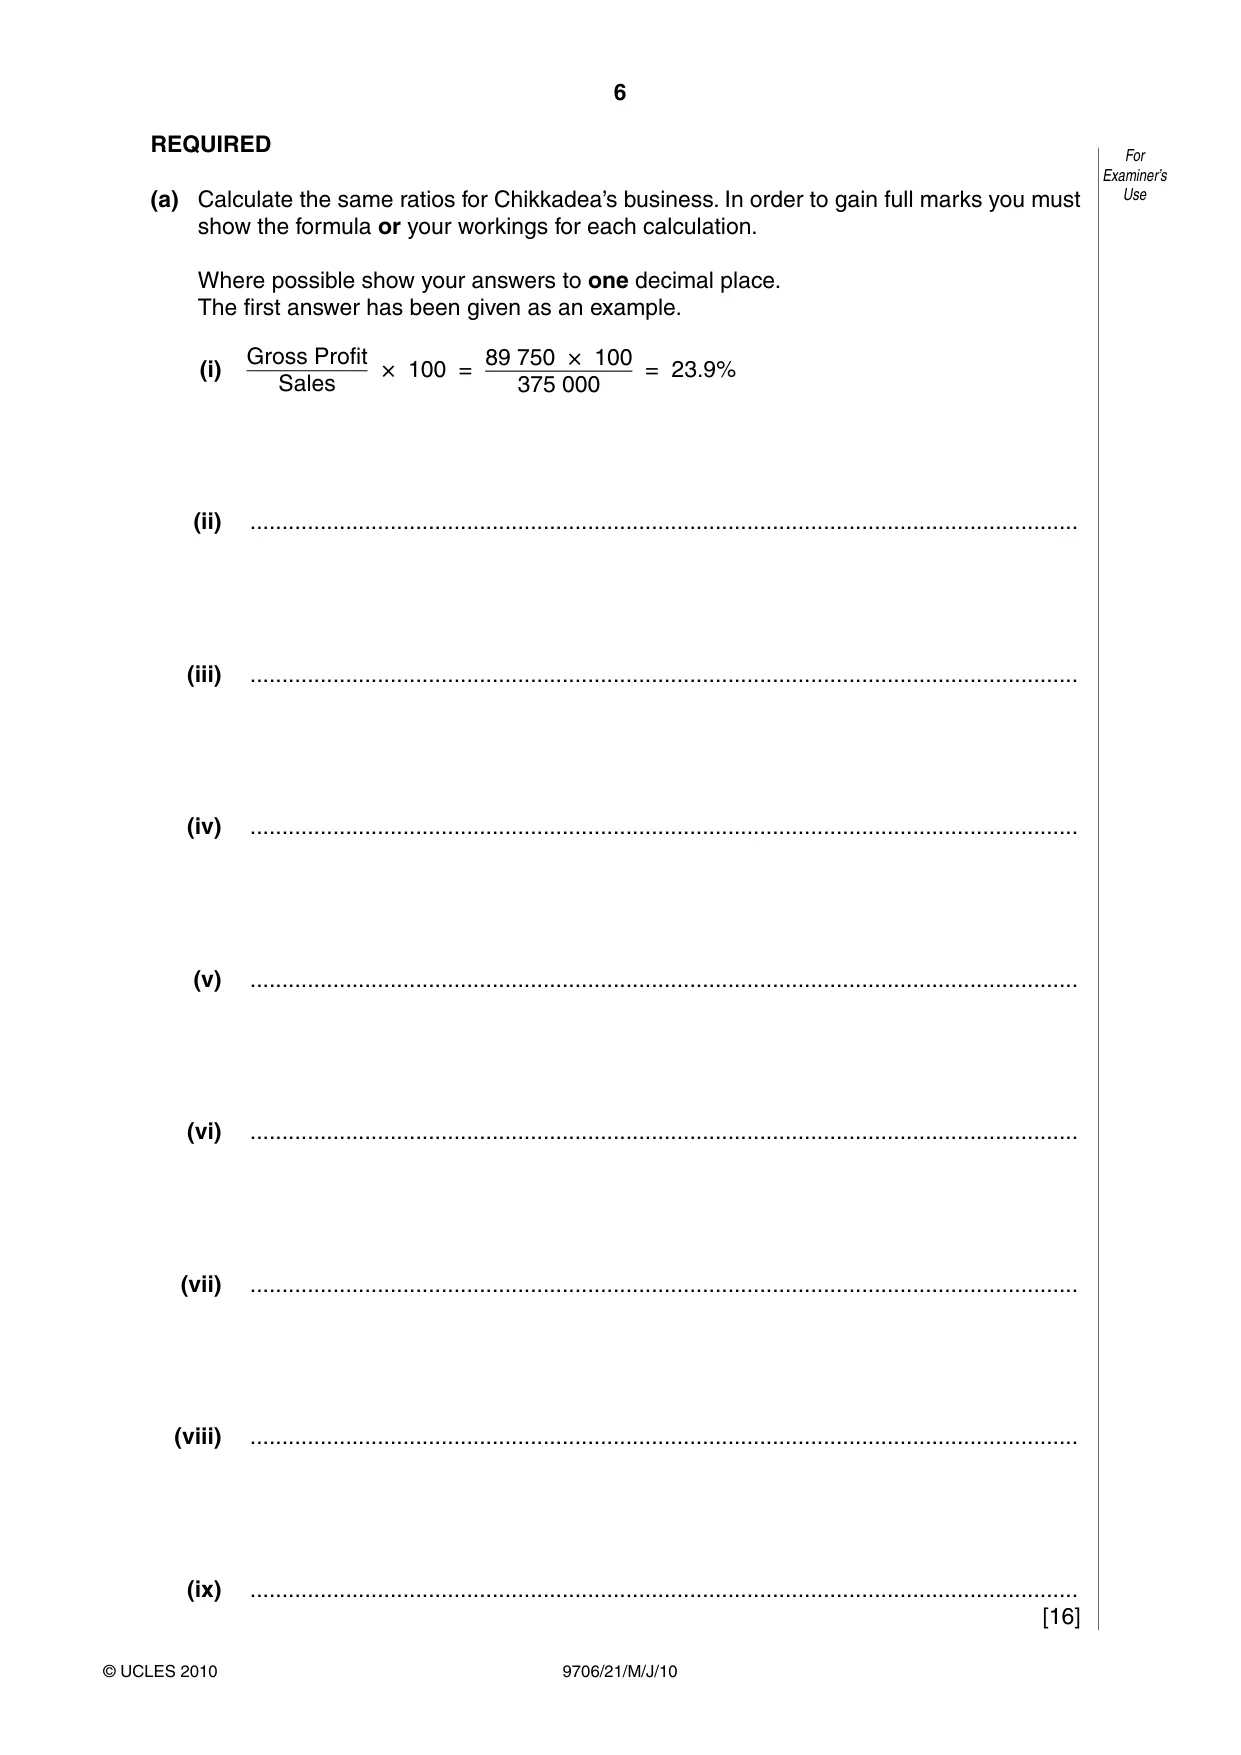
6 9706/21/M/J/10 © UCLES 2010 For Examiner’s Use REQUIRED (a) Calculate the same ratios for Chikkadea’s business. In order to gain full marks you must show the formula or your workings for each calculation. Where possible show your answers to one decimal place. The first answer has been given as an example. (i) Gross Profit Sales × 100 = 89 750 × 100 375 000 = 23.9% (ii) … (iii) … (iv) … (v) … (vi) … (vii) … (viii) … (ix) … [16]
Question paper, page 7
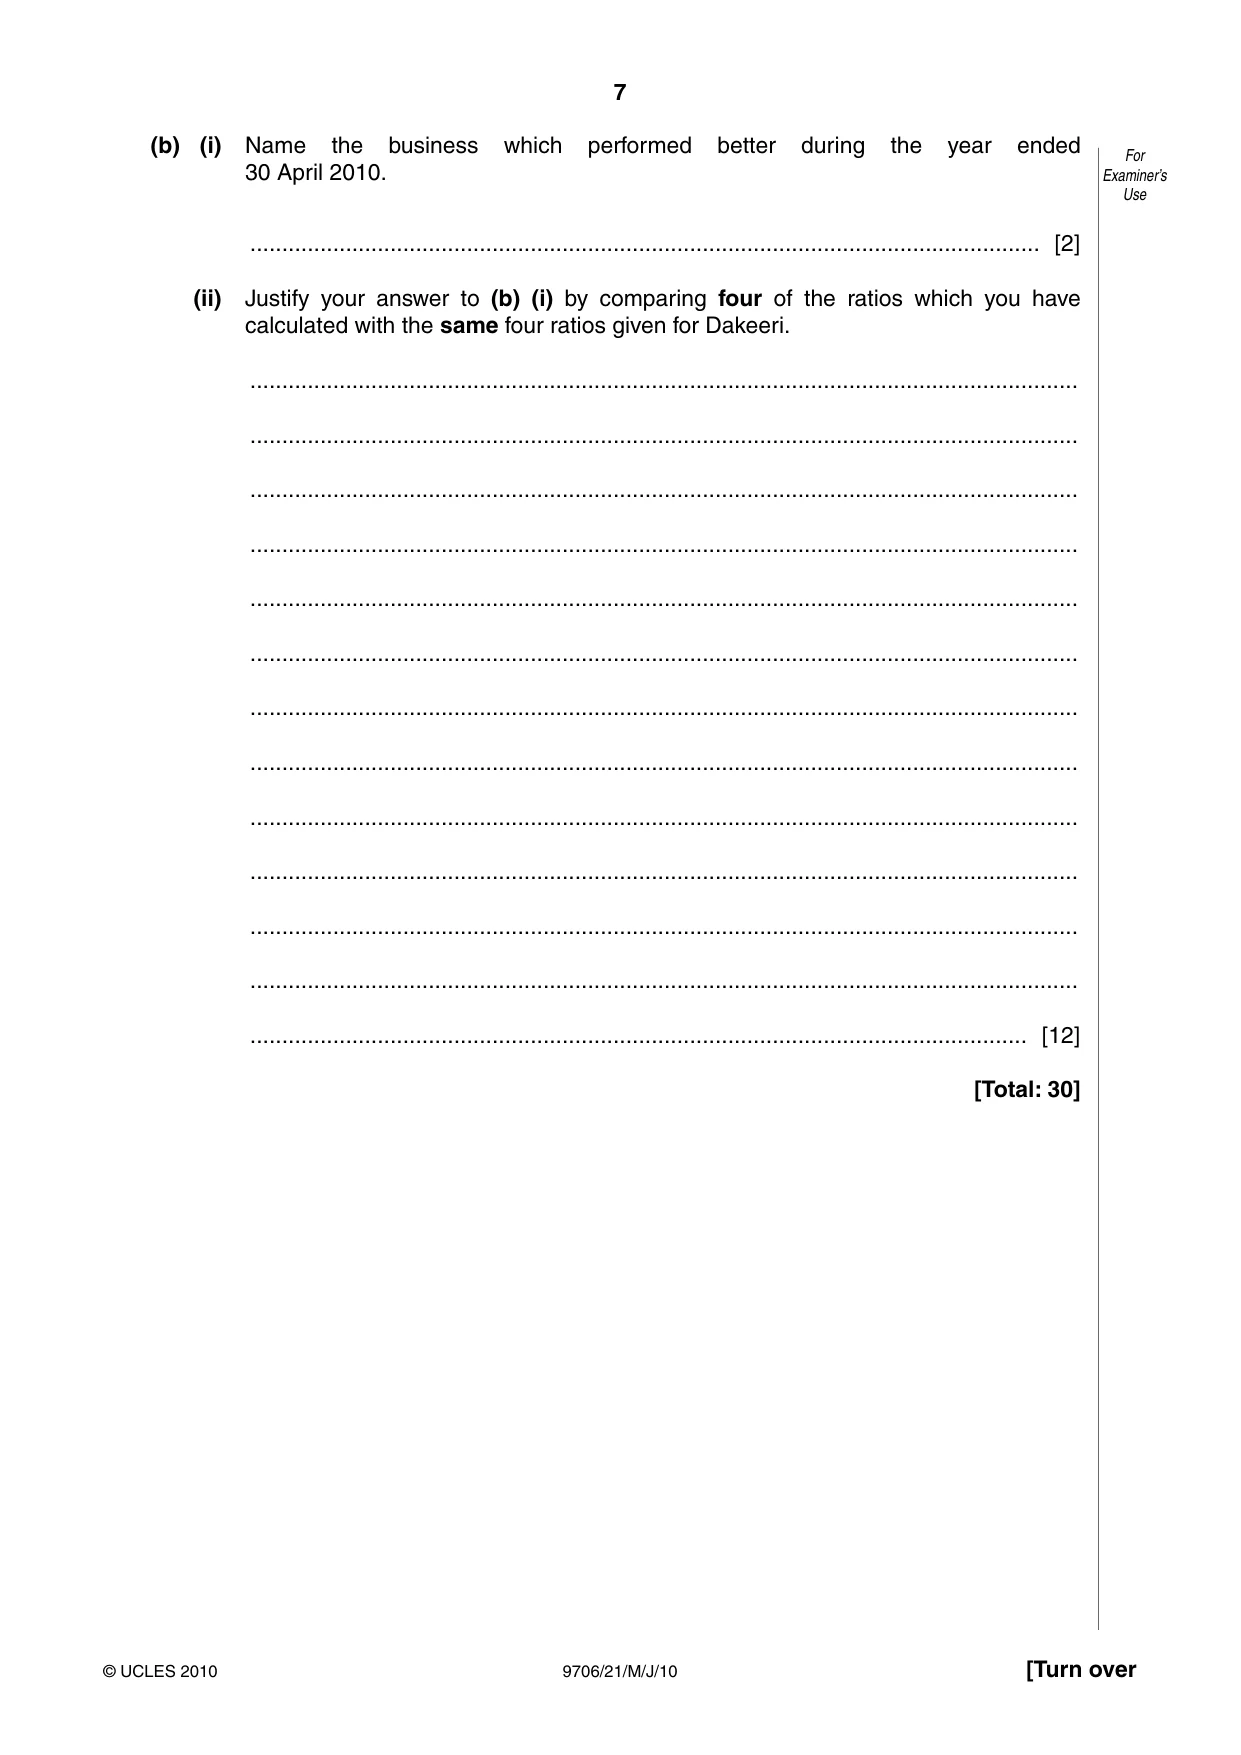
7 9706/21/M/J/10 © UCLES 2010 [Turn over For Examiner’s Use (b) (i) Name the business which performed better during the year ended 30 April 2010. … [2] (ii) Justify your answer to (b) (i) by comparing four of the ratios which you have calculated with the same four ratios given for Dakeeri. … … … … … … … … … … … … … [12] [Total: 30]
Question paper, page 8
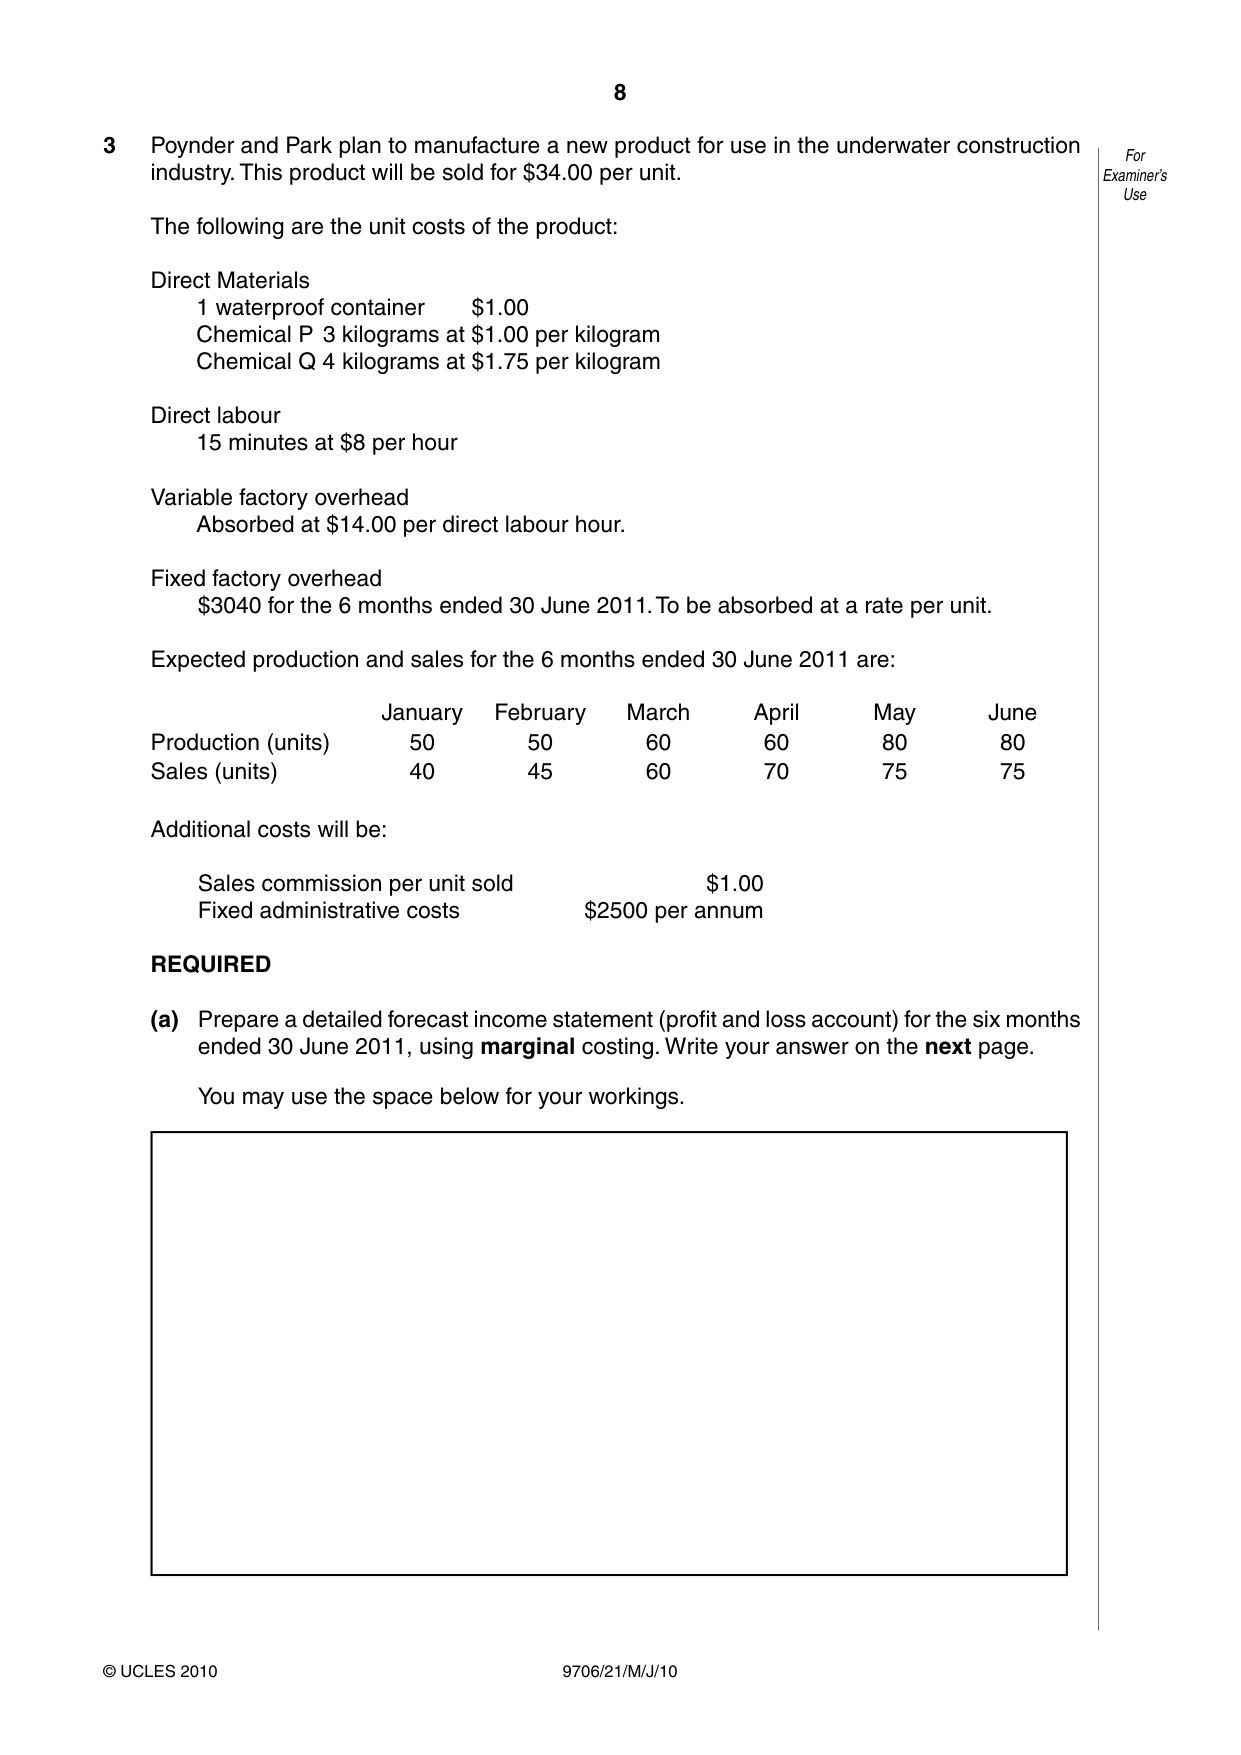
8 9706/21/M/J/10 © UCLES 2010 For Examiner’s Use 3 Poynder and Park plan to manufacture a new product for use in the underwater construction industry. This product will be sold for $34.00 per unit. The following are the unit costs of the product: Direct Materials 1 waterproof container $1.00 Chemical P 3 kilograms at $1.00 per kilogram Chemical Q 4 kilograms at $1.75 per kilogram Direct labour 15 minutes at $8 per hour Variable factory overhead Absorbed at $14.00 per direct labour hour. Fixed factory overhead $3040 for the 6 months ended 30 June 2011. To be absorbed at a rate per unit. Expected production and sales for the 6 months ended 30 June 2011 are: January February March April May June Production (units) 50 50 60 60 80 80 Sales (units) 40 45 60 70 75 75 Additional costs will be: Sales commission per unit sold $1.00 Fixed administrative costs $2500 per annum REQUIRED (a) Prepare a detailed forecast income statement (profit and loss account) for the six months ended 30 June 2011, using marginal costing. Write your answer on the next page. You may use the space below for your workings.
Question paper, page 9
9 9706/21/M/J/10 © UCLES 2010 [Turn over For Examiner’s Use Forecast income statement (profit and loss account) for the six months ended 30 June 2011, using marginal costing. … … … … … … … … … … … … … … … … … … … … … … … … [16]
Question paper, page 10
10 9706/21/M/J/10 © UCLES 2010 For Examiner’s Use REQUIRED (b) Prepare a detailed forecast income statement (profit and loss account) for the six months ended 30 June 2011, using absorption costing. … … … … … … … … … … … … … … … … … … … … … … … … [10]
Question paper, page 11
11 9706/21/M/J/10 © UCLES 2010 For Examiner’s Use (c) Prepare a statement to reconcile the profit in (a) with the profit in (b). … … … … … … … … … … [4] [Total: 30]
Question paper, page 12
12 9706/21/M/J/10 © UCLES 2010 BLANK PAGE Permission to reproduce items where third-party owned material protected by copyright is included has been sought and cleared where possible. Every reasonable effort has been made by the publisher (UCLES) to trace copyright holders, but if any items requiring clearance have unwittingly been included, the publisher will be pleased to make amends at the earliest possible opportunity. University of Cambridge International Examinations is part of the Cambridge Assessment Group. Cambridge Assessment is the brand name of University of Cambridge Local Examinations Syndicate (UCLES), which is itself a department of the University of Cambridge.
Mark scheme, page 1
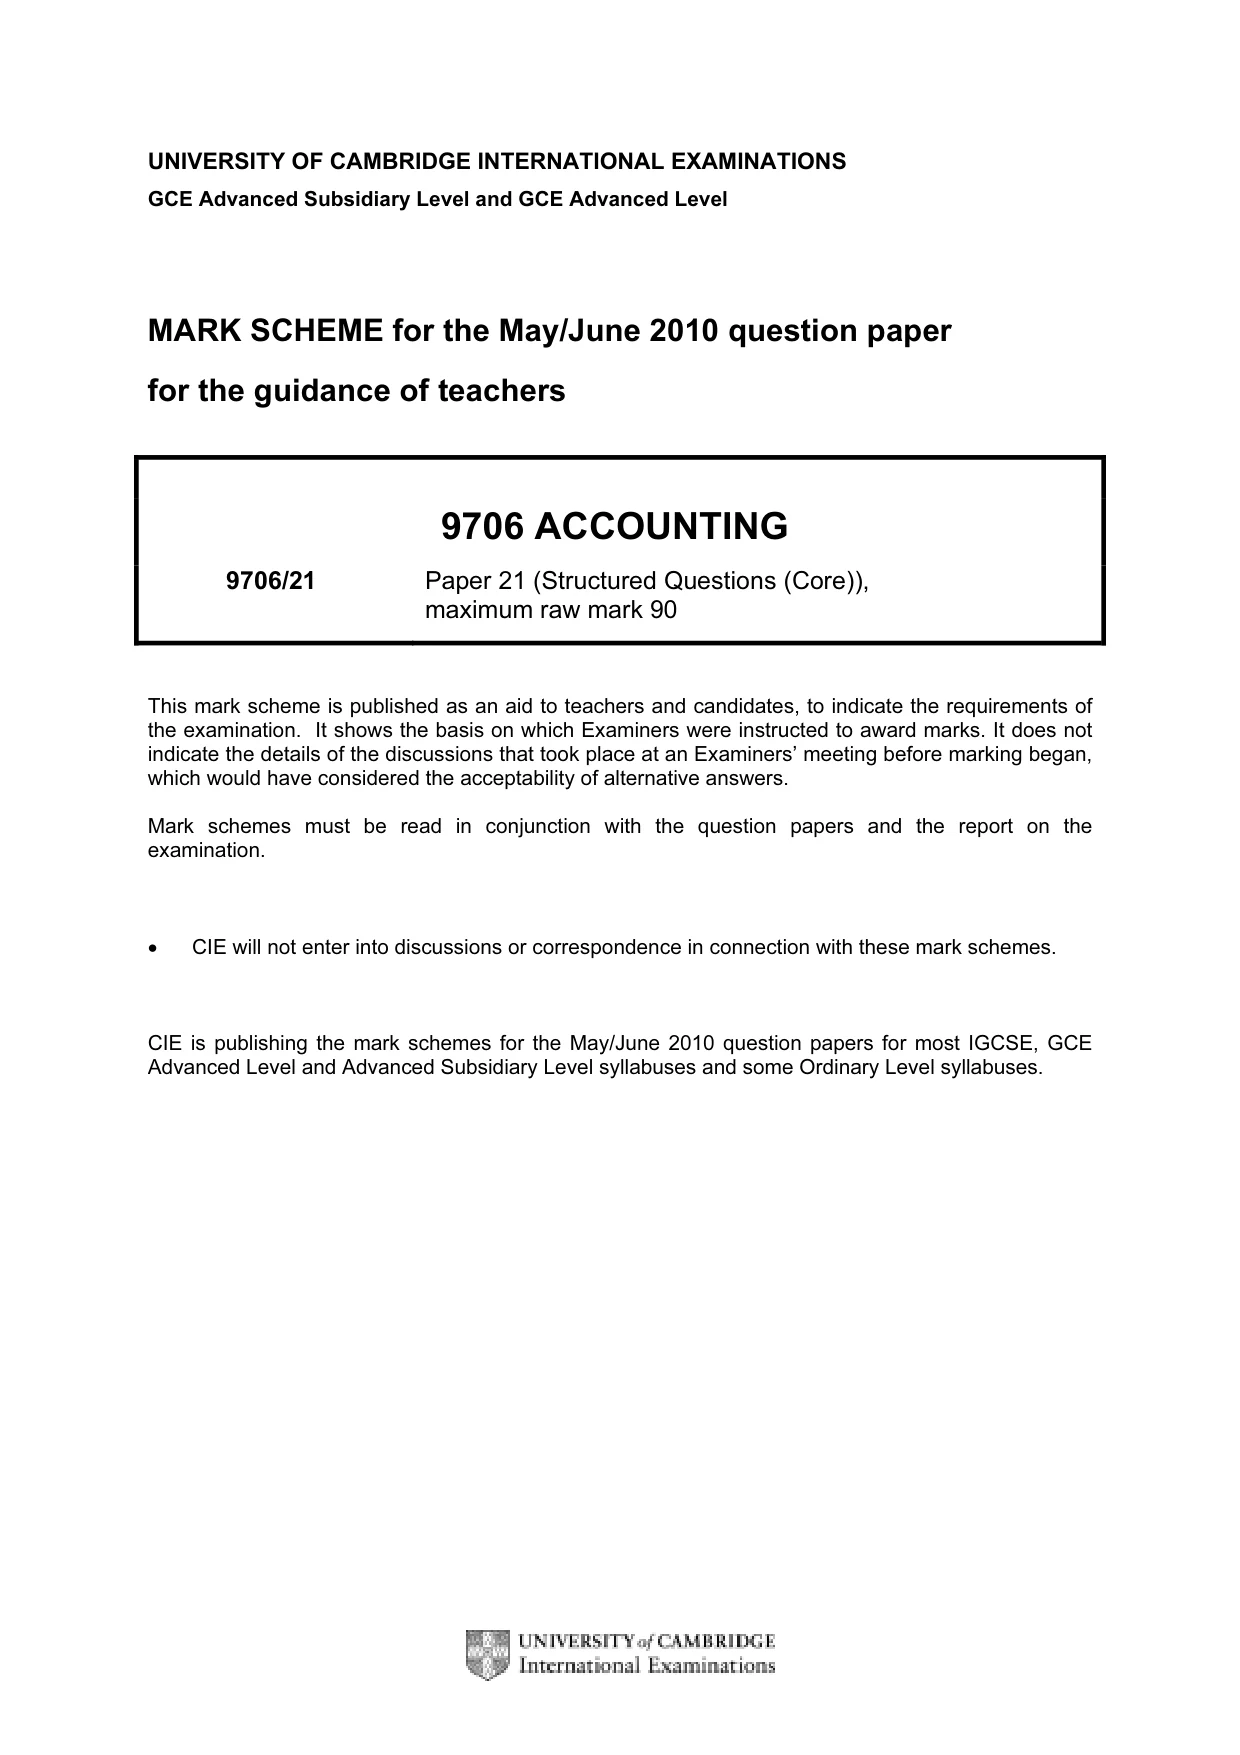
UNIVERSITY OF CAMBRIDGE INTERNATIONAL EXAMINATIONS GCE Advanced Subsidiary Level and GCE Advanced Level MARK SCHEME for the May/June 2010 question paper for the guidance of teachers 9706 ACCOUNTING 9706/21 Paper 21 (Structured Questions (Core)), maximum raw mark 90 This mark scheme is published as an aid to teachers and candidates, to indicate the requirements of the examination. It shows the basis on which Examiners were instructed to award marks. It does not indicate the details of the discussions that took place at an Examiners’ meeting before marking began, which would have considered the acceptability of alternative answers. Mark schemes must be read in conjunction with the question papers and the report on the examination. • CIE will not enter into discussions or correspondence in connection with these mark schemes. CIE is publishing the mark schemes for the May/June 2010 question papers for most IGCSE, GCE Advanced Level and Advanced Subsidiary Level syllabuses and some Ordinary Level syllabuses.
Mark scheme, page 2
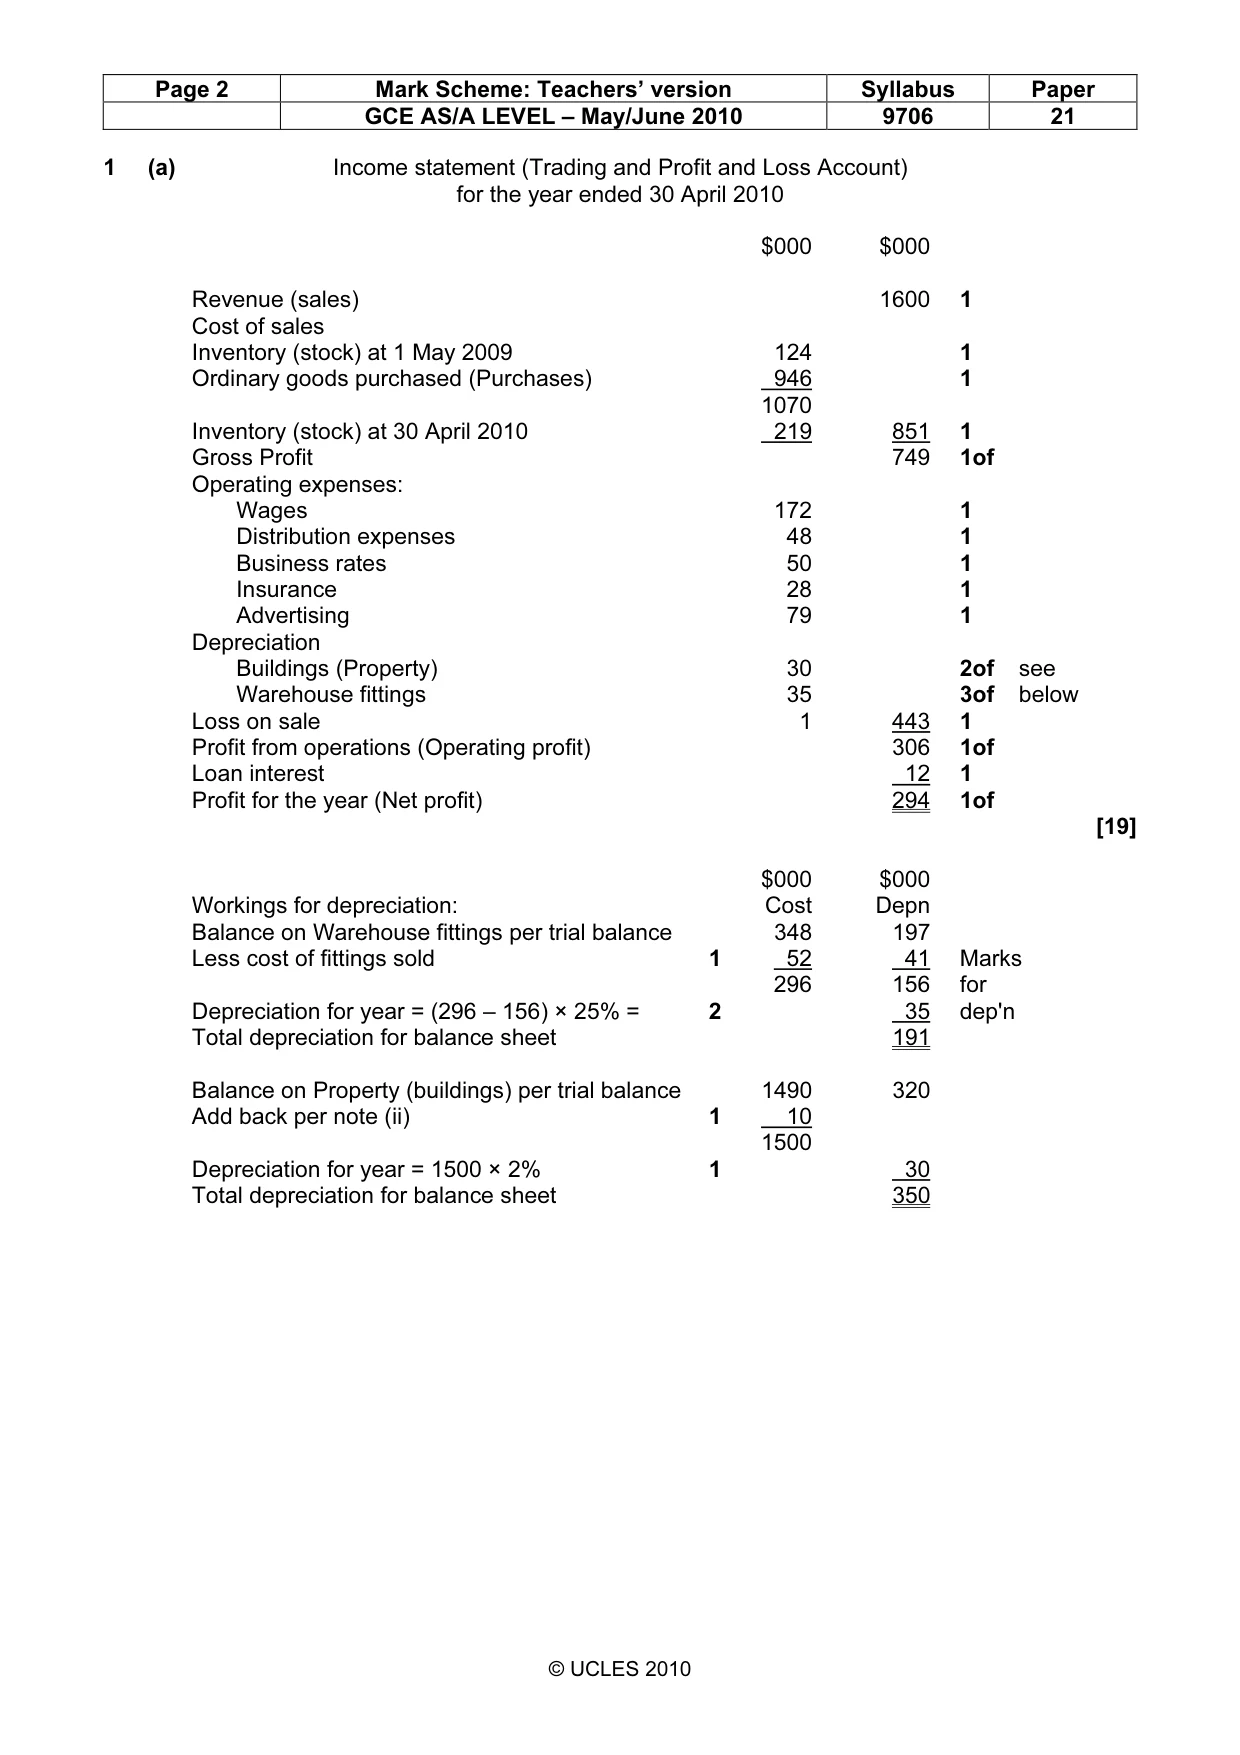
Page 2 Mark Scheme: Teachers’ version Syllabus Paper GCE AS/A LEVEL – May/June 2010 9706 21 © UCLES 2010 1 (a) Income statement (Trading and Profit and Loss Account) for the year ended 30 April 2010 $000 $000 Revenue (sales) 1600 1 Cost of sales Inventory (stock) at 1 May 2009 124 1 Ordinary goods purchased (Purchases) 946 1 1070 Inventory (stock) at 30 April 2010 219 851 1 Gross Profit 749 1of Operating expenses: Wages 172 1 Distribution expenses 48 1 Business rates 50 1 Insurance 28 1 Advertising 79 1 Depreciation Buildings (Property) 30 2of see Warehouse fittings 35 3of below Loss on sale 1 443 1 Profit from operations (Operating profit) 306 1of Loan interest 12 1 Profit for the year (Net profit) 294 1of [19] $000 $000 Workings for depreciation: Cost Depn Balance on Warehouse fittings per trial balance 348 197 Less cost of fittings sold 1 52 41 Marks 296 156 for Depreciation for year = (296 – 156) × 25% = 2 35 dep'n Total depreciation for balance sheet 191 Balance on Property (buildings) per trial balance 1490 320 Add back per note (ii) 1 10 1500 Depreciation for year = 1500 × 2% 1 30 Total depreciation for balance sheet 350
Mark scheme, page 3
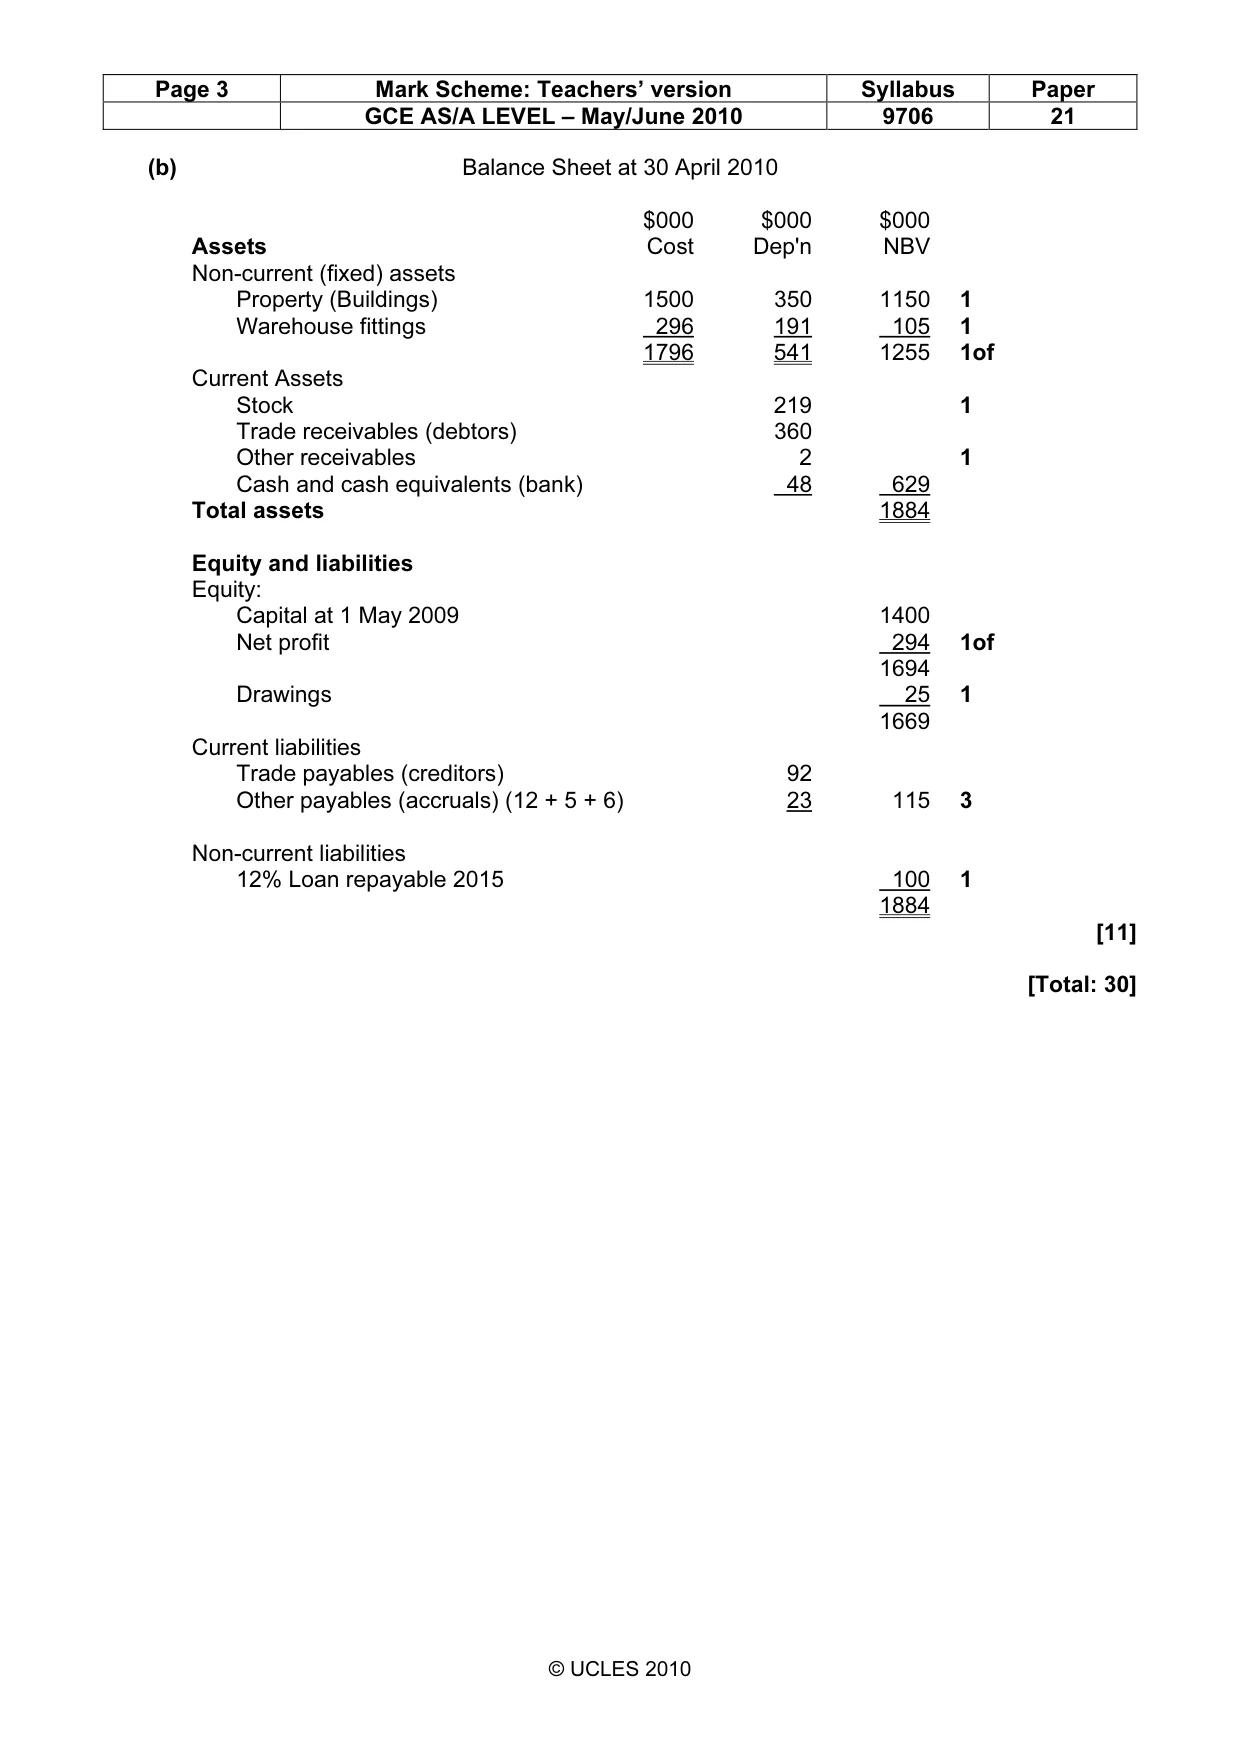
Page 3 Mark Scheme: Teachers’ version Syllabus Paper GCE AS/A LEVEL – May/June 2010 9706 21 © UCLES 2010 (b) Balance Sheet at 30 April 2010 $000 $000 $000 Assets Cost Dep'n NBV Non-current (fixed) assets Property (Buildings) 1500 350 1150 1 Warehouse fittings 296 191 105 1 1796 541 1255 1of Current Assets Stock 219 1 Trade receivables (debtors) 360 Other receivables 2 1 Cash and cash equivalents (bank) 48 629 Total assets 1884 Equity and liabilities Equity: Capital at 1 May 2009 1400 Net profit 294 1of 1694 Drawings 25 1 1669 Current liabilities Trade payables (creditors) 92 Other payables (accruals) (12 + 5 + 6) 23 115 3 Non-current liabilities 12% Loan repayable 2015 100 1 1884 [11] [Total: 30]
Mark scheme, page 4
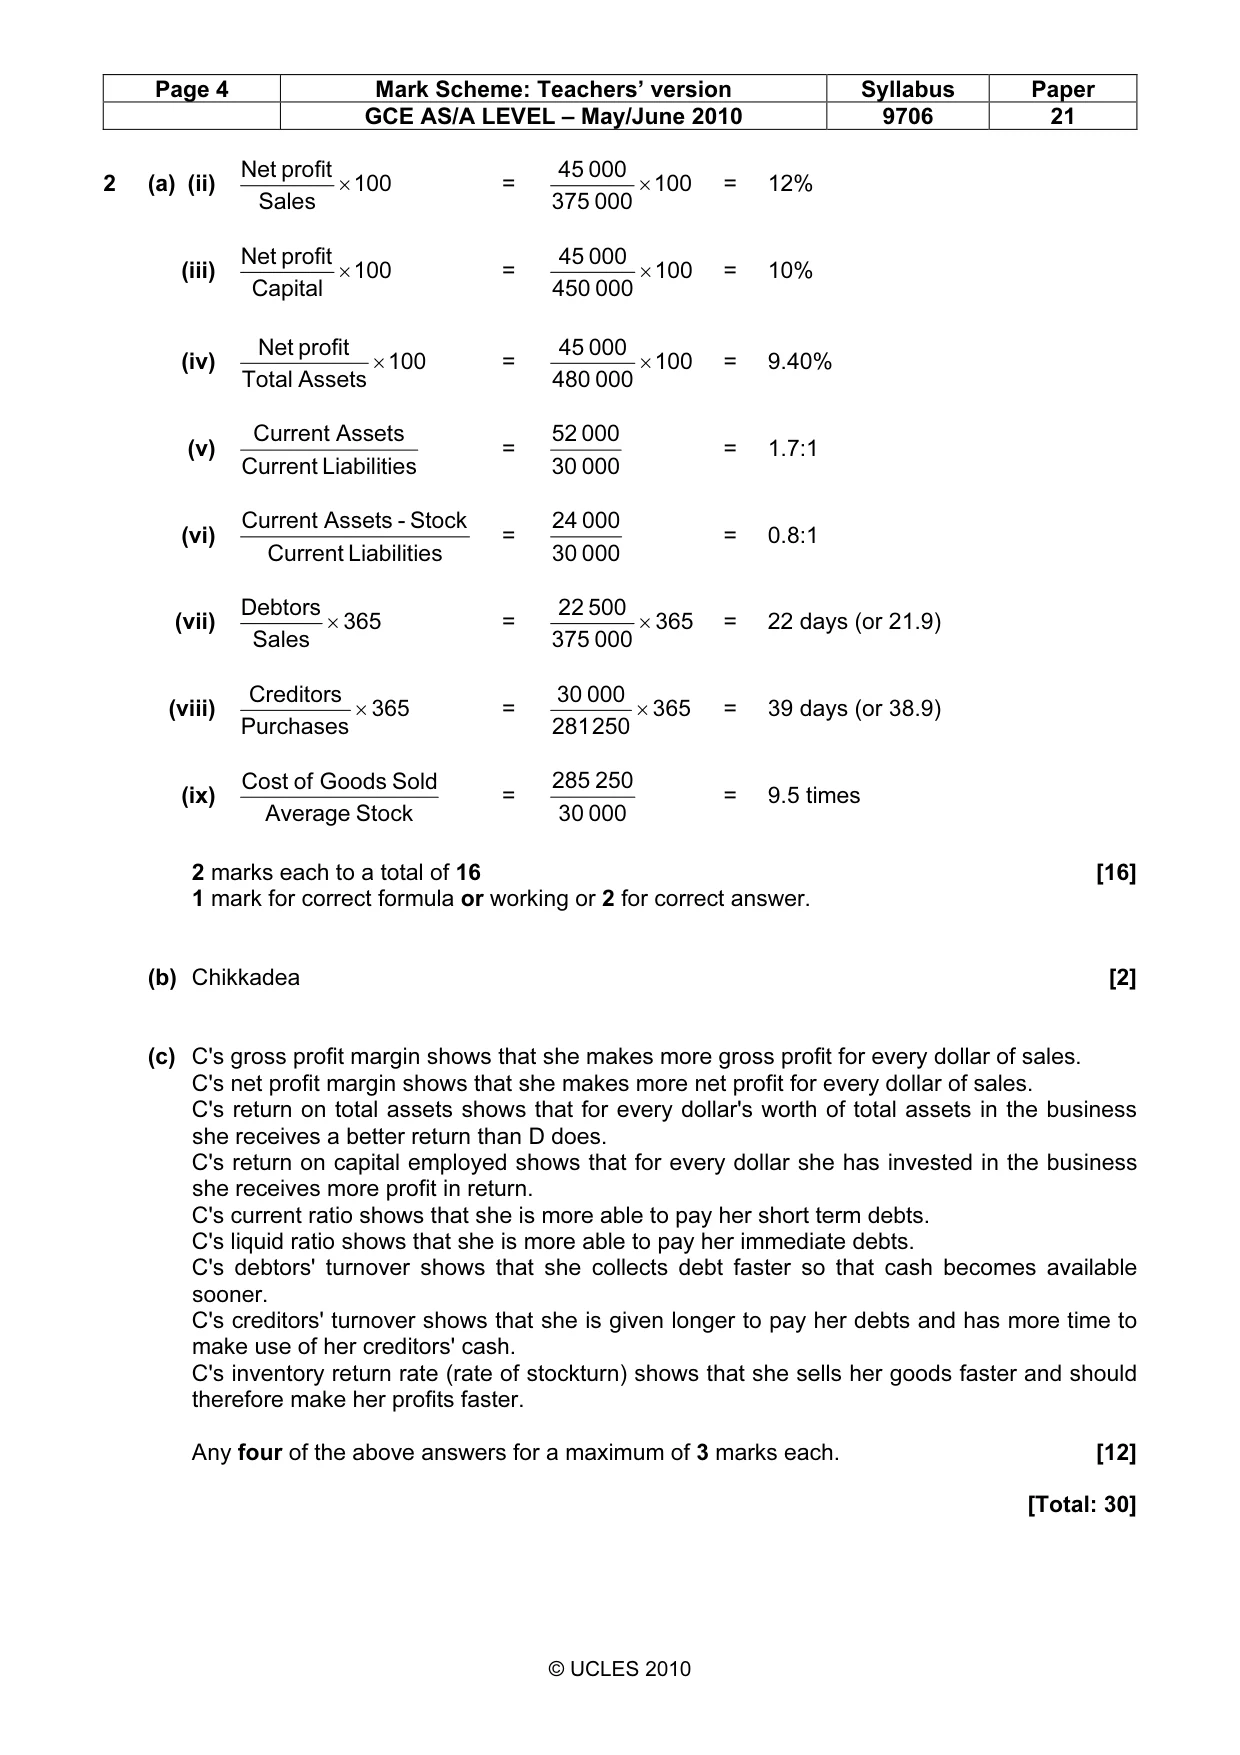
Page 4 Mark Scheme: Teachers’ version Syllabus Paper GCE AS/A LEVEL – May/June 2010 9706 21 © UCLES 2010 2 (a) (ii) 100 Sales profit Net × = 100 000 375 000 45 × = 12% (iii) 100 Capital profit Net × = 100 000 450 000 45 × = 10% (iv) 100 Assets Total profit Net × = 100 000 480 000 45 × = 9.40% (v) s Liabilitie Current Assets Current = 000 30 000 52 = 1.7:1 (vi) s Liabilitie Current Stock - Assets Current = 000 30 000 24 = 0.8:1 (vii) 365 Sales Debtors × = 365 000 375 500 22 × = 22 days (or 21.9) (viii) 365 Purchases Creditors × = 365 250 281 000 30 × = 39 days (or 38.9) (ix) Stock Average Sold Goods of Cost = 000 30 250 285 = 9.5 times 2 marks each to a total of 16 [16] 1 mark for correct formula or working or 2 for correct answer. (b) Chikkadea [2] (c) C's gross profit margin shows that she makes more gross profit for every dollar of sales. C's net profit margin shows that she makes more net profit for every dollar of sales. C's return on total assets shows that for every dollar's worth of total assets in the business she receives a better return than D does. C's return on capital employed shows that for every dollar she has invested in the business she receives more profit in return. C's current ratio shows that she is more able to pay her short term debts. C's liquid ratio shows that she is more able to pay her immediate debts. C's debtors' turnover shows that she collects debt faster so that cash becomes available sooner. C's creditors' turnover shows that she is given longer to pay her debts and has more time to make use of her creditors' cash. C's inventory return rate (rate of stockturn) shows that she sells her goods faster and should therefore make her profits faster. Any four of the above answers for a maximum of 3 marks each. [12] [Total: 30]
Mark scheme, page 5
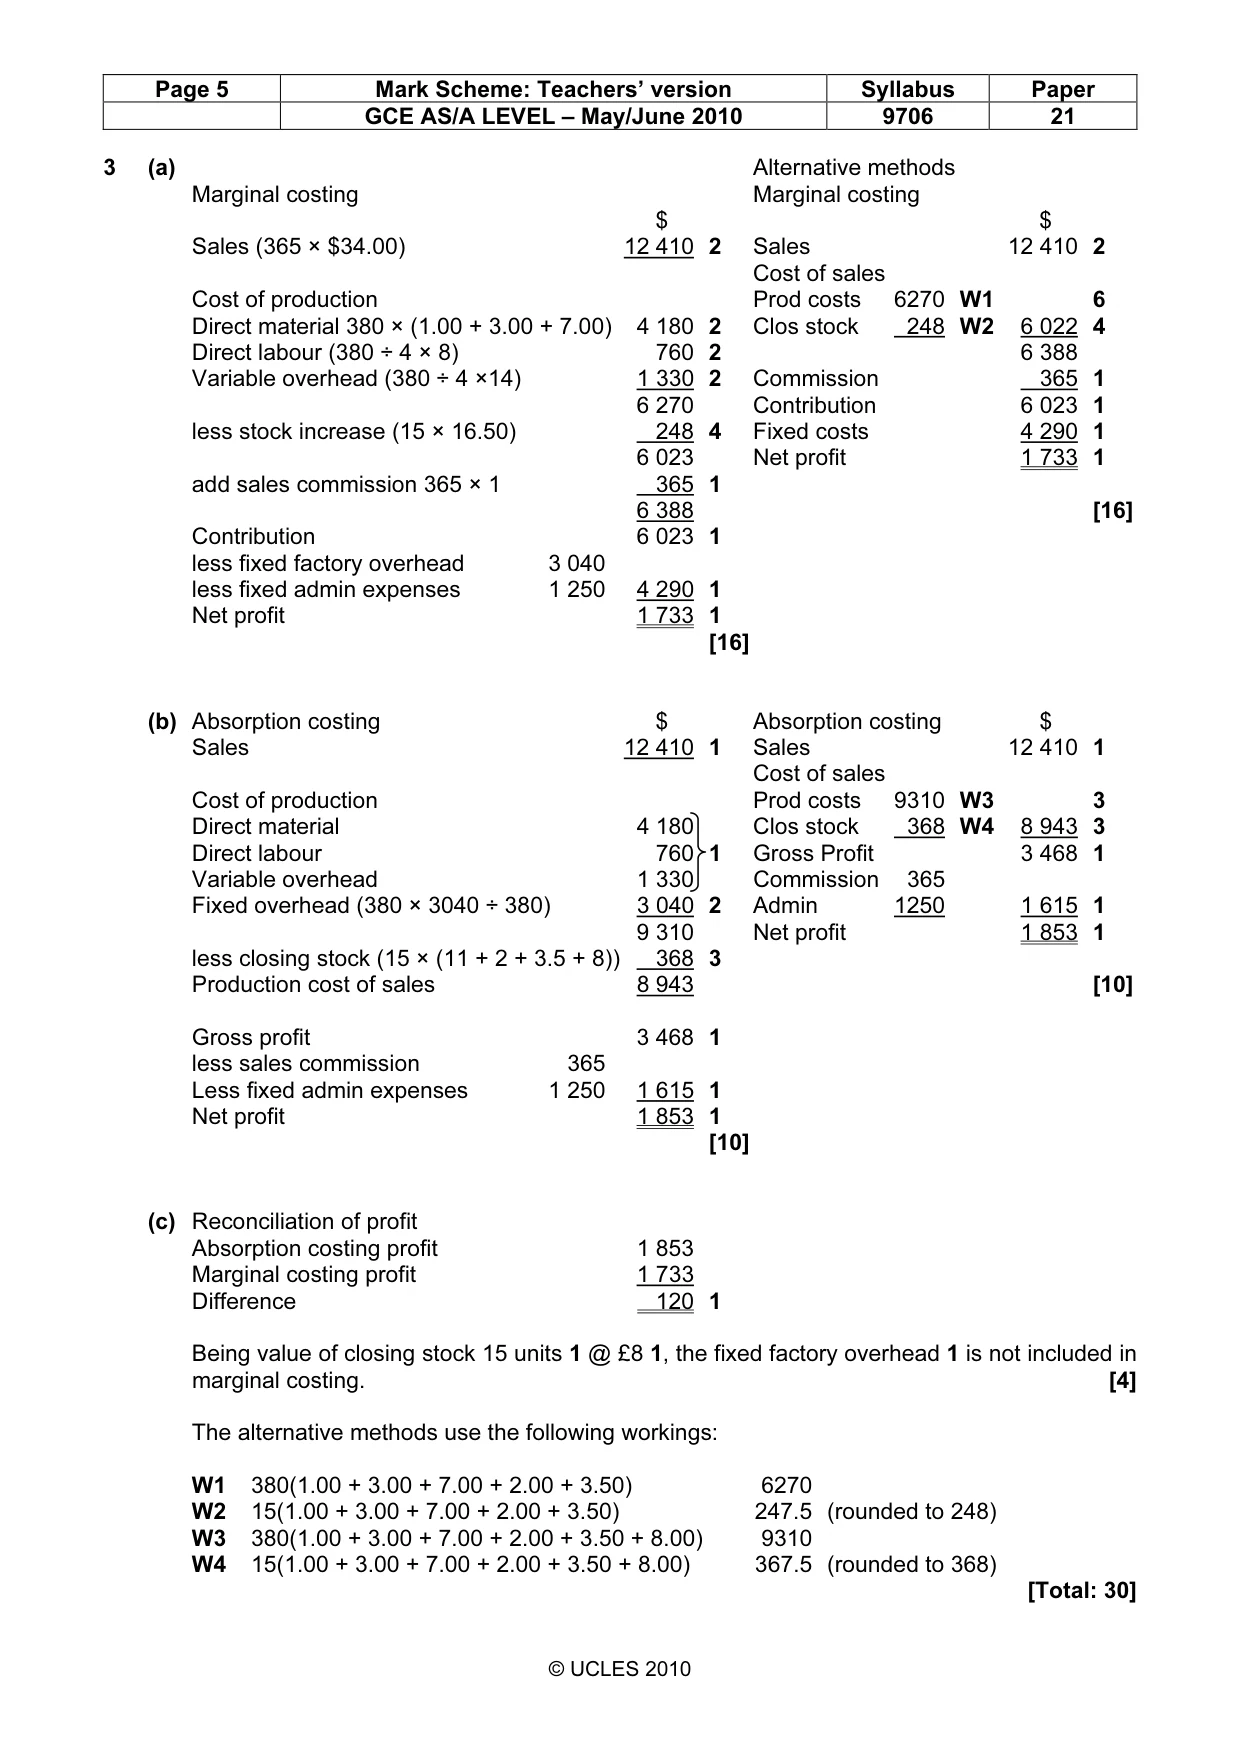
Page 5 Mark Scheme: Teachers’ version Syllabus Paper GCE AS/A LEVEL – May/June 2010 9706 21 © UCLES 2010 3 (a) Alternative methods Marginal costing Marginal costing $ $ Sales (365 × $34.00) 12 410 2 Sales 12 410 2 Cost of sales Cost of production Prod costs 6270 W1 6 Direct material 380 × (1.00 + 3.00 + 7.00) 4 180 2 Clos stock 248 W2 6 022 4 Direct labour (380 ÷ 4 × 8) 760 2 6 388 Variable overhead (380 ÷ 4 ×14) 1 330 2 Commission 365 1 6 270 Contribution 6 023 1 less stock increase (15 × 16.50) 248 4 Fixed costs 4 290 1 6 023 Net profit 1 733 1 add sales commission 365 × 1 365 1 6 388 [16] Contribution 6 023 1 less fixed factory overhead 3 040 less fixed admin expenses 1 250 4 290 1 Net profit 1 733 1 [16] (b) Absorption costing $ Absorption costing $ Sales 12 410 1 Sales 12 410 1 Cost of sales Cost of production Prod costs 9310 W3 3 Direct material 4 180 Clos stock 368 W4 8 943 3 Direct labour 760 1 Gross Profit 3 468 1 Variable overhead 1 330 Commission 365 Fixed overhead (380 × 3040 ÷ 380) 3 040 2 Admin 1250 1 615 1 9 310 Net profit 1 853 1 less closing stock (15 × (11 + 2 + 3.5 + 8)) 368 3 Production cost of sales 8 943 [10] Gross profit 3 468 1 less sales commission 365 Less fixed admin expenses 1 250 1 615 1 Net profit 1 853 1 [10] (c) Reconciliation of profit Absorption costing profit 1 853 Marginal costing profit 1 733 Difference 120 1 Being value of closing stock 15 units 1 @ £8 1, the fixed factory overhead 1 is not included in marginal costing. [4] The alternative methods use the following workings: W1 380(1.00 + 3.00 + 7.00 + 2.00 + 3.50) 6270 W2 15(1.00 + 3.00 + 7.00 + 2.00 + 3.50) 247.5 (rounded to 248) W3 380(1.00 + 3.00 + 7.00 + 2.00 + 3.50 + 8.00) 9310 W4 15(1.00 + 3.00 + 7.00 + 2.00 + 3.50 + 8.00) 367.5 (rounded to 368) [Total: 30]
What you needed in this session
Cambridge’s own grade thresholds for 2010 May/June, Paper 2 · Variant 1. A higher threshold means an easier paper — the bar moves with how the cohort did.