Cambridge IGCSE Sciences - Co-ordinated (Double) 0654 — 2020 May/June Paper 6 · Variant 2
0654/62/M/J/20 · 7 questions · 60 marks · ≈68 min
The question paper and its mark scheme, free to read here and free to download. This is Cambridge’s own paper, exactly as it was sat.
Question paper20 pages




Mark scheme9 pages
Answers below. Sit the paper first if you are practising.
Questions as text
Q1 · A student investigates an enzyme used in the extraction of apple juice
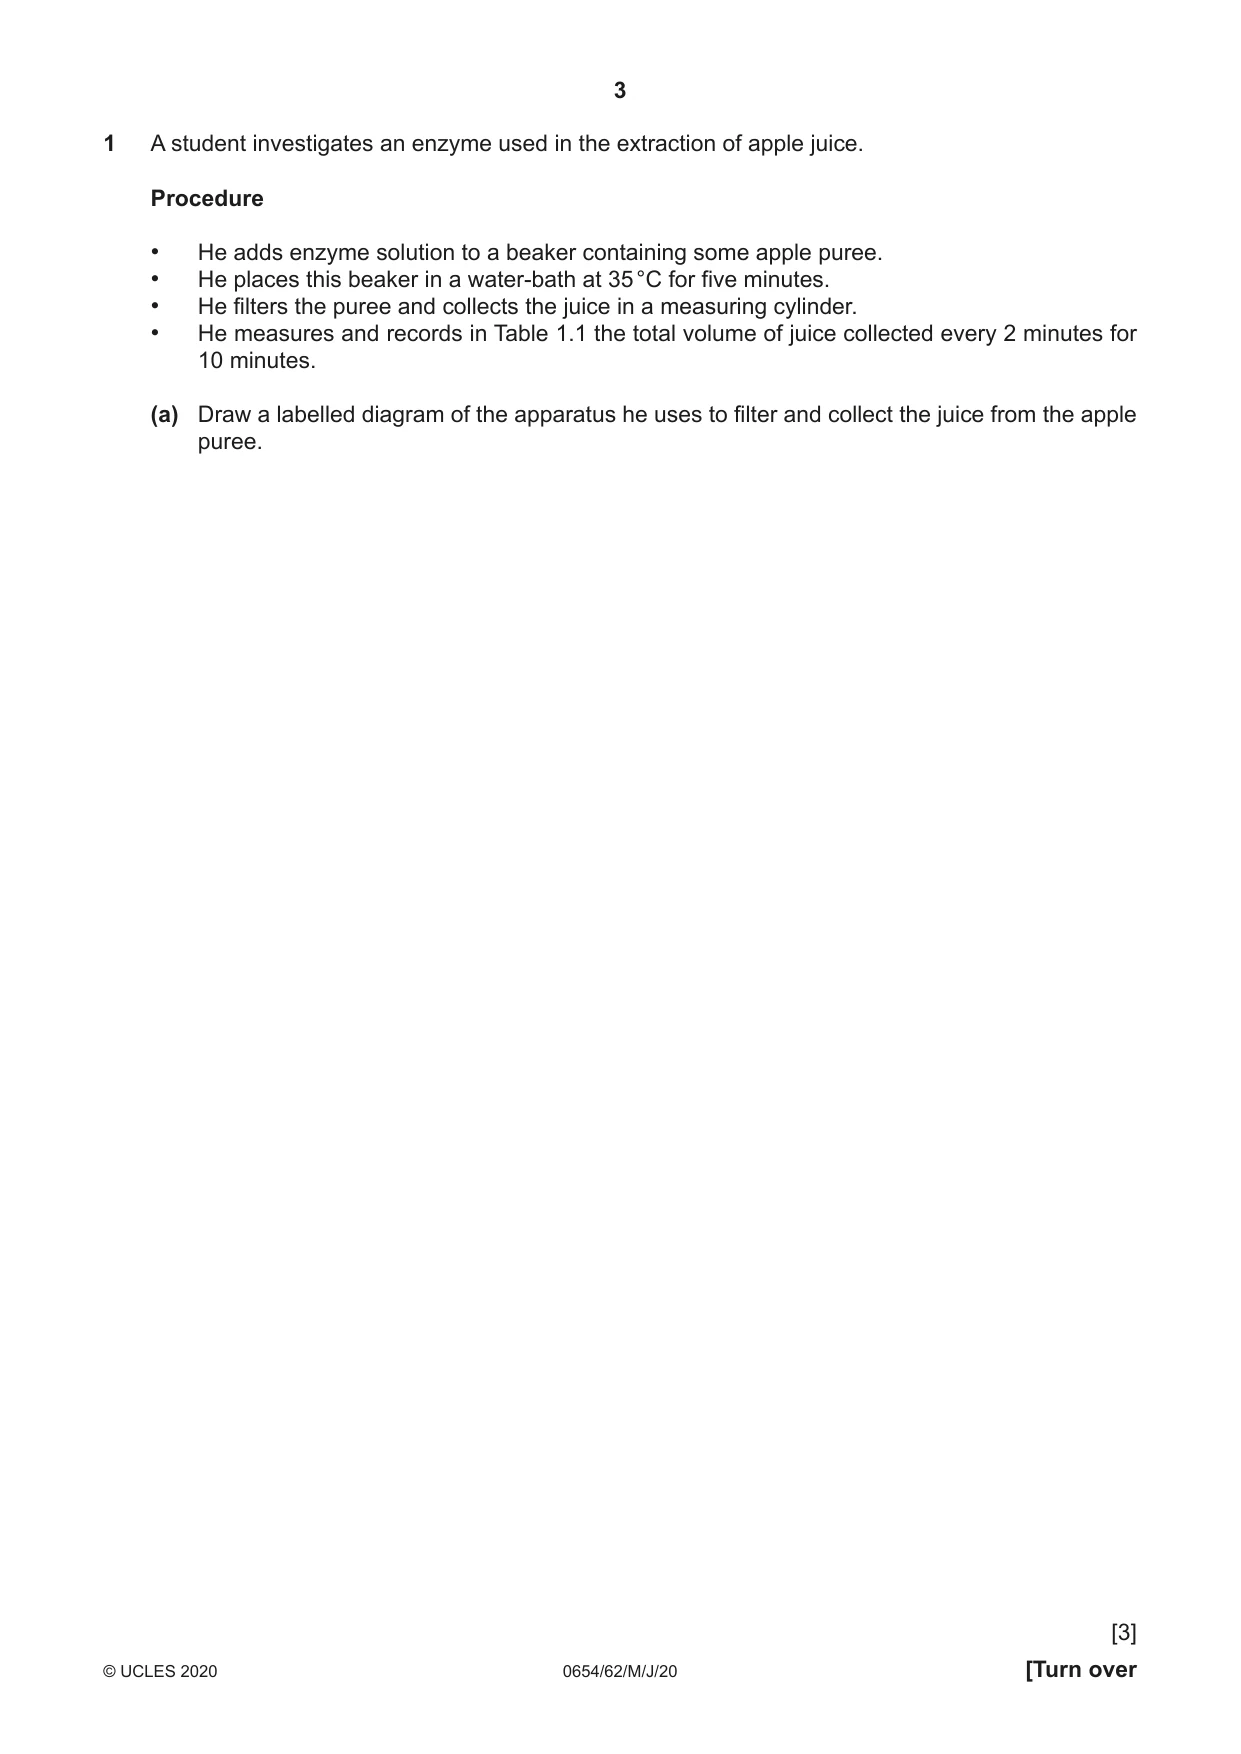
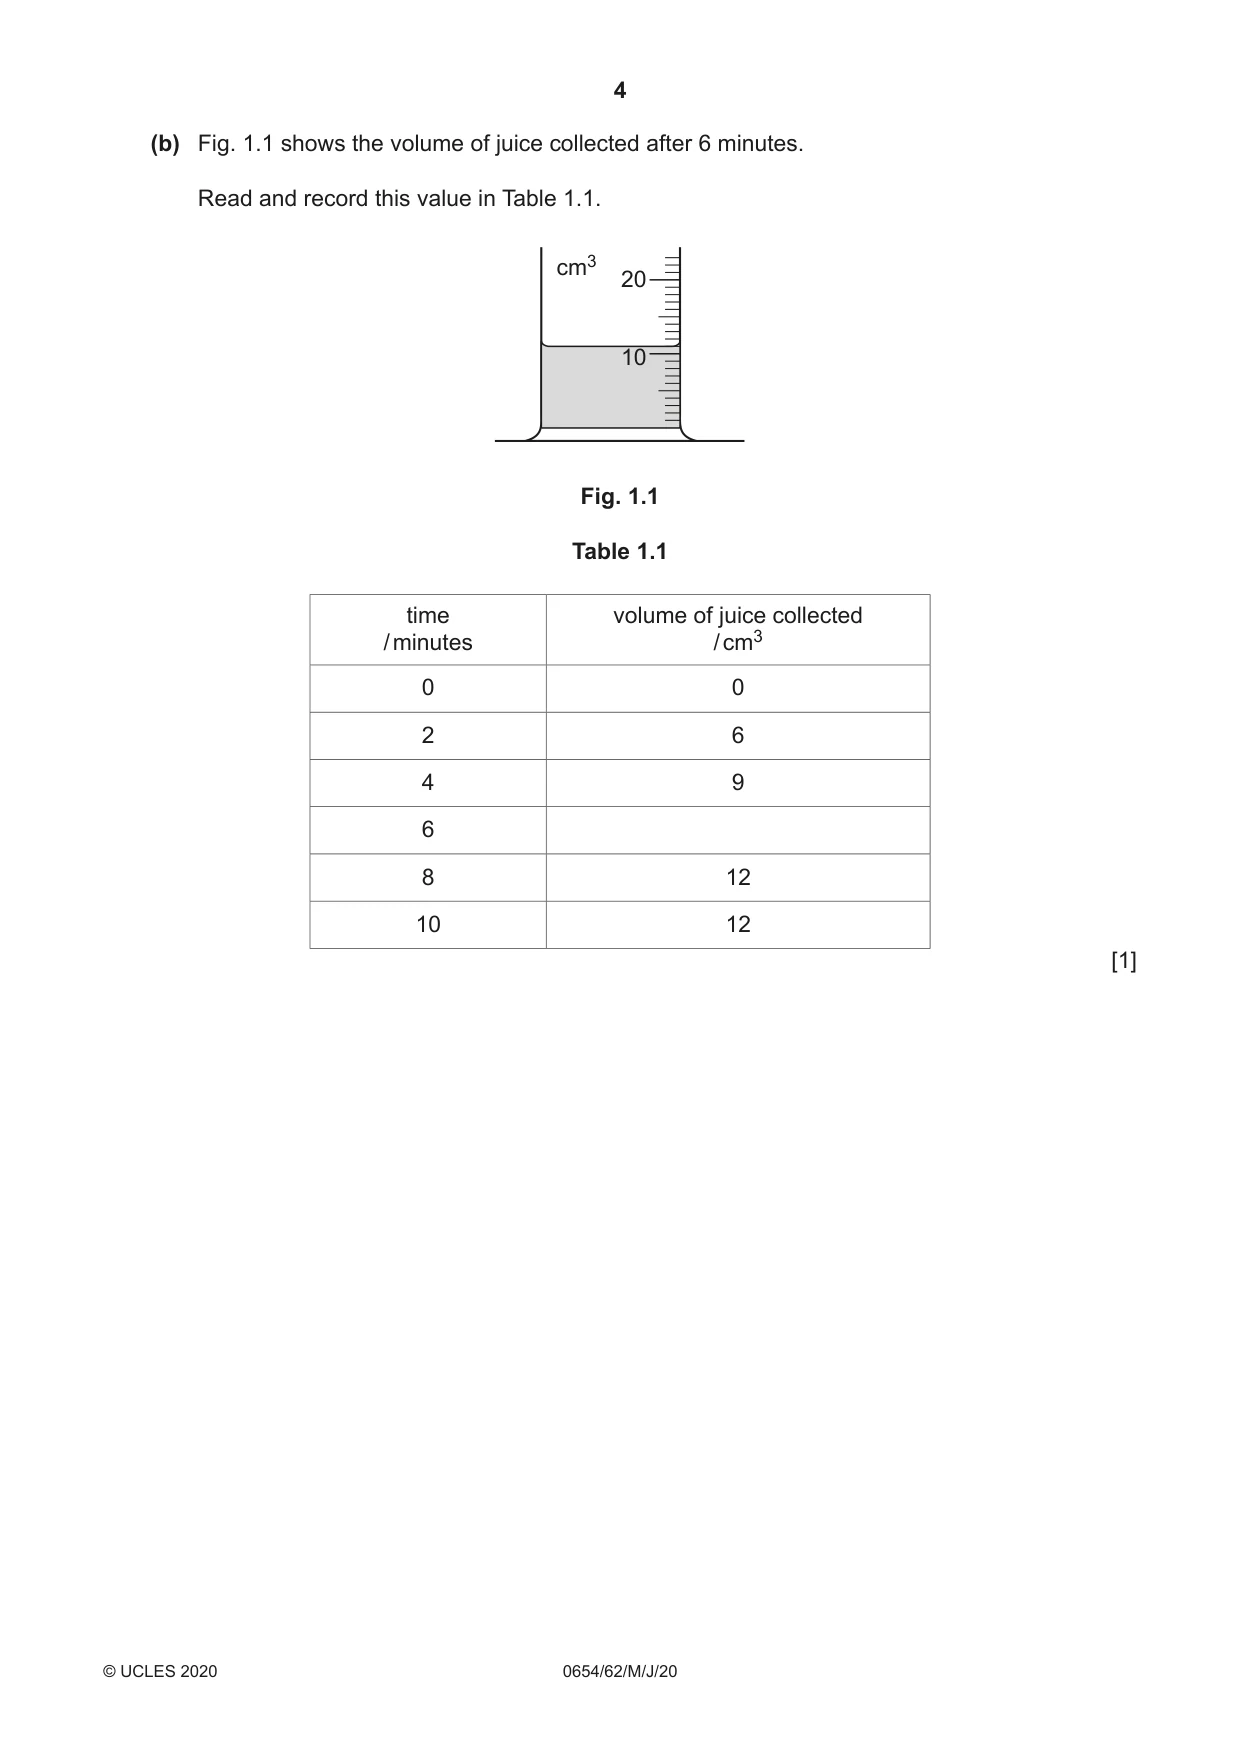
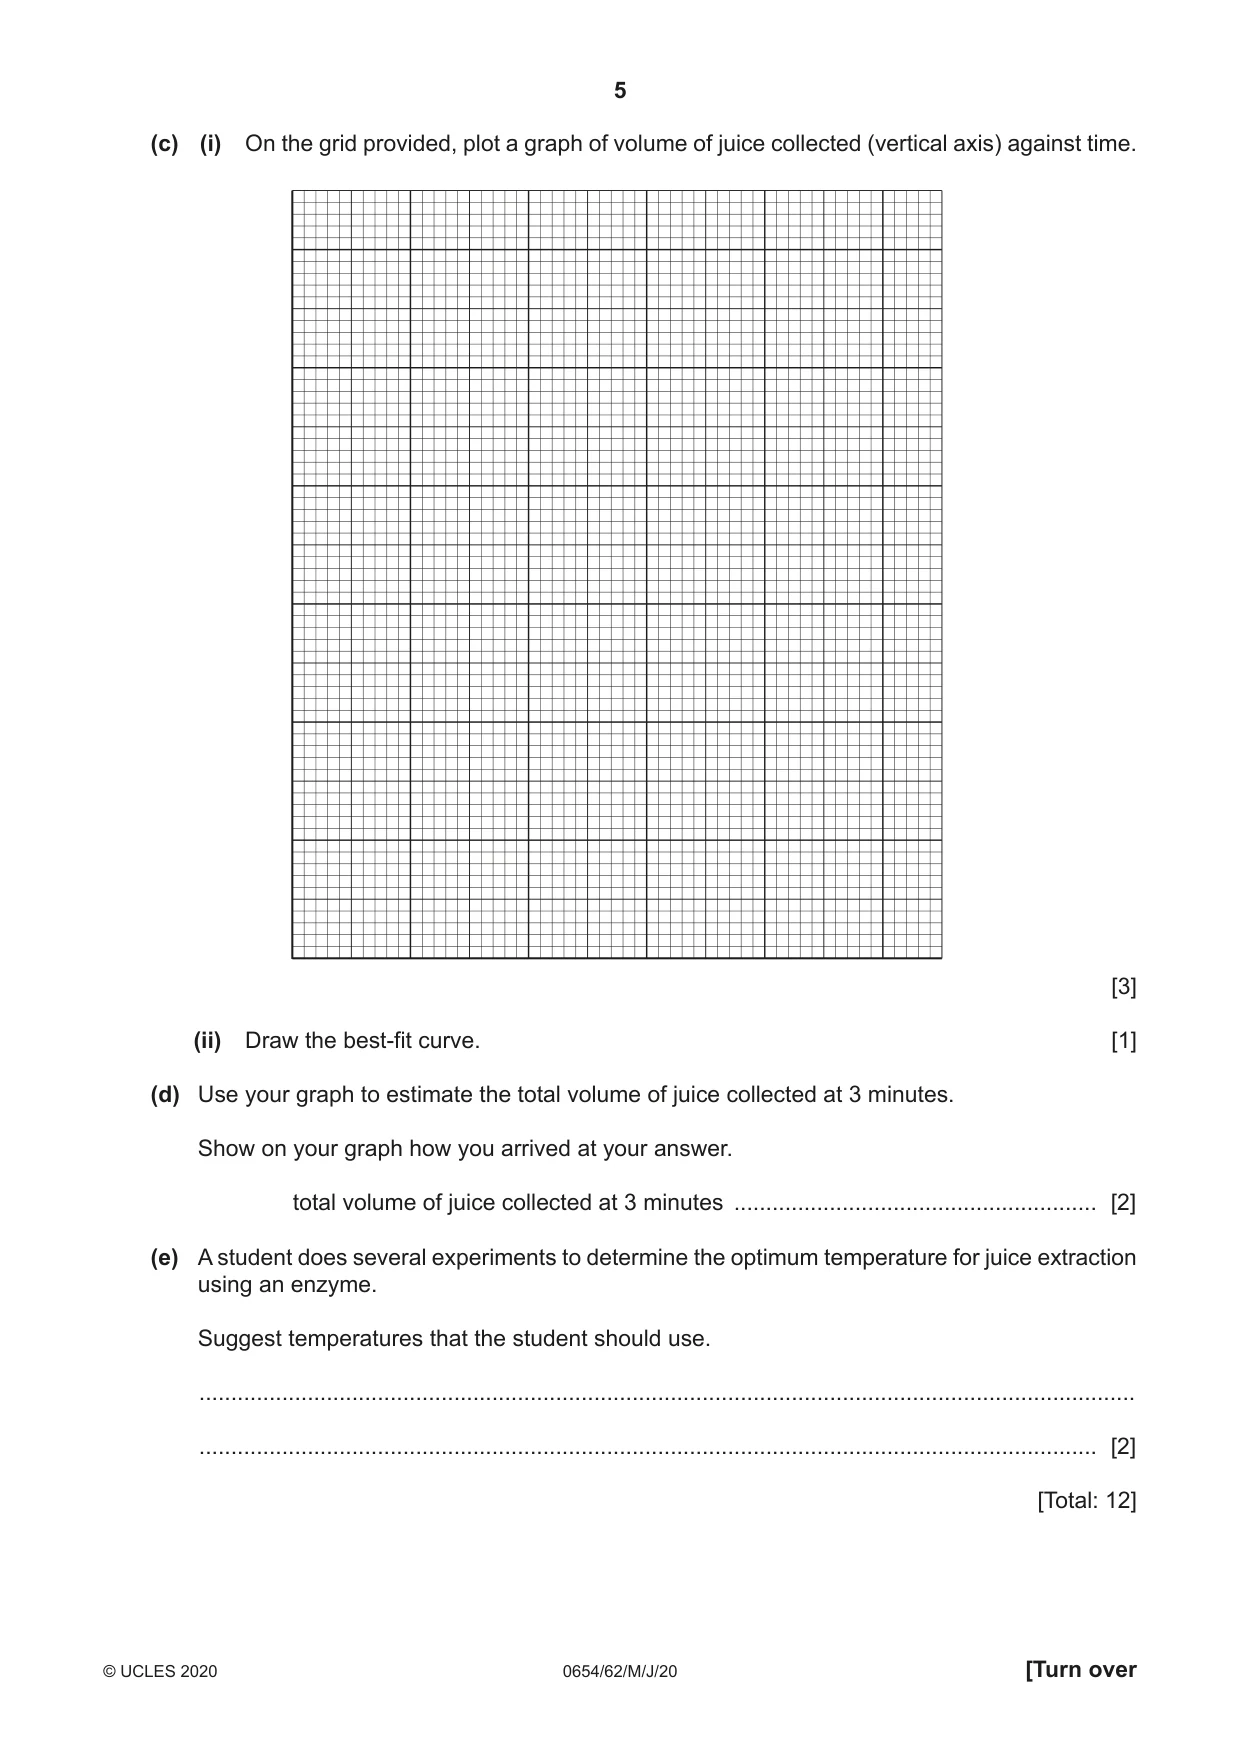
1 A student investigates an enzyme used in the extraction of apple juice. Procedure • He adds enzyme solution to a beaker containing some apple puree. • He places this beaker in a water-bath at 35 °C for five minutes. • He filters the puree and collects the juice in a measuring cylinder. • He measures and records in Table 1.1 the total volume of juice collected every 2 minutes for 10 minutes. (a) Draw a labelled diagram of the apparatus he uses to filter and collect the juice from the apple puree. [3] (b) Fig. 1.1 shows the volume of juice collected after 6 minutes. Read and record this value in Table 1.1. cm3 20 10 Fig. 1.1 Table 1.1 time volume of juice collected / minutes / cm3 0 0 2 6 4 9 6 8 12 10 12 [1] (c) (i) On the grid provided, plot a graph of volume of juice collected (vertical axis) against time. [3] (ii) Draw the best-fit curve. [1] (d) Use your graph to estimate the total volume of juice collected at 3 minutes. Show on your graph how you arrived at your answer. total volume of juice collected at 3 minutes ......................................................... [2] (e) A student does several experiments to determine the optimum temperature for juice extraction using an enzyme. Suggest temperatures that the student should use. ................................................................................................................................................... ............................................................................................................................................. [2] [Total: 12]
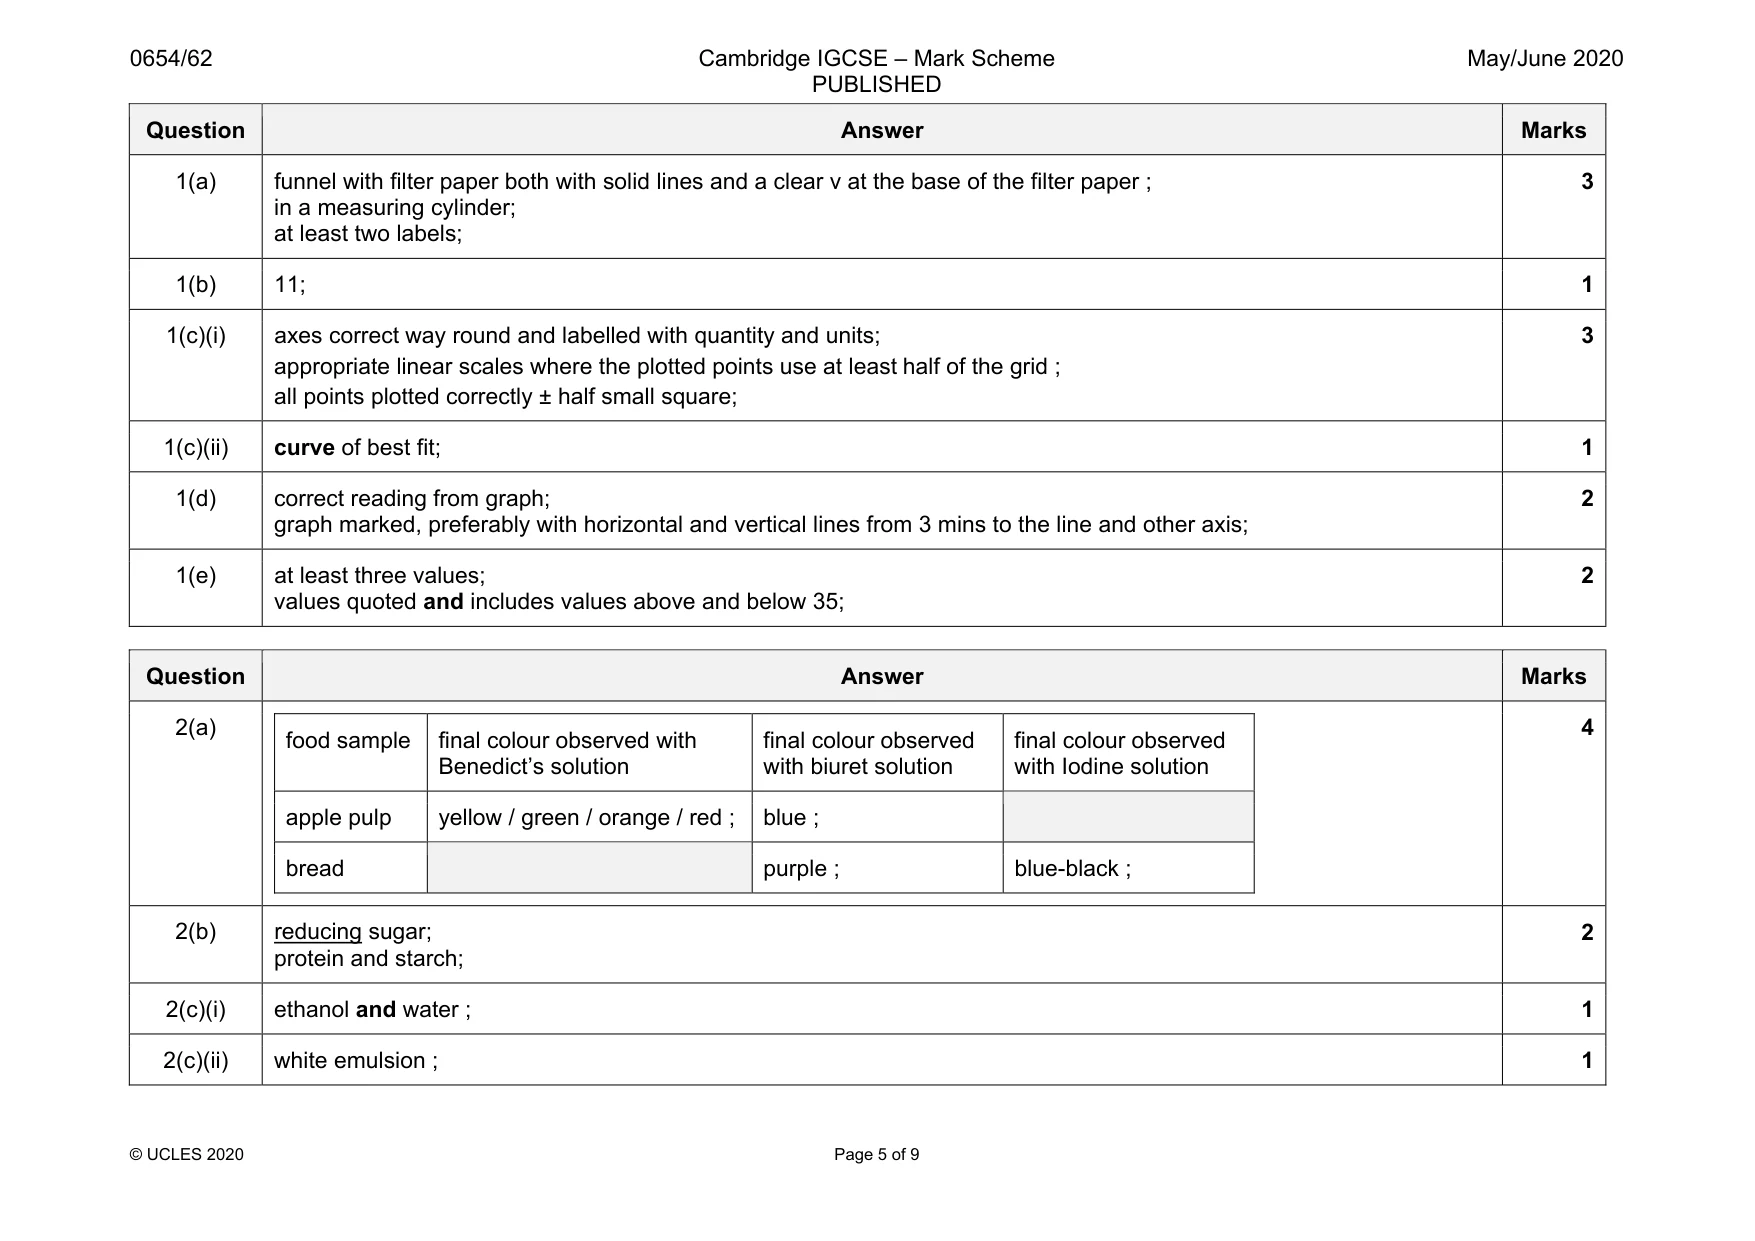
Mark scheme: 1(a) funnel with filter paper both with solid lines and a clear v at the base of the filter paper ; in a measuring cylinder; at least two labels; 3 1(b) 11; 1 1(c)(i) axes correct way round and labelled with quantity and units; appropriate linear scales where the plotted points use at least half of the grid ; all points plotted correctly ± half small square; 3 1(c)(ii) curve of best fit; 1 1(d) correct reading from graph; graph marked, preferably with horizontal and vertical lines from 3 mins to the line and other axis; 2 1(e) at least three values; values quoted and includes values above and below 35; 2
Q2 · A student investigates the nutrient content of apple puree and the nutrient content of…
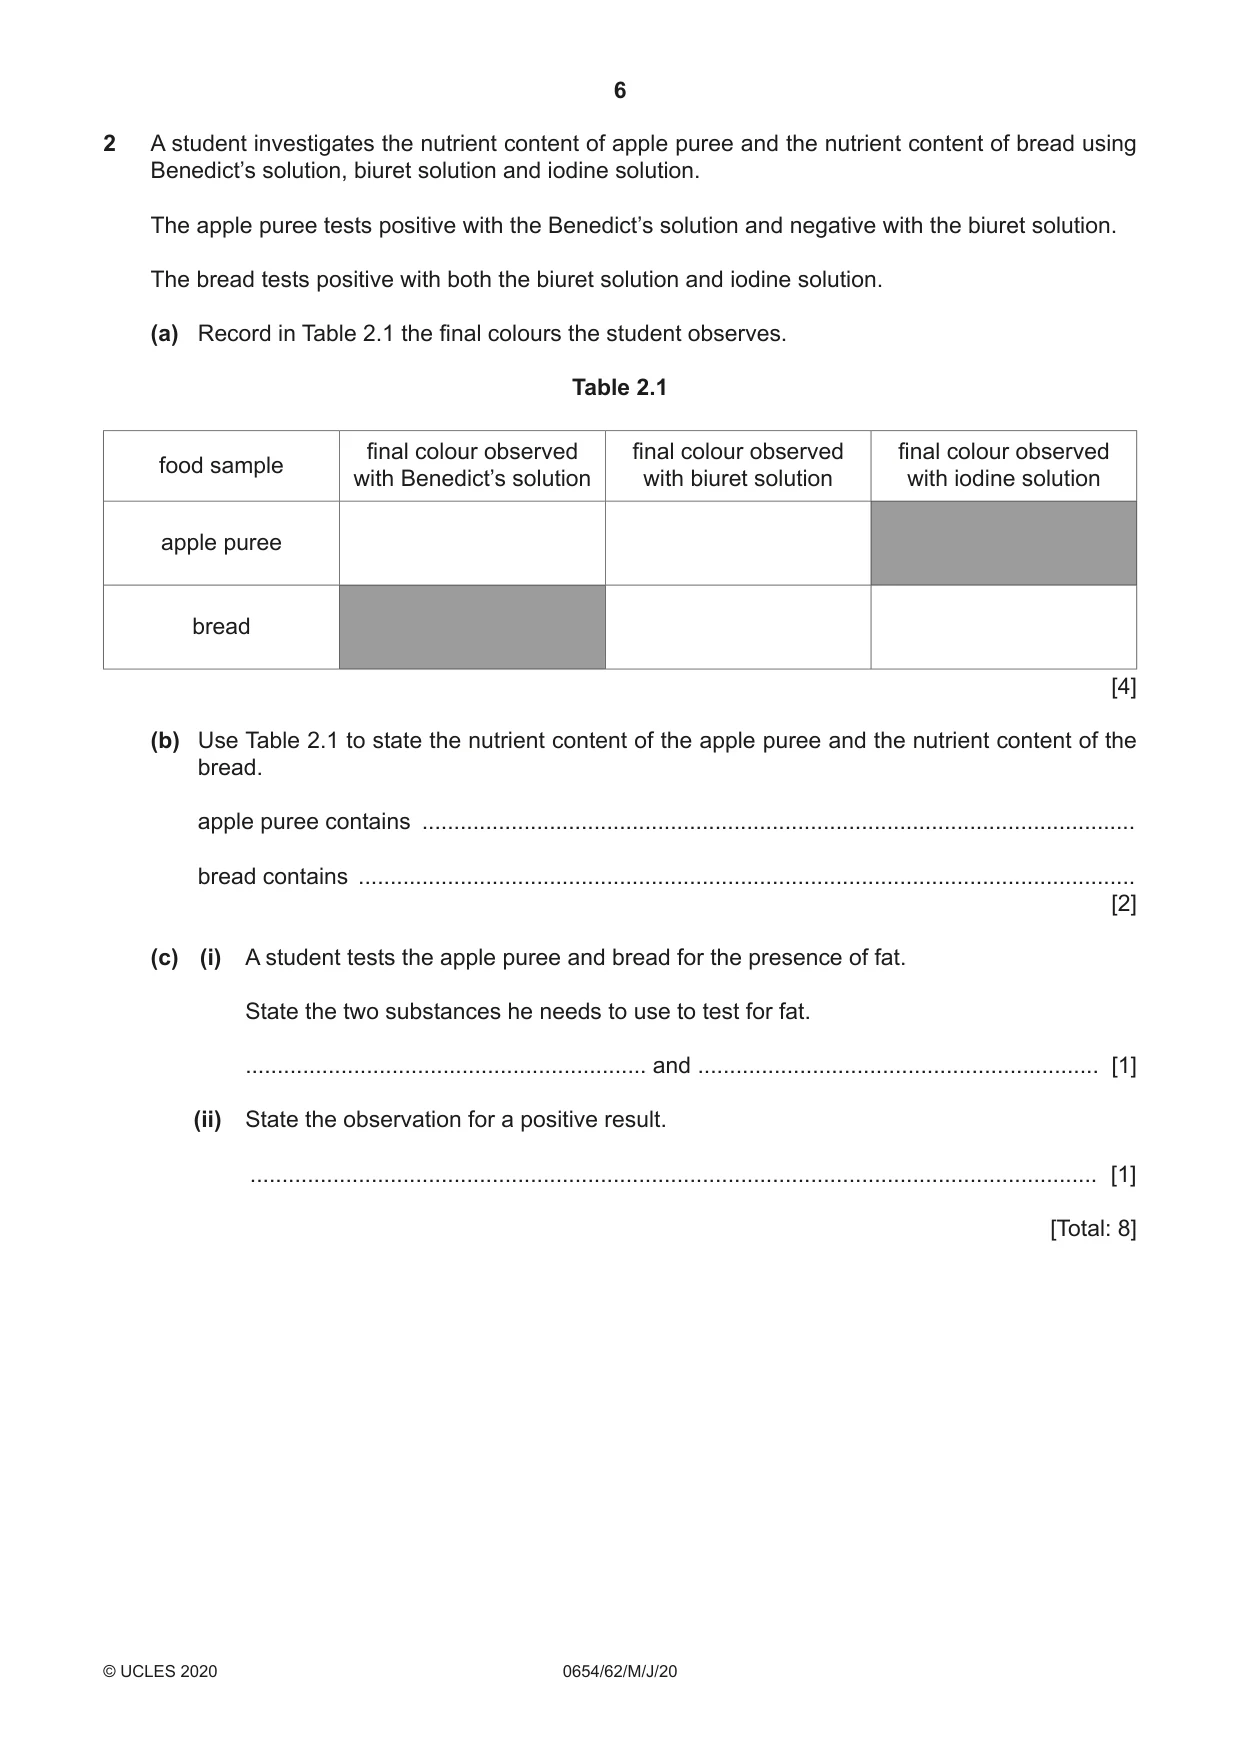
2 A student investigates the nutrient content of apple puree and the nutrient content of bread using Benedict’s solution, biuret solution and iodine solution. The apple puree tests positive with the Benedict’s solution and negative with the biuret solution. The bread tests positive with both the biuret solution and iodine solution. (a) Record in Table 2.1 the final colours the student observes. Table 2.1 final colour observed final colour observed final colour observed food sample with Benedict’s solution with biuret solution with iodine solution apple puree bread [4] (b) Use Table 2.1 to state the nutrient content of the apple puree and the nutrient content of the bread. apple puree contains ................................................................................................................ bread contains .......................................................................................................................... [2] (c) (i) A student tests the apple puree and bread for the presence of fat. State the two substances he needs to use to test for fat. ............................................................... and ............................................................... [1] (ii) State the observation for a positive result. ..................................................................................................................................... [1] [Total: 8]
Mark scheme: 2(a) food sample final colour observed with Benedict’s solution final colour observed with biuret solution final colour observed with Iodine solution apple pulp yellow / green / orange / red ; blue ; bread purple ; blue-black ; 4 2(b) reducing sugar; protein and starch; 2 2(c)(i) ethanol and water ; 1 2(c)(ii) white emulsion ; 1
Q3 · In this investigation a student is going to identify four solutions, J, K, L and M
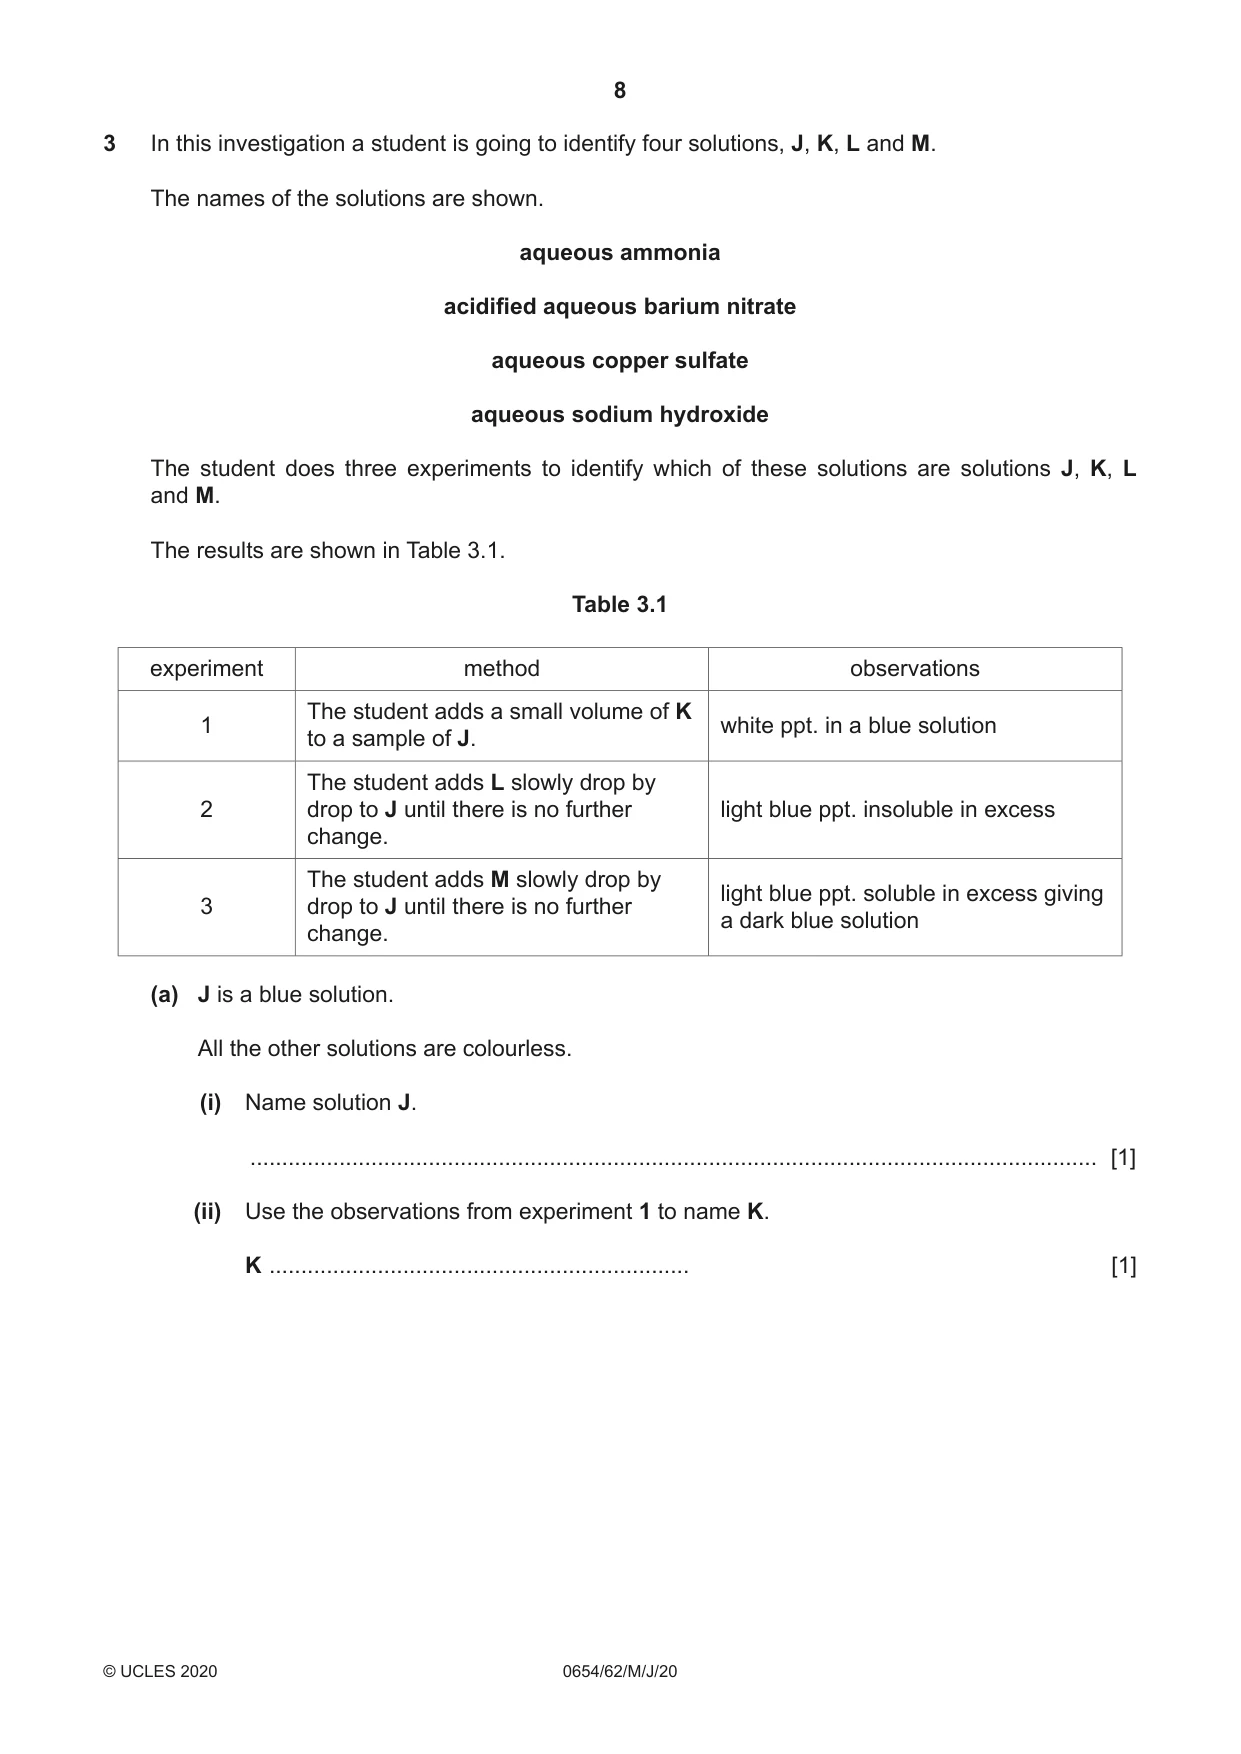
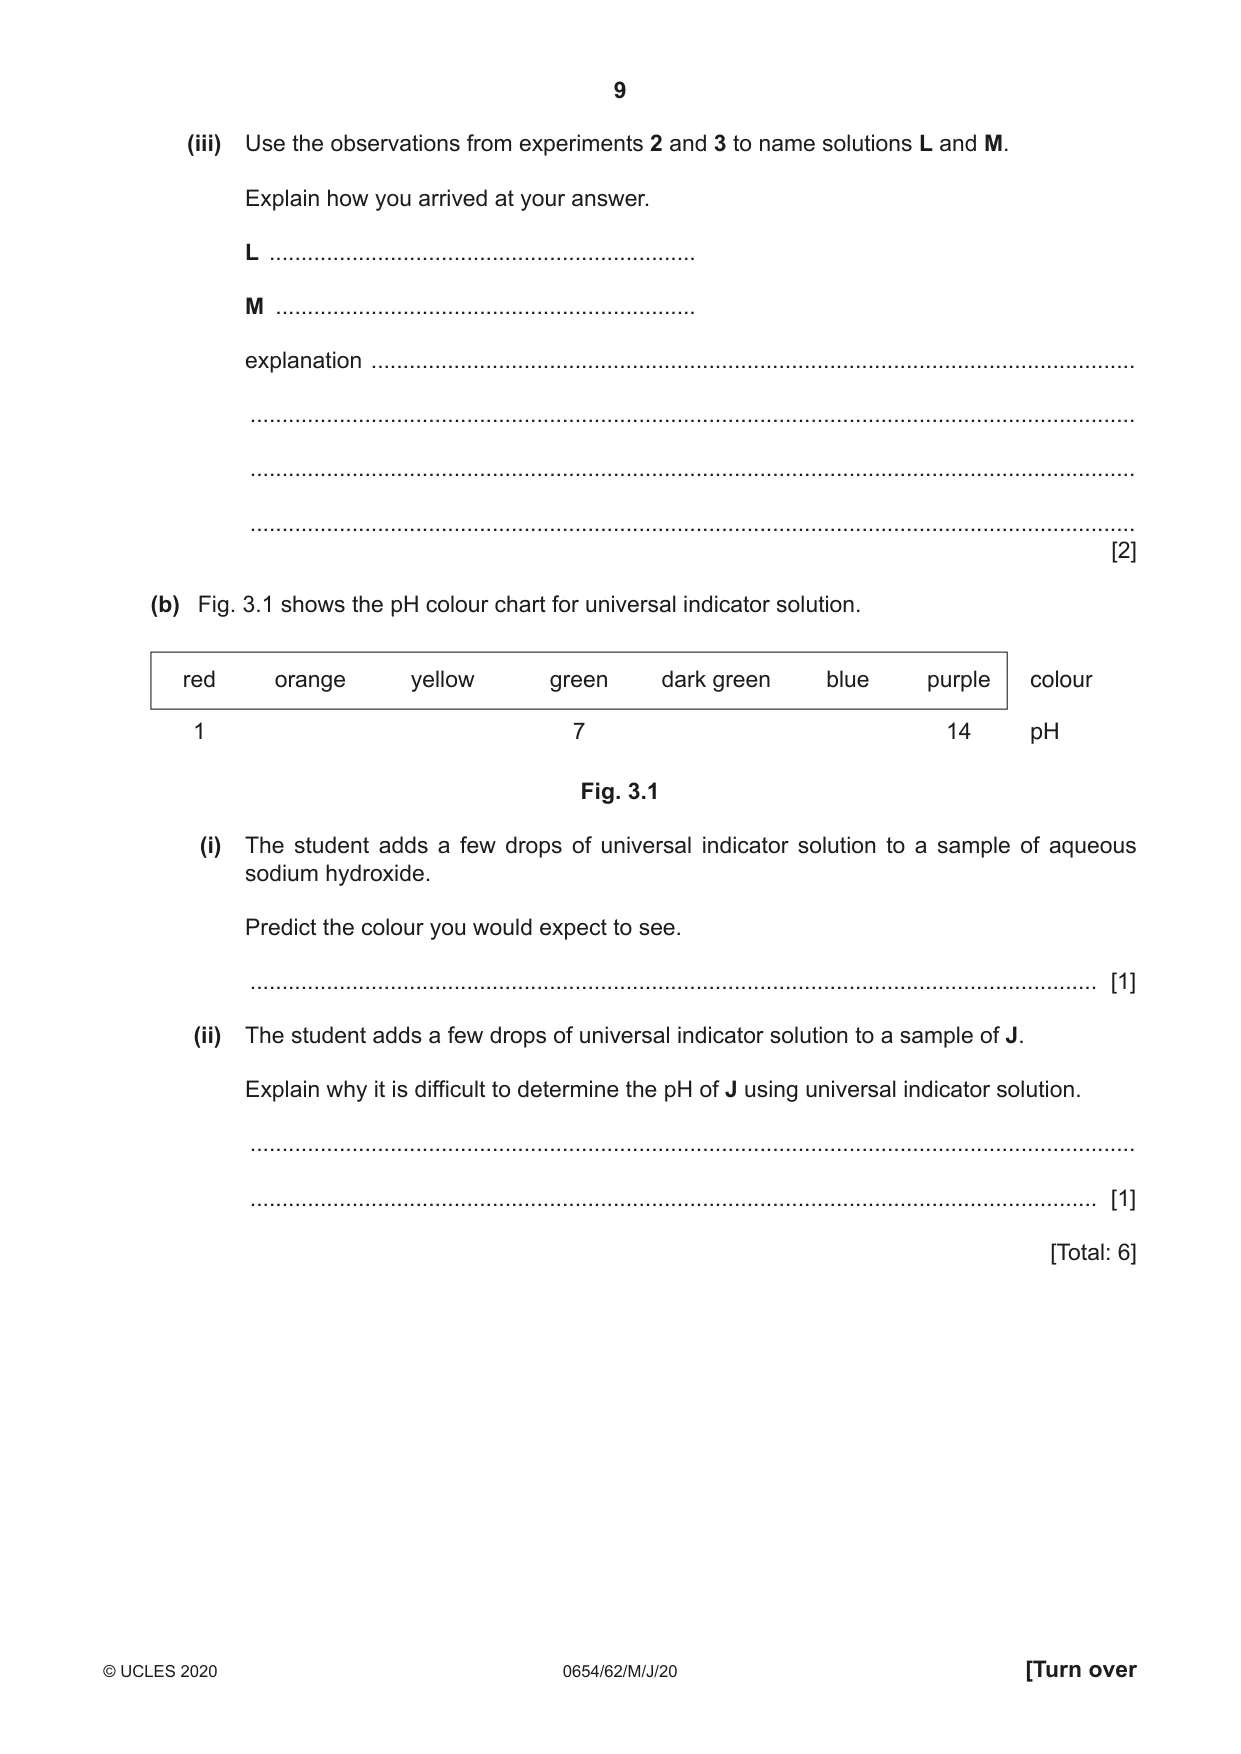
3 In this investigation a student is going to identify four solutions, J, K, L and M. The names of the solutions are shown. aqueous ammonia acidified aqueous barium nitrate aqueous copper sulfate aqueous sodium hydroxide The student does three experiments to identify which of these solutions are solutions J, K, L and M. The results are shown in Table 3.1. Table 3.1 experiment method observations The student adds a small volume of K 1 white ppt. in a blue solution to a sample of J. The student adds L slowly drop by 2 drop to J until there is no further light blue ppt. insoluble in excess change. The student adds M slowly drop by light blue ppt. soluble in excess giving 3 drop to J until there is no further a dark blue solution change. (a) J is a blue solution. All the other solutions are colourless. (i) Name solution J. ..................................................................................................................................... [1] (ii) Use the observations from experiment 1 to name K. K .................................................................. [1] (iii) Use the observations from experiments 2 and 3 to name solutions L and M. Explain how you arrived at your answer. L ................................................................... M .................................................................. explanation ........................................................................................................................ ........................................................................................................................................... ........................................................................................................................................... ........................................................................................................................................... [2] (b) Fig. 3.1 shows the pH colour chart for universal indicator solution. red orange yellow green dark green blue purple colour 1 7 14 pH Fig. 3.1 (i) The student adds a few drops of universal indicator solution to a sample of aqueous sodium hydroxide. Predict the colour you would expect to see. ..................................................................................................................................... [1] (ii) The student adds a few drops of universal indicator solution to a sample of J. Explain why it is difficult to determine the pH of J using universal indicator solution. ........................................................................................................................................... ..................................................................................................................................... [1] [Total: 6]
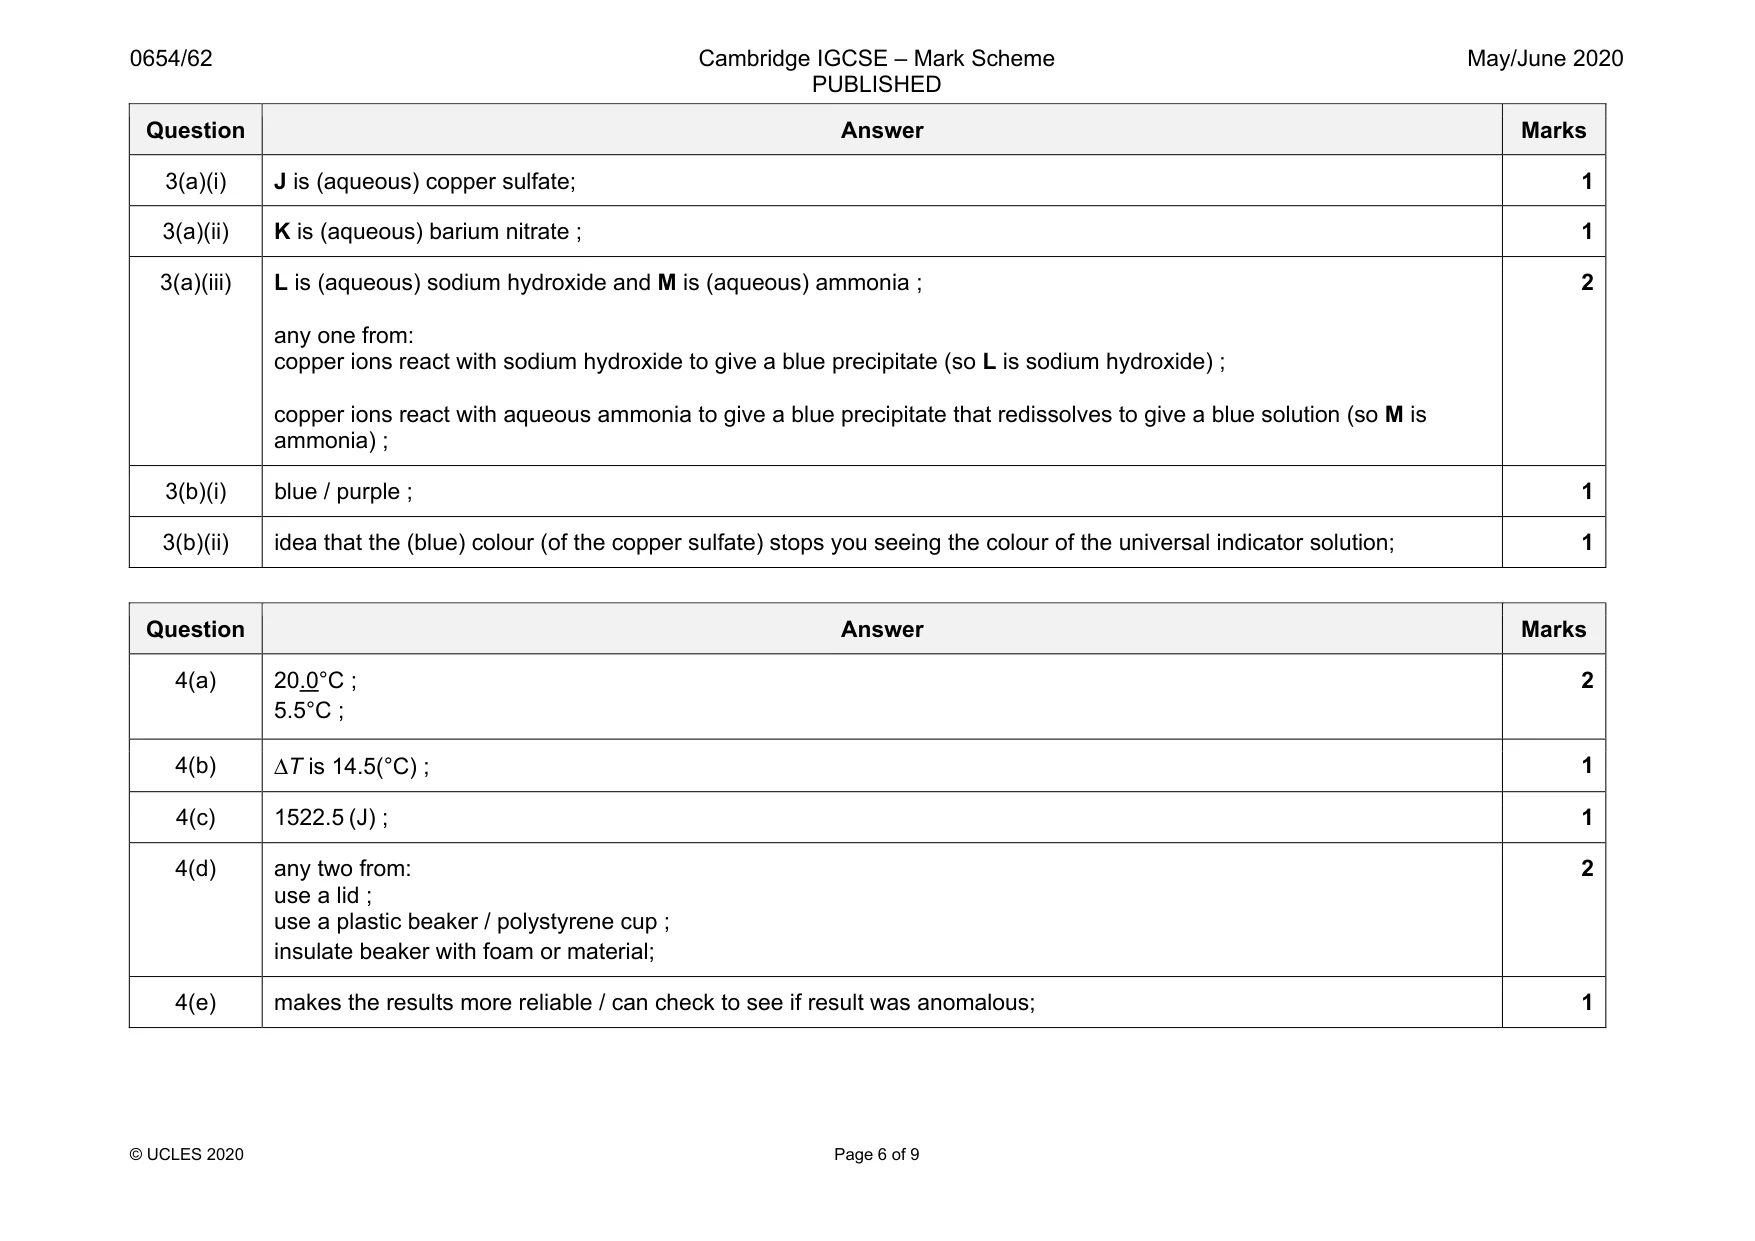
Mark scheme: 3(a)(i) J is (aqueous) copper sulfate; 1 3(a)(ii) K is (aqueous) barium nitrate ; 1 3(a)(iii) L is (aqueous) sodium hydroxide and M is (aqueous) ammonia ; any one from: copper ions react with sodium hydroxide to give a blue precipitate (so L is sodium hydroxide) ; copper ions react with aqueous ammonia to give a blue precipitate that redissolves to give a blue solution (so M is ammonia) ; 2 3(b)(i) blue / purple ; 1 3(b)(ii) idea that the (blue) colour (of the copper sulfate) stops you seeing the colour of the universal indicator solution; 1
Q4 · A student investigates the amount of thermal energy (heat) absorbed when solid ammonium…
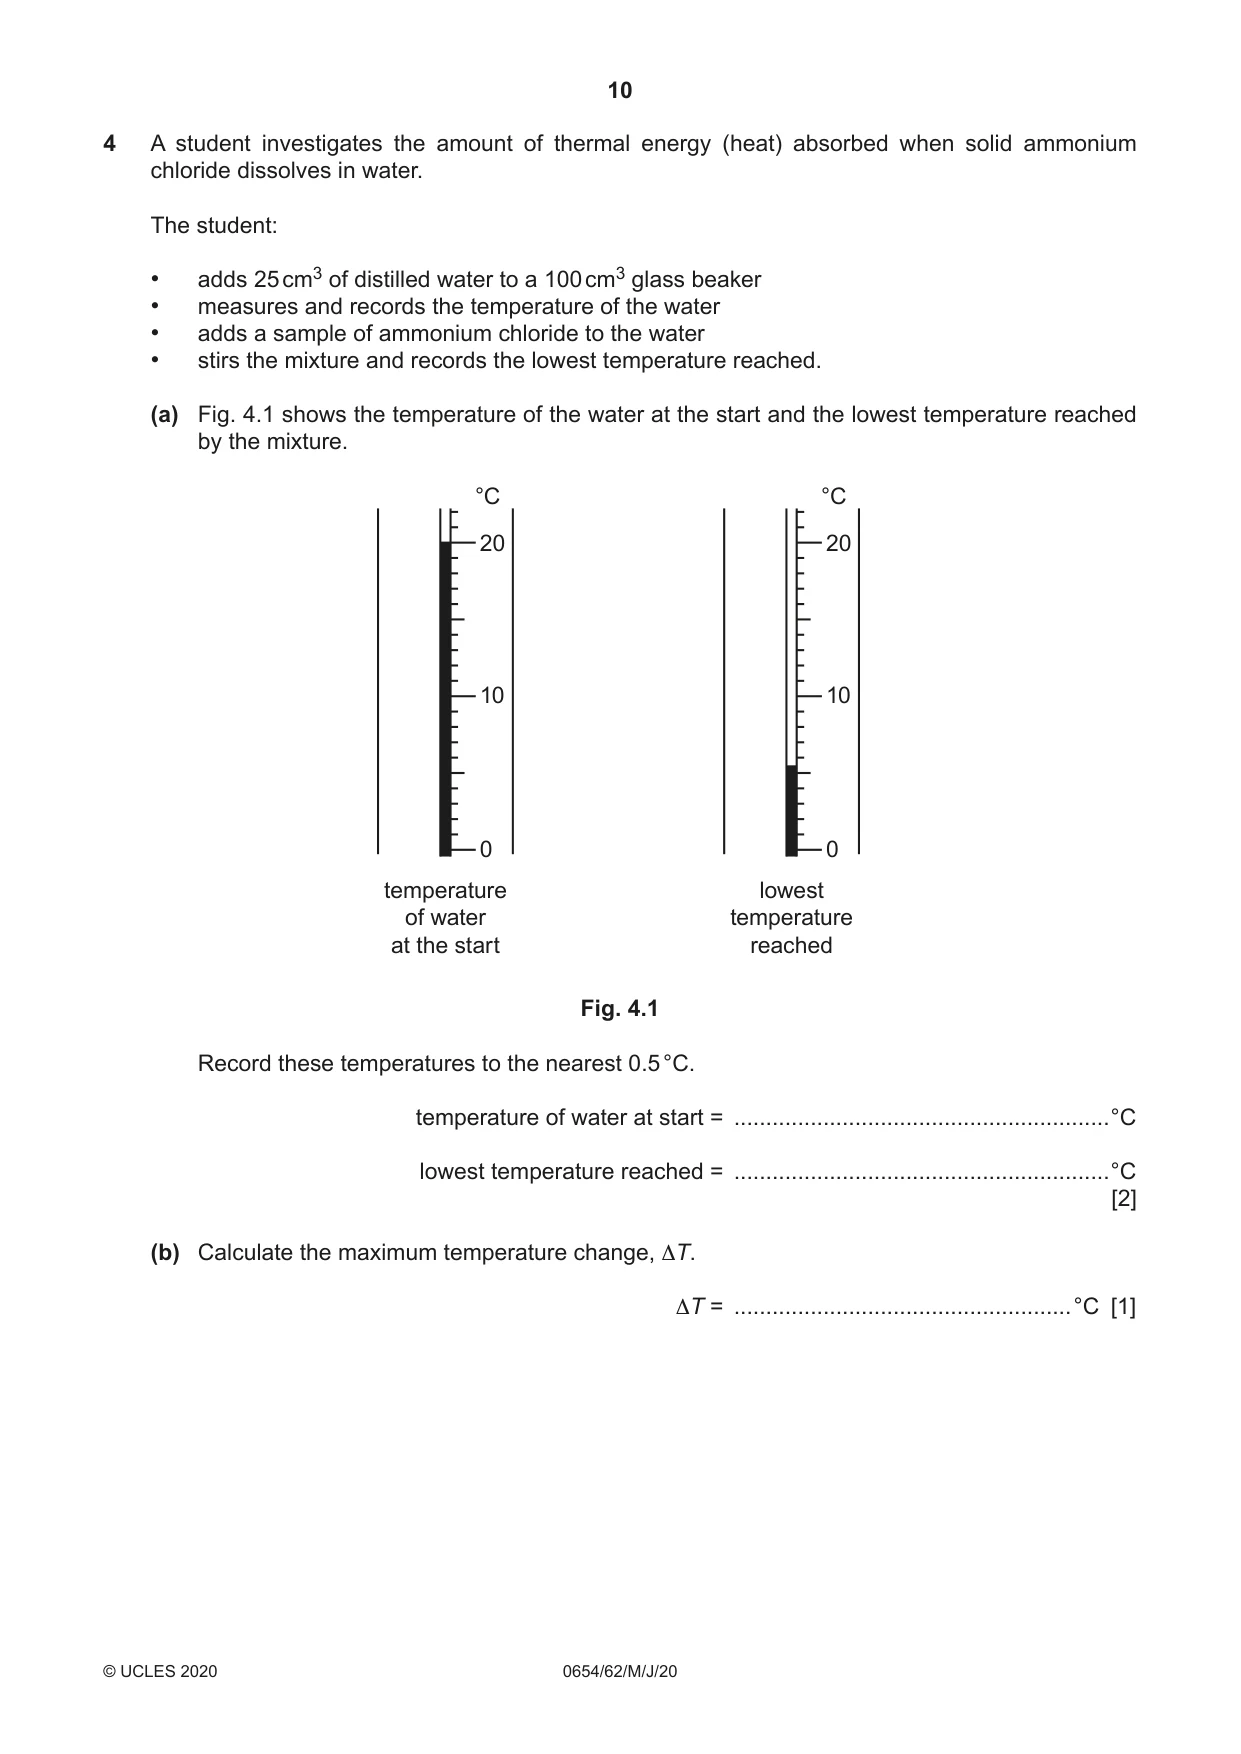
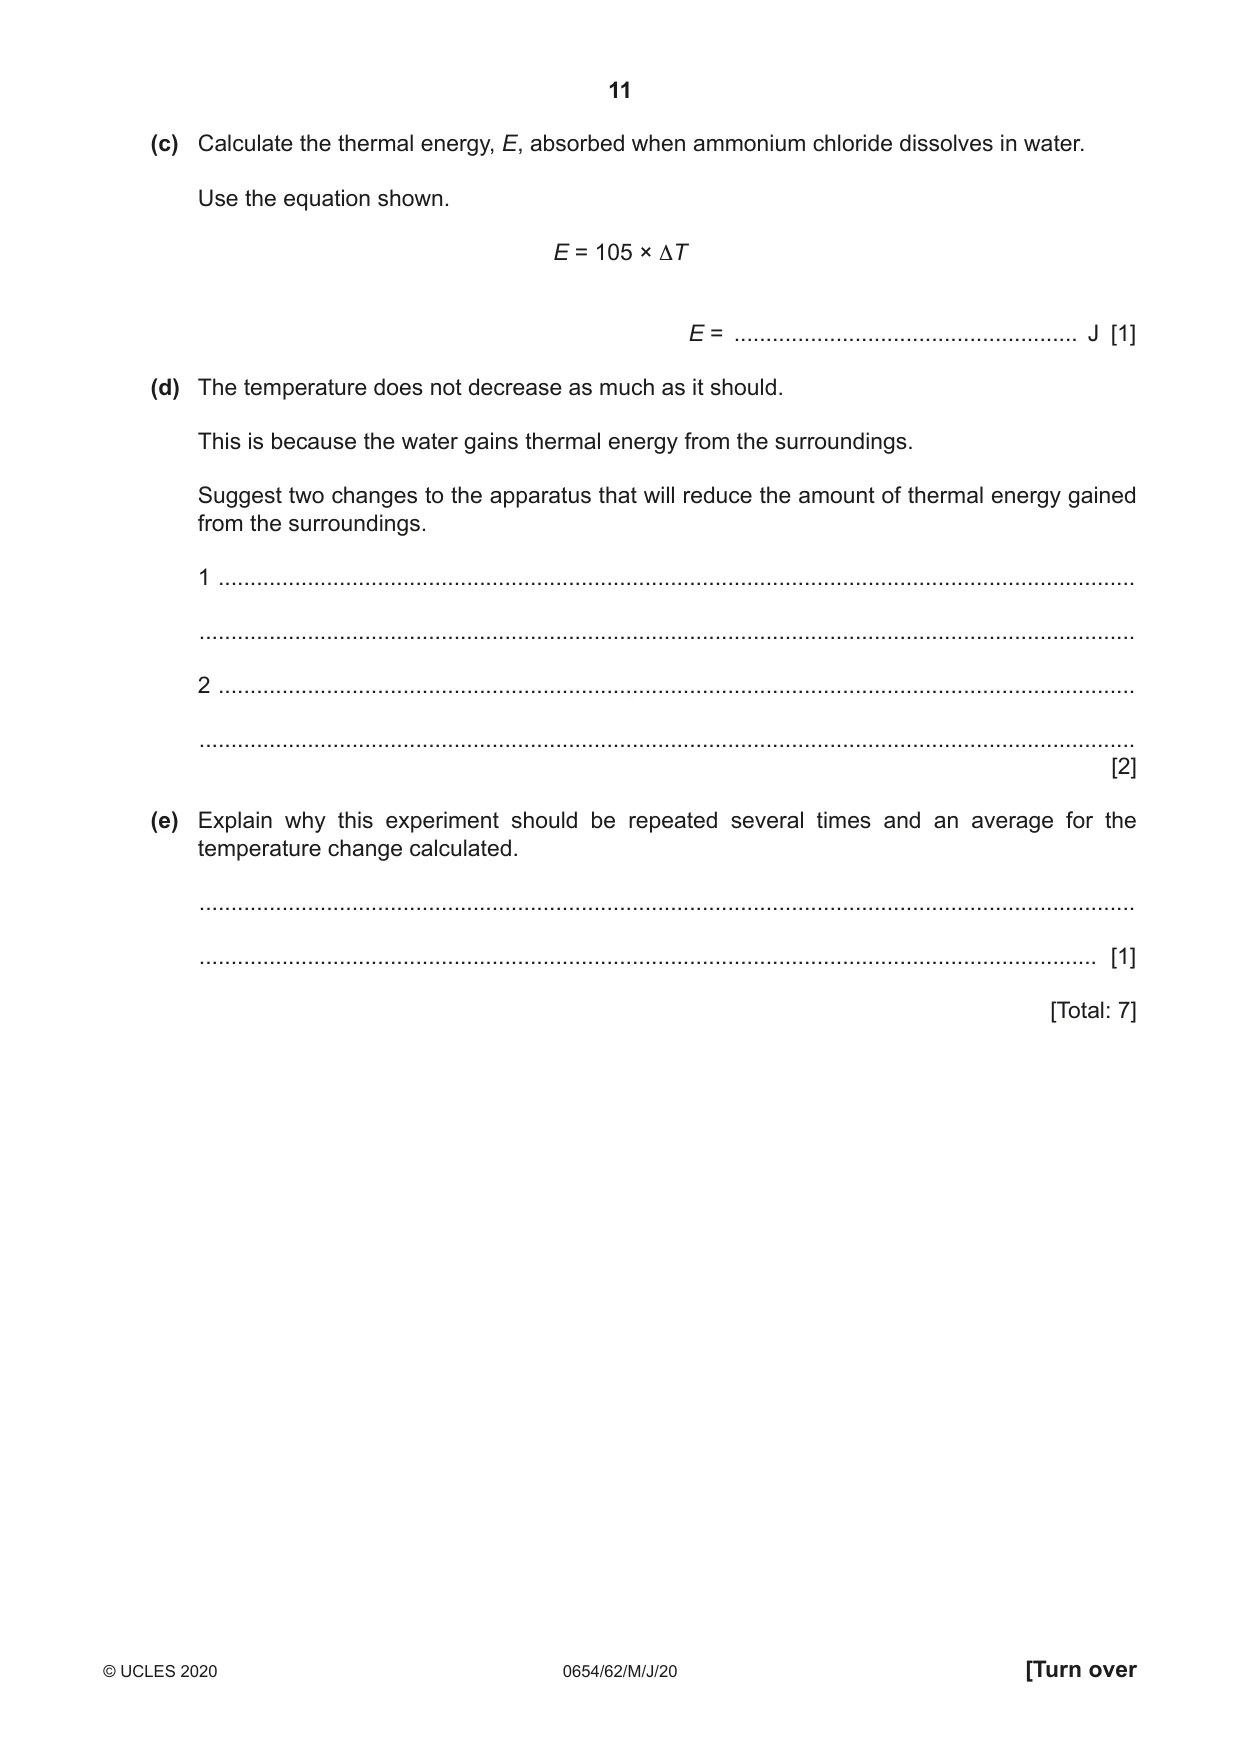
4 A student investigates the amount of thermal energy (heat) absorbed when solid ammonium chloride dissolves in water. The student: • adds 25 cm3 of distilled water to a 100 cm3 glass beaker • measures and records the temperature of the water • adds a sample of ammonium chloride to the water • stirs the mixture and records the lowest temperature reached. (a) Fig. 4.1 shows the temperature of the water at the start and the lowest temperature reached by the mixture. °C °C 20 20 10 10 0 0 temperature lowest of water temperature at the start reached Fig. 4.1 Record these temperatures to the nearest 0.5 °C. temperature of water at start = ...........................................................°C lowest temperature reached = ...........................................................°C [2] (b) Calculate the maximum temperature change, ∆T. ∆T = .....................................................°C [1] (c) Calculate the thermal energy, E, absorbed when ammonium chloride dissolves in water. Use the equation shown. E = 105 × ∆T E = ...................................................... J [1] (d) The temperature does not decrease as much as it should. This is because the water gains thermal energy from the surroundings. Suggest two changes to the apparatus that will reduce the amount of thermal energy gained from the surroundings. 1 ................................................................................................................................................ ................................................................................................................................................... 2 ................................................................................................................................................ ................................................................................................................................................... [2] (e) Explain why this experiment should be repeated several times and an average for the temperature change calculated. ................................................................................................................................................... ............................................................................................................................................. [1] [Total: 7]
Mark scheme: 4(a) 20.0°C ; 5.5°C ; 2 4(b) ΔT is 14.5(°C) ; 1 4(c) 1522.5 (J) ; 1 4(d) any two from: use a lid ; use a plastic beaker / polystyrene cup ; insulate beaker with foam or material; 2 4(e) makes the results more reliable / can check to see if result was anomalous; 1
Q5 · A student investigates the thermal decomposition of copper carbonate
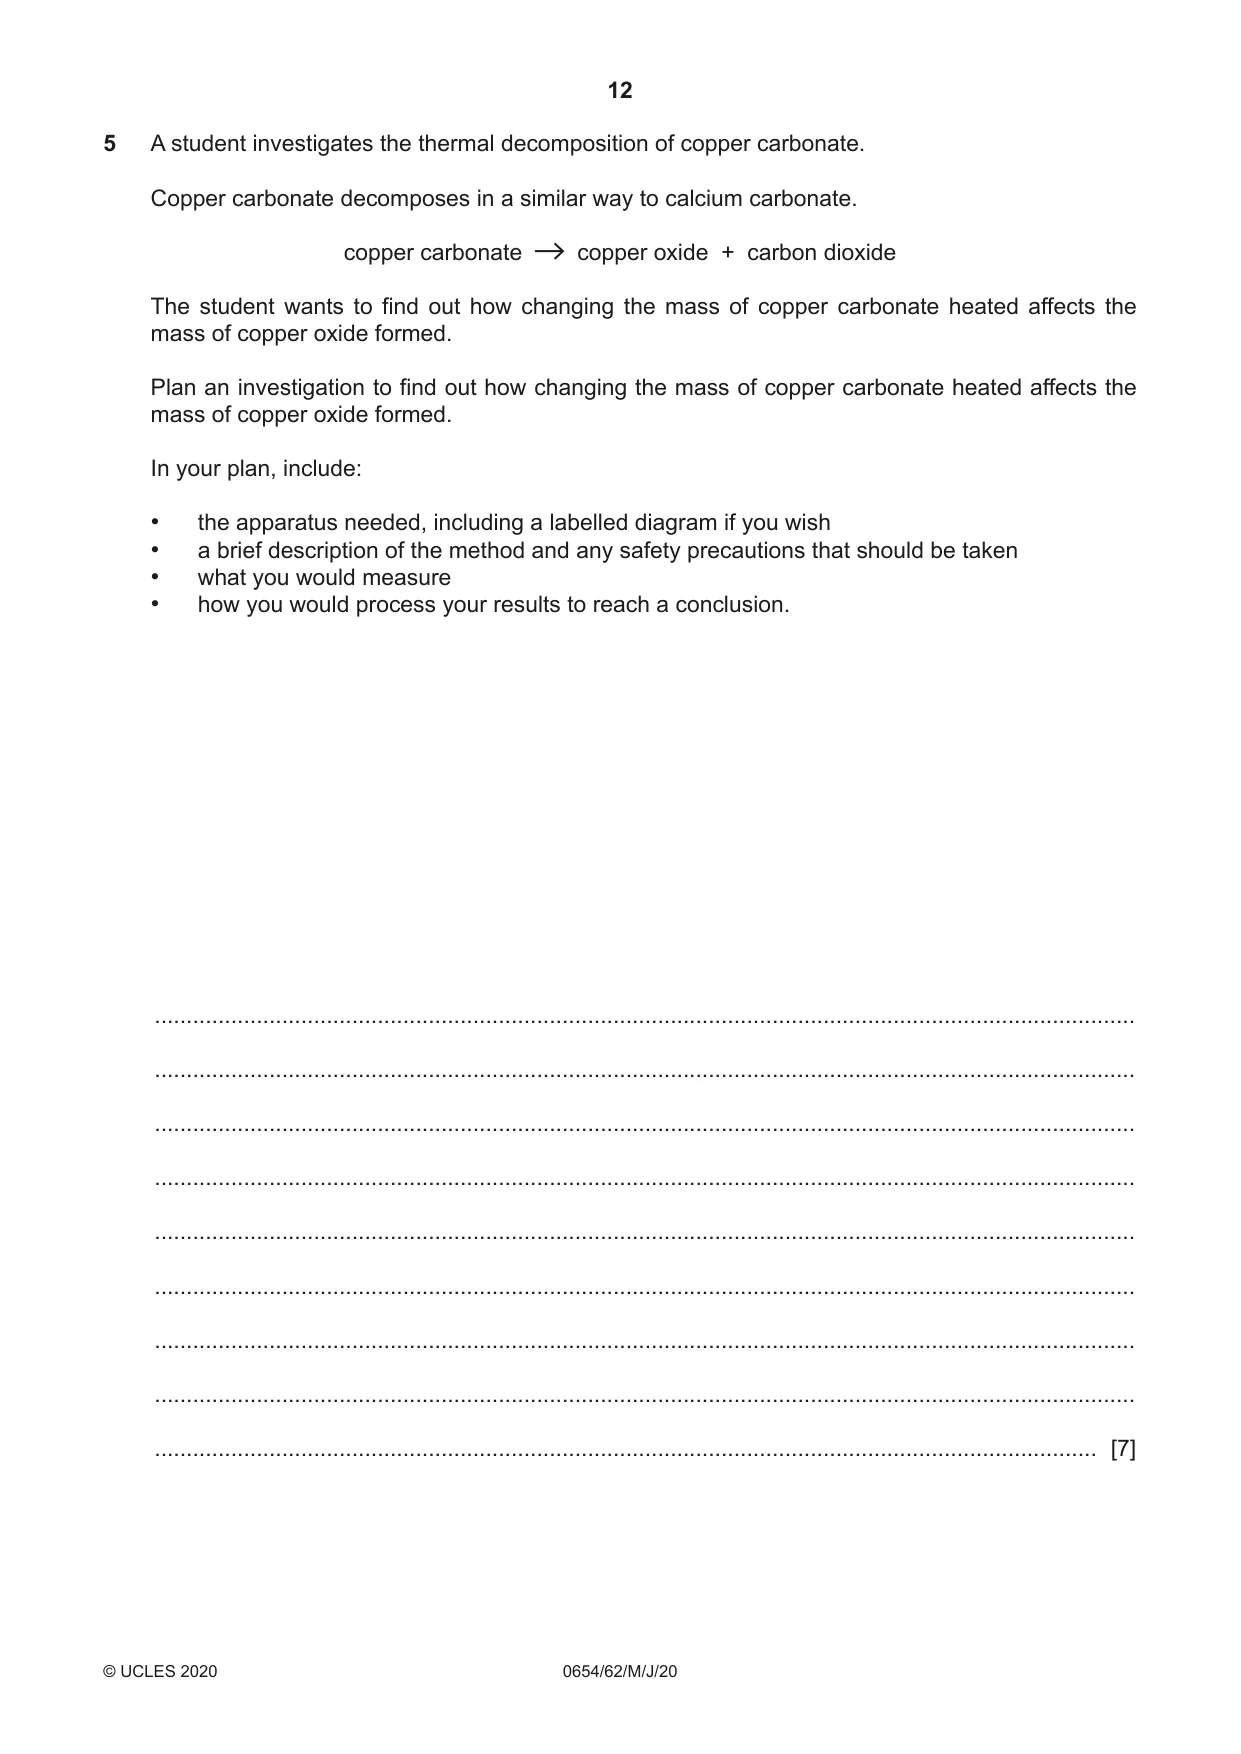
5 A student investigates the thermal decomposition of copper carbonate. Copper carbonate decomposes in a similar way to calcium carbonate. copper carbonate copper oxide + carbon dioxide The student wants to find out how changing the mass of copper carbonate heated affects the mass of copper oxide formed. Plan an investigation to find out how changing the mass of copper carbonate heated affects the mass of copper oxide formed. In your plan, include: • the apparatus needed, including a labelled diagram if you wish • a brief description of the method and any safety precautions that should be taken • what you would measure • how you would process your results to reach a conclusion. .......................................................................................................................................................... .......................................................................................................................................................... .......................................................................................................................................................... .......................................................................................................................................................... .......................................................................................................................................................... .......................................................................................................................................................... .......................................................................................................................................................... .......................................................................................................................................................... .................................................................................................................................................... [7]
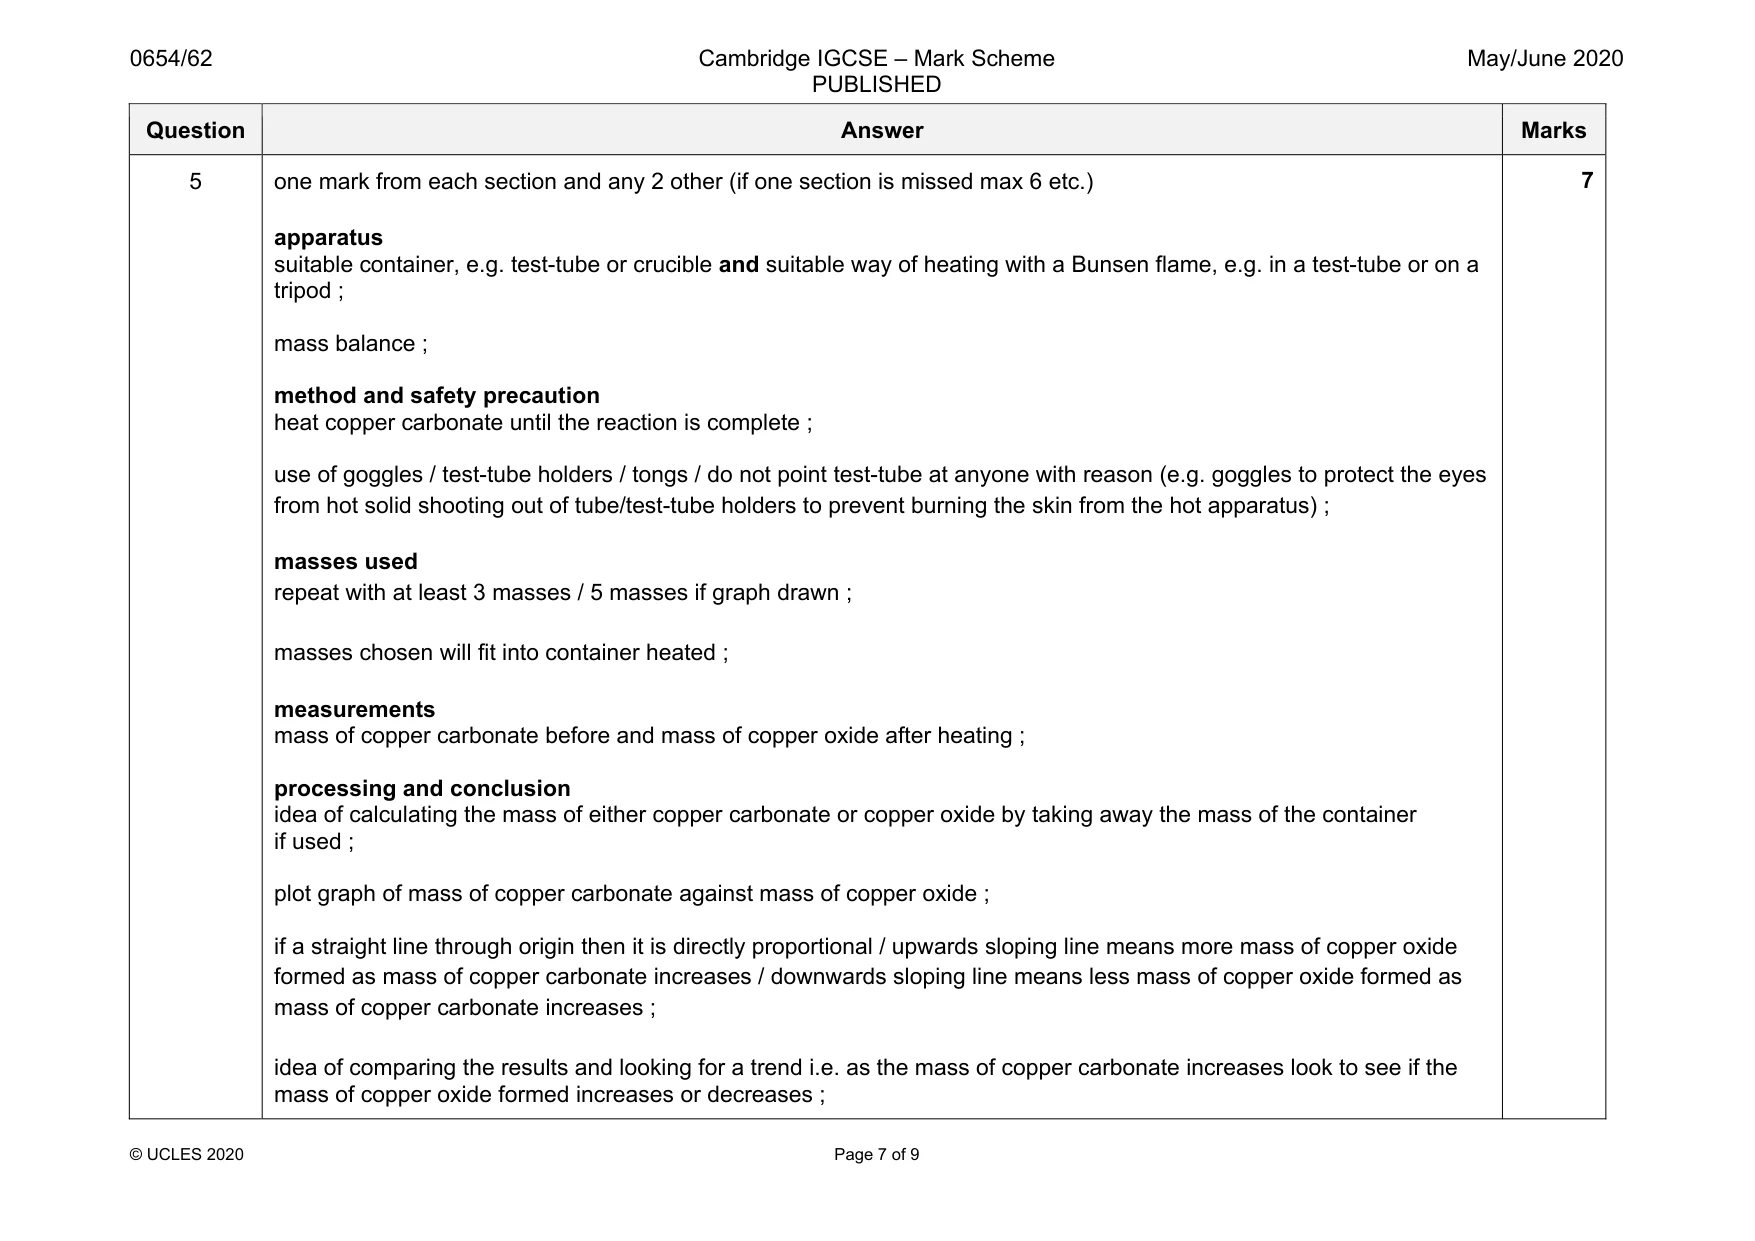
Mark scheme: 5 one mark from each section and any 2 other (if one section is missed max 6 etc.) apparatus suitable container, e.g. test-tube or crucible and suitable way of heating with a Bunsen flame, e.g. in a test-tube or on a tripod ; mass balance ; method and safety precaution heat copper carbonate until the reaction is complete ; use of goggles / test-tube holders / tongs / do not point test-tube at anyone with reason (e.g. goggles to protect the eyes from hot solid shooting out of tube/test-tube holders to prevent burning the skin from the hot apparatus) ; masses used repeat with at least 3 masses / 5 masses if graph drawn ; masses chosen will fit into container heated ; measurements mass of copper carbonate before and mass of copper oxide after heating ; processing and conclusion idea of calculating the mass of either copper carbonate or copper oxide by taking away the mass of the container if used ; plot graph of mass of copper carbonate against mass of copper oxide ; if a straight line through origin then it is directly proportional / upwards sloping line means more mass of copper oxide formed as mass of copper carbonate increases / downwards sloping line means less mass of copper oxide formed as mass of copper carbonate increases ; idea of comparing the results and looking for a trend i.e. as the mass of copper carbonate increases look to see if the mass of copper oxide formed increases or decreases ;
Q6 · A student determines the focal length f of a lens by measuring the magnification of the…
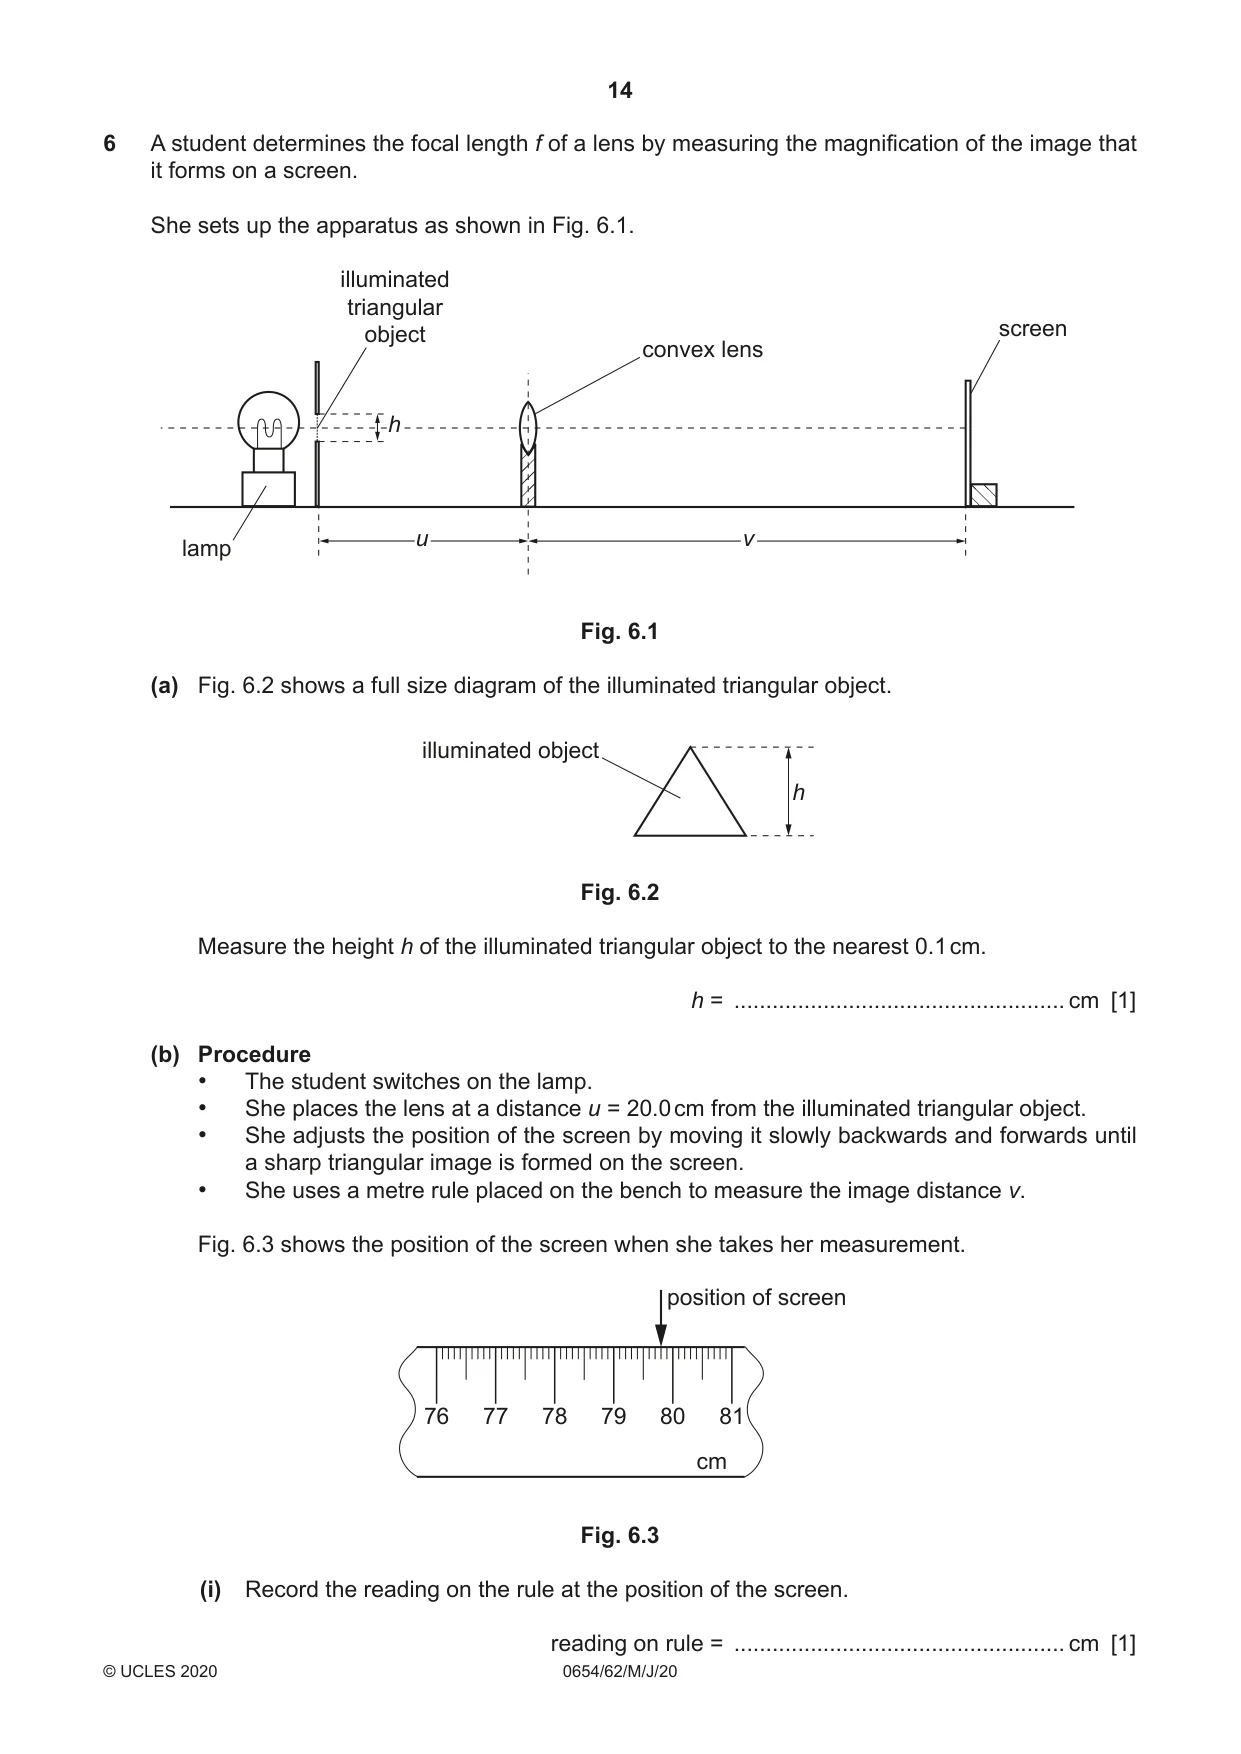
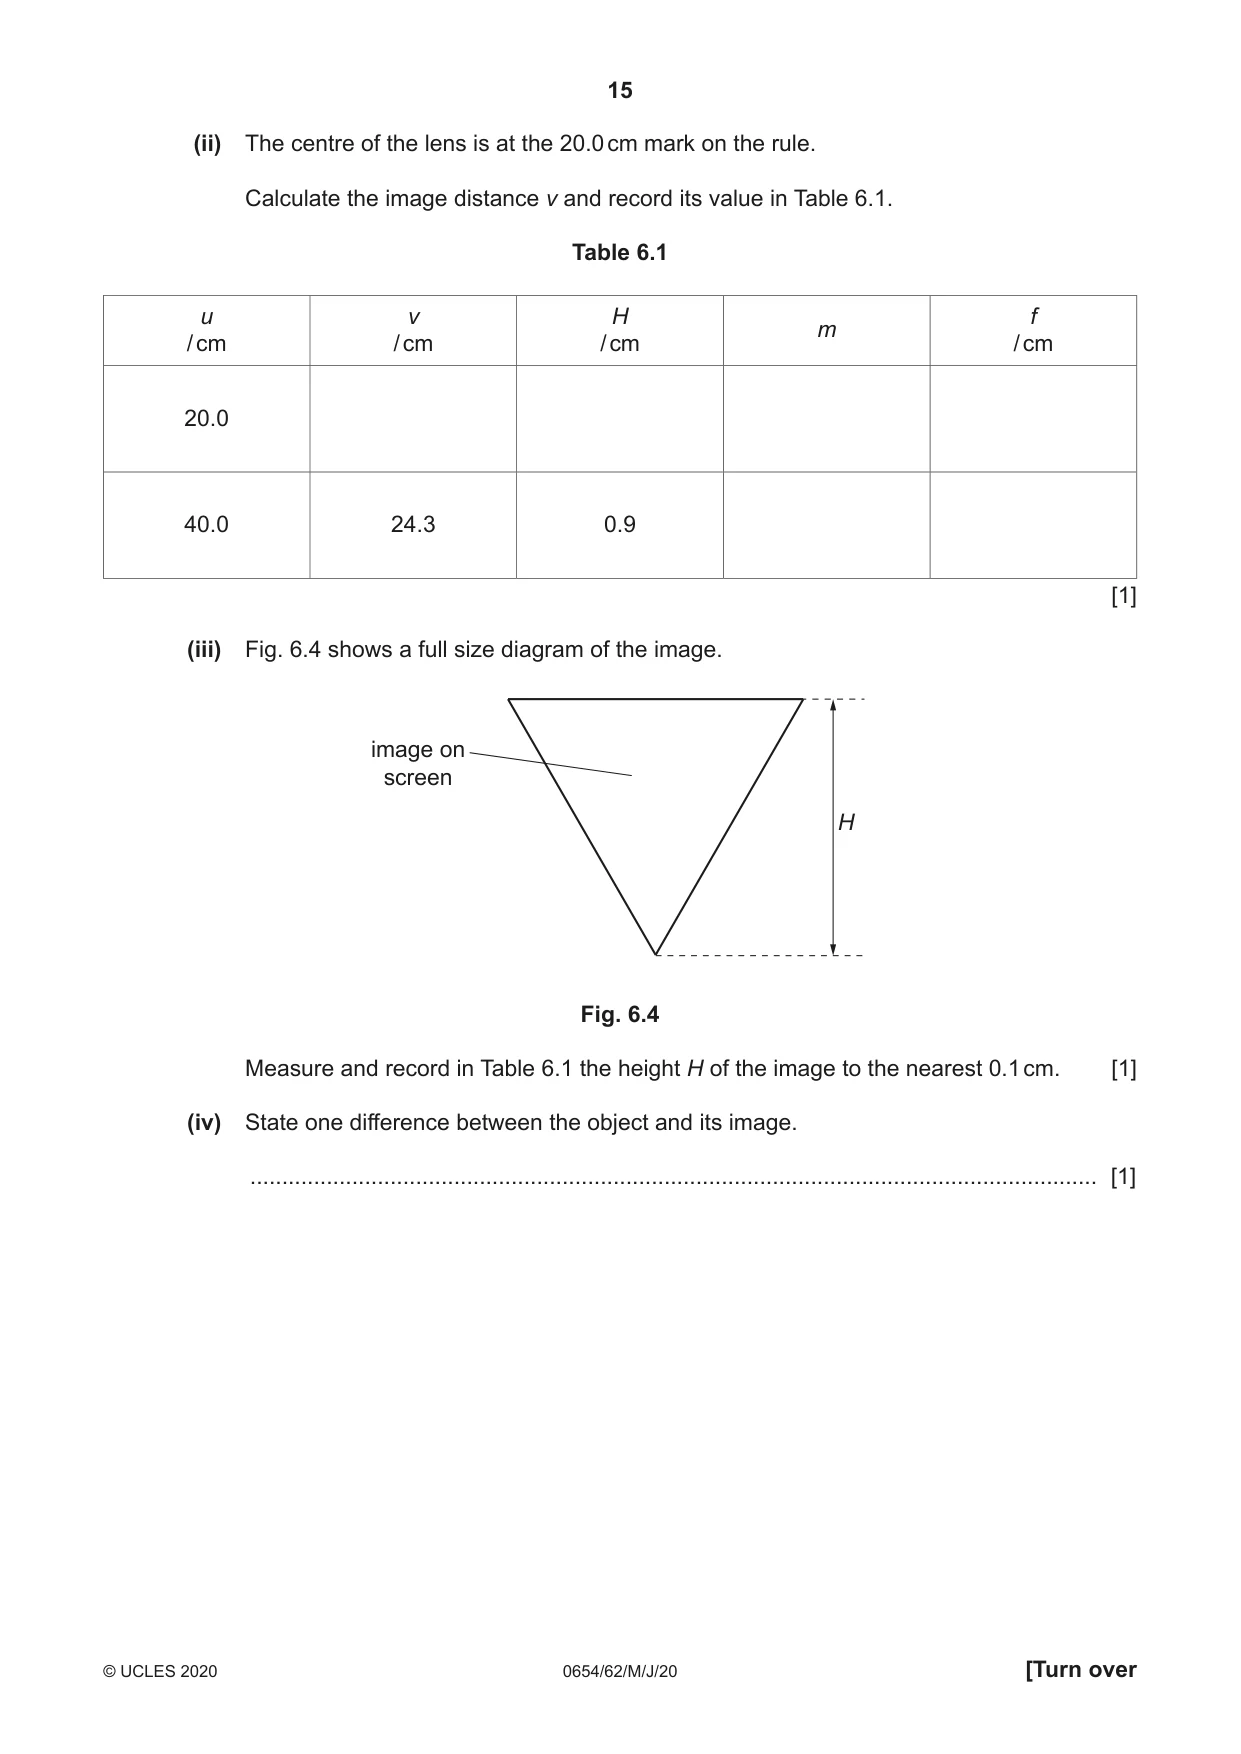
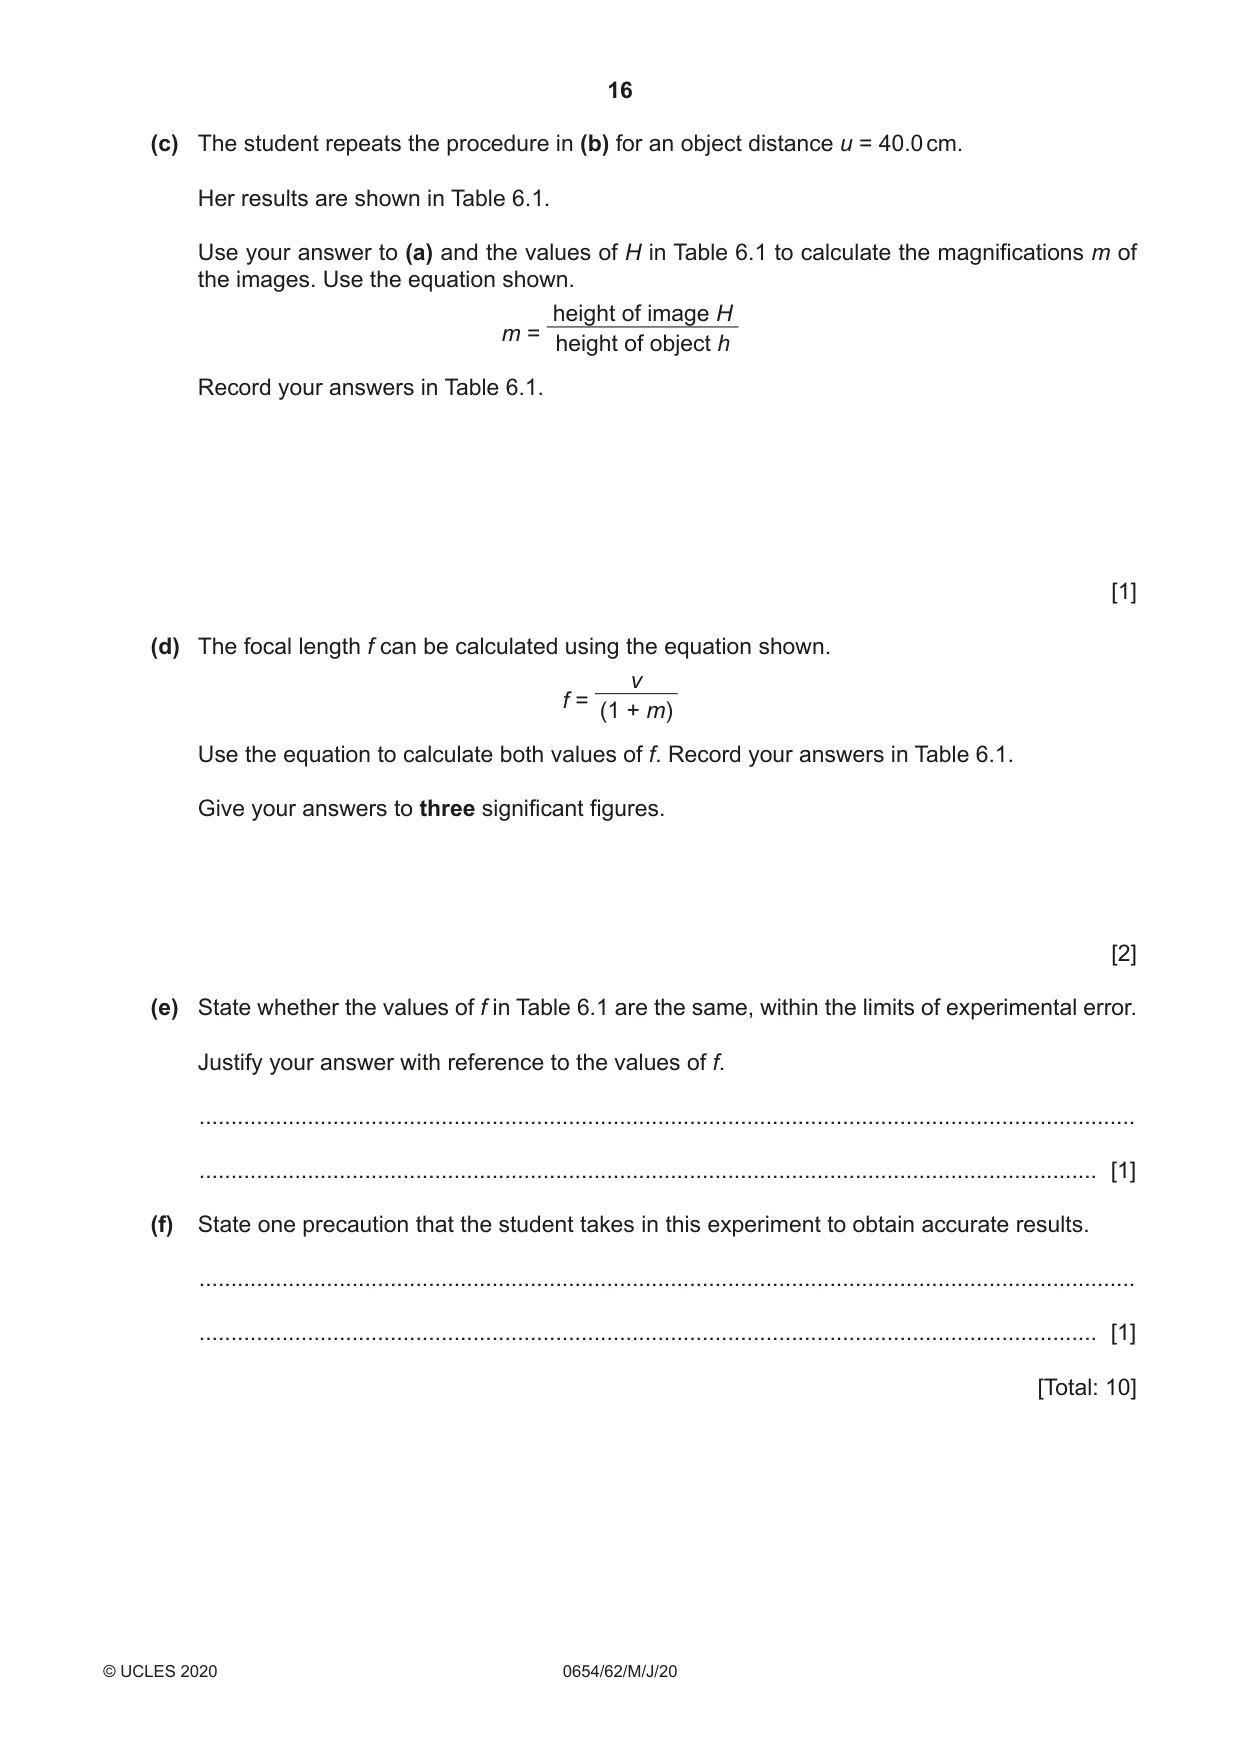
6 A student determines the focal length f of a lens by measuring the magnification of the image that it forms on a screen. She sets up the apparatus as shown in Fig. 6.1. illuminated triangular object screen convex lens h u v lamp Fig. 6.1 (a) Fig. 6.2 shows a full size diagram of the illuminated triangular object. illuminated object h Fig. 6.2 Measure the height h of the illuminated triangular object to the nearest 0.1 cm. h = .................................................... cm [1] (b) Procedure • The student switches on the lamp. • She places the lens at a distance u = 20.0 cm from the illuminated triangular object. • She adjusts the position of the screen by moving it slowly backwards and forwards until a sharp triangular image is formed on the screen. • She uses a metre rule placed on the bench to measure the image distance v. Fig. 6.3 shows the position of the screen when she takes her measurement. position of screen 76 77 78 79 80 81 cm Fig. 6.3 (i) Record the reading on the rule at the position of the screen. reading on rule = .................................................... cm [1] (ii) The centre of the lens is at the 20.0 cm mark on the rule. Calculate the image distance v and record its value in Table 6.1. Table 6.1 u v H f m/ cm / cm / cm / cm 20.0 40.0 24.3 0.9 [1] (iii) Fig. 6.4 shows a full size diagram of the image. image on screen H Fig. 6.4 Measure and record in Table 6.1 the height H of the image to the nearest 0.1 cm. [1] (iv) State one difference between the object and its image. ..................................................................................................................................... [1] (c) The student repeats the procedure in (b) for an object distance u = 40.0 cm. Her results are shown in Table 6.1. Use your answer to (a) and the values of H in Table 6.1 to calculate the magnifications m of the images. Use the equation shown. height of image H m = height of object h Record your answers in Table 6.1. [1] (d) The focal length f can be calculated using the equation shown. v f = (1 + m) Use the equation to calculate both values of f. Record your answers in Table 6.1. Give your answers to three significant figures. [2] (e) State whether the values of f in Table 6.1 are the same, within the limits of experimental error. Justify your answer with reference to the values of f. ................................................................................................................................................... ............................................................................................................................................. [1] (f) State one precaution that the student takes in this experiment to obtain accurate results. ................................................................................................................................................... ............................................................................................................................................. [1] [Total: 10]
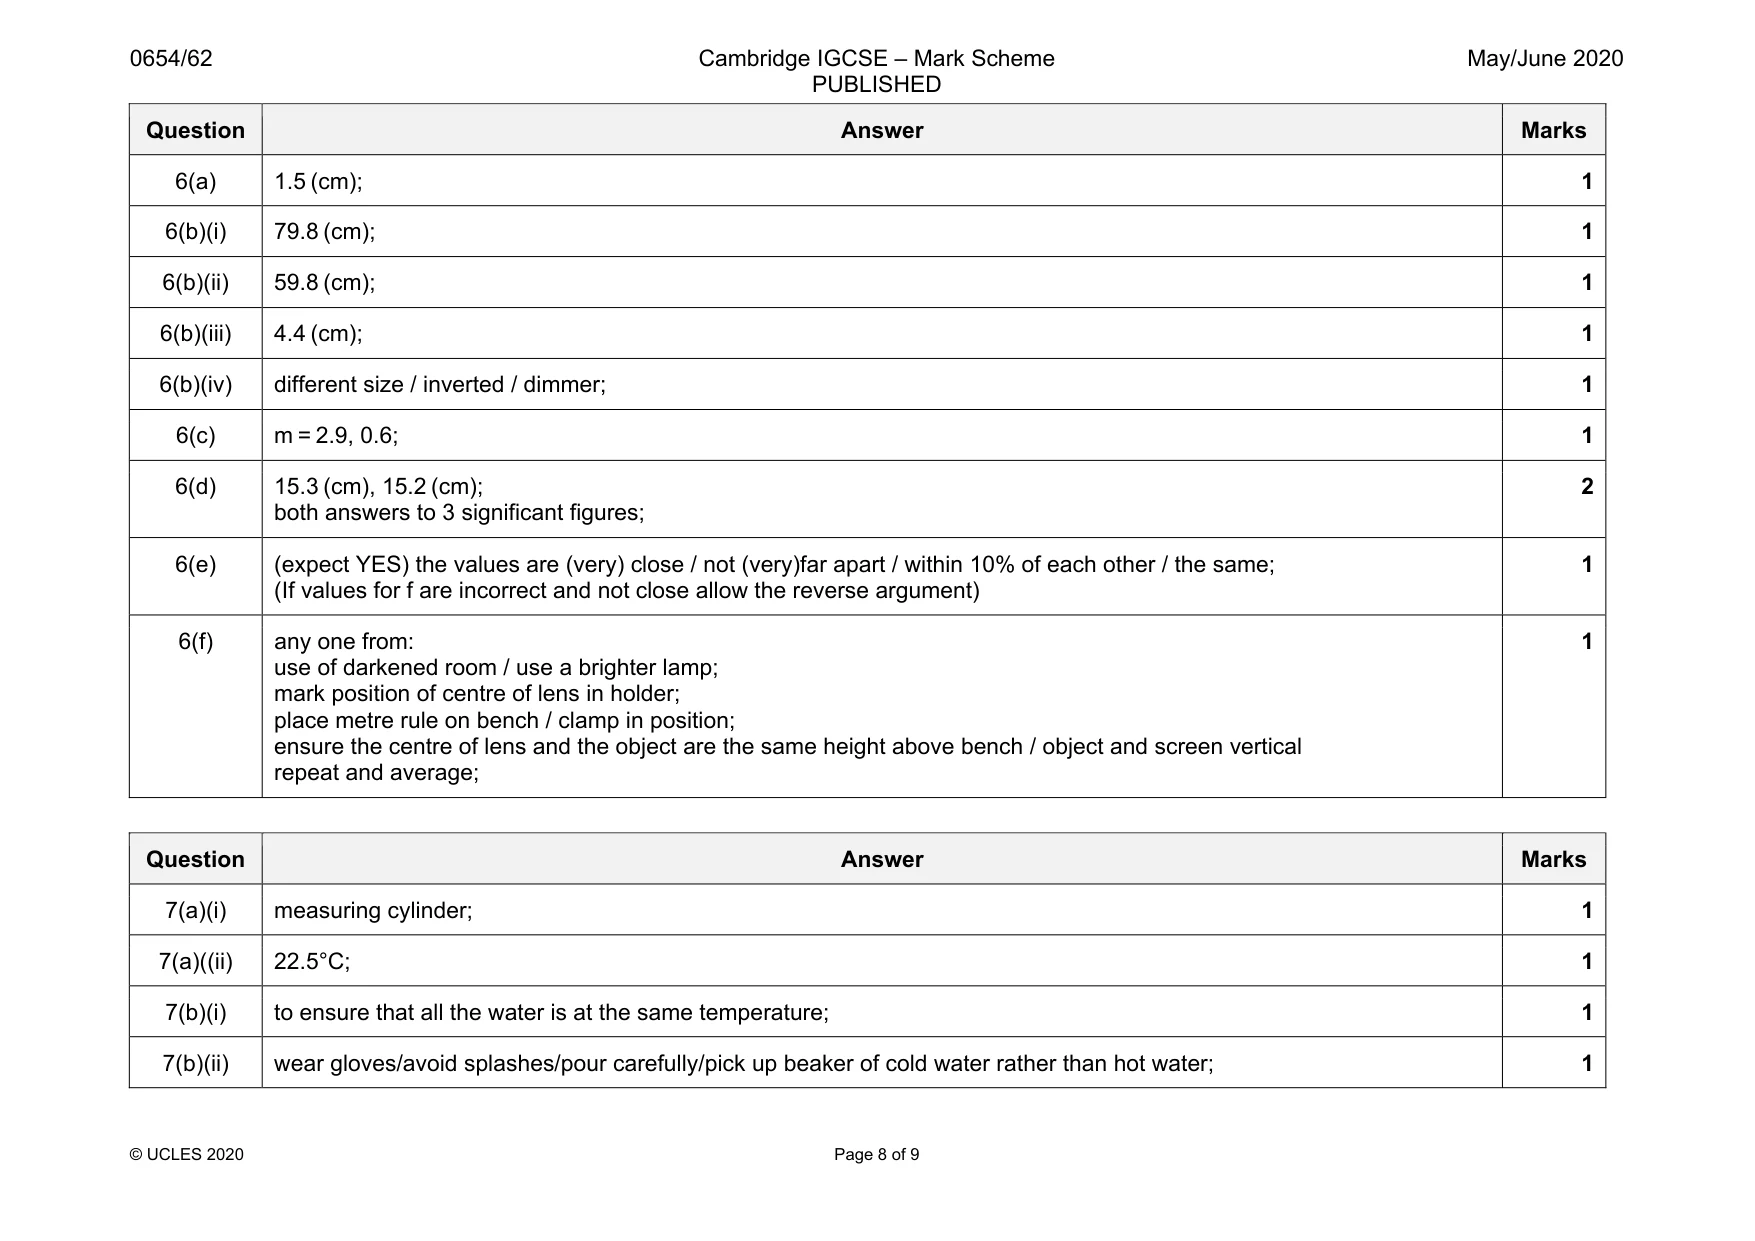
Mark scheme: 6(a) 1.5 (cm); 1 6(b)(i) 79.8 (cm); 1 6(b)(ii) 59.8 (cm); 1 6(b)(iii) 4.4 (cm); 1 6(b)(iv) different size / inverted / dimmer; 1 6(c) m = 2.9, 0.6; 1 6(d) 15.3 (cm), 15.2 (cm); both answers to 3 significant figures; 2 6(e) (expect YES) the values are (very) close / not (very)far apart / within 10% of each other / the same; (If values for f are incorrect and not close allow the reverse argument) 1 6(f) any one from: use of darkened room / use a brighter lamp; mark position of centre of lens in holder; place metre rule on bench / clamp in position; ensure the centre of lens and the object are the same height above bench / object and screen vertical repeat and average; 1
Q7 · A student determines the thermal energy lost from a beaker of water when hot and cold…
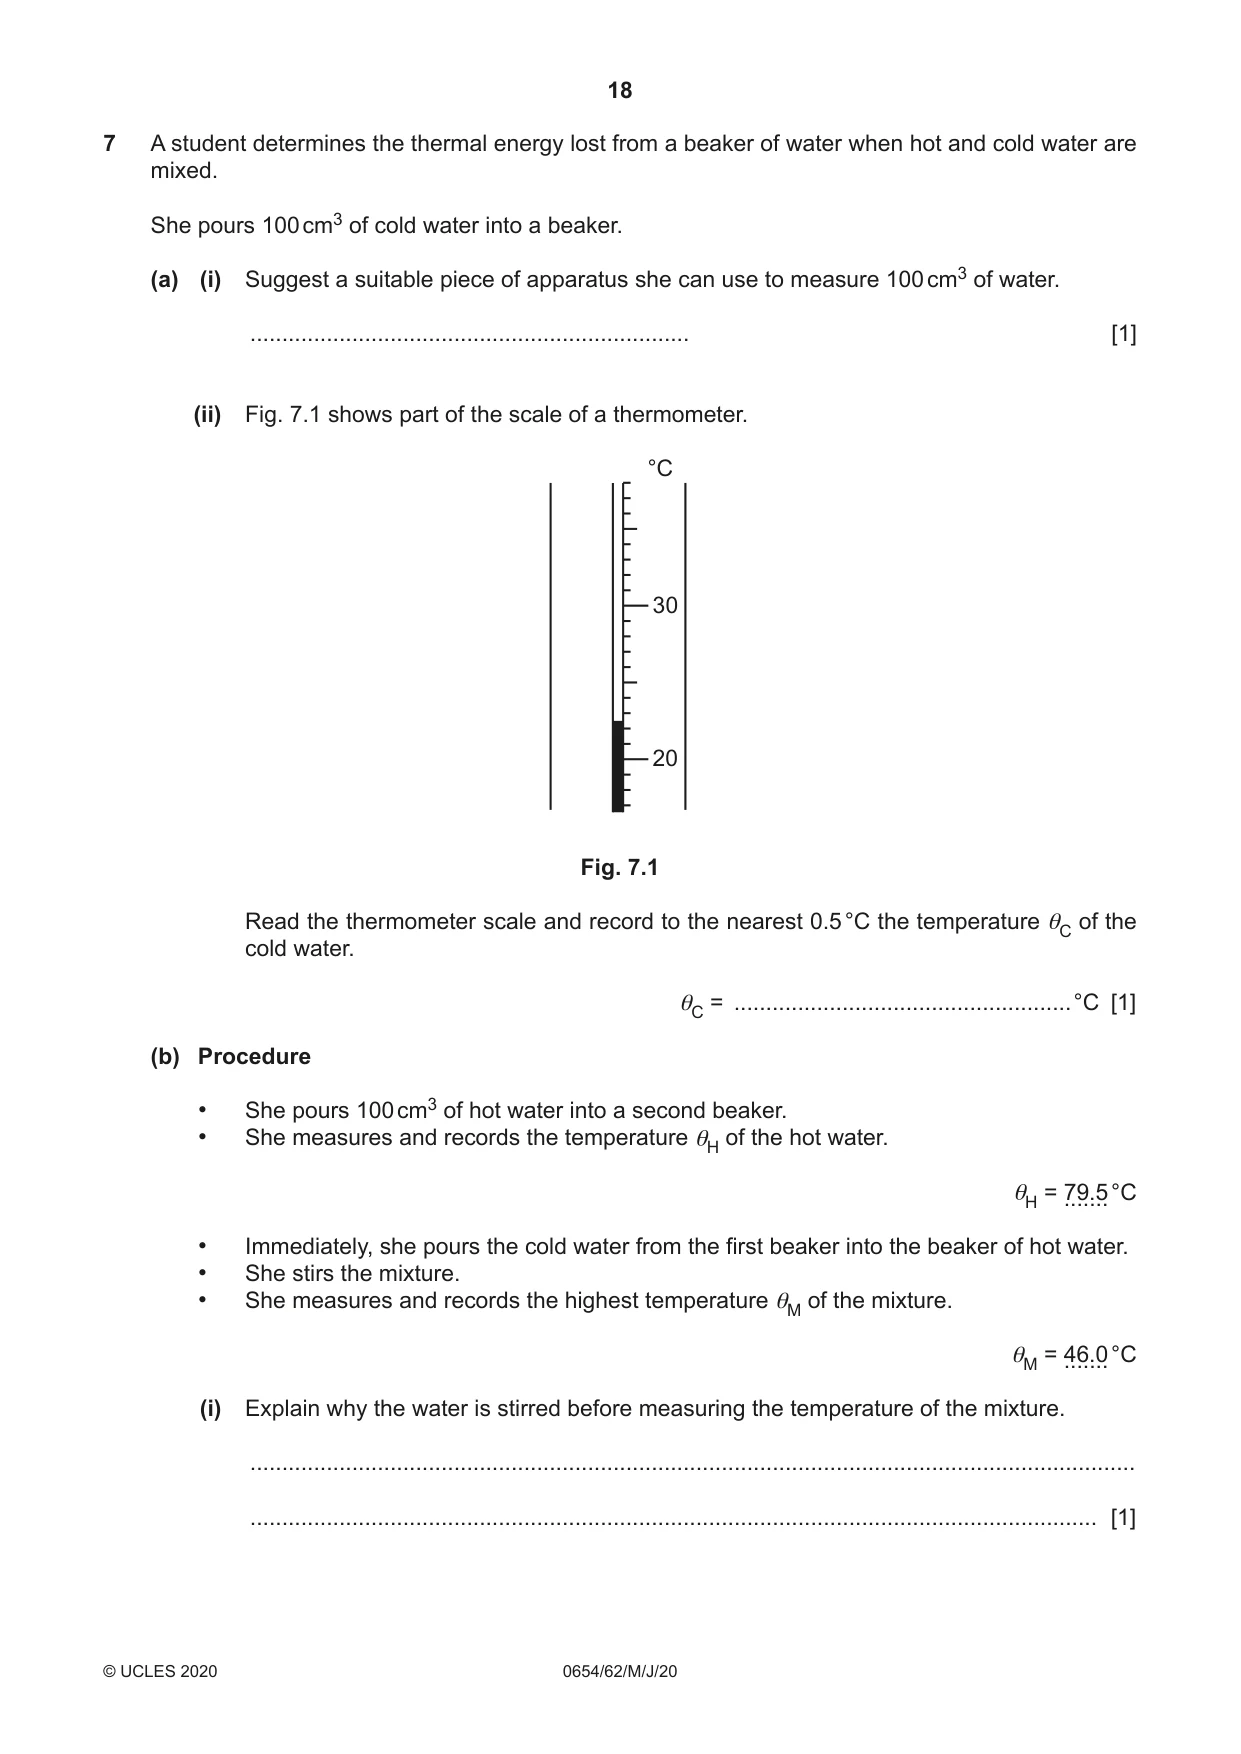
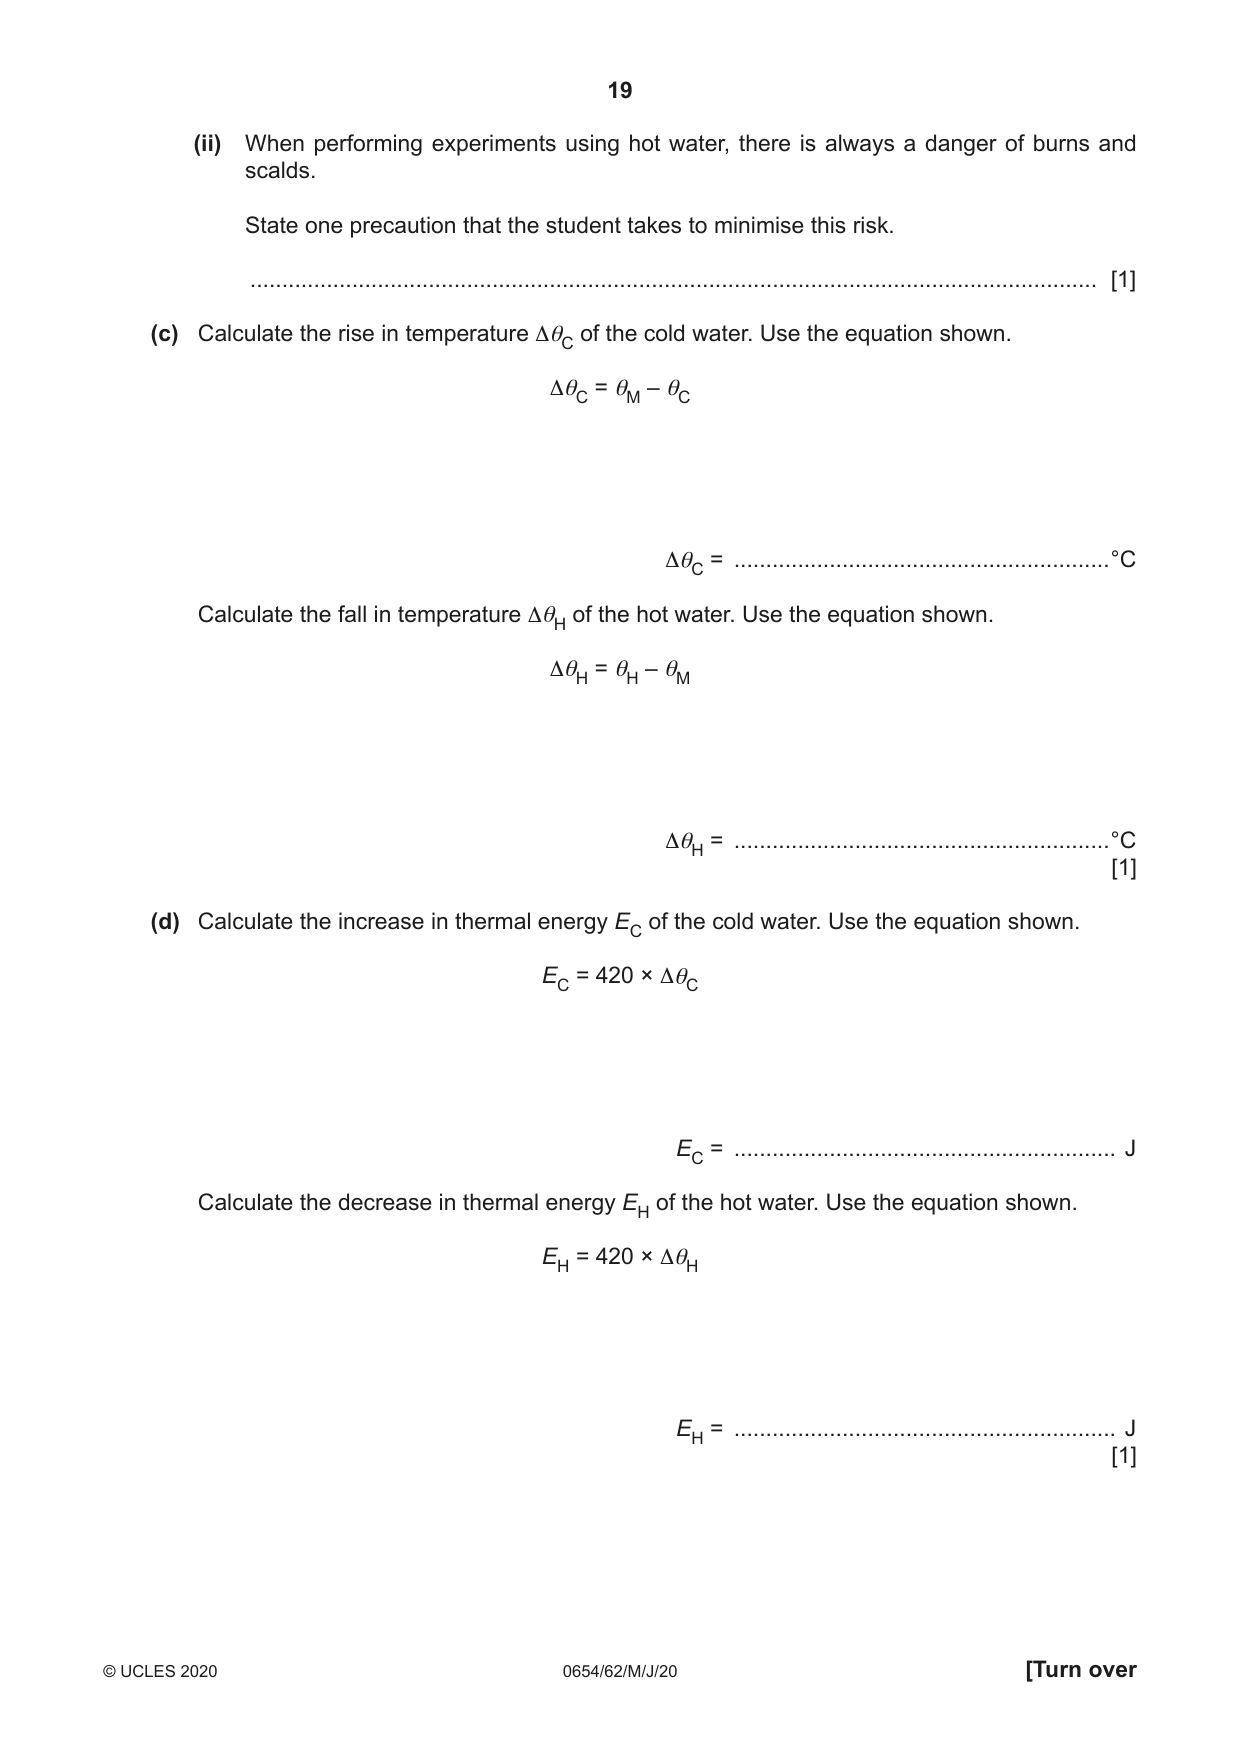
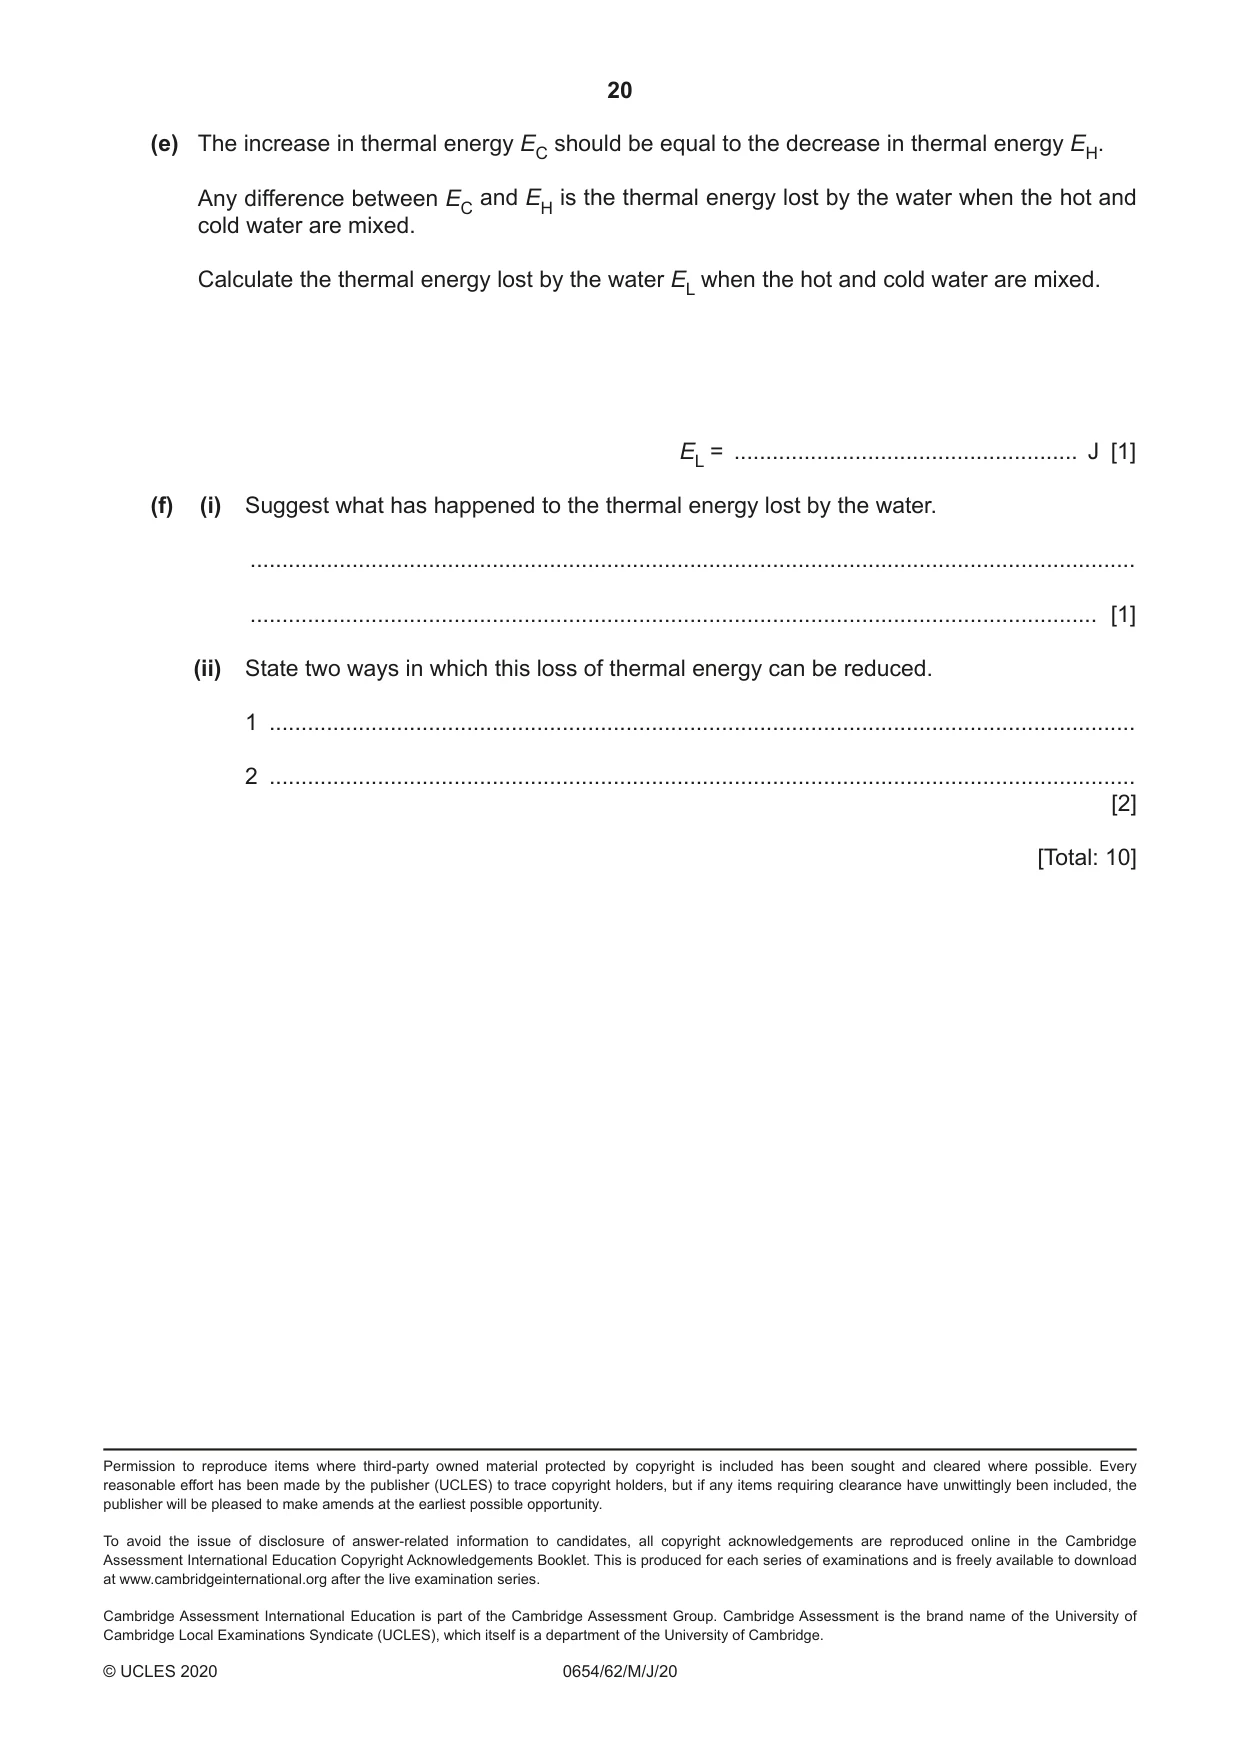
7 A student determines the thermal energy lost from a beaker of water when hot and cold water are mixed. She pours 100 cm3 of cold water into a beaker. (a) (i) Suggest a suitable piece of apparatus she can use to measure 100 cm3 of water. ..................................................................... [1] (ii) Fig. 7.1 shows part of the scale of a thermometer. °C 30 20 Fig. 7.1 Read the thermometer scale and record to the nearest 0.5 °C the temperature θC of the cold water. θC = .....................................................°C [1] (b) Procedure • She pours 100 cm3 of hot water into a second beaker. • She measures and records the temperature θH of the hot water. θH = 79.5....... °C • Immediately, she pours the cold water from the first beaker into the beaker of hot water. • She stirs the mixture. • She measures and records the highest temperature θM of the mixture. θM = 46.0....... °C (i) Explain why the water is stirred before measuring the temperature of the mixture. ........................................................................................................................................... ..................................................................................................................................... [1] (ii) When performing experiments using hot water, there is always a danger of burns and scalds. State one precaution that the student takes to minimise this risk. ..................................................................................................................................... [1] (c) Calculate the rise in temperature ∆θC of the cold water. Use the equation shown. ∆θC = θM – θC ∆θC = ...........................................................°C Calculate the fall in temperature ∆θH of the hot water. Use the equation shown. ∆θH = θH – θM ∆θH = ...........................................................°C [1] (d) Calculate the increase in thermal energy EC of the cold water. Use the equation shown. EC = 420 × ∆θC EC = ............................................................ J Calculate the decrease in thermal energy EH of the hot water. Use the equation shown. EH = 420 × ∆θH EH = ............................................................ J [1] (e) The increase in thermal energy EC should be equal to the decrease in thermal energy EH. Any difference between EC and EH is the thermal energy lost by the water when the hot and cold water are mixed. Calculate the thermal energy lost by the water EL when the hot and cold water are mixed. EL = ...................................................... J [1] (f) (i) Suggest what has happened to the thermal energy lost by the water. ........................................................................................................................................... ..................................................................................................................................... [1] (ii) State two ways in which this loss of thermal energy can be reduced. 1 ........................................................................................................................................ 2 ........................................................................................................................................ [2] [Total: 10]
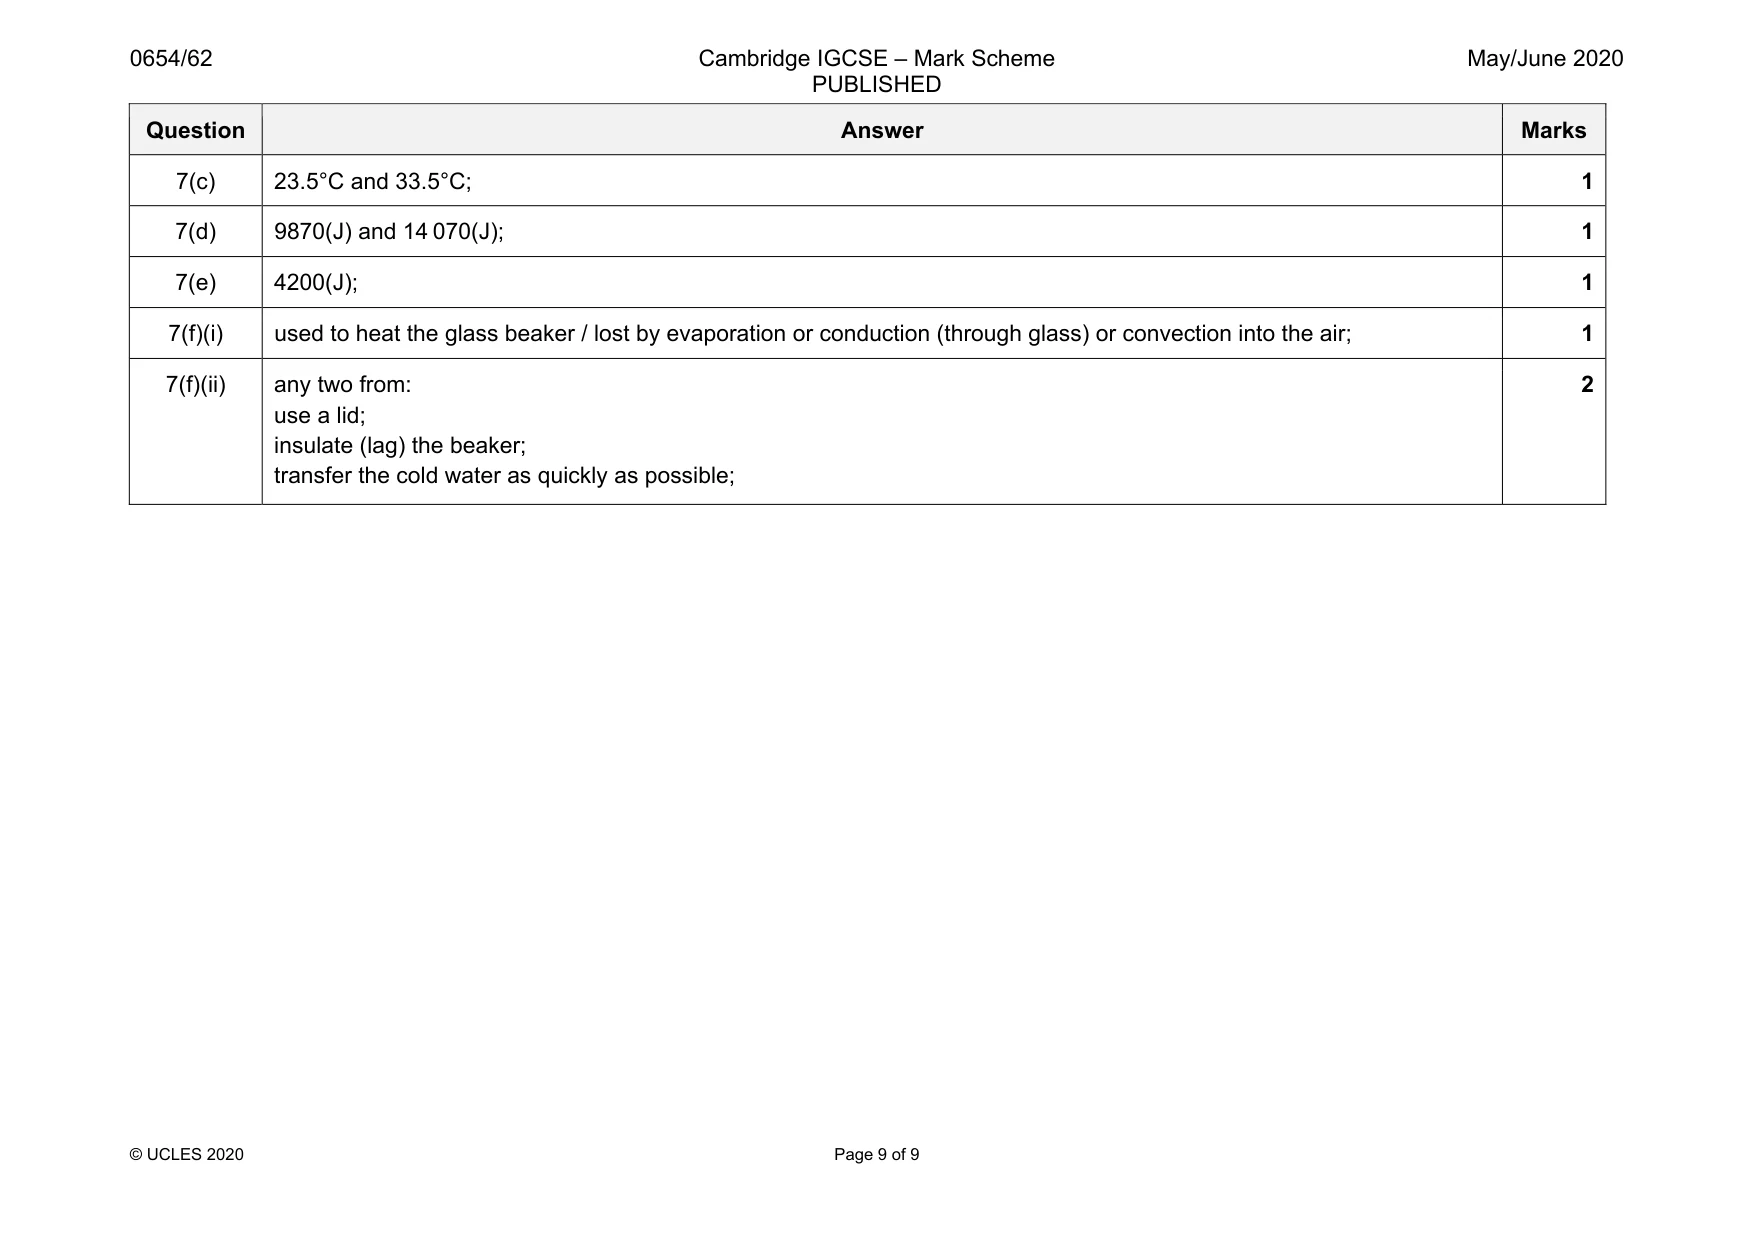
Mark scheme: 7(a)(i) measuring cylinder; 1 7(a)((ii) 22.5°C; 1 7(b)(i) to ensure that all the water is at the same temperature; 1 7(b)(ii) wear gloves/avoid splashes/pour carefully/pick up beaker of cold water rather than hot water; 1 Question Answer Marks 7(c) 23.5°C and 33.5°C; 1 7(d) 9870(J) and 14 070(J); 1 7(e) 4200(J); 1 7(f)(i) used to heat the glass beaker / lost by evaporation or conduction (through glass) or convection into the air; 1 7(f)(ii) any two from: use a lid; insulate (lag) the beaker; transfer the cold water as quickly as possible; 2
What was in this paper
The subtopics covered by these 7 questions, and how many questions each got. Open one in a new tab to see every Cambridge question on it.