Cambridge IGCSE Sciences - Co-ordinated (Double) 0654 — 2024 May/June Paper 6 · Variant 2
0654/62/M/J/24 · 6 questions · 60 marks · ≈68 min
The question paper and its mark scheme, free to read here and free to download. This is Cambridge’s own paper, exactly as it was sat.
Question paper20 pages
Mark scheme9 pages
Answers below. Sit the paper first if you are practising.
Questions as text
Q1 · A student investigates the glucose concentration of solution S
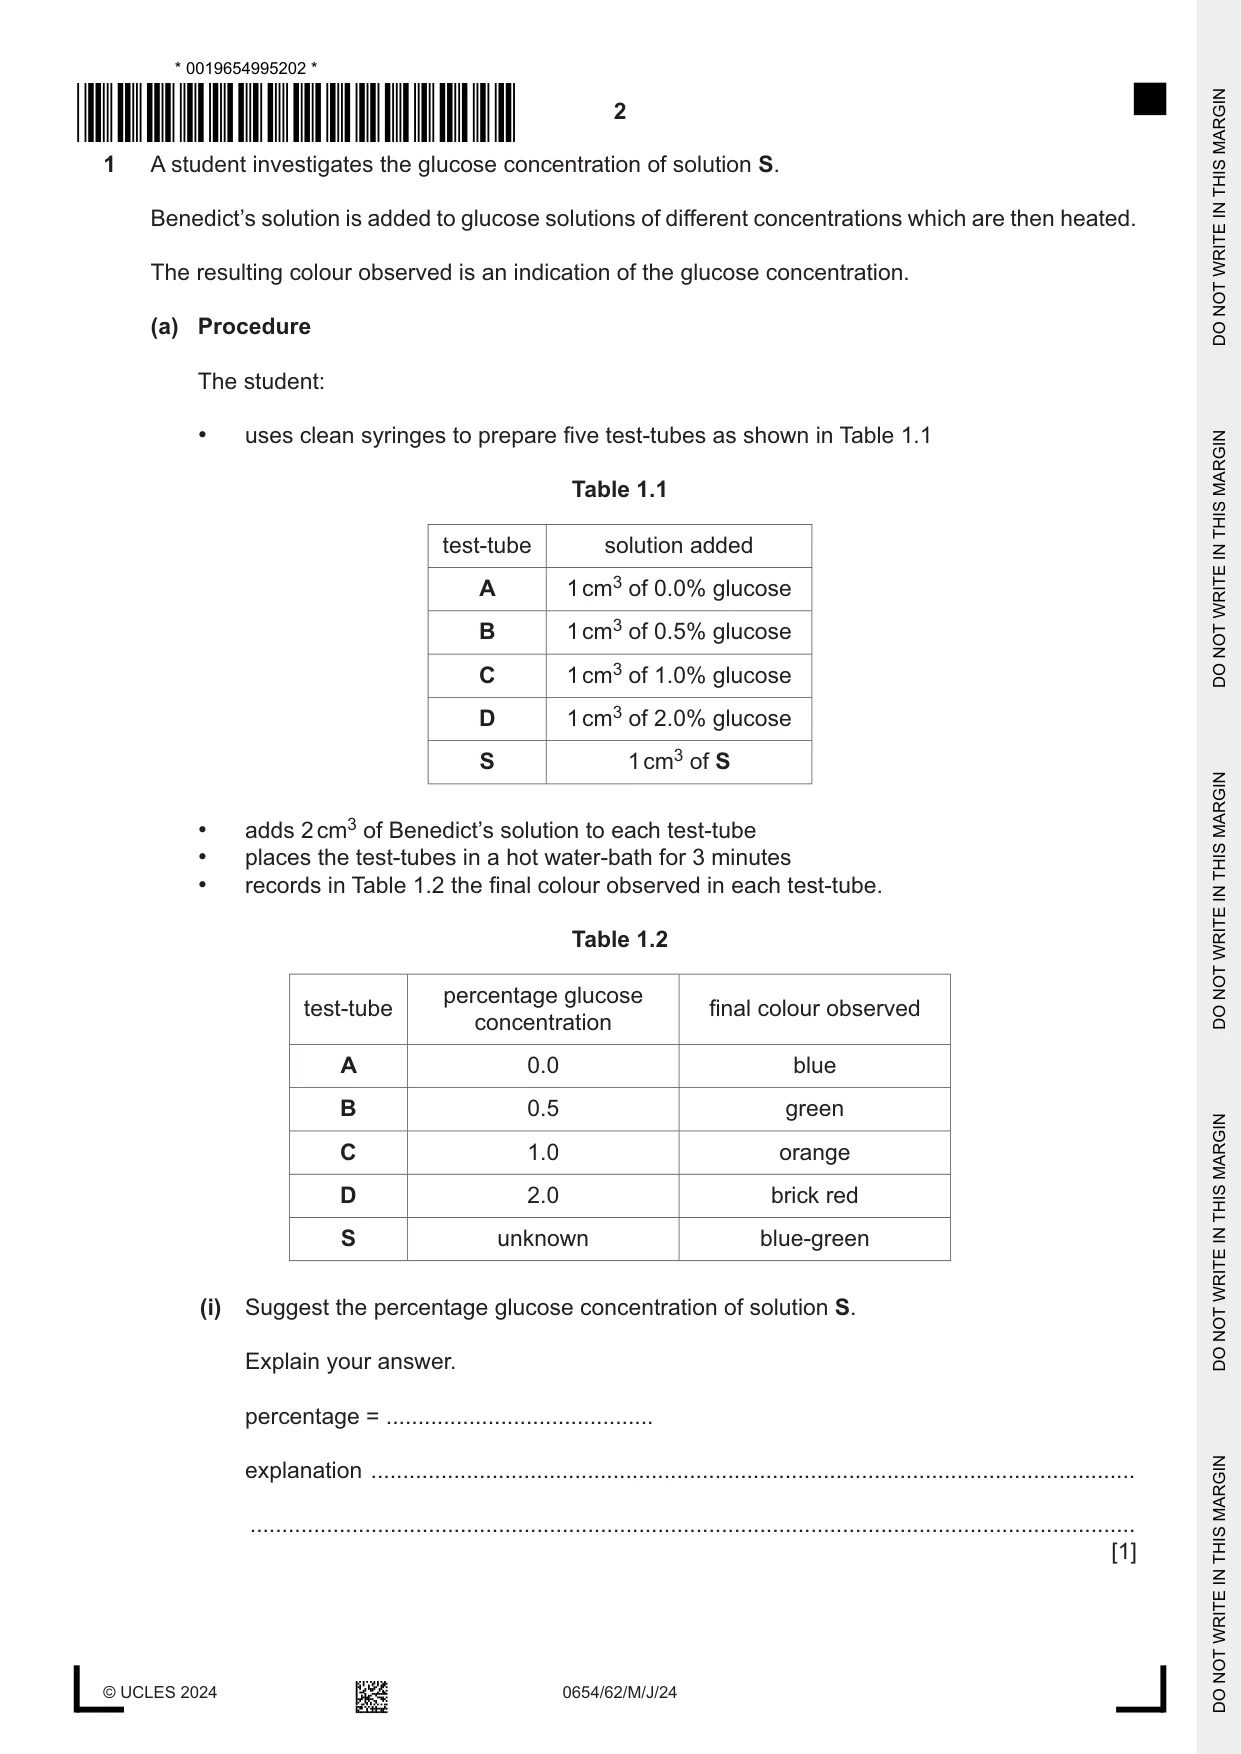
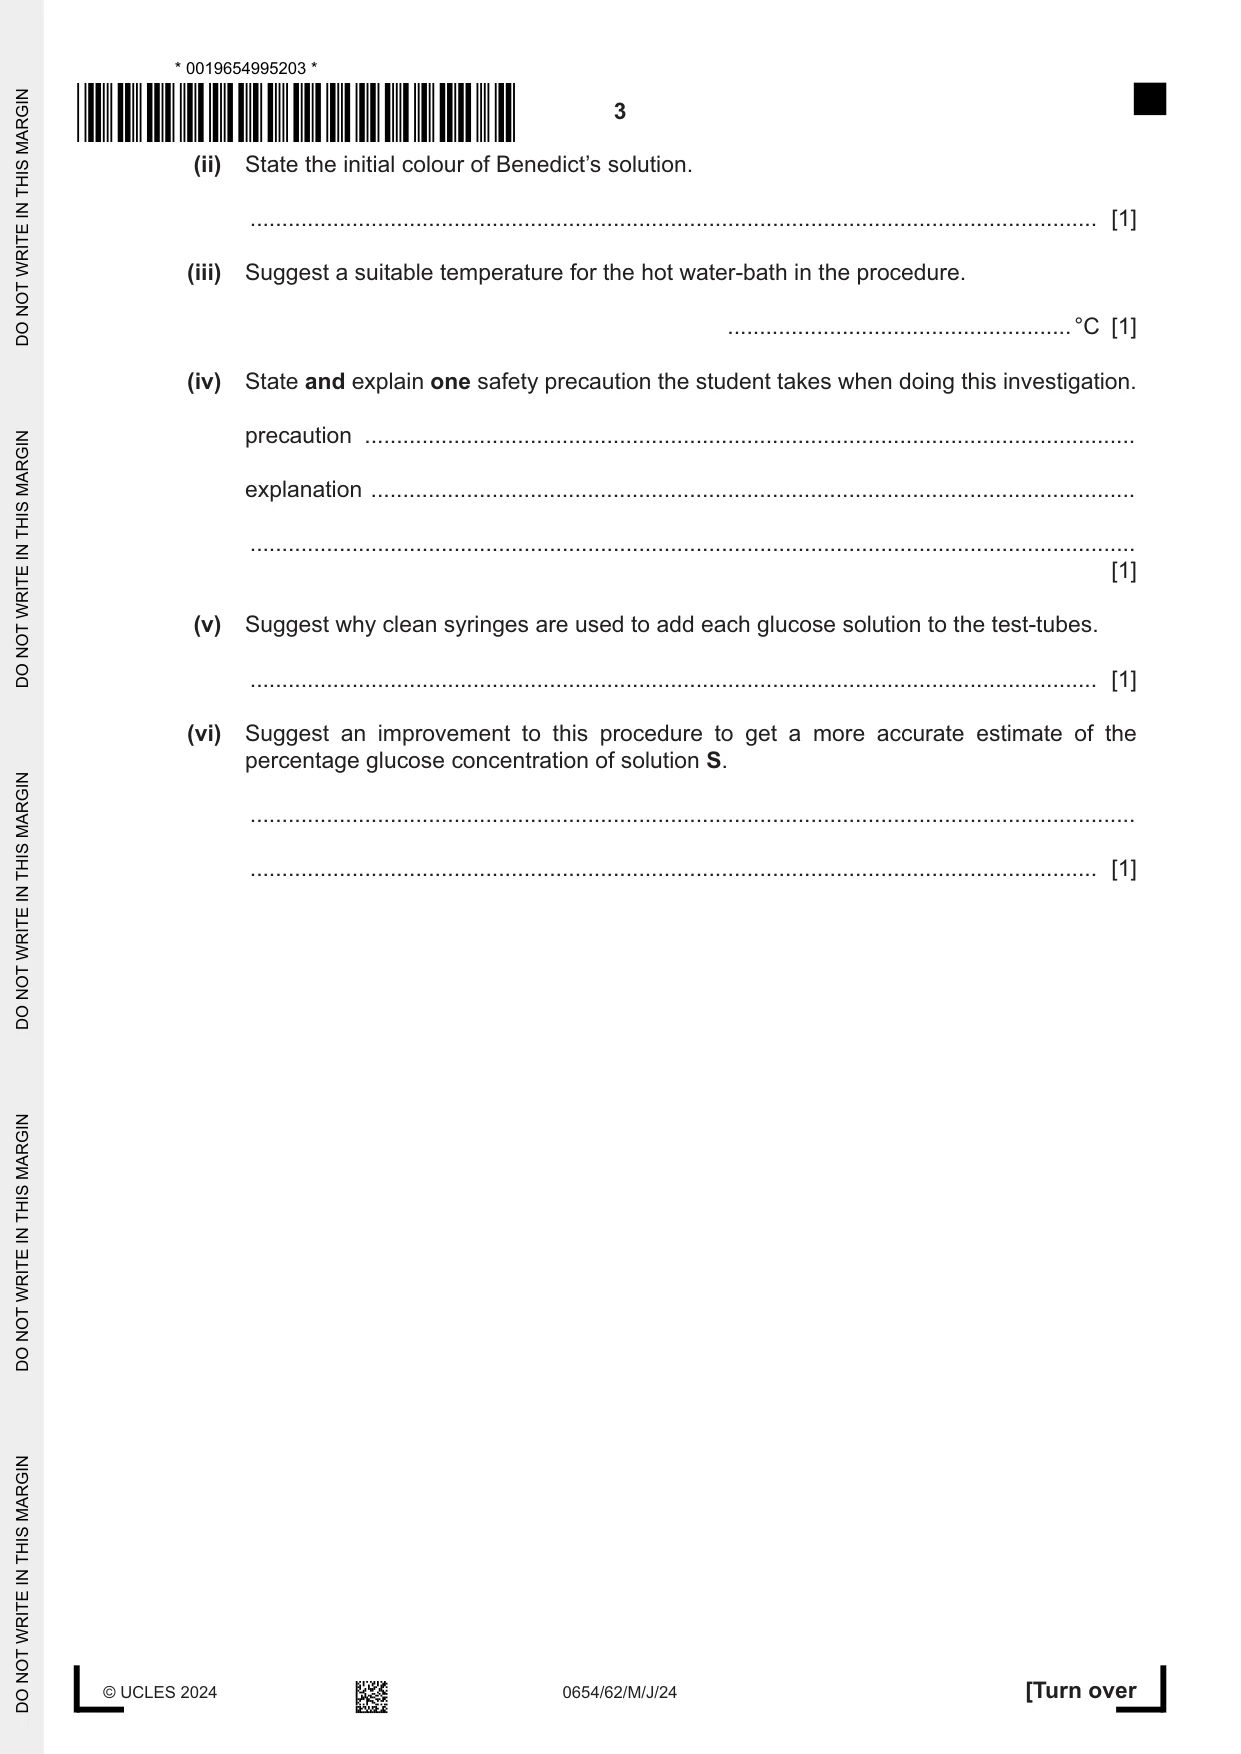
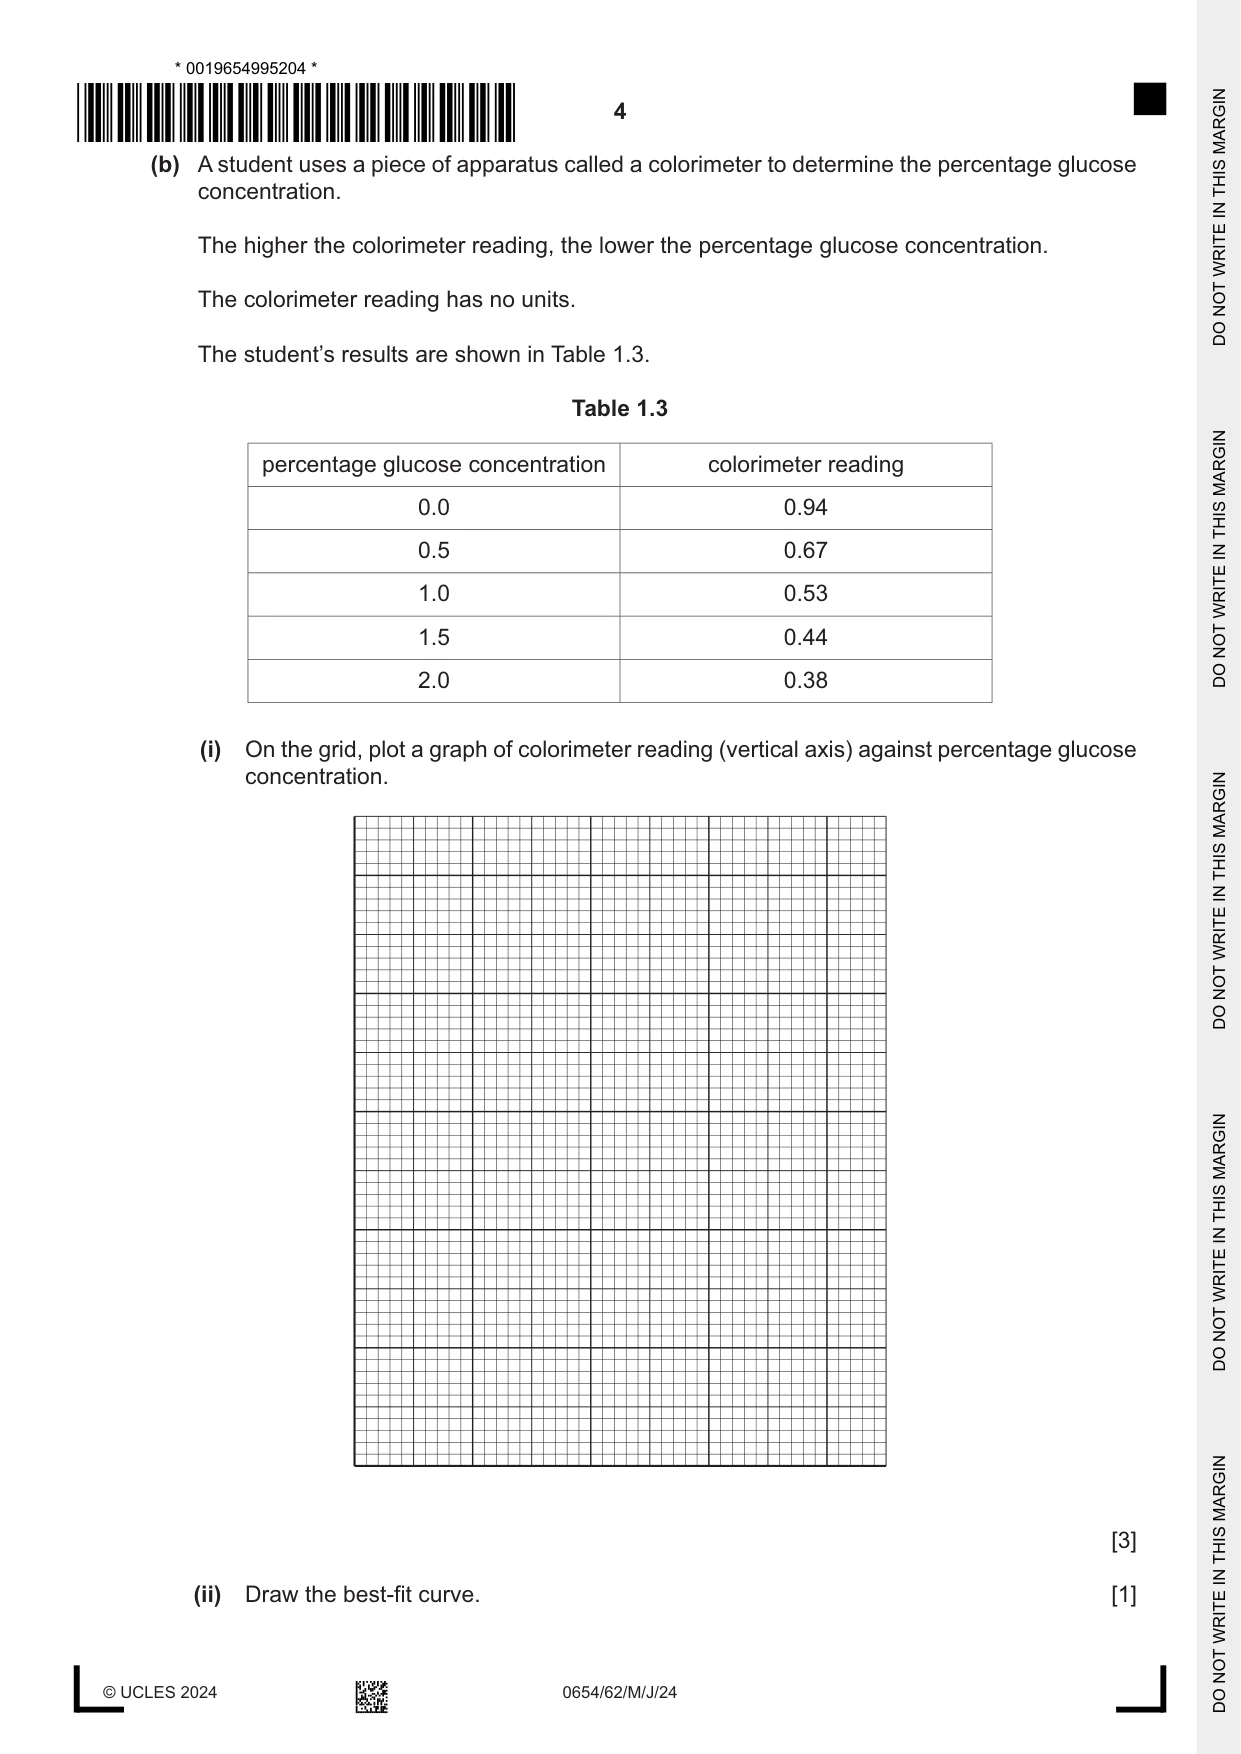
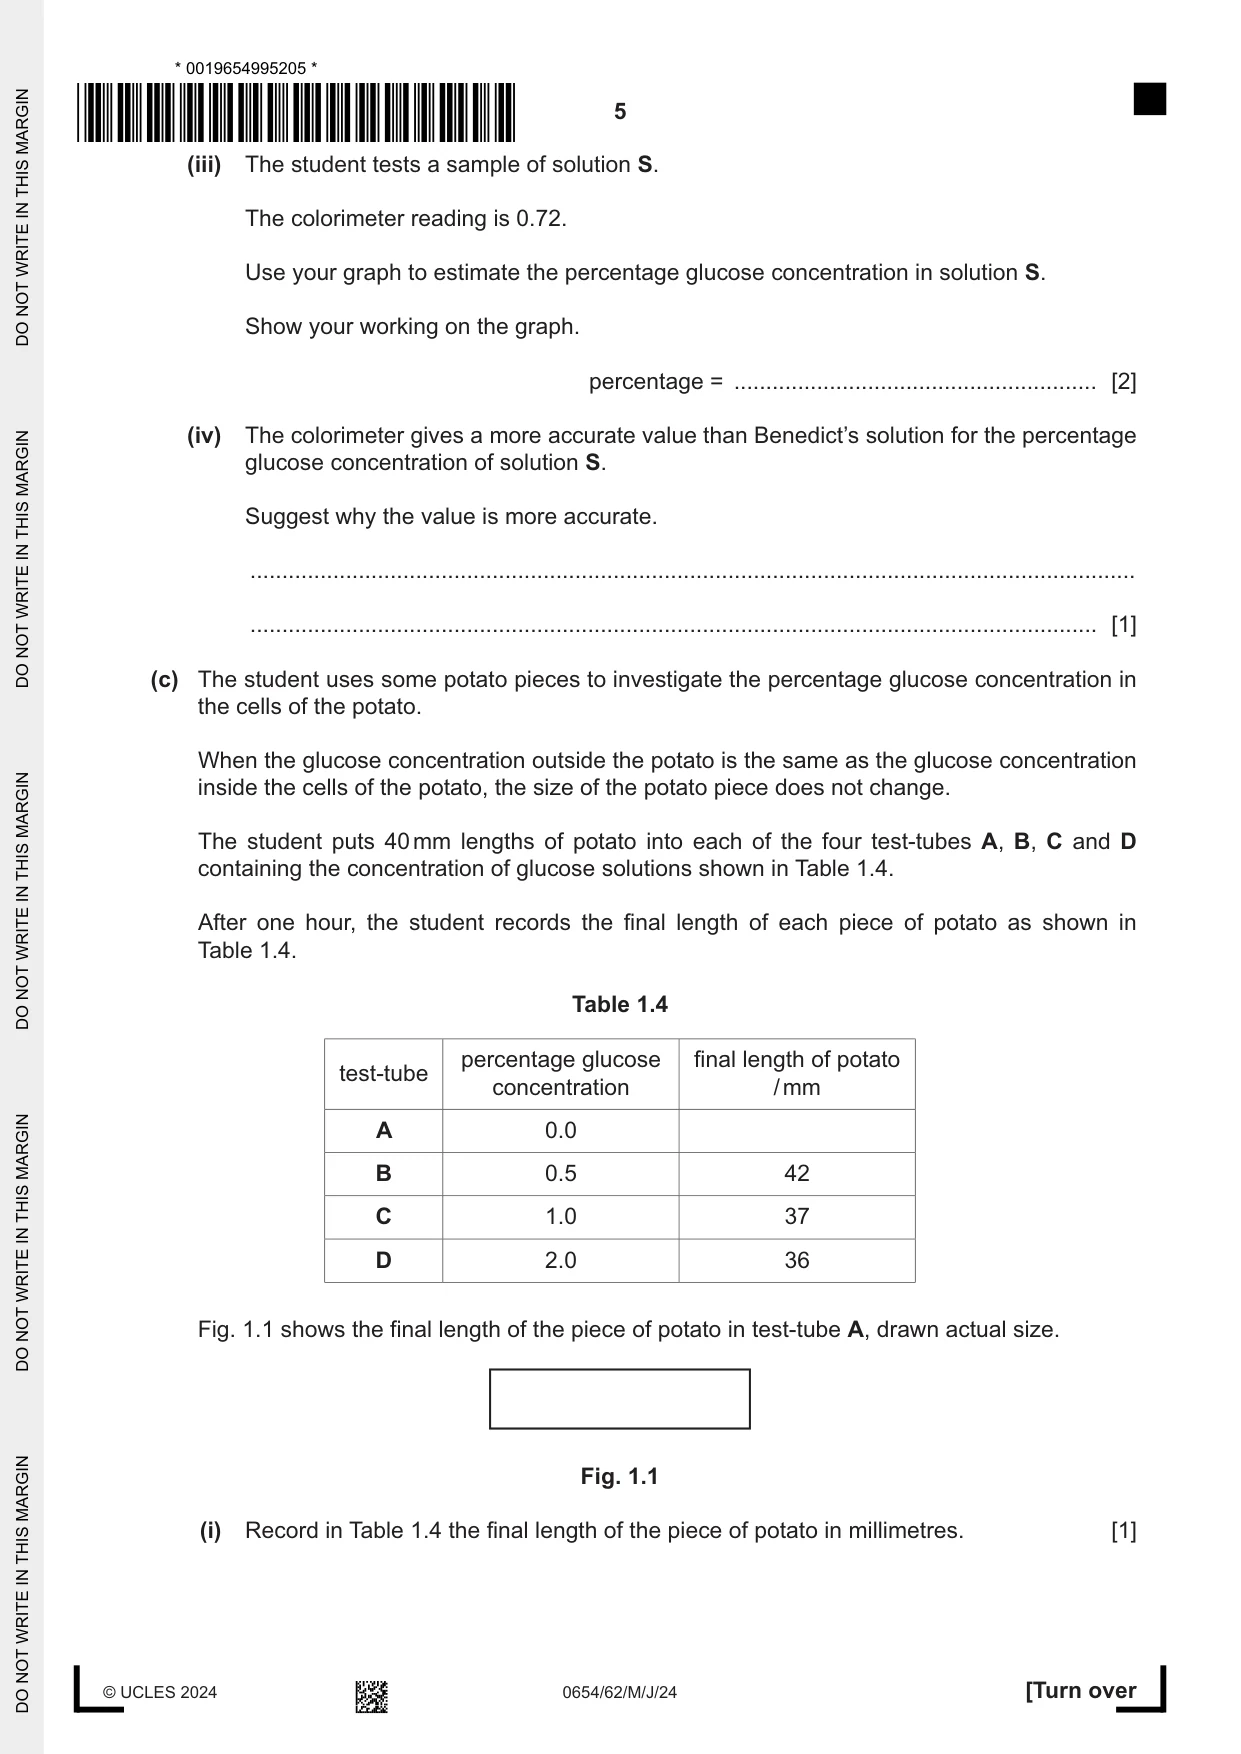
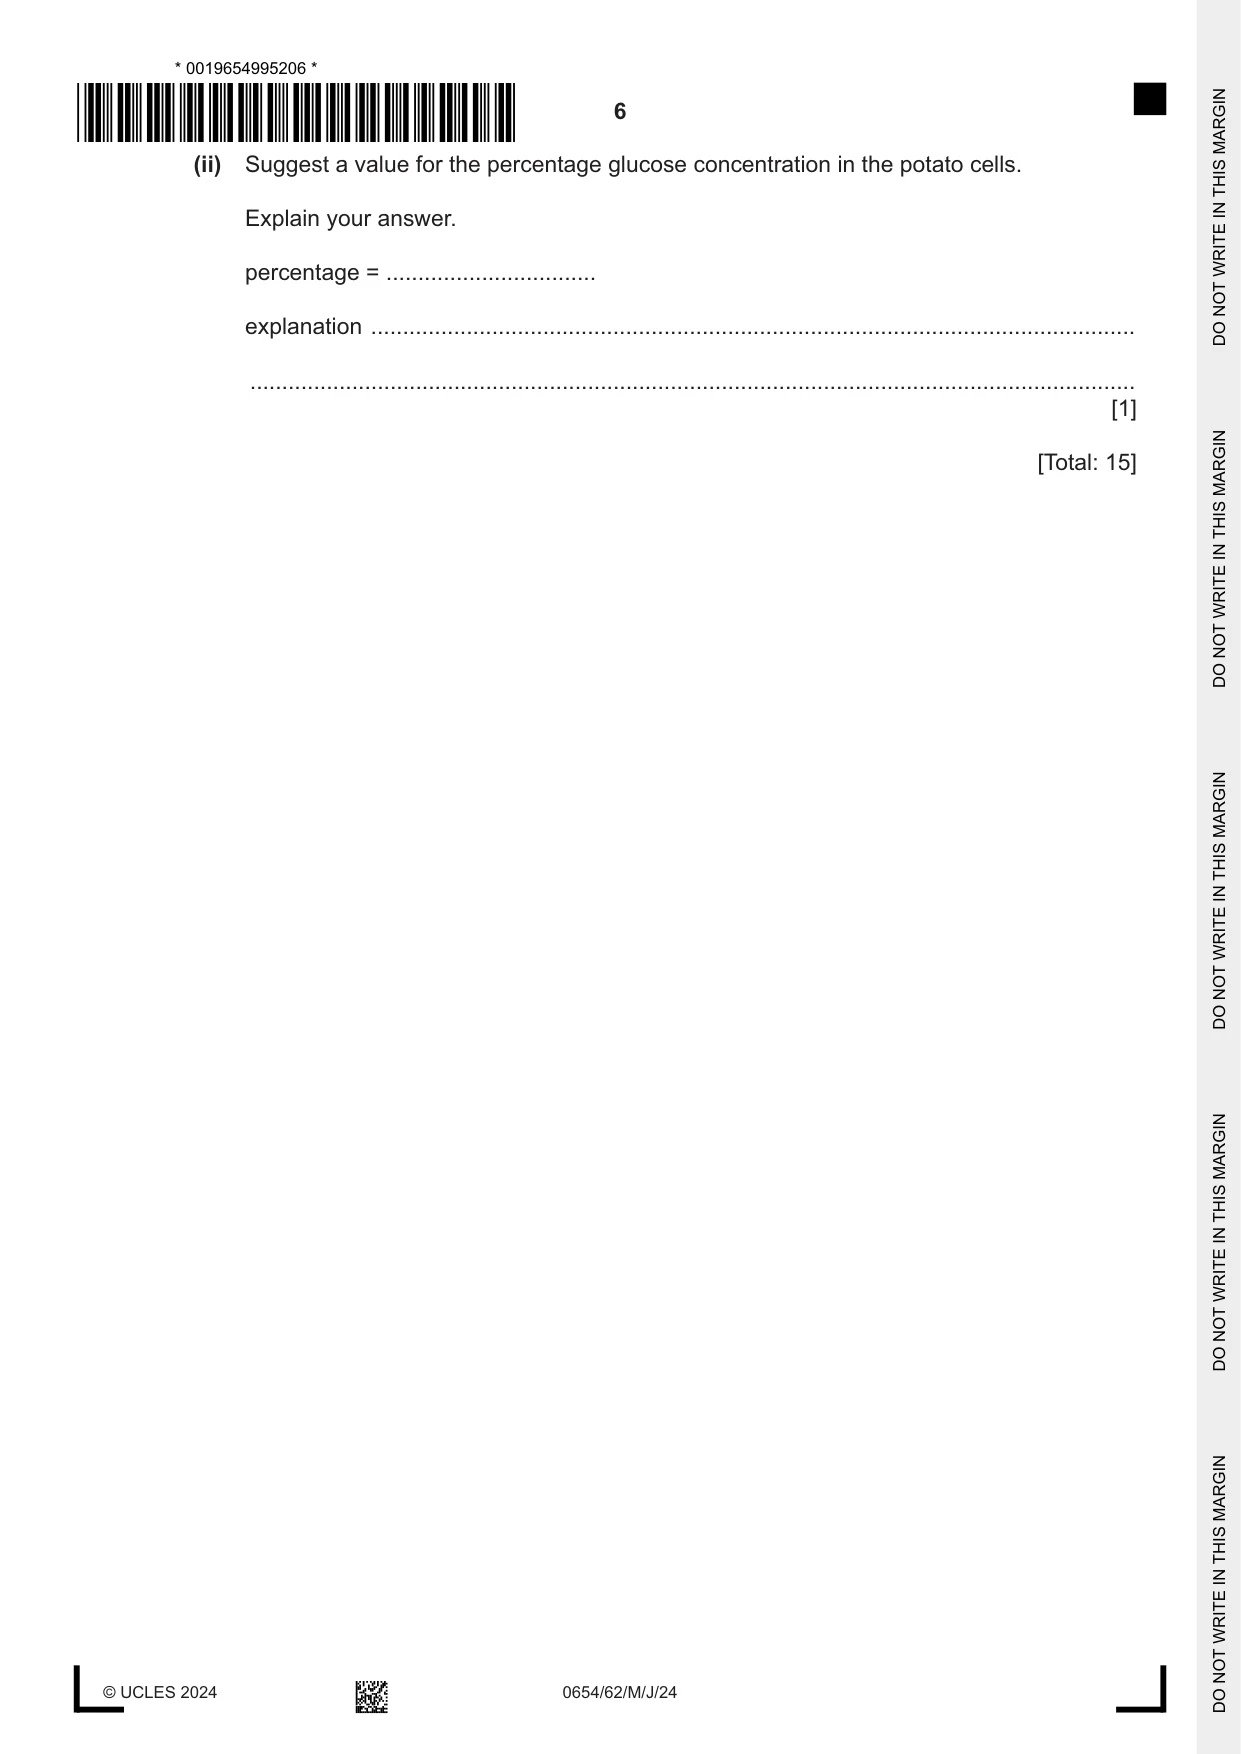
1 A student investigates the glucose concentration of solution S. Benedict’s solution is added to glucose solutions of different concentrations which are then heated. The resulting colour observed is an indication of the glucose concentration. (a) Procedure The student: • uses clean syringes to prepare five test-tubes as shown in Table 1.1 Table 1.1 test-tube solution added A 1 cm3 of 0.0% glucose B 1 cm3 of 0.5% glucose C 1 cm3 of 1.0% glucose D 1 cm3 of 2.0% glucose S 1 cm3 of S • adds 2 cm3 of Benedict’s solution to each test-tube • places the test-tubes in a hot water-bath for 3 minutes • records in Table 1.2 the final colour observed in each test-tube. Table 1.2 percentage glucose test-tube final colour observed concentration A 0.0 blue B 0.5 green C 1.0 orange D 2.0 brick red S unknown blue-green (i) Suggest the percentage glucose concentration of solution S. Explain your answer. percentage = .......................................... explanation ........................................................................................................................ ........................................................................................................................................... [1] (ii) State the initial colour of Benedict’s solution. ..................................................................................................................................... [1] (iii) Suggest a suitable temperature for the hot water-bath in the procedure. ...................................................... °C [1] (iv) State and explain one safety precaution the student takes when doing this investigation. precaution ......................................................................................................................... explanation ........................................................................................................................ ........................................................................................................................................... [1] (v) Suggest why clean syringes are used to add each glucose solution to the test-tubes. ..................................................................................................................................... [1] (vi) Suggest an improvement to this procedure to get a more accurate estimate of the percentage glucose concentration of solution S. ........................................................................................................................................... ..................................................................................................................................... [1] (b) A student uses a piece of apparatus called a colorimeter to determine the percentage glucose concentration. The higher the colorimeter reading, the lower the percentage glucose concentration. The colorimeter reading has no units. The student’s results are shown in Table 1.3. Table 1.3 percentage glucose concentration colorimeter reading 0.0 0.94 0.5 0.67 1.0 0.53 1.5 0.44 2.0 0.38 (i) On the grid, plot a graph of colorimeter reading (vertical axis) against percentage glucose concentration. [3] (ii) Draw the best-fit curve. [1] (iii) The student tests a sample of solution S. The colorimeter reading is 0.72. Use your graph to estimate the percentage glucose concentration in solution S. Show your working on the graph. percentage = ......................................................... [2] (iv) The colorimeter gives a more accurate value than Benedict’s solution for the percentage glucose concentration of solution S. Suggest why the value is more accurate. ........................................................................................................................................... ..................................................................................................................................... [1] (c) The student uses some potato pieces to investigate the percentage glucose concentration in the cells of the potato. When the glucose concentration outside the potato is the same as the glucose concentration inside the cells of the potato, the size of the potato piece does not change. The student puts 40 mm lengths of potato into each of the four test-tubes A, B, C and D containing the concentration of glucose solutions shown in Table 1.4. After one hour, the student records the final length of each piece of potato as shown in Table 1.4. Table 1.4 percentage glucose final length of potato test-tube concentration / mm A 0.0 B 0.5 42 C 1.0 37 D 2.0 36 Fig. 1.1 shows the final length of the piece of potato in test-tube A, drawn actual size. Fig. 1.1 (i) Record in Table 1.4 the final length of the piece of potato in millimetres. [1] (ii) Suggest a value for the percentage glucose concentration in the potato cells. Explain your answer. percentage = ................................. explanation ........................................................................................................................ ........................................................................................................................................... [1] [Total: 15]
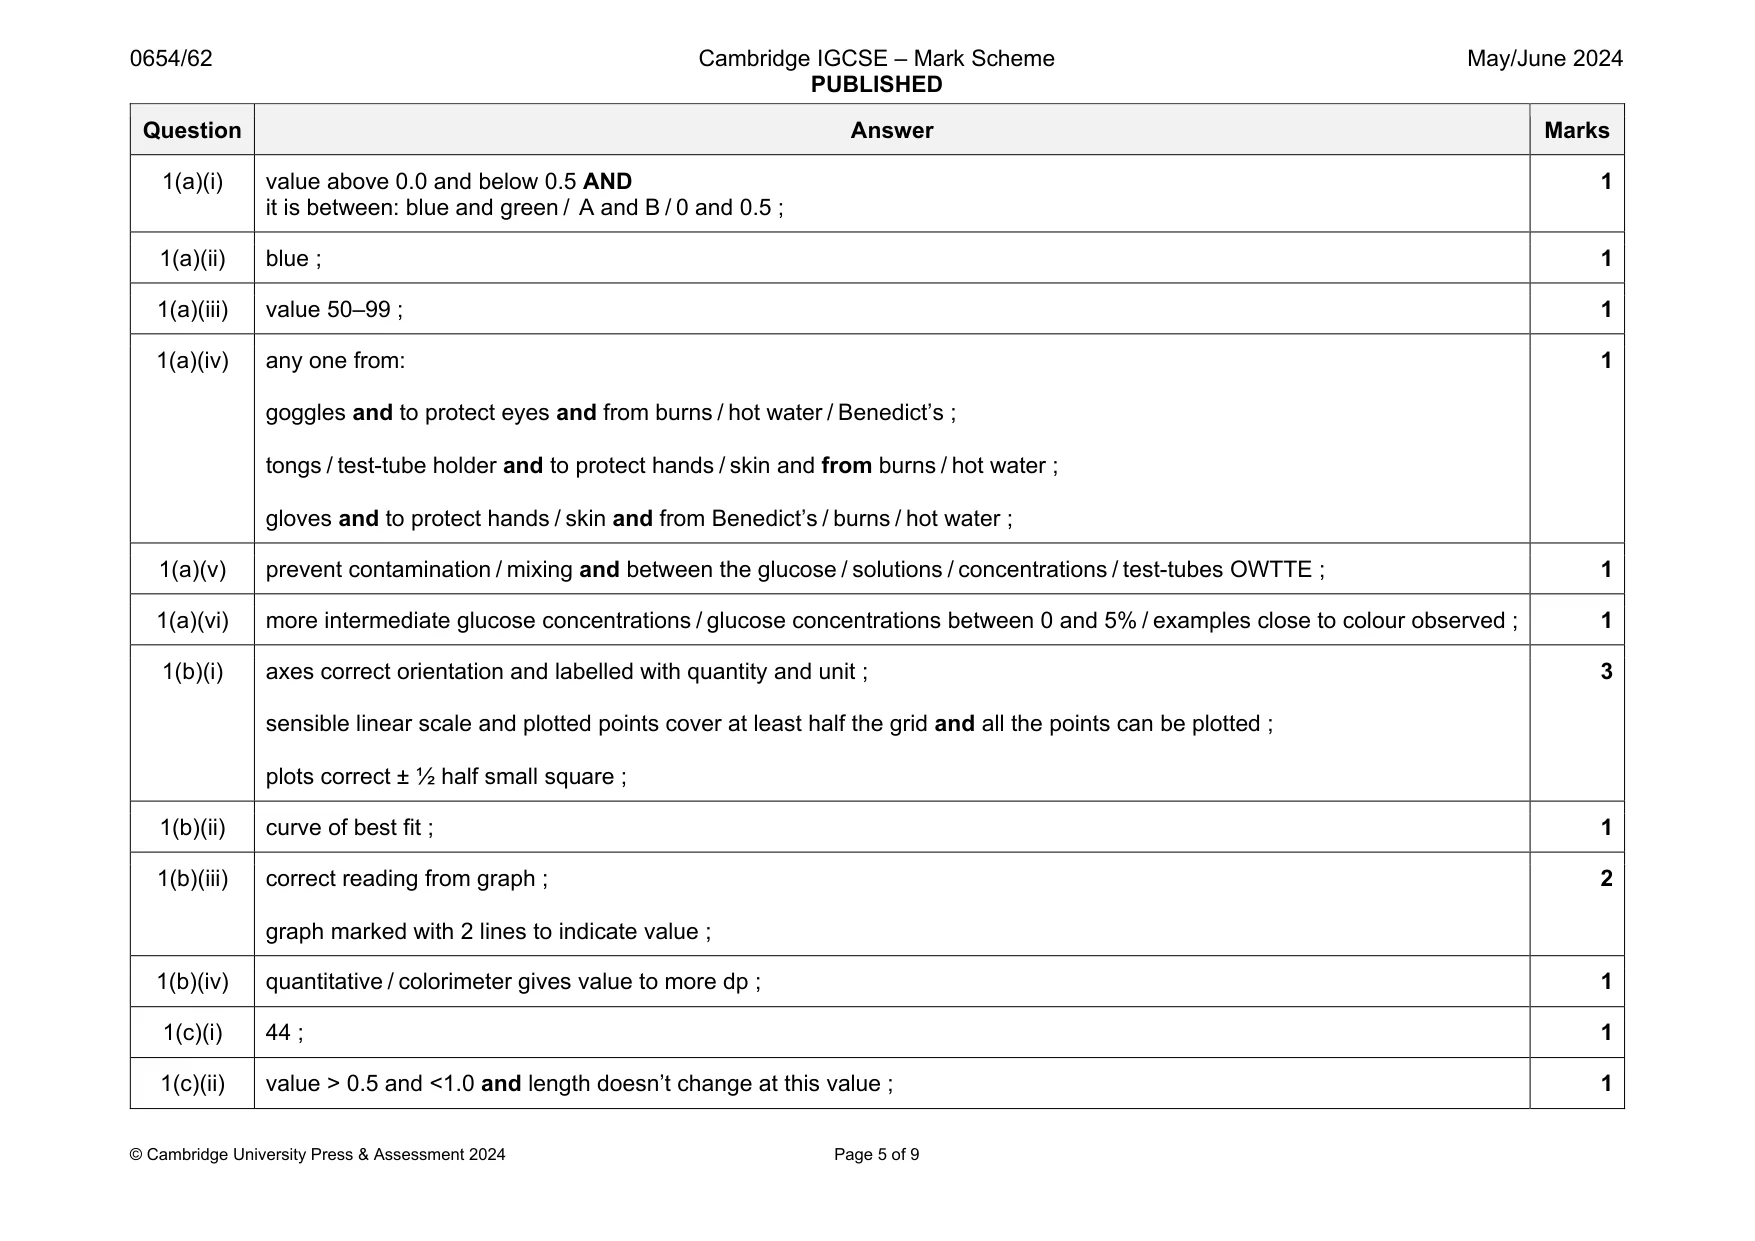
Mark scheme: 1(a)(i) value above 0.0 and below 0.5 AND it is between: blue and green / A and B / 0 and 0.5 ; 1 1(a)(ii) blue ; 1 1(a)(iii) value 50–99 ; 1 1(a)(iv) any one from: goggles and to protect eyes and from burns / hot water / Benedict’s ; tongs / test-tube holder and to protect hands / skin and from burns / hot water ; gloves and to protect hands / skin and from Benedict’s / burns / hot water ; 1 1(a)(v) prevent contamination / mixing and between the glucose / solutions / concentrations / test-tubes OWTTE ; 1 1(a)(vi) more intermediate glucose concentrations / glucose concentrations between 0 and 5% / examples close to colour observed ; 1 1(b)(i) axes correct orientation and labelled with quantity and unit ; sensible linear scale and plotted points cover at least half the grid and all the points can be plotted ; plots correct ± ½ half small square ; 3 1(b)(ii) curve of best fit ; 1 1(b)(iii) correct reading from graph ; graph marked with 2 lines to indicate value ; 2 1(b)(iv) quantitative / colorimeter gives value to more dp ; 1 1(c)(i) 44 ; 1 1(c)(ii) value > 0.5 and <1.0 and length doesn’t change at this value ; 1
Q2 · A student tests solution T for the presence of two different nutrients
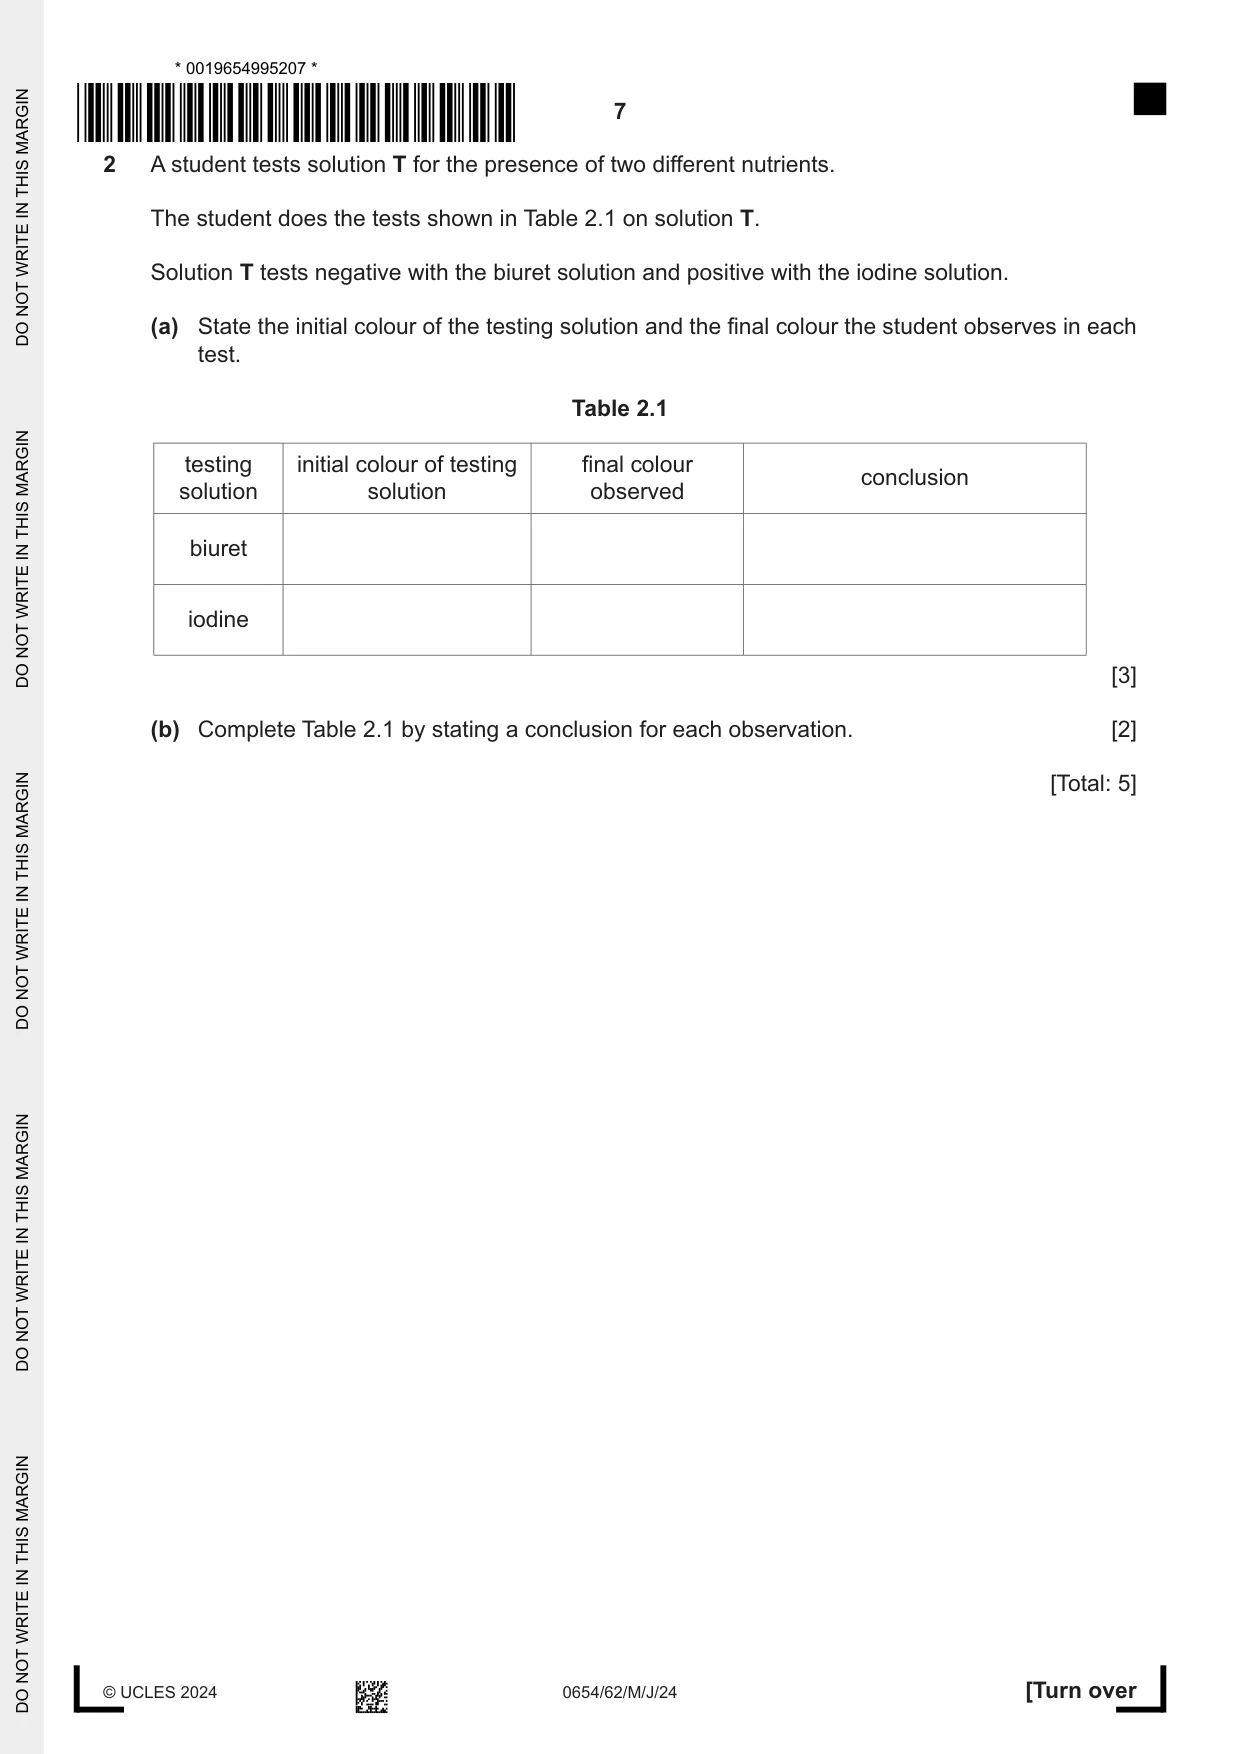
2 A student tests solution T for the presence of two different nutrients. The student does the tests shown in Table 2.1 on solution T. Solution T tests negative with the biuret solution and positive with the iodine solution. (a) State the initial colour of the testing solution and the final colour the student observes in each test. Table 2.1 testing initial colour of testing final colour conclusion solution solution observed biuret iodine [3] (b) Complete Table 2.1 by stating a conclusion for each observation. [2] [Total: 5]
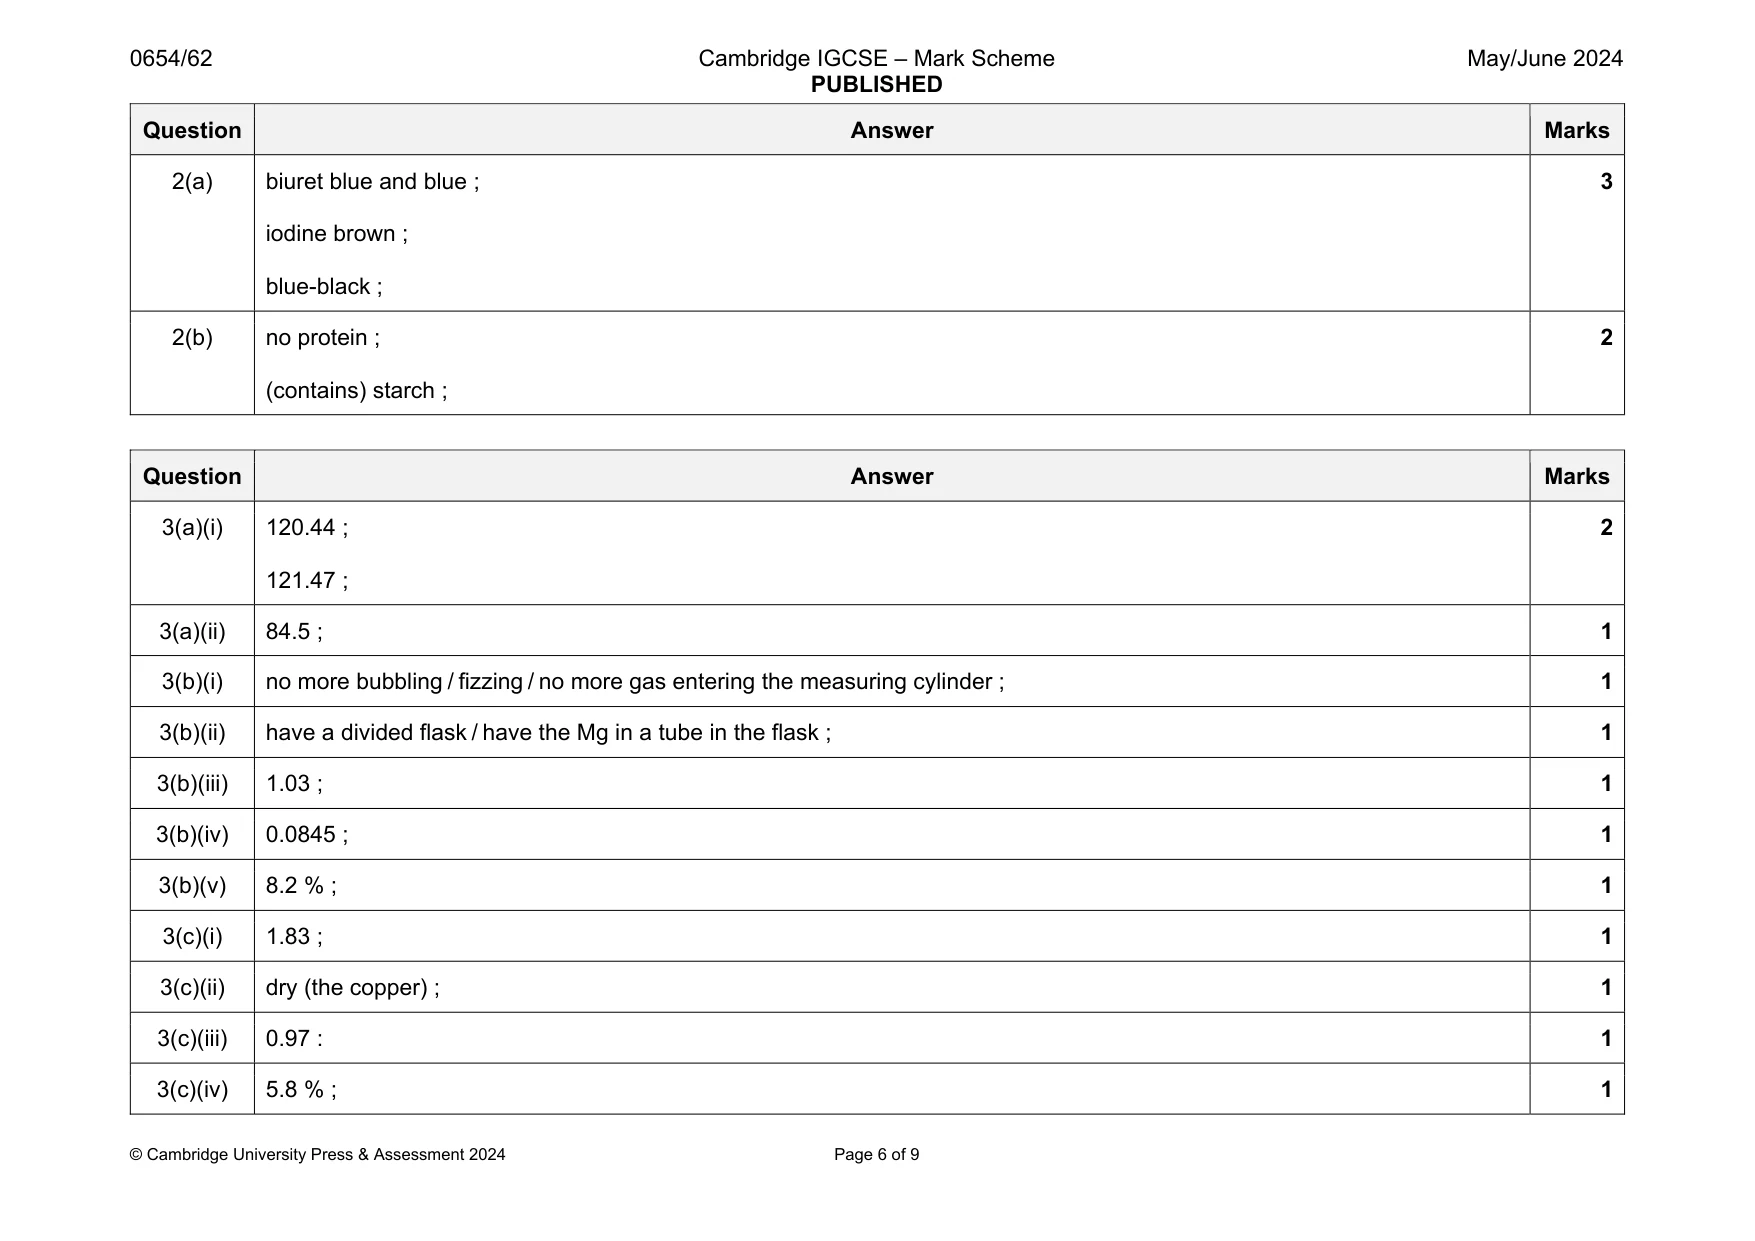
Mark scheme: 2(a) biuret blue and blue ; iodine brown ; blue-black ; 3 2(b) no protein ; (contains) starch ; 2
Q3 · A student determines the percentage by mass of magnesium in a mixture of magnesium and…
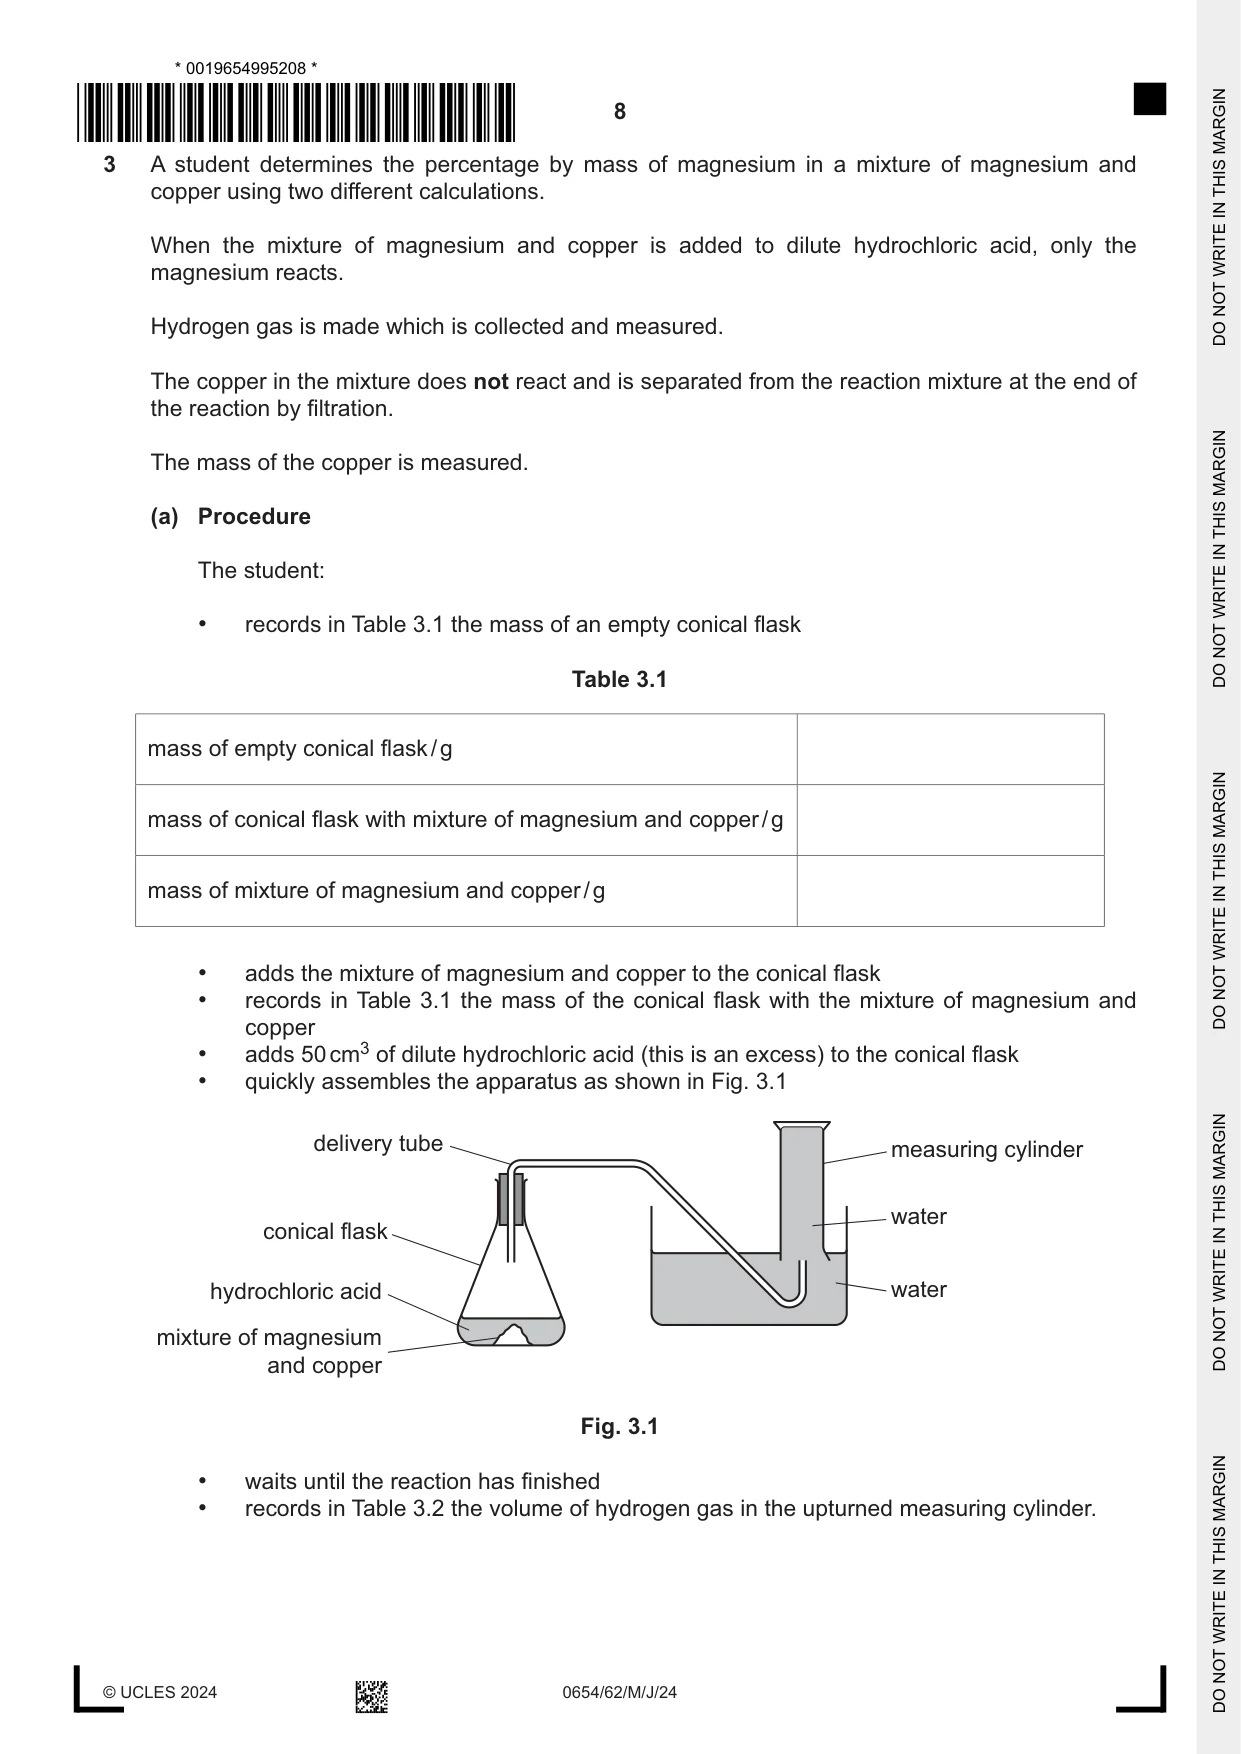
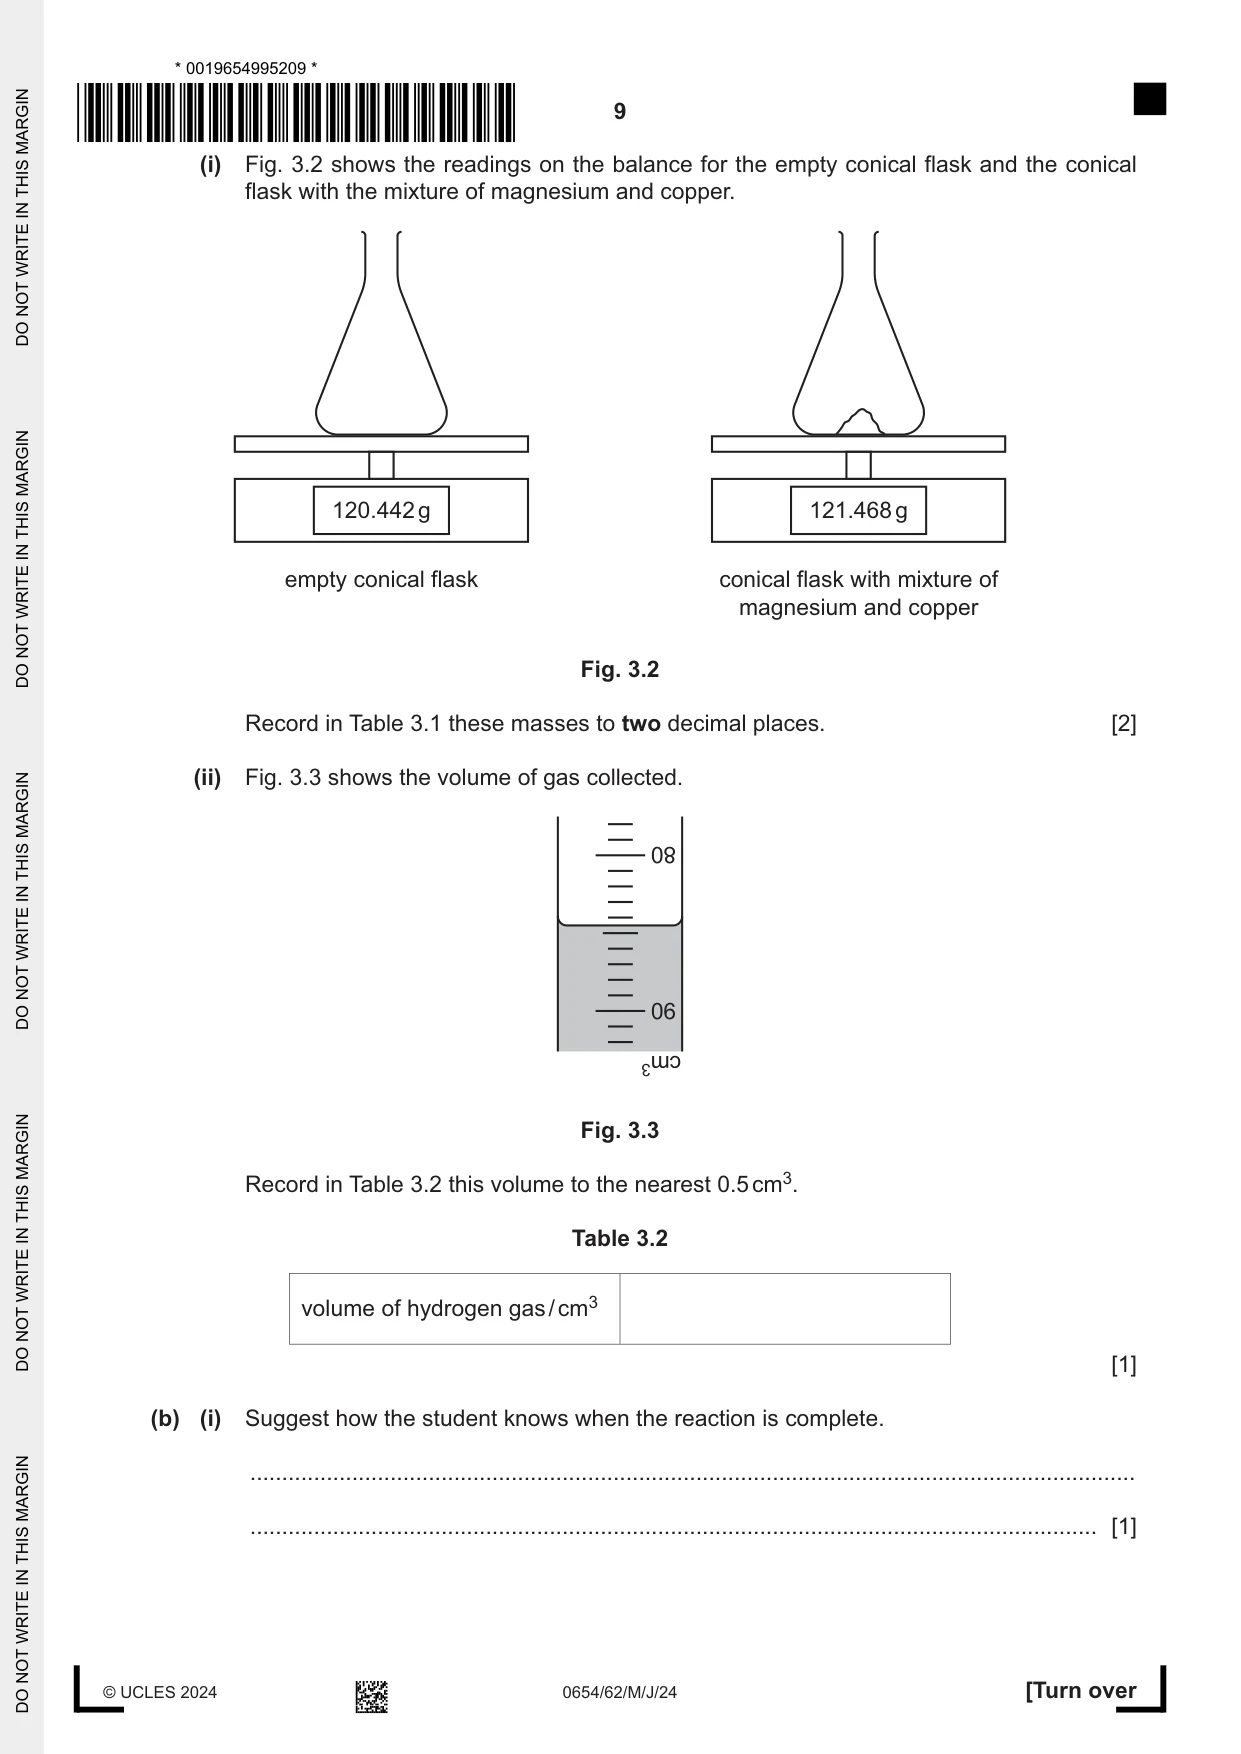
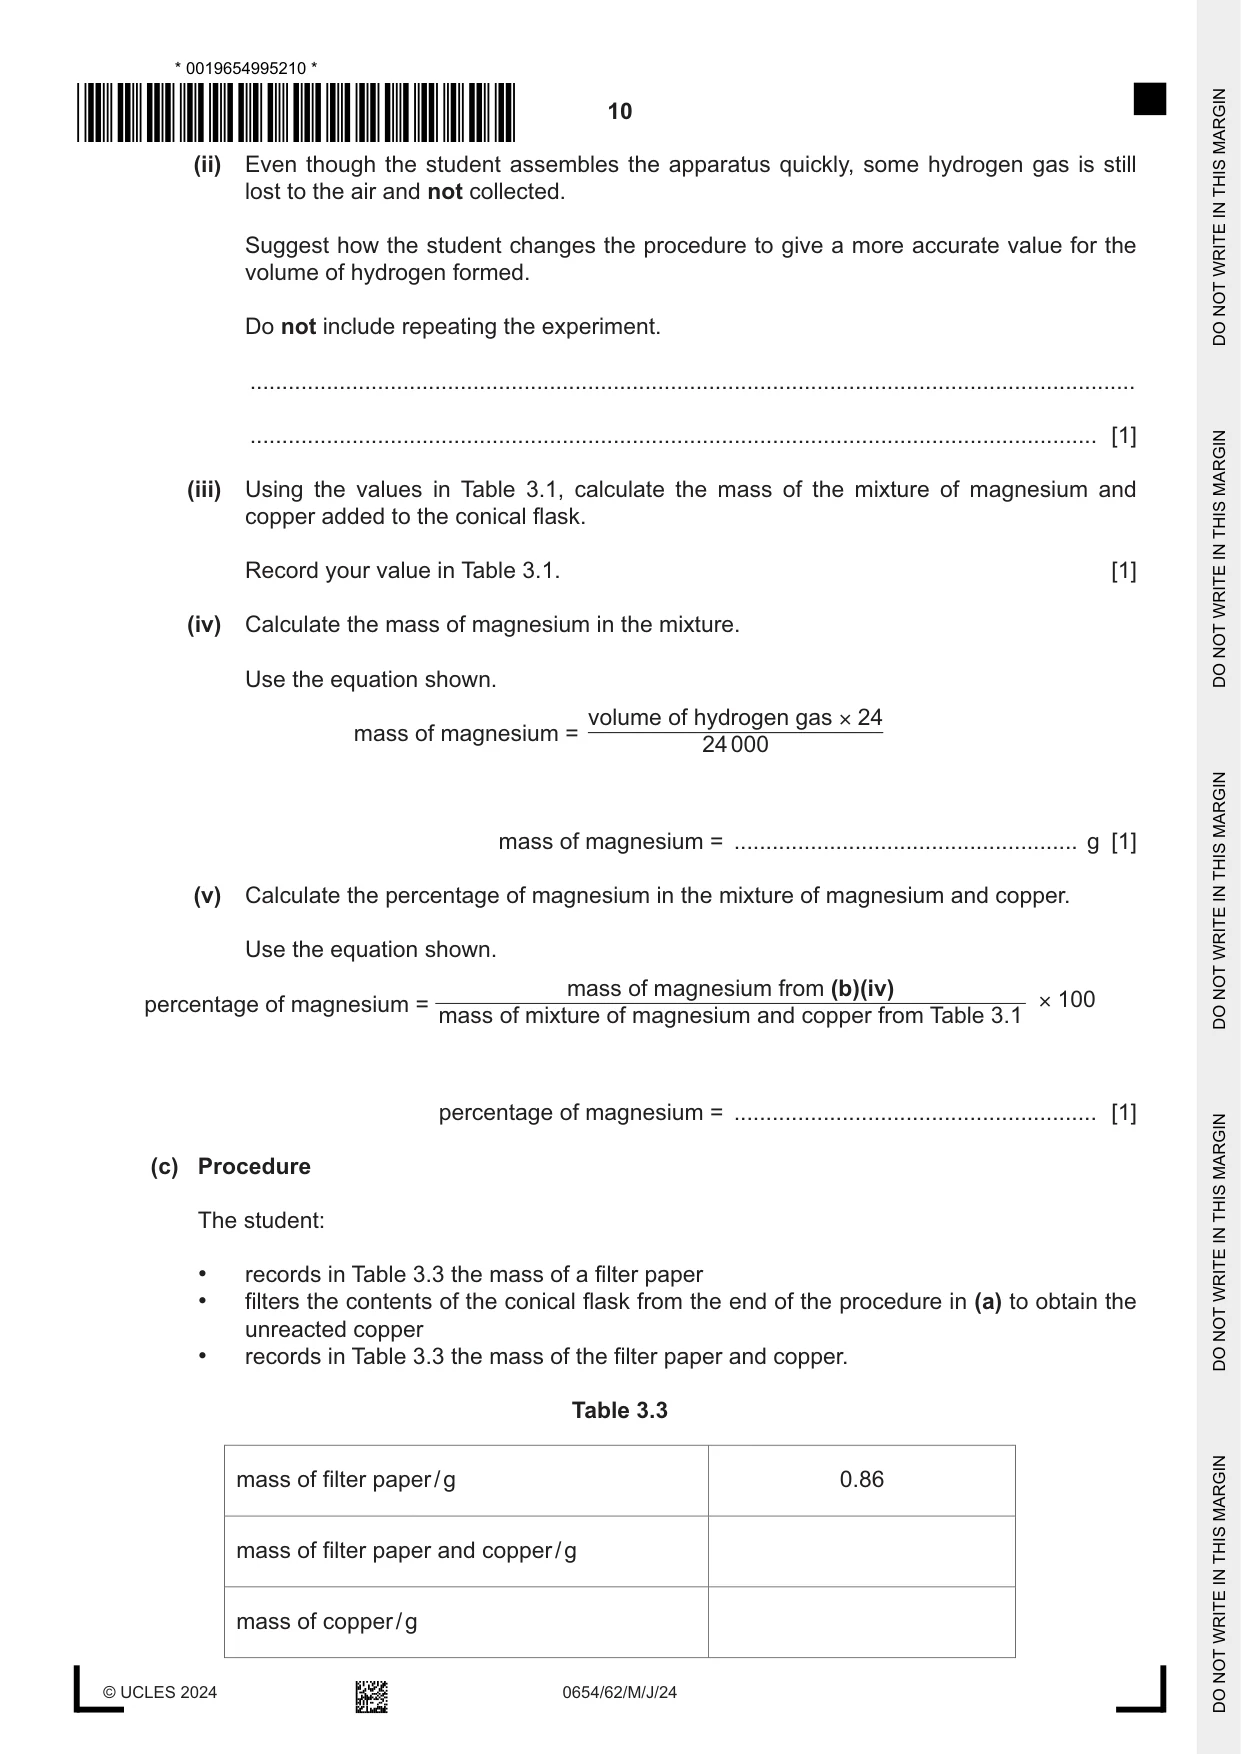
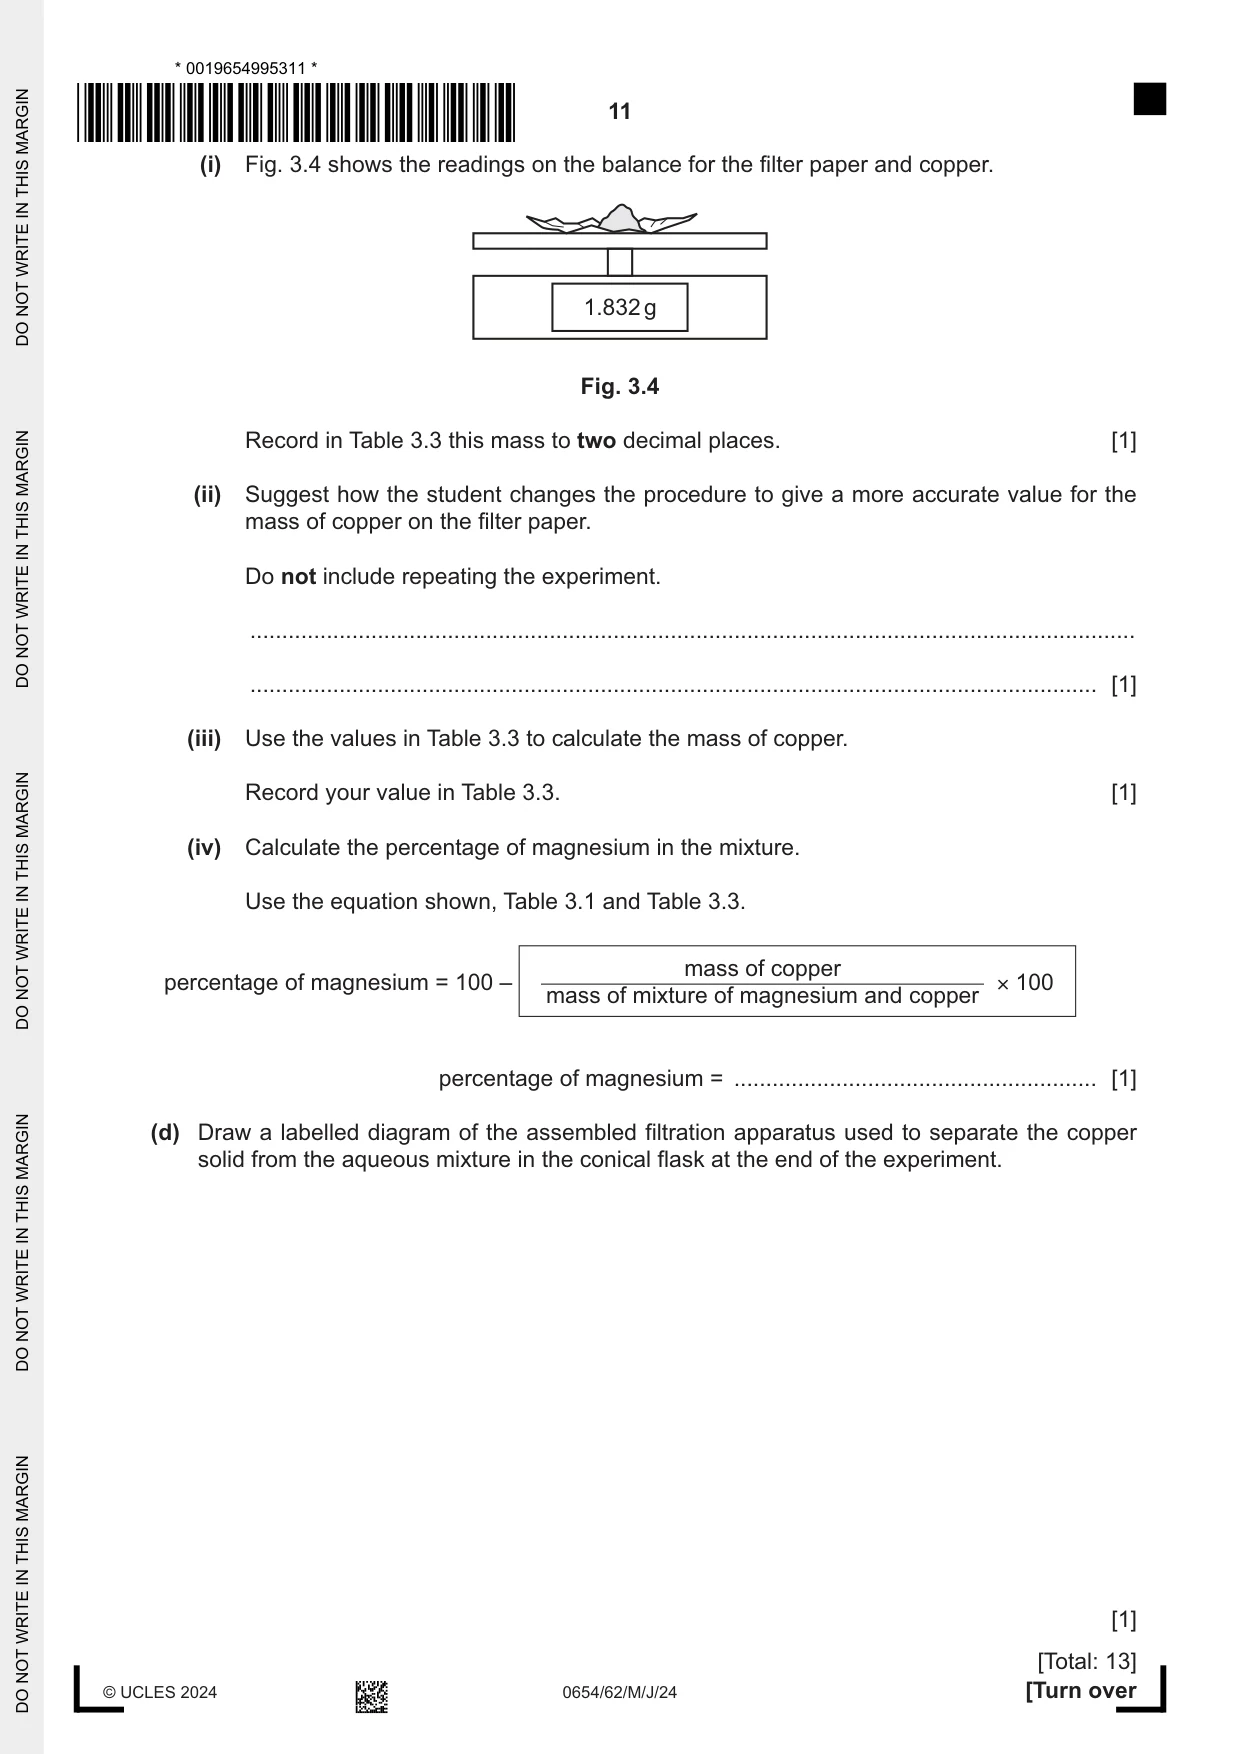
3 A student determines the percentage by mass of magnesium in a mixture of magnesium and copper using two different calculations. When the mixture of magnesium and copper is added to dilute hydrochloric acid, only the magnesium reacts. Hydrogen gas is made which is collected and measured. The copper in the mixture does not react and is separated from the reaction mixture at the end of the reaction by filtration. The mass of the copper is measured. (a) Procedure The student: • records in Table 3.1 the mass of an empty conical flask Table 3.1 mass of empty conical flask / g mass of conical flask with mixture of magnesium and copper / g mass of mixture of magnesium and copper / g • adds the mixture of magnesium and copper to the conical flask • records in Table 3.1 the mass of the conical flask with the mixture of magnesium and copper • adds 50 cm3 of dilute hydrochloric acid (this is an excess) to the conical flask • quickly assembles the apparatus as shown in Fig. 3.1 delivery tube measuring cylinder water conical flask hydrochloric acid water mixture of magnesium and copper Fig. 3.1 • waits until the reaction has finished • records in Table 3.2 the volume of hydrogen gas in the upturned measuring cylinder. (i) Fig. 3.2 shows the readings on the balance for the empty conical flask and the conical flask with the mixture of magnesium and copper. 120.442 g 121.468 g empty conical flask conical flask with mixture of magnesium and copper Fig. 3.2 Record in Table 3.1 these masses to two decimal places. [2] (ii) Fig. 3.3 shows the volume of gas collected. 80 90 cm3 Fig. 3.3 Record in Table 3.2 this volume to the nearest 0.5 cm3. Table 3.2 volume of hydrogen gas / cm3 [1] (b) (i) Suggest how the student knows when the reaction is complete. ........................................................................................................................................... ..................................................................................................................................... [1] (ii) Even though the student assembles the apparatus quickly, some hydrogen gas is still lost to the air and not collected. Suggest how the student changes the procedure to give a more accurate value for the volume of hydrogen formed. Do not include repeating the experiment. ........................................................................................................................................... ..................................................................................................................................... [1] (iii) Using the values in Table 3.1, calculate the mass of the mixture of magnesium and copper added to the conical flask. Record your value in Table 3.1. [1] (iv) Calculate the mass of magnesium in the mixture. Use the equation shown. volume of hydrogen gas × 24 mass of magnesium = 24 000 mass of magnesium = ...................................................... g [1] (v) Calculate the percentage of magnesium in the mixture of magnesium and copper. Use the equation shown. mass of magnesium from (b)(iv) percentage of magnesium = × 100 mass of mixture of magnesium and copper from Table 3.1 percentage of magnesium = ......................................................... [1] (c) Procedure The student: • records in Table 3.3 the mass of a filter paper • filters the contents of the conical flask from the end of the procedure in (a) to obtain the unreacted copper • records in Table 3.3 the mass of the filter paper and copper. Table 3.3 mass of filter paper / g 0.86 mass of filter paper and copper / g mass of copper / g (i) Fig. 3.4 shows the readings on the balance for the filter paper and copper. 1.832 g Fig. 3.4 Record in Table 3.3 this mass to two decimal places. [1] (ii) Suggest how the student changes the procedure to give a more accurate value for the mass of copper on the filter paper. Do not include repeating the experiment. ........................................................................................................................................... ..................................................................................................................................... [1] (iii) Use the values in Table 3.3 to calculate the mass of copper. Record your value in Table 3.3. [1] (iv) Calculate the percentage of magnesium in the mixture. Use the equation shown, Table 3.1 and Table 3.3. mass of copper percentage of magnesium = 100 – × 100 mass of mixture of magnesium and copper percentage of magnesium = ......................................................... [1] (d) Draw a labelled diagram of the assembled filtration apparatus used to separate the copper solid from the aqueous mixture in the conical flask at the end of the experiment. [1] [Total: 13]
Mark scheme: 3(a)(i) 120.44 ; 121.47 ; 2 3(a)(ii) 84.5 ; 1 3(b)(i) no more bubbling / fizzing / no more gas entering the measuring cylinder ; 1 3(b)(ii) have a divided flask / have the Mg in a tube in the flask ; 1 3(b)(iii) 1.03 ; 1 3(b)(iv) 0.0845 ; 1 3(b)(v) 8.2 % ; 1 3(c)(i) 1.83 ; 1 3(c)(ii) dry (the copper) ; 1 3(c)(iii) 0.97 : 1 3(c)(iv) 5.8 % ; 1 Question Answer Marks 3(d) filter funnel and filter paper with a v AND any 2 labels ; 1
Q4 · Pure water boils at a temperature of 100 °C
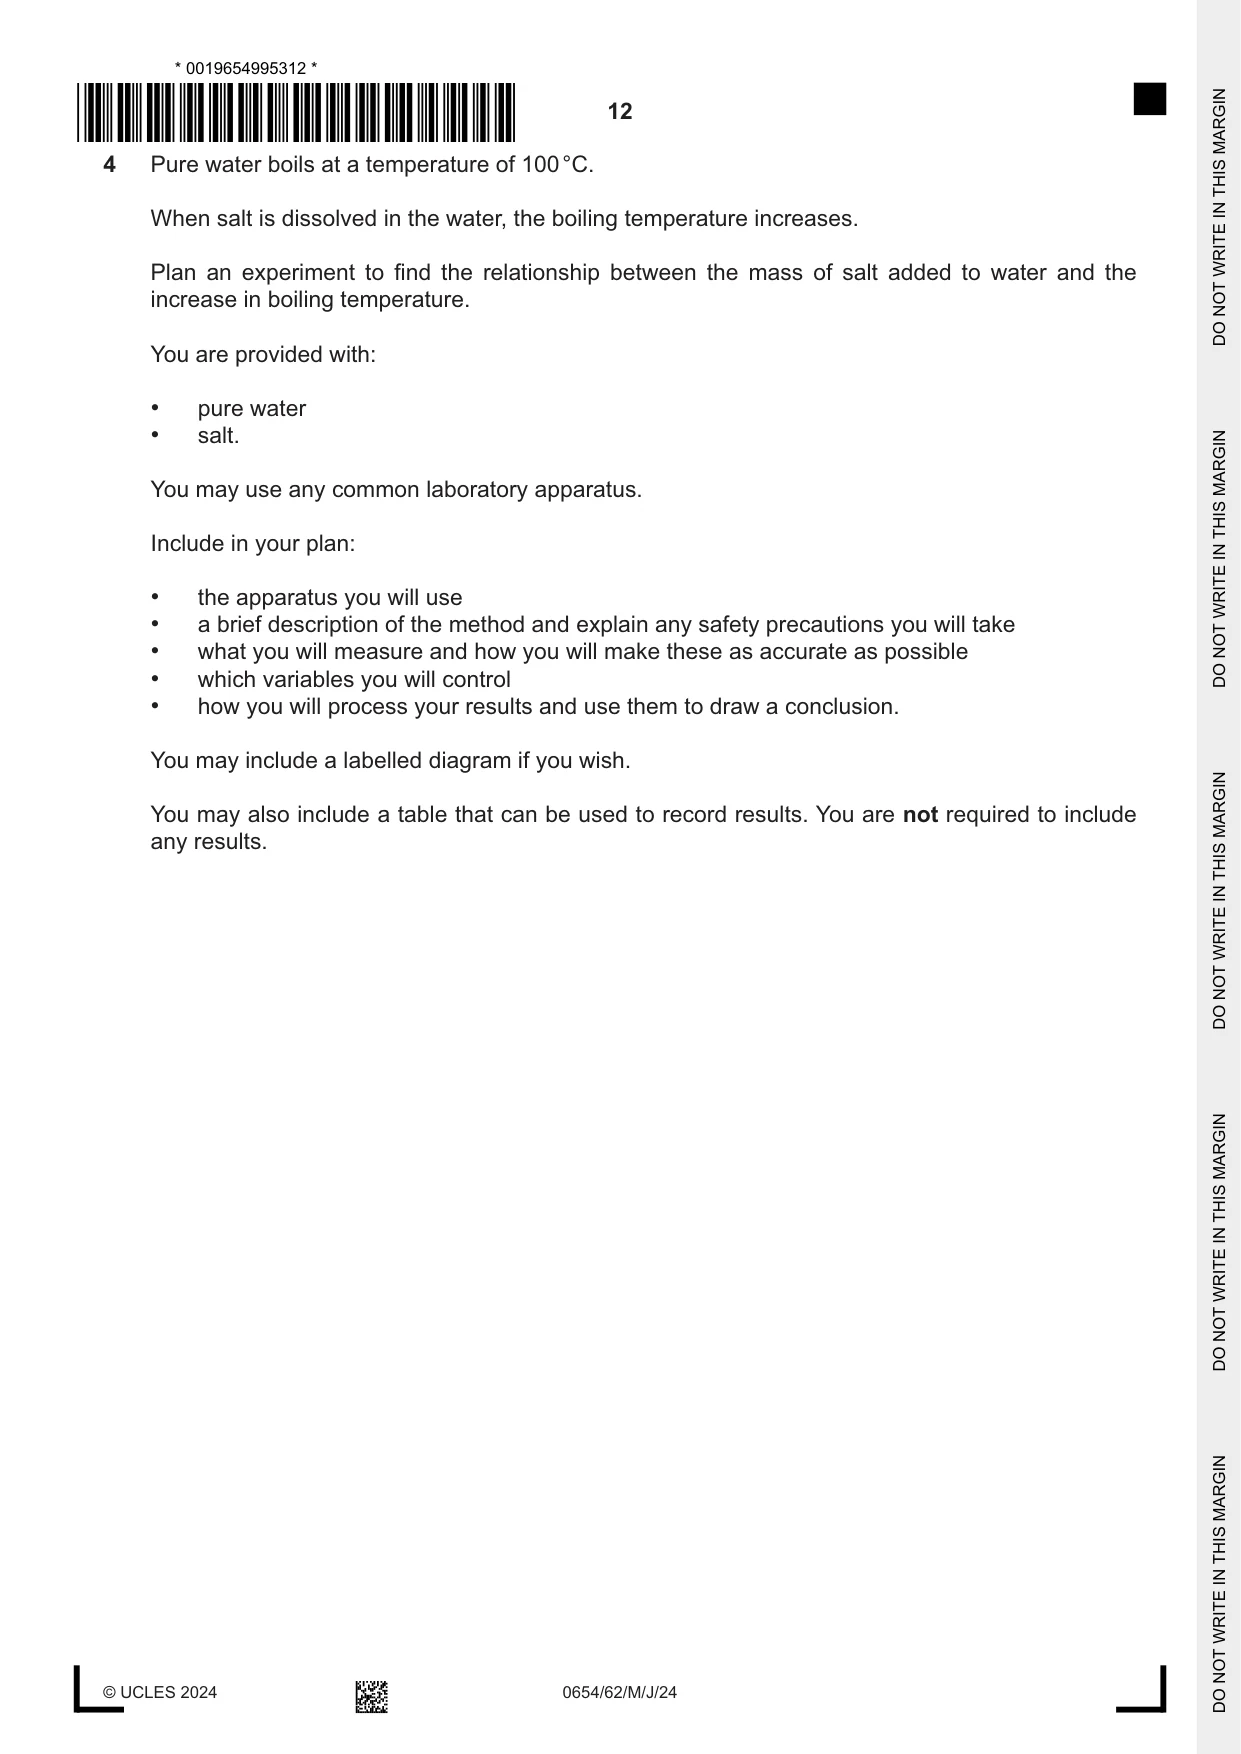
4 Pure water boils at a temperature of 100 °C. When salt is dissolved in the water, the boiling temperature increases. Plan an experiment to find the relationship between the mass of salt added to water and the increase in boiling temperature. You are provided with: • pure water • salt. You may use any common laboratory apparatus. Include in your plan: • the apparatus you will use • a brief description of the method and explain any safety precautions you will take • what you will measure and how you will make these as accurate as possible • which variables you will control • how you will process your results and use them to draw a conclusion. You may include a labelled diagram if you wish. You may also include a table that can be used to record results. You are not required to include any results. .......................................................................................................................................................... .......................................................................................................................................................... .......................................................................................................................................................... .......................................................................................................................................................... .......................................................................................................................................................... .......................................................................................................................................................... .......................................................................................................................................................... .......................................................................................................................................................... .......................................................................................................................................................... .......................................................................................................................................................... .......................................................................................................................................................... .......................................................................................................................................................... .......................................................................................................................................................... .......................................................................................................................................................... .......................................................................................................................................................... .......................................................................................................................................................... .......................................................................................................................................................... .......................................................................................................................................................... .......................................................................................................................................................... .......................................................................................................................................................... .................................................................................................................................................... [7]
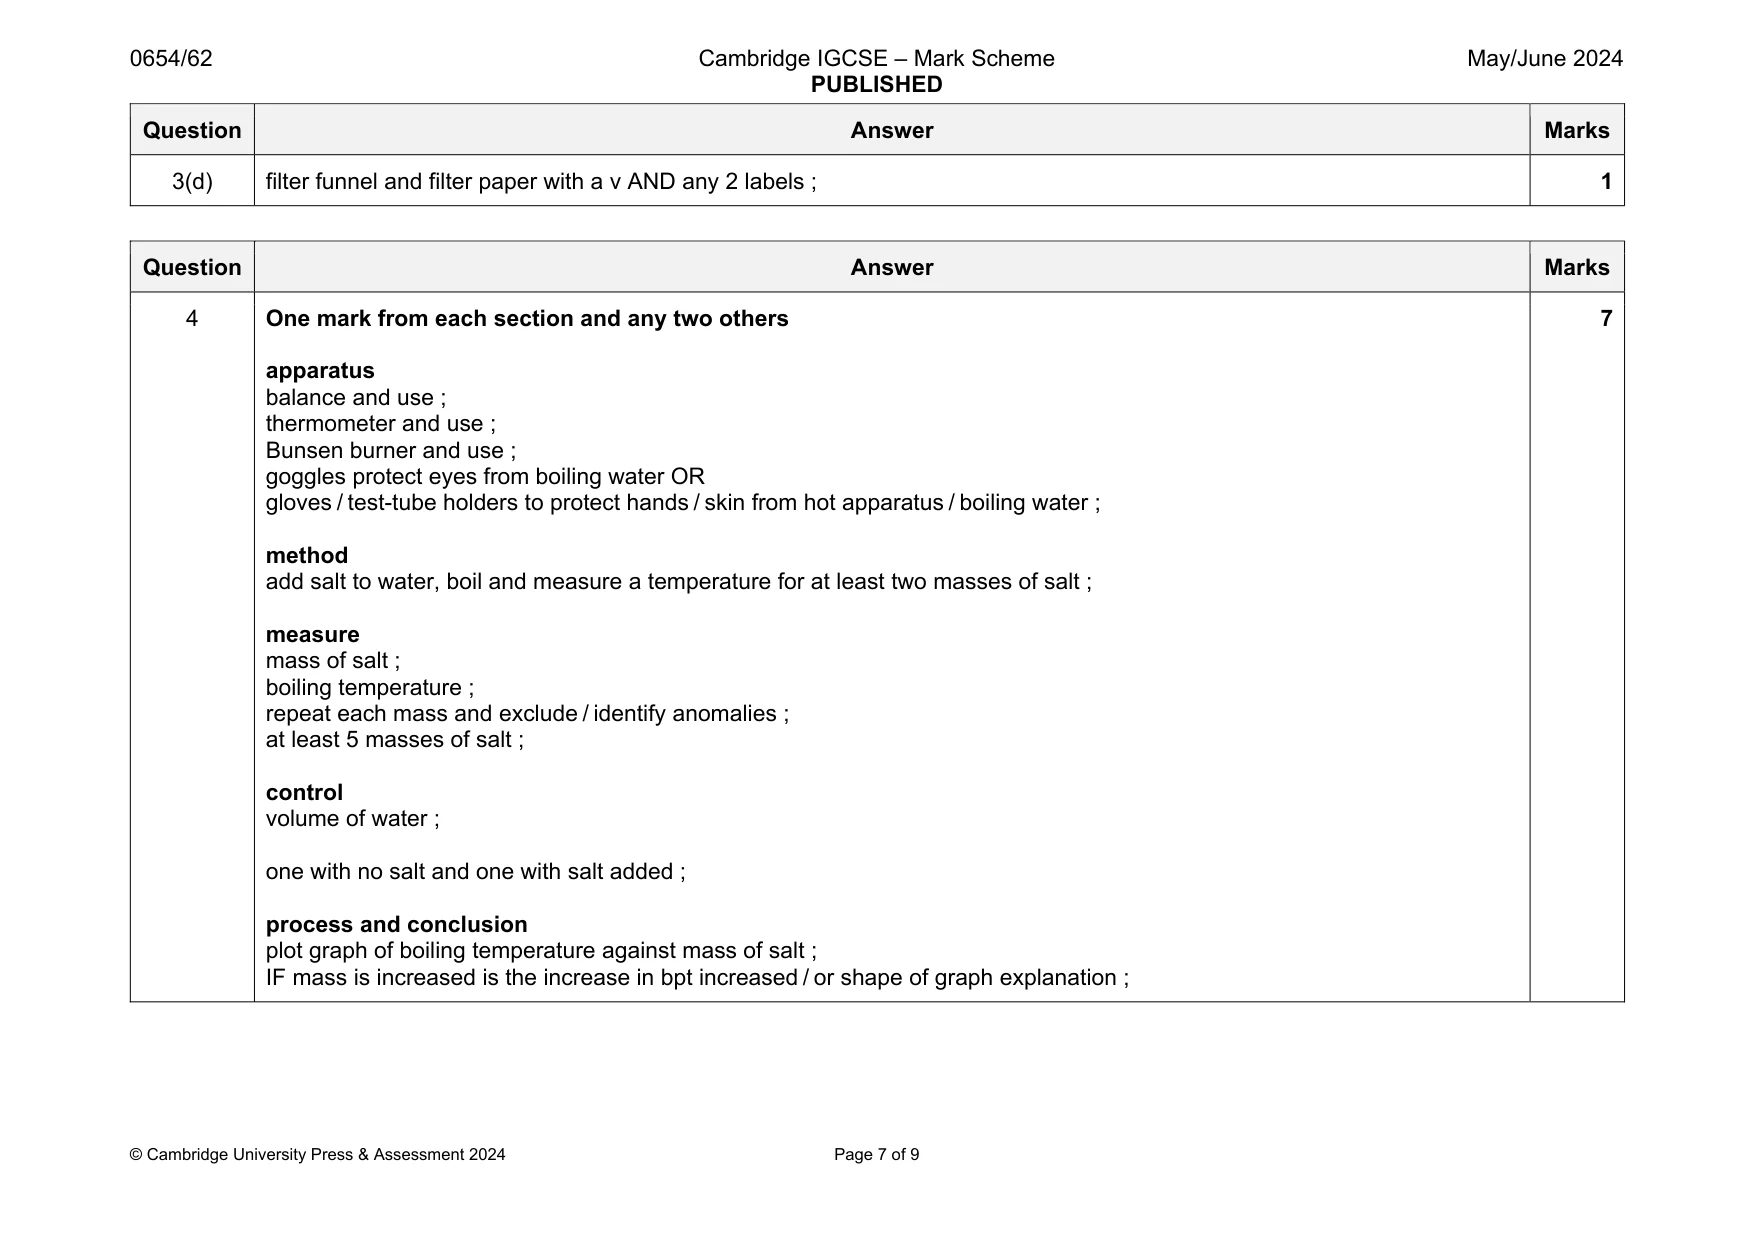
Mark scheme: 4 One mark from each section and any two others apparatus balance and use ; thermometer and use ; Bunsen burner and use ; goggles protect eyes from boiling water OR gloves / test-tube holders to protect hands / skin from hot apparatus / boiling water ; method add salt to water, boil and measure a temperature for at least two masses of salt ; measure mass of salt ; boiling temperature ; repeat each mass and exclude / identify anomalies ; at least 5 masses of salt ; control volume of water ; one with no salt and one with salt added ; process and conclusion plot graph of boiling temperature against mass of salt ; IF mass is increased is the increase in bpt increased / or shape of graph explanation ; 7
Q5 · A student determines the mass of a piece of modelling clay by two different methods
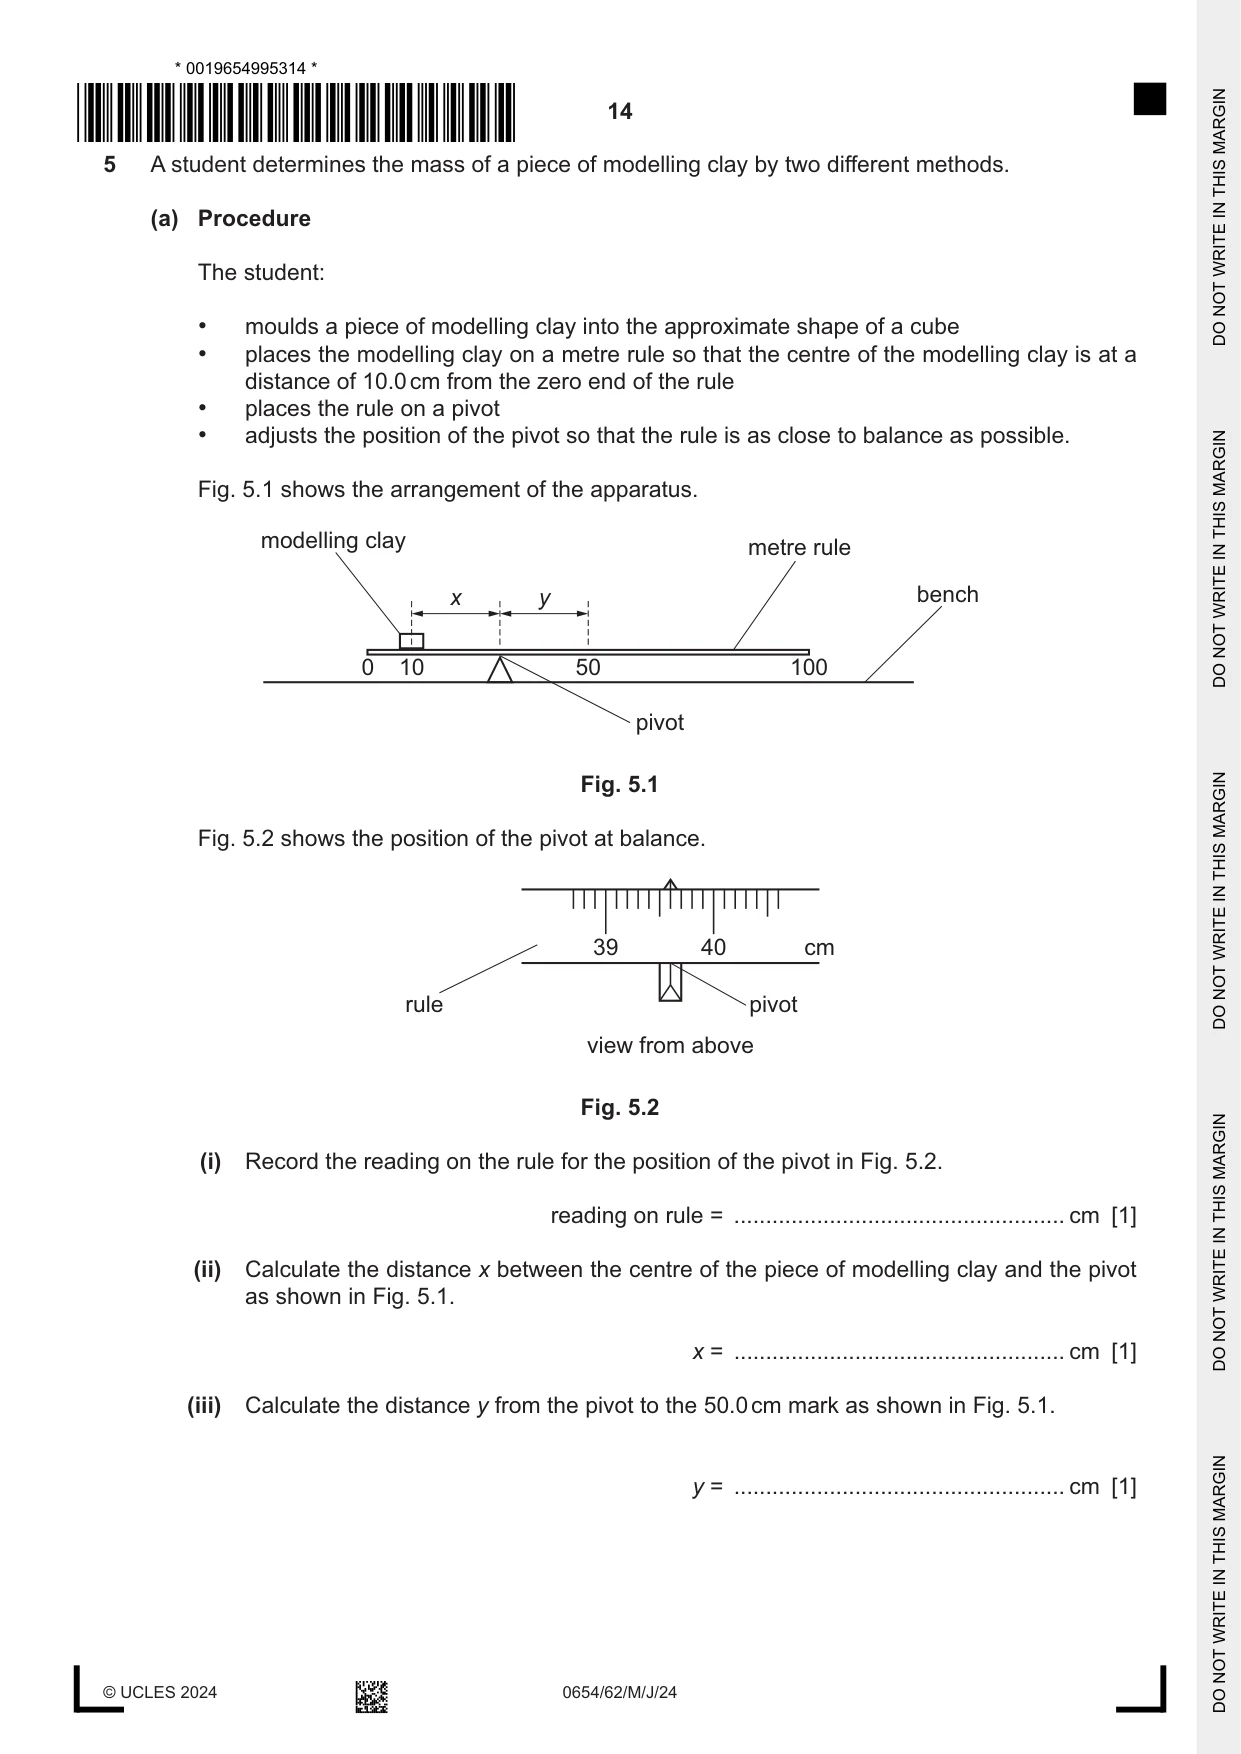
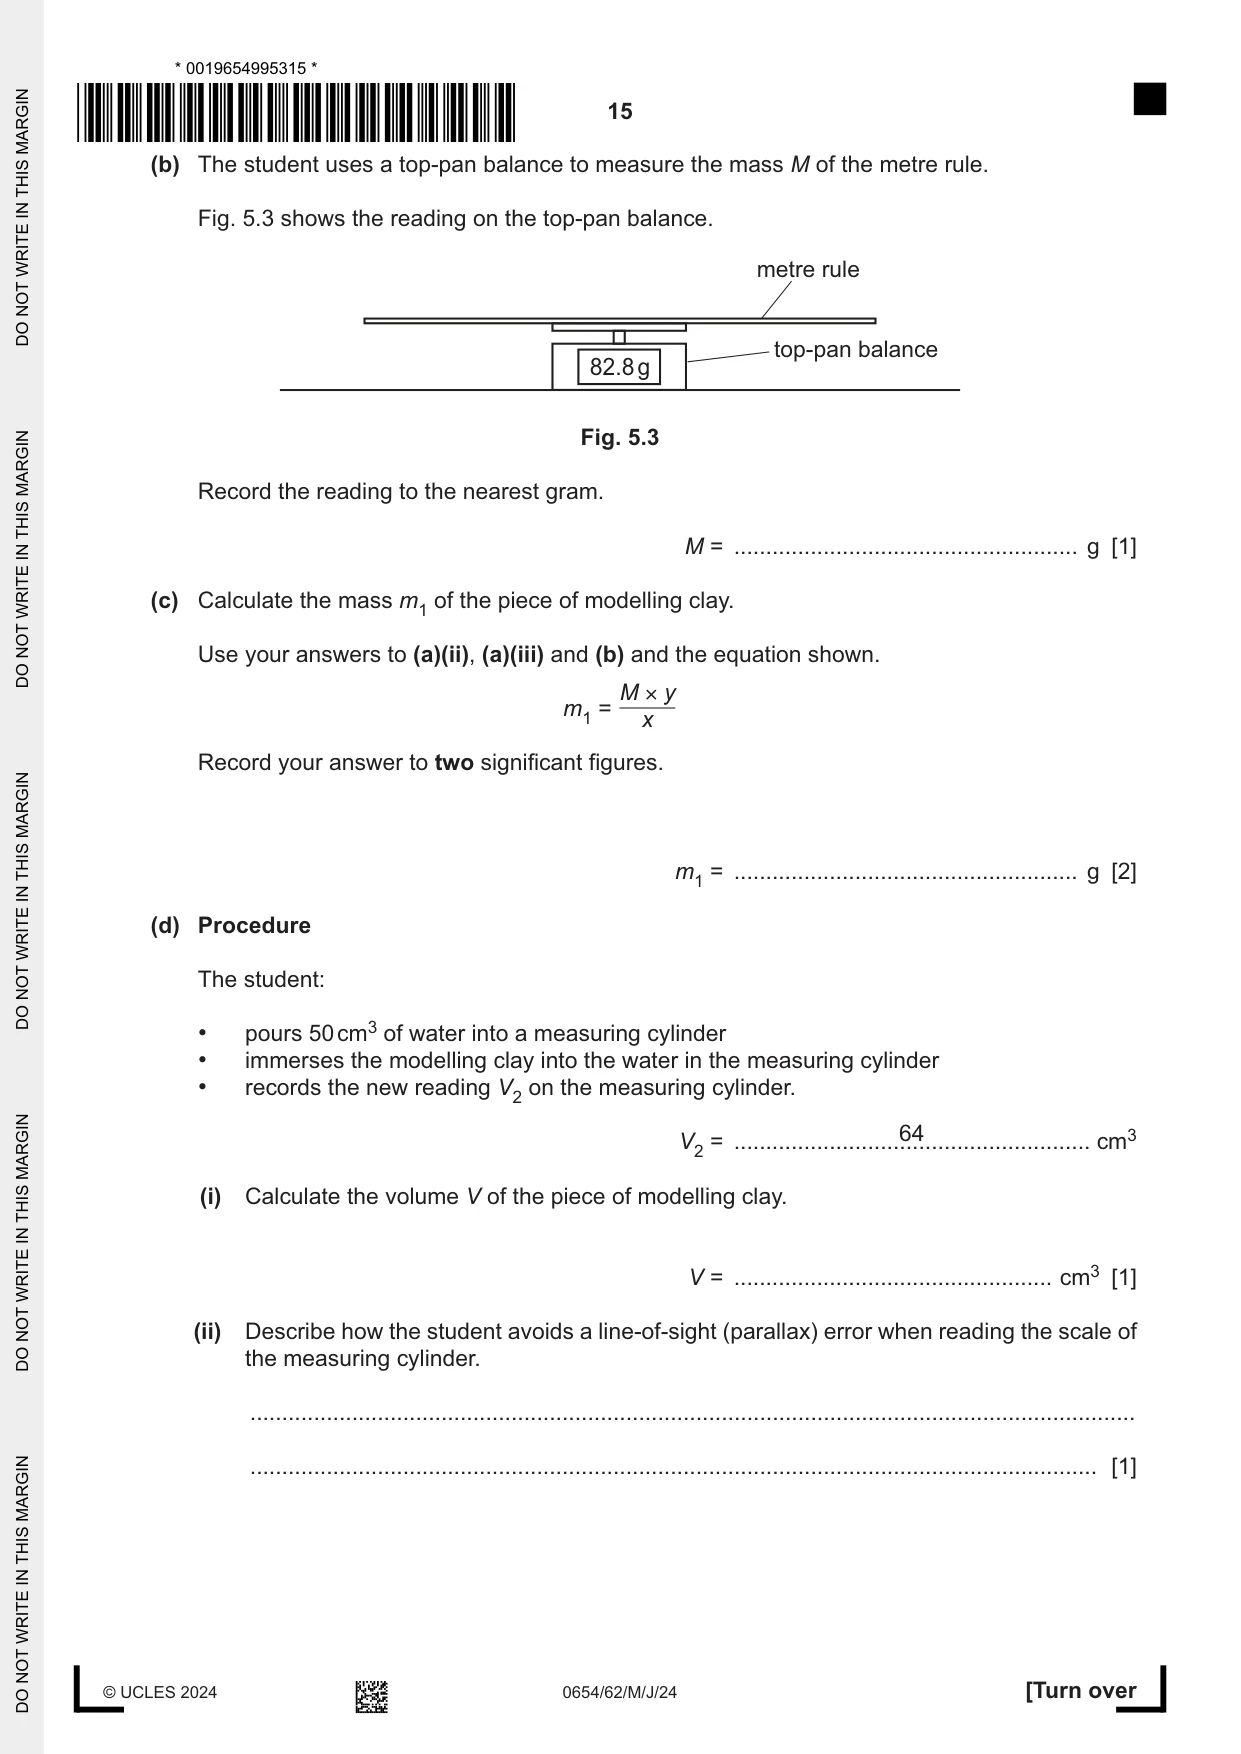
5 A student determines the mass of a piece of modelling clay by two different methods. (a) Procedure The student: • moulds a piece of modelling clay into the approximate shape of a cube • places the modelling clay on a metre rule so that the centre of the modelling clay is at a distance of 10.0 cm from the zero end of the rule • places the rule on a pivot • adjusts the position of the pivot so that the rule is as close to balance as possible. Fig. 5.1 shows the arrangement of the apparatus. modelling clay metre rule x y bench 0 10 50 100 pivot Fig. 5.1 Fig. 5.2 shows the position of the pivot at balance. 39 40 cm rule pivot view from above Fig. 5.2 (i) Record the reading on the rule for the position of the pivot in Fig. 5.2. reading on rule = .................................................... cm [1] (ii) Calculate the distance x between the centre of the piece of modelling clay and the pivot as shown in Fig. 5.1. x = .................................................... cm [1] (iii) Calculate the distance y from the pivot to the 50.0 cm mark as shown in Fig. 5.1. y = .................................................... cm [1] (b) The student uses a top-pan balance to measure the mass M of the metre rule. Fig. 5.3 shows the reading on the top-pan balance. metre rule top-pan balance 82.8 g Fig. 5.3 Record the reading to the nearest gram. M = ...................................................... g [1] (c) Calculate the mass m1 of the piece of modelling clay. Use your answers to (a)(ii), (a)(iii) and (b) and the equation shown. M × y m1 = x Record your answer to two significant figures. m1 = ...................................................... g [2] (d) Procedure The student: • pours 50 cm3 of water into a measuring cylinder • immerses the modelling clay into the water in the measuring cylinder • records the new reading V2 on the measuring cylinder. 64 V2 = ........................................................ cm3 (i) Calculate the volume V of the piece of modelling clay. V = .................................................. cm3 [1] (ii) Describe how the student avoids a line-of-sight (parallax) error when reading the scale of the measuring cylinder. ........................................................................................................................................... ..................................................................................................................................... [1] (e) The density ρ of the modelling clay is 1.9 g / cm3. Calculate the mass m2 of the modelling clay. Use your answer from (d)(i) and the equation shown. m2 = V × ρ m2 = ...................................................... g [1] (f) Two values are considered to be equal within the limits of experimental accuracy if they are within 10% of each other. Compare your value m1 from (c) with your value m2 from (e). State if your values for the mass of the modelling clay are equal, within the limits of experimental accuracy. Justify your statement with a calculation. statement .................................................................................................................................. justification ................................................................................................................................ ................................................................................................................................................... ................................................................................................................................................... [2] [Total: 11]
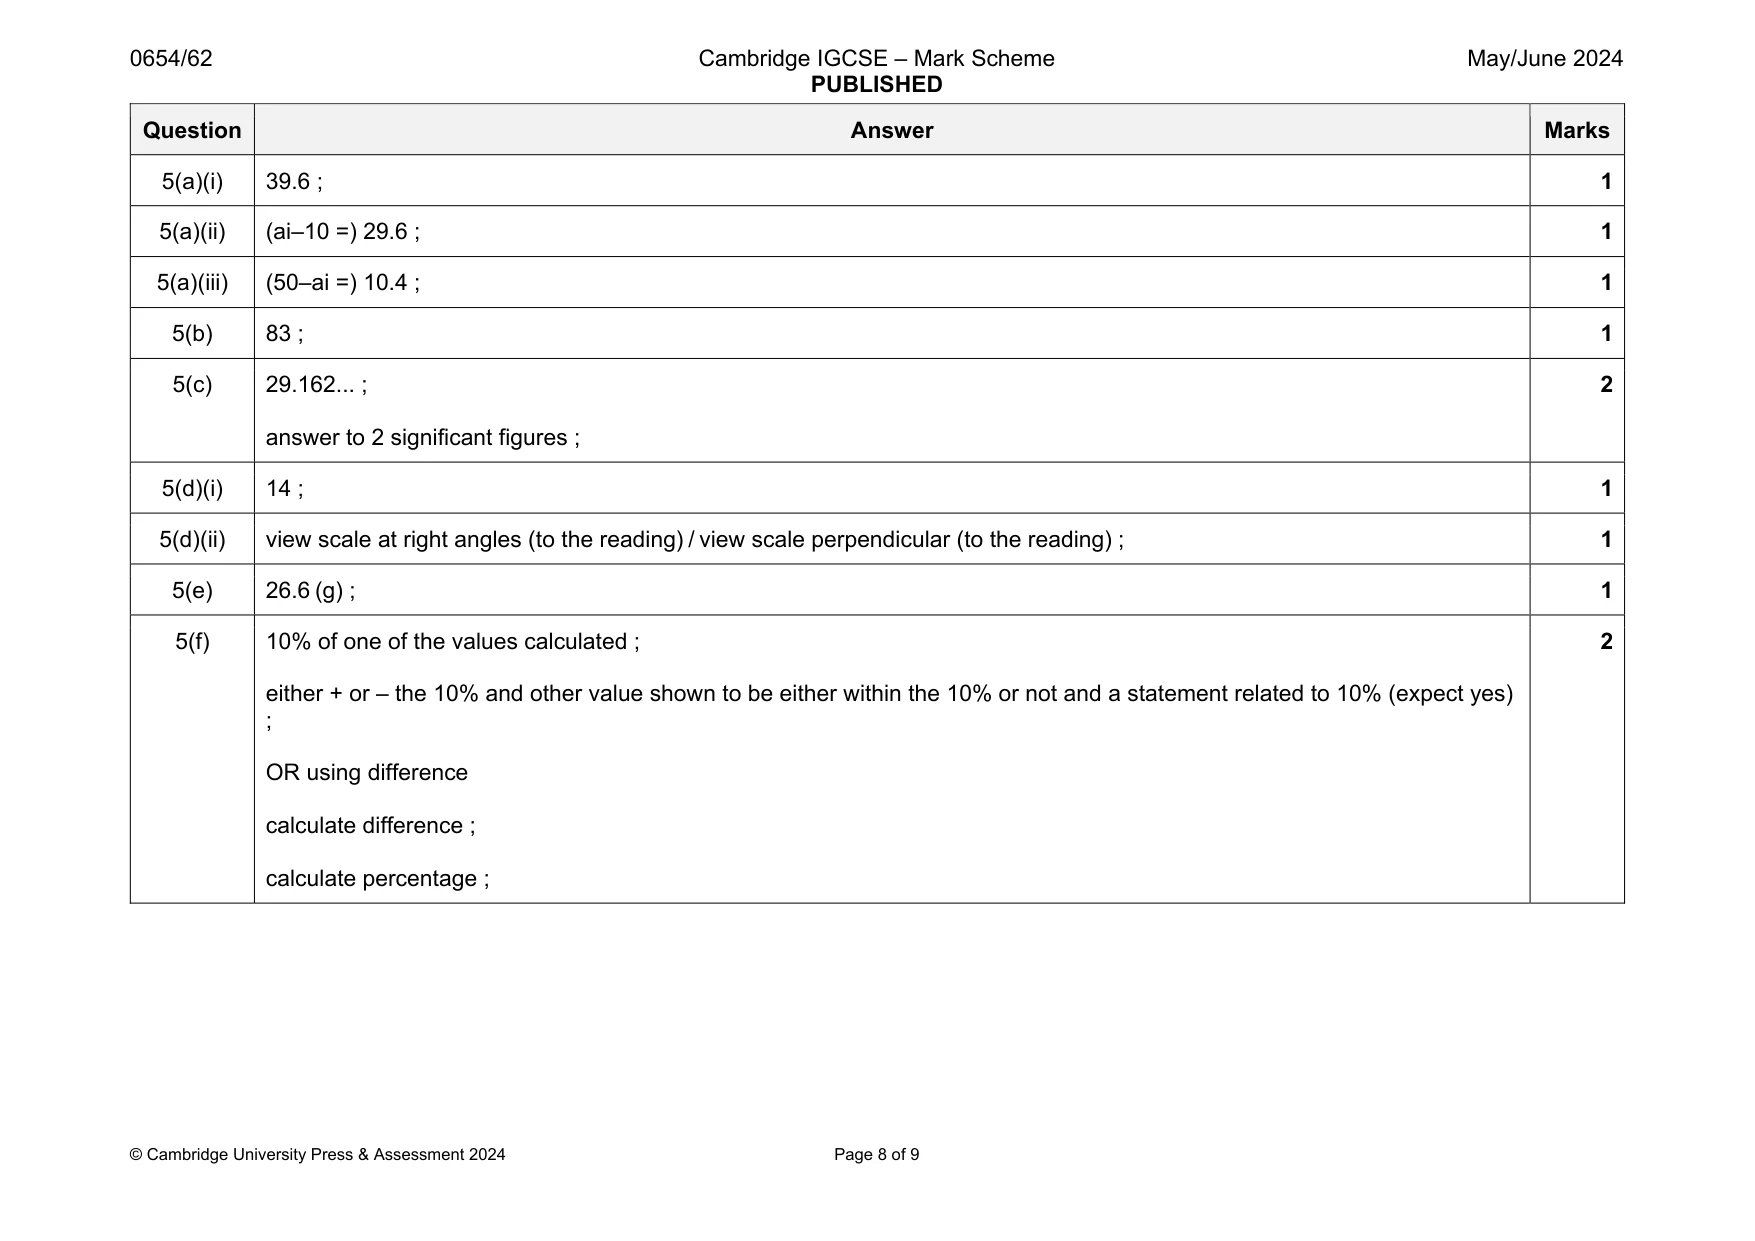
Mark scheme: 5(a)(i) 39.6 ; 1 5(a)(ii) (ai–10 =) 29.6 ; 1 5(a)(iii) (50–ai =) 10.4 ; 1 5(b) 83 ; 1 5(c) 29.162... ; answer to 2 significant figures ; 2 5(d)(i) 14 ; 1 5(d)(ii) view scale at right angles (to the reading) / view scale perpendicular (to the reading) ; 1 5(e) 26.6 (g) ; 1 5(f) 10% of one of the values calculated ; either + or – the 10% and other value shown to be either within the 10% or not and a statement related to 10% (expect yes) ; OR using difference calculate difference ; calculate percentage ; 2
More questions on Physical quantities and measurement techniques
Q6 · A student investigates the rate of cooling of hot water
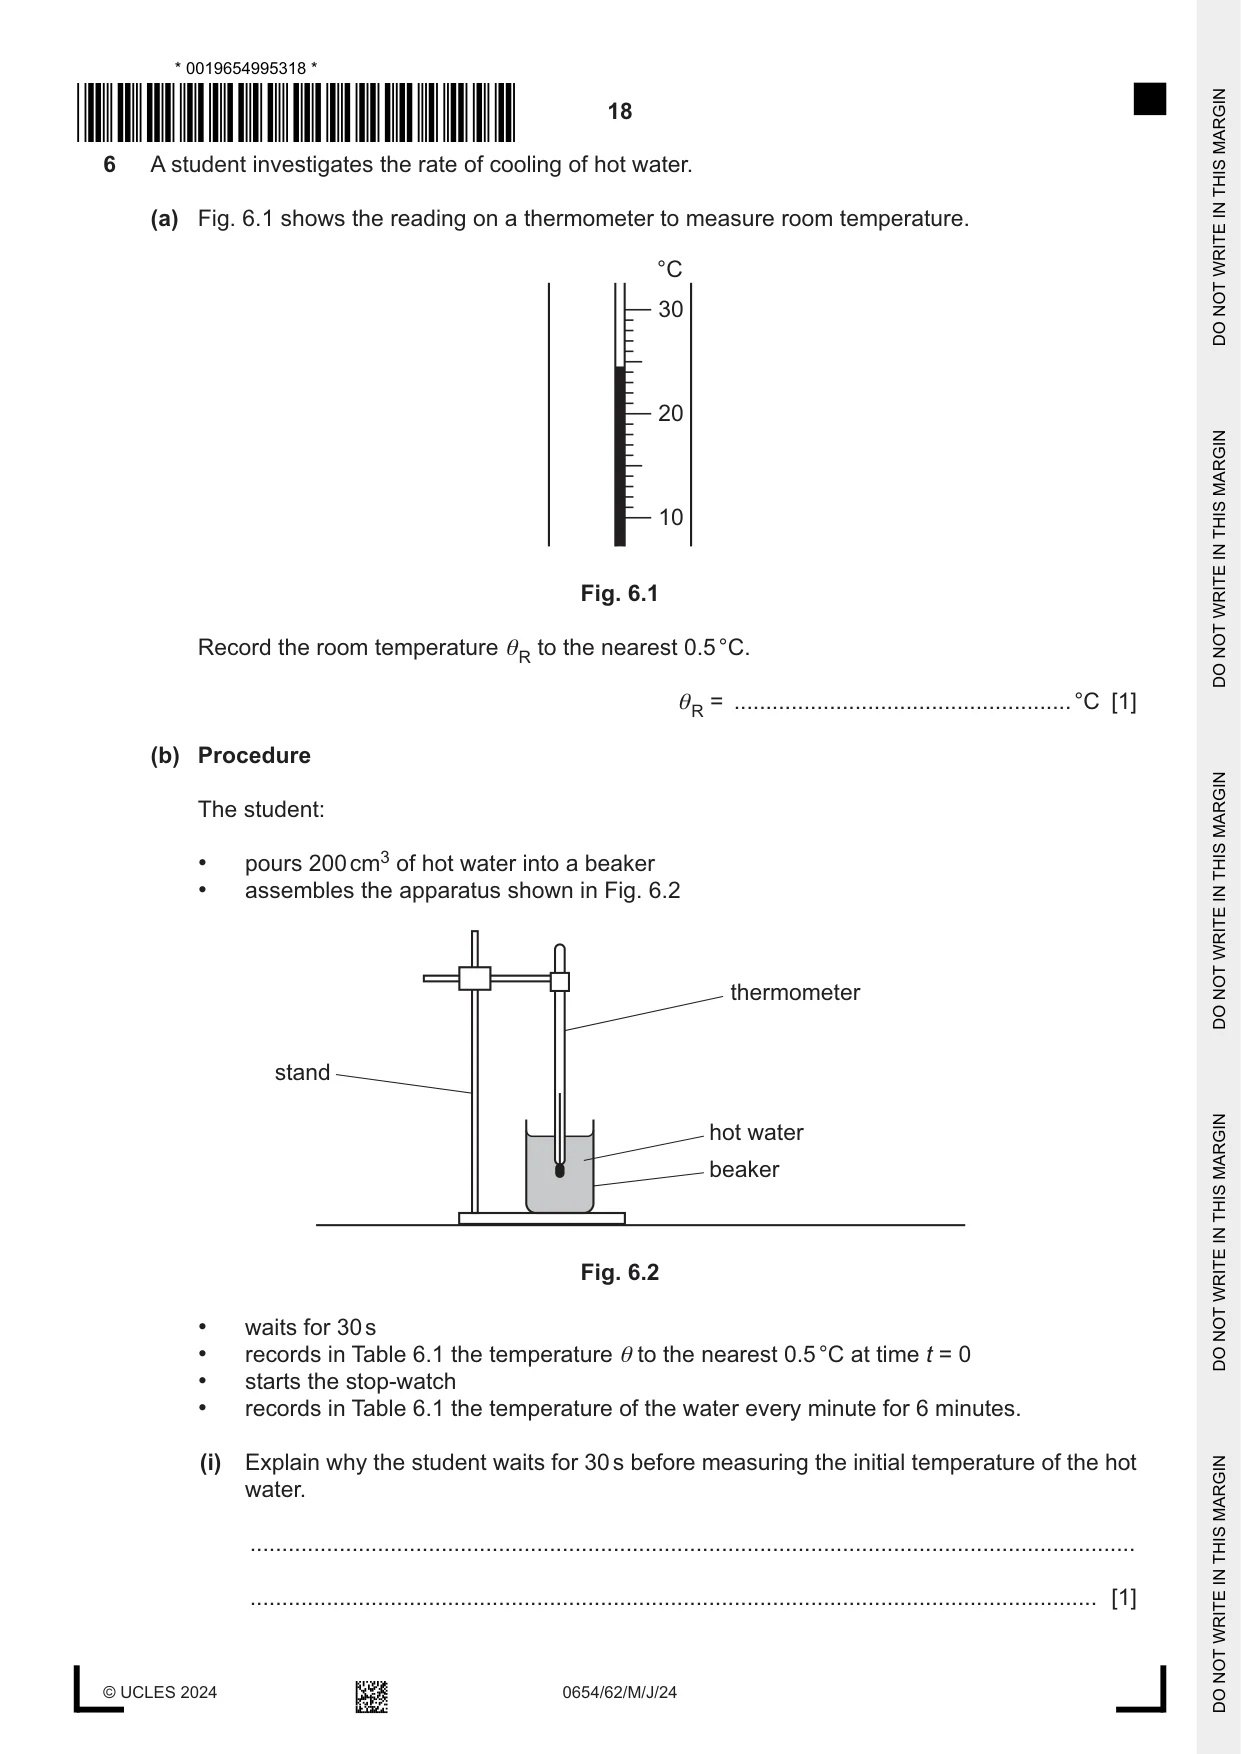
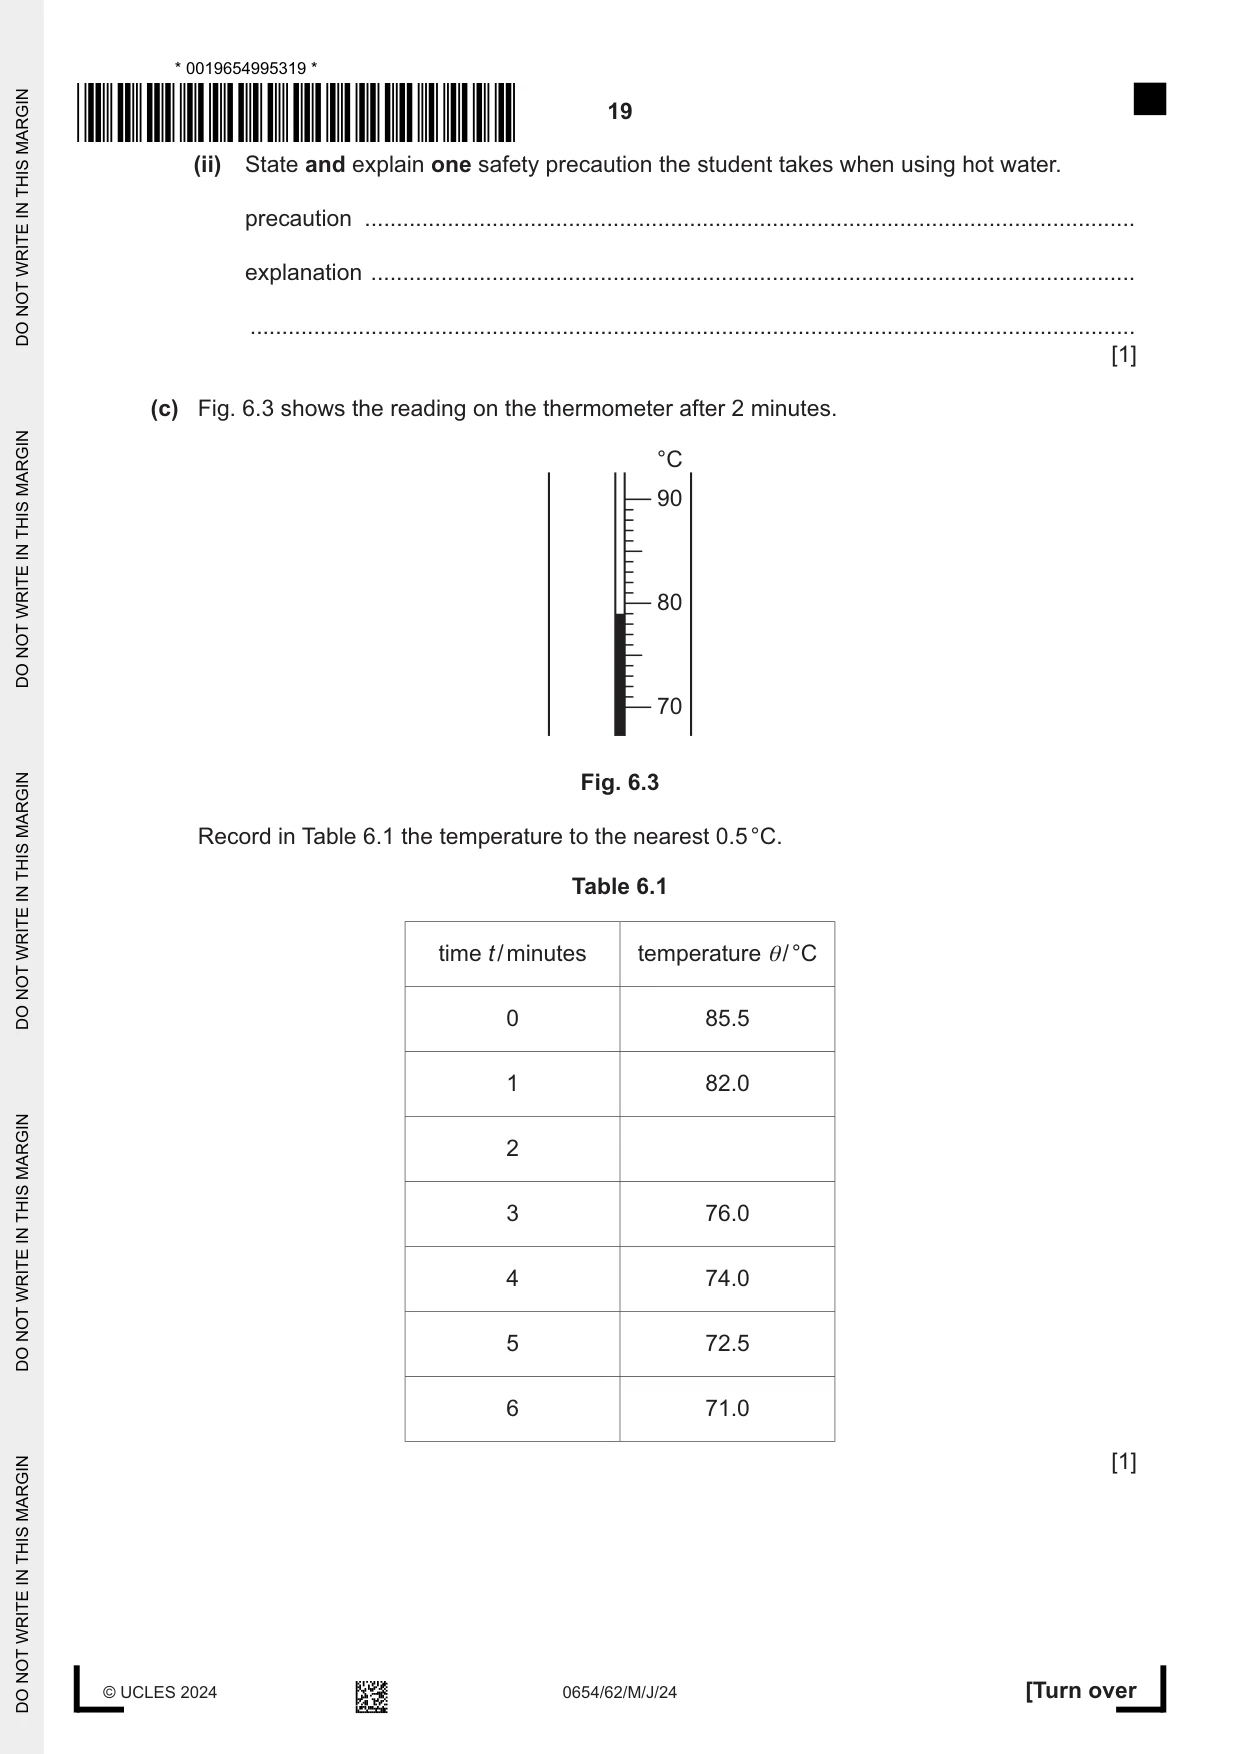
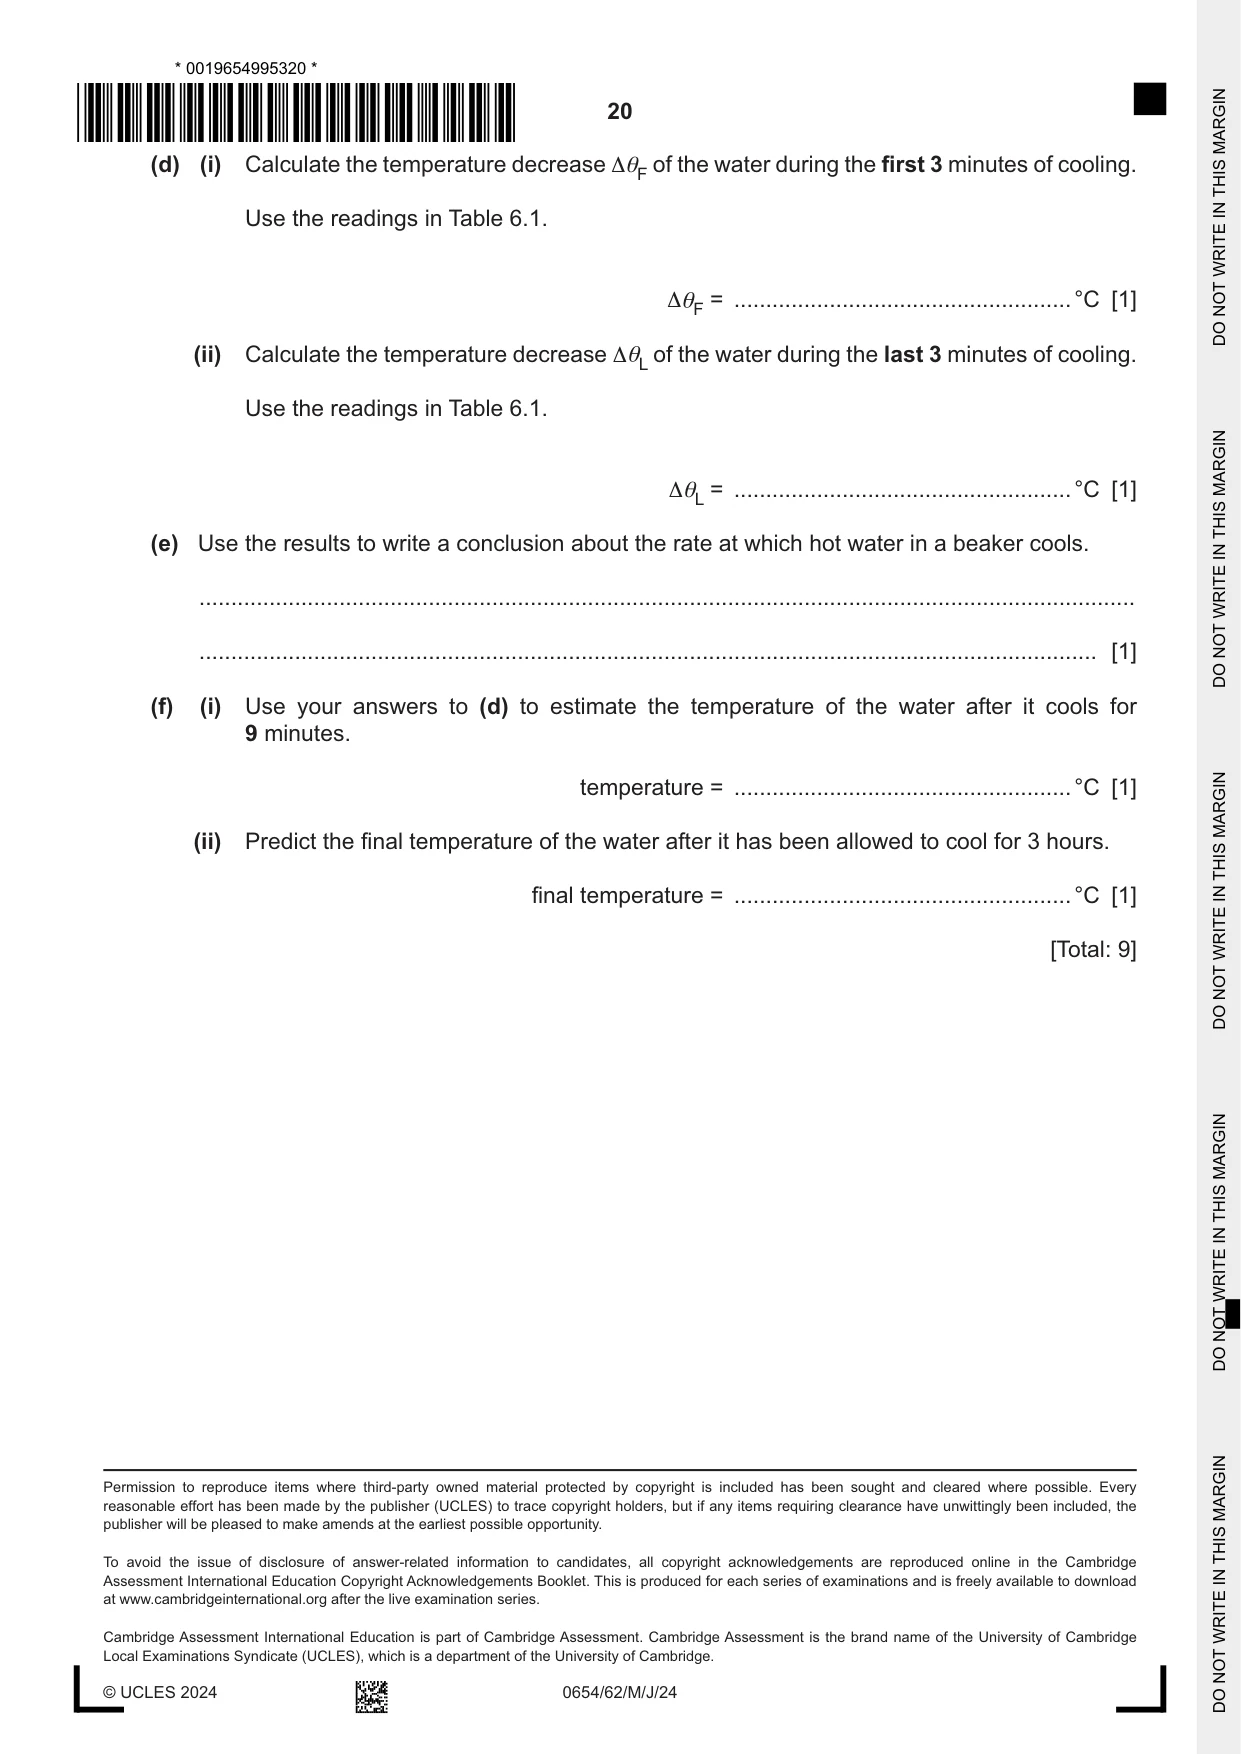
6 A student investigates the rate of cooling of hot water. (a) Fig. 6.1 shows the reading on a thermometer to measure room temperature. °C 30 20 10 Fig. 6.1 Record the room temperature θ R to the nearest 0.5 °C. θ R = ..................................................... °C [1] (b) Procedure The student: • pours 200 cm3 of hot water into a beaker • assembles the apparatus shown in Fig. 6.2 thermometer stand hot water beaker Fig. 6.2 • waits for 30 s • records in Table 6.1 the temperature θ to the nearest 0.5 °C at time t = 0 • starts the stop-watch • records in Table 6.1 the temperature of the water every minute for 6 minutes. (i) Explain why the student waits for 30 s before measuring the initial temperature of the hot water. ........................................................................................................................................... ..................................................................................................................................... [1] (ii) State and explain one safety precaution the student takes when using hot water. precaution ......................................................................................................................... explanation ........................................................................................................................ ........................................................................................................................................... [1] (c) Fig. 6.3 shows the reading on the thermometer after 2 minutes. °C 90 80 70 Fig. 6.3 Record in Table 6.1 the temperature to the nearest 0.5 °C. Table 6.1 time t / minutes temperature θ/ °C 0 85.5 1 82.0 2 3 76.0 4 74.0 5 72.5 6 71.0 [1] (d) (i) Calculate the temperature decrease ΔθF of the water during the first 3 minutes of cooling. Use the readings in Table 6.1. ΔθF = ..................................................... °C [1] (ii) Calculate the temperature decrease ΔθL of the water during the last 3 minutes of cooling. Use the readings in Table 6.1. ΔθL = ..................................................... °C [1] (e) Use the results to write a conclusion about the rate at which hot water in a beaker cools. ................................................................................................................................................... ............................................................................................................................................. [1] (f) (i) Use your answers to (d) to estimate the temperature of the water after it cools for 9 minutes. temperature = ..................................................... °C [1] (ii) Predict the final temperature of the water after it has been allowed to cool for 3 hours. final temperature = ..................................................... °C [1] [Total: 9]
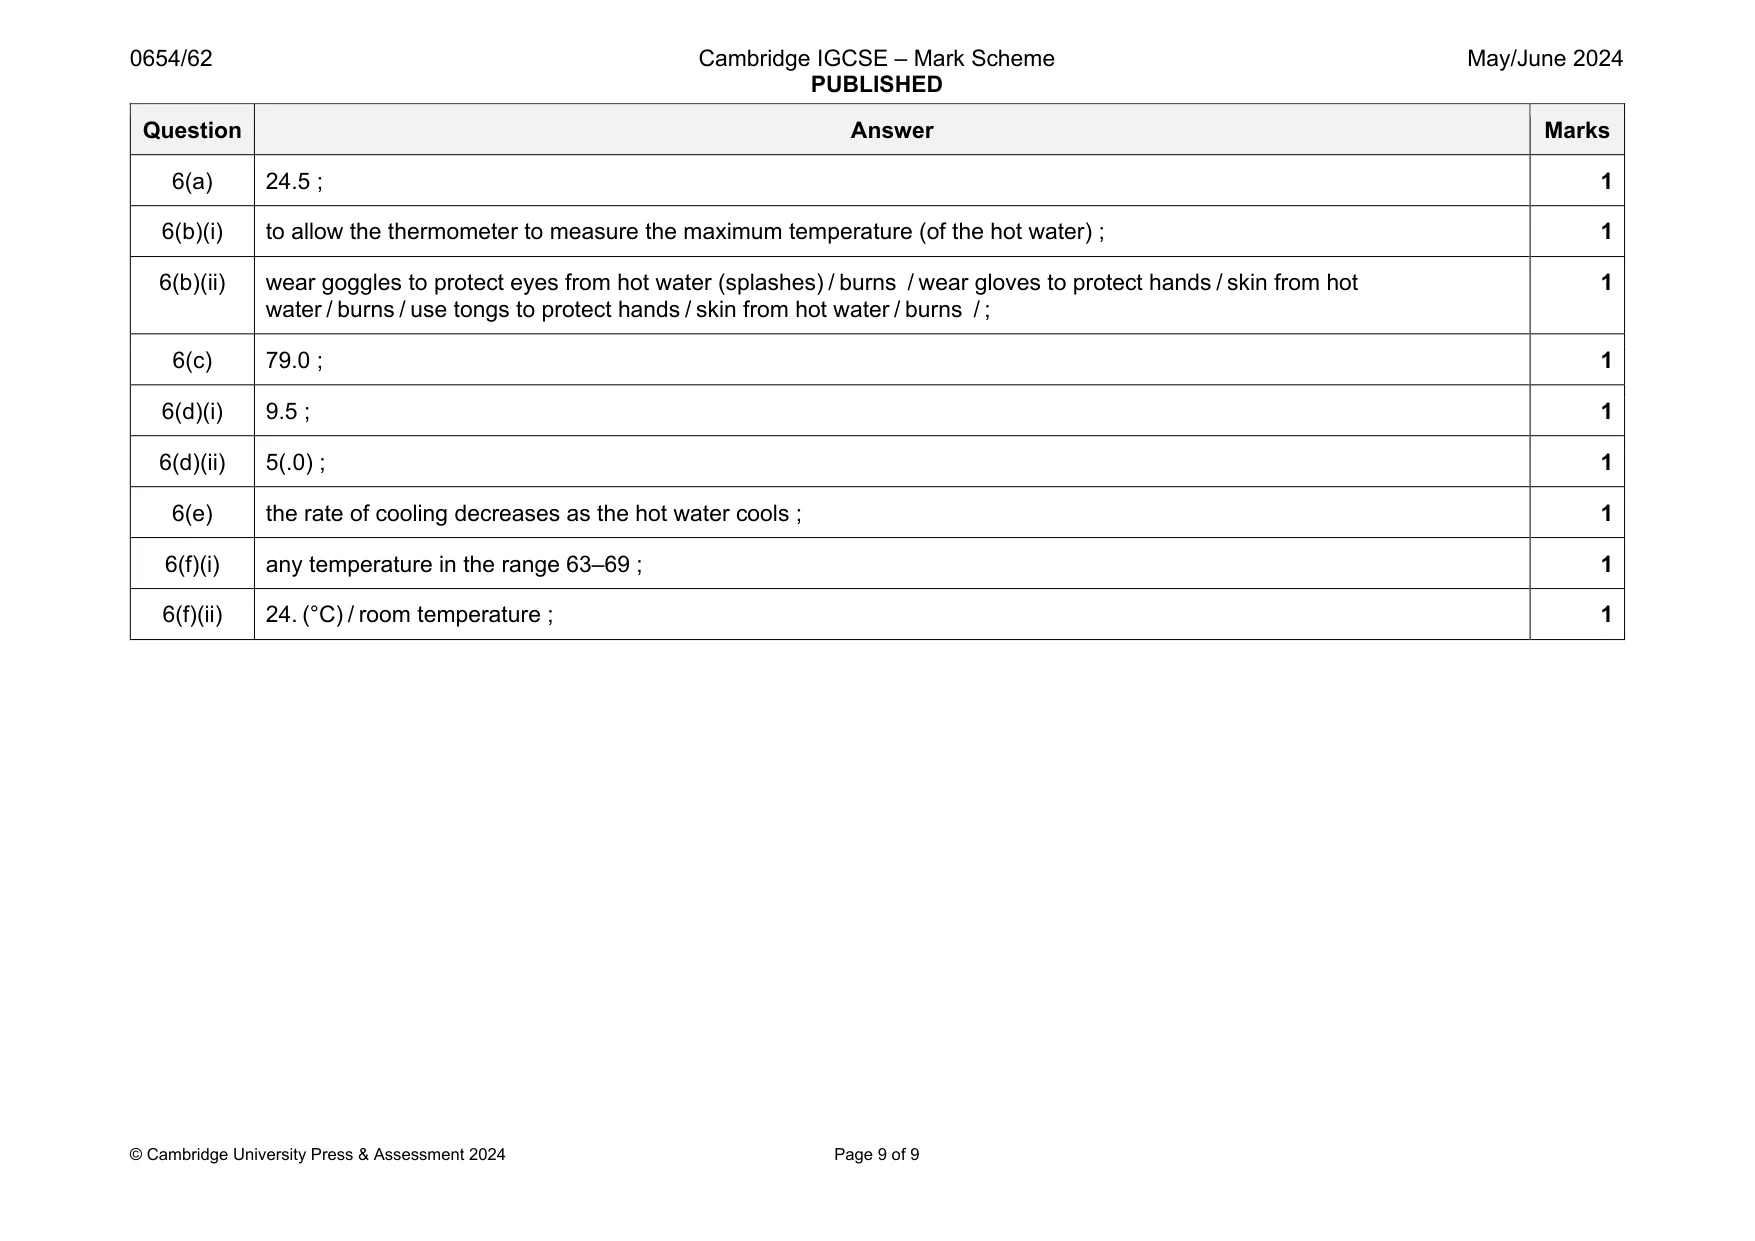
Mark scheme: 6(a) 24.5 ; 1 6(b)(i) to allow the thermometer to measure the maximum temperature (of the hot water) ; 1 6(b)(ii) wear goggles to protect eyes from hot water (splashes) / burns / wear gloves to protect hands / skin from hot water / burns / use tongs to protect hands / skin from hot water / burns / ; 1 6(c) 79.0 ; 1 6(d)(i) 9.5 ; 1 6(d)(ii) 5(.0) ; 1 6(e) the rate of cooling decreases as the hot water cools ; 1 6(f)(i) any temperature in the range 63–69 ; 1 6(f)(ii) 24. (°C) / room temperature ; 1
What was in this paper
The subtopics covered by these 6 questions, and how many questions each got. Open one in a new tab to see every Cambridge question on it.
What you needed in this session
Cambridge’s own grade thresholds for 2024 May/June, Paper 6 · Variant 2. A higher threshold means an easier paper — the bar moves with how the cohort did.