Cambridge IGCSE Sciences - Co-ordinated (Double) 0654 — 2020 May/June Paper 6 · Variant 3
0654/63/M/J/20 · 7 questions · 60 marks · ≈68 min
The question paper and its mark scheme, free to read here and free to download. This is Cambridge’s own paper, exactly as it was sat.
Question paper16 pages
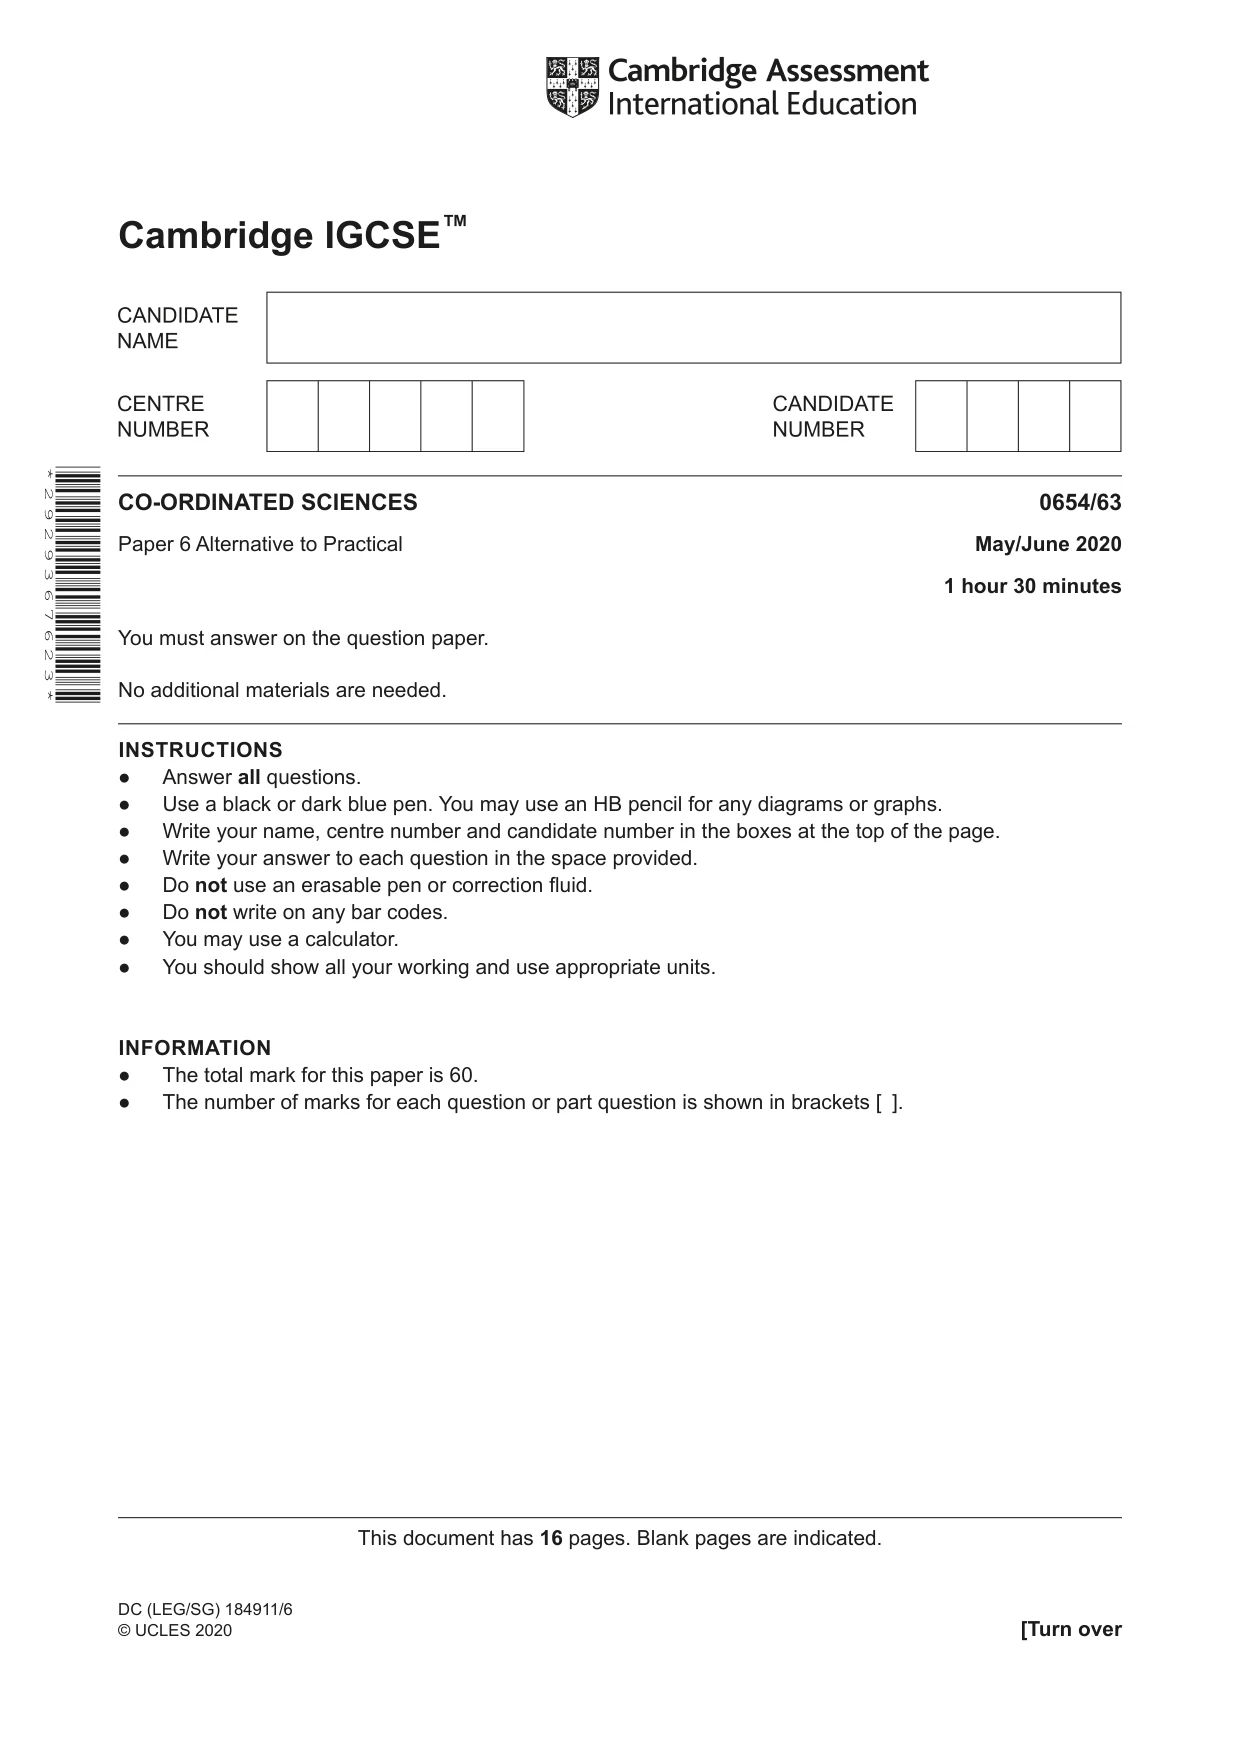

Mark scheme9 pages
Answers below. Sit the paper first if you are practising.
Questions as text
Question 1
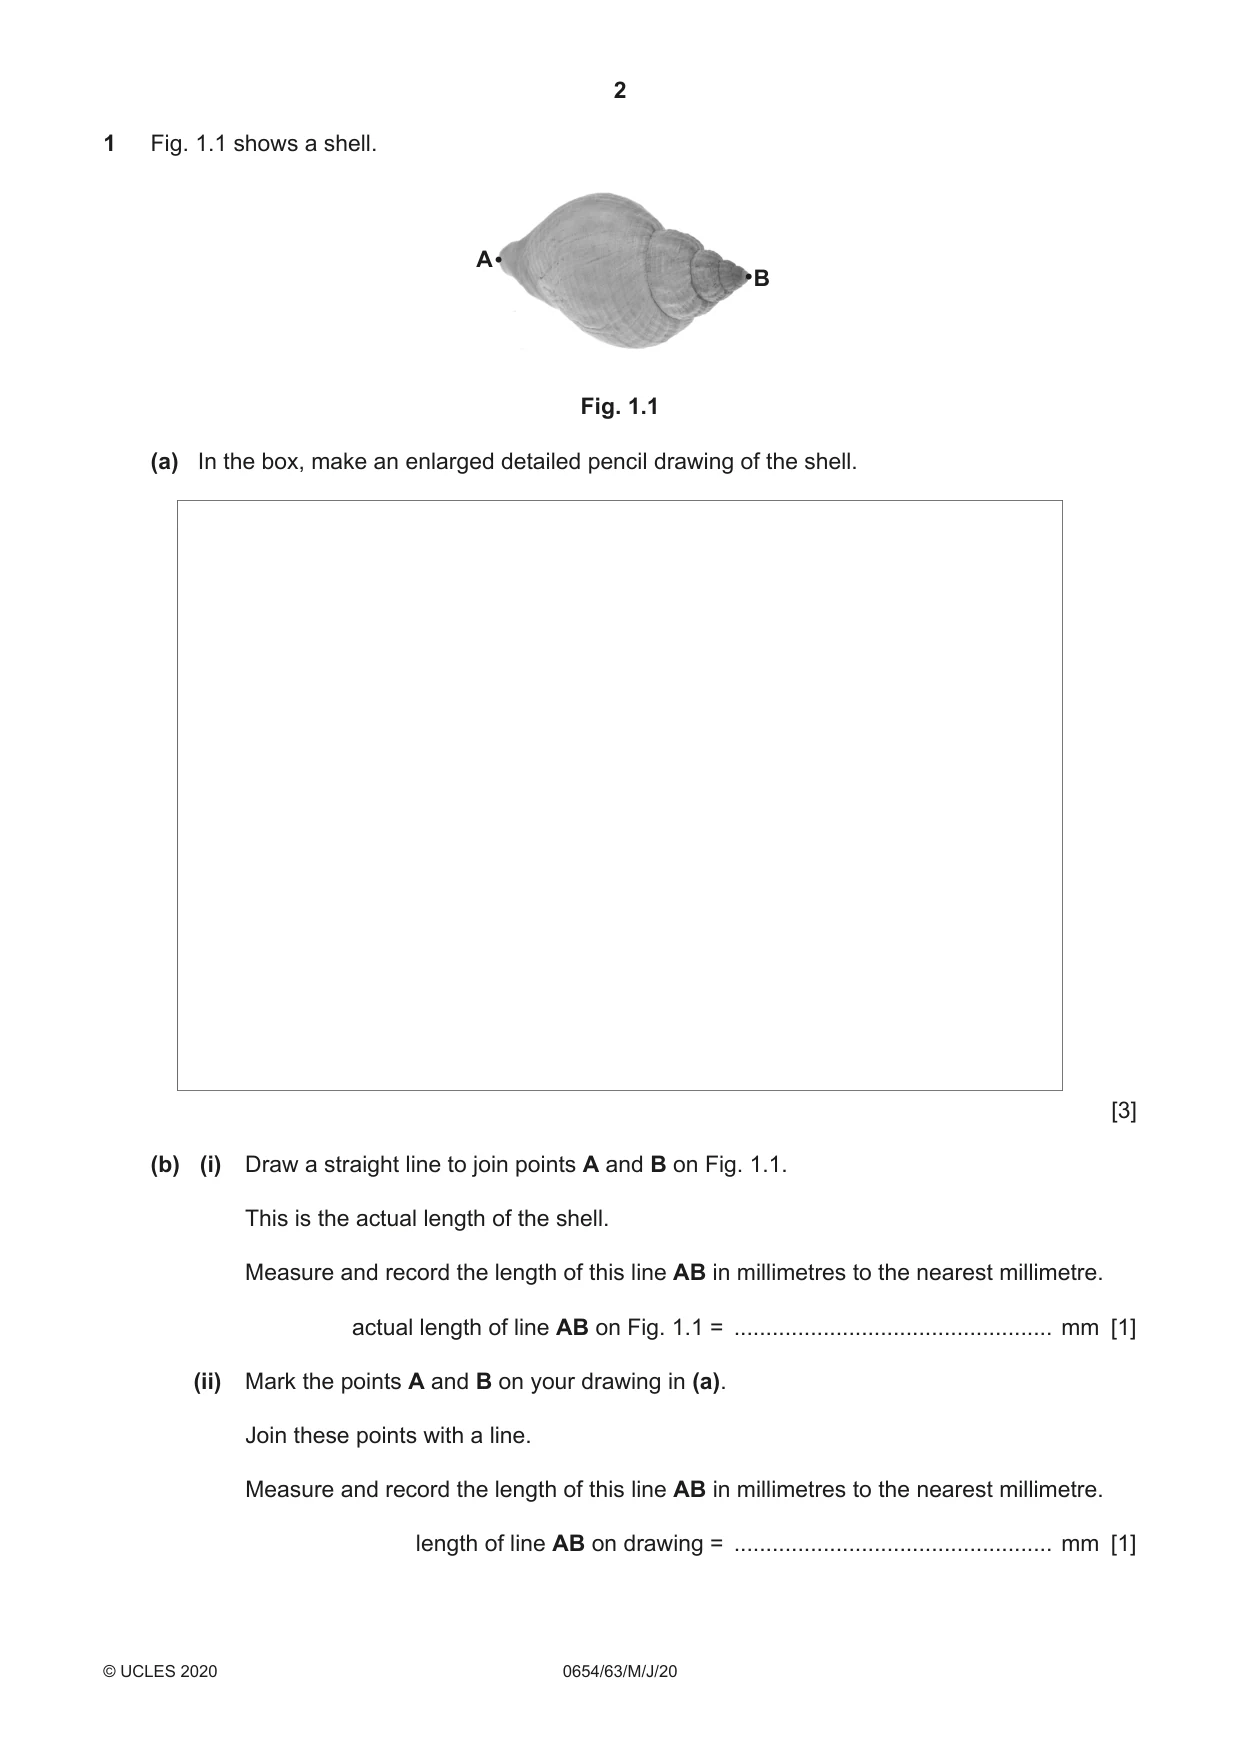
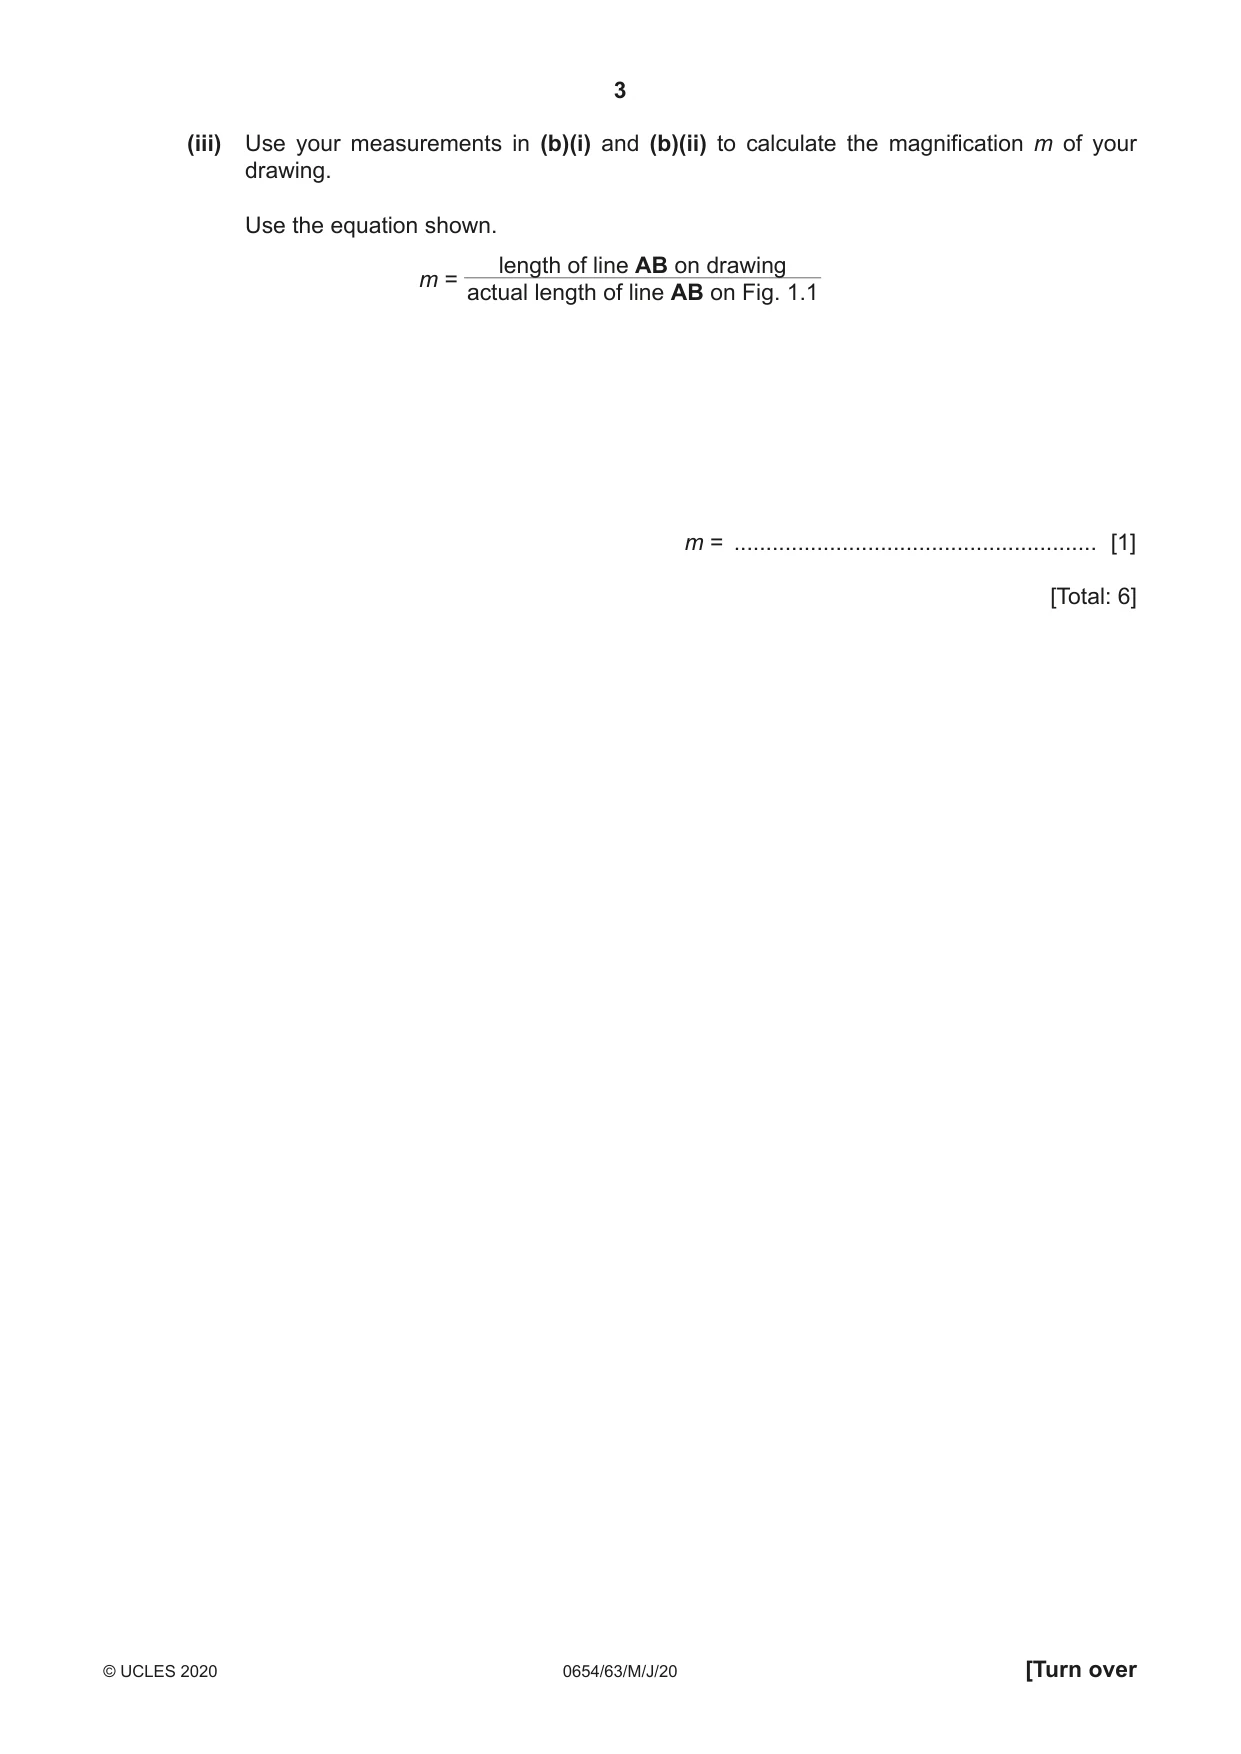
1 Fig. 1.1 shows a shell. A B Fig. 1.1 (a) In the box, make an enlarged detailed pencil drawing of the shell. [3] (b) (i) Draw a straight line to join points A and B on Fig. 1.1. This is the actual length of the shell. Measure and record the length of this line AB in millimetres to the nearest millimetre. actual length of line AB on Fig. 1.1 = .................................................. mm [1] (ii) Mark the points A and B on your drawing in (a). Join these points with a line. Measure and record the length of this line AB in millimetres to the nearest millimetre. length of line AB on drawing = .................................................. mm [1] (iii) Use your measurements in (b)(i) and (b)(ii) to calculate the magnification m of your drawing. Use the equation shown. length of line AB on drawing m = actual length of line AB on Fig. 1.1 m = ......................................................... [1] [Total: 6]
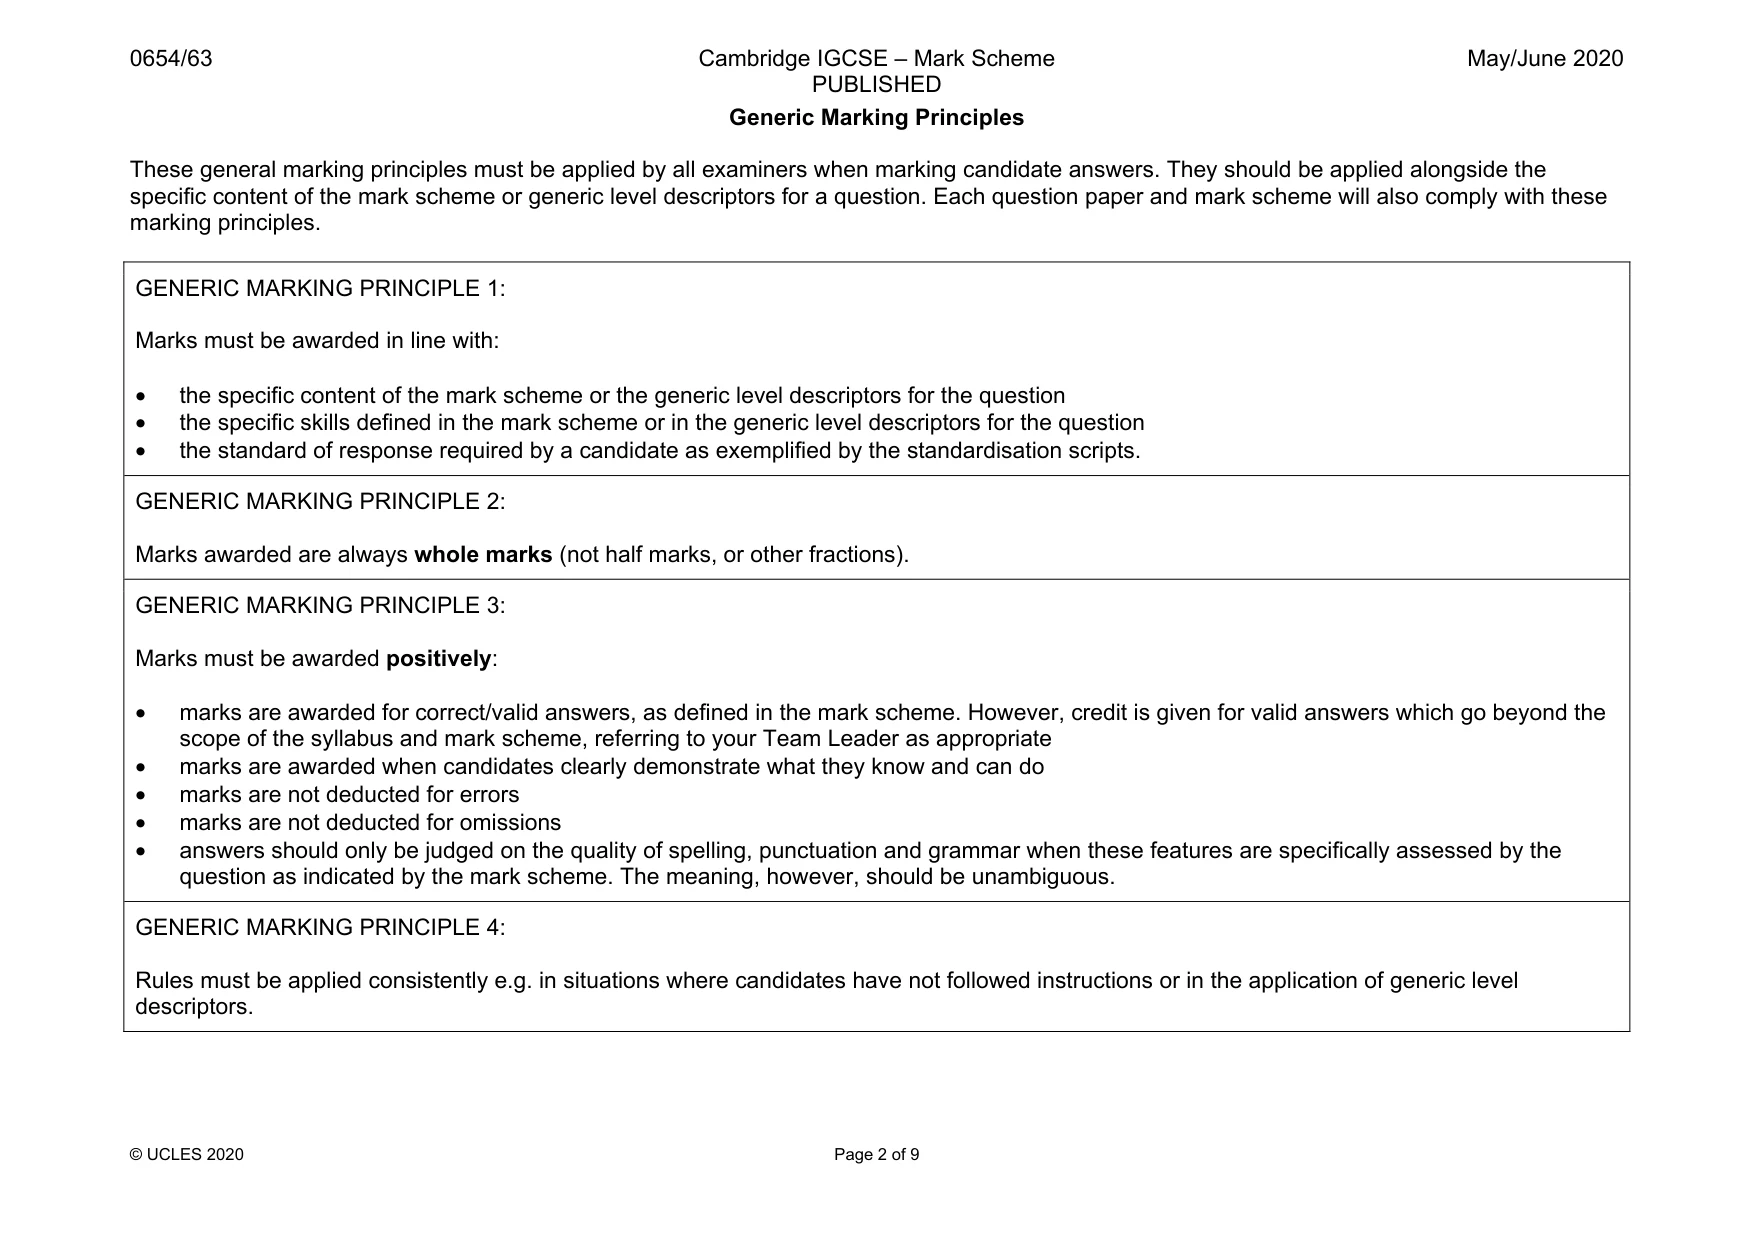
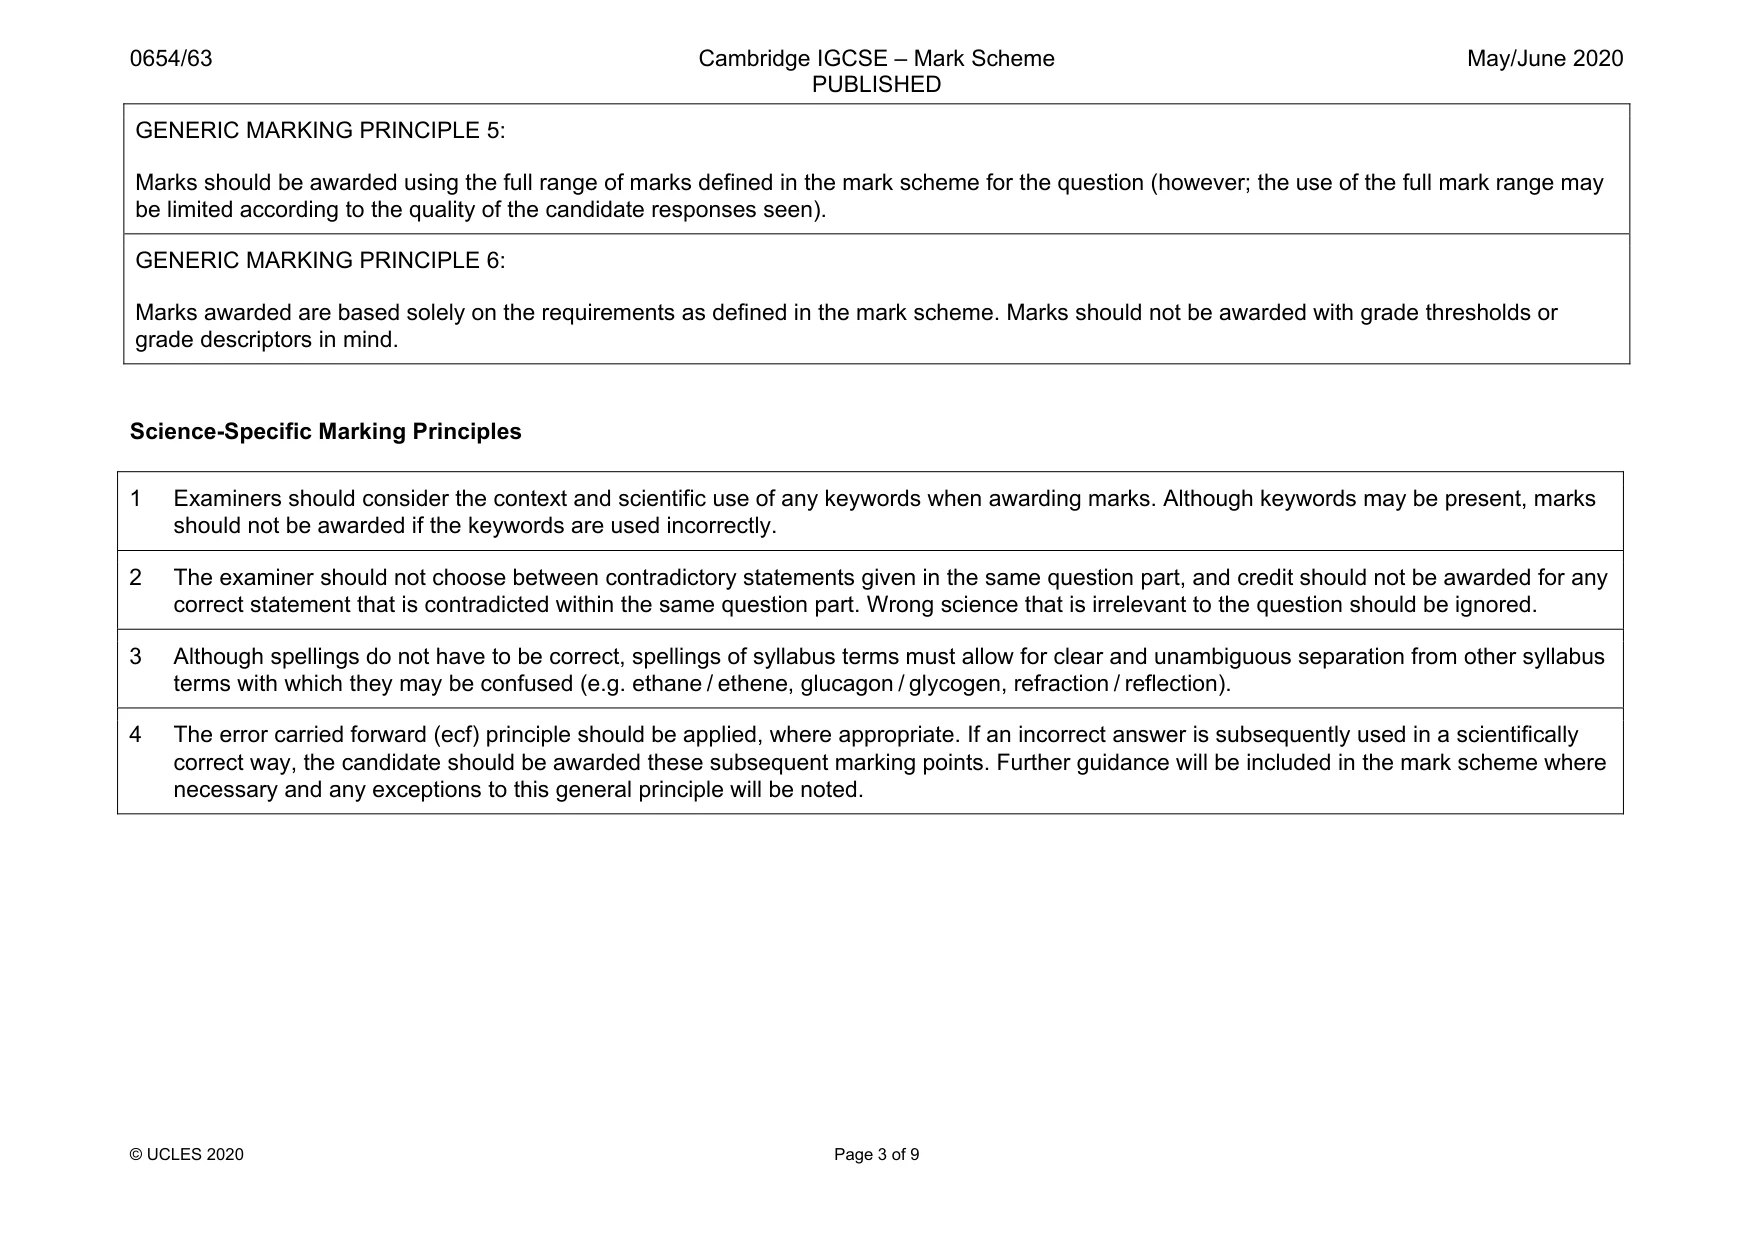
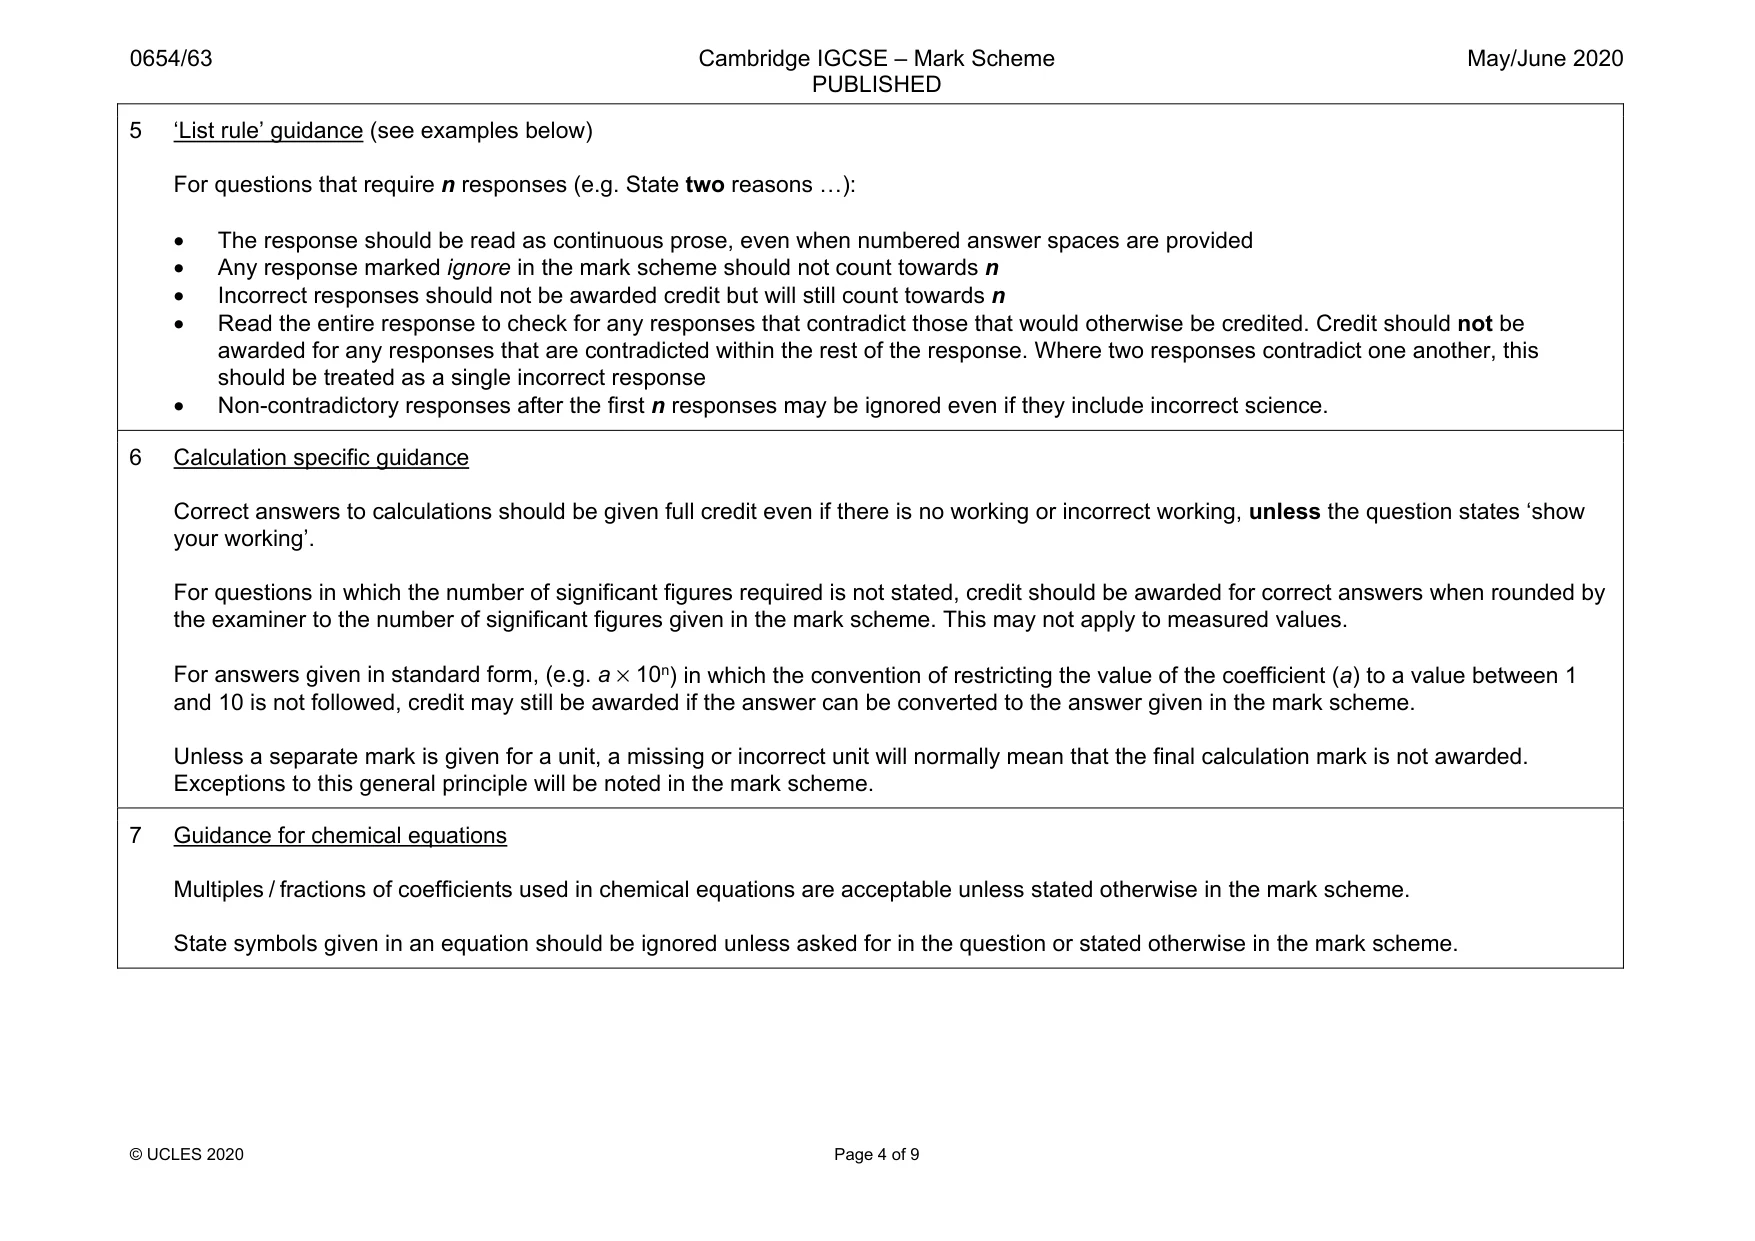
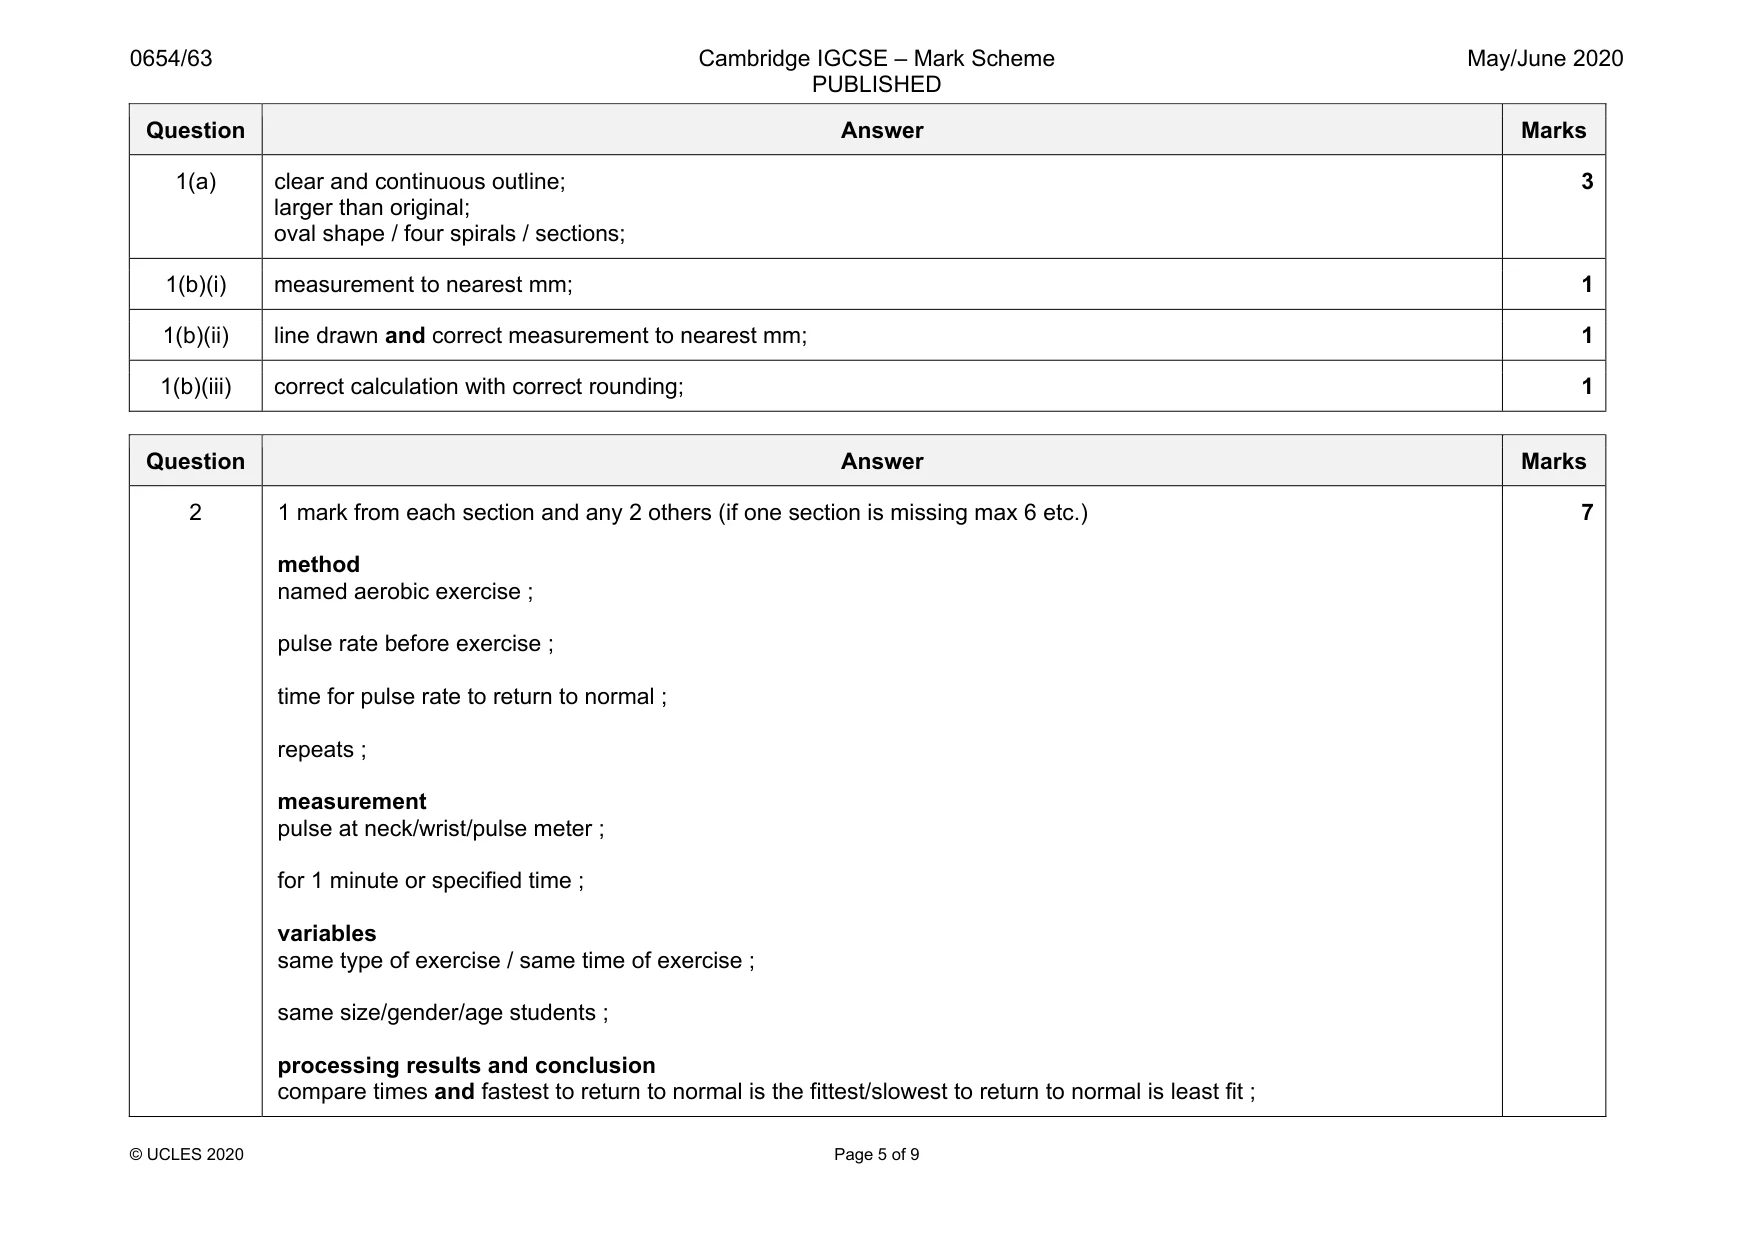
Mark scheme: 1(a) clear and continuous outline; larger than original; oval shape / four spirals / sections; 3 1(b)(i) measurement to nearest mm; 1 1(b)(ii) line drawn and correct measurement to nearest mm; 1 1(b)(iii) correct calculation with correct rounding; 1
Q2 · A teacher says that after exercise, the fitness of a person determines the time taken for…
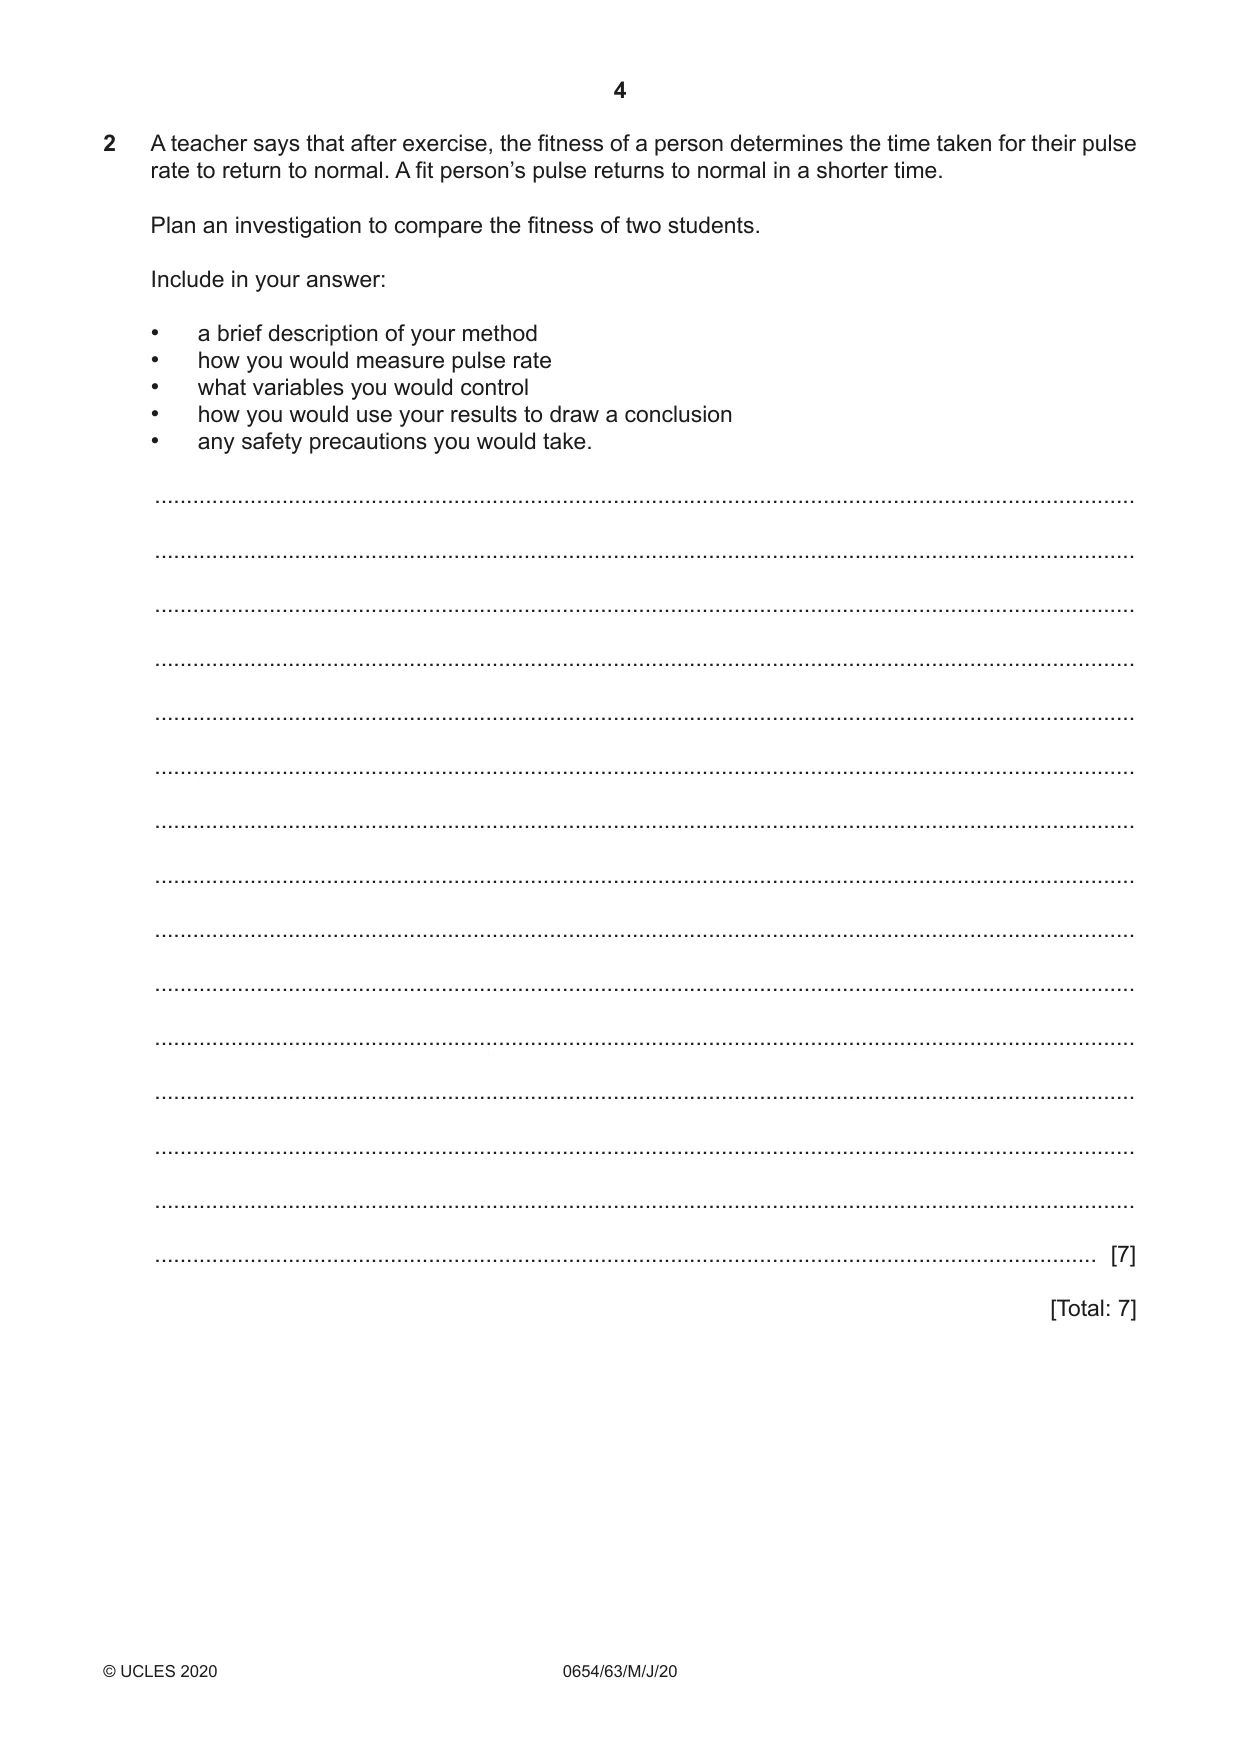
2 A teacher says that after exercise, the fitness of a person determines the time taken for their pulse rate to return to normal. A fit person’s pulse returns to normal in a shorter time. Plan an investigation to compare the fitness of two students. Include in your answer: • a brief description of your method • how you would measure pulse rate • what variables you would control • how you would use your results to draw a conclusion • any safety precautions you would take. .......................................................................................................................................................... .......................................................................................................................................................... .......................................................................................................................................................... .......................................................................................................................................................... .......................................................................................................................................................... .......................................................................................................................................................... .......................................................................................................................................................... .......................................................................................................................................................... .......................................................................................................................................................... .......................................................................................................................................................... .......................................................................................................................................................... .......................................................................................................................................................... .......................................................................................................................................................... .......................................................................................................................................................... .................................................................................................................................................... [7] [Total: 7]
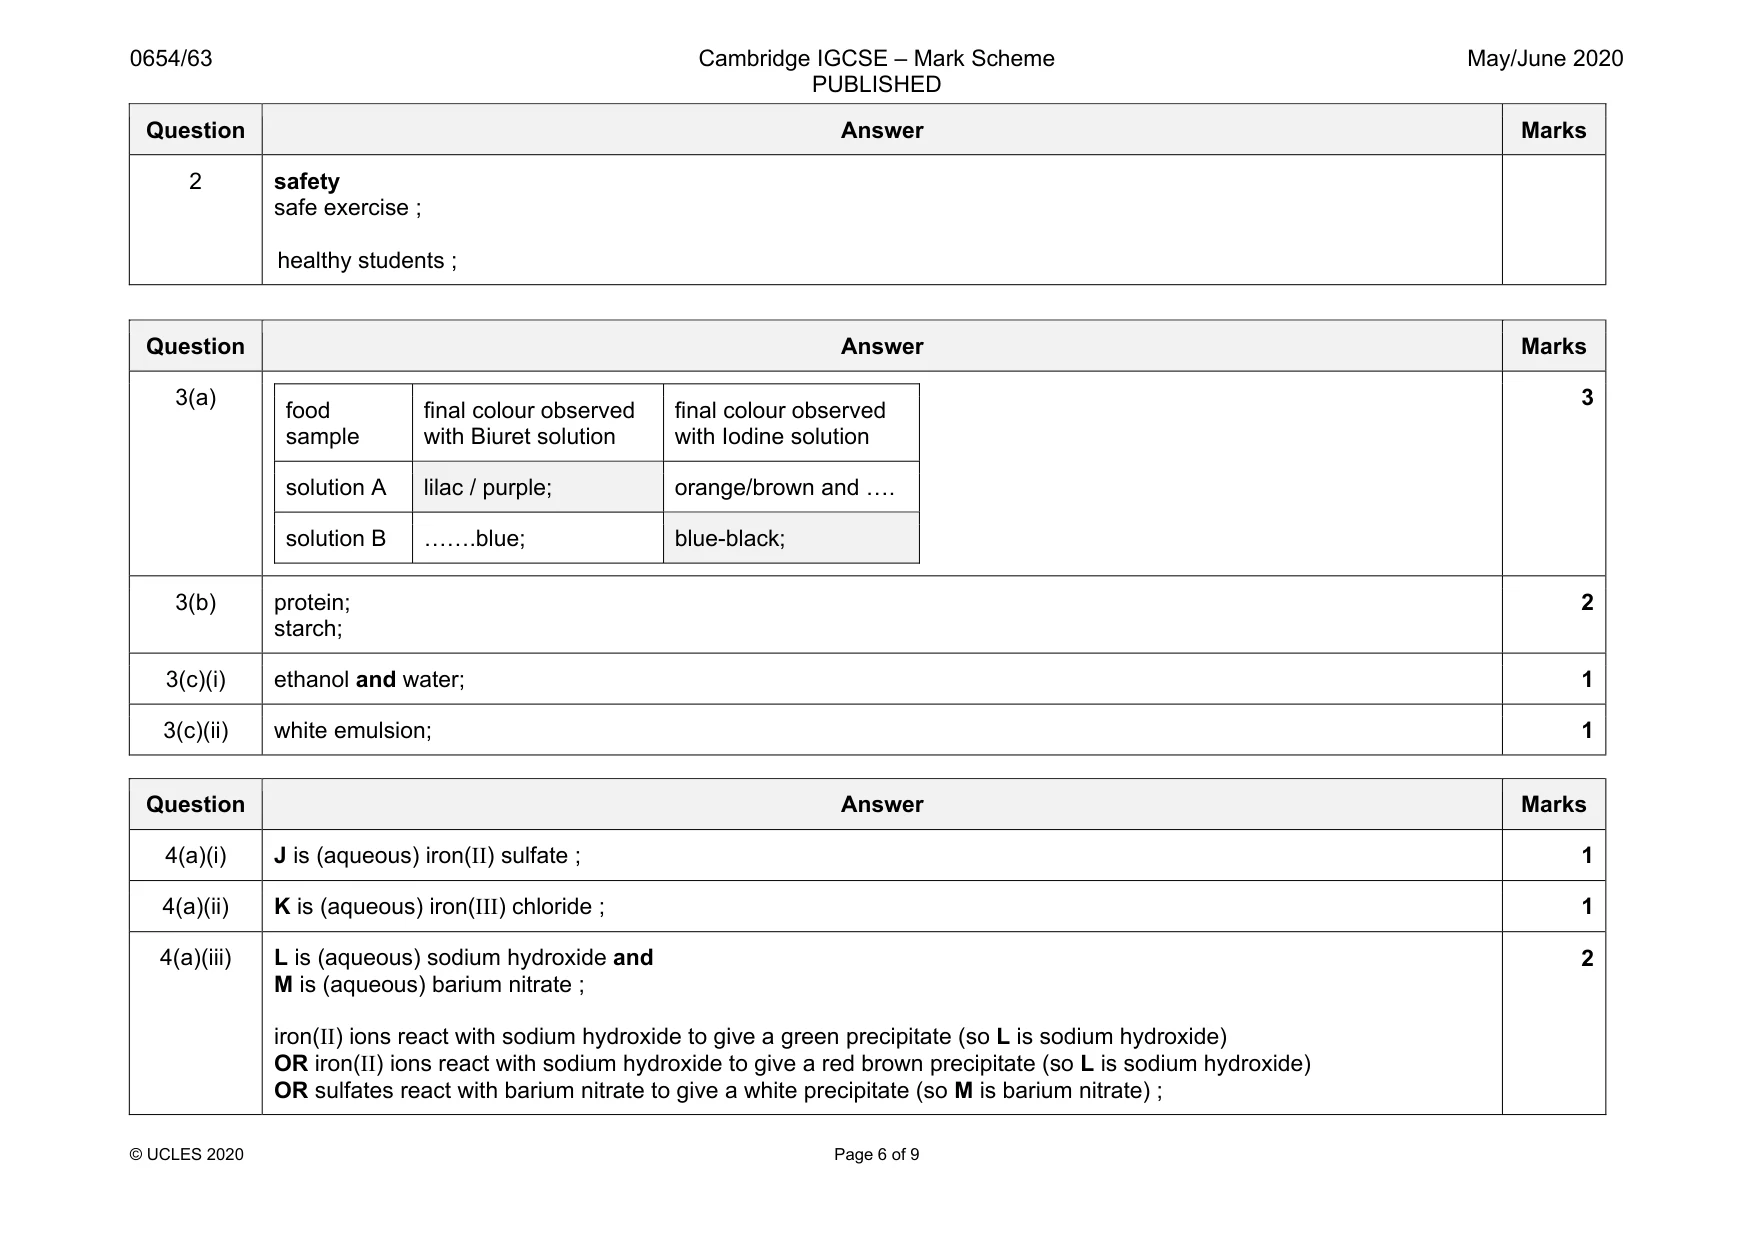
Mark scheme: 2 1 mark from each section and any 2 others (if one section is missing max 6 etc.) method named aerobic exercise ; pulse rate before exercise ; time for pulse rate to return to normal ; repeats ; measurement pulse at neck/wrist/pulse meter ; for 1 minute or specified time ; variables same type of exercise / same time of exercise ; same size/gender/age students ; processing results and conclusion compare times and fastest to return to normal is the fittest/slowest to return to normal is least fit ; Question Answer Marks 2 safety safe exercise ; healthy students ;
Q3 · A student investigates the nutrient content of two food solutions, A and B, using biuret…
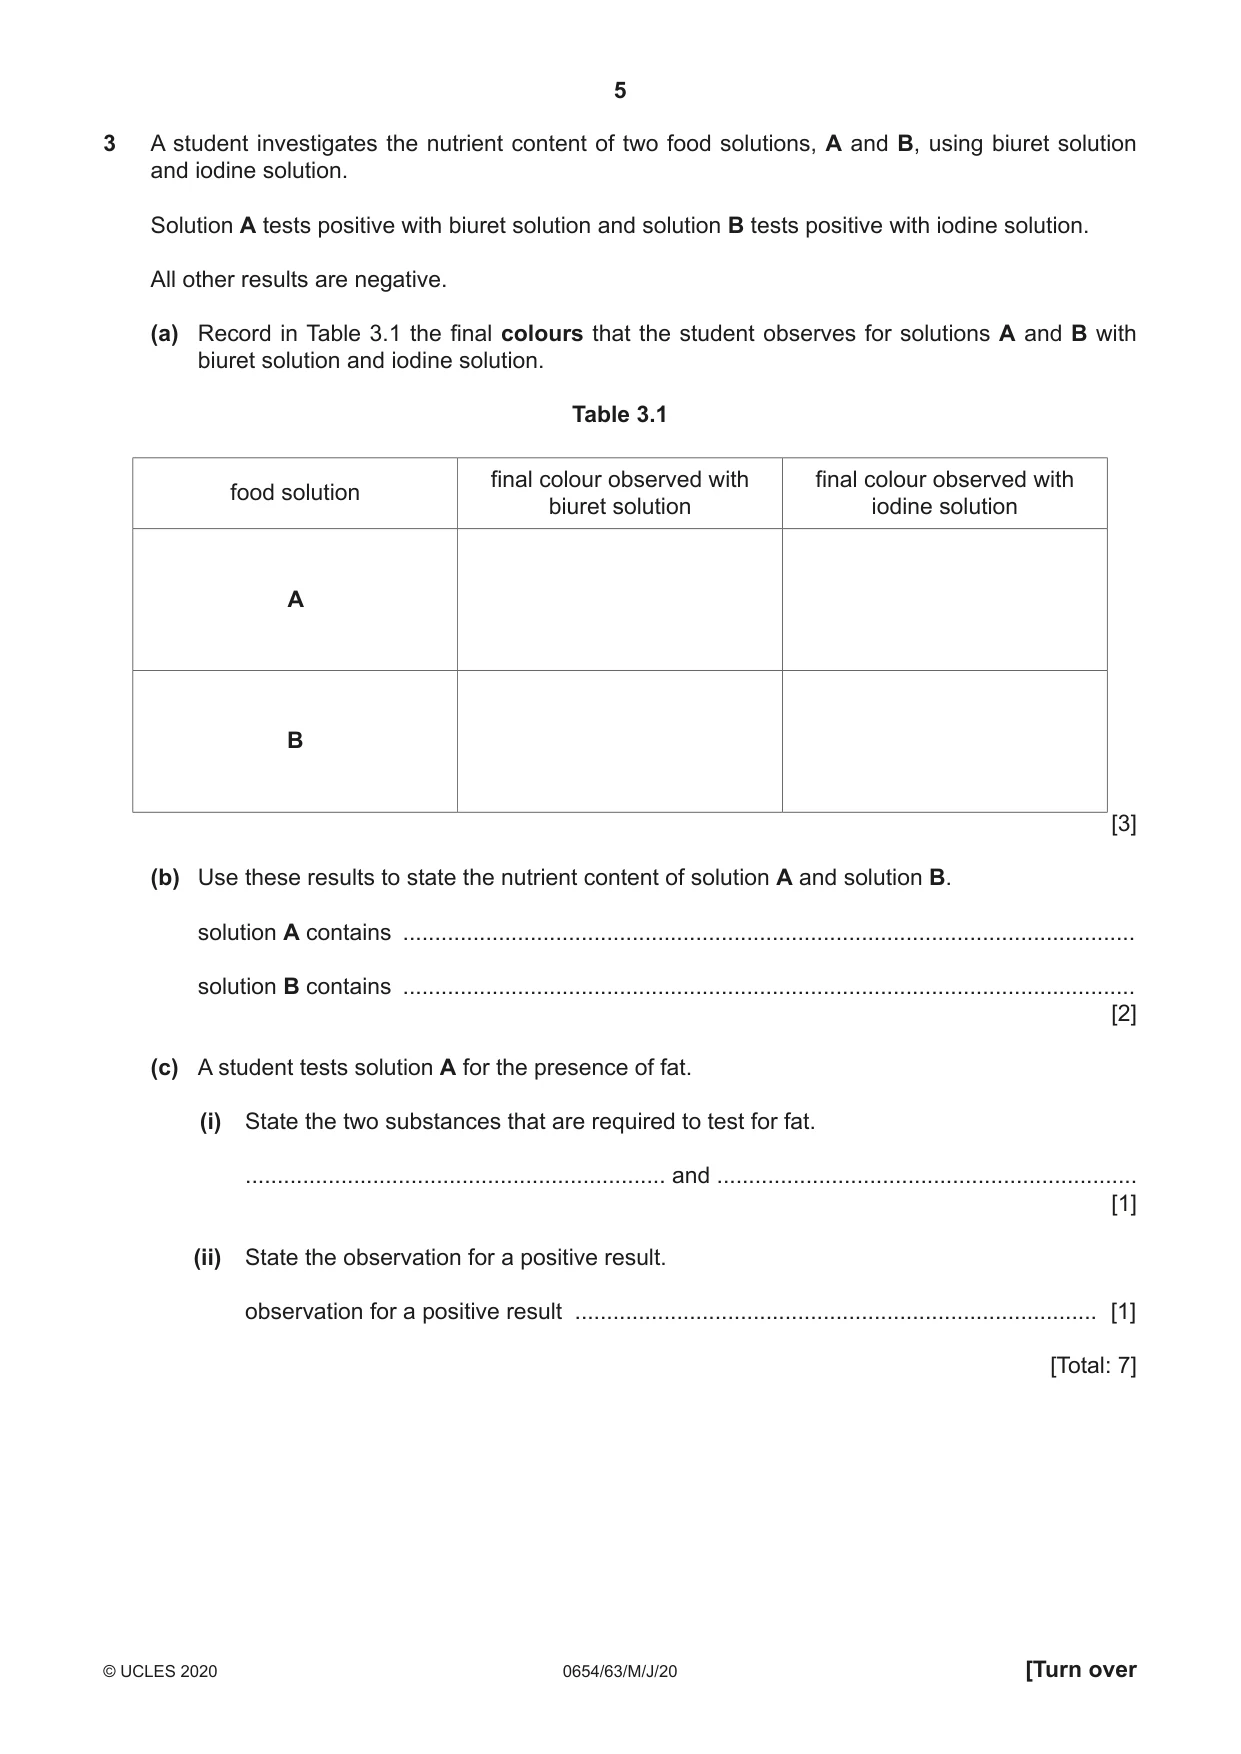
3 A student investigates the nutrient content of two food solutions, A and B, using biuret solution and iodine solution. Solution A tests positive with biuret solution and solution B tests positive with iodine solution. All other results are negative. (a) Record in Table 3.1 the final colours that the student observes for solutions A and B with biuret solution and iodine solution. Table 3.1 final colour observed with final colour observed with food solution biuret solution iodine solution A B [3] (b) Use these results to state the nutrient content of solution A and solution B. solution A contains ................................................................................................................... solution B contains ................................................................................................................... [2] (c) A student tests solution A for the presence of fat. (i) State the two substances that are required to test for fat. .................................................................. and .................................................................. [1] (ii) State the observation for a positive result. observation for a positive result .................................................................................. [1] [Total: 7]
Mark scheme: 3(a) food sample final colour observed with Biuret solution final colour observed with Iodine solution solution A lilac / purple; orange/brown and …. solution B …….blue; blue-black; 3 3(b) protein; starch; 2 3(c)(i) ethanol and water; 1 3(c)(ii) white emulsion; 1
Q4 · In this investigation a student is going to identify four solutions labelled J, K, L and M
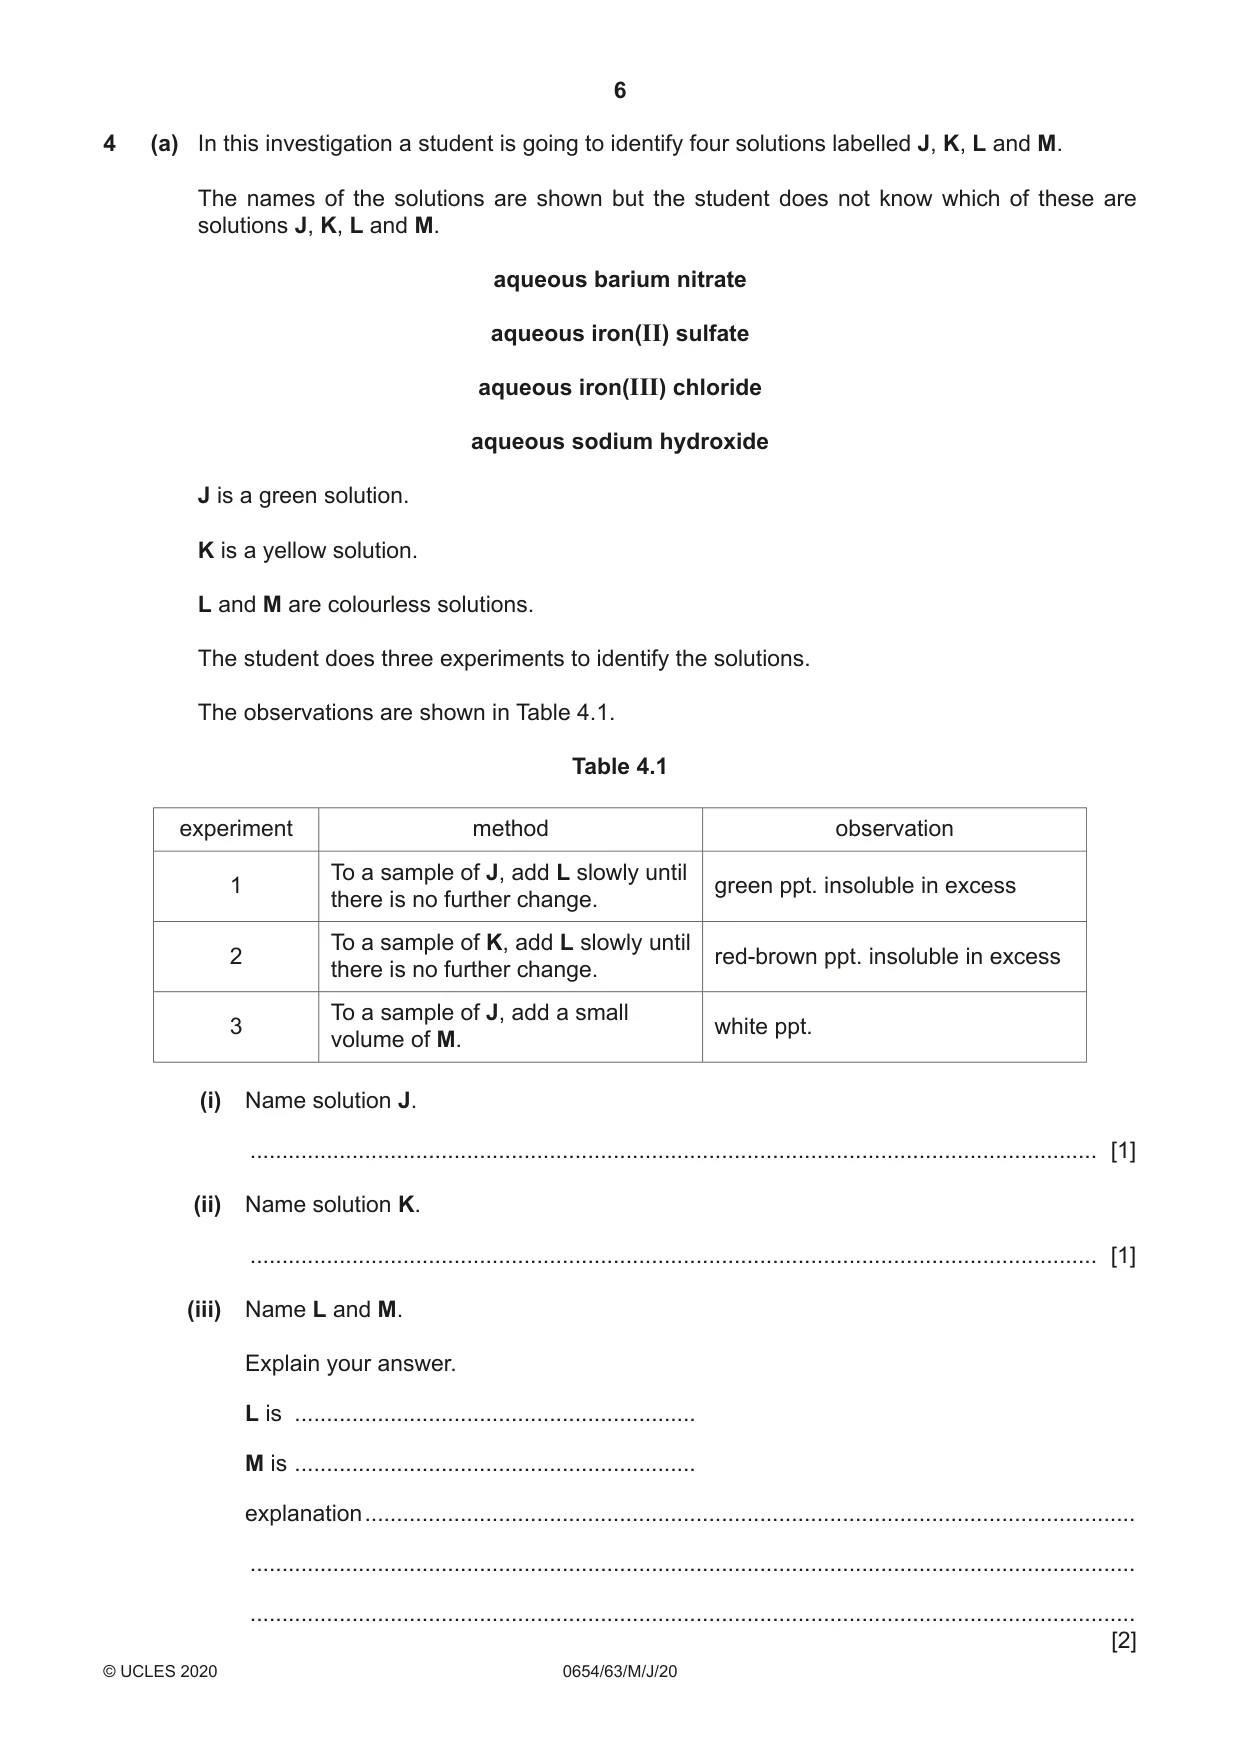
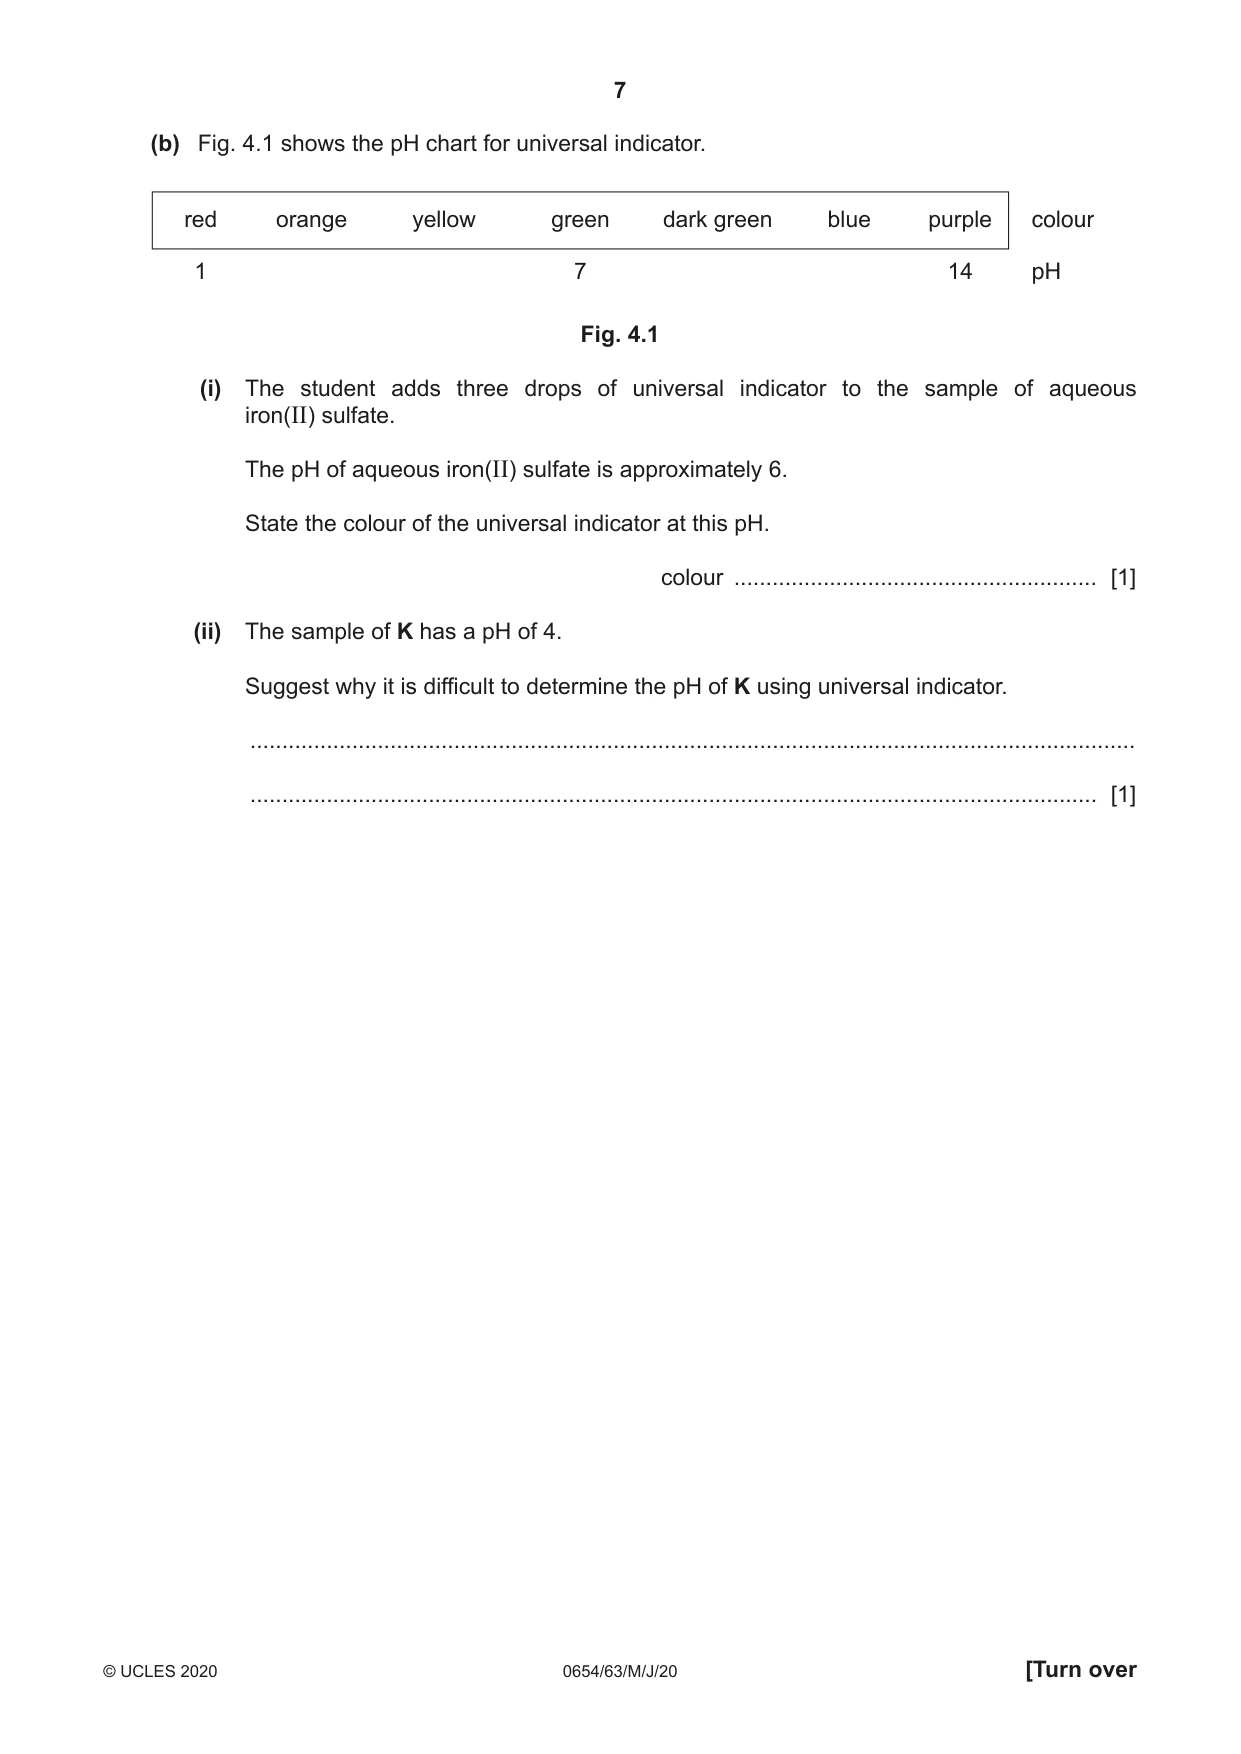
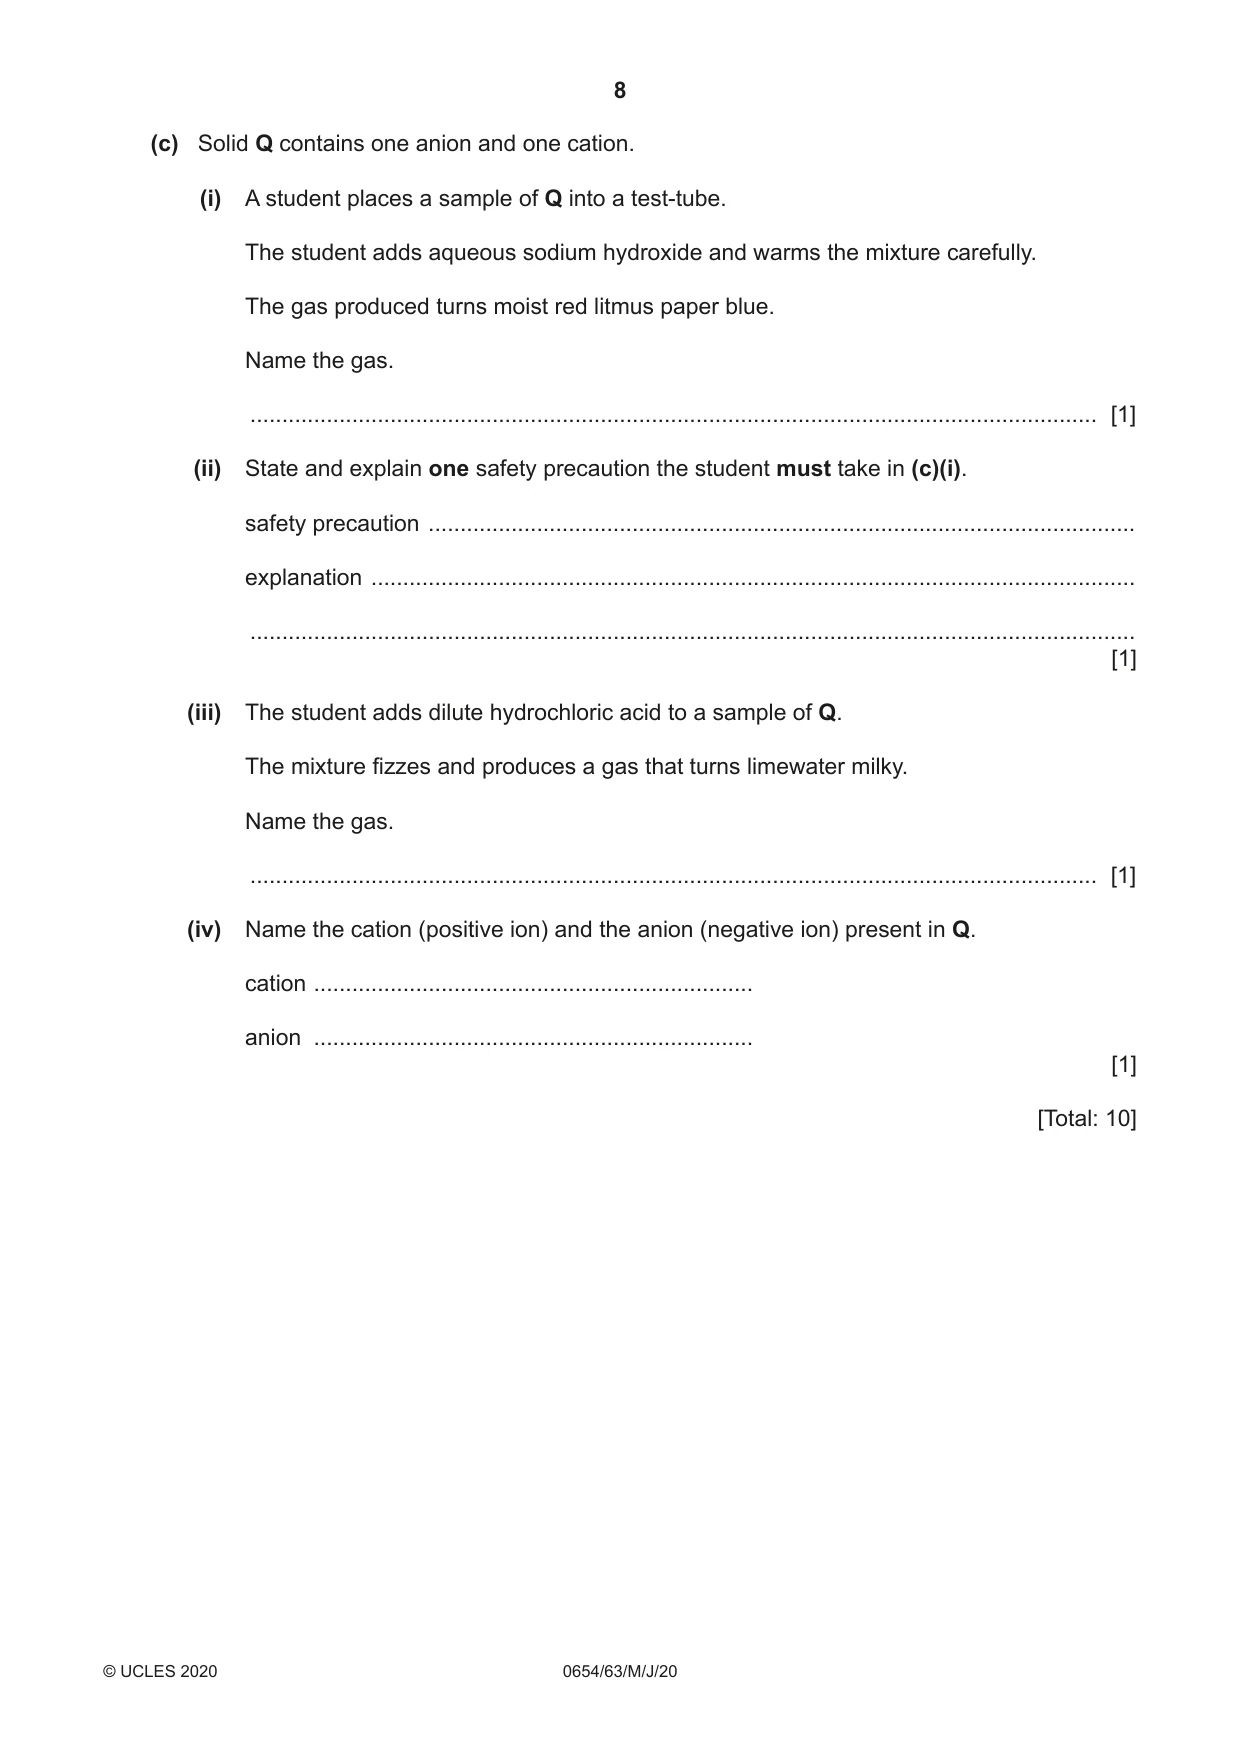
4 (a) In this investigation a student is going to identify four solutions labelled J, K, L and M. The names of the solutions are shown but the student does not know which of these are solutions J, K, L and M. aqueous barium nitrate aqueous iron(II) sulfate aqueous iron(III) chloride aqueous sodium hydroxide J is a green solution. K is a yellow solution. L and M are colourless solutions. The student does three experiments to identify the solutions. The observations are shown in Table 4.1. Table 4.1 experiment method observation To a sample of J, add L slowly until 1 green ppt. insoluble in excess there is no further change. To a sample of K, add L slowly until 2 red-brown ppt. insoluble in excess there is no further change. To a sample of J, add a small 3 white ppt. volume of M. (i) Name solution J. ..................................................................................................................................... [1] (ii) Name solution K. ..................................................................................................................................... [1] (iii) Name L and M. Explain your answer. L is ............................................................... M is ............................................................... explanation ......................................................................................................................... ........................................................................................................................................... ........................................................................................................................................... [2] (b) Fig. 4.1 shows the pH chart for universal indicator. red orange yellow green dark green blue purple colour 1 7 14 pH Fig. 4.1 (i) The student adds three drops of universal indicator to the sample of aqueous iron(II) sulfate. The pH of aqueous iron(II) sulfate is approximately 6. State the colour of the universal indicator at this pH. colour ......................................................... [1] (ii) The sample of K has a pH of 4. Suggest why it is difficult to determine the pH of K using universal indicator. ........................................................................................................................................... ..................................................................................................................................... [1] (c) Solid Q contains one anion and one cation. (i) A student places a sample of Q into a test-tube. The student adds aqueous sodium hydroxide and warms the mixture carefully. The gas produced turns moist red litmus paper blue. Name the gas. ..................................................................................................................................... [1] (ii) State and explain one safety precaution the student must take in (c)(i). safety precaution ............................................................................................................... explanation ........................................................................................................................ ........................................................................................................................................... [1] (iii) The student adds dilute hydrochloric acid to a sample of Q. The mixture fizzes and produces a gas that turns limewater milky. Name the gas. ..................................................................................................................................... [1] (iv) Name the cation (positive ion) and the anion (negative ion) present in Q. cation ..................................................................... anion ..................................................................... [1] [Total: 10]
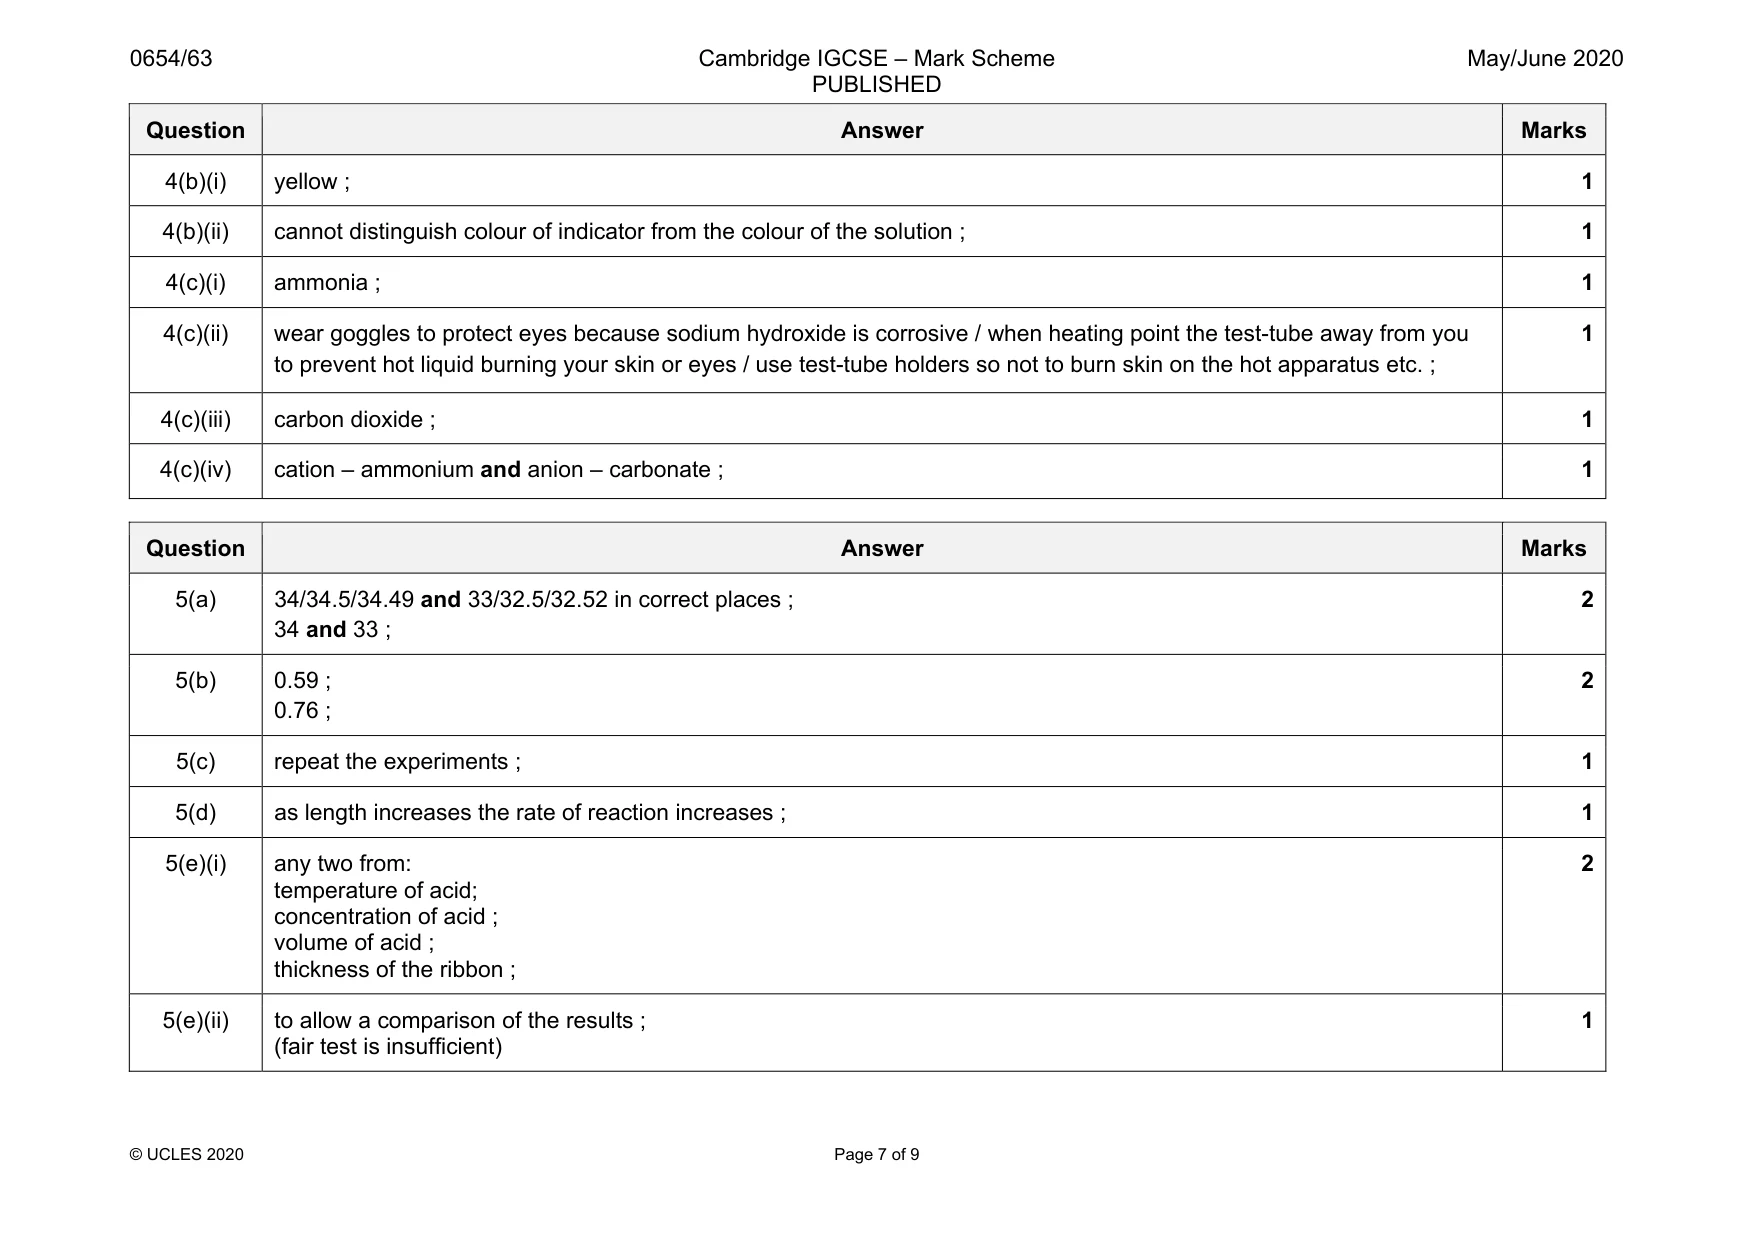
Mark scheme: 4(a)(i) J is (aqueous) iron(II) sulfate ; 1 4(a)(ii) K is (aqueous) iron(III) chloride ; 1 4(a)(iii) L is (aqueous) sodium hydroxide and M is (aqueous) barium nitrate ; iron(II) ions react with sodium hydroxide to give a green precipitate (so L is sodium hydroxide) OR iron(II) ions react with sodium hydroxide to give a red brown precipitate (so L is sodium hydroxide) OR sulfates react with barium nitrate to give a white precipitate (so M is barium nitrate) ; 2 Question Answer Marks 4(b)(i) yellow ; 1 4(b)(ii) cannot distinguish colour of indicator from the colour of the solution ; 1 4(c)(i) ammonia ; 1 4(c)(ii) wear goggles to protect eyes because sodium hydroxide is corrosive / when heating point the test-tube away from you to prevent hot liquid burning your skin or eyes / use test-tube holders so not to burn skin on the hot apparatus etc. ; 1 4(c)(iii) carbon dioxide ; 1 4(c)(iv) cation – ammonium and anion – carbonate ; 1
Q5 · A student investigates the effect of increasing the length of magnesium ribbon on the…
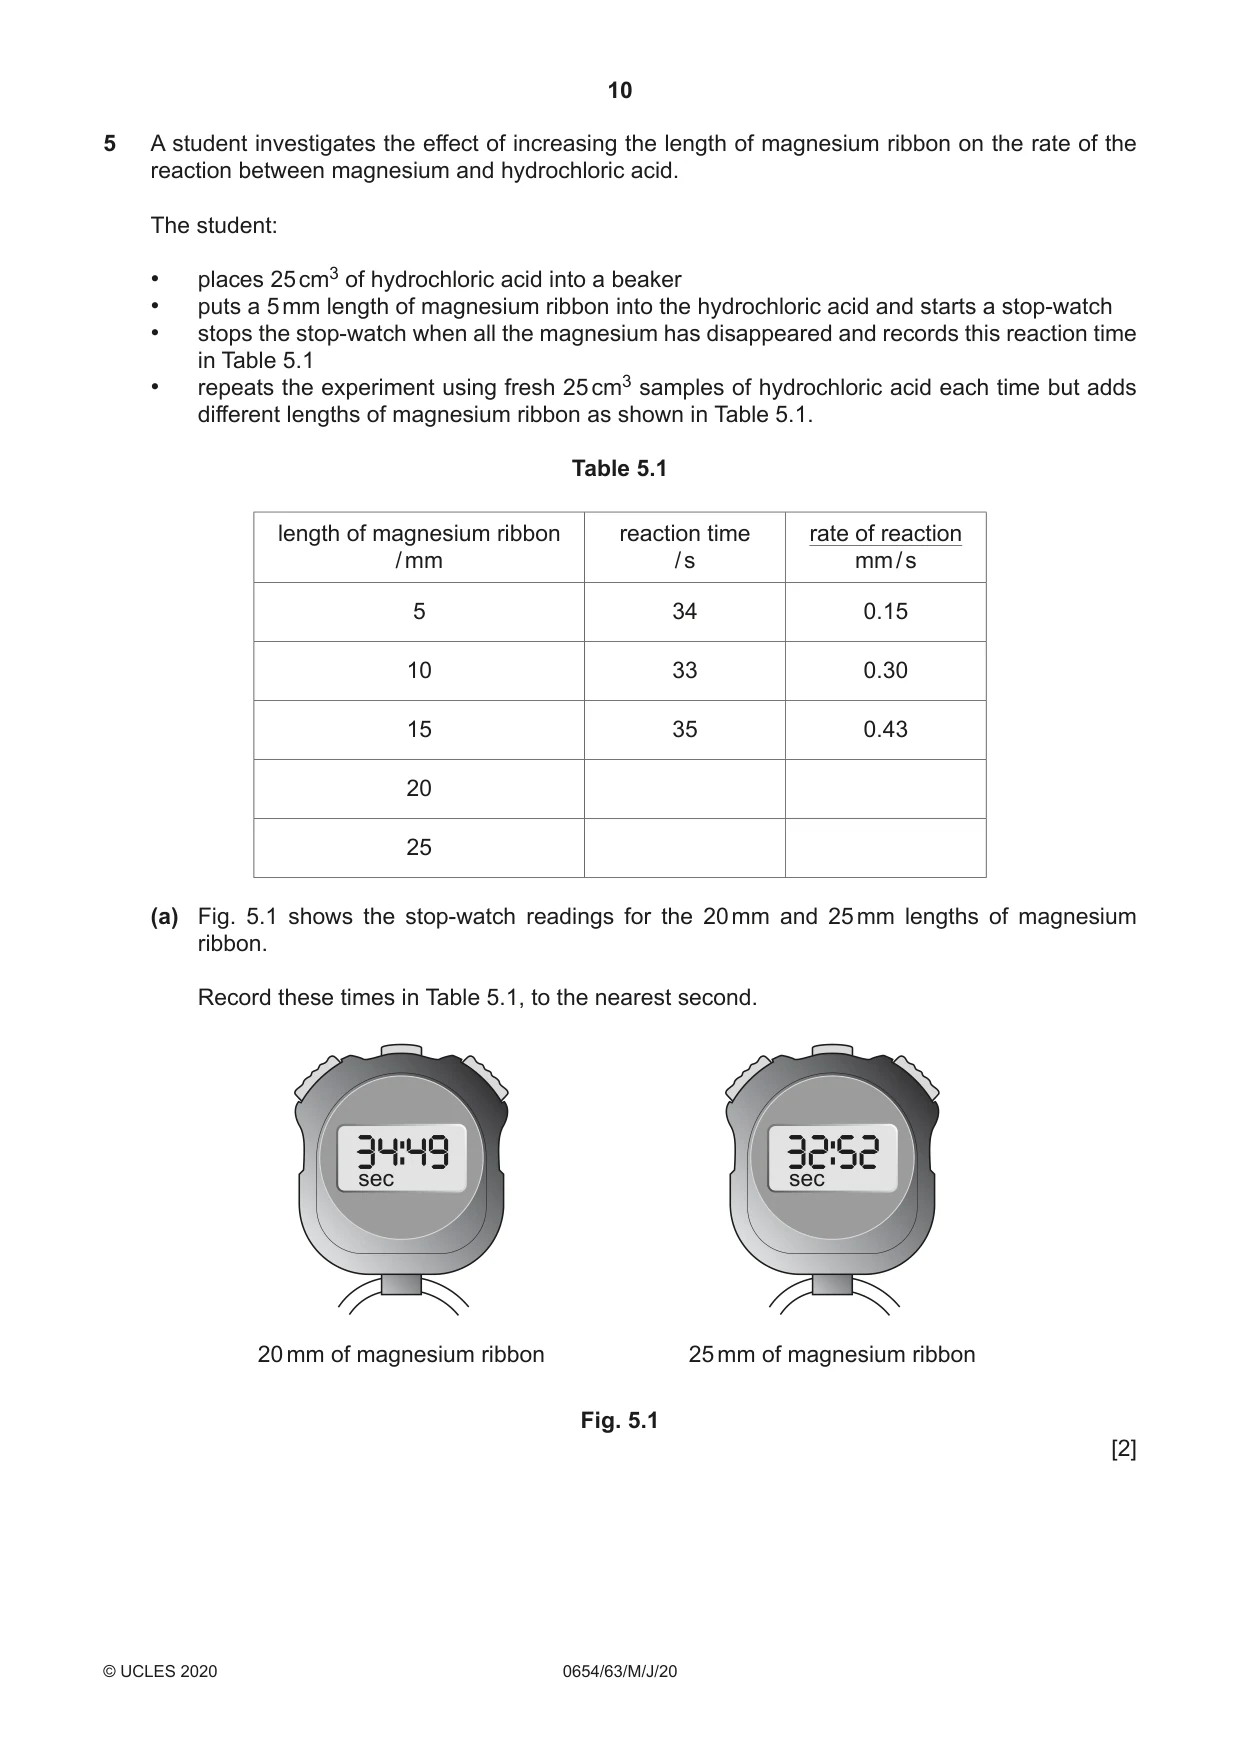
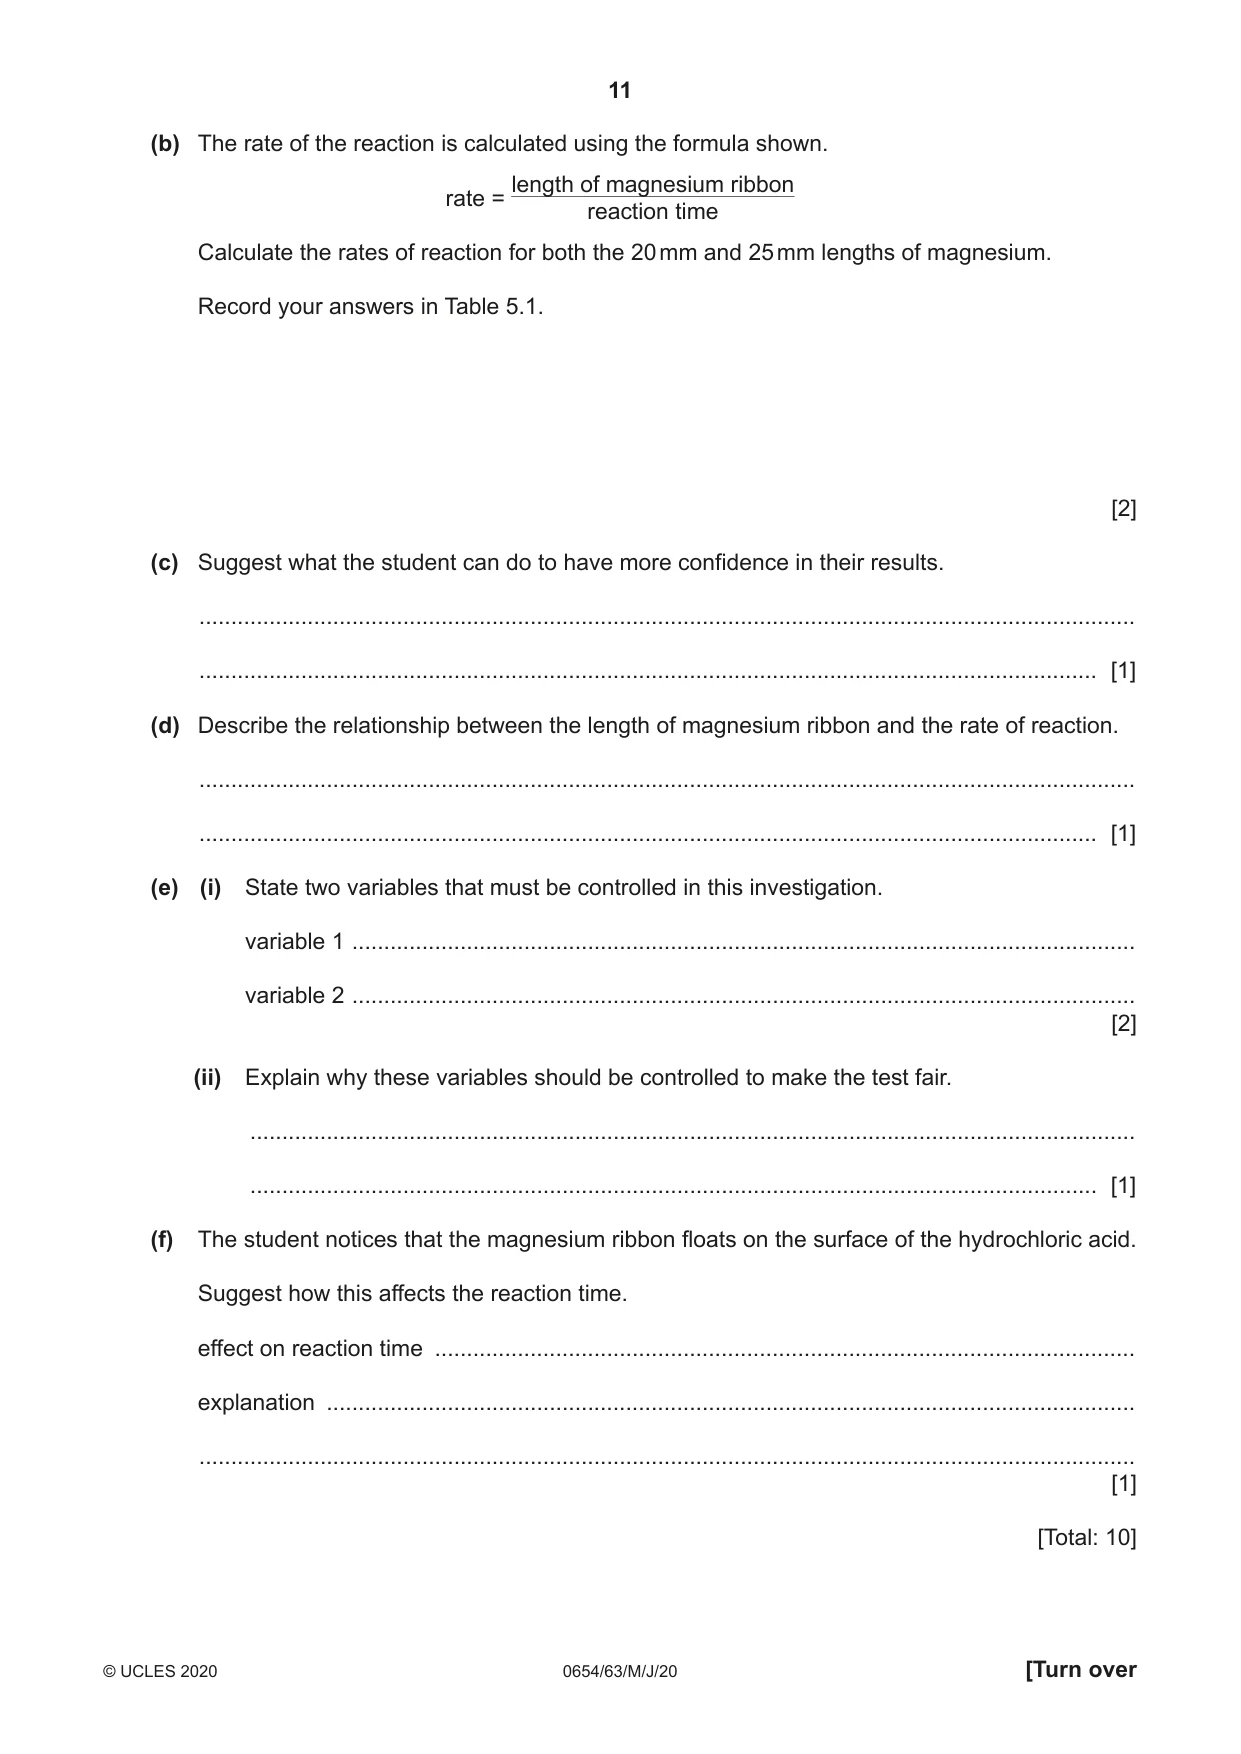
5 A student investigates the effect of increasing the length of magnesium ribbon on the rate of the reaction between magnesium and hydrochloric acid. The student: • places 25 cm3 of hydrochloric acid into a beaker • puts a 5 mm length of magnesium ribbon into the hydrochloric acid and starts a stop-watch • stops the stop-watch when all the magnesium has disappeared and records this reaction time in Table 5.1 • repeats the experiment using fresh 25 cm3 samples of hydrochloric acid each time but adds different lengths of magnesium ribbon as shown in Table 5.1. Table 5.1 length of magnesium ribbon reaction time rate of reaction / mm / s mm / s 5 34 0.15 10 33 0.30 15 35 0.43 20 25 (a) Fig. 5.1 shows the stop-watch readings for the 20 mm and 25 mm lengths of magnesium ribbon. Record these times in Table 5.1, to the nearest second. sec sec 20 mm of magnesium ribbon 25 mm of magnesium ribbon Fig. 5.1 [2] (b) The rate of the reaction is calculated using the formula shown. length of magnesium ribbon rate = reaction time Calculate the rates of reaction for both the 20 mm and 25 mm lengths of magnesium. Record your answers in Table 5.1. [2] (c) Suggest what the student can do to have more confidence in their results. ................................................................................................................................................... ............................................................................................................................................. [1] (d) Describe the relationship between the length of magnesium ribbon and the rate of reaction. ................................................................................................................................................... ............................................................................................................................................. [1] (e) (i) State two variables that must be controlled in this investigation. variable 1 ........................................................................................................................... variable 2 ........................................................................................................................... [2] (ii) Explain why these variables should be controlled to make the test fair. ........................................................................................................................................... ..................................................................................................................................... [1] (f) The student notices that the magnesium ribbon floats on the surface of the hydrochloric acid. Suggest how this affects the reaction time. effect on reaction time .............................................................................................................. explanation ............................................................................................................................... ................................................................................................................................................... [1] [Total: 10]
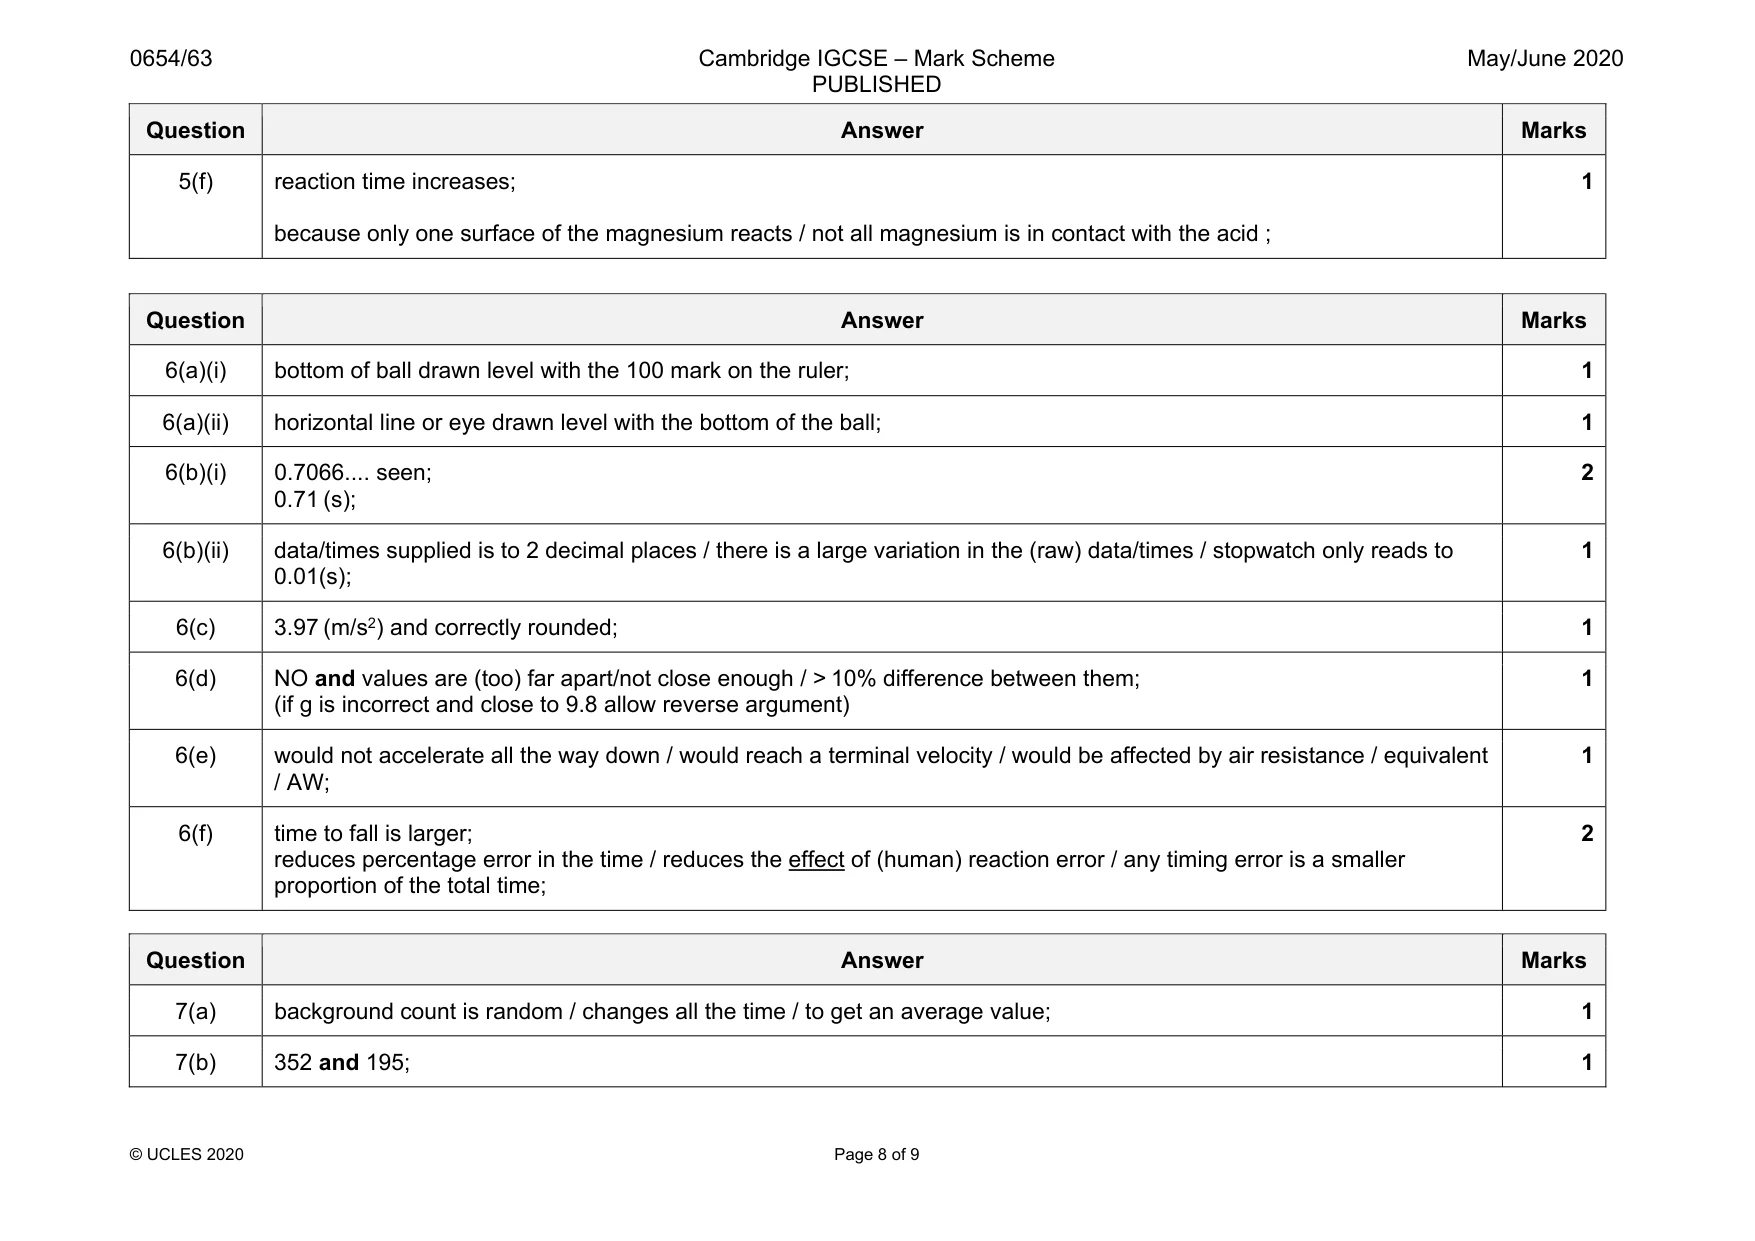
Mark scheme: 5(a) 34/34.5/34.49 and 33/32.5/32.52 in correct places ; 34 and 33 ; 2 5(b) 0.59 ; 0.76 ; 2 5(c) repeat the experiments ; 1 5(d) as length increases the rate of reaction increases ; 1 5(e)(i) any two from: temperature of acid; concentration of acid ; volume of acid ; thickness of the ribbon ; 2 5(e)(ii) to allow a comparison of the results ; (fair test is insufficient) 1 Question Answer Marks 5(f) reaction time increases; because only one surface of the magnesium reacts / not all magnesium is in contact with the acid ; 1
Q6 · A student measures the acceleration of free fall g
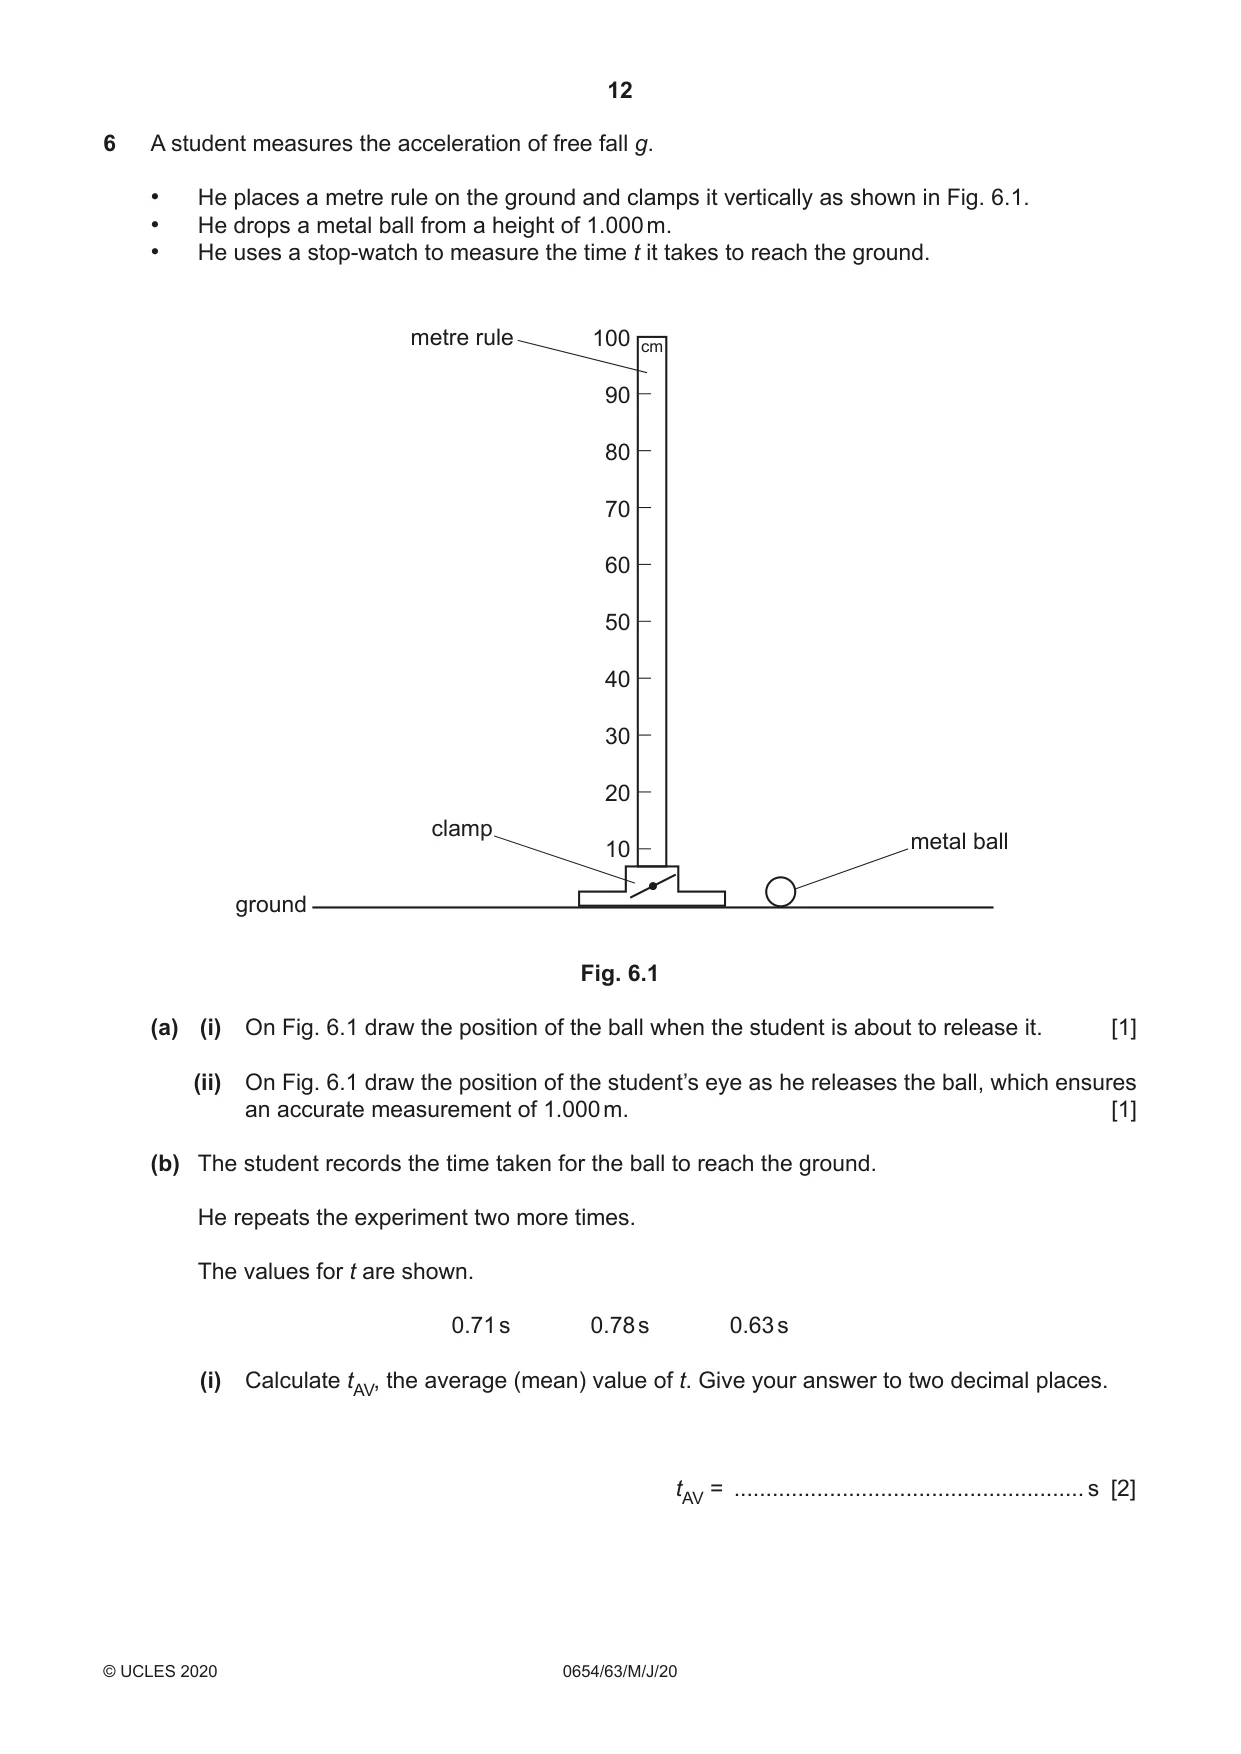
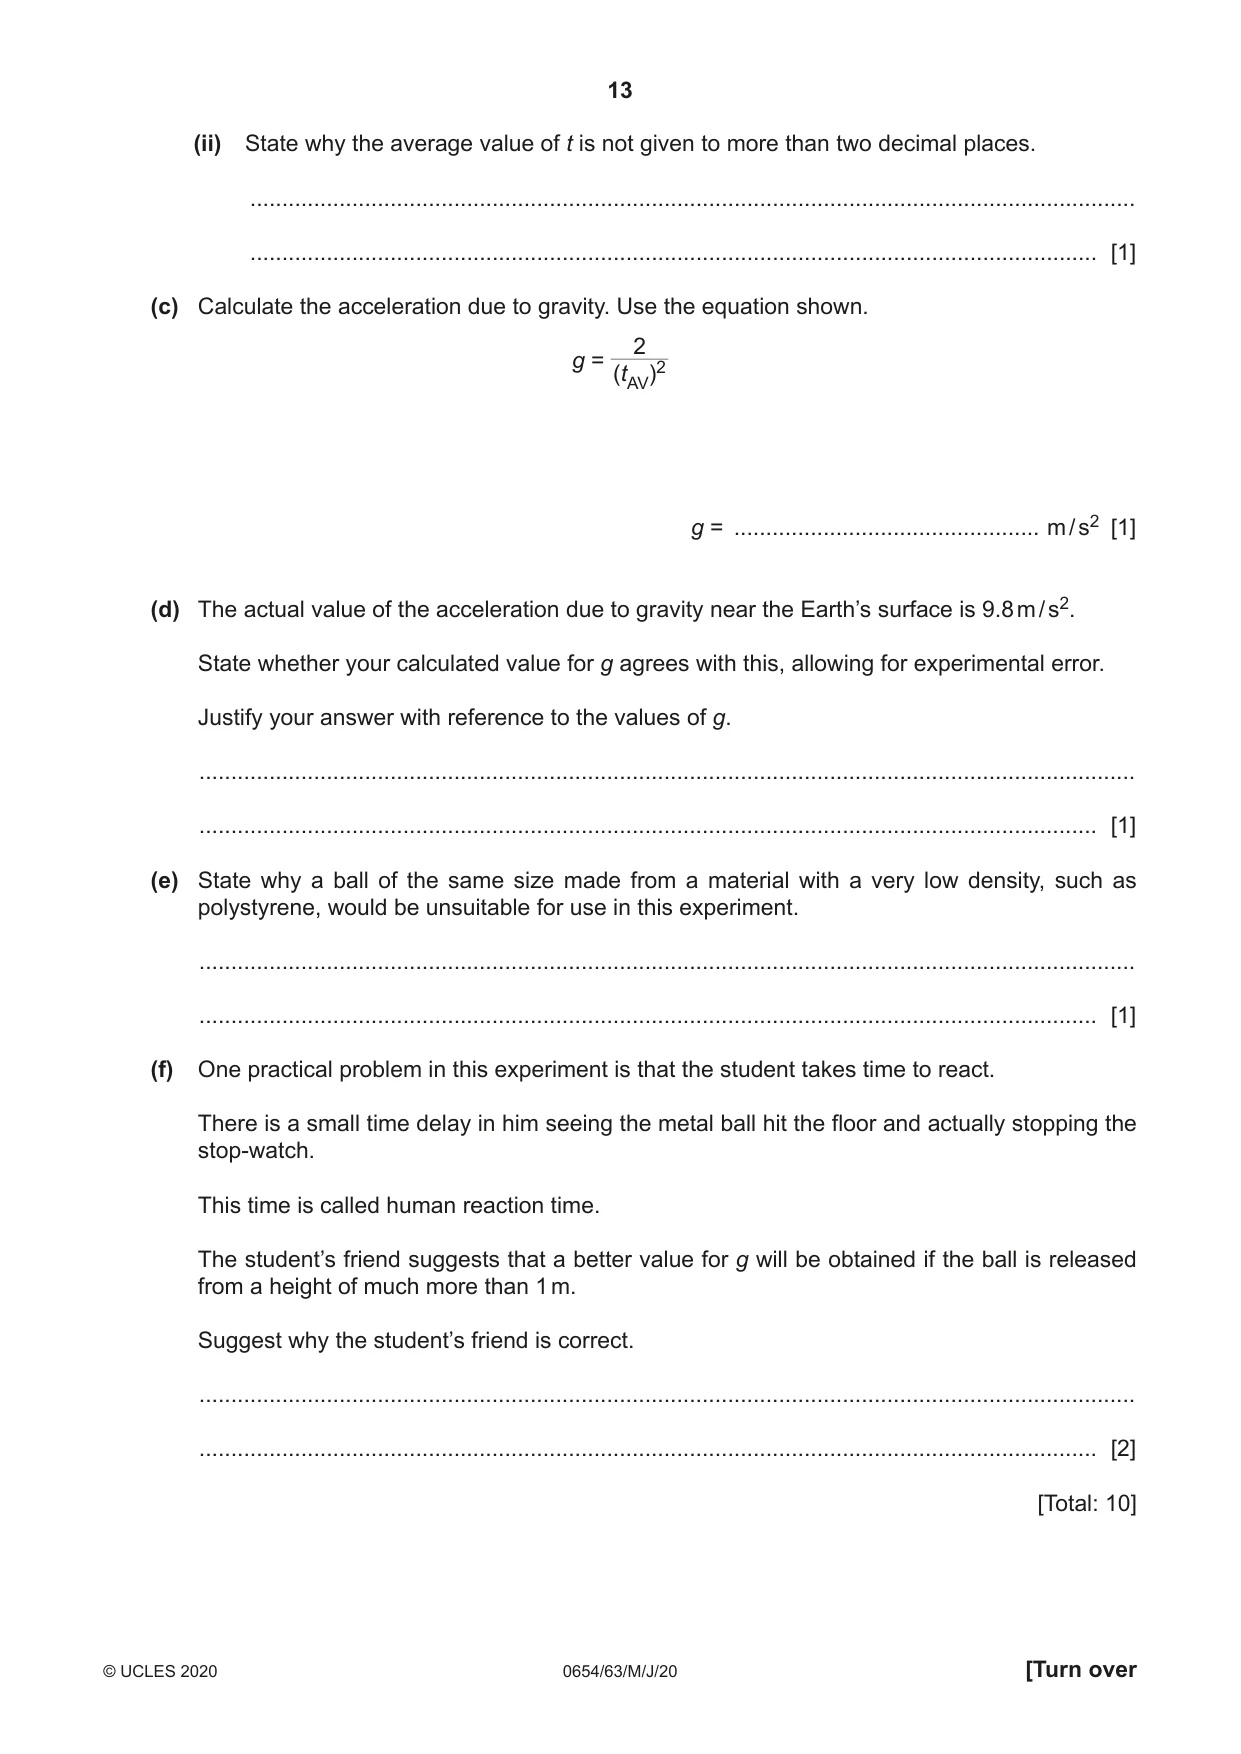
6 A student measures the acceleration of free fall g. • He places a metre rule on the ground and clamps it vertically as shown in Fig. 6.1. • He drops a metal ball from a height of 1.000 m. • He uses a stop-watch to measure the time t it takes to reach the ground. metre rule 100 cm 90 80 70 60 50 40 30 20 clamp metal ball 10 ground Fig. 6.1 (a) (i) On Fig. 6.1 draw the position of the ball when the student is about to release it. [1] (ii) On Fig. 6.1 draw the position of the student’s eye as he releases the ball, which ensures an accurate measurement of 1.000 m. [1] (b) The student records the time taken for the ball to reach the ground. He repeats the experiment two more times. The values for t are shown. 0.71 s 0.78 s 0.63 s (i) Calculate tAV, the average (mean) value of t. Give your answer to two decimal places. tAV = ....................................................... s [2] (ii) State why the average value of t is not given to more than two decimal places. ........................................................................................................................................... ..................................................................................................................................... [1] (c) Calculate the acceleration due to gravity. Use the equation shown. 2 g = (tAV)2 g = ................................................ m / s2 [1] (d) The actual value of the acceleration due to gravity near the Earth’s surface is 9.8 m / s2. State whether your calculated value for g agrees with this, allowing for experimental error. Justify your answer with reference to the values of g. ................................................................................................................................................... ............................................................................................................................................. [1] (e) State why a ball of the same size made from a material with a very low density, such as polystyrene, would be unsuitable for use in this experiment. ................................................................................................................................................... ............................................................................................................................................. [1] (f) One practical problem in this experiment is that the student takes time to react. There is a small time delay in him seeing the metal ball hit the floor and actually stopping the stop-watch. This time is called human reaction time. The student’s friend suggests that a better value for g will be obtained if the ball is released from a height of much more than 1 m. Suggest why the student’s friend is correct. ................................................................................................................................................... ............................................................................................................................................. [2] [Total: 10]
Mark scheme: 6(a)(i) bottom of ball drawn level with the 100 mark on the ruler; 1 6(a)(ii) horizontal line or eye drawn level with the bottom of the ball; 1 6(b)(i) 0.7066.... seen; 0.71 (s); 2 6(b)(ii) data/times supplied is to 2 decimal places / there is a large variation in the (raw) data/times / stopwatch only reads to 0.01(s); 1 6(c) 3.97 (m/s2) and correctly rounded; 1 6(d) NO and values are (too) far apart/not close enough / > 10% difference between them; (if g is incorrect and close to 9.8 allow reverse argument) 1 6(e) would not accelerate all the way down / would reach a terminal velocity / would be affected by air resistance / equivalent / AW; 1 6(f) time to fall is larger; reduces percentage error in the time / reduces the effect of (human) reaction error / any timing error is a smaller proportion of the total time; 2
More questions on Physical quantities and measurement techniques
Q7 · A teacher demonstrates the absorption of beta (β)-particles by aluminium foil
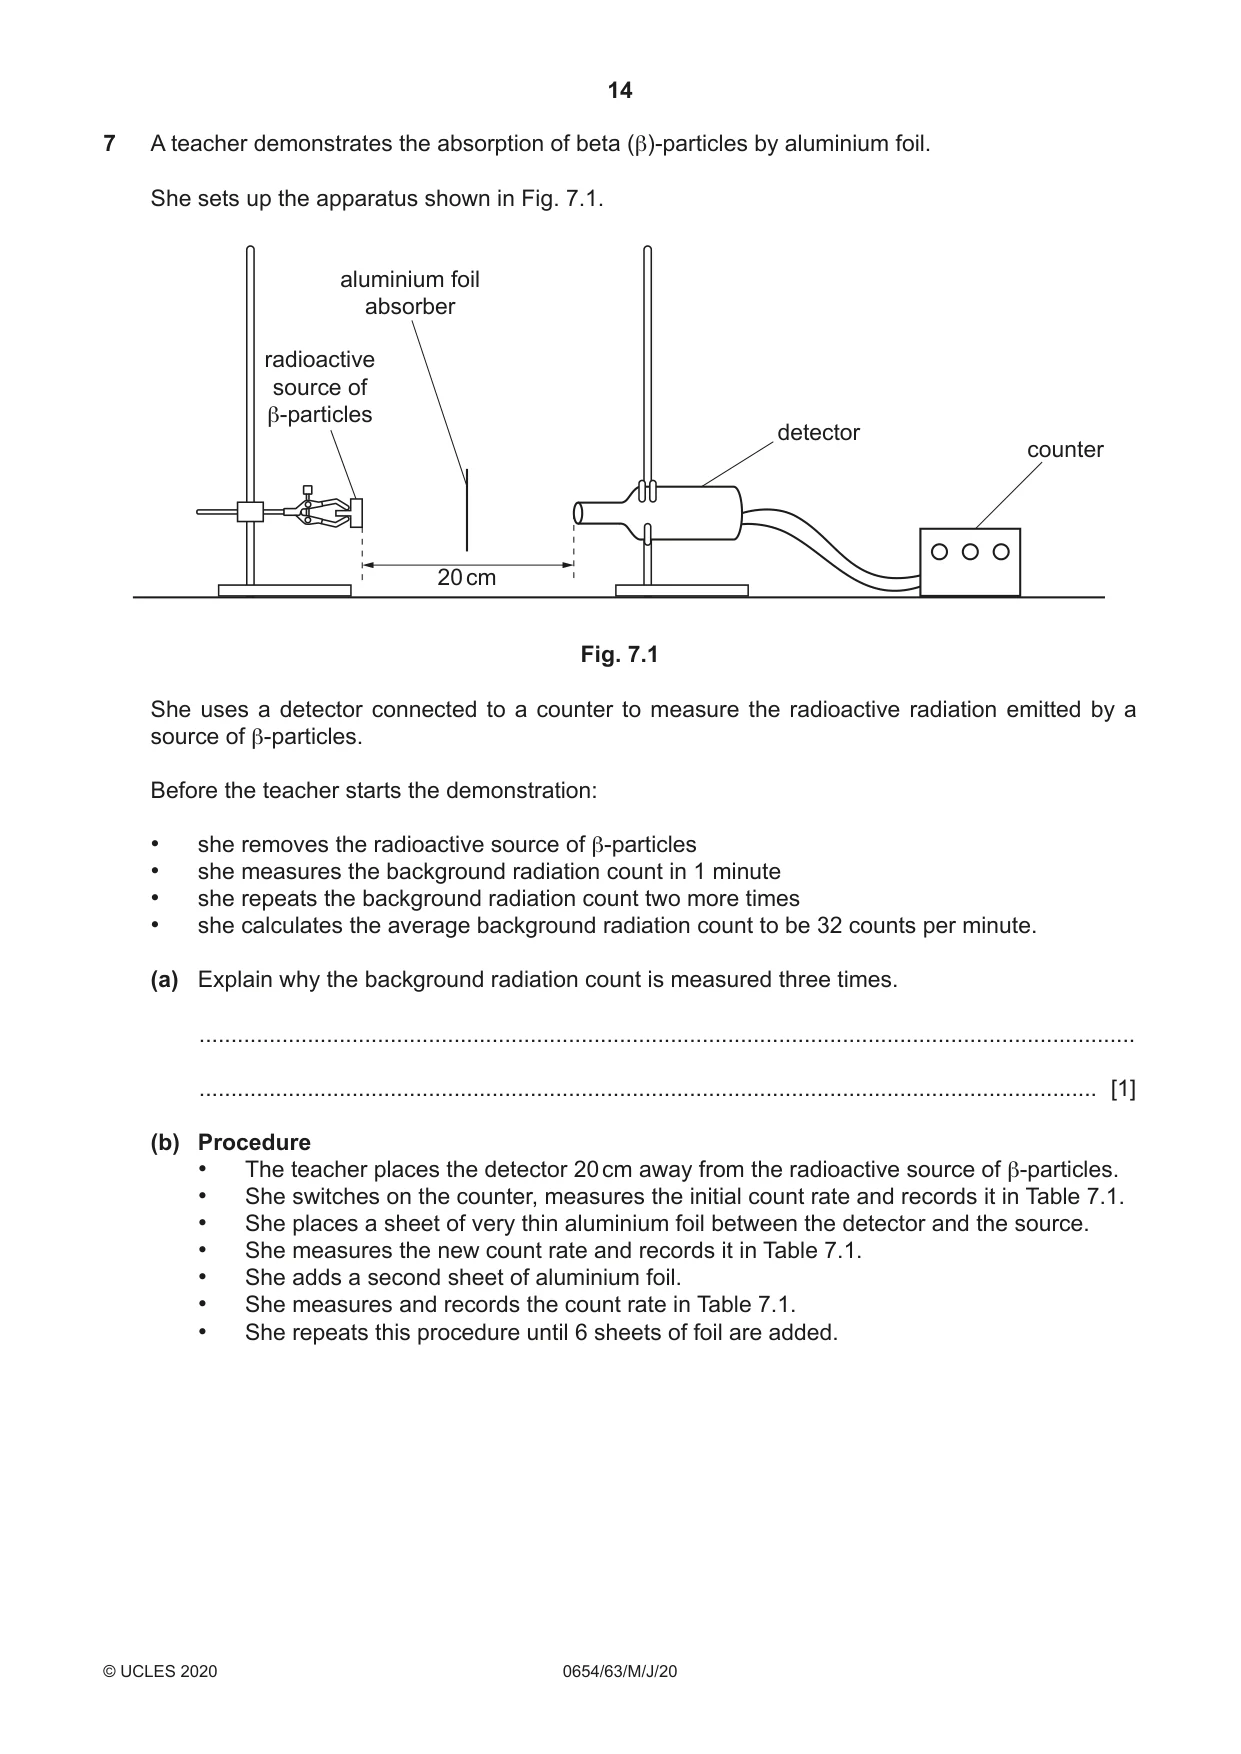
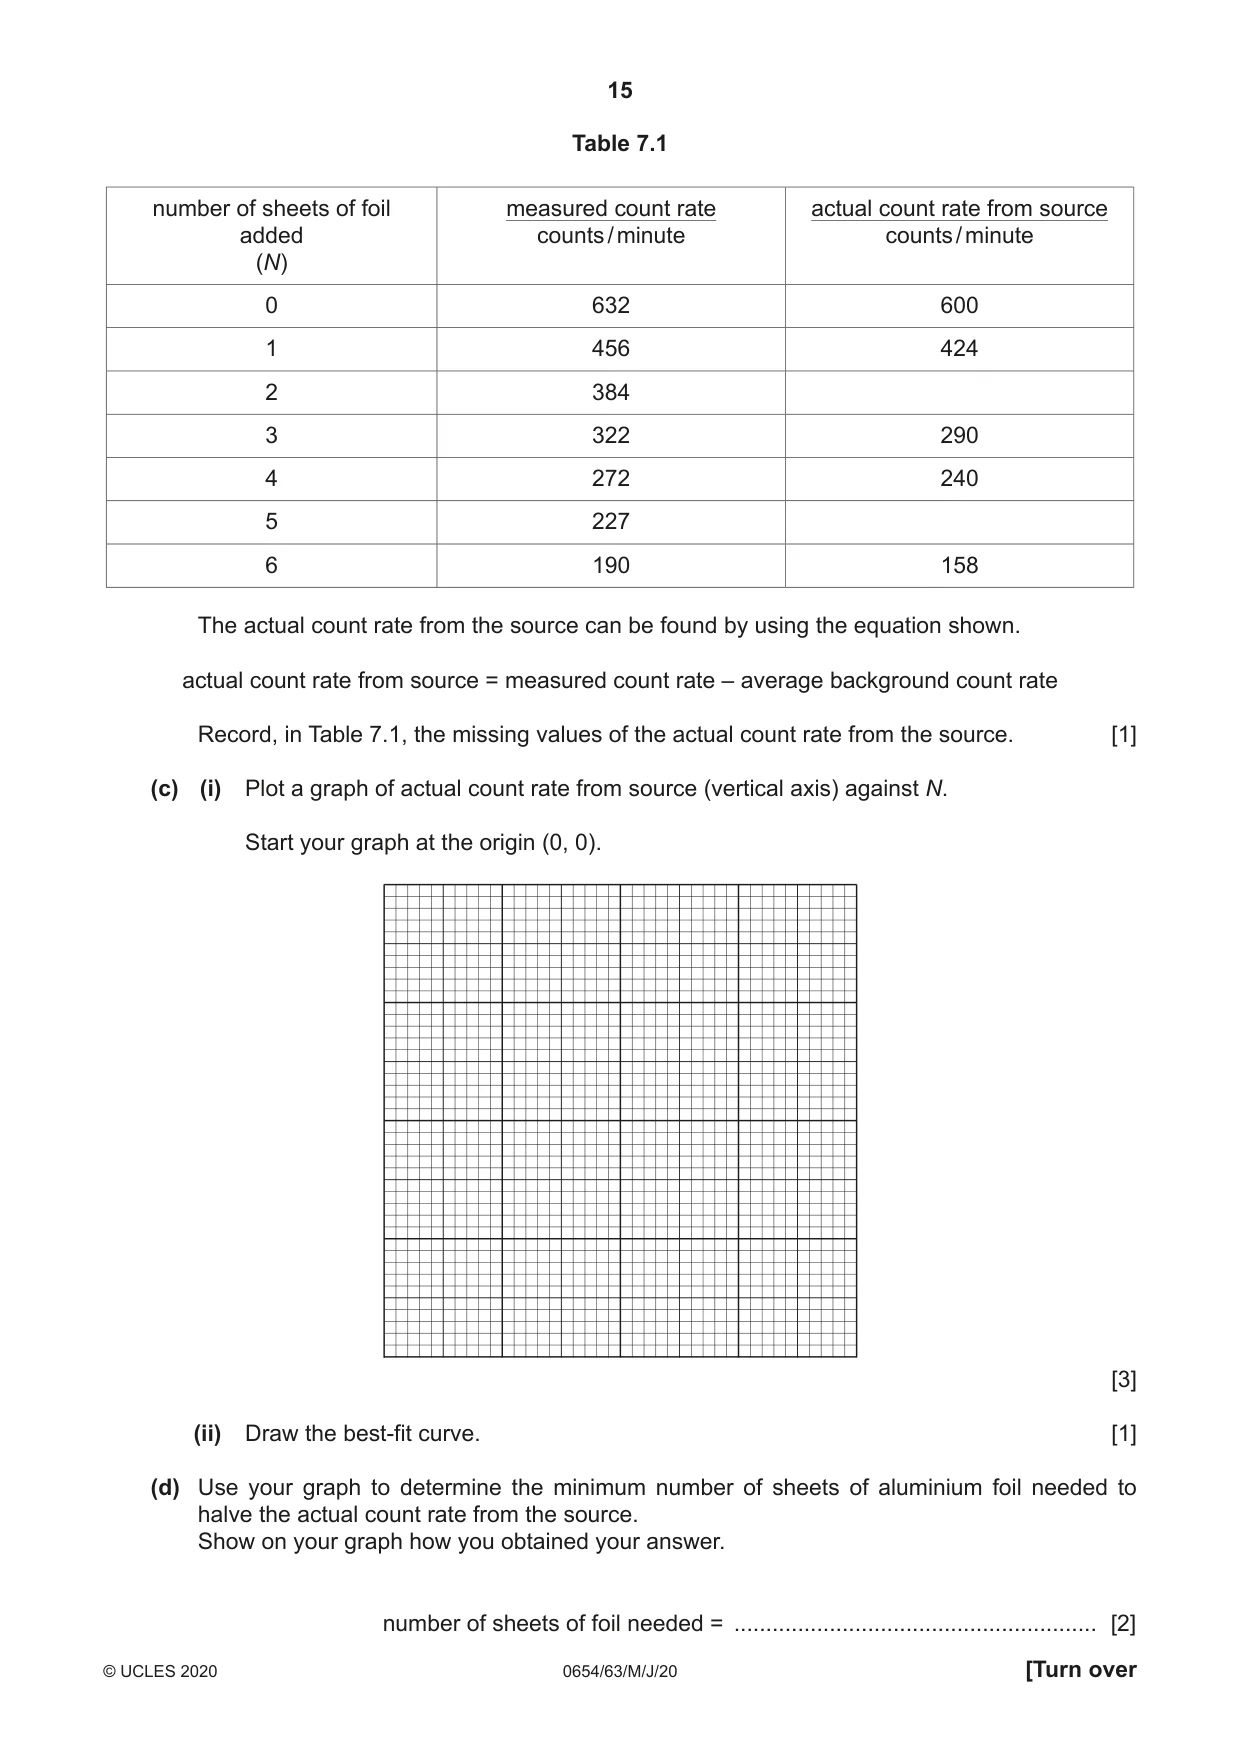
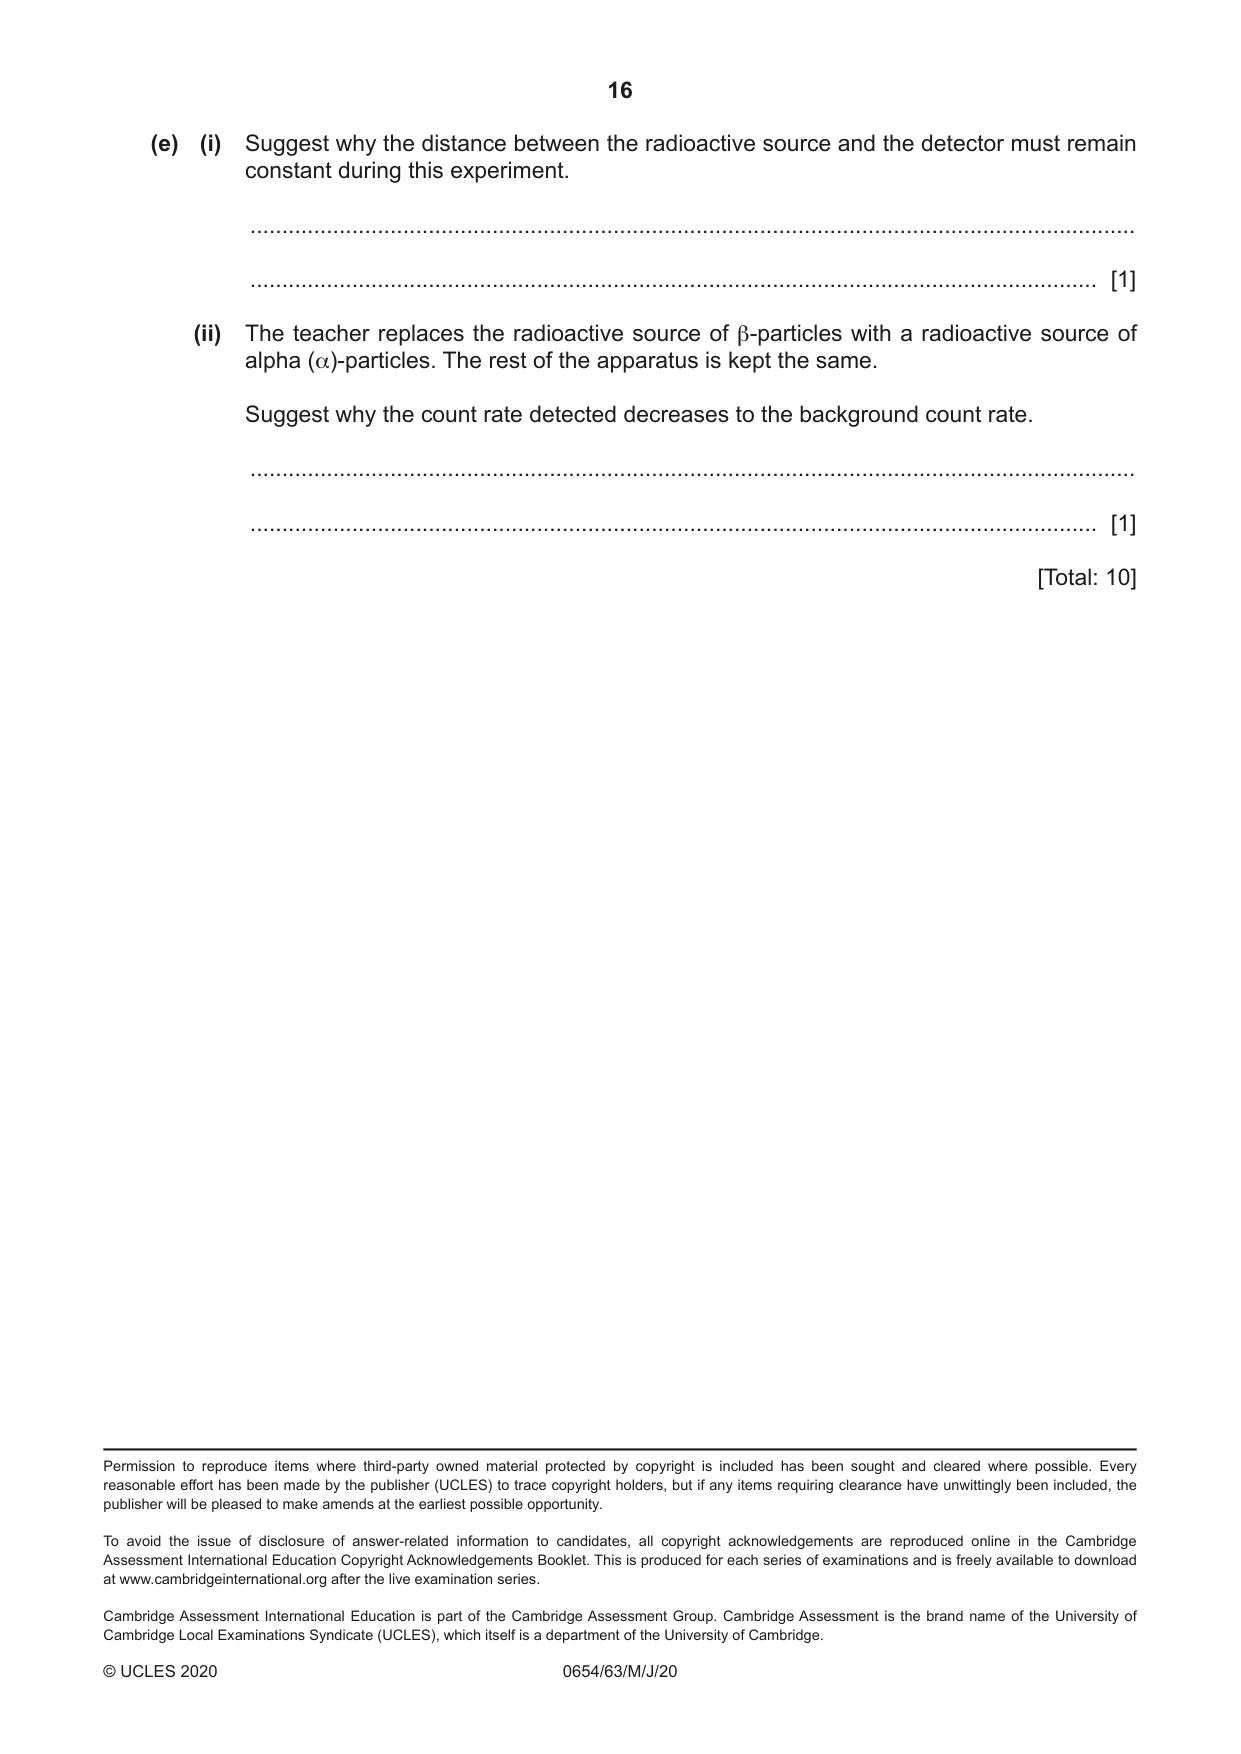
7 A teacher demonstrates the absorption of beta (β)-particles by aluminium foil. She sets up the apparatus shown in Fig. 7.1. aluminium foil absorber radioactive source of β-particles detector counter 20 cm Fig. 7.1 She uses a detector connected to a counter to measure the radioactive radiation emitted by a source of β-particles. Before the teacher starts the demonstration: • she removes the radioactive source of β-particles • she measures the background radiation count in 1 minute • she repeats the background radiation count two more times • she calculates the average background radiation count to be 32 counts per minute. (a) Explain why the background radiation count is measured three times. ................................................................................................................................................... ............................................................................................................................................. [1] (b) Procedure • The teacher places the detector 20 cm away from the radioactive source of β-particles. • She switches on the counter, measures the initial count rate and records it in Table 7.1. • She places a sheet of very thin aluminium foil between the detector and the source. • She measures the new count rate and records it in Table 7.1. • She adds a second sheet of aluminium foil. • She measures and records the count rate in Table 7.1. • She repeats this procedure until 6 sheets of foil are added. Table 7.1 number of sheets of foil measured count rate actual count rate from source added counts / minute counts / minute (N) 0 632 600 1 456 424 2 384 3 322 290 4 272 240 5 227 6 190 158 The actual count rate from the source can be found by using the equation shown. actual count rate from source = measured count rate – average background count rate Record, in Table 7.1, the missing values of the actual count rate from the source. [1] (c) (i) Plot a graph of actual count rate from source (vertical axis) against N. Start your graph at the origin (0, 0). [3] (ii) Draw the best-fit curve. [1] (d) Use your graph to determine the minimum number of sheets of aluminium foil needed to halve the actual count rate from the source. Show on your graph how you obtained your answer. number of sheets of foil needed = ......................................................... [2] (e) (i) Suggest why the distance between the radioactive source and the detector must remain constant during this experiment. ........................................................................................................................................... ..................................................................................................................................... [1] (ii) The teacher replaces the radioactive source of β-particles with a radioactive source of alpha (α)-particles. The rest of the apparatus is kept the same. Suggest why the count rate detected decreases to the background count rate. ........................................................................................................................................... ..................................................................................................................................... [1] [Total: 10]
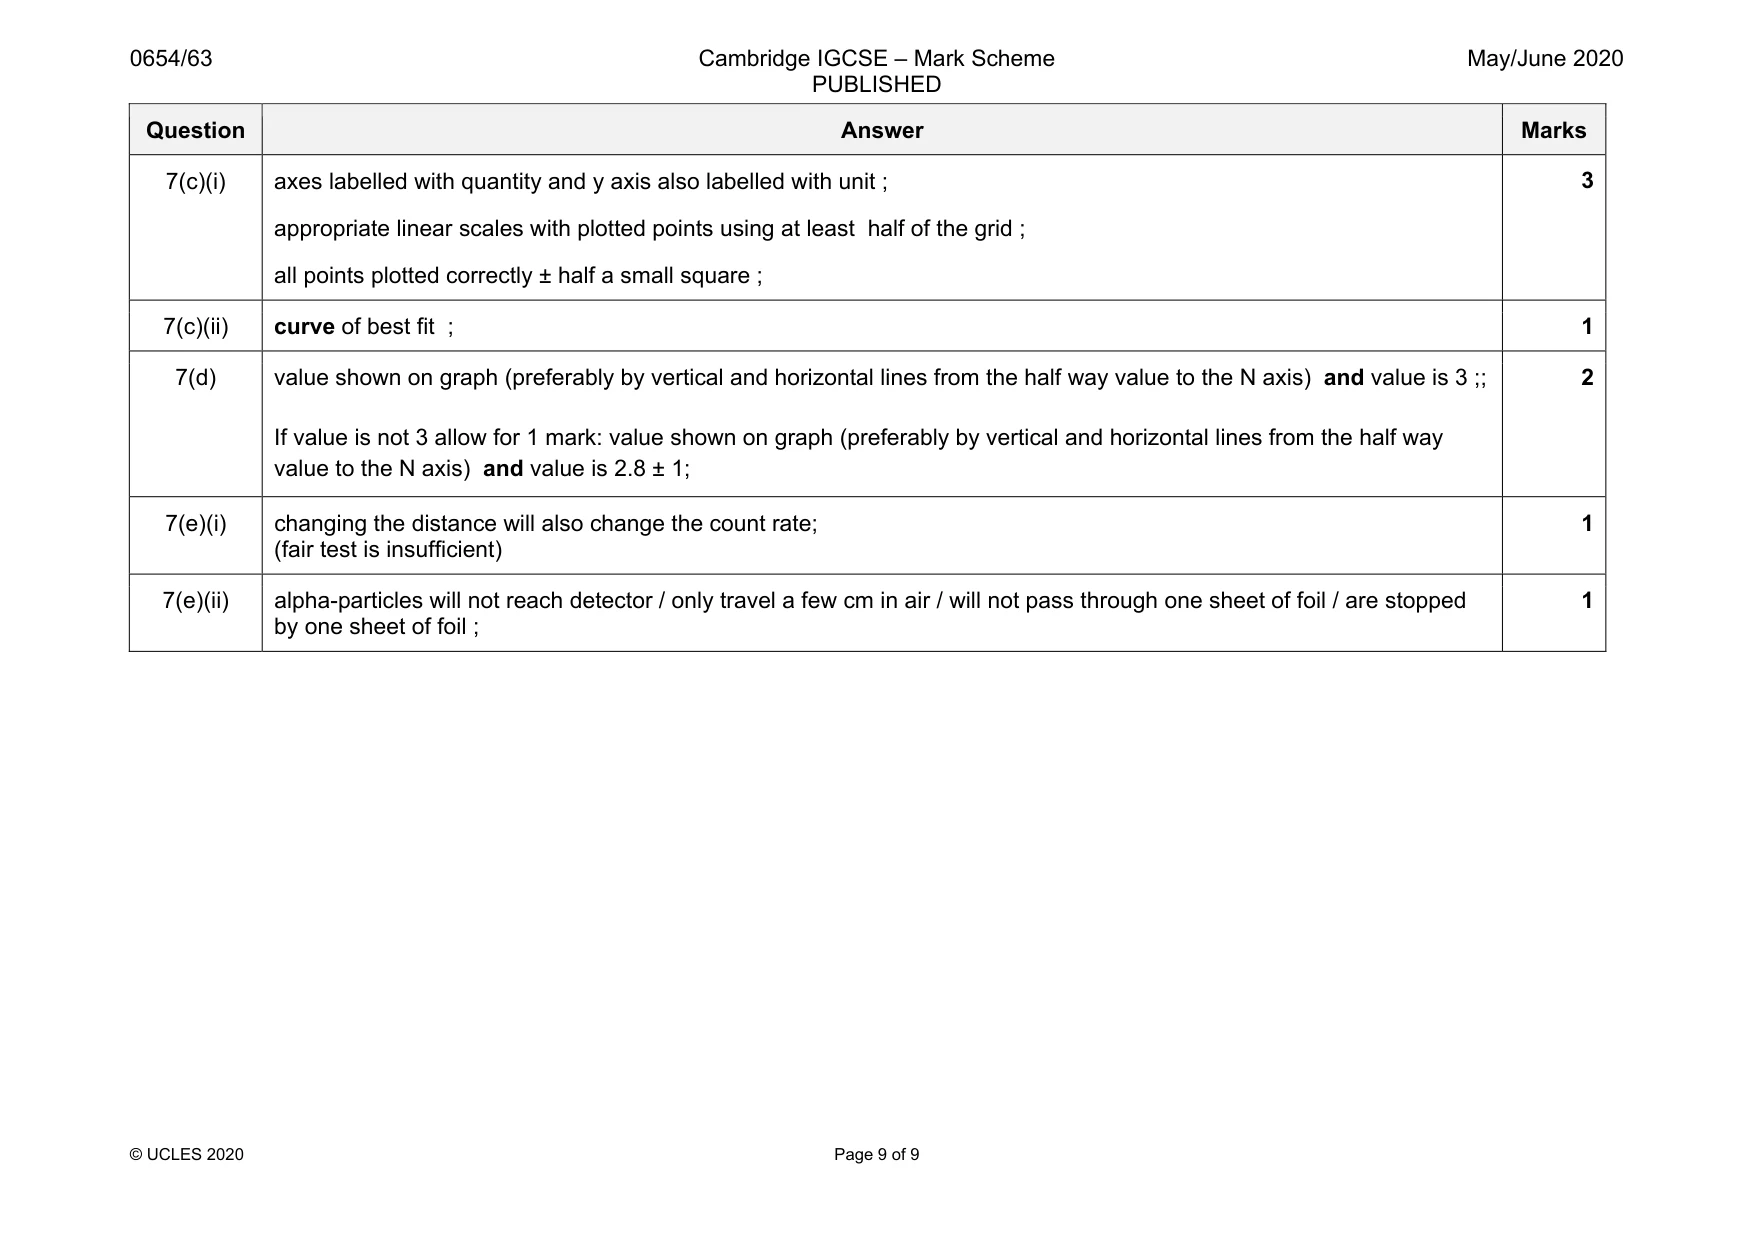
Mark scheme: 7(a) background count is random / changes all the time / to get an average value; 1 7(b) 352 and 195; 1 Question Answer Marks 7(c)(i) axes labelled with quantity and y axis also labelled with unit ; appropriate linear scales with plotted points using at least half of the grid ; all points plotted correctly ± half a small square ; 3 7(c)(ii) curve of best fit ; 1 7(d) value shown on graph (preferably by vertical and horizontal lines from the half way value to the N axis) and value is 3 ;; If value is not 3 allow for 1 mark: value shown on graph (preferably by vertical and horizontal lines from the half way value to the N axis) and value is 2.8 ± 1; 2 7(e)(i) changing the distance will also change the count rate; (fair test is insufficient) 1 7(e)(ii) alpha-particles will not reach detector / only travel a few cm in air / will not pass through one sheet of foil / are stopped by one sheet of foil ; 1
What was in this paper
The subtopics covered by these 7 questions, and how many questions each got. Open one in a new tab to see every Cambridge question on it.